Weather Vol. 58 December 2003
References Barton, J. S . and Borthwick, A. S . (1982) August
weather on a mountain summit. Weather, 37,
Barton, J. S. and Roy, M. (1983) A monument to mountain meteorology. New Sci., 16 June,
Calder, I. R. and Kidd, C. H. R. (1978) A note on the dynamic calibration of tipping bucket rain- gauges. J. Hydrol., 39, pp. 383-386
Crewe, M. (2003) The fathers of scientific meteorol- ogy - Boyle, Wren, Hooke and Halley: Part 1. Wather, 58, pp. 103-107
Curran, J. C., Peckham, G. E., Smith, D., Thom, A. S . , McCulloch, J. S. G. and Strange- ways, I. C. (1977) Cairngorm summit automatic weather station. Weather, 32, pp. 60-63
Hanna, E. (1995) How effective are tipping bucket raingauges? A review. Weather, 50, pp. 336-342
Quartly, G. D., Guymer, T. H. and Birch, K. G. (2002) Back to basics: Measuring rainfall at sea: Part 1 - In situ sensors. Weather, 57, pp. 3 15-320
Strangeways, I. C. (1984) The development of an automatic weather station for cold regions. In: Proceedings 52nd Annual Meeting Western Snow Conference, Sun I/alley, Idaho, pp. 12-23 - (198%) The development of an automatic weather
station for use in arctic conditions. PhD thesis, Department of Meteorology, University of Reading - (1985b) A cold regions automatic weather
station. J. Hydrol. , 79, pp. 323-332 - (1996a) Back to basics: The ‘met. enclosure’:
pp. 228-240
pp. 804-806
Part 2(a) - Raingauges. Weather, 51, pp. 274-279 - (1996b) Back to basics: The ‘met. enclosure’:
Part 2(b) - Raingauges, their errors. Weather, 51,
- (1998) Back to basics: The ‘met. enclosure’: Part 3 - Radiation. Wearher, 53, pp. 4 3 4 9 - (2001) Back to basics: The ‘met. enclosure’:
Part 7 - Evaporation. Weather, 56, pp. 419427 L_ (2003a) Back to basics: The ‘met. enclosure’:
Part 9(a) - Automatic weather stations: Tempera- ture, humidity, barometric pressure and wind. Weather, 58, pp. 428-434 - (2003b) Measuring the natural environment,
second edition. Cambridge University Press Strangeways, I. C and Curran, J. C. (1977) Meteor-
ological measurements under conditions of icing: Some new attempts to solve the problem. In: Proceedings WMO Technical Conference on Instru- ments and Methods oj Observation (TECIMO), Hamburg, 27-30 July 1977, WMO No. 480, pp. 7- 12
Wankiewicz, A. (1 979) A review of water movement in snow. In: Proceedings Modelling of Snow Cover Runoff, US Army Corps of Engineers Cold Regions Research and Engineering Laboratory, Hanover,
pp. 298-303
USA, pp. 222-252
Correspondence to: Dr I. C. Strangeways, TerraData, 7 Cherwell Close, Thames St, Walling- ford, Oxon. 0x10 OJJ. www.terradata.co.uk. e-mail: [email protected] 1 ’ Royal Meteorological Society, 2003. doi: 10.1256/wea.81.03A
Summer shamals over the Arabian Gulf
P. Govinda Rao, H. R. Hatwar, Mohammed Hassan Al-Sulaiti and Ali Hamid Al-Mulla Department of Civil Aviation and Meteorology, Doha, Qatar
The purpose of this paper is to present results of a study on summer shamals over the Arabian Gulf. Synoptic conditions (both surface and upper-air) which are important for shamal activities are discussed, along with forecasting rules of thumb and objective relationships for their possible application in day-to-day opera- tional forecasting. ‘Shamal’ is a name given to strong north-westerly winds. The term has
been derived from an Arabic word meaning ‘north’. Shamals are important weather phe- nomena in the region as they cause adverse weather conditions, hampering many activities. These conditions include gusty winds, sand- storms, duststorms, rough seas, low-level wind shear, etc. which can influence many opera- tional activities related to aviation and offshore hydrocarbon exploration. Shamals occur in
47 1
Weather Vol. 58 December 2003 both the summer and winter seasons. Rao et al. (2001) gave an objective criterion for shamals in their recent study on winter shamals. Winter shamals occur mainly in the months of Novem- ber to March and are closely associated with midlatitude frontal systems that traverse from west to east across northern parts of the Ara- bian Gulf. In contrast, summer shamals affect the region predominantly during May to July and are known to be linked with the seasonal thermal lows lying over north-west India, Paki- stan, Iran and southern Saudi Arabia.
In Rao et al. (2001) aspects of winter sha- mals were emphasised, updating the pioneering work by Perrone (1979). Ali (1992, 1994) examined the wind regime over the Arabian Gulf and examined the duststorms associated with summer shamals. Membery (1 983) reported the presence of a strong low-level jet over the Gulf area on summer shamal days. Hatwar et al. (1 999) described the characteris- tics of summer shamals vis-a-vis prominent surface pressure systems. Hatwar et al. (2000) also examined the role of upper-air flow pat- terns on the life cycle of a summer shamal. In the present study, the salient features of summer shamals, with an emphasis on the weather conditions over the state of Qatar (in the central Arabian Gulf) and its surroundings, are included.
Data and methodology
The study was restricted to the period 1990-97 because of upper-air data availability. The Omega radio-navigational system ceased operation at the end of September 1997. About 250 stations (25%) of the global upper- air network and about 33 stations (1 0%) of the Asian region were using Omega-based upper- air observing stations (World Climate Research Programme 1998). The discontinuation was due to a change in policy of the allocation of radio frequency for meteorological purposes. Because of this problem radiosonde observa- tions were discontinued at Doha Arport in 1997 and restored only in 2002. This study has therefore been undertaken only for the period 1990-97. The first step was to analyse the hourly wind data. A number of weather ele- ments such as surface air temperature, mean
sea-level pressure, relative humidity, horizontal visibility, sea state etc. were then analysed for a few days before and after shamal days in the record. Tephigrams for Doha were examined to study the vertical structure of the atmos- phere associated with the phenomena. Synop- tic charts for 0000 and 1200 GMT at mean sea- level and three upper-air levels (850, 500 and 250mbar) for the Gulf domain, between 30- 65"E and 10-40"N, were critically analysed to identify different synoptic systems that influ- ence shamal activities over the Arabian Gulf region. An objective criterion given by Rao et al. (2001) has been adopted to designate a day as a shamal day. According to this criterion, a shamal day is one on which the surface wind direction is north-westerly or northerly and the hourly mean wind speed is 17 kn or above in at least three hours of the day.
Results and discussion Climatological aspects
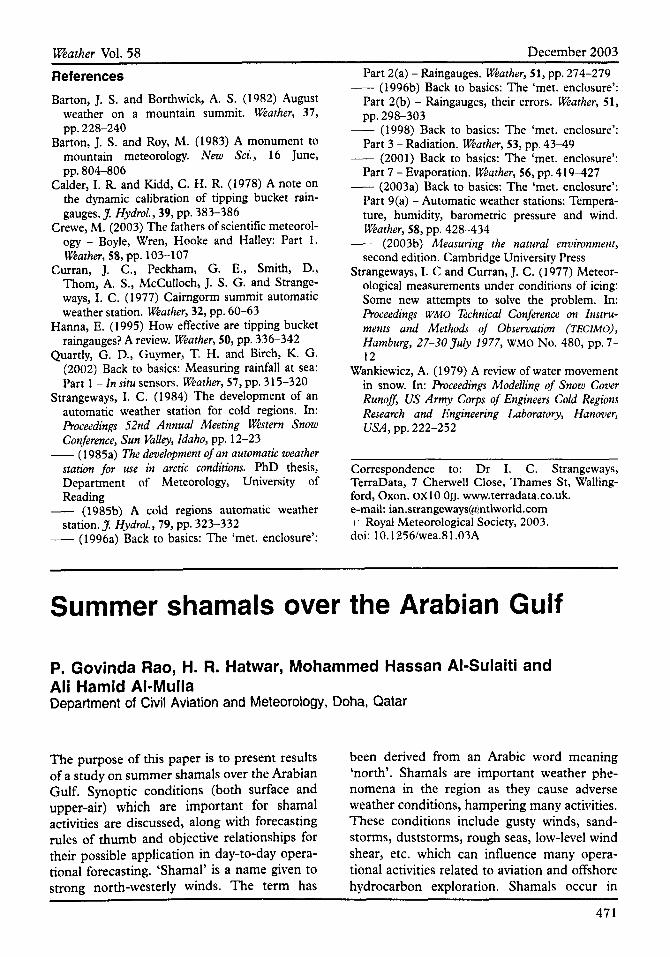
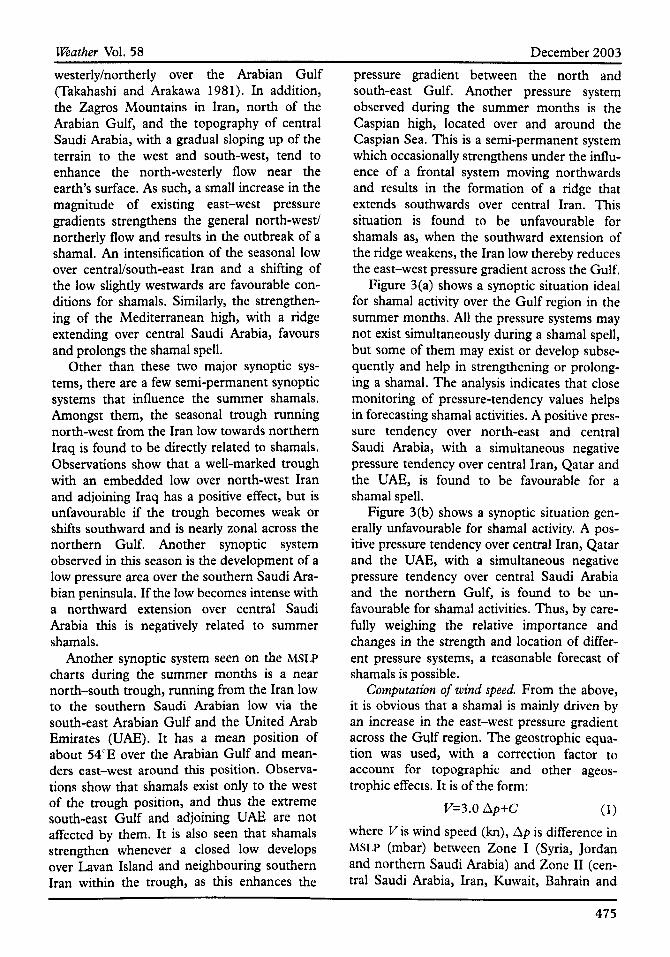
As observed in the previous study (Rao et al. 2001) the %month period May-July is the main shamal season in Qatar with over 50% of the annual number of shamal days. In this period, June has the highest shamal frequency, followed by July and then May. Figure 1 shows the weekly distribution of shamals in May- August during the 8-year period 1990-97. It may be noted that week 8 (19-25 June) has the maximum number of shamal days. Further, it can be seen that the 4-week period from 5 June to 2 July (weeks 6-9) has the maximum number of shamal days, followed by another maximum during the 4-week period from 10 July to 6 August (weeks 11-14). Later, shamal frequency decreases sharply. It is interesting to note that the two peak periods in shamal activity coincide with two distinct phases of the Indian summer monsoon. The first period closely matches the normal onset period of the monsoon, whereas the second coincides with the most active phase of the monsoon. Prob- ably, during these two peak periods, the main thermal low over north-west India and adjoin- ing Pakistan becomes more intense and increases the east-west pressure gradient across Iran and the neighbouring Gulf region, and is thus conducive for shamal activities.
472
Weather Vol. 58 December 2003
16 1d n
0 > 4 8 lo 12 l4 16 - 1 . I
Week number from 1 May to 31 August
Weekly distribution of shanial days in May- Fig. 1 August, 1990-97
Shamal versus local weather conditions
To determine the impact of shamals on local weather, various weather elements - mean wind speed, relative humidity (RH) maximum temperature (Tmax), minimum temperature (Tmin) and mean sea-level pressure (MSLP) - were analysed during shamal days as well as a few days before and after shamal days. These elements were compared with the climatic normal values of the respective months. From the analysis it was found that daily mean wind speed is stronger on shamal days (D days) compared with that two days prior to shamal days (D-2 days). RH shows a considerable decrease on D days, more significantly in June and July, indicating that shamals bring dry air over the region. Tmax falls on D days in May, as northern parts of the Gulf region are cooler than southern parts during this month. Even the shamals that occur in the first half of June generally bring down the Tmax. However, in July, Tmax remains well above 42°C on shamal days due to hot air surges from Kuwait and Saudi Arabia where high temperatures are observed during this month. Tmin shows little change in May, whereas in both June and July it increases on D days. The days remain gener- ally hotter on D days compared to non-shamal (ND) days in June and July. MSLP increases on D days in May, but during the D days of June
Thus, it may be noted that the characteris- tics of May shamals generally differ from those observed in June and July. This is mainly due to the fact that May is the beginning of the summer season and few midlatitude frontal systems still influence the weather. The synop- tic conditions responsible for May shamals are partly due to midlatitude wave systems and partly to summer heating effects.
Diurnal variation
The diurnal variation of the surface wind speed on shamal days was averaged over the three months May-July. The wind speed steadily increases during the day, reaching a maximum around 1300 local time (LT, 1 0 0 0 ~ ~ ~ ) and then weakens gradually, reaching a minimum around 2300 LT. The increasing trend during the progress of the day may be due to increased heating, and so turbulence in the boundary layer and downward transfer of momentum from aloft.
Vertical structure of the lower troposphere
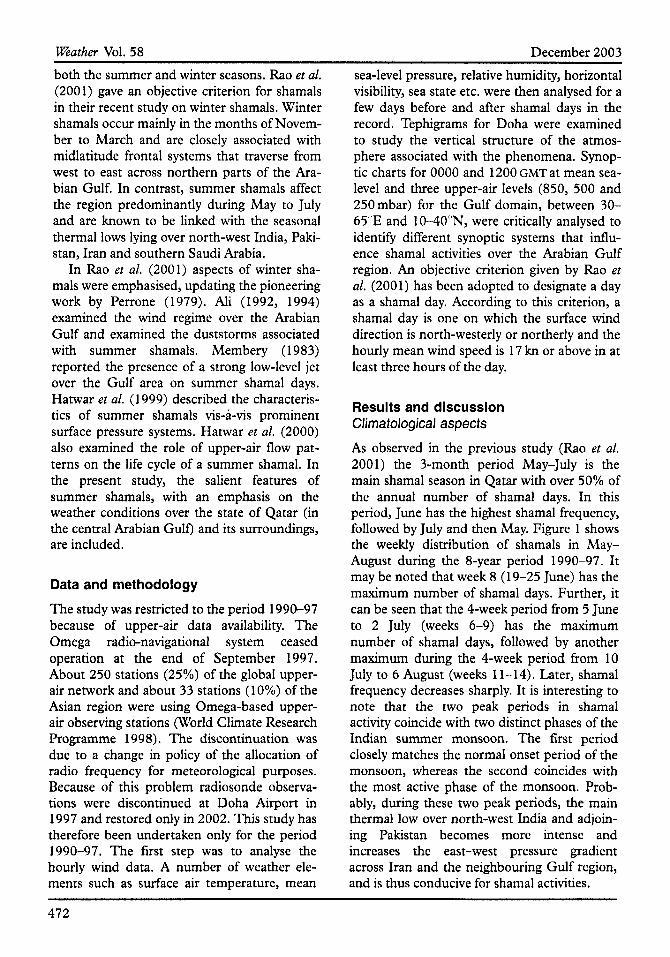
Examination of 0000 GMT tephigrams at Doha on D days and N D days during May-July gives some interesting results. Figure 2 depicts the vertical profile of wind speed for June. The May and July deviations from the June values
I I
I I
I
0 , , ,
surrmc4 0
I I I I 5 I 5 25
0 10 20 30 40 WIND SPEED (kn)
Fig. 2 (solid line) and non-shalnal days (dashed line) in June, 1990-97
Vrrtical profile of wind speed on sharrral days
and July it decreases.
473
Weather Vol. 58 December 2003
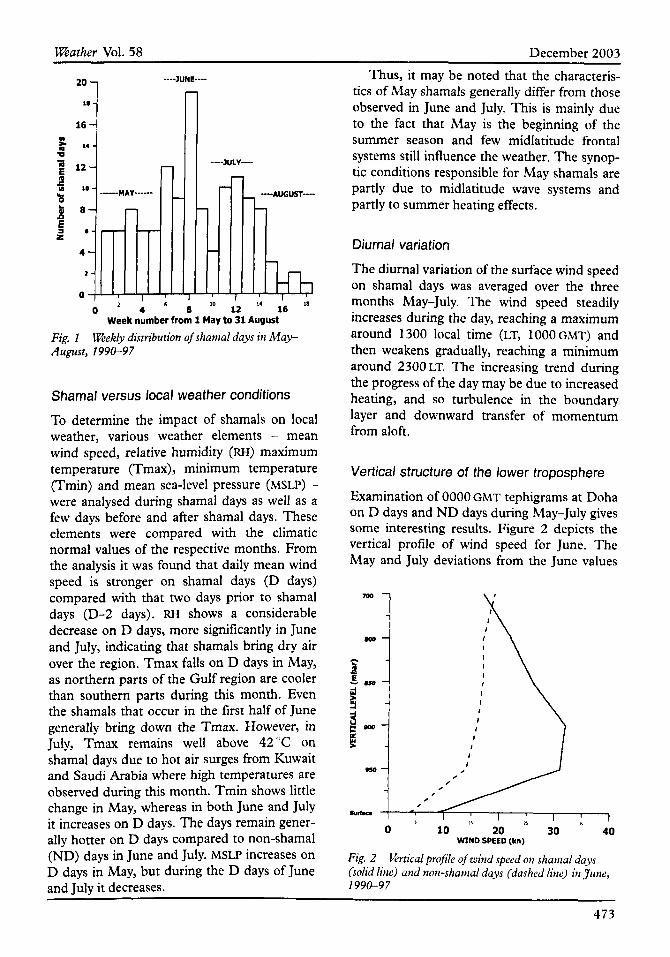
Table 1 1990-97
Deviations in wind speed (kn) in May and July from the June values at Doha International Airport,
May D day ND day
July D day ND day
Surface 950 mbar 900 mbar 850 mbar 800 mbar 700 mbar
+3 +1 + 1 0 -3 -1 -1 0 +2 0 +8 +1
0 + I +2 +4 +4 +4 +6 +2 +2 -1 -5 -7
are given in Table 1. From these, one can see that the wind speed rapidly increases from the surface (-1Okn) to 950mbar (-3Okn) on D days in all three months. Above this level, it decreases gradually up to 850 mbar in May, whereas it slightly increases up to 900 mbar and decreases further aloft in both June and July. No such rapid increase in wind speed is observed on ND days close to the surface. The mean wind direction is found to be predomi- nantly north-west in a relatively deep layer, up to 800mbar, on D days in the three months, suggesting that shamals extend up to a height of about 2 km in the lower troposphere.
The presence of a large wind shear between the surface and 950mbar has an adverse impact on air navigation during take-off and landing. The analysis of dry-bulb and dew- point temperature profiles revealed the pre- sence of a strong inversion between the surface and 950mbar which is very dry at the top on both D days and ND days. The temperature increases by about 6-8 degC, whereas RH decreases from -50% at the surface to -10% at 950 mbar. This stable dry layer is more marked in June and July than May, and inhibits convec- tive development in the summer months.
Wind and sea state during summer shamals
Over the sea, as well as reduced visibility, strong winds and rough seas prevail on D days.
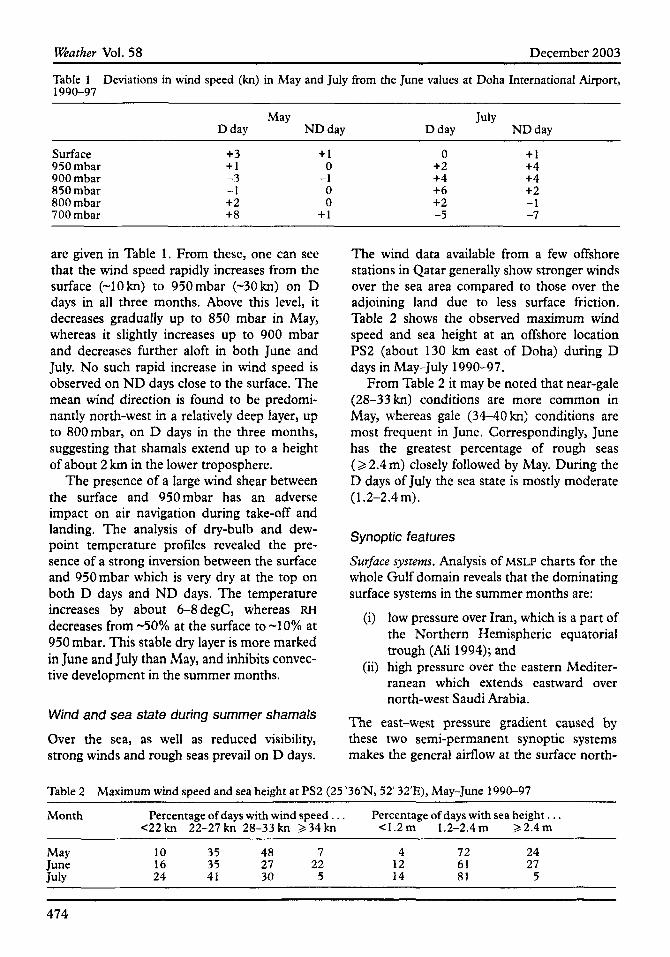
The wind data available from a few offshore stations in Qatar generally show stronger winds over the sea area compared to those over the adjoining land due to less surface friction. Table 2 shows the observed maximum wind speed and sea height at an offshore location PS2 (about 130 km east of Doha) during D days in May-July 1990-97.
From Table 2 it may be noted that near-gale (28-33kn) conditions are more common in May, whereas gale (344Okn) conditions are most frequent in June. Correspondingly, June has the greatest percentage of rough seas ( 2 2.4 m) closely followed by May. During the D days of July the sea state is mostly moderate (1.2-2.4m).
Synoptic features
&$ace systems. Analysis of MSLP charts for the whole Gulf domain reveals that the dominating surface systems in the summer months are:
(i) low pressure over Iran, which is a part of the Northern Hemispheric equatorial trough (Ah 1994); and
(ii) high pressure over the eastern Mediter- ranean which extends eastward over north-west Saudi Arabia.
The east-west pressure gradient caused by these two semi-permanent synoptic systems makes the general airflow at the surface north-
Table 2
Month
Maximum wind speed and sea height at PS2 (25"36'N, 52"32'E), May-June 1990-97
Percentage of days with wind speed . . . Percentage of days with sea height . . . <22 kn 22-27 kn 28-33 kn 234 kn <1.2m 1.2-2.4m 22.4m
10 35 48 7 4 72 24 16 35 27 22 12 61 27
May
July 24 41 30 5 14 81 5 June
474
Weather Vol. 58 December 2003 westerlyhortherly over the Arabian Gulf (Takahashi and Arakawa 1981). In addition, the Zagros Mountains in Iran, north of the Arabian Gulf, and the topography of central Saudi Arabia, with a gradual sloping up of the terrain to the west and south-west, tend to enhance the north-westerly flow near the earth's surface. As such, a small increase in the magnitude of existing east-west pressure gradients strengthens the general north-west/ northerly flow and results in the outbreak of a shamal. An intensification of the seasonal low over centralhouth-east Iran and a shifting of the low slightly westwards are favourable con- ditions for shamals. Similarly, the strengthen- ing of the Mediterranean high, with a ridge extending over central Saudi Arabia, favours and prolongs the shamal spell.
Other than these two major synoptic sys- tems, there are a few semi-permanent synoptic systems that influence the summer shamals. Amongst them, the seasonal trough running north-west from the Iran low towards northern Iraq is found to be directly related to shamals. Observations show that a well-marked trough with an embedded low over north-west Iran and adjoining Iraq has a positive effect, but is unfavourable if the trough becomes weak or shifts southward and is nearly zonal across the northern Gulf. Another synoptic system observed in this season is the development of a low pressure area over the southern Saudi Ara- bian peninsula. If the low becomes intense with a northward extension over central Saudi Arabia this is negatively related to summer shamals.
Another synoptic system seen on the MSLP charts during the summer months is a near north-south trough, running from the Iran low to the southern Saudi Arabian low via the south-east Arabian Gulf and the United Arab Emirates (UAE). It has a mean position of about 54'E over the Arabian Gulf and mean- ders east-west around this position. Observa- tions show that shamals exist only to the west of the trough position, and thus the extreme south-east Gulf and adjoining UAE are not affected by them. It is also seen that shamals strengthen whenever a closed low develops over Lavan Island and neighbouring southern Iran within the trough, as this enhances the
pressure gradient between the north and south-east Gulf. Another pressure system observed during the summer months is the Caspian high, located over and around the Caspian Sea. This is a semi-permanent system which occasionally strengthens under the influ- ence of a frontal system moving northwards and results in the formation of a ridge that extends southwards over central Iran. This situation is found to be unfavourable for shamals as, when the southward extension of the ridge weakens, the Iran low thereby reduces the east-west pressure gradient across the Gulf.
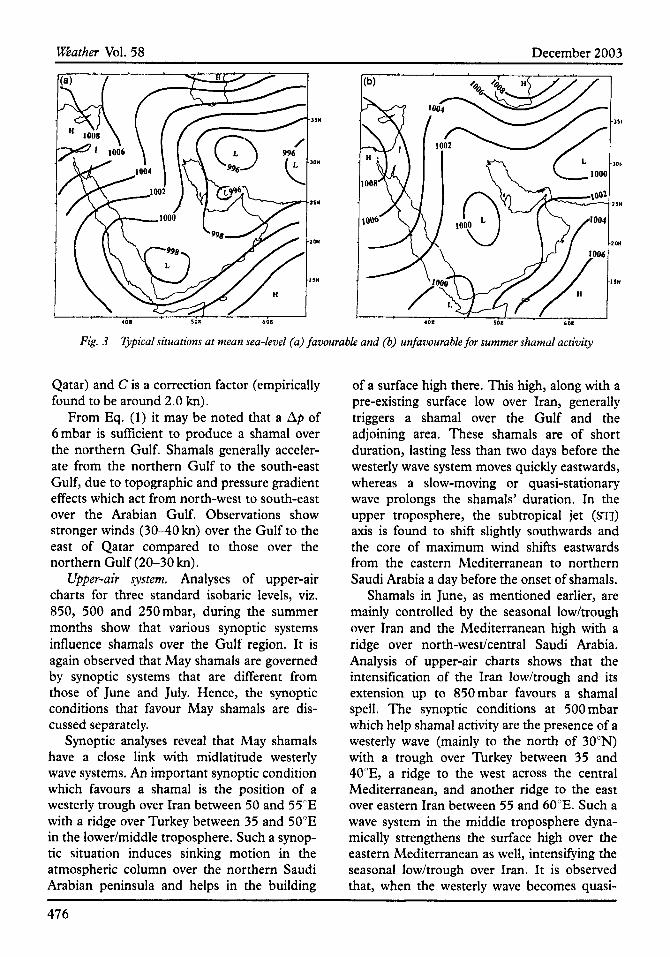
Figure 3(a) shows a synoptic situation ideal for shamal activity over the Gulf region in the summer months. All the pressure systems may not exist simultaneously during a shamal spell, but some of them may exist or develop subse- quently and help in strengthening or prolong- ing a shamal. The analysis indicates that close monitoring of pressure-tendency values helps in forecasting shamal activities. A positive pres- sure tendency over north-east and central Saudi Arabia, with a simultaneous negative pressure tendency over central Iran, Qatar and the UAE, is found to be favourable for a shamal spell.
Figure 3(b) shows a synoptic situation gen- erally unfavourable for shamal activity. A pos- itive pressure tendency over central Iran, Qatar and the UAE, with a simultaneous negative pressure tendency over central Saudi Arabia and the northern Gulf, is found to be un- favourable for shamal activities. Thus, by care- fully weighing the relative importance and changes in the strength and location of differ- ent pressure systems, a reasonable forecast of shamals is possible.
Computation of wind speed. From the above, it is obvious that a shamal is mainly driven by an increase in the east-west pressure gradient across the Gulf region. The geostrophic equa- tion was used, with a correction factor to account for topographic and other ageos- trophic effects. It is of the form:
V=3.0 Ap+C (1) where Vis wind speed (kn), Ap is difference in MSLP (mbar) between Zone I (Syria, Jordan and northern Saudi Arabia) and Zone I1 (cen- tral Saudi Arabia, Iran, Kuwait, Bahrain and
475
Weather Vol. 58 December 2003
Fig. 3 Typical situations at mean sea-level (a) favourable and (b) unfavourable for summer shamal activity
Qatar) and C is a correction factor (empirically found to be around 2.0 kn).
From Eq. (1) it may be noted that a Ap of 6mbar is sufficient to produce a shamal over the northern Gulf. Shamals generally acceler- ate from the northern Gulf to the south-east Gulf, due to topographic and pressure gradient effects which act from north-west to south-east over the Arabian Gulf. Observations show stronger winds (30-40 kn) over the Gulf to the east of Qatar compared to those over the northern Gulf (20-30 kn).
Upper-air system. Analyses of upper-air charts for three standard isobaric levels, viz. 850, 500 and 250mbar, during the summer months show that various synoptic systems influence shamals over the Gulf region. It is again observed that May shamals are governed by synoptic systems that are different from those of June and July. Hence, the synoptic conditions that favour May shamals are dis- cussed separately.
Synoptic analyses reveal that May shamals have a close link with midlatitude westerly wave systems. An important synoptic condition which favours a shamal is the position of a westerly trough over Iran between 50 and 55'E with a ridge over Turkey between 35 and 50"E in the lower/middle troposphere. Such a synop- tic situation induces sinking motion in the atmospheric column over the northern Saudi Arabian peninsula and helps in the building
of a surface high there. This high, along with a pre-existing surface low over Iran, generally triggers a shamal over the Gulf and the adjoining area. These shamals are of short duration, lasting less than two days before the westerly wave system moves quickly eastwards, whereas a slow-moving or quasi-stationary wave prolongs the shamals' duration. In the upper troposphere, the subtropical jet (STJ) axis is found to shift slightly southwards and the core of maximum wind shifts eastwards from the eastern Mediterranean to northern Saudi Arabia a day before the onset of shamals.
Shamals in June, as mentioned earlier, are mainly controlled by the seasonal low/trough over Iran and the Mediterranean high with a ridge over north-westkentral Saudi Arabia. Analysis of upper-air charts shows that the intensification of the Iran low/trough and its extension up to 850mbar favours a shamal spell. The synoptic conditions at 500 mbar which help shamal activity are the presence of a westerly wave (mainly to the north of 30"N) with a trough over Turkey between 35 and 40"E, a ridge to the west across the central Mediterranean, and another ridge to the east over eastern Iran between 55 and 60"E. Such a wave system in the middle troposphere dyna- mically strengthens the surface high over the eastern Mediterranean as well, intensifying the seasonal lowhrough over Iran. It is observed that, when the westerly wave becomes quasi-
476
Weather Vol. 58
stationary, a shamal persists for a longer period (more than 48 hours). In the upper tropo- sphere, the core of maximum wind associated with the STJ appears to shift from Turkey to Iran about 24-36 hours before the shamal's onset. It is observed that a shamal weakens whenever a north-south trough develops over the eastern Mediterranean at 850 mbar and extends up to mid-troposphere with a west- ward tilt, as this synoptic situation weakens the surface high over the eastern Mediterranean.
Analyses of the upper-air flow pattern for July show that the synoptic conditions favour- able for shamals during this month are similar to those observed in June. However, intens- ification of the seasonal trough extending from southern Turkey to central Iran in the lower troposphere appears then to be the most important synoptic condition for a shamal spell. A weak trough, or the western end of the trough dipping into the eastern Mediterranean, seems to be unfavourable for shamals. In the middle troposphere, westerly wave systems are generally weakly defined in July and the upper- troposphere STJ lies near 40"N, and hence no large changes could be identified during a shamal spell.
Conclusions The analyses of surface and upper-air data over the Arabian Gulf for the period 1990-97 during the summer shamal months of May to July reveal the following:
Shamals generally affect eastern Saudi Arabia, Kuwait, Qatar and its neigh- bourhood. The activity is at a maximum in June with the largest number of shamal days.
(ii) Shamals of long duration are more common in June and July, whereas most of the May shamals are of short dura- tion.
(iii) The diurnal variation of wind speed on a shamal day indicates that the wind speed steadily increases from early morning, attains a maximum around 1300 LT and then weakens, gradually reaching a minimum around 2300 LT.
(iv) The study clarifies that the characteris-
(i)
December 2003 tics of May shamals and the synoptic forces governing them differ signifi- cantly from those of June and July.
(v) Summer shamals cause low horizontal visibility due to rising dust and sand.
(vi) Low-level wind shear, and associated turbulence, is another adverse condition during shamals. The rapid increase in wind speed by about 20kn in a shallow layer 500 m above the ground may cause serious problems during aircraft take-off or landing.
(vii) In offshore areas rough seas occur as a result of strong winds, affecting various operational activities.
(viii) A geostrophic relation, with a correction factor, has been developed to compute the wind speed on a D day.
Acknowledgements The authors are grateful to the Civil Aviation Authority, State of Qatar, for the support to carry out this study.
References Ah, H. (1 992) Wind meteorology of summer shamal
over the Arabian Gulf. Unpublished master's thesis, Boston University, Boston, USA - ( 1 994) Wind regime of the Arabian Gulf. In:
El-Baz, F. and Makharita, R. M. (Eds.) The Guy War and the environment, Gordon and Breach Science Publishers, Switzerland
Hatwar, H. R., Rao, P. G., Sulaiti, M. and Ah, A. H. (1999) Some characteristics of summer shamals over the Arabian Gulfand neighbourhood region. Technical Report of the Department of Civil Aviation and Meteorology, Doha, State of Qatar
Hatwar, H. R., Al-Sulaiti, M. and Ali, A. H. (2000) Summer shamals over the Arabian gulf and associated upper air systems. Technical Report, Department of Civil Aviation and Meteorology, State of Qatar
Membery, D. A. (1983) Low level wind profiles during the Gulf shamal. Weather, 38, pp. 18-24
Perrone, T. J. (1979) Winter shamal in the Persian Gulf. Technical Report TR-79-06, Naval Environ- mental Prediction Research Facility, Monterey, USA
Rao, P. G., Al-Sulaiti, M. and Al-Mulla, A. H. (2001) Winter shamals in Qatar, Arabian Gulf. Weather, 56, pp. 444-45 1
Takahashi, K. and Arakawa, H. (1981) Climates of
477
Weather Vol. 58 December 2003
SOuthern and wester* Asia. world Correspondence to: Dr P. Govinda Rao, Depart- Climatol., 9, pp. 215-228 ment of Civil Aviation and Meteorology, PO Box
World Climate Research Programme (1 998) Report 3000, Doha, Qatar. e-mail: [email protected] of the Atmospheric Observation Panel for Climate, ,(‘, Royal Meteorological Society, 2003. Global Climate Observing System. World Climate doi: 10.1256lwea.282.02 Research Programme (WCRP), AOPC-IV, Doc. 5.1/2, Honolulu, USA
Kew Observatory
J. F. P. Galvin Newton Abbot, Devon
A large, rather imposing, building in the Old Deer Park, Richmond, Surrey (5 1 “28’N, O0l9’W>, was built as the King’s Observatory on the south bank of the River Thames to the designs of Sir William Chambers. Its initial purpose was the observation of the eclipse of the sun by the planet Venus on 3 June 1769 by George 111. The site was formerly that of a Carthusian monastery, which was removed to provide space for the new building (Whipple 1937). Within the Observatory were modern telescopes that had been provided at the king’s expense. An important result of this observa- tion was the accurate discovery of the distance to the sun, later to be named the astronomical unit. However, this was only the beginning of a distinguished career for Kew Observatory that variously included astronomical, geomagnetic and meteorological research Uacobs 1969). Although the observation of weather was not the initial purpose of the King’s Observatory, by the late twentieth century it had become one of the Meteorological Office’s best known sites.
In the late eighteenth century, Kew was in an area of partly wooded countryside on a large meander of the River Thames about 17 km west-south-west of the City of London. How- ever, the development of the extensive urban fringe of London during the twentieth century was to spell its demise, although it remained in the protected surroundings of the Old Deer Park - a mixture of grassland and woodland, now the Royal Mid-Surrey Golf Club, as can
be seen in Fig. 1 . By the 1970s, its record had become influenced by its surroundings (Crad- dock 1965; Mofitt 1972; Mayes 1994) and it had become expensive to run.
The meteorological record from Kew is one of the longest in the British Isles. Regular observations of the weather commenced there in 1773 and continued with only a few short breaks until the Observatory was closed on 31 December 1980.
The instrumental record
Between 1773 and 1840, weather observations were made daily, occasionally more than once per day, although it seems that these readings were not very systematic (Whipple 1937). The thermometers were exposed in a northern window of the Observatory (a custom common in the late eighteenth century) and the rain- gauge was mounted on a pole above the roof, since at the time there were no grounds suit- able for a more conventional exposure. The height of the rim of the gauge is not known and the raingauge was later moved into the grounds of the Observatory once a suitable space had been cleared.
More systematic observations commenced in November 1842, after the Observatory had been put under the control of the British Asso- ciation for the Advancement of Science (BA). Apart from a few short breaks, most between 1848 and 1853, there was a continuous weather record kept until its closure.
478
Recommended