6/12/17 Shimada et al.
Page 1
SUPPLEMENTARY INFORMATION
SUPPLEMENTARY MATERIALS AND METHODS
PCR genotyping of mice
Primers used to genotype mice for Cre alleles were Cre-F, 5’-
AATGCTGTCACTTGGTCGTGGC-3’; Cre-R, 5’-GAAAATGCTTCTGTCCGTTTGC -3’. Primers
used to genotype mice for the Prdm16flox allele were Prdm16-G1, 5’-
TGCTAAGCCTTCACCGTTCT-3’ Prdm16-G2, 5’-TGCAGGGAGATTGACAAGTG-3’, and
Prdm16-G3, 5’-CCATGGTTCACATGGTCAAG-3’. Primers used to genotype mice for the
Prdm16Gt(OST67423)Lex allele were Prdm16Gt(OST67423)Lex-1, AAATGGCGTTACTTAAGCTAGCTTGC;
Prdm16Gt(OST67423)Lex-2, ACAGGCGAGGAACTGTATGAAAGG; Prdm16Gt(OST67423)Lex-3.
CCATCTGAGGTCGTCTGAAACTGG.
BrdU analysis
To assess the rate of cell division, we administered a pulse of BrdU (Sigma; 50 mg of BrdU/kg
body mass dissolved in PBS) injected i.p. 2 hours before the mice were killed for analysis. To
identify newborn neurons in the olfactory bulb, mice were injected i.p. with 50 mg of BrdU/Kg
body mass, then maintained on drinking water that contained 0.5 mg/ml BrdU for 1 week, then
switched to regular water for 4 weeks before being killed to analyze the frequency of
NeuN+BrdU+ neurons in olfactory bulb sections.
Temozolomide (TMZ) SVZ regeneration assay
TMZ (T2577; Sigma) was dissolved in 25% DMSO/75% 0.9% saline solution at 10 mg/ml by
heating briefly to 90–100°C, then shaking and rapidly cooling. TMZ was injected i.p. at 100
mg/kg/day for 3 consecutive days then mice recovered for 3–35 days before analysis.
Flow cytometry

6/12/17 Shimada et al.
Page 2
Enzymatically dissociated SVZ cells were stained with a combination of antibodies against cell
surface antigens for analysis and sorting (Mich et al. 2014), including anti-Ter119 (116233;
1:200; Biolegend, San Diego, CA), anti-CD45 (103133; 1:200; Biolegend), anti-CD24 (47-0242-
82; 1:200; eBioscience, San Diego, CA), anti-PSA-NCAM (5A5, Developmental Studies
Hybridoma Bank, Iowa City, IA, 1:200), anti-O4 (1:200), anti-PlexinB2 (14-5665-82; 1:200;
eBioscience), biotinylated anti-EGFR (BAF1280, 1:200; R&D Systems), anti-Glast (130-095-
822; 1:10; Miltenyi Biotec, Bergisch Gladbach, Germany), and DAPI (50 μg/ml, 1:200) for 45
minutes on ice. In some cases, APC anti-Glast antibody (130-098-803; 1:10; Miltenyi Biotec)
was also used. Cells were then washed and resuspended in secondary antibodies. Secondary
antibodies were PerCP-eFluor 710 conjugated anti-mouse IgG (46-4010-82; 1:400; Jackson
Immunoresearch, West Grove, PA), PE conjugated anti-hamster IgG (127-115-160; 1:400;
Jackson Immunoresearch), PE-Cy7 conjugated anti-mouse IgM (25-5790-82; 1:400;
eBioscience), or BV650-conjugated streptavidin (563260; 1:400; BD Biosciences). Cells were
analyzed using a 5 laser FACS Aria III (Becton Dickenson, Franklin Lakes, NJ). Data were
analyzed using FACSDiva (BD Biosciences) or FlowJo (Tree Star) software.
Quantitative RT-PCR
The SVZ was dissected from the lateral ventricle wall en face as described previously (Mirzadeh
et al. 2010). RNA was extracted using the RNeasy micro plus kit (Qiagen), and cDNA was
synthesized with iScript Reverse Transcription Supermix (Bio-Rad). Reactions were run in 20 µl
volumes with SYBR green and a LightCycler 480 (Roche Applied Science). Primer sequences
were: Prdm16 F 5’- AGCCATTCATATGCGAGGTC—3’, Prdm16 R 5’-
GAACATCTGCCCACAGTCCT-3’; Foxj1 F 5’-GAACTTCTTCCAGAACCTTCCTC-3’, Foxj1 R 5’-
TCCTCCGAACACGAATGTG-3’; β-actin F 5’- CGTCGACAACGGCTCCGGCATG-3’, β -actin R
5’- GGGCCTCGTCACCCACATAGGAG-3’.

6/12/17 Shimada et al.
Page 3
Immunohistochemistry
Mice were perfused with HBSS or PBS, dissected and bisected down the midline, fixed in 4%
PFA overnight at 4°C, and incubated in 30% sucrose for 2 days at 4°C. Brains were mounted
with OCT compound, and cut into 30 µm frozen sections. The frozen sections were incubated in
PBS for 15 min to dissolve away the OCT. Sections were then blocked in blocking buffer (3%
normal donkey serum [Jackson immunoResearch, West Grove, PA], 0.4% Triton X in PBS) for 1
hour at room temperature. Sections were incubated overnight at room temperature with primary
antibodies against the following antigens: β-catenin (1:500, C2206; Sigma), β-galactosidase
(1:500, Z3781; Promega), β-galactosidase (1:500, CGAL-45A-Z; ICL), β-tubulin III (1:1000,
PRB-435P; Covance), BrdU (1:500, ab6326, Abcam), doublecortin (DCX; 1:1000, AB5910;
Millipore), GFAP (1:1000, Z0334; DAKO), GFAP (1:500, G3893; Sigma), γ-tubulin (1:500, sc-
7396; Santa Cruz), Foxj1 (1:500, 14-9965-82; eBiosceience), Ki67 (1:500, ab1667; Abcam),
Nestin (1:500, PRB-315C; Covance), NeuN (1:1000, MAB377; Millipore), NeuroD1 (1:1000,
SC1084, Santa Cruz), P-Histone H3 (pH3; 1:500, 9706; Cell Signaling), Sox2 (1:500, AF2018;
R& D systems), S100B (1:500;Z0311 ; Dako), and S100B (1:500; S2532; Sigma).
For BrdU staining, sections were treated with 2 N HCl for 15 min at 37°C and washed
before incubating with blocking buffer. For staining with antibodies against Sox2 and Neurod1,
sections were treated with 0.1M citric acid (pH 6.0; pre-warmed to 50-60°C) and mildly heated in
a microwave (5 rounds of 20 seconds of microwave heating with 2 min and 40 seconds between
rounds). After three PBS washes, the sections were incubated in secondary antibodies (Alexa
Fluor 488-, 555-, 647- conjugated secondary antibodies, 1:500; Life Technologies, Carlsbad,
CA) for 1 hour at room temperature. Cell nuclei were stained with DAPI (Sigma). The TUNEL
(ApopTag Fluorescenin In Situ Apoptosis Detection Kit, S7110, Millipore) assay was performed
according to the manufacturer’s protocol. Slides were mounted with anti-fade prolong gold (Life
technologies) and images were acquired with a Zeiss LSM780 confocal microscope and a Leica
SP8 confocal microscope.
6/12/17 Shimada et al.
Page 4
Scanning electron microscopy
Mice were perfused with PBS followed by a fixative containing 2% glutaraldehyde, 2%
paraformaldehyde, and 0.1 M cacodylate buffer at pH 7.3. SVZs were dissected, then post-fixed
in 2.5% glutaraldehyde in 0.1M sodium cacodylate buffer overnight at 4°C. After three rinses in
0.1 M sodium cacodylate buffer, the samples were post-fixed with 2% osmium tetroxide in 0.1 M
sodium cacodylate buffer for 2h. Samples were next dehydrated in ethanol, followed by critical
point drying (Tousimis Samdri-795; Tousimis Research Corporation; Rockville, MD). Samples
were air dried in a hood, mounted on SEM stubs, and sputter coated with gold/palladium using a
Cressington 108 auto sputter coater (Cressington Scientific Instruments Ltd.; Watford, UK).
Images were acquired using a Field-Emission Scanning Electron Microscope (Zeiss Sigma; Carl
Zeiss AG, Oberkochen, Germany) at 2-3 kV.
Hematoxylin and eosin staining
Mice were perfused with HBSS or PBS, then the brains were dissected, fixed in 4% PFA
overnight at 4°C, and incubated in 0.1M PBS overnight at 4°C. Brains were processed over
a 12-hour period using a Thermo-Shandon Hypercenter Automated Tissue Processor
(A78400001D; ThermoFisher Scientific) which dehydrated the brains through 6 ethanol
concentrations, commencing with 50% ethanol and ending in 3 changes of absolute ethanol,
cleared through 3 changes of xylene, and infiltrated with wax through 3 Paraplast Plus paraffin
baths (39602004; Leica). Samples were embedded in Paraplast Plus using paraffin-
filled stainless steel base molds and a Thermo-Shandon Histocenter 2 Embedding Workstation
(6400012D; ThermoFisher Scientific). The brains were then cut in 5 μm thick sections and
stained by hematoxylin and eosin (Hematoxylin 560; 3801575; Leica and Alcoholic Eosin Y 515;
3801615; Leica) using a Sakura DRS-601 x-y-z robotic-stainer (DRS-601;Sakura-FineTek,
Torrance, CA). Slides were dehydrated and mounted with Permount (SP15-100; ThermoFisher).
6/12/17 Shimada et al.
Page 5
Microbead flow analysis
The SVZ was dissected from the lateral ventricle wall en face as described (Mirzadeh et al.
2010). The dissection was performed in ice-cold, oxygenated (95% O2 and 5% CO2) artificial
cerebrospinal fluid solution (aCSF) containing (in mM) 124 NaCl, 5 KCl, 2.6 CaCl2, 1.3 MgSO4,
1.24 NaH2PO4, 26 N aHCO3 and 10 glucose. The microbead flow analysis was also performed
in aCSF by adding 5 µl of fluorescent microbeads (1/1000 dilution of Fluoresbrite Carboxy YG
2.0 micron Microspheres: 09847: Polysciences, Warrington, PA) to the ventricular surface of the
en face dissected SVZ. Microbead flow was imaged at room temperature for 1000 frames (10
ms/frame) using a stereomicroscope (SMZ18, Nikon). To analyze the flow of microbeads, we
recorded the movement of non-attached beads using a 1.6X lens. Non-floating microbeads that
moved less than 30 µm were excluded from the analysis. Anterior and posterior regions of the
SVZ were selected rostral or caudal to the medial wall adhesion point (see Fig. 5A in ref
(Mirzadeh et al. 2008). Microbead movement was analyzed using Bitplane Imaris v7.7.1.
Chromatin Immunoprecipitation
We performed ChIPseq analysis on four independent samples of P4 SVZ cells from wild-type
C57BL/Ka mice (two mice per sample). Freshly dissected SVZ tissue was gently dissociated
using a 32G needle, then washed once with 1X PBS and fixed for 15 minutes with fresh 1%
paraformaldehyde in 1X Covaris Fixing buffer (Covaris TruChIP Chromatin Shearing Kit,
Cat#520154) at 4°C. Samples were quenched with 1X quenching buffer, washed twice with
PBS, and cell pellets were frozen. For sonication, samples were prepared according to the
Covaris TruChIP Chromatin Shearing low cell protocol. Chromatin was sheared by sonication
using a Covaris S2 focused ultra-sonicator to a size of 300-500 bp. Sonicated samples were
centrifuged to remove debris, and the supernatant was placed in a fresh tube. Chromatin was
pre-cleared with protein G agarose (Cell Signaling) for 30 minutes to one hour. Then, samples
6/12/17 Shimada et al.
Page 6
were diluted in Prdm16 ChIP buffer [20mM Tris, 0.1% SDS, 1% TritonX-100, 150mM NaCl,
1mM EDTA, protease inhibitors (Thermo Scientific Halt Protease and Phosphatase Inhibitor
Cocktail, Cat# 78440)] (Harms et al. 2015) and incubated overnight at 4°C with anti-Prdm16
antibody (Harms et al. 2014) or rabbit IgG antibody as control. Immunoprecipitated DNA was
collected by binding to protein G agarose for at least two hours at 4°C. The samples were
extensively washed and DNA was eluted in elution buffer (20mM Tris-HCl, pH8, 1mM EDTA,
1% SDS) at 65°C. Samples were treated with RNase A and proteinase K, and DNA was
extracted using phenol-chloroform extraction and ethanol precipitation. ChIP and input DNA
libraries were prepared for sequencing using the NEBNext Ultra II library preparation kit (NEB,
Cat# 520154) according to manufacturer’s instructions.
Eight ChIP-seq libraries (four IP and four input samples) were sequenced using an
Illumina NextSeq 500 sequencer (75bp, single-ended). The quality of ChIP-seq raw reads was
checked using FastQC 0.11.2. Raw reads were quality-trimmed using Trimmomatic 0.32 and
mapped to Ensembl’s mouse reference genome GRCm38, sourced from Illumina’s iGenomes
project (see https://support.illumina.com/sequencing/sequencing_software/igenome.html) using
Bowtie2 2.1.0. Mapped reads were quality-filtered using SAMtools 0.1.19, and peaks (genomic
regions where sequencing reads cluster) were called using MACS 2.1.0, with SVZ samples as
treatments and corresponding inputs as controls (MACS FDR q-value < 0.01). Common peaks
in the Prdm16 ChIP samples were identified using bedtools 2.25.0 and annotated using Homer
4.9 with mm10 genome annotations to associate them with their nearest promoter-Transcription
Start Site (TSS).
RNA-seq analysis
RNA samples were derived from the SVZ of postnatal day 4 Nestin-Cre;Prdm16fl/fl mice and
littermate controls. Three RNA-seq libraries per genotype, each from independent mice, were
prepared using the TruSeq® Stranded Total RNA library prep kit (RS-122-2301, Illumina). The

6/12/17 Shimada et al.
Page 7
libraries were sequenced using an Illumina NextSeq500 sequencer (75bp, single-ended). There
were 43±12 million reads per library. The raw reads were mapped to Ensembl’s mouse
reference genome GRCm38, sourced from Illumina’s iGenomes project
(see https://support.illumina.com/sequencing/sequencing_software/igenome.html). TopHat
2.0.12 with Bowtie2 was used to map the raw reads (the mapping rate was 92±6%). The FPKM
calculations and differential expression analysis were performed using CuffNorm and CuffDiff in
the Cufflinks 2.2.1 suite, respectively. Differentially expressed genes were identified using the
following criteria: (1) FDR q-value < 0.005, (2) fold change > 2.5 relative to control in either
direction, (3) all three samples from at least one genotype had to be FPKM>1, and (4) all mean
FPKMs<1 were set to 1 to calculate fold changes.
We performed gene set enrichment analysis (GSEA) comparing postnatal day 4 SVZ
cells from Nestin-Cre; Prdm16fl/fl and littermate control mice. A list of genes with their fold
changes obtained from the RNA-seq analysis was inputted to the pre-ranked version of GSEA
2-2.2.1. To ensure that the GSEA was performed on genes that were actually expressed, all
three biological replicates of at least one genotype had to have FPKM>1. We used the
EnrichmentMap database of gene sets for the GSEA (Merico et al. 2010)
(http://download.baderlab.org/EM_Genesets/current_release/Mouse/symbol/). The GSEA was
performed using default settings from GSEA version 2-2.2.1. Gene sets with FDR q< 0.001 and
NES>2.3 in either direction were considered significant. There were 23,204 gene sets in the
database, 6,080 of which fulfilled the criteria in the default settings. A total of 14,671 unique
gene symbols were tested.
Cell quantification and statistics
Unbiased quantification of cell numbers on randomly-selected fields within brain sections were
obtained using stereological quantification with an Olympus BX51 System Microscope, a
MicroFIRE A/R camera (Optronics, Goleta, California), and the Optical Fractionator Probe within
6/12/17 Shimada et al.
Page 8
the Stereo Investigator software (MBF Bioscience, MicroBrightField, Inc., Williston, Vermont).
For ciliated ependymal cell quantification, ependymal cells in three to five randomly selected
regions of the ventricular surface were manually counted using Image J. The volume and area
of brain sections were measured manually using Neurolucida (MBF Bioscience). No formal
randomization techniques were used; however, mice were allocated randomly to experiments
and samples were processed in an arbitrary order. No blinding was performed. Sample sizes
were based on our experience with these assays. All data in Fig. are expressed as mean±SD.
For analysis of the statistical significance of differences between two genotypes, we generally
performed unpaired, two-tailed Student's t-tests. To assess the statistical significance of
differences between genotypes when the experimental design involved multiple conditions, such
as time points, we generally performed two-way ordinary ANOVAs with Sidak’s multiple
comparisons tests. Prior to performing statistical tests, the normality of the data was tested
using the Shapiro-Wilk tests or the D'Agostino-Pearson omnibus tests when sample sizes were
sufficient. Most data were normally distributed. We tested whether variability within groups was
similar using F-tests (for t-tests or alternatives) or Levine’s median test (for ANOVAs). When the
data were not normally distributed or there were significant differences in variability between
groups, the data were log2-transformed and tested again for normality and variability. If the data
were not normally distributed or not equally variable after the transformation, alternatives for t-
tests such as the Mann-Whitney test (when data were not normally distributed) or Welch’s tests
(when the data were normally distributed but not equally variable) were performed. All statistical
tests were performed using GraphPad with Prism7, following its Statistics Guide. For the
microbead movement analysis (Fig. 5I and Fig. S3J), non-floating microbeads that moved less
than 30 µm were excluded from the flow analysis. This exclusion criterion was established prior
to data collection. Otherwise, no mice or samples were excluded from any experiments. Values
of p < 0.05 were considered significant except for the identification of differentially expressed
genes by RNAseq (FDR q<0.005), and GSEA (FDR q<0.001).

6/12/17 Shimada et al.
Page 9
SUPPLEMENTARY FIGURE LEGENDS
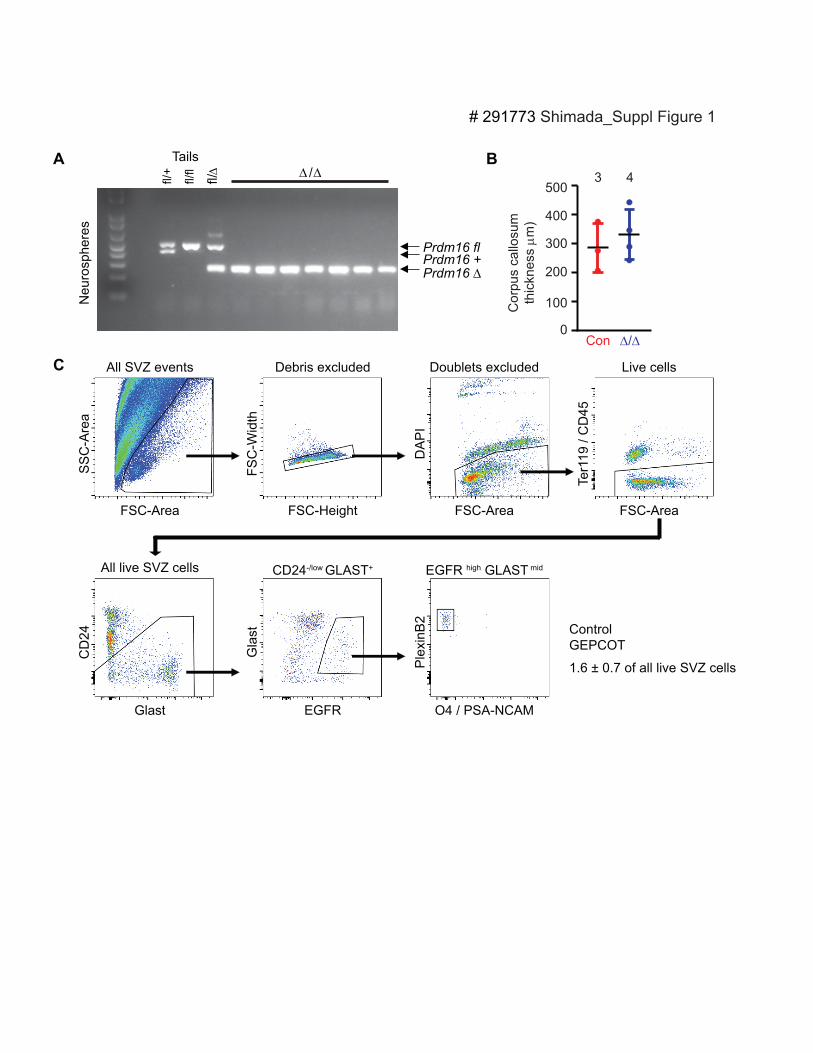
Suppl. Figure 1. Deletion of Prdm16 did not affect corpus callosum thickness in adult
Nestin-Cre; Prdm16fl/fl mice. (A) PCR genotyping of genomic DNA from neurospheres cultured
from Nestin-Cre; Prdm16fl/fl mice to assess the efficiency of Prdm16 deletion. In this image, 7 of
7 neurospheres exhibited complete deletion of Prdm16. Overall, we observed complete deletion
in 22 of 22 neurospheres cultured from 5 mice. The floxed allele was 490 bp, the WT allele was
408 bp and deleted allele was 244 bp. (B) The thickness of the corpus callosum in adult Nestin-
Cre; Prdm16fl/fl mice and littermate controls (3 independent experiments). The thickness of the
corpus callosum was measured at the dorsomedial lateral ventricle wall in 4-5 sections per
mouse, 300 µm apart, beginning at the rostral end of the lateral ventricle. Con is Prdm16fl/fl and
∆/∆ is Nestin-Cre;Prdm16fl/fl. (C) Flow cytometry plots showing the gates used to identify
GEPCOT cells (GLASTmidEGFRhighPlexinB2highCD24-/lowO4/PSA-NCAM-/lowTer119/CD45-) in an
adult mouse. Data represent mean ± SD. Statistical significance was assessed by Student’s t-
test. The numbers of replicates in each treatment are shown at the top of each graph.
Suppl. Figure 2. Prdm16 promotes proliferation and neurogenesis in the SGZ of the
dentate gyrus. Nestin-CreERT2; Prdm16fl/fl (∆/∆) and littermate control (Con) mice were treated
with tamoxifen for 1 month, beginning at 2 months of age, then analyzed 0.5, 3, or 6 months
later. All data, except in panel A, represent mean ± SD from 4 independent experiments (C-K).
(A) Male and female body mass 2 months after tamoxifen treatment. (B) PCR genotyping of
genomic DNA from neurospheres cultured from Nestin-CreERT2; Prdm16fl/fl mice 2 weeks after
tamoxifen treatment to assess the efficiency of Prdm16 deletion. In this image, 8 of 8
neurospheres exhibited complete Prdm16 deletion. Overall, we observed complete deletion in
24 of 25 neurospheres cultured from 3 mice. (C) The percentages of primary neurospheres that
gave rise to (C) neurons, (D) oligodendrocytes, or (E) astrocytes upon differentiation in adherent
cultures. (F) TUNEL+ dying cells per section. (G) Hematoxylin and eosin stained coronal

6/12/17 Shimada et al.
Page 10
sections through the dentate gyrus. (H) The number of Ki67+ proliferating cells per section. (I)
The number of SGZ cells per section that incorporated a 2 hour pulse of BrdU. (J, K) The
number of DCX+ cells (J) and NeuroD1+ cells (K) per mm3 of SGZ. The statistical significance of
differences between genotypes was assessed by two-way ANOVAs with Sidak’s multiple
comparisons tests (* p<0.05, ** p<0.01, *** p<0.001). The numbers of replicates in each
treatment are shown at the top of each graph.
Suppl. Figure 3. Ongoing Prdm16 expression is not required for the maintenance or
function of ependymal cells in the adult lateral ventricle. Nestin-CreERT2; Prdm16fl/fl (∆/∆) or
littermate control (Con) mice were treated with tamoxifen for 1 month, beginning at 2 months of
age, then analyzed 2 to 4 months later. All data represent mean ± SD from 2 independent
experiments. (A, B) The number of S100B+Sox2+GFAP- ependymal cells per mm3 in the lateral
wall of the lateral ventricle (4-5 sections per mouse, 300µm apart, beginning at the rostral end of
the lateral ventricle). (C, D) The number of γ-tubulin+β-catenin+ ciliated ependymal cells per field
of view on the surface of the lateral wall of the lateral ventricle. (E) Nearly all β-catenin+ cells on
the surface of the lateral wall of the lateral ventricle were also γ-tubulin+ in mice of both
genotypes. (F) Scanning electron microscopy revealed abundant ciliated ependymal cells on the
lateral wall of the lateral ventricle in mice of both genotypes. (G) S100B+Sox2+GFAP+ cells were
rare in the SVZ of mice of both genotypes. (H, I) Representative images of bead flow tracks on
the ventricular surface of SVZ specimens in culture. Beads tended to flow anteriorly over both
control and Nestin-CreERT2; Prdm16fl/fl SVZs. D indicates dorsal and A indicates anterior. (J)
Anterior and posterior regions of the SVZ were selected rostral or caudal to the adhesion point.
Each circle indicates 5% of the total number of microbeads. The statistical significance of
differences between genotypes was assessed using Welch’s test (E), Mann-Whitney tests (G,
J), and Student’s t-tests (A, C); in no case were the differences statistically significant. The
numbers of replicates or beads analyzed in each treatment are shown at the top of each graph.

6/12/17 Shimada et al.
Page 11
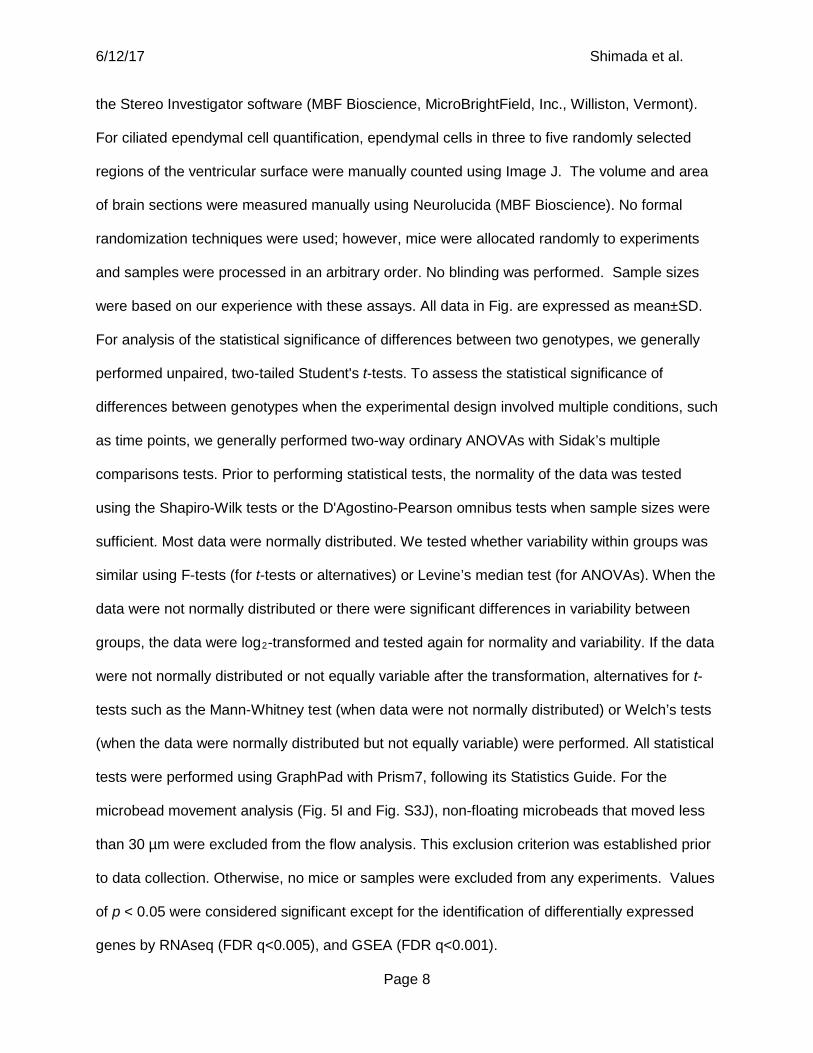
Supplementary Table 1: Genes that were downregulated after Prdm16 deletion. The
expression of 103 genes was significantly (FDR q<0.005) reduced (fold change>2.5) in the SVZ
of postnatal day 4 Nestin-Cre; Prdm16fl/fl mice as compared to littermate control mice by RNA-
seq analysis. Gene products involved in the formation or function of cilia are highlighted in blue.
Gene Mean FPKM of control
samples (n=3)
Mean FPKM of Prdm16-deficient
samples (n=3)
Adjusted fold-change Prdm16-deficient/
control
Ptgds 86.8 3.9 0.045 Tmem212 13.4 1.0 0.074 AU021034 9.4 1.0 0.106 Ccdc153 8.7 1.0 0.115 Hdc 8.4 1.0 0.119 Tm4sf1 12.4 1.8 0.141 Ak7 7.1 1.0 0.141 Lrrc23 39.6 6.0 0.153 Spata18 6.4 1.0 0.155 4930451C15Rik 6.3 1.0 0.159 Odf3b 6.1 1.0 0.163 Ppp1r32 6.1 1.0 0.165 Lgals3 6.7 1.2 0.176 1700012B09Rik 6.7 1.2 0.181 Wdr63 5.9 1.1 0.183 Fam107a 14.8 2.7 0.185 Dynlrb2 31.0 5.7 0.185 C4b 6.6 1.3 0.193 Ccdc113 5.7 1.1 0.194 Hgf 5.1 1.0 0.196 Cdhr4 5.0 1.0 0.201 Morn5 5.2 1.1 0.206 1700007G11Rik 4.7 1.0 0.212 1700026D08Rik 4.7 1.0 0.214 Cfap126 7.7 1.7 0.216 Ccna1 4.5 1.0 0.220 1700001C02Rik 4.5 1.0 0.220 1500015O10Rik 4.4 1.0 0.229 Ppp1r36 4.3 1.0 0.233 Fam183b 8.8 2.1 0.234 Ccdc67 7.6 1.8 0.237 Got1l1 4.2 1.0 0.238 Tekt4 4.1 1.0 0.243

6/12/17 Shimada et al.
Page 12
Ccdc108 4.1 1.0 0.246 Rsph1 12.1 3.0 0.250 Spag16 3.9 1.0 0.254 1700028P14Rik 3.9 1.0 0.259 Fam179a 3.9 1.0 0.260 Crip3 7.1 1.8 0.260 Aifm3 9.0 2.4 0.265 Fbxo36 3.8 1.0 0.265 Capsl 7.3 1.9 0.266 1700027A23Rik 9.8 2.6 0.268 Efhc1 3.9 1.1 0.270 Fhad1 3.7 1.0 0.271 Car9 3.6 1.0 0.274 1110017D15Rik 21.8 6.1 0.281 Aebp1 3.5 1.0 0.282 S100a4 11.0 3.1 0.284 Dapp1 5.7 1.6 0.286 Lpar1 11.5 3.3 0.286 1600029I14Rik 3.5 1.0 0.289 Lrrc46 3.4 1.0 0.293 1700016K19Rik 6.3 1.8 0.293 H19 19.8 5.8 0.293 Ccdc19 7.0 2.1 0.297 Fxyd3 4.5 1.4 0.298 Dnahc6 3.3 1.0 0.299 Bbox1 3.3 1.0 0.300 Ccno 4.0 1.2 0.302 Ccdc170 3.2 1.0 0.309 Islr 3.5 1.1 0.310 Ogn 3.2 1.0 0.311 E030010N08Rik 3.2 1.0 0.312 Fzd5 3.2 1.0 0.317 Rgs22 3.1 1.0 0.326 Ubxn10 3.0 1.0 0.330 6820408C15Rik 6.3 2.1 0.333 1700003M02Rik 8.4 2.8 0.335 Ccdc135 3.0 1.0 0.335 Myb 5.6 1.9 0.344 Rd3 2.9 1.0 0.344 Prrg4 2.9 1.0 0.349 4833427G06Rik 2.8 1.0 0.351
6/12/17 Shimada et al.
Page 13
Pls1 2.9 1.0 0.352 Col1a2 11.2 4.0 0.354 Musk 2.8 1.0 0.356 Sfrp5 2.8 1.0 0.356 Fam47e 2.8 1.0 0.356 Efcab10 2.8 1.0 0.357 Rsph4a 6.6 2.4 0.361 Col3a1 5.1 1.9 0.370 Slc24a6 2.7 1.0 0.371 Dnajb13 3.3 1.2 0.371 Dio2 6.5 2.4 0.371 Ak8 2.7 1.0 0.372 Loxl1 2.7 1.0 0.372 Chi3l1 4.0 1.5 0.373 Pamr1 4.1 1.5 0.379 Hspa2 11.3 4.3 0.379 Gm216 2.6 1.0 0.381 Fbln2 15.9 6.1 0.385 Lrrc48 15.3 5.9 0.386 Spef2 2.8 1.1 0.386 Cd82 12.2 4.7 0.388 Cybrd1 2.5 1.0 0.393 Aard 3.5 1.4 0.397 Cyp4f15 2.5 1.0 0.398 Lrrc34 2.5 1.0 0.402 Foxj1 28.7 11.5 0.403 Armc3 3.5 1.4 0.403 Spa17 7.7 3.1 0.404 Fam161a 4.2 1.7 0.405
6/12/17 Shimada et al.
Page 14
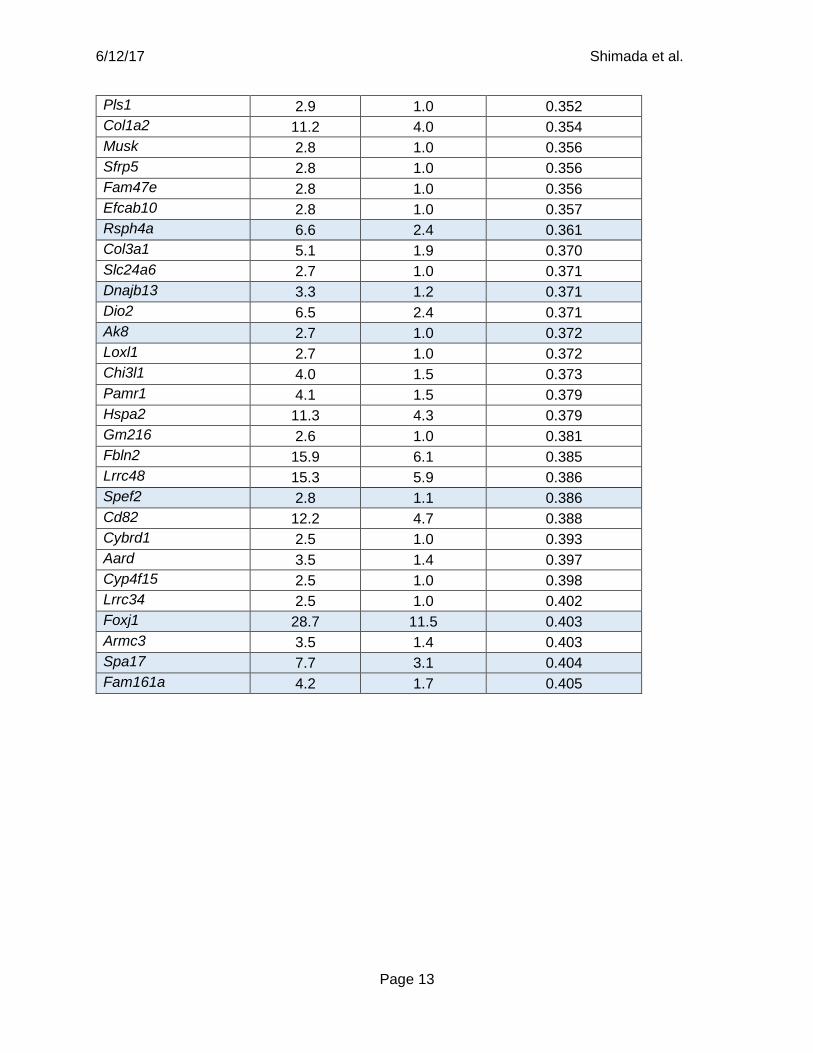
Supplementary Table 2: Genes that were upregulated after Prdm16 deletion. The
expression of 27 genes was significantly (FDR q<0.005) increased (fold change>2.5) in the SVZ
of postnatal day 4 Nestin-Cre; Prdm16fl/fl mice as compared to littermate control mice by RNA-
seq analysis. No gene products involved in the formation or function of cilia were upregulated
after Prdm16 deletion.
Gene Mean FPKM of control
samples (n=3)
Mean FPKM of Prdm16-deficient
samples (n=3)
Adjusted fold-change Prdm16-deficient/
control
0610040J01Rik 1.8 10.4 5.79 Egfl6 1.0 5.2 5.17 Upp1 1.1 5.6 5.00 F5 1.0 4.9 4.90 Ptx3 6.2 30.1 4.85 Scel 1.0 4.6 4.55 P4ha3 2.5 11.2 4.54 Agt 3.9 17.1 4.38 Ccdc3 2.7 11.4 4.29 Moxd1 1.8 6.9 3.92 AC129605.1 1.6 5.9 3.62 Dgkk 1.1 3.9 3.60 Fam20a 1.8 5.9 3.24 Lars2 14.0 45.1 3.22 Fgfbp3 15.4 48.6 3.17 Gm5506 3.1 9.9 3.16 Bhlhe22 3.3 10.0 3.03 Mitf 1.3 3.8 2.98 2610034M16Rik 5.7 16.8 2.95 Slc14a1 1.5 4.3 2.88 Adora2b 1.1 3.1 2.84 C1ql3 2.2 5.9 2.72 Rprml 11.6 30.8 2.66 Enpp2 12.9 33.7 2.61 Pdzrn3 7.9 20.3 2.56 Hpgd 1.3 3.3 2.56 Gpr101 1.2 3.1 2.51
6/12/17 Shimada et al.
Page 15
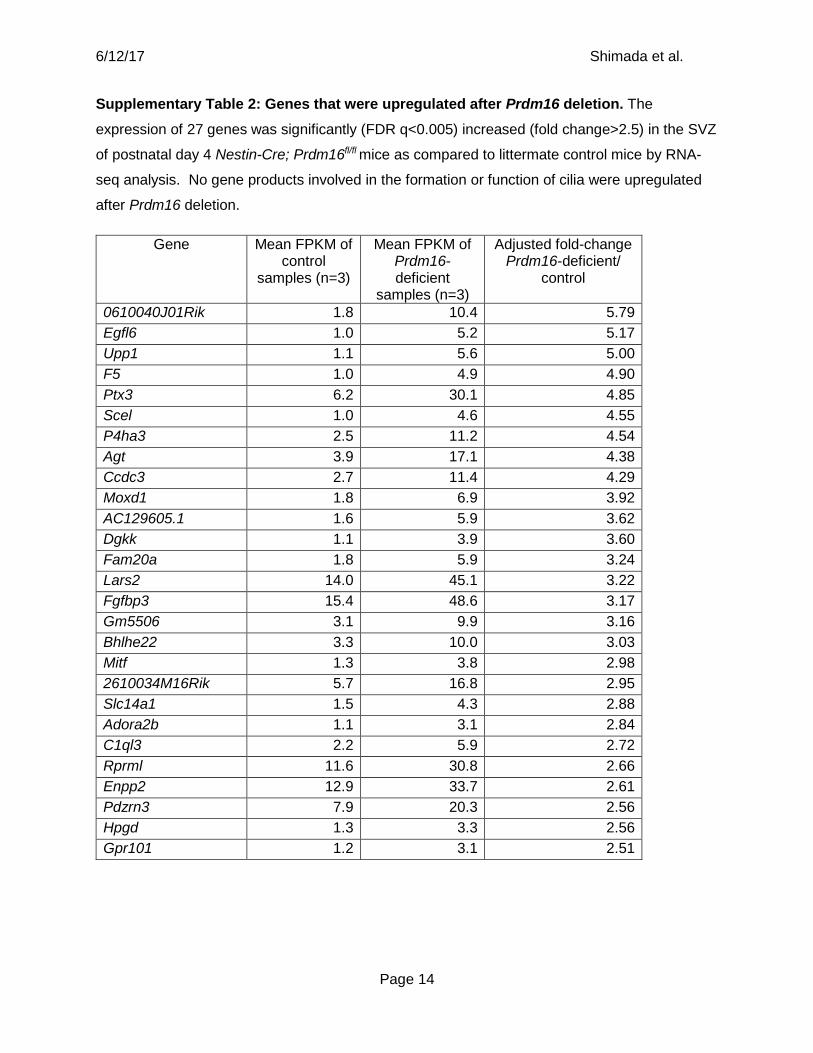
Supplementary Table 3: Gene sets that were significantly dowregulated in Prdm16-deficient SVZ cells. 6 gene sets were significantly (FDR q<0.001) downregulated (NES<-2.3)
in the SVZ of postnatal day 4 Nestin-Cre; Prdm16fl/fl mice as compared to littermate control mice
by GSEA. Gene set name, Gene ontology ID (GO ID)(Ashburner et al. 2000) and normalized
enrichment score (NES) are shown. Gene sets related to the formation or function of cilia are
highlighted in blue.
Gene set name GO ID NES
CILIARY CYTOPLASM GO 0097014 -2.5
AXONEME GO 0005930 -2.4
MICROTUBULE BUNDLE FORMATION GO 0001578 -2.4
AXONEME ASSEMBLY GO 0035082 -2.3
CILIUM MOVEMENT GO 0003341 -2.3
MOTILE CILIUM GO 0031514 -2.3

6/12/17 Shimada et al.
Page 16
Supplementary Table 4: Gene sets that were significantly upregulated in Prdm16-deficient SVZ cells. 9 gene sets were significantly (FDR q<0.001) upregulated (NES>2.3) in
the SVZ of postnatal day 4 Nestin-Cre; Prdm16fl/fl mice as compared to littermate control mice
by GSEA. Gene set name, Gene ontology ID (GO ID)(Ashburner et al. 2000), Kyoto
Encyclopedia of Genes and Genomes (KEGG) pathway ID(Kanehisa and Goto 2000),
Reactome ID(Croft et al. 2014) and normalized enrichment score (NES) are shown.
Gene set name GO ID, Ractome ID or KEGG ID
NES
NEURONAL SYSTEM R-HAS-112316 2.4
SYNAPTIC TRANSMISSION GO 0007268 2.4
GLUTAMATERGIC SYNAPSE HAS 04724 2.4
TRANSMISSION ACROSS CHEMICAL SYNAPSES R-HSA-112315 2.4
NEUROTRANSMITTER RECEPTOR BINDING AND DOWNSTREAM TRANSMISSION IN THE POSTSYNAPTIC CELL
R-HSA-112314 2.3
CALCIUM SIGNALING PATHWAY HAS 04020 2.3
VOLTAGE-GATED CATION CHANNEL ACTIVITY GO 0022843 2.3
TRANSMEMBRANE TRANSPORTER COMPLEX GO 1902495 2.3
IONOTROPIC GLUTAMATE RECEPTOR COMPLEX GO 0008328 2.3

6/12/17 Shimada et al.
Page 17
SUPPLEMENTARY REFERENCES
Ashburner M, Ball CA, Blake JA, Botstein D, Butler H, Cherry JM, Davis AP, Dolinski K, Dwight
SS, Eppig JT et al. 2000. Gene ontology: tool for the unification of biology. The Gene
Ontology Consortium. Nature genetics 25: 25-29.
Croft D, Mundo AF, Haw R, Milacic M, Weiser J, Wu G, Caudy M, Garapati P, Gillespie M,
Kamdar MR et al. 2014. The Reactome pathway knowledgebase. Nucleic acids research
42: D472-477.
Harms MJ, Ishibashi J, Wang W, Lim HW, Goyama S, Sato T, Kurokawa M, Won KJ, Seale P.
2014. Prdm16 is required for the maintenance of brown adipocyte identity and function in
adult mice. Cell metabolism 19: 593-604.
Harms MJ, Lim HW, Ho Y, Shapira SN, Ishibashi J, Rajakumari S, Steger DJ, Lazar MA, Won
KJ, Seale P. 2015. PRDM16 binds MED1 and controls chromatin architecture to
determine a brown fat transcriptional program. Genes & development 29: 298-307.
Kanehisa M, Goto S. 2000. KEGG: kyoto encyclopedia of genes and genomes. Nucleic acids
research 28: 27-30.
Merico D, Isserlin R, Stueker O, Emili A, Bader GD. 2010. Enrichment map: a network-based
method for gene-set enrichment visualization and interpretation. PloS one 5: e13984.
Mich JK, Signer RA, Nakada D, Pineda A, Burgess RJ, Vue TY, Johnson JE, Morrison SJ.
2014. Prospective identification of functionally distinct stem cells and neurosphere-
initiating cells in adult mouse forebrain. eLife 3: e02669.
Mirzadeh Z, Doetsch F, Sawamoto K, Wichterle H, Alvarez-Buylla A. 2010. The subventricular
zone en-face: wholemount staining and ependymal flow. J Vis Exp.
Mirzadeh Z, Merkle FT, Soriano-Navarro M, Garcia-Verdugo JM, Alvarez-Buylla A. 2008. Neural
stem cells confer unique pinwheel architecture to the ventricular surface in neurogenic
regions of the adult brain. Cell stem cell 3: 265-278.
# 291773 Shimada_Suppl Figure 1
A B
Neu
rosp
here
s
∆ /∆
Prdm16 flPrdm16 +Prdm16 ∆
fl/+
fl/fl
fl/∆
Tails
∆/∆Con
FSC-Area
SSC
-Are
a
FSC
-Wid
th
FSC-Height
Gla
st
DAP
I
Ter1
19 /
CD
45
Plex
inB2
O4 / PSA-NCAMEGFR
CD
24
FSC-Area FSC-Area
Glast
C All SVZ events Debris excluded Doublets excluded Live cells
All live SVZ cells CD24-/low GLAST+ EGFR high GLAST mid
ControlGEPCOT1.6 ± 0.7 of all live SVZ cells
Cor
pus
callo
sum
thic
knes
s µm
)
500
400
300
200
100
0
3 4

# 291773 Shimada_Suppl. Fig. 2
A
0
10
20
30
40
Body
mas
s (g
)
Neurospheres H2O
fl/+
fl/fl
fl/∆
Tails
Prdm16 flPrdm16 +Prdm16 ∆
B
Male Female∆/∆Con
∆/∆Con
G H
I
0
1
2
3
4
Neur
oD1
(X10
5 cells
/mm
3 )
J K
0
5
10
15Ki
67 (
X104 ce
lls/m
m3 )
∆/∆Con
1 mm 1 mm
C
0
50
100
% o
f sph
eres
that
co
ntai
ned
neur
ons
3 M0.5 M 6 M∆/∆Con
∆/∆Con∆/∆Con
0
2
4
6
TUN
EL C
ells
/sec
tion
3 M0.5 M 6 M∆/∆Con
∆/∆Con∆/∆Con
3 M0.5 M 6 M∆/∆Con
∆/∆Con∆/∆Con
3 M0.5 M 6 M∆/∆Con
∆/∆Con∆/∆Con0
1
2
3
4
DCX
(X10
5 cells
/mm
3 )
3 M0.5 M 6 M∆/∆Con
∆/∆Con∆/∆Con
BrDU
(X
104 ce
lls/m
m3 )
0
1
23
5
4
3 M0.5 M 6 M∆/∆Con
∆/∆Con∆/∆Con
D
0
50
100
% o
f sph
eres
that
co
ntai
ned
olig
oden
droc
ytes
3 M0.5 M 6 M∆/∆Con
∆/∆Con∆/∆Con
E
0
50
100
% o
f sph
eres
that
co
ntai
ned
astro
cyte
s
3 M0.5 M 6 M∆/∆Con
∆/∆Con∆/∆Con
F
****
***
* ******
*****
*
***
** ***** ***
11
3
7 4 6 4 4 4 1410 8
4 4 4 1410 84 4 4 1410 8 4 4 333
4 43 4 4 4
4 43 4 4 4 4 4 4 4 3 3 4 4 4 4 3 3

B
C
H
I
# 291773 Shimada_Suppl. Fig. 3A
D
F
J
G
E
0
2
4
6
8GF
AP- SO
X2+ S1
00B+
( X10
5 cells
/mm
3 )
GFA
P S1
00B
SOX2
Ante
rior
Post
erio
r
D
A
ns
ns
D
A
D
A
Bead flow
20 µm 20 µm
β-ca
teni
n γ-
tubu
lin D
API
20 µm 20 µm
500 µm
500 µm
∆/∆Con
0
0.02
0.04
0.08
GFAP
+ SOX2
+ S100
B+ (X
105 ce
lls/m
m3 )
10 µm 10 µm
∆/∆Con
0.06
0
20
40
60
80100
% o
f β-c
aten
in+ ce
lls th
at a
re γ
-tubu
lin+
∆/∆Con∆/∆Con
β-ca
teni
n+ γ-
tubu
lin+
(X 1
03 cel
ls/m
m2 )
0
1
2
34
5
3 3
3 3 3 3
3 3
∆/∆
Con
∆/∆Con
∆/∆Con
∆/∆Con
Con ∆/∆
Bead flow direction
n=62 n=61
Con ∆/∆n=82 n=83
Recommended