Supporting Information
Unraveling the mechanism of the oxidation of glycerol to dicarboxylic acids
over a sonochemically synthesized copper oxide catalyst
Prince N. Amaniampong, a,# Quang Thang Trinh,b,# Jithin John Varghese,b Ronan Behling,c
Sabine Valange,c Samir H. Mushrif,d,e* Francois Jeromea,c*
a INCREASE (FR CNRS 3707), Université de Poitiers, ENSIP, 1 rue Marcel Doré, TSA41105,
86073 Poitiers Cedex 9, France
b Cambridge Centre for Advanced Research and Education in Singapore (CARES), Campus for
Research Excellence and Technological Enterprise (CREATE), 1 Create Way, Singapore 138602,
Singapore.
c Institut de Chimie des Milieux et Matériaux de Poitiers (IC2MP), Université de Poitiers,
d School of Chemical and Biomedical Engineering, Nanyang Technological University, 62
Nanyang Drive, Singapore 637459, Singapore.
e Department of Chemical and Materials Engineering, University of Alberta, 9211-116 St NW,
Edmonton, Alberta T6G1H9, Canada.
Corresponding Author
* [email protected] (SHM)
* [email protected] (FJ)
Electronic Supplementary Material (ESI) for Green Chemistry.This journal is © The Royal Society of Chemistry 2018
1. Experimental Methods
1.1. Preparation of Copper (II) Oxide Nanoleaves (CuO NLs) under ultrasound irradiation.
All chemical reagents were used without further purification. In a typical synthesis method, 40
mL of 0.25 M NaOH aqueous solution was added to 10 mL of 0.5 M Cu(NO3)2 aqueous solution
and a sky-blue suspension was obtained. This suspension was subsequently exposed a low
frequency ultrasound irradiation. Ultrasound was generated by a Digital Sonifier S-250D from
Branson (power of standby Po = 27.0 W, nominal electric power of the generator Pelec = 8.2 W).
A 3.2 nm diameter tapered microtip probe operating at a frequency of 19.95 kHz was used. The
volume acoustic power of this system was P acous.vol = 0.25 W.mL-1 in water (determined by
calorimetry measurements)1. The ultrasound probe was immersed directly in the reaction
medium and a Minichiller cooler (Huber) was used to control the reaction temperature at 25 oC.
On completion of sonication at the desired time, the dark blue or black precipitates were washed
thoroughly with distilled water and dried in an oven at 60 oC overnight.
1.2. Preparation of Copper (II) Oxide Nanoleaves (CuO NLs) under Mechanical stirring.
Copper (II) oxide nanoleaves synthesis procedure was adapted following the procedure
previously described by Amaniampong et al.2 Briefly, 20 mL of 0.25 M NaOH aqueous solution
was added to 5 mL of 0.5 M Cu(NO3)2 aqueous solution under stirring at room temperature and
the mixture was continuously stirred overnight. The solid sample was then washed with
deionized water several times and dried in an oven at 60 oC.
1.3. Catalyst Characterization
Crystallographic analysis of the CuO NLs were performed by means of XRD measurements in
2ϴ mode on a Bruker AXS D8 diffractometer with CuKα (λ = 0.154056 Å) radiation at 40 kV and
20 mA. XPS was performed on a Thermo Escalab 250 spectrometer. The binding energy was
calibrated using C1s (284.6 eV) as a reference. The as-synthesized CuO nanoleaves morphology
was also studied by SEM (JEOL JSM 6700F field emission), TEM and HR-TEM (JEOL JEM-
2100F). Surface area analysis was determined by nitrogen physisorption on a Micromeritics
TrisStar apparatus. The specific area was calculated using the Brunauer-Emmett-Teller (BET)
equation.
1.4. Activity test and analytical methods.
The general procedure for testing the catalytic oxidation of glycerol over CuO NLs catalyst in
the presence of H2O2 is briefly described here. Typically, about 0.100 g of glycerol was charged
into a 25 mL capacity round-bottom flask and an appropriate amount of CuO NLs catalyst
(unless otherwise stated) added. To this, 2 equivalent H2O2 and 2 mL of DI water were added
sequentially. The reaction mixture was heated in a temperature controlled oil bath and heated to
desired reaction temperatures. Once the pre-set temperature of the oil bath is attained, stirring
rate was set at 250 rpm and reaction proceeds until the desired reaction time. After the reaction,
approximately 05 mL of the reaction liquid sample was taken and diluted and filtered before
HPLC analysis. Oxalic acid, tartronic acid, glycolic acid, formic acid and glyceraldehyde were
all confirmed using a Varian Pro Star HPLC equipped with an ICE-COREGEL 107H column
300 x 7.8 mm from Transgenomic, a UV/Vis detector (Varian Pro Star, 210 nm) and a refractive
index detector (Varian 356-LC). A H2SO4 aqueous solution (7 mM) was used as the eluent with
a 0.4 mL min-1 flow rate. External calibration of the liquid chromatography was performed using
standards of oxalic acid, glycolic acid, glycerol, tartronic acid, glyceraldehyde and formic acid
was quantified by the difference between the two HPLC analyses. Noteworthy, the detected
amount of formic acid reported in our study is the solubilized fraction of it, although the
volatized amount of formic acid at the analyze condition is small according to its corresponding
Henry’s law coefficient.3 After each set of reaction, the catalyst is filtered off, by washing

thoroughly with DI water, it is then dried in an oven at 60 °C overnight. The recovered dried
samples are weighed to estimate the exact amount of recovered catalyst after recycling. Typically,
90-85 % of the catalyst amounts are recovered. All other reactant amounts are adjusted to the
amount of recovered catalyst in order to obtain uniform reaction parameters throughout the
experiment.
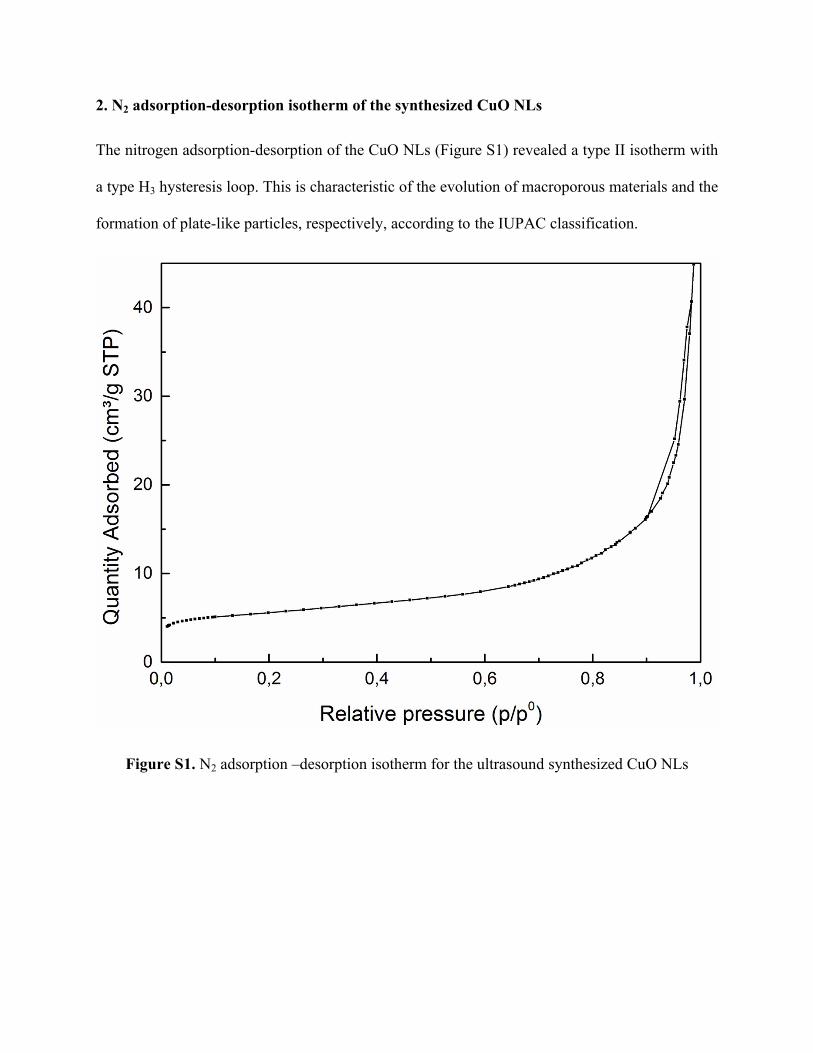
2. N2 adsorption-desorption isotherm of the synthesized CuO NLs
The nitrogen adsorption-desorption of the CuO NLs (Figure S1) revealed a type II isotherm with
a type H3 hysteresis loop. This is characteristic of the evolution of macroporous materials and the
formation of plate-like particles, respectively, according to the IUPAC classification.
Figure S1. N2 adsorption –desorption isotherm for the ultrasound synthesized CuO NLs
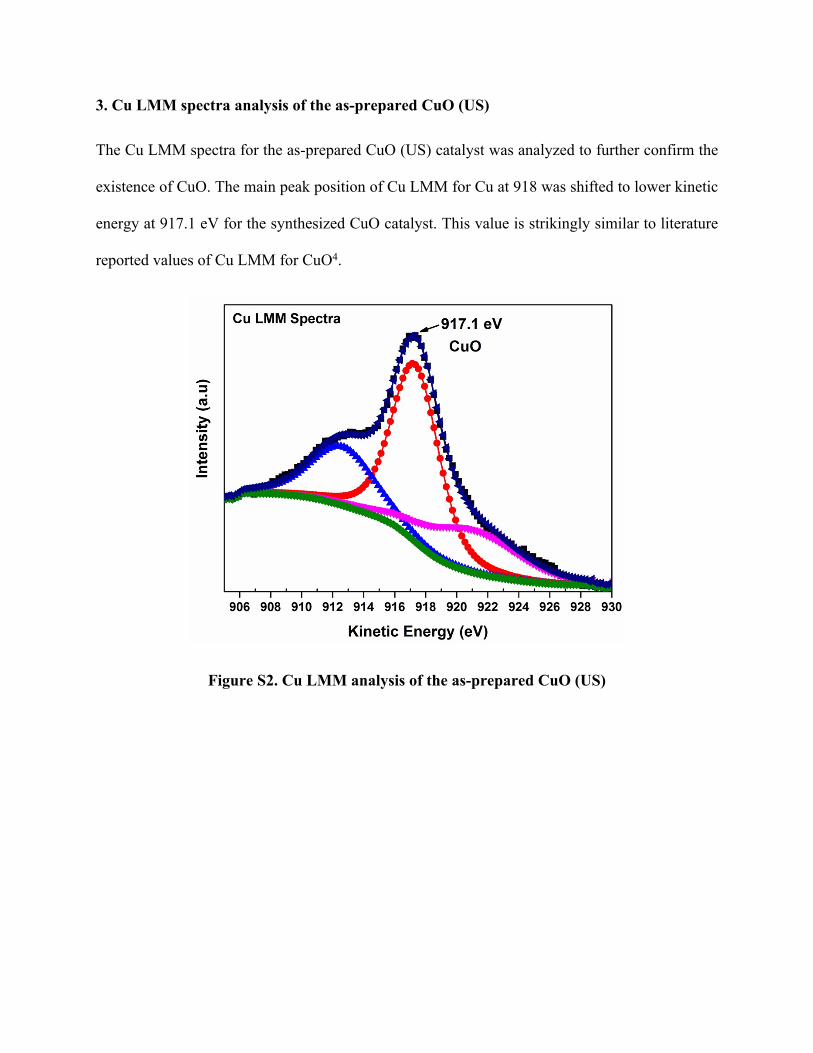
3. Cu LMM spectra analysis of the as-prepared CuO (US)
The Cu LMM spectra for the as-prepared CuO (US) catalyst was analyzed to further confirm the
existence of CuO. The main peak position of Cu LMM for Cu at 918 was shifted to lower kinetic
energy at 917.1 eV for the synthesized CuO catalyst. This value is strikingly similar to literature
reported values of Cu LMM for CuO4.
Figure S2. Cu LMM analysis of the as-prepared CuO (US)

4. XRD analysis of recovered CuO catalysts
XRD analysis was performed on samples recovered after the oxidation of glycerol in the absence
of H2O2. The analysis results revealed a complete reduction of CuO to Cu2O and Cu, indicating
that in the absence of H2O2, lattice oxygen of CuO catalyst is consumed in the oxidation of
glycerol. The XRD is shown in Figure S3.
Figure S3. XRD analysis of recovered catalysts in the H2O2-free oxidation of glycerol
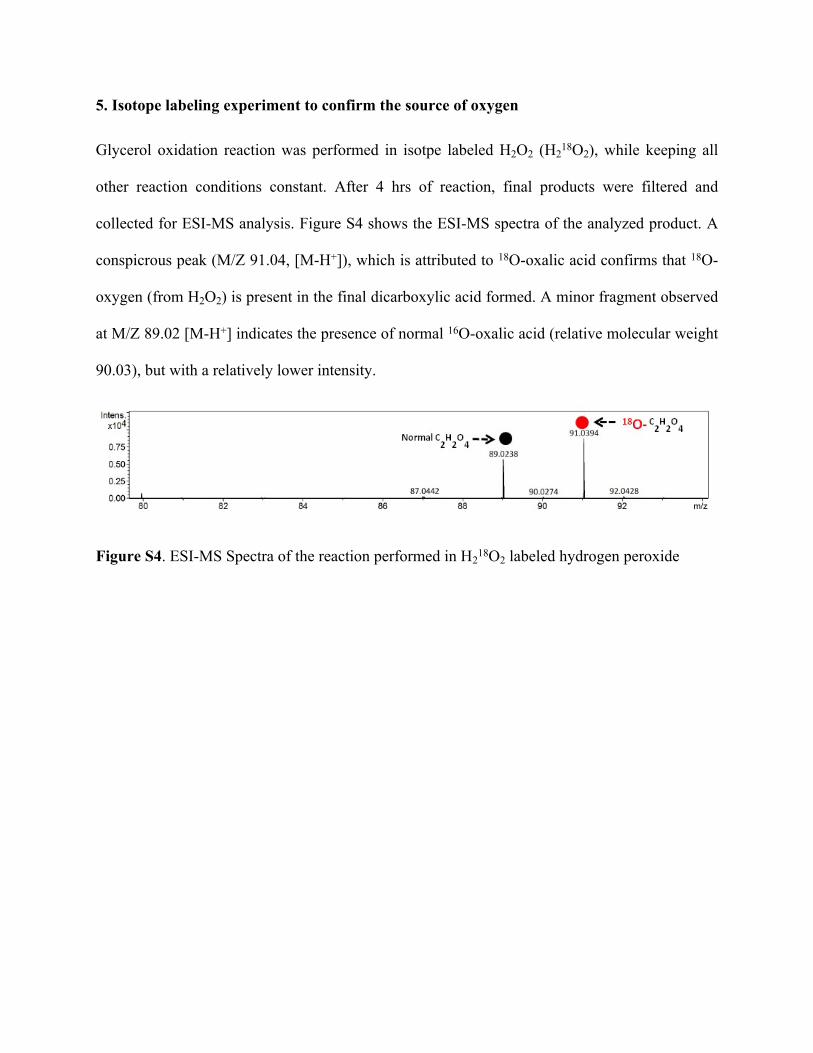
5. Isotope labeling experiment to confirm the source of oxygen
Glycerol oxidation reaction was performed in isotpe labeled H2O2 (H218O2), while keeping all
other reaction conditions constant. After 4 hrs of reaction, final products were filtered and
collected for ESI-MS analysis. Figure S4 shows the ESI-MS spectra of the analyzed product. A
conspicrous peak (M/Z 91.04, [M-H+]), which is attributed to 18O-oxalic acid confirms that 18O-
oxygen (from H2O2) is present in the final dicarboxylic acid formed. A minor fragment observed
at M/Z 89.02 [M-H+] indicates the presence of normal 16O-oxalic acid (relative molecular weight
90.03), but with a relatively lower intensity.
Figure S4. ESI-MS Spectra of the reaction performed in H218O2 labeled hydrogen peroxide
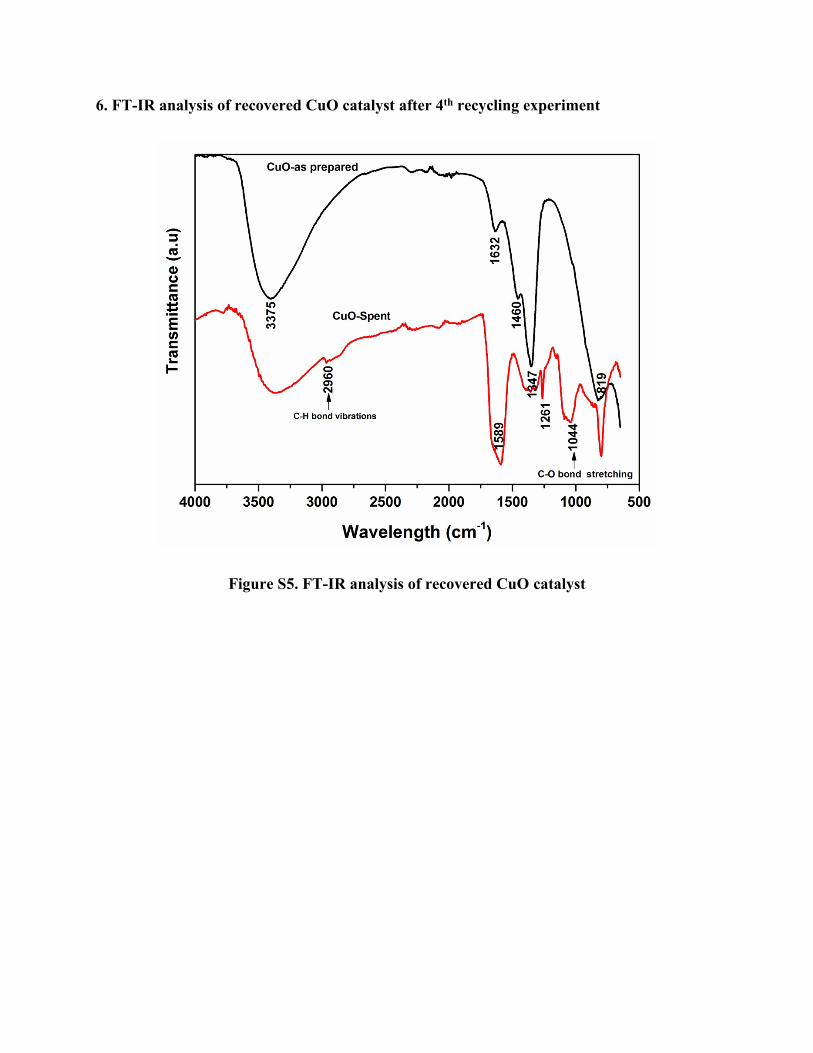
6. FT-IR analysis of recovered CuO catalyst after 4th recycling experiment
Figure S5. FT-IR analysis of recovered CuO catalyst

6. XRD analysis of recovered CuO (CM) and CuO (US) catalyst after 1st recycling
experiment
XRD analysis of the recovered samples after the 1st recycling experiment revealed a mixture of
Cu species in the form of Cu2O, CuO and Cu.
Figure S6a. XRD analysis of recovered CuO catalyst
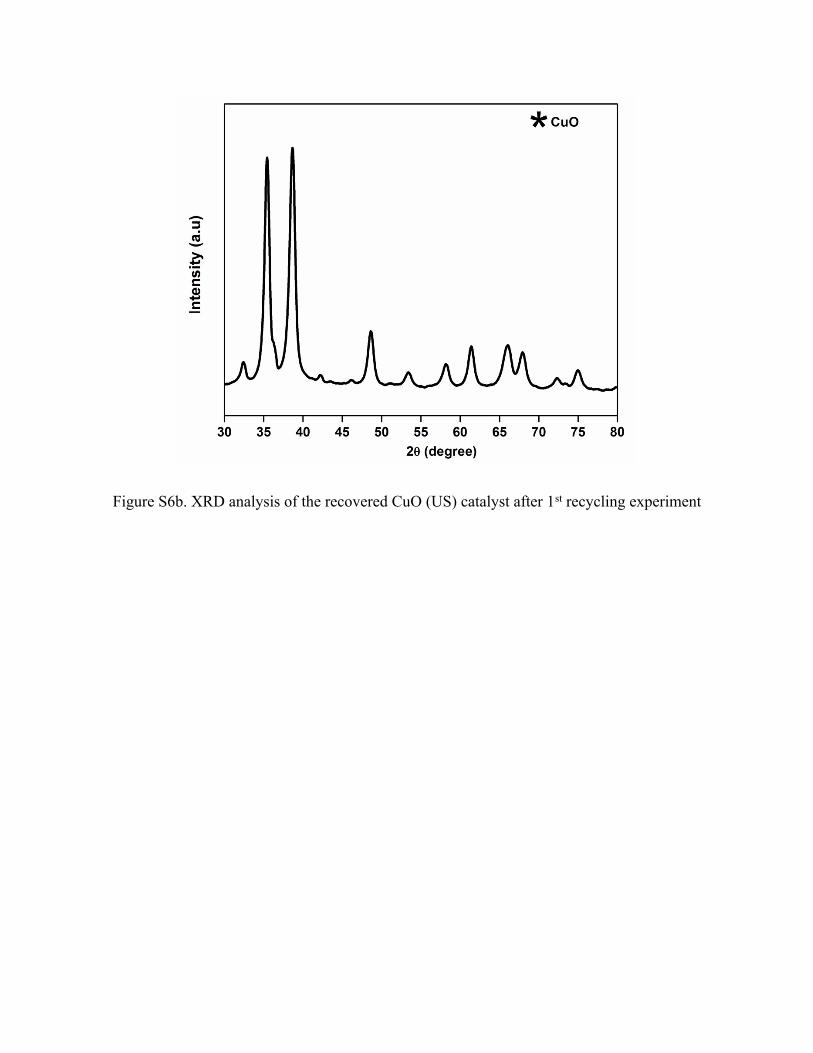
Figure S6b. XRD analysis of the recovered CuO (US) catalyst after 1st recycling experiment
7. Optimization of CuO-catalyzed oxidation of Glycerol
Initial catalytic experiments focused on the optimization of the reaction conditions. To this end,
several reaction parameters were investigated such as reaction temperature, glycerol/H2O2 molar
ratio and catalyst loading, the amounts of catalyst loading and the amount of oxidant on the yield
of OXA and TAR were studied. The oxidative conversion of glycerol was first carried out over a
range of temperatures (30-100 oC) as seen in Figure S7. As expected, a positive effect on the
glycerol conversion was observed with an increase in temperature. More precisely, a sharp
increase in conversion from 30 to 50 % was observed when the temperature was raised from 30
to 40 oC, respectively. A complete conversion (100 %) was achieved at 100 °C. The temperature
profile investigations revealed that, once TAR was formed, it was relatively stable and does not
undergo any significant degradation or oxidative decomposition. Conversely, the yield to OXA
was observed to be ~ 9 % at 40 oC, which increased significantly with temperature and reached a
maximum of 56 % at 80 oC. However, a sudden decreased in the yield to OXA was observed
when the temperature was further increase from 80 to 100 oC (yield of 35 %). Hence, an
optimum reaction temperature of 80 oC, based on the maximum yield to OXA and TAR was
adopted throughout the investigation.

Figure S7. Effect of reaction temperature. Reaction conditions: 0.050g of CuO NLs, 0.100 g of
glycerol, 2 eq. H2O2, 2 mL of H2O, 4 h reaction time
More interestingly, we observed that of glyceric acid (yield 10 %) was formed in the presence of
CuO catalyst without the addition of H2O2 (Figure S8). This can be explained by the fact that,
reactions involving CuO and water can results in the formation of OH species via the cleavage of
water molecules on the surfaces of CuO,2 which in our experimental conditions could lead to the
oxidation of glycerol. Note that formation of glyceric acid was not observed without CuO,
further supporting this claim. A maximum yield to OXA and TAR of 56 and 22 %, respectively
was observed at a glycerol/H2O2 molar ratio of 0.5. When the glycerol/H2O2 molar ratio was
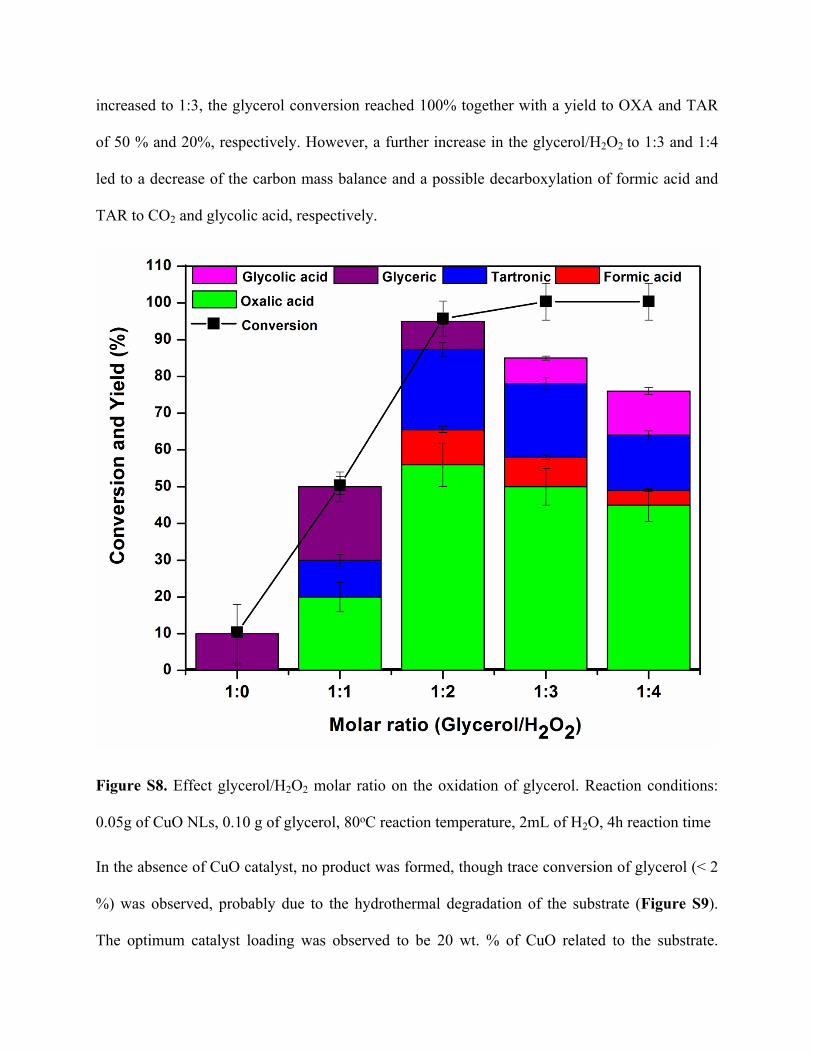
increased to 1:3, the glycerol conversion reached 100% together with a yield to OXA and TAR
of 50 % and 20%, respectively. However, a further increase in the glycerol/H2O2 to 1:3 and 1:4
led to a decrease of the carbon mass balance and a possible decarboxylation of formic acid and
TAR to CO2 and glycolic acid, respectively.
Figure S8. Effect glycerol/H2O2 molar ratio on the oxidation of glycerol. Reaction conditions:
0.05g of CuO NLs, 0.10 g of glycerol, 80oC reaction temperature, 2mL of H2O, 4h reaction time
In the absence of CuO catalyst, no product was formed, though trace conversion of glycerol (< 2
%) was observed, probably due to the hydrothermal degradation of the substrate (Figure S9).
The optimum catalyst loading was observed to be 20 wt. % of CuO related to the substrate.

Indeed, when higher amounts of catalyst were used in the reaction, a conversion increase was
observed and quickly reaches a maximum (100 %) from 10 wt. % (60 % conversion) to 100 wt. %
(100 % conversion). On the contrary, the yield towards OXA and TAR increased at 10 wt. % (22
and 10 %, respectively) to 20 wt. % (56 and 22 %, respectively), and further suffer from
oxidative decomposition upon CuO amount increment in the reaction media.
Figure S9. Effect of catalyst loading on the oxidation glycerol. Reaction conditions: 0.100 g of
glycerol, 80 oC reaction temperature, 2 mL of H2O, 4 h reaction time

Table S1. Comparison of the present work with the state of the art
ResultsSelectivity (%)Catalyst Glycerol
conversion (%) TAR OXAConditions Ref.
CuO (Ultrasound synthesized)
95.5 23 59Glycerol (0.100g), 2
eq.H2O2, 80 °C, 4h, H2O (2 mL)
This Work
Cr(SO3-salen)-CuMgAl-LDH 85.5 2.5 2.4
Glycerol (50mL);3% H2O2 (30mL);0.2g Catalyst, 60
oC, 6 h3
Cr(SO3-salen)-MnMgAl-LDH 41.5 11.5 0
Glycerol (50mL);3% H2O2 (30mL);0.2g Catalyst, 60
oC, 6 h3
[Mn(SO3-salphen)]- LDH 29.4 7.0 50.8
Glycerol (25mL);3% H2O2 (25mL);0.2g Catalyst, 60
oC, 4 h4
Pt100-starch/HT 88 13 12Glycerol (0.5mmol) H2O
(2 mL); O2 flow (10 mLmin-
1) 25 oC, 6h5
AuPd/TiO2 +FeCl3
49 0 0.8Glycerol/Au-Pd mole ratio (2500), 160 oC, 6h, O2 (1
MPa)6
Co0.15/Mg3Al-s 100 63.5 24 0.5g Glycerol, 1.5g NaOH, 0.2g Catalyst, 70 oC, 24 h 7
AuPt/MgO 30 1 6 0.3M Glycerol, O2 (3 atm), 80 oC 8
Au-Pd-Pt/TiO2 100 14.8 2.2 Glycerol:NaOH =2:1, 60 oC, 4 h 9
2Au/CuO 16.4 0 4.6 0.1M Glycerol (20mL); O2 (10 bar), 60 oC, 2 h 10
1Au/NiO 10.5 0 3.7 0.1M Glycerol (20mL); O2 (10 bar), 60 oC, pH=6.7 10
1Au/NiO 19.6 30.6 5.0 0.1M Glycerol (20mL); O2 (10 bar), 60 oC, pH=13.8 10
1Au/TiO2 34.2 11.5 1.6 0.1M Glycerol (20mL); O2 (10 bar), 60 oC, pH=13.8 10
8. Computational Methods
All the spin-polarized DFT calculations were done using the Vienna ab-initio simulation
program (VASP).5 Plane-wave basis set with a cut-off kinetic energy of 450 eV, the projector-
augmented wave (PAW)6 and the Perdew-Burke-Ernzerhof (PBE) functional7 were utilized for
those simulations. To correct the strong correlation and localization of 3d electrons of Cu in CuO
structure, the Hubbard term in the form of GGA+U with Ueff = 7.0 ev was applied within the
Dudarev’s approach.8 This correction described well the bulk properties (lattice parameters, band
gap value and magnetic moment) of CuO and was successfully applied to simulate the activation
of glucose and methane on CuO surfaces.2, 9 In this study, CuO was modeled as periodic four-
layer (4×2) slabs and a 20 Å vacuum thickness above the top layer was used to prevent
interaction between repeated unit cells. Two top layers and the adsorbates were allowed to fully
relax while the bottom two layers were fixed at the optimized bulk lattice parameters to reduce
the computational cost without influencing the accuracy of simulations. Magnetic moment in the
bulk-ordering is applied for CuO(111) surface since it was found to result in the most stable
structure as reported by Mishra et al.10 The 3×3×1 Monkhorst-Pack grid was used to sample the
Brillouin zone, and the tetrahedron method with Blöchl corrections was employed for all
calculations. Transition states were searched using the Nudged Elastic Band (NEB) method, and
subsequently confirmed with the frequency calculations. To get the free energies of the process,
the entropy, zero-point energy and enthalpy correction were computed from statistical
thermodynamics for all adsorbed structures, while those values for gas-phase molecules were
taken from the standard thermodynamics NIST-JANAF table.11

9. Adsorption of Glycerol on CuO(111) surface.
To evaluate the adsorption configuration of glycerol at different coverages, two scenarios were
considered: the first corresponds to the configuration when only one glycerol molecule is
adsorbed on CuO surface (called Scenario 1, representing low coverage), and the second
corresponds to the configuration when two glycerol molecules are placed close to each other
(called Scenario 2, to illustrate high coverages).
9.1. Scenario 1 – Adsorption at low coverage.
At low coverages, glycerol could adsorb on CuO surface via 4 different configurations: 1) bound
to surface via its single primary OH (terminal OH) (Figure S10A), 2) bound to surface via its
single secondary OH (Fig.S10B), 3) bound to surface via both primary and secondary OHs
(Fig.S10C) and 4) bound to surface via both the primary OHs (terminal OH) (Fig.S7D). The
stability is in the order B < A < C < D. In the most stable adsorption configuration (Fig.S7D), the
adsorption energy is -104 kJ/mol.
Figure S10. Adsorption configurations of glycerol on CuO(111) surface at low coverages. A)
glycerol bound to CuO surface via its single primary OH; B) glycerol bound to CuO surface via
its single secondary OH ; C) glycerol bound to CuO surface via one primary and one secondary
OH; D) glycerol bound to CuO surface via both primary OHs.
9.2. Scenario 2 – Adsorption at high coverages.
To make the comparison more convenient, both, the average binding energy Eadsavg and the
differential binding energy Eadsdiff, are computed and the adsorption structure of glycerol at high
coverages is presented in Figure S8. Only configurations in Figs. S10A and S10D are evaluated
here (other configurations are even less stable at higher coverages due to the geometrical
constraint). At higher coverages, adsorption configuration of glycerol in Fig. S10D is not the
most stable configuration anymore. Due to the geometrical constraint, the energy gain Eadsdiff for
adding one more molecule of glycerol next to the existing one in the configuration in Fig. S10D
(coordination via both primary OHs ) is only -32 kJ/mol and the average binding energy Eadsavg is
reduced from -104 kJ/mol (Fig.S10D) to only -67 kJ/mol (Fig.S11A). On the contrary, adding
one more molecule of glycerol next to the existing one in configuration in Fig. S10A
(coordination via only one primary OH) is much more preferred with the differential binding
energy Eadsdiff of -99 kJ/mol (Fig.S11B) due to the inter H-bonding stabilization between adjacent
glycerol molecules, making it the most stable configuration with the average binding energy
Eadsavg of -81 kJ/mol. Therefore, we choose the adsorption configuration of glycerol on
CuO(111) surface where it coordinates to CuO surface via only one primary OH group
(configuration S10A) to build the reaction energy for glycerol oxidation to glyceric acid in
Figure 5 of the main text. This configuration is also widely used for DFT simulations on glycerol
oxidation over transition metals surface in the literature.2, 12 It is worth mentioning that even
using the adsorption configuration in Fig. S10D (coordination via both two primary OHs), the
activation barriers for the initial primary OH activation (43 kJ/mol, Fig. S9a) and subsequent CH
activation (59 kJ/mol, Fig.S12b) are almost identical to the barriers using adsorption
configuration in Fig. S10A (49 kJ/mol and 63 kJ/mol for the initial OH and subsequent CH
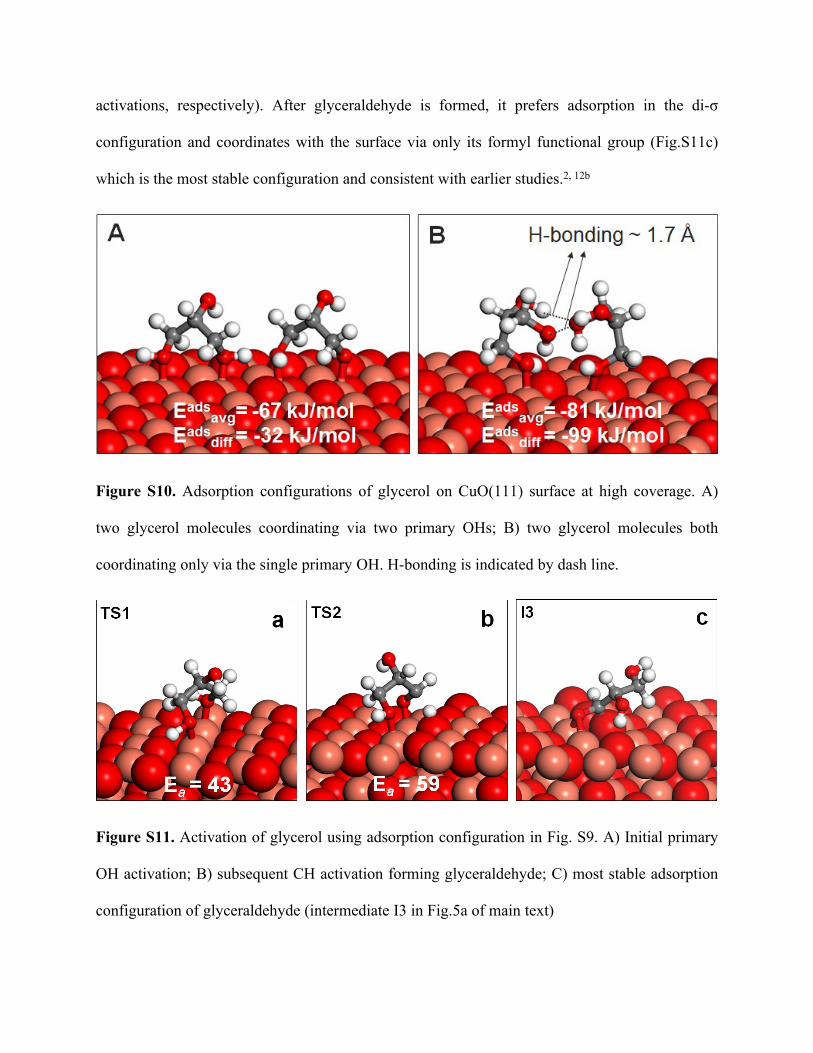
activations, respectively). After glyceraldehyde is formed, it prefers adsorption in the di-σ
configuration and coordinates with the surface via only its formyl functional group (Fig.S11c)
which is the most stable configuration and consistent with earlier studies.2, 12b
Figure S10. Adsorption configurations of glycerol on CuO(111) surface at high coverage. A)
two glycerol molecules coordinating via two primary OHs; B) two glycerol molecules both
coordinating only via the single primary OH. H-bonding is indicated by dash line.
Figure S11. Activation of glycerol using adsorption configuration in Fig. S9. A) Initial primary
OH activation; B) subsequent CH activation forming glyceraldehyde; C) most stable adsorption
configuration of glyceraldehyde (intermediate I3 in Fig.5a of main text)
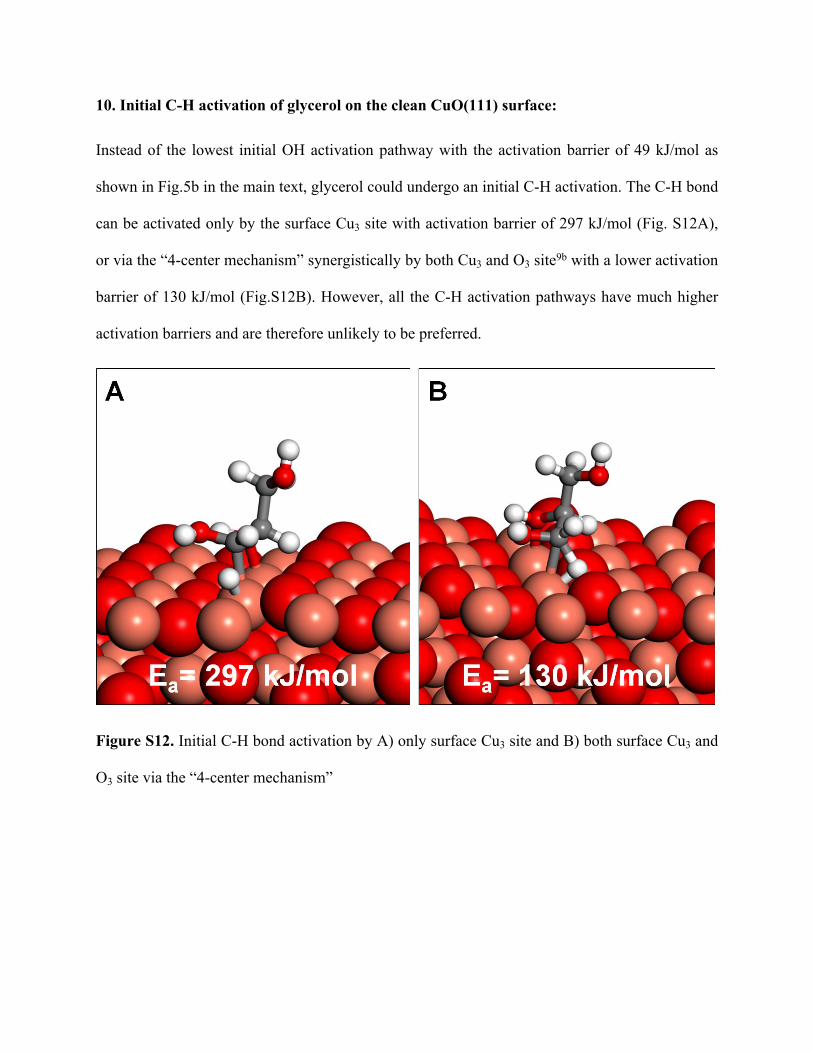
10. Initial C-H activation of glycerol on the clean CuO(111) surface:
Instead of the lowest initial OH activation pathway with the activation barrier of 49 kJ/mol as
shown in Fig.5b in the main text, glycerol could undergo an initial C-H activation. The C-H bond
can be activated only by the surface Cu3 site with activation barrier of 297 kJ/mol (Fig. S12A),
or via the “4-center mechanism” synergistically by both Cu3 and O3 site9b with a lower activation
barrier of 130 kJ/mol (Fig.S12B). However, all the C-H activation pathways have much higher
activation barriers and are therefore unlikely to be preferred.
Figure S12. Initial C-H bond activation by A) only surface Cu3 site and B) both surface Cu3 and
O3 site via the “4-center mechanism”
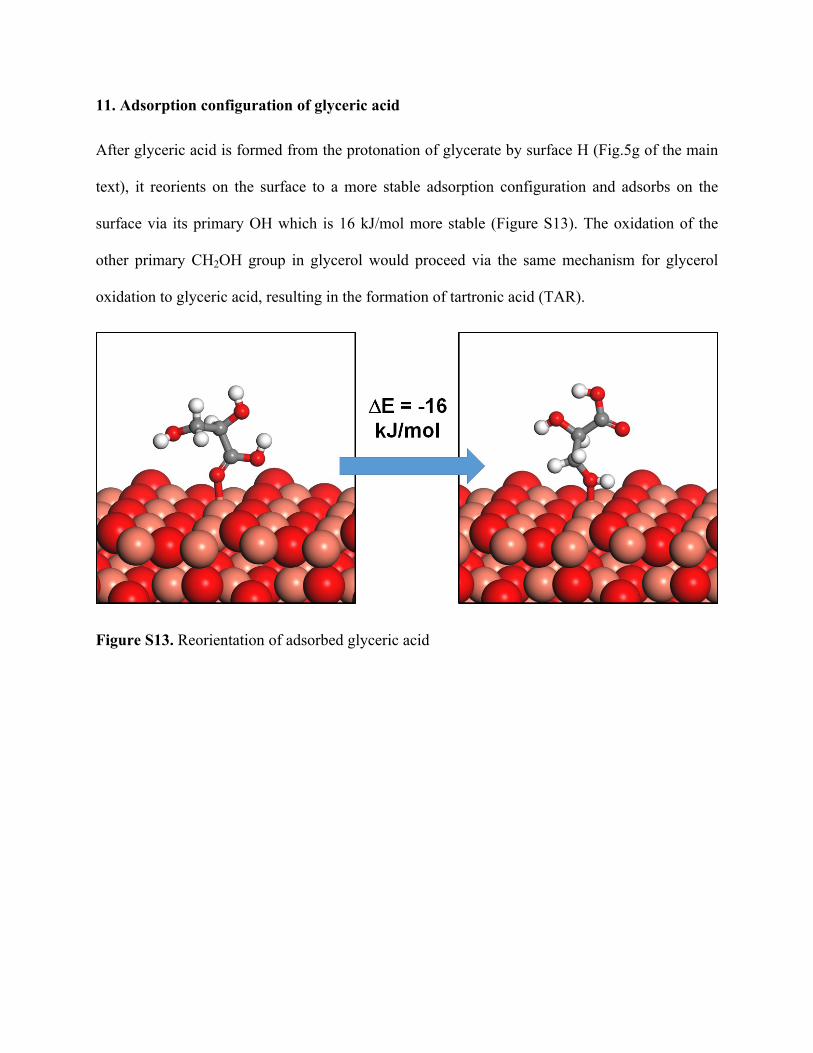
11. Adsorption configuration of glyceric acid
After glyceric acid is formed from the protonation of glycerate by surface H (Fig.5g of the main
text), it reorients on the surface to a more stable adsorption configuration and adsorbs on the
surface via its primary OH which is 16 kJ/mol more stable (Figure S13). The oxidation of the
other primary CH2OH group in glycerol would proceed via the same mechanism for glycerol
oxidation to glyceric acid, resulting in the formation of tartronic acid (TAR).
Figure S13. Reorientation of adsorbed glyceric acid
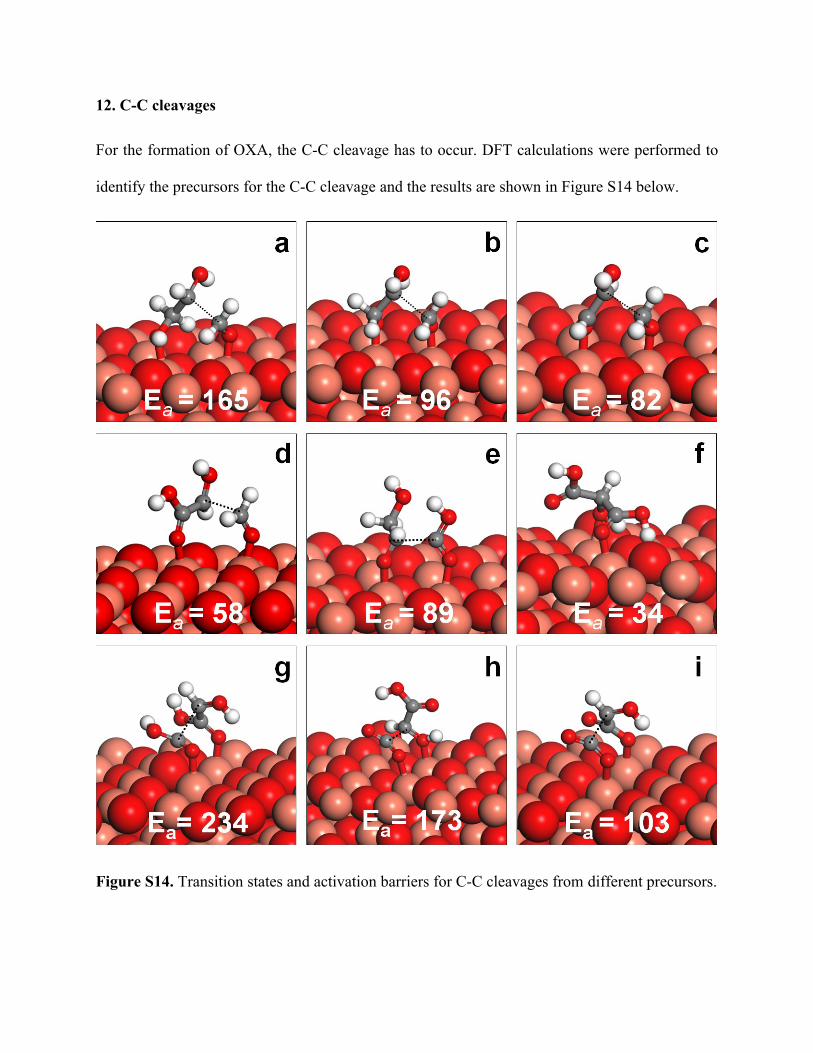
12. C-C cleavages
For the formation of OXA, the C-C cleavage has to occur. DFT calculations were performed to
identify the precursors for the C-C cleavage and the results are shown in Figure S14 below.
Figure S14. Transition states and activation barriers for C-C cleavages from different precursors.
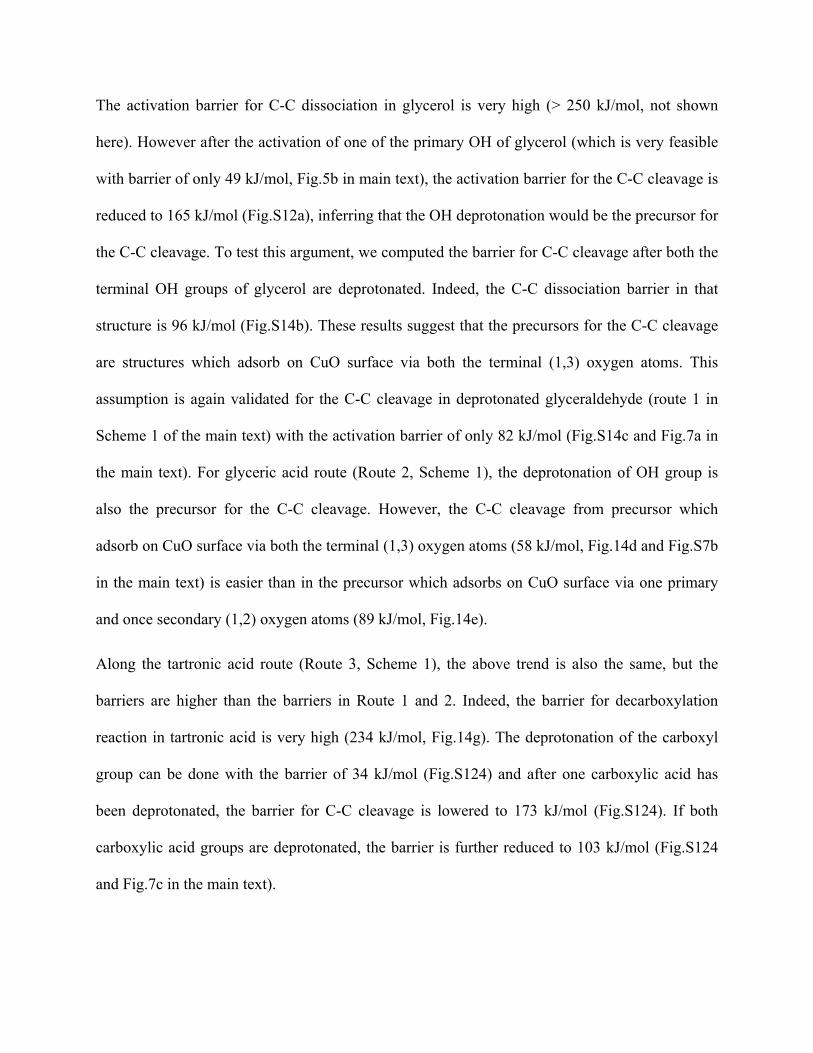
The activation barrier for C-C dissociation in glycerol is very high (> 250 kJ/mol, not shown
here). However after the activation of one of the primary OH of glycerol (which is very feasible
with barrier of only 49 kJ/mol, Fig.5b in main text), the activation barrier for the C-C cleavage is
reduced to 165 kJ/mol (Fig.S12a), inferring that the OH deprotonation would be the precursor for
the C-C cleavage. To test this argument, we computed the barrier for C-C cleavage after both the
terminal OH groups of glycerol are deprotonated. Indeed, the C-C dissociation barrier in that
structure is 96 kJ/mol (Fig.S14b). These results suggest that the precursors for the C-C cleavage
are structures which adsorb on CuO surface via both the terminal (1,3) oxygen atoms. This
assumption is again validated for the C-C cleavage in deprotonated glyceraldehyde (route 1 in
Scheme 1 of the main text) with the activation barrier of only 82 kJ/mol (Fig.S14c and Fig.7a in
the main text). For glyceric acid route (Route 2, Scheme 1), the deprotonation of OH group is
also the precursor for the C-C cleavage. However, the C-C cleavage from precursor which
adsorb on CuO surface via both the terminal (1,3) oxygen atoms (58 kJ/mol, Fig.14d and Fig.S7b
in the main text) is easier than in the precursor which adsorbs on CuO surface via one primary
and once secondary (1,2) oxygen atoms (89 kJ/mol, Fig.14e).
Along the tartronic acid route (Route 3, Scheme 1), the above trend is also the same, but the
barriers are higher than the barriers in Route 1 and 2. Indeed, the barrier for decarboxylation
reaction in tartronic acid is very high (234 kJ/mol, Fig.14g). The deprotonation of the carboxyl
group can be done with the barrier of 34 kJ/mol (Fig.S124) and after one carboxylic acid has
been deprotonated, the barrier for C-C cleavage is lowered to 173 kJ/mol (Fig.S124). If both
carboxylic acid groups are deprotonated, the barrier is further reduced to 103 kJ/mol (Fig.S124
and Fig.7c in the main text).
13. The formation of adsorbed OH on CuO(111) surface and reaction between surface OH
with H atom to regenerate the blocked surface lattice O3 active site
In the presence of H2O2, surface OH could be formed on the CuO surface and adsorbs on the
bridge site between two adjacent Cu3 sites (Figure S15a) via the reaction:
H2O2 + * 2OH* (1)
We have calculated the Gibbs free energy G of reaction (1) at reaction conditions (T=80oC) via
the equation: G = E + Hcorrection + ZPE - TS
whereas E is the DFT computed electronic energy, thermodynamic properties including entropy
(S), enthalpy correction (Hcorrection), zero point energy (ZPE) of different adsorbed configurations
were calculated from statistical thermodynamics for clean surface (*) and adsorbed OH (OH*)
and were obtained from the standard thermodynamics NIST-JANAF table and corrected at
specified reaction temperatures for gas phase H2O2.
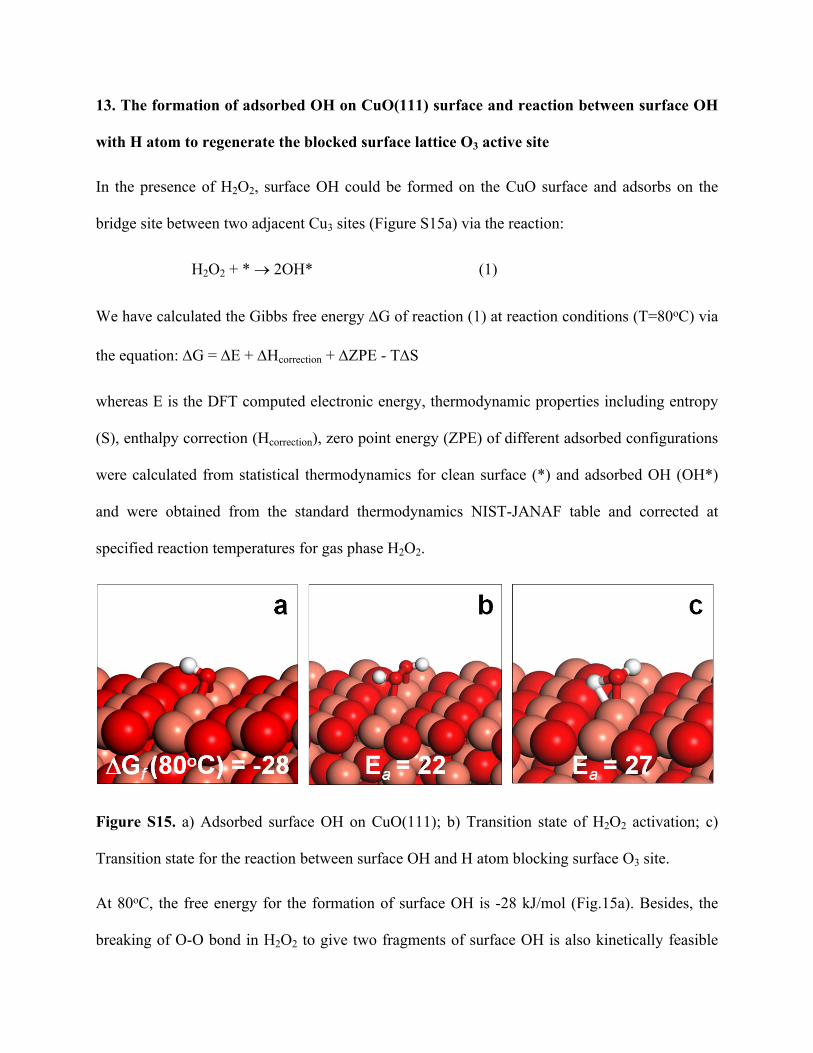
Figure S15. a) Adsorbed surface OH on CuO(111); b) Transition state of H2O2 activation; c)
Transition state for the reaction between surface OH and H atom blocking surface O3 site.
At 80oC, the free energy for the formation of surface OH is -28 kJ/mol (Fig.15a). Besides, the
breaking of O-O bond in H2O2 to give two fragments of surface OH is also kinetically feasible
with the barrier of 22 kJ/mol only (Fig.15b). Therefore, the formation of surface OH species is
both thermodynamically and kinetically favorable. As was mentioned in the main text, during the
reaction, H atoms that are strongly bound on the active O3 site will block those sites and reduce
the activity of CuO. Surface OH can react with that H atom occupying the active surface O3 site
easily with the barrier of 27 kJ/mol (Fig.15c) via the reaction: OH* + H* H2O* + *. Due to
this role of surface OH, the active O3 site is regenerated and contribute into the high conversion
of glycerol, as was observed experimentally in the main text.
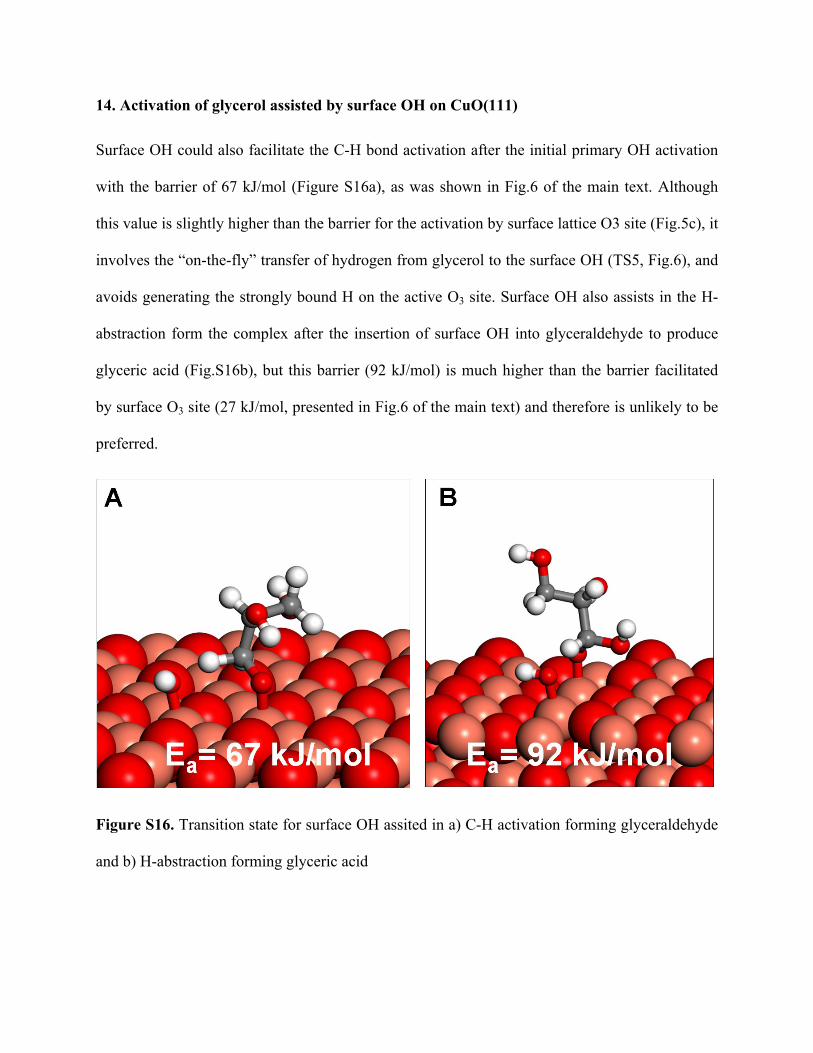
14. Activation of glycerol assisted by surface OH on CuO(111)
Surface OH could also facilitate the C-H bond activation after the initial primary OH activation
with the barrier of 67 kJ/mol (Figure S16a), as was shown in Fig.6 of the main text. Although
this value is slightly higher than the barrier for the activation by surface lattice O3 site (Fig.5c), it
involves the “on-the-fly” transfer of hydrogen from glycerol to the surface OH (TS5, Fig.6), and
avoids generating the strongly bound H on the active O3 site. Surface OH also assists in the H-
abstraction form the complex after the insertion of surface OH into glyceraldehyde to produce
glyceric acid (Fig.S16b), but this barrier (92 kJ/mol) is much higher than the barrier facilitated
by surface O3 site (27 kJ/mol, presented in Fig.6 of the main text) and therefore is unlikely to be
preferred.
Figure S16. Transition state for surface OH assited in a) C-H activation forming glyceraldehyde
and b) H-abstraction forming glyceric acid

15. Compensation of CuO(111) surface by H2O2
During the reaction, the lattice Oxygen could be consumed by incorporating itself into the acids
generated during the oxidation reaction. This results in the reduction of CuO. The presence of
H2O2 could provide oxygen to compensate the oxygen vacancies created on the partially reduced
CuO (called CunOn-1) to convert it either to Hydrogenated CuO (with H atom adorbs on the
surface, called CunOn-H) or the original CuO (called CunOn) via the reaction:
CunOn-1 + 0.5H2O2 CunOn—H (2)
CunOn-1 + H2O2 CunOn + H2O (3)
The structures are illustrated in Figure S17. The Gibbs free energy for reactions (2) and (3) are
computed at T=80oC (reaction temperature) in a same procedure as was described in Section 11
of the Supporting Information. The results and discussion are presented in the main text.
Figure S17. The refill of consumed lattice oxygen on CuO by H2O2
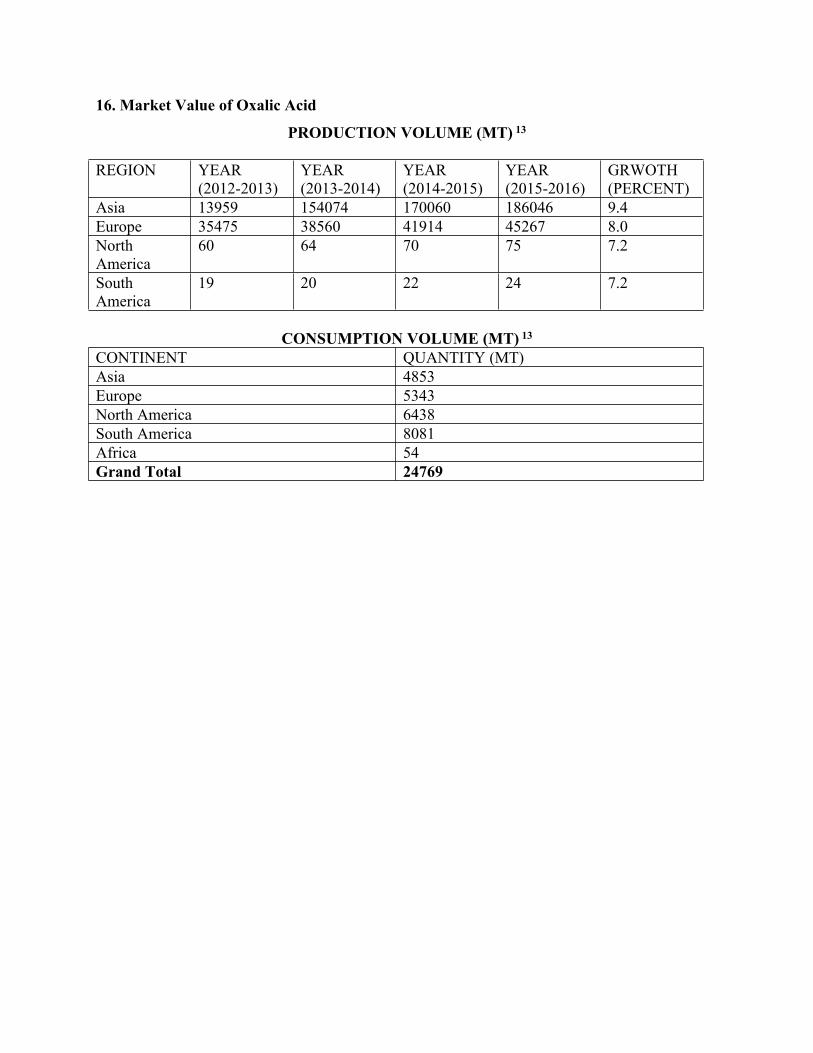
16. Market Value of Oxalic Acid
PRODUCTION VOLUME (MT) 13
REGION YEAR (2012-2013)
YEAR (2013-2014)
YEAR (2014-2015)
YEAR (2015-2016)
GRWOTH (PERCENT)
Asia 13959 154074 170060 186046 9.4Europe 35475 38560 41914 45267 8.0North America
60 64 70 75 7.2
South America
19 20 22 24 7.2
CONSUMPTION VOLUME (MT) 13
CONTINENT QUANTITY (MT)Asia 4853Europe 5343North America 6438South America 8081Africa 54Grand Total 24769
REFRENCES
1. Koda, S.; Kimura, T.; Kondo, T.; Mitome, H., A standard method to calibrate
sonochemical efficiency of an individual reaction system. Ultrasonics sonochemistry 2003, 10
(3), 149-156.
2. Amaniampong, P. N.; Trinh, Q. T.; Wang, B.; Borgna, A.; Yang, Y.; Mushrif, S. H.,
Biomass Oxidation: Formyl CH Bond Activation by the Surface Lattice Oxygen of
Regenerative CuO Nanoleaves. Angewandte Chemie International Edition 2015, 54 (31), 8928-
8933.
3. Amaniampong, P. N.; Trinh, Q. T.; Li, K.; Mushrif, S. H.; Hao, Y.; Yang, Y., Porous
structured CuO-CeO2 nanospheres for the direct oxidation of cellobiose and glucose to gluconic
acid. Catalysis Today 2017.
4. Tahir, D.; Tougaard, S., Electronic and optical properties of Cu, CuO and Cu2O studied
by electron spectroscopy. Journal of Physics: Condensed Matter 2012, 24 (17), 175002.
5. (a) Kresse, G.; Furthmüller, J., Efficiency of ab-initio total energy calculations for metals
and semiconductors using a plane-wave basis set. Computational Materials Science 1996, 6 (1),
15-50; (b) Kresse, G.; Hafner, J., Ab initio molecular dynamics for liquid metals. Physical
Review B 1993, 47 (1), 558-561.
6. Blöchl, P. E., Projector augmented-wave method. Physical Review B 1994, 50 (24),
17953-17979.
7. Perdew, J. P.; Burke, K.; Ernzerhof, M., Generalized Gradient Approximation Made
Simple. Physical Review Letters 1996, 77 (18), 3865-3868.
8. Dudarev, S. L.; Botton, G. A.; Savrasov, S. Y.; Humphreys, C. J.; Sutton, A. P., Electron-
energy-loss spectra and the structural stability of nickel oxide: An LSDA+U study. Physical
Review B 1998, 57 (3), 1505-1509.
9. (a) Singuru, R.; Trinh, Q. T.; Banerjee, B.; Govinda Rao, B.; Bai, L.; Bhaumik, A.;
Reddy, B. M.; Hirao, H.; Mondal, J., Integrated Experimental and Theoretical Study of Shape-
Controlled Catalytic Oxidative Coupling of Aromatic Amines over CuO Nanostructures. ACS
Omega 2016, 1 (6), 1121-1138; (b) Varghese, J. J.; Trinh, Q. T.; Mushrif, S. H., Insights into the
synergistic role of metal-lattice oxygen site pairs in four-centered C-H bond activation of
methane: the case of CuO. Catalysis Science & Technology 2016, 6 (11), 3984-3996.
10. Mishra, A. K.; Roldan, A.; de Leeuw, N. H., CuO Surfaces and CO2 Activation: A
Dispersion-Corrected DFT+U Study. The Journal of Physical Chemistry C 2016, 120 (4), 2198-
2214.
11. (a) Trinh, Q. T.; Banerjee, A.; Yang, Y.; Mushrif, S. H., Sub-Surface Boron-Doped
Copper for Methane Activation and Coupling: First-Principles Investigation of the Structure,
Activity, and Selectivity of the Catalyst. The Journal of Physical Chemistry C 2017, 121 (2),
1099-1112; (b) Trinh, Q. T.; Nguyen, A. V.; Huynh, D. C.; Pham, T. H.; Mushrif, S. H.,
Mechanistic insights into the catalytic elimination of tar and the promotional effect of boron on
it: first-principles study using toluene as a model compound. Catalysis Science & Technology
2016, 6 (15), 5871-5883; (c) Trinh, Q. T.; Yang, J.; Lee, J. Y.; Saeys, M., Computational and
experimental study of the Volcano behavior of the oxygen reduction activity of PdM@PdPt/C
(M=Pt, Ni, Co, Fe, and Cr) core–shell electrocatalysts. Journal of Catalysis 2012, 291, 26-35.
12. (a) Trinh, Q. T.; Chethana, B. K.; Mushrif, S. H., Adsorption and Reactivity of Cellulosic
Aldoses on Transition Metals. The Journal of Physical Chemistry C 2015, 119 (30), 17137-
17145; (b) Zope, B. N.; Hibbitts, D. D.; Neurock, M.; Davis, R. J., Reactivity of the Gold/Water
Interface During Selective Oxidation Catalysis. Science 2010, 330 (6000), 74-78.
13. Lifescience Intellipedia, Market Research Report on Oxalic acid (accessed on 25 September 2017) http://www.lifescienceintellipedia.com
Recommended