ISBN 978-1-933286-68-6
Supporting Private Business Growth in African Fragile StatesA Guiding Framework for the World Bank Group in South Sudan and Other Nations
Benjamin Leo, Vijaya Ramachandran, and Ross Thuotte
Cente
r for G
lobal D
eve
lopm
ent
Sup
portin
g Private B
usiness G
rowth
in A
frican Fragile S
tates Leo, R
amachan
dran, and Thuotte
CG
D

For an electronic version of this report, visit www.cgdev.org.
Cente
r for G
lobal D
eve
lopm
ent
Supporting Private Business Growth in African Fragile StatesA Guiding Framework for the World Bank Group in South Sudan and Other Nations
Benjamin Leo, Vijaya Ramachandran, and Ross Thuotte
Copyright © 2012 by the Center for Global Development
ISBN 978-1-933286-68-6
Cover photo: United Nations Environment Programme.
Editing, design, and production by Communications Development Incorporated, Washington, D.C., and Peter Grundy Art & Design, London.
The Center for Global Development is grateful for contributions from the Royal Danish Embassy in support of this work.
About the authorsBenjamin Leo is a former Research Fellow at the Center for Global Development and is currently Global Policy Director at the ONE Campaign. Vijaya Ramachandran is a Senior Fellow at the Center for Global Development. Ross Thuotte is a Research Assistant at the Center for Global Development.
The authors would like thank the Government of Denmark for generous financial support. We are also grateful to James Emery for his detailed reading of several drafts and his comments on our interpretation of the IFC data. In addition, Alan Gelb, Alvaro Gonzalez, Charles Kenny, Todd Moss, and Gaiv Tata provided extensive comments on various drafts of this report, and we would like to thank them for their efforts. John Osterman was of great help in guiding this manuscript through to publication, and Julie Walz provided excellent research assistance. The authors are solely responsible for any errors in fact or judgment.
iv
Preface viiiAcronyms ix
Executive summary xi
Chapter 1 Overview 1Definition of fragile states 1Notes 3
Chapter 2 Private sector development in fragile states 4PSD in Africa 4PSD in fragile states 4Rationale for public sector support of the private sector 5Existing multilateral efforts — the World Bank Group 5Promoting business growth — policy goals in fragile states 7PSD policy design in fragile states 8Notes 9
Chapter 3 Constraints to business growth in African fragile states 11World Bank Doing Business Reports 11World Bank Enterprise Surveys 12World Bank Group alignment with business constraints 13Conclusion 18Notes 19
Chapter 4 Government priorities in fragile states 21Methodology 21Country government priorities 21Economic sector priorities 22World Bank Group alignment with government priorities 22Conclusion 24Notes 25
Chapter 5 What works — proven PSD successes in fragile environments 27IDA alignment with what works 27IFC alignment with what works 30Notes 32
Table of contents
vTab
le of conten
ts
Chapter 6 Country case study — South Sudan 34Contextual overview 34Private sector overview 34Major business constraints 35Government priorities 38Existing donor programs 40Conclusion 42Notes 42
Chapter 7 Conclusion 44Moving forward 44Note 45
Appendix 1 IFC investments in African fragile state sample, 2000–11 46
Appendix 2 MIGA guarantees in African fragile state sample, 2011 50
Appendix 3 Traditional aid modality limitations in fragile states 55
Appendix 4 Private sector–related donor projects, South Sudan, as of end-2010 56
Appendix 5 Country case study — Zimbabwe 68
Appendix 6 Country case study—Somaliland 75
Appendix 7 Fragile states and World Bank CPIA scores, 2005–09 80
Appendix 8 Other private sector development initiatives in fragile states 81
Appendix 9 Methodology for reclassifying IDA PSD-related projects 84
Appendix 10 Top PSD-related constraints and economic sectors, African fragile states 86
Appendix 11 IDA IEG project outcome ratings and distributions, 1980–2006 88
Appendix 12 Correlation analysis of IDA IEG project rating components 90
References 92
viTa
ble
of
conte
nts
Figures1 Policy design framework for fragile states xii1.1 Per capita World Bank Group disbursements by income category, 2010 12.1 Policy design framework for fragile states 83.1 Most frequently cited business constraints in African countries 123.2 IDA alignment, fragile state commitments 163.3 IFC alignment with business constraints, selected measures, 2000–11 164.1 World Bank Group alignment with countries’ PSD priorities 255.1 PSD-related project rating distribution in fragile states, 1980–2006 295.2 Historical IDA prioritization and outcome ratings, by PSD subsector 295.3 Current PSD subsector prioritization and outcome ratings, African fragile states 305.4 DOTS development outcome ratings by sector, weighted and unweighted 315.5 IFC investment return versus portfolio share, 2009–10 326.1 Donor alignment with major business constraints 406.2 Donor alignment with what works 42A5.1 GDP and sector growth, 2005–10 68A5.2 Change in Doing Business scores, 2006–11 69A5.3 “Protecting investors” score, Zimbabwe and comparator economies 70A5.4 Deposits and credit to private sector 70A5.5 Deposits (left axis) and loan-to-deposits ratio (right axis), 2008–10 71A11.1 Project outcome ratings by sector, fragile and nonfragile states, 1980–2006 88
Tables1 Criteria to build roads in the Republic of Congo xiii1.1 African fragile states sample and selected indicators 23.1 Fragile states compared with other developing countries, Doing Business indicators 113.2 Most frequently cited business constraints in African fragile states (percent) 133.3 IDA alignment with “major constraints,” by country, selected measures 143.4 IFC alignment with constraints, 2000–11 (percent) 163.5 IFC investments in African fragile states by sector, 1980–2000 173.6 MIGA investments in African fragile states by sector, 1990–2011 194.1 Country PSD constraint priorities, by frequency 214.2 Country economic sector priorities, by frequency 224.3 IDA project alignment with government priority constraints 234.4 IFC investments and priority sector mapping 234.5 MIGA PSD project and priority sector mapping 245.1 IDA PSD-related project evaluation data, 1980–2006 275.2 IDA project outcome ratings by PSD-related sector, 1980–2006 285.3 IFC loan and equity portfolio income, 2009–10 316.1 Private enterprises in South Sudan, by number and distribution of employees 356.2 Commercial bank exposure, by sector (SDG millions) 366.3 Use of banking services among households, by state (percent) 37
viiTab
le of conten
ts
6.4 Distribution of commercial banking services, by state (number of branches) 386.5 Price comparison of select intermediate inputs, Malakal and other cities 386.6 Time and cost to import a container, Juba and comparator cities 396.7 Donor funding for private sector–related projects, 2010 406.8 Donor alignment with government priorities 41A5.1 Time and cost associated with building a warehouse, Zimbabwe and comparator countries 71A5.2 Time and cost required to import, Zimbabwe and comparator countries 72A8.1 OPIC investments and DCA loan guarantees in African fragile states 82A9.1 Reclassification methodology for World Bank project categories 85A11.1 PSD-related project ratings, “satisfactory” and “unsatisfactory” outcomes 89
viii
Fragile and post-conflict states pose a daunting challenge to the World Bank Group. They suffer from a combination of harsh busi-ness environments, unstable and corrupt political regimes, and rent-seeking actors. These barriers prevent private businesses from generating much-needed services, economic growth, and jobs. Viewing the private sector as the key to economic and social prog-ress in fragile states, the authors of this report assess the programs and projects supported by the three major arms of the World Bank active in those states (the International Development Associa-tion, the International Finance Corporation, and the Multilateral Investment Guarantee Agency) and propose a strategy to improve the overall effectiveness of the Bank’s work.
Though the World Bank Group and its shareholders have made fragile states a priority in recent years, their private sector– oriented programs in the past decade have not yielded many con-crete development results. Bank Group staff has been asked to improve project outcomes and to help increase the absorptive capacity of fragile states while targeting priority sectors. But there has not been a clear World Bank Group–wide strategy for fragile states operations.
Using project documents and other sources of information, the authors have compiled a comprehensive dataset on the Bank Group’s work in 14 African states (Sudan, Central African Repub-lic, Democratic Republic of Congo, Togo, Guinea-Bissau, Guinea, Liberia, Angola, Côte d’Ivoire, Republic of Congo, Zimbabwe,
Eritrea, Chad, and Burundi), which are classified as fragile by the World Bank Group. The dataset describes 5,000 IDA proj-ects, 3,700 IFC projects, and 700 MIGA projects over the period 1980–2011 that focus on building the private sector in these states. These data are available for the first time in an easily acces-sible format and will likely serve as a valuable resource for policy-makers, donors, and other interested actors. Analysis of the data shows that there often does not appear to be a clear strategy driv-ing the interventions and that they are sometimes at odds with the stated needs of policymakers and the public.
Policymakers at the World Bank and those in its shareholder countries should heed the authors’ findings if they hope to help private sector businesses grow in Africa’s most challenging invest-ment environments. The authors’ methodical and exhaustive assessment allows them to deliver a clear message. The World Bank should design and implement projects that a) alleviate the growth constraints most identified by businesses, b) target sectors that governments have explicitly made priorities, and c) align with proven, country-specific successes. Adherence to this framework could greatly increase the chances of successful future private sector–oriented interventions in fragile states.
Nancy BirdsallPresidentCenter for Global Development
Preface
ix
Acronyms
AfDB African Development BankCPIA Country Policy and Institutional AssessmentDOTS Development Outcome Tracking SystemFCS Fragile and conflict situationFIAS Financial Investment Advisory ServiceFY Fiscal yearICT Information and communication technologyIDA International Development AssociationIEG World Bank Independent Evaluation GroupIFC International Finance CorporationIFI International financial institutionIRAI IDA Resource Allocation IndexIRR Internal rate of returnMDC Movement for Democratic ChangeMIGA Multilateral Investment Guarantee AgencyPPIAF Public-Private Infrastructure Advisory FacilityPPP Public-private partnershipPSD Private sector developmentSME Small and medium enterpriseUSAID U.S. Agency for International DevelopmentWFP World Food ProgrammeZANU-PF Zimbabwe African National Union–Patriotic Front

xi
The World Bank Group faces significant operational changes over the near to medium term. More than half of poor countries are projected to graduate from the World Bank’s International Devel-opment Association (IDA) concessional assistance over the next 15 years.1 As a result, IDA’s country client base is projected to become dominated by African fragile states. To its credit, the World Bank Group recognizes these coming changes and the unique needs and constraints present in fragile environments. It has publicly expressed a plan to develop an organization-wide strategy tailored specifically for fragile and conflict-affected situations.
At the same time, private businesses often are able to oper-ate in the absence of stable, well-established governments and therefore can present donor organizations with an attractive pro-growth opportunity in fragile states. After all, the overwhelming majority of African jobs come from the private sector, and private businesses are responsible for some of the most dramatic improve-ments in the African economic landscape over the past decade. Perhaps most impressively, the mobile telecommunications sector, comprised almost entirely of private firms, generated more than 300 million mobile phone subscribers between 2000 and 2008. Recognizing these issues, the World Bank Group must make busi-ness growth a central objective of its future strategy for fragile and conflict-affected states. The most recent World Development Report and its subsequent implementation report partially reflect this sentiment. They argue that the organization must “position fragility, conflict, and violence at the core of its development man-date” and that the Bank must “significantly adjust its operations model” to reflect this priority shift.2 Currently, the World Bank Group is devising a new strategy that will set the tone for Group-wide strategic changes.
Scope and key findingsFirst, we examine three key private sector–related factors in Afri-can fragile states: what businesses cite as the most binding con-straints to private sector growth; what government priorities are
for business climate improvements or strategic economic sectors; and what types of projects have been more effective over time. This analysis draws upon World Bank Enterprise Survey data, a newly assembled database of African fragile state government priorities, and World Bank Independent Evaluation Group project outcome rating data. Our summary findings include:•Business constraints. On average, the most frequently cited busi-
ness constraints in African fragile states include electricity (68 percent of survey respondents), access to finance (56 percent), political instability (56 percent), corruption (48 percent), and tax rates (40 percent).
•Government priorities. African fragile state governments have prioritized the following issues: regulatory framework reforms (100 percent of sample countries), transport infrastructure (100 percent), electricity (92 percent), access to and cost of finance (83 percent), and macroeconomic stability (75 percent). Our analysis seeks to identify government priorities in a defined set of African fragile states. A separate comparison between fragile and nonfragile low-income country priorities could be useful to World Bank project design staff.
•Project outcome performance. The private sector–related sub-sectors with the highest project outcome ratings include: tele-communications, oil and gas, transport infrastructure, and trade policy reform. At least half of IDA projects had at least “satisfactory” outcome ratings in these subsectors. The worst-performing subsectors include: port infrastructure; bank-ing; micro, small, and medium enterprise finance; rail infra-structure; and mining.Subsequently, we assess the alignment of World Bank Group
operations within these three areas over the last decade. For this analysis, we have assembled a new database covering all World Bank Group operations in fragile states since 1980, which includes current and past fragile states (both African and non-African). Overall, we find that project alignment varies widely across the World Bank Group’s three largest subsidiaries — IDA, the
Executive summary
xiiExe
cuti
ve s
um
mar
y
International Finance Corporation (IFC), and the Multilateral Investment Guarantee Agency (MIGA). Despite several bright spots, our analysis suggests that strategic changes in the World Bank Group’s operations are needed — particularly for IFC and MIGA. Our summary findings include:•IFC and MIGA alignment performance. IFC and MIGA proj-
ects are only modestly aligned with the private sector’s most binding constraints or government priorities. Instead, projects have been heavily concentrated in low-risk sectors, such as the extractive sector (between 1980 and 2000). In recent years, this concentration has shifted toward the financial sector (on a proj-ect count basis) and the telecommunications sector (on a project value basis). Taken together, IFC activities over time suggest that the organization chooses its investments on a project-by-project basis, rather than implementing a comprehensive, sys-tematic strategy in African fragile states.
•IDA alignment performance. IDA exhibits very strong align-ment with government priorities and reasonably good
prioritization in sectors with higher project outcome ratings. But it has a more mixed performance with respect to focusing on what businesses cite as the most binding private sector–related constraints. By illustration, it has focused a dispropor-tionate share of private sector–related projects on transport infrastructure, which businesses cite less frequently as a “major constraint.” On the other hand, IDA has pursued fewer proj-ects focusing on the most binding constraints, such as electric-ity and access to finance.3
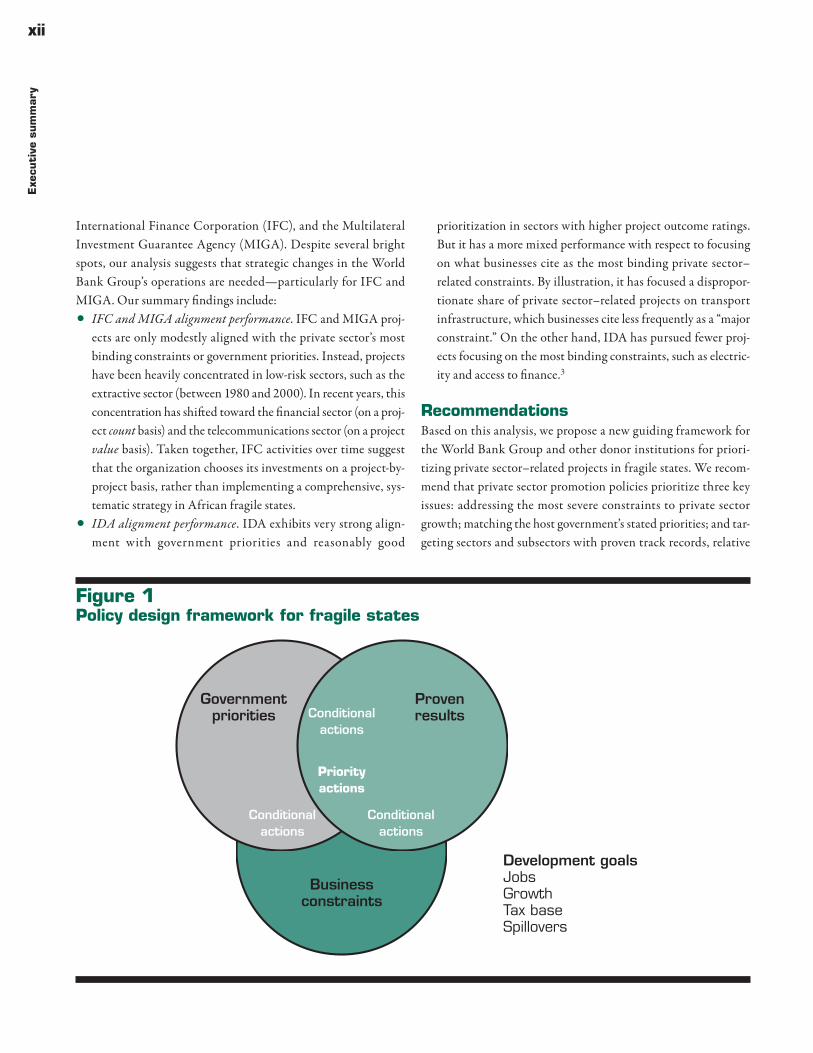
RecommendationsBased on this analysis, we propose a new guiding framework for the World Bank Group and other donor institutions for priori-tizing private sector–related projects in fragile states. We recom-mend that private sector promotion policies prioritize three key issues: addressing the most severe constraints to private sector growth; matching the host government’s stated priorities; and tar-geting sectors and subsectors with proven track records, relative
Figure 1 Policy design framework for fragile states
ProvenresultsConditional
actions
Conditionalactions
Conditionalactions
Priorityactions
Governmentpriorities
Businessconstraints
Development goalsJobsGrowthTax baseSpillovers
xiiiExecu
tive sum
mary
to other sectors (figure 1). Moreover, donor policies and projects should also contribute to broader development goals, including job creation, economic growth, broadening and strengthening of the tax base, and positive spillover effects into other economic sectors.
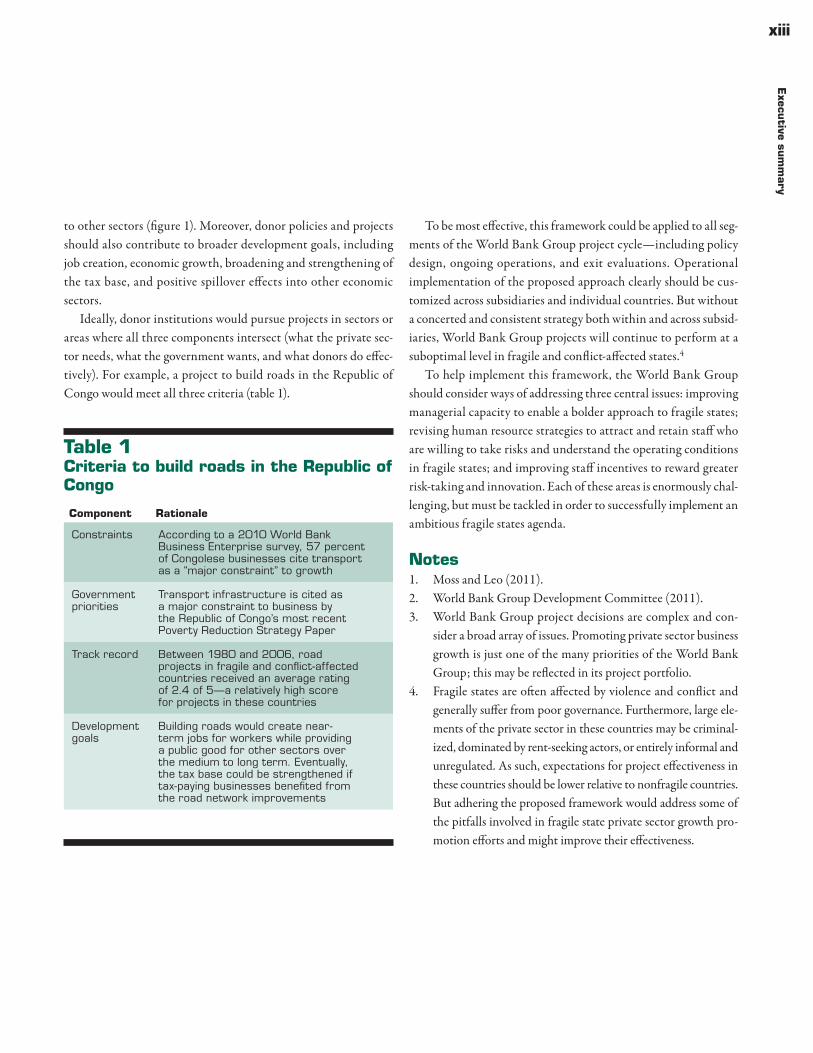
Ideally, donor institutions would pursue projects in sectors or areas where all three components intersect (what the private sec-tor needs, what the government wants, and what donors do effec-tively). For example, a project to build roads in the Republic of Congo would meet all three criteria (table 1).
To be most effective, this framework could be applied to all seg-ments of the World Bank Group project cycle — including policy design, ongoing operations, and exit evaluations. Operational implementation of the proposed approach clearly should be cus-tomized across subsidiaries and individual countries. But without a concerted and consistent strategy both within and across subsid-iaries, World Bank Group projects will continue to perform at a suboptimal level in fragile and conflict-affected states.4
To help implement this framework, the World Bank Group should consider ways of addressing three central issues: improving managerial capacity to enable a bolder approach to fragile states; revising human resource strategies to attract and retain staff who are willing to take risks and understand the operating conditions in fragile states; and improving staff incentives to reward greater risk-taking and innovation. Each of these areas is enormously chal-lenging, but must be tackled in order to successfully implement an ambitious fragile states agenda.
Notes1. Moss and Leo (2011).2. World Bank Group Development Committee (2011).3. World Bank Group project decisions are complex and con-
sider a broad array of issues. Promoting private sector business growth is just one of the many priorities of the World Bank Group; this may be reflected in its project portfolio.
4. Fragile states are often affected by violence and conflict and generally suffer from poor governance. Furthermore, large ele-ments of the private sector in these countries may be criminal-ized, dominated by rent-seeking actors, or entirely informal and unregulated. As such, expectations for project effectiveness in these countries should be lower relative to nonfragile countries. But adhering the proposed framework would address some of the pitfalls involved in fragile state private sector growth pro-motion efforts and might improve their effectiveness.
Table 1 Criteria to build roads in the Republic of Congo
Component Rationale
Constraints According to a 2010 World Bank Business Enterprise survey, 57 percent of Congolese businesses cite transport as a “major constraint” to growth
Government priorities
Transport infrastructure is cited as a major constraint to business by the Republic of Congo’s most recent Poverty Reduction Strategy Paper
Track record Between 1980 and 2006, road projects in fragile and conflict-affected countries received an average rating of 2.4 of 5 — a relatively high score for projects in these countries
Development goals
Building roads would create near-term jobs for workers while providing a public good for other sectors over the medium to long term. Eventually, the tax base could be strengthened if tax-paying businesses benefited from the road network improvements

1
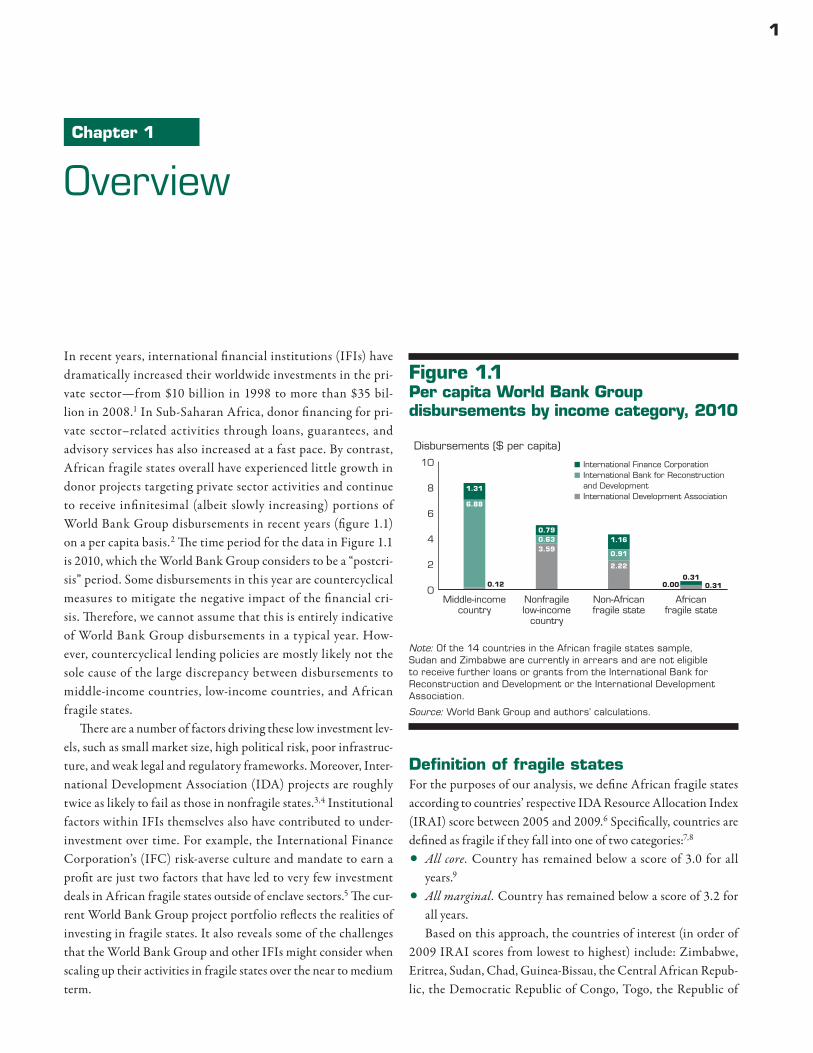
In recent years, international financial institutions (IFIs) have dramatically increased their worldwide investments in the pri-vate sector — from $10 billion in 1998 to more than $35 bil-lion in 2008.1 In Sub-Saharan Africa, donor financing for pri-vate sector–related activities through loans, guarantees, and advisory services has also increased at a fast pace. By contrast, African fragile states overall have experienced little growth in donor projects targeting private sector activities and continue to receive infinitesimal (albeit slowly increasing) portions of World Bank Group disbursements in recent years (figure 1.1) on a per capita basis.2 The time period for the data in Figure 1.1 is 2010, which the World Bank Group considers to be a “postcri-sis” period. Some disbursements in this year are countercyclical measures to mitigate the negative impact of the financial cri-sis. Therefore, we cannot assume that this is entirely indicative of World Bank Group disbursements in a typical year. How-ever, countercyclical lending policies are mostly likely not the sole cause of the large discrepancy between disbursements to middle- income countries, low-income countries, and African fragile states.
There are a number of factors driving these low investment lev-els, such as small market size, high political risk, poor infrastruc-ture, and weak legal and regulatory frameworks. Moreover, Inter-national Development Association (IDA) projects are roughly twice as likely to fail as those in nonfragile states.3,4 Institutional factors within IFIs themselves also have contributed to under-investment over time. For example, the International Finance Corporation’s (IFC) risk-averse culture and mandate to earn a profit are just two factors that have led to very few investment deals in African fragile states outside of enclave sectors.5 The cur-rent World Bank Group project portfolio reflects the realities of investing in fragile states. It also reveals some of the challenges that the World Bank Group and other IFIs might consider when scaling up their activities in fragile states over the near to medium term.
Definition of fragile statesFor the purposes of our analysis, we define African fragile states according to countries’ respective IDA Resource Allocation Index (IRAI) score between 2005 and 2009.6 Specifically, countries are defined as fragile if they fall into one of two categories:7,8
•All core. Country has remained below a score of 3.0 for all years.9
•All marginal. Country has remained below a score of 3.2 for all years.Based on this approach, the countries of interest (in order of
2009 IRAI scores from lowest to highest) include: Zimbabwe, Eritrea, Sudan, Chad, Guinea-Bissau, the Central African Repub-lic, the Democratic Republic of Congo, Togo, the Republic of
Chapter 1
Overview
Figure 1.1 Per capita World Bank Group disbursements by income category, 2010
Note: Of the 14 countries in the African fragile states sample, Sudan and Zimbabwe are currently in arrears and are not eligible to receive further loans or grants from the International Bank for Reconstruction and Development or the International Development Association.
Source: World Bank Group and authors’ calculations.
0
2
4
6
8
10
Africanfragile state
Non-Africanfragile state
Nonfragilelow-income
country
Middle-incomecountry
Disbursements ($ per capita)
International Finance CorporationInternational Bank for Reconstruction and DevelopmentInternational Development Association
0.310.00
2.22
0.91
1.163.590.630.79
0.12
6.88
1.31
0.31
2O
verv
iew
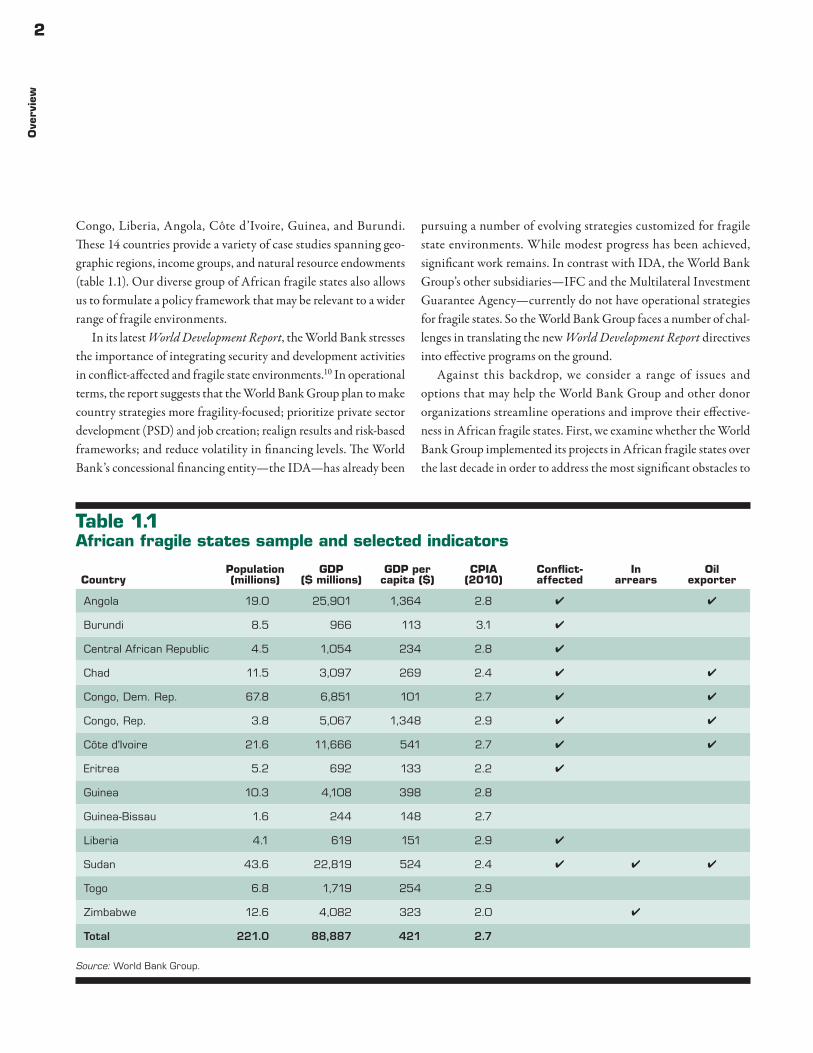
Congo, Liberia, Angola, Côte d’Ivoire, Guinea, and Burundi. These 14 countries provide a variety of case studies spanning geo-graphic regions, income groups, and natural resource endowments (table 1.1). Our diverse group of African fragile states also allows us to formulate a policy framework that may be relevant to a wider range of fragile environments.
In its latest World Development Report, the World Bank stresses the importance of integrating security and development activities in conflict-affected and fragile state environments.10 In operational terms, the report suggests that the World Bank Group plan to make country strategies more fragility-focused; prioritize private sector development (PSD) and job creation; realign results and risk-based frameworks; and reduce volatility in financing levels. The World Bank’s concessional financing entity — the IDA — has already been
pursuing a number of evolving strategies customized for fragile state environments. While modest progress has been achieved, significant work remains. In contrast with IDA, the World Bank Group’s other subsidiaries — IFC and the Multilateral Investment Guarantee Agency — currently do not have operational strategies for fragile states. So the World Bank Group faces a number of chal-lenges in translating the new World Development Report directives into effective programs on the ground.
Against this backdrop, we consider a range of issues and options that may help the World Bank Group and other donor organizations streamline operations and improve their effective-ness in African fragile states. First, we examine whether the World Bank Group implemented its projects in African fragile states over the last decade in order to address the most significant obstacles to
Table 1.1 African fragile states sample and selected indicators
Source: World Bank Group.
CountryPopulation (millions)
GDP ($ millions)
GDP per capita ($)
CPIA (2010)
Conflict-affected
In arrears
Oil exporter
Angola 19.0 25,901 1,364 2.8 ✔ ✔
Burundi 8.5 966 113 3.1 ✔
Central African Republic 4.5 1,054 234 2.8 ✔
Chad 11.5 3,097 269 2.4 ✔ ✔
Congo, Dem. Rep. 67.8 6,851 101 2.7 ✔ ✔
Congo, Rep. 3.8 5,067 1,348 2.9 ✔ ✔
Côte d'Ivoire 21.6 11,666 541 2.7 ✔ ✔
Eritrea 5.2 692 133 2.2 ✔
Guinea 10.3 4,108 398 2.8
Guinea-Bissau 1.6 244 148 2.7
Liberia 4.1 619 151 2.9 ✔
Sudan 43.6 22,819 524 2.4 ✔ ✔ ✔
Togo 6.8 1,719 254 2.9
Zimbabwe 12.6 4,082 323 2.0 ✔
Total 221.0 88,887 421 2.7
3O
verview
business growth; country government priorities; and areas where the World Bank Group has a proven track record. In this manner, we gauge how well the World Bank Group is focusing on what is needed, what is wanted, and what works. Second, we apply this approach to assess donors’ PSD support in the newly independent nation of South Sudan.11 Taken together, our findings suggest a somewhat mixed picture about the World Bank Group’s align-ment and effectiveness in promoting PSD in African fragile states. Finally, drawing upon this analysis, we propose a number of strate-gic and operational policy recommendations for the World Bank Group to consider as it seeks to prioritize and improve its PSD programs in African fragile states.
Notes1. IFC (2010b).2. In this report, we use several metrics to demonstrate the rela-
tive size of World Bank Group commitments to fragile states. First, to reduce the bias of countries with larger populations receiving more commitments, we use per capita figures. Sec-ond, to gain the perspective of fragile state commitments versus commitments in other countries, we use commitment values in fragile states as a percentage of total commitment values in all countries. Third, for countries in which high-value projects are simply not feasible, we use project count metrics in relation to total Group projects in all countries.
3. Gelb (2010).4. While IDA’s supply-driven resource allocation model ensures
that fragile states receive substantial assistance volumes, poor project performance levels have a significant influence on the sectors targeted by IDA funding. IDA’s performance-based
allocation (PBA) system does include a project portfolio qual-ity component, which has a modest impact on each respective recipient country’s resource allocation.
5. Of the numerous private sector–related programs and funding sources listed later in this paper, investments in fragile states constitute a small portion of overall investments. For a com-plete breakdown of multilateral development banks’ invest-ments, see Perry (2011).
6. IRAI scores are based on the World Bank’s annual Country Policy and Institutional Assessment (CPIA) exercise. They are calculated as the average of country ratings across four dis-tinct categories: economic management; structural policies; policies for social inclusion/equity; and public sector manage-ment and institutions. The CPIA/IRAI is the principal deter-minant of a given country’s IDA allocation. For additional details, see www.worldbank.org/ida.
7. Appendix 7 includes a full list of existing African “fragile states,” their IRAI scores, and categorizations. To maintain close relevance with our target countries, we have omitted island nations and non-African countries.
8. This report’s definition of fragile states tracks largely with that of the World Bank, which defines “core” and “marginal” states as those countries with IRAI scores of below 3.0 and 3.2, respectively. Our only departure from the Bank’s definition is that we extend the period to 2005–09.
9. This categorization also includes countries that are missing data for one or more years, but that lie below 3.0 when scored.
10. World Bank (2011a).11. Appendixes 5 and 6 provide further analysis on the case stud-
ies of Zimbabwe and Somaliland.
4
Chapter 2
Private sector development in fragile states
PSD in AfricaIn recent years, the majority of investment in the African private sector has flowed toward the rapidly expanding telecommunica-tions and extractive industry sectors. Between 2005 and 2008, private investors contributed 62 percent of total funding to the telecommunications industry, which has resulted in the rapid expansion of networks and profitability, as well as prospects for continued growth.1 By illustration, African telecommunications firms generated more than 316 million mobile phone subscribers between 2000 and 2010.2 The rapid 43 percent annual growth rate leaves plenty of room for upward movement in the sector, as mobile penetration only reached 44 percent in 2009.3 Unlike other sectors, telecommunications growth has spanned the gamut of Sub-Saharan countries, ranging from middle- income economies to fragile states.4 The natural resources and extractive industries have also accounted for a significant portion of African growth, contributing roughly a quarter of Africa’s growth between 2002 and 2007.5
While progress in the telecommunications and extractive industry sectors is promising, current signals indicate that private investors’ appetite for other sectors continues to grow and that private sector expansion could provide a valuable boost to capi-tal- and capacity-starved fragile states. Private sector investment projects in infrastructure could provide high investment returns (as in telecommunications) for both investors and customers in fragile states. For example, “bankable” investments in electricity generation capability and infrastructure (for which there is signifi-cant consumer demand) could greatly decrease costs for businesses while generating revenue for power providers.6
PSD in fragile statesTheoretically, the private sector has many opportunities to thrive in environments in which traditional aid cannot succeed. For instance, the private sector can exist (and even thrive) even when there is no central government that is stable enough to accept
foreign aid (for example, Somaliland). This could make the pri-vate sector a particularly viable and valuable target for economic development interventions in fragile states. Therefore, promoting private sector growth in fragile states could be one tangible first step toward better governance and more diverse, robust econo-mies. However, despite a sound rationale for public sector inter-vention in the private sector, private sector development (PSD)–focused activities in fragile state environments remain vulnerable to a range of binding or limiting constraints.
Fragile states generally are categorized by very weak business climates that often restrict individual firm activities through sev-eral channels. In particular, the indirect costs of poor infrastruc-ture, regulatory challenges (such as excessive licensing fees, bribes, and so forth), and low labor productivity can reduce profit mar-gins and reduce incentives for business owners and prospective entrepreneurs.7 These effects can be exacerbated in fragile states, in which governments and institutions routinely fail to adminis-ter services, enforce contracts, and reduce corruption. Political risk also is a major concern for multilateral institutions that wish to invest in the African private sector. This illustrates African fragile states’ acute need for customized financing instruments, such as political risk guarantees.
Fragile states also lack the human capital needed to operate scalable business ventures. While skilled micro-entrepreneurs may exist en masse in countries like Chad and Burundi, many of the most skilled businesspeople (such as those with formal skills in accounting, personnel management, strategic planning, risk analysis, marketing, and the like) have often left these hostile busi-ness environments for more lucrative and/or secure opportunities abroad. Although these highly skilled workers often send home substantial remittances, they frequently do not maintain local busi-nesses in the fragile-state environment from where they came.8
Many firms in fragile states are also heavily constrained by what Ramachandran, Gelb, and Shah (2009) refer to as “external costs.”9 These external or indirect costs — such as those stemming
5P
rivate sector d
evelopm
ent in
fragile sta
tes
from failures in electricity service provision, transport infrastruc-ture, and supplier networks — often erode individual businesses’ profit-making capabilities. In other words, many African firms’ “ability to produce value beyond the cost of their direct and indi-rect inputs is heavily constrained by the magnitude of the cost of the latter.”10 Finally, markets for goods in nearly all of our 14 fragile states are particularly disparate and weak. Even with strong support from multilateral development banks on the supply side, the private sector will not thrive without predictable and steadily increasing demand from local consumers.
Rationale for public sector support of the private sectorBefore launching into a more in-depth discussion of PSD initia-tives in fragile states, we shall examine several broad theoretical rationales for public sector support of the private sector. First, it is believed that PSD activities help to create jobs and foster eco-nomic growth (the private sector accounts for roughly 90 percent of jobs in the developing world).11 Second, many argue that the public sector should support the private sector because individual busi-nesses are constrained by numerous government-driven limitations, ranging from corruption to lack of physical infrastructure. Third, many of these constraints result from market deficiencies that theo-retically can be rectified by public sector initiatives. For example, imperfect capital markets hinder businesses — notably small and medium enterprises — by not investing in profitable projects. This often occurs because of imperfect information regarding profit-ability, high transaction costs, and insufficient legal frameworks and enforcement mechanisms. Relatedly, informal and small firms are often unable to pledge collateral and lack formal title rights to physical property.12 Another example relates to governance. PSD requires an appropriate institutional framework that the private sector cannot provide for itself. While there are several examples of private sector firms joining together to help stabilize the gover-nance environment (such as in Somaliland), most firms in fragile states are unwilling or unable to create the institutional framework necessary to promote PSD by themselves.13
Existing multilateral efforts — the World Bank GroupThe World Bank Group and others donor organizations’ PSD goals in African fragile states broadly mirror those in other
low-income countries. The key differences relate to developing policies and projects that are tailored to the more difficult operat-ing environments.
The World Bank’s soft loan facility (the International Devel-opment Association, or IDA) has a significant presence in fragile states. All of the African fragile states are IDA-eligible borrowers, though several countries (namely, Sudan and Zimbabwe) currently are inactive due to World Bank Group loan arrears. Oil-produc-ing African fragile states (Angola and the Republic of Congo) are above the IDA lending income cutoff, but still have access to IDA loans on “hardened terms.”14 Although one of IDA’s specific foci is PSD, its projects in many sectors such as infrastructure and regu-latory reform result in positive spillover effects for private sector businesses. Indeed, much of IDA’s contribution to the private sec-tor may result from indirect benefits from non-PSD–focused IDA projects. IDA’s current eligibility requirements have significant implications for the institution’s future. A recent study estimates that by 2025, most IDA-eligible countries will be African fragile states — a reality that may compel IDA to restructure its strategy around fragile lending environments in the coming years.15 By extension, adapting to the specific constraints of fragile states will be essential to IDA’s continuing success.
The efforts of the World Bank Group’s private sector arm are of particular interest. The International Finance Corporation (IFC) is a leading global player in the PSD spectrum and makes nearly 40 percent of all investments that originate from develop-ment finance institutions.16 However, IFC’s 2010 project disburse-ments to African fragile states, on a per capita basis, were four times smaller than commitments to middle- income countries.17 The smaller levels of investment in African fragile states reflect investment conditions characterized by volatility and high levels of risk, limited private sector partners, and few choices for viable investment projects. And if IFC hopes to scale up its investments in African fragile states (a World Bank Group–wide measure has been proposed in the most recent World Development Report), it must innovate its investment model.
Taken together, the World Bank Group has shown an increased level of commitment toward fragile states in recent years. During the World Bank’s spring 2011 Development Committee meeting, shareholders agreed on the following commitments:18
•Make fragile and conflict situation (FCS) strategies more fragility- focused by preparing new strategies for FCS countries.
6P
riva
te s
ecto
r dev
elop
men
t in
fra
gile
sta
tes
•Increase attention to jobs and PSD by promoting a common World Bank Group approach to employment and introducing new IFC/Multilateral Investment Guarantee Agency (MIGA) instruments.
•Realign results and risk frameworks for FCS countries through the development of results metrics that are sensitive to conflict and fragility.
•Strive for “global excellence in FCS” by establishing a new FCS hub in Nairobi by the end of fiscal year (FY) 2011 and further revising human resource policies that reflect FCS priorities and needs.Since this World Bank Group strategy was approved only
recently, it has yet to be operationalized by the individual World Bank subsidiary organizations such as IFC and IDA. However, the IFC launched its five-year Conflict Affected States in Africa Initia-tive in 2008 to help design and implement integrated strategies that support economic recovery in conflict-affected countries. Roughly 18 percent of total IFC advisory service expenditures worldwide are committed to World Bank–classified fragile states, which include non-African countries. Specifically, the Conflict Affected States in Africa program has four main elements: improving the business environment through regulatory reform; strengthening small and medium enterprises and support institutions (such as chambers of commerce); rebuilding financial markets and other financial institutions; and increasing private sector involvement in rebuild-ing infrastructure.19 The IFC has implemented Conflict Affected States in Africa projects in several postconflict countries with severe business climate constraints, such as Burundi, the Central African Republic, the Democratic Republic of Congo, Liberia, and Sierra Leone. It continues its extensive advisory service operations in many African fragile states. IFC emphasizes the importance of these services in lieu of larger investment project operations, which it says are especially difficult in fragile environments.20
Although there are numerous efforts aimed at promoting Afri-can infrastructure growth (one result of which would be private sector growth), few of these initiatives have the capability and/or audacity to commit resources to fragile states. Although exam-ined for this report, many private sector and infrastructure initia-tives were not included because they do not focus on fragile states. These initiatives/institutions include NEPAD’s Infrastructure Investment Fund, DevCo (a fund overseen by the Private Infra-structure Development Group), and InfraCo (also funded by the
Group). A list of selected PSD initiatives in fragile states is located in appendix 8. Of particular interest is the Public-Private Infra-structure Advisory Facility (PPIAF), which was established in 1999 to increase private sector participation in emerging mar-kets. PPIAF provides grants to help governments create a sound enabling environment for private participation in infrastructure through activities such as framing infrastructure development strategies, organizing stakeholder consultation workshops, and designing pioneering projects.21 PPIAF, committing about $20 million a year globally, has sponsored projects in fragile states such as the Democratic Republic of Congo, Guinea, Guinea-Bis-sau, Liberia, and Sierra Leone.22 The projects often have a regional focus, and PPIAF’s 2011–13 work plan cites fragile states as one of four major cross-cutting themes for future projects.
The World Bank Group’s Financial Investment Advisory Ser-vice (FIAS) is a multidonor investment climate program that assists developing and transition economies to improve their busi-ness environments with an emphasis on regulatory simplification and investment generation.23 FIAS also coordinates with IFC Advisory Services and other World Bank Group departments. Forty-five percent of FIAS activities in FY10 occurred in Sub-Saharan Africa, including 31 percent of its implementation expen-ditures in fragile and postconflict states.24 FIAS completed five business reforms in three fragile states, including business taxation reform in Sierra Leone, construction permits in the Democratic Republic of Congo, and investment policy reforms in Guinea-Bis-sau. In 2011, FIAS began designing a methodology to estimate the savings accrued to firms resulting from its business climate reform support. FIAS’s client satisfaction rating has hovered around 90 percent in recent years.25 Moreover, FIAS released a Rough Field Guide to Investment Climate Reform in Conflict-Affected Countries in 2010, which explicitly links investment climate improvement with peace-building efforts in postconflict countries. The report also provides highly detailed instructions on the design, imple-mentation, and evaluation of investment climate reforms, includ-ing laws, regulations, and procedures that govern industry compet-itiveness, bureaucratic efficiency, and institutional governance.26
The World Bank’s Doing Business project provides absolute and relative measurements of business regulations and obstacles across 183 economies. These annual reviews contain extensive data on constraints to business growth, including time and costs required to start a business, licensing fees, construction permits, and trading
7P
rivate sector d
evelopm
ent in
fragile sta
tes
across borders. Unlike most private sector–oriented diagnostics, Doing Business collects data annually for nearly all of the world’s economies.27 While the Doing Business program does not support specific business reform activities, its field analysis and findings feed into IFC, FIAS, and non–World Bank Group programs assisting fragile states (and other countries) with business climate reforms.
Promoting business growth — policy goals in fragile statesThe next chapters describe the World Bank Group’s projects in some detail. But first, with a view to evaluating the efforts of the World Bank Group, we describe four key business growth–related objectives in fragile states: supporting broad-based economic growth, job creation, tax mobilization, and positive spillovers. We also introduce a conceptual framework to guide support opera-tions that could be adapted and applied to a variety of African fragile state environments.
Broad-based economic growthSustained, broad-based economic growth is the critical driver for significant poverty reduction in low-income countries, particularly in view of the limited scope for income redistribution. But as the World Bank’s Commission on Growth and Development states, economic growth is not an end in itself. Rather, it is the spark to create resources and social services to support health, education, job creation, and other development goals. By illustration, one study estimated that a 2 percent rise in average household income resulted in a 1.2–7.0 percent decline in poverty rates.28 Therefore, economic growth has major implications for poverty reduction in African fragile states.29 Over the last 30 years, poverty levels have fallen significantly, with much of the progress being attributable to economic growth. Globalization has provided the platform to expand markets, import ideas and technology, and facilitate the movement of human capital and investment to regions that were previously largely closed off from the global economy. Although there is not one common success story, countries that have achieved sustained economic growth have maintained macroeconomic and political stability, raised investment and savings, and opened their markets. The overriding policy challenge is to determine how to apply these success stories to the poorest and most fragile countries.
The World Bank’s Commission on Growth and Development outlines several types of countries that face dramatic challenges in
achieving sustained economic growth. These include Sub-Saharan countries still contending with postcolonial resource extraction models and negative spillovers from unstable and violent neigh-bors; small states with significant concentration in a few economic sectors highly vulnerable to exogenous shocks; governments facing comparatively high per capita costs of social services; and countries rich in natural resources facing Dutch disease and rent-seeking risks. Most African fragile states examined in this report fall into one of these categories.
Job creationThe labor market is deeply entwined with both economic growth and poverty reduction. Many African fragile states face high, persistent unemployment levels, particularly among youth and demobilized combatants, which can contribute to increased rates of violence, political instability, and higher levels of poverty.30 Therefore, supporting job creation opportunities should be a central objective of any World Bank Group operation that aims to promote business growth. The relationship between jobs and growth is largely a two-way street: sustainable economic growth depends at least partly on the underlying labor market structure and a flexible labor force, while employment growth often depends on growth of output in the formal sector. But a key characteristic of African labor markets is the very high ratio of informal to for-mal sector employment.31 Thus, although formal sector growth is essential in the long term, the informal sector often has greater capacity to absorb the ever-expanding labor force — especially in economies constrained by low formal output growth.32 Therefore, African fragile state governments and donor organizations often need to pursue two-track approaches for supporting increased pro-ductivity within the informal sector while simultaneously improv-ing the operating environment for formal enterprises.
Tax mobilizationA third PSD-related objective is fostering a broad, stable tax base, which contributes to improved governance, accountability, and eco-nomic growth. Domestic tax policies have the potential to strengthen government legitimacy in the eyes of constituents through increased accountability and transparency, perceived fairness, and a clear polit-ical commitment to shared prosperity.33 Government revenues are also necessary for providing social services and can be used to support economic growth and diversification. There is considerable variation
8P
riva
te s
ecto
r dev
elop
men
t in
fra
gile
sta
tes
in African countries’ tax bases, with the lowest tax bases often corre-sponding to almost exclusive dependence on natural resource rents. Tax revenues average roughly 14 percent of GDP in African fragile states, with oil exporters Chad and the Republic of Congo on the low end with slightly higher than 5 percent of GDP and Liberia and Zimbabwe on the high end with approximately 30 percent of GDP.34 Due to large informal sectors, most fragile states have relatively nar-row tax bases. Thus, the government’s “fiscal-social contract” with the private sector is an important step toward reform. Formalizing the informal sector of the economy creates not only a broader tax base and larger stream of revenue to provide necessary services, it provides an incentive for expanded political participation.35
Positive spillovers and multipliersAnother driver of success is growth spillovers — when growth in one part of the country or some subset of firms impacts the growth of other firms or regions. At the country level, open borders for the flow of goods and services, along with increasing migration and flow of human capital, lead to increasingly positive spillovers. Within countries, knowledge and technology are key ingredients in the development of industry, and can be shared across firms.
Also, firms in fragile states may be able to “borrow” knowledge cheaply, helping to “leapfrog” the historic development process. Mobile phone technology is a prime example.36 Finally, some types of investments can also spur the growth of related indus-tries, either upstream or downstream in the production process.37
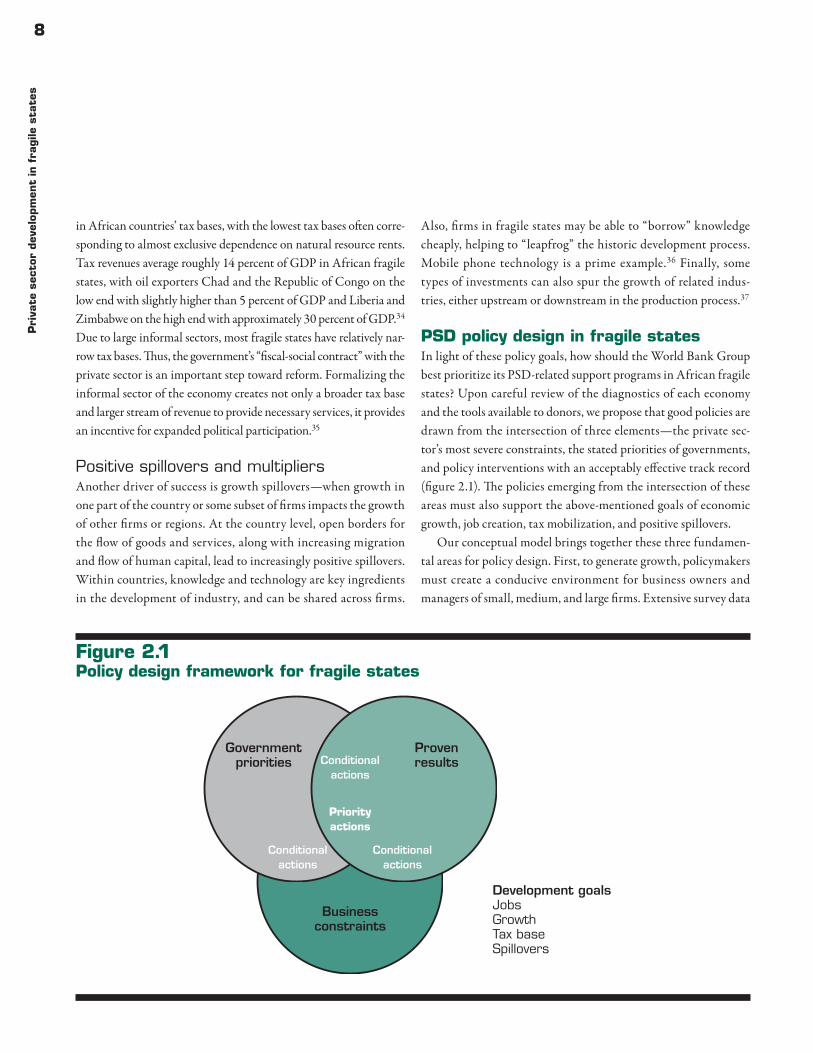
PSD policy design in fragile statesIn light of these policy goals, how should the World Bank Group best prioritize its PSD-related support programs in African fragile states? Upon careful review of the diagnostics of each economy and the tools available to donors, we propose that good policies are drawn from the intersection of three elements — the private sec-tor’s most severe constraints, the stated priorities of governments, and policy interventions with an acceptably effective track record (figure 2.1). The policies emerging from the intersection of these areas must also support the above-mentioned goals of economic growth, job creation, tax mobilization, and positive spillovers.
Our conceptual model brings together these three fundamen-tal areas for policy design. First, to generate growth, policymakers must create a conducive environment for business owners and managers of small, medium, and large firms. Extensive survey data
Figure 2.1 Policy design framework for fragile states
ProvenresultsConditional
actions
Conditionalactions
Conditionalactions
Priorityactions
Governmentpriorities
Businessconstraints
Development goalsJobsGrowthTax baseSpillovers
9P
rivate sector d
evelopm
ent in
fragile sta
tes
on the problems reported by businesses are available on the World Bank’s website and from other sources.38 We analyze these data to identify the most critical problems facing businesses that are trying to survive in fragile environments. Understanding their constraints is the crucial first step toward good policy design. Whether it is the basics (infrastructure, public services), regula-tions (taxes, licensing rules), or labor shortages, we need to know what the private sector believes is holding back growth.
The second area is understanding government priorities. Policy-makers in fragile states operate in very difficult environments, often trying to address various constraints simultaneously with very few resources. Understanding their perspective and primary objectives is important, especially for policymakers in multilateral institutions. By searching through public documents, speeches, and other data, we try to identify what African fragile state gov-ernments perceive to be their most binding PSD-related obstacles. There may well be some overlap between their perspective and that of the private sector, as we will see in next chapters.
Third, we must use the lessons learned from past policy inter-ventions. Understanding what has worked in fragile environments will be useful to the design of new policies, programs, and proj-ects, particularly when these findings are referenced against public and private sector constraints and priorities. To accomplish this task, we analyze past policy interventions using a database of IDA projects and other sources to identify successful projects by sector, type, and location.
When considered together, these three analytical components can help multilateral organizations prioritize PSD-related pro-grams in fragile states. As noted previously, donor institutions ideally would pursue projects in sectors or areas where all three components intersect (what the private sector needs, what the gov-ernment wants, and what donors do effectively). This is the “prior-ity action” zone of the conceptual framework. But there will be sit-uations or environments in which multilateral organizations may wish or need to pursue projects or investments that do not meet this condition. In this instance, we recommend that multilateral organizations then prioritize projects in sectors or areas where two of the three components intersect. Careful attention should be given to why one of the components does not meet this condition and what types of remedial actions would be required. For each of the omitted policy prioritization components, potential remedial steps could include the following in different situations:
•Major PSD constraints (need to tread carefully). Multilateral organizations should proceed very cautiously in the absence of private sector buy-in. However, there could be instances when proceeding could be justified — such as a prioritization overlap with informal and/or small and medium enterprises, though not with the business elite.
•Government priorities (need to get buy-in). Multilateral organi-zations should determine why the private sector and national government priorities are not consistent. After this, steps should be taken to encourage government buy-in as appropriate — particularly in areas where direct or indirect government involve-ment is likely. But multilateral organizations may want to depri-oritize the need for buy-in in failed or highly repressive states.
•Proven results (need to innovate): Multilateral organizations will need to consider innovative or alternative implementa-tion models to ensure that project or investment results exceed historical performance patterns. Moreover, careful attention should be given to programmatic factors that are significantly predictive of project outcome performance ratings, such as quality-at-entry and supervision (these issues are examined in greater detail in chapter 4).The next chapters explore each of these areas — constraints
reported by businesses, priorities of governments, and understand-ing what works — in significant detail. Each chapter examines the available data, and then compares them with the project portfo-lio of the three relevant World Bank Group entities — IDA, IFC, and MIGA (when possible). The aim of this analysis is to under-stand whether these institutions have operated with a consistent, well-defined strategy and whether their projects have met needs identified by either the government or the private sector (or ideally both). Finally, our conceptual model is used to identify priorities for Africa’s newest country, South Sudan (chapter 6). Case studies for Somaliland and Zimbabwe are included as well.
Notes1. McKinsey Global Institute (2010).2. McKinsey Global Institute (2010).3. McKinsey & Company (2010).4. For example, Zain (a Kuwaiti mobile telecommunications
company) has made major investments in South Sudan since 2008. To date, Zain has invested more than $300 million in their South Sudan network.
10P
riva
te s
ecto
r dev
elop
men
t in
fra
gile
sta
tes
5. Government spending from resource-generated revenue con-tributed an additional 8 percentage points. See McKinsey & Company (2010).
6. In a 2010 interview with the Infrastructure Consortium for Africa, Bobby J. Pittman Jr., African Development Bank Vice President for Infrastructure, Private Sector Development, and Regional Integration, noted the AfDB’s strong interest in high-return investments in African infrastructure projects.
7. Ramachandran, Gelb, and Shah (2009).8. Fragile states record significant amounts of remittances from
abroad. World Bank estimates for 8 of the 14 countries in the sample are that remittances counted for an average of nearly 4 percent of GDP in 2009. During that year, the average for Sub-Saharan Africa was roughly 2.5 percent.
9. Ramachandran, Gelb, and Shah (2009), p. 44.10. Ramachandran, Gelb, and Shah (2009), p. 45.11. Kurokawa, Tembo, and te Velde (2008).12. Kurokawa, Tembo, and te Velde (2008).13. See appendix 6 for more in-depth information on how the
Somaliland private sector helped stabilize an otherwise vola-tile business environment in the subnational territory.
14. For more details, see www.worldbank.org/ida.15. Moss and Leo (2011).16. IFC (2010a). This includes institutions such as IFC, the Euro-
pean Bank for Reconstruction and Development, and MIGA.17. Of IFC capital, 89 percent is invested in middle- income countries
(DfID 2010). According to authors’ calculations, IFC’s 2010 commitments to MICs were roughly $1.31 per capita, while commitments to African fragile states were only $0.31 per capita.
18. World Bank Group Development Committee (2011).19. IFC Conflict Affected States in Africa website, www.ifc.org/
ifcext/africa.nsf/Content/CASA_Home.20. The developmental and financial returns gained from advisory
service projects are far more ambiguous than returns gained from investment projects (for instance, IFC received a 16.5 percent return on its organization-wide manufacturing equity investments in 2010). Therefore, much of IFC’s work in African fragile states is difficult to quantify, and the full impact of IFC in these countries may not necessarily be presented by the data analysis contained in this report. But the IFC’s own evaluation report completed by the World Bank Group’s Independent Eval-uation Group determined that advisory projects in “high-risk”
business climates tend to have higher development effectiveness than those in their non-high-risk counterparts. This same assess-ment applies to IFC investment projects in high-risk climates.
21. See www.ppiaf.org/.22. The PPIAF also manages the Private Participation in Infra-
structure Database, which houses data on more than 4,600 infrastructure projects in 137 countries, including the Cen-tral African Republic, Sierra Leone, and Zimbabwe. The data-base has project-level reports on energy, telecommunications, transport, and water and sewage sectors, which allow trend identification in the private infrastructure space.
23. FIAS (2010).24. FIAS implementation expenditures for 2010 totaled $18.5
million.25. Another positive indicator is FIAS’s recent improvements
(from 48 percent in 2008 to 77 percent in 2010) in the World Bank’s own Development Effectiveness ratings.
26. Also in 2010, FIAS launched the Investing across Borders report, which provides objective data on the climate for foreign direct investment in 21 African countries, including Liberia and Sierra Leone. The report presents numerous indicators under the fol-lowing four categories: friendliness to foreign investors (that is, the percent of ownership allowed), ease of starting a foreign busi-ness, ease of accessing industrial land, and complexity and length of the commercial arbitration process. See World Bank (2010b).
27. The only African fragile state without Doing Business cover-age is Somalia.
28. Commission on Growth and Development (2008).29. Over the past decade, the average oil-exporting African fragile
state’s GDP grew at a pace of between 3 and 11 percent, while the average non-oil-exporting African fragile state grew at a pace of –1 to 5 percent (measured on an annual basis).
30. Harris (1999).31. ILO (2011).32. Gelb and Tidrick (2000).33. Everest-Phillips (2008).34. Heritage Foundation (2011). For additional details, see www.
heritage.org/index/.35. Everest-Phillips (2008).36. Timmer (2006).37. Forni and Paba (2002).38. For additional details, see www.enterprisesurveys.org/.
11
Chapter 3
One of the public sector’s primary objectives in assisting the private sector is to relieve constraints that may stifle businesses’ ability to grow, expand employment opportunities, and generate profits. Rec-ognizing this, donor organizations have increased funding over the last decade for private sector development (PSD) diagnostics that help to identify these binding constraints. While there are a num-ber of instruments available, we focus primarily on two World Bank surveys: the Doing Business reports, which provide comprehen-sive assessments on regulatory, financial, and political constraints through a top-down methodology; and the Enterprise Surveys, which gauge firms’ views about business environment constraints.
World Bank Doing Business ReportsDoing Business country (and subnational) reports provide rela-tive and absolute measures of business environment constraints across eight distinct categories, such as the ease and cost of start-ing a new business, enforcing contracts, and trading across bor-ders. The Doing Business methodology scores countries according to both the attractiveness of their current business environment (the number of days it takes to secure an import license) and their
progress toward delivering more private sector–friendly poli-cies (the number of regulatory reforms that have been completed in a given year). Overall, the Doing Business reports, providing the most comprehensive country coverage, are completed on an annual basis — which allows for more dynamic monitoring of busi-ness environment changes and trends.
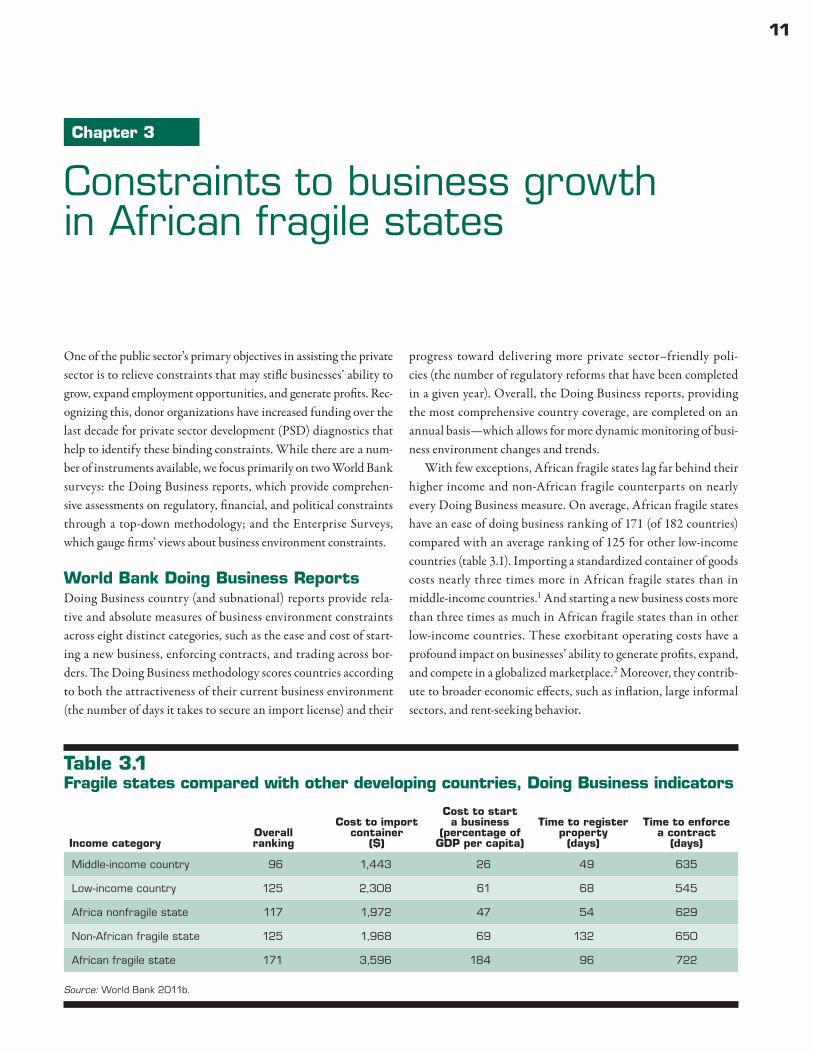
With few exceptions, African fragile states lag far behind their higher income and non-African fragile counterparts on nearly every Doing Business measure. On average, African fragile states have an ease of doing business ranking of 171 (of 182 countries) compared with an average ranking of 125 for other low-income countries (table 3.1). Importing a standardized container of goods costs nearly three times more in African fragile states than in middle- income countries.1 And starting a new business costs more than three times as much in African fragile states than in other low-income countries. These exorbitant operating costs have a profound impact on businesses’ ability to generate profits, expand, and compete in a globalized marketplace.2 Moreover, they contrib-ute to broader economic effects, such as inflation, large informal sectors, and rent-seeking behavior.
Constraints to business growth in African fragile states
Table 3.1 Fragile states compared with other developing countries, Doing Business indicators
Source: World Bank 2011b.
Income categoryOverall ranking
Cost to import container
($)
Cost to start a business
(percentage of GDP per capita)
Time to register property
(days)
Time to enforce a contract
(days)
Middle-income country 96 1,443 26 49 635
Low-income country 125 2,308 61 68 545
Africa nonfragile state 117 1,972 47 54 629
Non-African fragile state 125 1,968 69 132 650
African fragile state 171 3,596 184 96 722
12C
onst
rain
ts t
o busi
nes
s gro
wth
in A
fric
an f
ragile
sta
tes
While Doing Business reports provide a useful assessment of business environment issues, they also omit several factors that impact PSD, such as macroeconomic stability, security, quality of infrastructure, and corruption. As such, they should be used with other diagnostic instruments to identify the most binding con-straints on business growth in African fragile states.
World Bank Enterprise SurveysThe World Bank Enterprise Surveys compile individual firms’ opinions and concerns to assess national and regional business environments. The surveys fill in many of the gaps in the Doing Business reports, such as corruption, physical infrastructure (including transport), crime, informality, competition, and access to finance. Private contractors administer the surveys to firms largely in the manufacturing and service sectors, including con-struction, transport, and information and communication tech-nology. As of mid-2011, World Bank Enterprise Surveys were available for 12 of our sample of 14 African fragile states.3
Despite their significant strengths, World Bank Enterprise Surveys have two key weaknesses. First, they are fairly expensive, time-consuming, and infrequently completed (not annually or according to a clearly defined timetable). So they are not an ideal
instrument for identifying country trends over time. Second, the surveys focus almost exclusively on firms in the formal sector.4 Since the informal sector accounts for the overwhelming major-ity of businesses and employment in low-income countries, enter-prise surveys may not adequately reflect constraints impacting the broader business sector. Even so, while World Bank Enterprise Surveys may have limitations, they remain a very useful tool in gauging firms’ views about major constraints.5
Ramachandran (2010) summarizes in detail the available sur-vey data for African countries, along with analyzing trends between countries and income groups.6 Businesses in the poorest African countries — in which most fragile states are included — tend to cite basic infrastructure deficiencies, access to financing, and lack of macroeconomic stability as the primary constraints to profitability and expansion.7 Other constraints, such as weak governance, low administrative and bureaucratic capacity, and official corruption are cited more frequently in the next highest income tier of Sub-Saha-ran countries (such as Kenya and Senegal). Businesses in the highest income group (such as Gabon and South Africa), on average, cite the lack of job skills and labor regulation as more binding constraints.
Since country fragility is defined according to policy and insti-tutional quality measures, we also examine business constraints
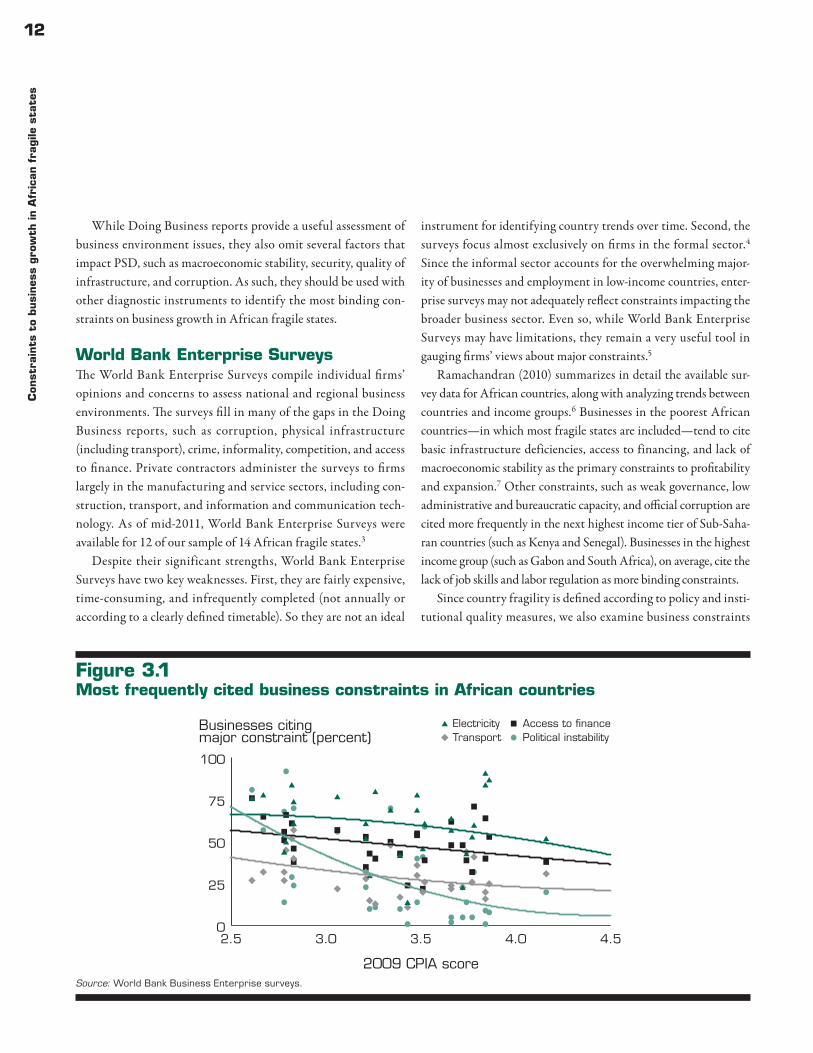
Figure 3.1 Most frequently cited business constraints in African countries
Source: World Bank Business Enterprise surveys.
2.5 3.0 3.5 4.0 4.50
25
50
75
100
Businesses citingmajor constraint (percent)
2009 CPIA score
Electricity Access to financeTransport Political instability
13C
onstra
ints to b
usin
ess grow
th in
African
fragile sta
tes
in relation to IDA Resource Allocation Index (IRAI) scores (as opposed to income per capita levels). Figure 3.1 illustrates sev-eral of the most frequently cited business constraints in African countries — political instability, transport infrastructure, elec-tricity, and access to finance.8 Across the board, the percentage of firms reporting these issues as “major constraints” declines as countries’ IRAI scores increase. Not surprisingly, concerns about political instability decline the most dramatically across our coun-try sample. Nearly twice as many African firms cite concerns about electricity as a “major constraint” compared with concerns about transport infrastructure. And access to finance is also cited more frequently as a “major constraint” than transport infrastructure is.
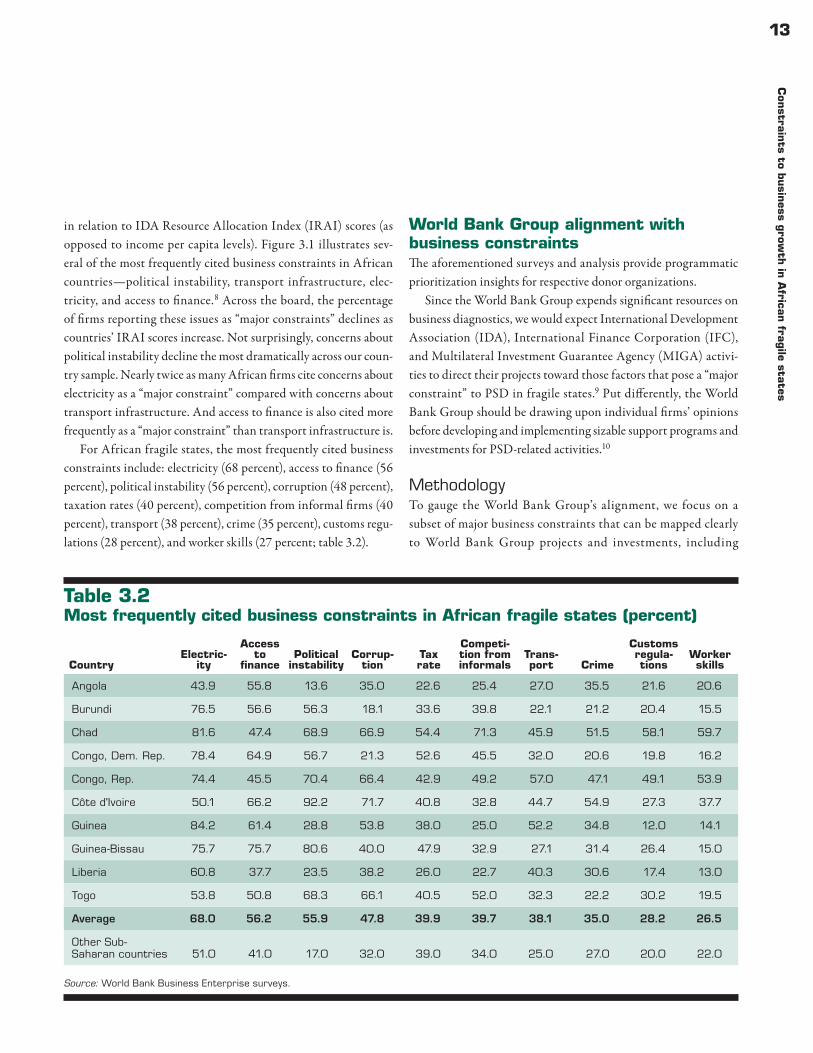
For African fragile states, the most frequently cited business constraints include: electricity (68 percent), access to finance (56 percent), political instability (56 percent), corruption (48 percent), taxation rates (40 percent), competition from informal firms (40 percent), transport (38 percent), crime (35 percent), customs regu-lations (28 percent), and worker skills (27 percent; table 3.2).
World Bank Group alignment with business constraintsThe aforementioned surveys and analysis provide programmatic prioritization insights for respective donor organizations.
Since the World Bank Group expends significant resources on business diagnostics, we would expect International Development Association (IDA), International Finance Corporation (IFC), and Multilateral Investment Guarantee Agency (MIGA) activi-ties to direct their projects toward those factors that pose a “major constraint” to PSD in fragile states.9 Put differently, the World Bank Group should be drawing upon individual firms’ opinions before developing and implementing sizable support programs and investments for PSD-related activities.10
MethodologyTo gauge the World Bank Group’s alignment, we focus on a subset of major business constraints that can be mapped clearly to World Bank Group projects and investments, including
Table 3.2 Most frequently cited business constraints in African fragile states (percent)
Source: World Bank Business Enterprise surveys.
CountryElectric-
ity
Access to
financePolitical
instabilityCorrup-
tionTax rate
Competi-tion from informals
Trans- port Crime
Customs regula-tions
Worker skills
Angola 43.9 55.8 13.6 35.0 22.6 25.4 27.0 35.5 21.6 20.6
Burundi 76.5 56.6 56.3 18.1 33.6 39.8 22.1 21.2 20.4 15.5
Chad 81.6 47.4 68.9 66.9 54.4 71.3 45.9 51.5 58.1 59.7
Congo, Dem. Rep. 78.4 64.9 56.7 21.3 52.6 45.5 32.0 20.6 19.8 16.2
Congo, Rep. 74.4 45.5 70.4 66.4 42.9 49.2 57.0 47.1 49.1 53.9
Côte d'Ivoire 50.1 66.2 92.2 71.7 40.8 32.8 44.7 54.9 27.3 37.7
Guinea 84.2 61.4 28.8 53.8 38.0 25.0 52.2 34.8 12.0 14.1
Guinea-Bissau 75.7 75.7 80.6 40.0 47.9 32.9 27.1 31.4 26.4 15.0
Liberia 60.8 37.7 23.5 38.2 26.0 22.7 40.3 30.6 17.4 13.0
Togo 53.8 50.8 68.3 66.1 40.5 52.0 32.3 22.2 30.2 19.5
Average 68.0 56.2 55.9 47.8 39.9 39.7 38.1 35.0 28.2 26.5
Other Sub-Saharan countries 51.0 41.0 17.0 32.0 39.0 34.0 25.0 27.0 20.0 22.0
14C
onst
rain
ts t
o busi
nes
s gro
wth
in A
fric
an f
ragile
sta
tes
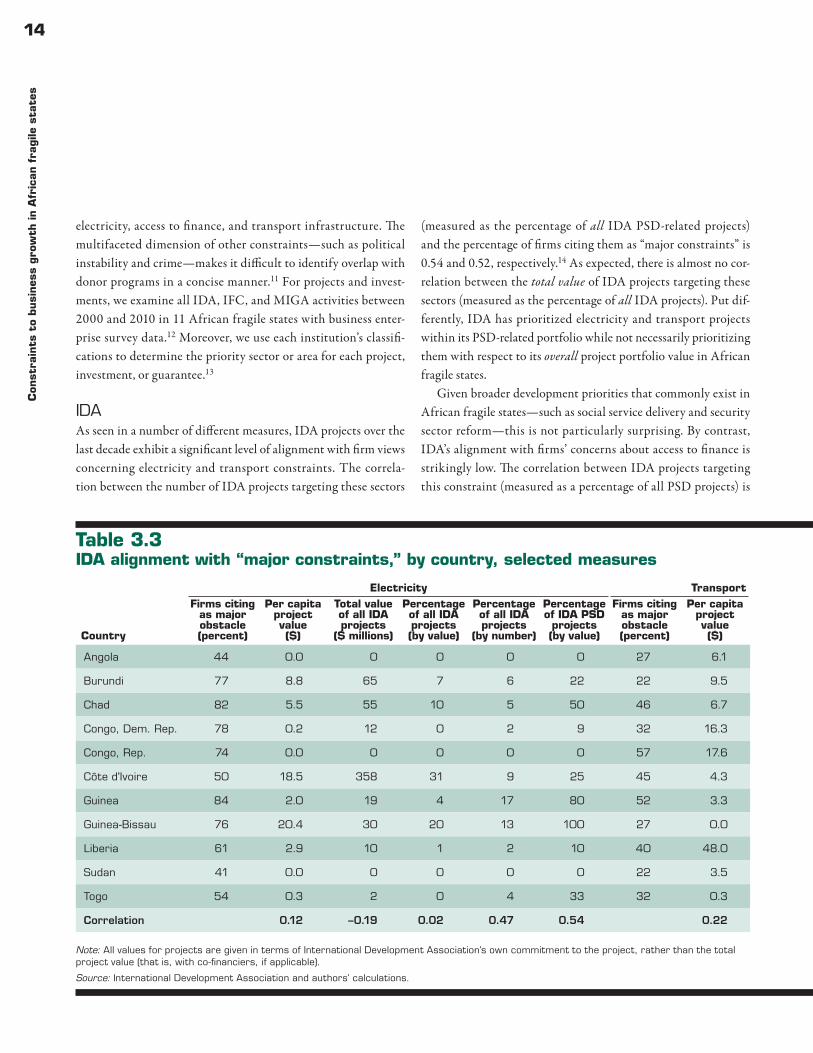
electricity, access to finance, and transport infrastructure. The multifaceted dimension of other constraints — such as political instability and crime — makes it difficult to identify overlap with donor programs in a concise manner.11 For projects and invest-ments, we examine all IDA, IFC, and MIGA activities between 2000 and 2010 in 11 African fragile states with business enter-prise survey data.12 Moreover, we use each institution’s classifi-cations to determine the priority sector or area for each project, investment, or guarantee.13
IDAAs seen in a number of different measures, IDA projects over the last decade exhibit a significant level of alignment with firm views concerning electricity and transport constraints. The correla-tion between the number of IDA projects targeting these sectors
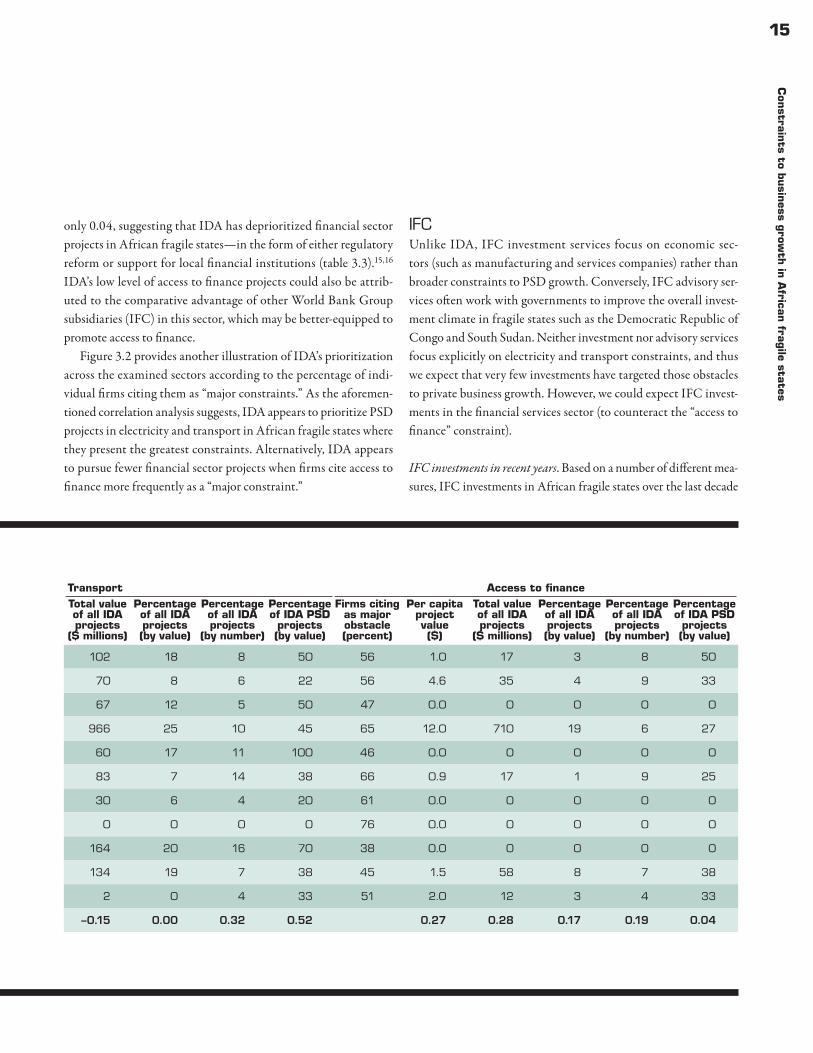
(measured as the percentage of all IDA PSD-related projects) and the percentage of firms citing them as “major constraints” is 0.54 and 0.52, respectively.14 As expected, there is almost no cor-relation between the total value of IDA projects targeting these sectors (measured as the percentage of all IDA projects). Put dif-ferently, IDA has prioritized electricity and transport projects within its PSD-related portfolio while not necessarily prioritizing them with respect to its overall project portfolio value in African fragile states.
Given broader development priorities that commonly exist in African fragile states — such as social service delivery and security sector reform — this is not particularly surprising. By contrast, IDA’s alignment with firms’ concerns about access to finance is strikingly low. The correlation between IDA projects targeting this constraint (measured as a percentage of all PSD projects) is
Table 3.3 IDA alignment with “major constraints,” by country, selected measures
Note: All values for projects are given in terms of International Development Association’s own commitment to the project, rather than the total project value (that is, with co-financiers, if applicable).
Source: International Development Association and authors’ calculations.
Country
Electricity Transport Transport Access to financeFirms citing
as major obstacle (percent)
Per capita project value($)
Total value of all IDA projects
($ millions)
Percentage of all IDA projects (by value)
Percentage of all IDA projects
(by number)
Percentage of IDA PSD
projects (by value)
Firms citing as major obstacle (percent)
Per capita project value($)
Total value of all IDA projects
($ millions)
Percentage of all IDA projects (by value)
Percentage of all IDA projects
(by number)
Percentage of IDA PSD
projects (by value)
Firms citing as major obstacle (percent)
Per capita project value($)
Total value of all IDA projects
($ millions)
Percentage of all IDA projects (by value)
Percentage of all IDA projects
(by number)
Percentage of IDA PSD
projects (by value)
Angola 44 0.0 0 0 0 0 27 6.1 102 18 8 50 56 1.0 17 3 8 50
Burundi 77 8.8 65 7 6 22 22 9.5 70 8 6 22 56 4.6 35 4 9 33
Chad 82 5.5 55 10 5 50 46 6.7 67 12 5 50 47 0.0 0 0 0 0
Congo, Dem. Rep. 78 0.2 12 0 2 9 32 16.3 966 25 10 45 65 12.0 710 19 6 27
Congo, Rep. 74 0.0 0 0 0 0 57 17.6 60 17 11 100 46 0.0 0 0 0 0
Côte d'Ivoire 50 18.5 358 31 9 25 45 4.3 83 7 14 38 66 0.9 17 1 9 25
Guinea 84 2.0 19 4 17 80 52 3.3 30 6 4 20 61 0.0 0 0 0 0
Guinea-Bissau 76 20.4 30 20 13 100 27 0.0 0 0 0 0 76 0.0 0 0 0 0
Liberia 61 2.9 10 1 2 10 40 48.0 164 20 16 70 38 0.0 0 0 0 0
Sudan 41 0.0 0 0 0 0 22 3.5 134 19 7 38 45 1.5 58 8 7 38
Togo 54 0.3 2 0 4 33 32 0.3 2 0 4 33 51 2.0 12 3 4 33
Correlation 0.12 –0.19 0.02 0.47 0.54 0.22 –0.15 0.00 0.32 0.52 0.27 0.28 0.17 0.19 0.04
15C
onstra
ints to b
usin
ess grow
th in
African
fragile sta
tes
only 0.04, suggesting that IDA has deprioritized financial sector projects in African fragile states — in the form of either regulatory reform or support for local financial institutions (table 3.3).15,16 IDA’s low level of access to finance projects could also be attrib-uted to the comparative advantage of other World Bank Group subsidiaries (IFC) in this sector, which may be better-equipped to promote access to finance.
Figure 3.2 provides another illustration of IDA’s prioritization across the examined sectors according to the percentage of indi-vidual firms citing them as “major constraints.” As the aforemen-tioned correlation analysis suggests, IDA appears to prioritize PSD projects in electricity and transport in African fragile states where they present the greatest constraints. Alternatively, IDA appears to pursue fewer financial sector projects when firms cite access to finance more frequently as a “major constraint.”
IFCUnlike IDA, IFC investment services focus on economic sec-tors (such as manufacturing and services companies) rather than broader constraints to PSD growth. Conversely, IFC advisory ser-vices often work with governments to improve the overall invest-ment climate in fragile states such as the Democratic Republic of Congo and South Sudan. Neither investment nor advisory services focus explicitly on electricity and transport constraints, and thus we expect that very few investments have targeted those obstacles to private business growth. However, we could expect IFC invest-ments in the financial services sector (to counteract the “access to finance” constraint).
IFC investments in recent years. Based on a number of different mea-sures, IFC investments in African fragile states over the last decade
Table 3.3 IDA alignment with “major constraints,” by country, selected measures
Note: All values for projects are given in terms of International Development Association’s own commitment to the project, rather than the total project value (that is, with co-financiers, if applicable).
Source: International Development Association and authors’ calculations.
Country
Electricity Transport Transport Access to financeFirms citing
as major obstacle (percent)
Per capita project value($)
Total value of all IDA projects
($ millions)
Percentage of all IDA projects (by value)
Percentage of all IDA projects
(by number)
Percentage of IDA PSD
projects (by value)
Firms citing as major obstacle (percent)
Per capita project value($)
Total value of all IDA projects
($ millions)
Percentage of all IDA projects (by value)
Percentage of all IDA projects
(by number)
Percentage of IDA PSD
projects (by value)
Firms citing as major obstacle (percent)
Per capita project value($)
Total value of all IDA projects
($ millions)
Percentage of all IDA projects (by value)
Percentage of all IDA projects
(by number)
Percentage of IDA PSD
projects (by value)
Angola 44 0.0 0 0 0 0 27 6.1 102 18 8 50 56 1.0 17 3 8 50
Burundi 77 8.8 65 7 6 22 22 9.5 70 8 6 22 56 4.6 35 4 9 33
Chad 82 5.5 55 10 5 50 46 6.7 67 12 5 50 47 0.0 0 0 0 0
Congo, Dem. Rep. 78 0.2 12 0 2 9 32 16.3 966 25 10 45 65 12.0 710 19 6 27
Congo, Rep. 74 0.0 0 0 0 0 57 17.6 60 17 11 100 46 0.0 0 0 0 0
Côte d'Ivoire 50 18.5 358 31 9 25 45 4.3 83 7 14 38 66 0.9 17 1 9 25
Guinea 84 2.0 19 4 17 80 52 3.3 30 6 4 20 61 0.0 0 0 0 0
Guinea-Bissau 76 20.4 30 20 13 100 27 0.0 0 0 0 0 76 0.0 0 0 0 0
Liberia 61 2.9 10 1 2 10 40 48.0 164 20 16 70 38 0.0 0 0 0 0
Sudan 41 0.0 0 0 0 0 22 3.5 134 19 7 38 45 1.5 58 8 7 38
Togo 54 0.3 2 0 4 33 32 0.3 2 0 4 33 51 2.0 12 3 4 33
Correlation 0.12 –0.19 0.02 0.47 0.54 0.22 –0.15 0.00 0.32 0.52 0.27 0.28 0.17 0.19 0.04
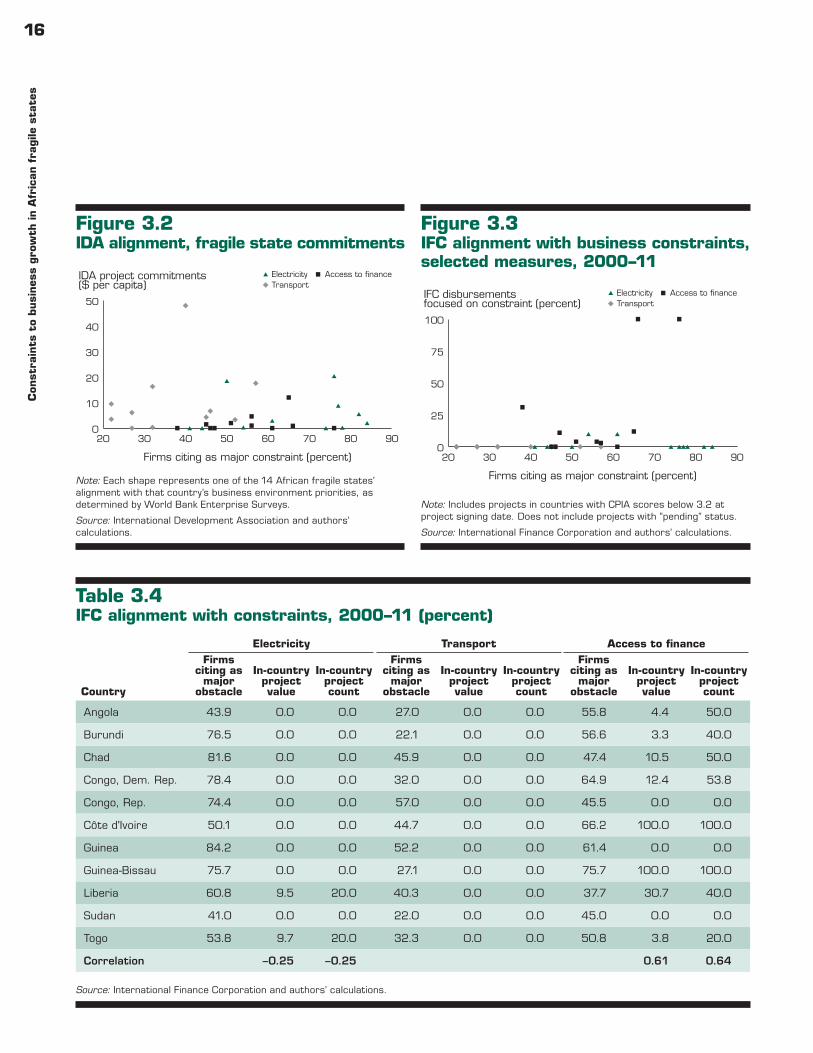
16C
onst
rain
ts t
o busi
nes
s gro
wth
in A
fric
an f
ragile
sta
tes
Figure 3.2 IDA alignment, fragile state commitments
Note: Each shape represents one of the 14 African fragile states’ alignment with that country’s business environment priorities, as determined by World Bank Enterprise Surveys.
Source: International Development Association and authors’ calculations.
20 30 40 50 60 70 80 900
10
20
30
40
50
IDA project commitments($ per capita)
Firms citing as major constraint (percent)
Electricity Access to financeTransport
Figure 3.3 IFC alignment with business constraints, selected measures, 2000–11
Note: Includes projects in countries with CPIA scores below 3.2 at project signing date. Does not include projects with “pending” status.
Source: International Finance Corporation and authors’ calculations.
20 30 40 50 60 70 80 900
25
50
75
100
IFC disbursements focused on constraint (percent)
Firms citing as major constraint (percent)
Electricity Access to financeTransport
Table 3.4 IFC alignment with constraints, 2000–11 (percent)
Source: International Finance Corporation and authors’ calculations.
Country
Electricity Transport Access to financeFirms
citing as major
obstacle
In-country project value
In-country project count
Firms citing as
major obstacle
In-country project value
In-country project count
Firms citing as
major obstacle
In-country project value
In-country project count
Angola 43.9 0.0 0.0 27.0 0.0 0.0 55.8 4.4 50.0
Burundi 76.5 0.0 0.0 22.1 0.0 0.0 56.6 3.3 40.0
Chad 81.6 0.0 0.0 45.9 0.0 0.0 47.4 10.5 50.0
Congo, Dem. Rep. 78.4 0.0 0.0 32.0 0.0 0.0 64.9 12.4 53.8
Congo, Rep. 74.4 0.0 0.0 57.0 0.0 0.0 45.5 0.0 0.0
Côte d'Ivoire 50.1 0.0 0.0 44.7 0.0 0.0 66.2 100.0 100.0
Guinea 84.2 0.0 0.0 52.2 0.0 0.0 61.4 0.0 0.0
Guinea-Bissau 75.7 0.0 0.0 27.1 0.0 0.0 75.7 100.0 100.0
Liberia 60.8 9.5 20.0 40.3 0.0 0.0 37.7 30.7 40.0
Sudan 41.0 0.0 0.0 22.0 0.0 0.0 45.0 0.0 0.0
Togo 53.8 9.7 20.0 32.3 0.0 0.0 50.8 3.8 20.0
Correlation –0.25 –0.25 0.61 0.64
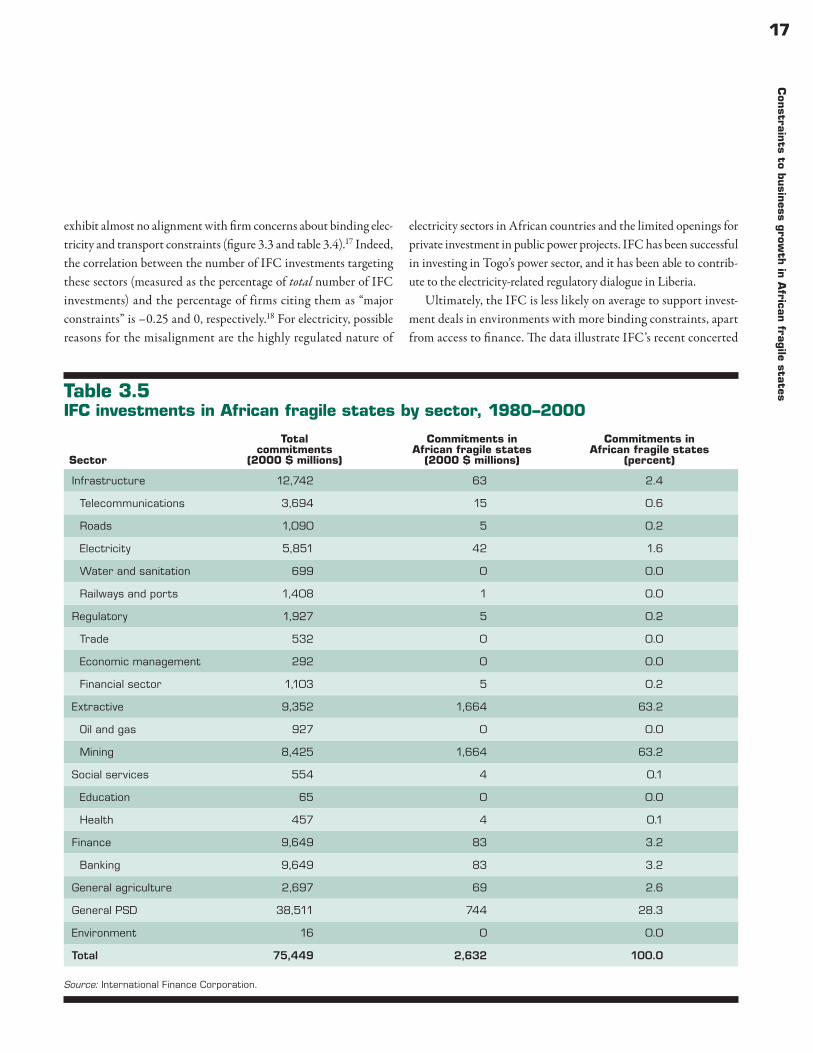
17C
onstra
ints to b
usin
ess grow
th in
African
fragile sta
tes
exhibit almost no alignment with firm concerns about binding elec-tricity and transport constraints (figure 3.3 and table 3.4).17 Indeed, the correlation between the number of IFC investments targeting these sectors (measured as the percentage of total number of IFC investments) and the percentage of firms citing them as “major constraints” is –0.25 and 0, respectively.18 For electricity, possible reasons for the misalignment are the highly regulated nature of
electricity sectors in African countries and the limited openings for private investment in public power projects. IFC has been successful in investing in Togo’s power sector, and it has been able to contrib-ute to the electricity-related regulatory dialogue in Liberia.
Ultimately, the IFC is less likely on average to support invest-ment deals in environments with more binding constraints, apart from access to finance. The data illustrate IFC’s recent concerted
Table 3.5 IFC investments in African fragile states by sector, 1980–2000
Source: International Finance Corporation.
Sector
Total commitments
(2000 $ millions)
Commitments in African fragile states
(2000 $ millions)
Commitments in African fragile states
(percent)
Infrastructure 12,742 63 2.4
Telecommunications 3,694 15 0.6
Roads 1,090 5 0.2
Electricity 5,851 42 1.6
Water and sanitation 699 0 0.0
Railways and ports 1,408 1 0.0
Regulatory 1,927 5 0.2
Trade 532 0 0.0
Economic management 292 0 0.0
Financial sector 1,103 5 0.2
Extractive 9,352 1,664 63.2
Oil and gas 927 0 0.0
Mining 8,425 1,664 63.2
Social services 554 4 0.1
Education 65 0 0.0
Health 457 4 0.1
Finance 9,649 83 3.2
Banking 9,649 83 3.2
General agriculture 2,697 69 2.6
General PSD 38,511 744 28.3
Environment 16 0 0.0
Total 75,449 2,632 100.0
18C
onst
rain
ts t
o busi
nes
s gro
wth
in A
fric
an f
ragile
sta
tes
efforts to target access to finance constraints in several African fragile states, including Côte d’Ivoire and Guinea-Bissau. Recent IFC investments in these two countries are wholly concentrated in finance-related sectors.19 While firm concerns could signify strong market demand opportunities for IFC, the high respondent rates likely also signify regulatory distortions and other market risks that could jeopardize IFC’s financial returns. While these find-ings are striking, they should not be overemphasized given IFC’s historical focus on market sectors (as noted above). IFC alignment with these sectors is explored in chapter 4.
IFC investments before 2000. When we extend our country sample prior to recent years and beyond the 14 current African fragile states, historical IFC investment trends show little focus on constraints such as electricity, roads, and access to finance. Between 1980 and 2000, IFC invested $2.6 billion in all African fragile states that fit our definition of “chronically fragile” states (table 3.5).20 Of this $2.6 billion, 63 percent went to mining proj-ects alone, while just 0.7 percent went to electricity and 0.5 percent to roads. Nineteen banking and finance projects accounted for just 3.2 percent of the total. Assuming that business constraints in African fragile states have remained relatively unchanged over the past few decades, IFC’s investment record does not show a com-mitment toward addressing some of these limitations.21
MIGABetween 2000 and 2010, MIGA provided only one banking sec-tor guarantee in our sample of 14 African fragile states. It did not provide any guarantees to support foreign investments to improve electricity or transport infrastructure networks. As a result, there is no alignment between MIGA activities and firms’ concerns about “major constraints” to growth and profitability. Historical MIGA guarantees mirror this trend when we extend our country sample beyond the 14 current African fragile states. Between 1990 and 2011, MIGA provided guarantees totaling $797 million in African fragile states — of which 27 percent went to telecommunications projects (a low priority for businesses; table 3.6). Also during this time, MIGA guarantees for electricity and roads projects were just 2 percent and 0 percent of total guarantees in African fragile states. However, as with IFC, MIGA has traditionally been focused on market sectors instead of broader PSD-related constraints. MIGA alignment with these sectors is explored in the chapter 4.
ConclusionWhile the World Bank Group has made significant strides in assessing the constraints to business growth in fragile states over the past 10 years, two of its subsidiaries (IFC and MIGA) have not committed significant financial resources to address the most binding business constraints. As noted above, both organi-zations’ business models prioritize financial returns as opposed to development returns. Given this, IFC and MIGA, for vari-ous reasons, have been reluctant, unable, or unwilling to execute investments and guarantees in African fragile states that target the most binding business constraints. By contrast, IDA dis-plays a significant level of alignment with business constraints in African fragile states — with the possible exception of access to finance.
Notes1. This disparity is not driven solely by landlocked status.
Only four of the examined African fragile states are land-locked (Burundi, the Central African Republic, Chad, and Zimbabwe).
2. In general, the World Bank Group’s efforts to improve coun-try business environments are based on the assumption that higher institutional quality will lead to increased business performance. But the literature does not unanimously sup-port this assumption. For instance, Commander and Niko-loski (2010) do not find a statistically significant relationship between many of the Doing Business indicators and actual business and investment performance. Even so, the World Bank’s current initiatives aimed at promoting investment in developing countries place a strong emphasis on business con-straints, such as those determined by Doing Business Surveys.
3. These include Angola, Burundi, Chad, Côte d’Ivoire, the Democratic Republic of Congo, Eritrea, Guinea, Guinea-Bis-sau, Liberia, the Republic of Congo, Sudan, and Togo. How-ever, the Eritrea business enterprise survey is excluded from our analysis due to methodology and quality deficiencies. The World Bank Enterprise Survey team had planned to publish its Zimbabwe survey data in late 2011, but at time of publica-tion had not yet done so.
4. But the World Bank occasionally departs from its standard-ized methodology and surveys informal and micro enterprises as well.
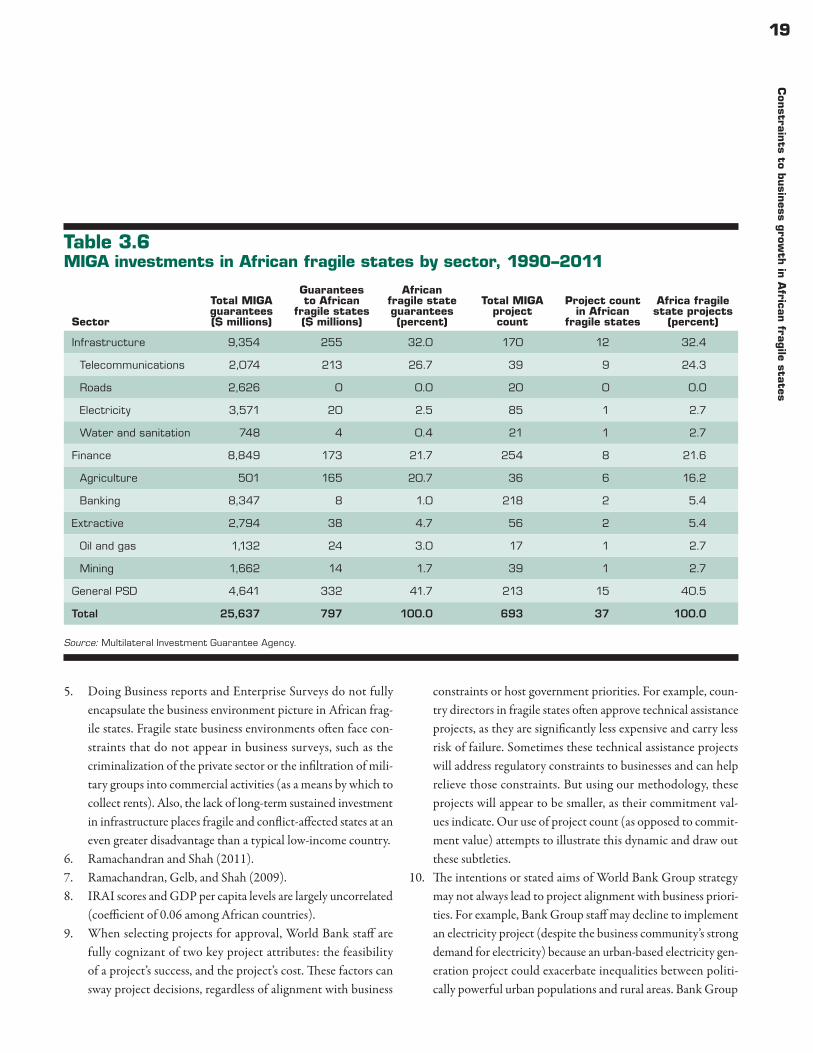
19C
onstra
ints to b
usin
ess grow
th in
African
fragile sta
tes
5. Doing Business reports and Enterprise Surveys do not fully encapsulate the business environment picture in African frag-ile states. Fragile state business environments often face con-straints that do not appear in business surveys, such as the criminalization of the private sector or the infiltration of mili-tary groups into commercial activities (as a means by which to collect rents). Also, the lack of long-term sustained investment in infrastructure places fragile and conflict-affected states at an even greater disadvantage than a typical low-income country.
6. Ramachandran and Shah (2011).7. Ramachandran, Gelb, and Shah (2009).8. IRAI scores and GDP per capita levels are largely uncorrelated
(coefficient of 0.06 among African countries).9. When selecting projects for approval, World Bank staff are
fully cognizant of two key project attributes: the feasibility of a project’s success, and the project’s cost. These factors can sway project decisions, regardless of alignment with business
constraints or host government priorities. For example, coun-try directors in fragile states often approve technical assistance projects, as they are significantly less expensive and carry less risk of failure. Sometimes these technical assistance projects will address regulatory constraints to businesses and can help relieve those constraints. But using our methodology, these projects will appear to be smaller, as their commitment val-ues indicate. Our use of project count (as opposed to commit-ment value) attempts to illustrate this dynamic and draw out these subtleties.
10. The intentions or stated aims of World Bank Group strategy may not always lead to project alignment with business priori-ties. For example, Bank Group staff may decline to implement an electricity project (despite the business community’s strong demand for electricity) because an urban-based electricity gen-eration project could exacerbate inequalities between politi-cally powerful urban populations and rural areas. Bank Group
Table 3.6 MIGA investments in African fragile states by sector, 1990–2011
Source: Multilateral Investment Guarantee Agency.
Sector
Total MIGA guarantees ($ millions)
Guarantees to African
fragile states ($ millions)
African fragile state guarantees (percent)
Total MIGA project count
Project count in African
fragile states
Africa fragile state projects
(percent)
Infrastructure 9,354 255 32.0 170 12 32.4
Telecommunications 2,074 213 26.7 39 9 24.3
Roads 2,626 0 0.0 20 0 0.0
Electricity 3,571 20 2.5 85 1 2.7
Water and sanitation 748 4 0.4 21 1 2.7
Finance 8,849 173 21.7 254 8 21.6
Agriculture 501 165 20.7 36 6 16.2
Banking 8,347 8 1.0 218 2 5.4
Extractive 2,794 38 4.7 56 2 5.4
Oil and gas 1,132 24 3.0 17 1 2.7
Mining 1,662 14 1.7 39 1 2.7
General PSD 4,641 332 41.7 213 15 40.5
Total 25,637 797 100.0 693 37 100.0
20C
onst
rain
ts t
o busi
nes
s gro
wth
in A
fric
an f
ragile
sta
tes
staff may also be unable to implement projects in desired busi-ness areas due to regulatory restrictions and constraints.
11. For example, political instability and crime may have a multi-tude of underlying causes relating to ethnicity, demographic changes, and employment opportunities, as well as factors within governments’ direct control (such as policing, political openness, and transparency).
12. Eritrea is excluded from this analysis due to the poor represen-tational quality of the Business Enterprise survey.
13. For projects with multiple programmatic areas, we use a sec-tor threshold of 50 percent or more of the total project value. By illustration, the $15.4 million Burundi Emergency Energy Project focuses 54 percent of total project funds on power-related investments. As a result, the project would be classified as an electricity sector project.
14. Since individual firms can cite multiple constraints as “major,” these correlations are very high.
15. Up until the late 1980s, IDA regularly extended loans to national development banks and other local financial inter-mediaries. But an influential report by World Bank researcher Fred Levy revealed that many of these loans had poor develop-ment outcomes and that the funds often were not reextended from development banks to local projects. In the wake of the report and its presentation to the World Bank board of direc-tors, the Bank heavily reduced its lending to national develop-ment banks.
16. Smaller correlations between business priorities and IDA-allo-cated funds do not necessarily imply that IDA is uninterested in finance-related projects and/or unwilling to implement them. Other factors are involved in the project design pro-cess, including available technology or resources or the level of expected involvement from other World Bank Group sub-sidiaries (for example, IFC has recently focused more of its projects on improving access to finance).
17. Data for IFC investment projects are taken from its annual reports, accounting for IFC’s final commitment value. Also included are IFC B loans (syndicated loans that are recorded as liabilities on IFC’s books.) Data on IFC advisory projects are included only for projects of more than $2 million, as other advisory projects are not disclosed on a project-by-project basis.
18. IFC, like the other World Bank Group subsidiaries, continues to actively engage in postcrisis and countercyclical spending. As a result, many of the recent IFC commitments are geared toward rehabilitating trade. These trade finance guarantees can artificially inflate the value of IFC investments in both fragile and nonfragile states.
19. Also over the past decade, IFC has invested large amounts of capital in telecommunications projects in fragile states. Accord-ing to our analysis of business enterprise surveys, lack of tele-communication capacity in fragile states is not a major concern for business owners. While IFC arguably has made a significant contribution to the telecommunications sector in several Afri-can fragile states (Burundi, Chad, and the Democratic Repub-lic of Congo), it is impossible to determine whether investment would have flowed into this sector regardless of IFC involve-ment. The telecommunications sector accounts for some of the most profitable projects in Sub-Saharan Africa and many of the continent’s most encouraging success stories. Further, telecom-munications sectors in other fragile states (in which IFC was not involved) still saw rapid growth.
20. This methodology, outlined in chapter 1 and appendix 7, con-siders states to be fragile if they maintain a Country Policy and Institutional Assessment score of below 3.2 for five consecu-tive years leading up to (and including) the project sign date.
21. For this analysis, we assume that business constraints in the most fragile environments have remained fairly stable over time (for example, electricity, transport infrastructure, and access to finance).
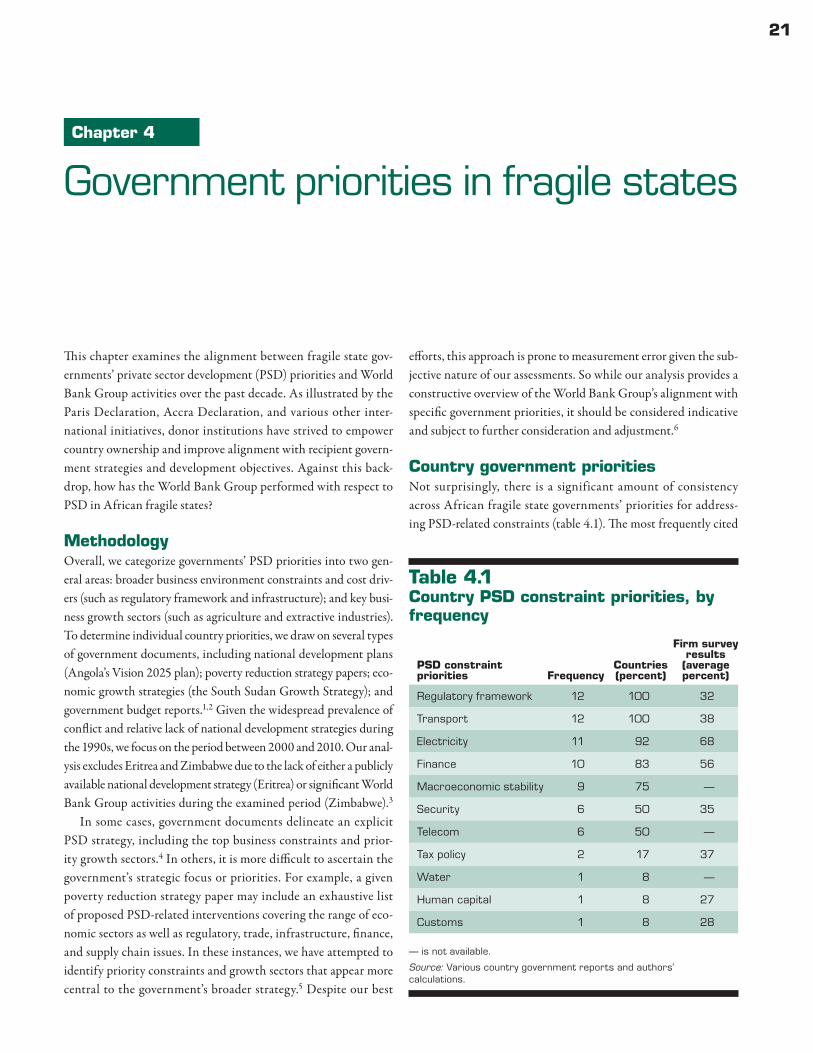
21
Chapter 4
Government priorities in fragile states
This chapter examines the alignment between fragile state gov-ernments’ private sector development (PSD) priorities and World Bank Group activities over the past decade. As illustrated by the Paris Declaration, Accra Declaration, and various other inter-national initiatives, donor institutions have strived to empower country ownership and improve alignment with recipient govern-ment strategies and development objectives. Against this back-drop, how has the World Bank Group performed with respect to PSD in African fragile states?
MethodologyOverall, we categorize governments’ PSD priorities into two gen-eral areas: broader business environment constraints and cost driv-ers (such as regulatory framework and infrastructure); and key busi-ness growth sectors (such as agriculture and extractive industries). To determine individual country priorities, we draw on several types of government documents, including national development plans (Angola’s Vision 2025 plan); poverty reduction strategy papers; eco-nomic growth strategies (the South Sudan Growth Strategy); and government budget reports.1,2 Given the widespread prevalence of conflict and relative lack of national development strategies during the 1990s, we focus on the period between 2000 and 2010. Our anal-ysis excludes Eritrea and Zimbabwe due to the lack of either a publicly available national development strategy (Eritrea) or significant World Bank Group activities during the examined period (Zimbabwe).3
In some cases, government documents delineate an explicit PSD strategy, including the top business constraints and prior-ity growth sectors.4 In others, it is more difficult to ascertain the government’s strategic focus or priorities. For example, a given poverty reduction strategy paper may include an exhaustive list of proposed PSD-related interventions covering the range of eco-nomic sectors as well as regulatory, trade, infrastructure, finance, and supply chain issues. In these instances, we have attempted to identify priority constraints and growth sectors that appear more central to the government’s broader strategy.5 Despite our best
efforts, this approach is prone to measurement error given the sub-jective nature of our assessments. So while our analysis provides a constructive overview of the World Bank Group’s alignment with specific government priorities, it should be considered indicative and subject to further consideration and adjustment.6
Country government prioritiesNot surprisingly, there is a significant amount of consistency across African fragile state governments’ priorities for address-ing PSD-related constraints (table 4.1). The most frequently cited
Table 4.1 Country PSD constraint priorities, by frequency
— is not available.
Source: Various country government reports and authors’ calculations.
PSD constraint priorities Frequency
Countries (percent)
Firm survey results
(average percent)
Regulatory framework 12 100 32
Transport 12 100 38
Electricity 11 92 68
Finance 10 83 56
Macroeconomic stability 9 75 —
Security 6 50 35
Telecom 6 50 —
Tax policy 2 17 37
Water 1 8 —
Human capital 1 8 27
Customs 1 8 28
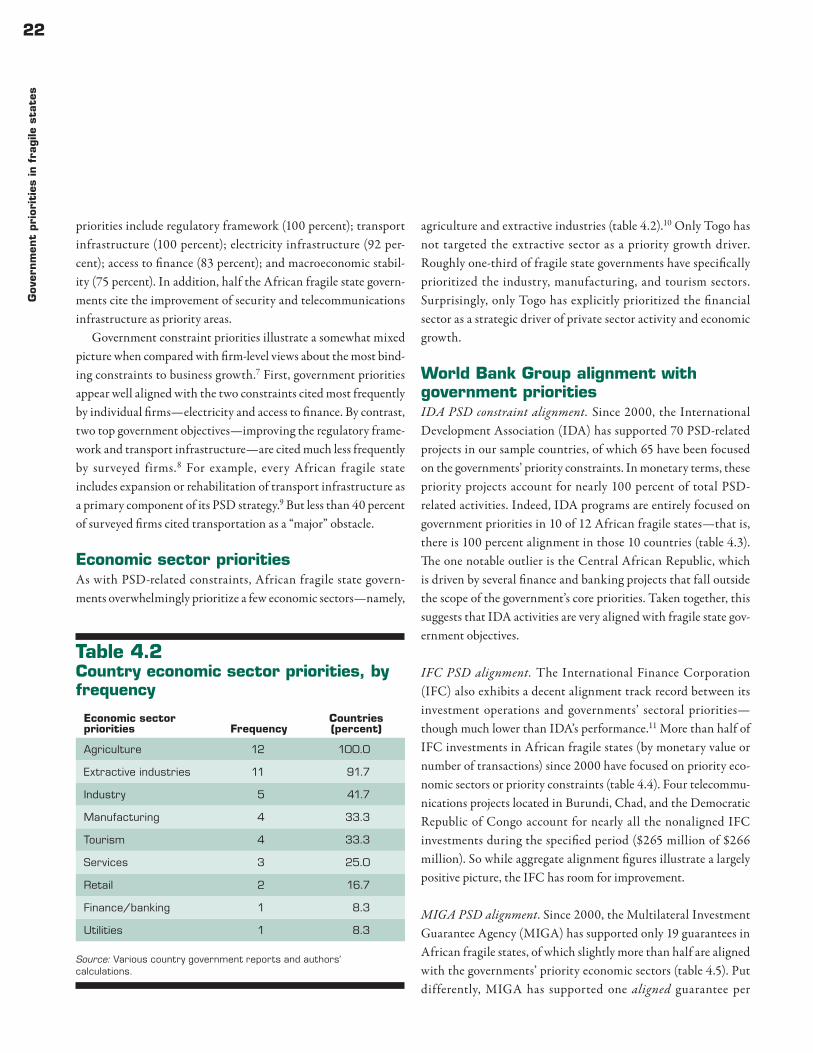
22G
over
nm
ent
pri
orit
ies
in f
ragile
sta
tes
priorities include regulatory framework (100 percent); transport infrastructure (100 percent); electricity infrastructure (92 per-cent); access to finance (83 percent); and macroeconomic stabil-ity (75 percent). In addition, half the African fragile state govern-ments cite the improvement of security and telecommunications infrastructure as priority areas.
Government constraint priorities illustrate a somewhat mixed picture when compared with firm-level views about the most bind-ing constraints to business growth.7 First, government priorities appear well aligned with the two constraints cited most frequently by individual firms — electricity and access to finance. By contrast, two top government objectives — improving the regulatory frame-work and transport infrastructure — are cited much less frequently by surveyed firms.8 For example, every African fragile state includes expansion or rehabilitation of transport infrastructure as a primary component of its PSD strategy.9 But less than 40 percent of surveyed firms cited transportation as a “major” obstacle.
Economic sector prioritiesAs with PSD-related constraints, African fragile state govern-ments overwhelmingly prioritize a few economic sectors — namely,
agriculture and extractive industries (table 4.2).10 Only Togo has not targeted the extractive sector as a priority growth driver. Roughly one-third of fragile state governments have specifically prioritized the industry, manufacturing, and tourism sectors. Surprisingly, only Togo has explicitly prioritized the financial sector as a strategic driver of private sector activity and economic growth.
World Bank Group alignment with government prioritiesIDA PSD constraint alignment. Since 2000, the International Development Association (IDA) has supported 70 PSD-related projects in our sample countries, of which 65 have been focused on the governments’ priority constraints. In monetary terms, these priority projects account for nearly 100 percent of total PSD-related activities. Indeed, IDA programs are entirely focused on government priorities in 10 of 12 African fragile states — that is, there is 100 percent alignment in those 10 countries (table 4.3). The one notable outlier is the Central African Republic, which is driven by several finance and banking projects that fall outside the scope of the government’s core priorities. Taken together, this suggests that IDA activities are very aligned with fragile state gov-ernment objectives.
IFC PSD alignment. The International Finance Corporation (IFC) also exhibits a decent alignment track record between its investment operations and governments’ sectoral priorities — though much lower than IDA’s performance.11 More than half of IFC investments in African fragile states (by monetary value or number of transactions) since 2000 have focused on priority eco-nomic sectors or priority constraints (table 4.4). Four telecommu-nications projects located in Burundi, Chad, and the Democratic Republic of Congo account for nearly all the nonaligned IFC investments during the specified period ($265 million of $266 million). So while aggregate alignment figures illustrate a largely positive picture, the IFC has room for improvement.
MIGA PSD alignment. Since 2000, the Multilateral Investment Guarantee Agency (MIGA) has supported only 19 guarantees in African fragile states, of which slightly more than half are aligned with the governments’ priority economic sectors (table 4.5). Put differently, MIGA has supported one aligned guarantee per
Table 4.2 Country economic sector priorities, by frequency
Source: Various country government reports and authors’ calculations.
Economic sector priorities Frequency
Countries (percent)
Agriculture 12 100.0
Extractive industries 11 91.7
Industry 5 41.7
Manufacturing 4 33.3
Tourism 4 33.3
Services 3 25.0
Retail 2 16.7
Finance/banking 1 8.3
Utilities 1 8.3
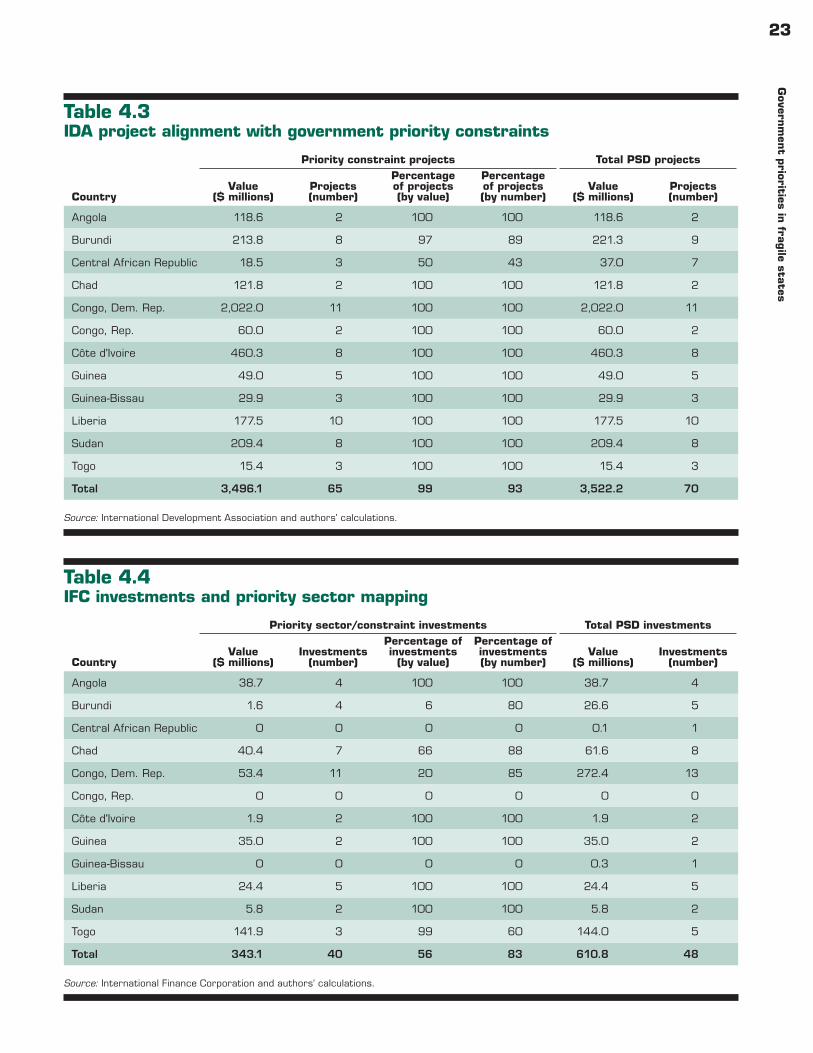
23G
overnm
ent p
riorities in fra
gile sta
tes
Table 4.3 IDA project alignment with government priority constraints
Source: International Development Association and authors’ calculations.
Country
Priority constraint projects Total PSD projects
Value ($ millions)
Projects (number)
Percentage of projects (by value)
Percentage of projects (by number)
Value ($ millions)
Projects (number)
Angola 118.6 2 100 100 118.6 2
Burundi 213.8 8 97 89 221.3 9
Central African Republic 18.5 3 50 43 37.0 7
Chad 121.8 2 100 100 121.8 2
Congo, Dem. Rep. 2,022.0 11 100 100 2,022.0 11
Congo, Rep. 60.0 2 100 100 60.0 2
Côte d'Ivoire 460.3 8 100 100 460.3 8
Guinea 49.0 5 100 100 49.0 5
Guinea-Bissau 29.9 3 100 100 29.9 3
Liberia 177.5 10 100 100 177.5 10
Sudan 209.4 8 100 100 209.4 8
Togo 15.4 3 100 100 15.4 3
Total 3,496.1 65 99 93 3,522.2 70
Table 4.4 IFC investments and priority sector mapping
Source: International Finance Corporation and authors’ calculations.
Country
Priority sector/constraint investments Total PSD investments
Value ($ millions)
Investments (number)
Percentage of investments
(by value)
Percentage of investments (by number)
Value ($ millions)
Investments (number)
Angola 38.7 4 100 100 38.7 4
Burundi 1.6 4 6 80 26.6 5
Central African Republic 0 0 0 0 0.1 1
Chad 40.4 7 66 88 61.6 8
Congo, Dem. Rep. 53.4 11 20 85 272.4 13
Congo, Rep. 0 0 0 0 0 0
Côte d'Ivoire 1.9 2 100 100 1.9 2
Guinea 35.0 2 100 100 35.0 2
Guinea-Bissau 0 0 0 0 0.3 1
Liberia 24.4 5 100 100 24.4 5
Sudan 5.8 2 100 100 5.8 2
Togo 141.9 3 99 60 144.0 5
Total 343.1 40 56 83 610.8 48
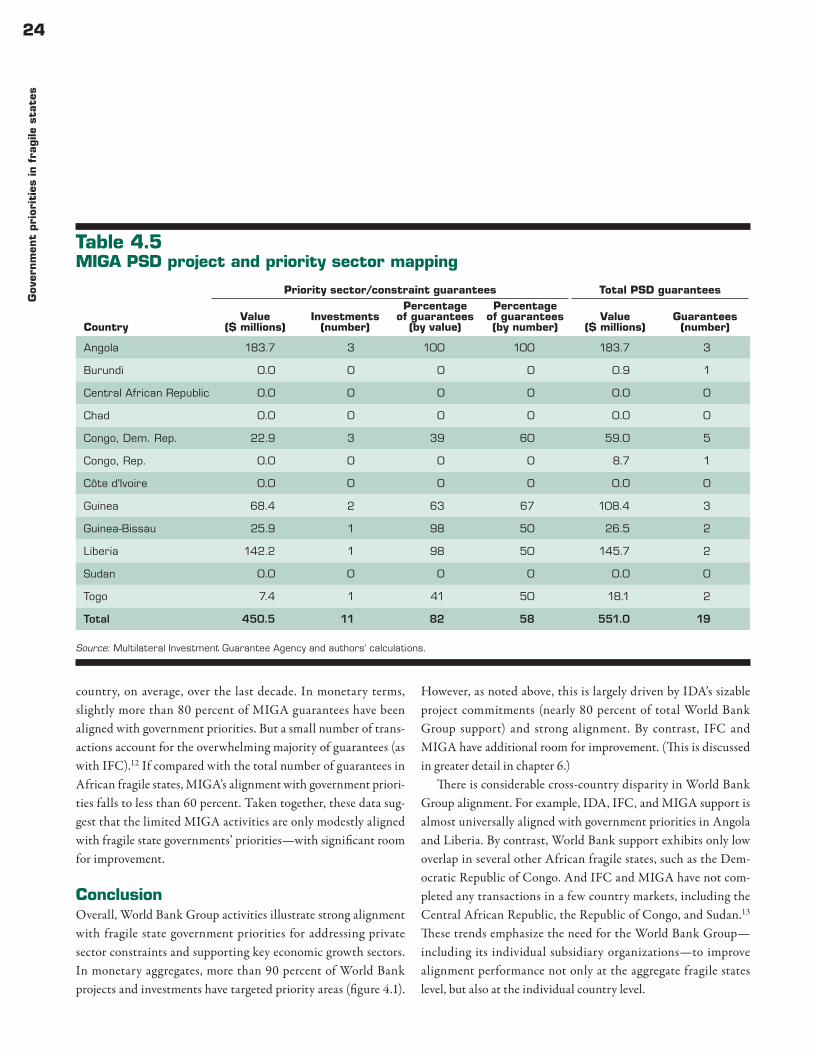
24G
over
nm
ent
pri
orit
ies
in f
ragile
sta
tes
country, on average, over the last decade. In monetary terms, slightly more than 80 percent of MIGA guarantees have been aligned with government priorities. But a small number of trans-actions account for the overwhelming majority of guarantees (as with IFC).12 If compared with the total number of guarantees in African fragile states, MIGA’s alignment with government priori-ties falls to less than 60 percent. Taken together, these data sug-gest that the limited MIGA activities are only modestly aligned with fragile state governments’ priorities — with significant room for improvement.
ConclusionOverall, World Bank Group activities illustrate strong alignment with fragile state government priorities for addressing private sector constraints and supporting key economic growth sectors. In monetary aggregates, more than 90 percent of World Bank projects and investments have targeted priority areas (figure 4.1).
However, as noted above, this is largely driven by IDA’s sizable project commitments (nearly 80 percent of total World Bank Group support) and strong alignment. By contrast, IFC and MIGA have additional room for improvement. (This is discussed in greater detail in chapter 6.)
There is considerable cross-country disparity in World Bank Group alignment. For example, IDA, IFC, and MIGA support is almost universally aligned with government priorities in Angola and Liberia. By contrast, World Bank support exhibits only low overlap in several other African fragile states, such as the Dem-ocratic Republic of Congo. And IFC and MIGA have not com-pleted any transactions in a few country markets, including the Central African Republic, the Republic of Congo, and Sudan.13 These trends emphasize the need for the World Bank Group — including its individual subsidiary organizations — to improve alignment performance not only at the aggregate fragile states level, but also at the individual country level.
Table 4.5 MIGA PSD project and priority sector mapping
Source: Multilateral Investment Guarantee Agency and authors’ calculations.
Country
Priority sector/constraint guarantees Total PSD guarantees
Value ($ millions)
Investments (number)
Percentage of guarantees
(by value)
Percentage of guarantees (by number)
Value ($ millions)
Guarantees (number)
Angola 183.7 3 100 100 183.7 3
Burundi 0.0 0 0 0 0.9 1
Central African Republic 0.0 0 0 0 0.0 0
Chad 0.0 0 0 0 0.0 0
Congo, Dem. Rep. 22.9 3 39 60 59.0 5
Congo, Rep. 0.0 0 0 0 8.7 1
Côte d'Ivoire 0.0 0 0 0 0.0 0
Guinea 68.4 2 63 67 108.4 3
Guinea-Bissau 25.9 1 98 50 26.5 2
Liberia 142.2 1 98 50 145.7 2
Sudan 0.0 0 0 0 0.0 0
Togo 7.4 1 41 50 18.1 2
Total 450.5 11 82 58 551.0 19
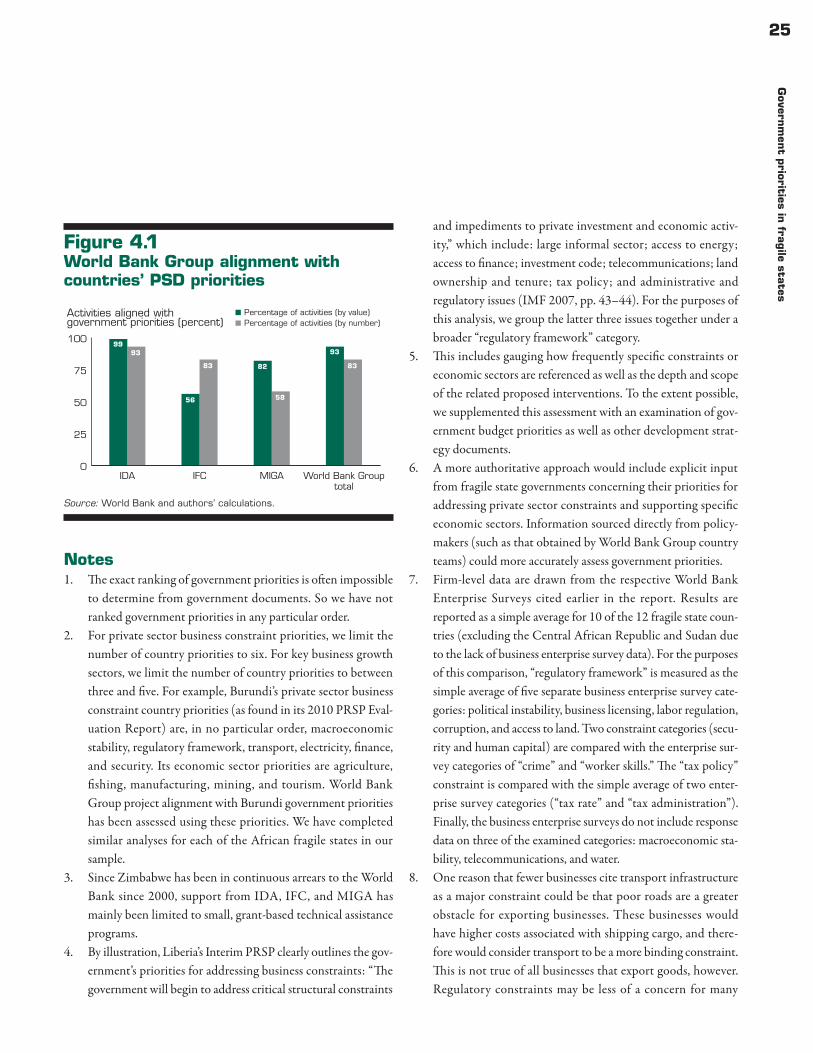
25G
overnm
ent p
riorities in fra
gile sta
tes
Notes1. The exact ranking of government priorities is often impossible
to determine from government documents. So we have not ranked government priorities in any particular order.
2. For private sector business constraint priorities, we limit the number of country priorities to six. For key business growth sectors, we limit the number of country priorities to between three and five. For example, Burundi’s private sector business constraint country priorities (as found in its 2010 PRSP Eval-uation Report) are, in no particular order, macroeconomic stability, regulatory framework, transport, electricity, finance, and security. Its economic sector priorities are agriculture, fishing, manufacturing, mining, and tourism. World Bank Group project alignment with Burundi government priorities has been assessed using these priorities. We have completed similar analyses for each of the African fragile states in our sample.
3. Since Zimbabwe has been in continuous arrears to the World Bank since 2000, support from IDA, IFC, and MIGA has mainly been limited to small, grant-based technical assistance programs.
4. By illustration, Liberia’s Interim PRSP clearly outlines the gov-ernment’s priorities for addressing business constraints: “The government will begin to address critical structural constraints
and impediments to private investment and economic activ-ity,” which include: large informal sector; access to energy; access to finance; investment code; telecommunications; land ownership and tenure; tax policy; and administrative and regulatory issues (IMF 2007, pp. 43–44). For the purposes of this analysis, we group the latter three issues together under a broader “regulatory framework” category.
5. This includes gauging how frequently specific constraints or economic sectors are referenced as well as the depth and scope of the related proposed interventions. To the extent possible, we supplemented this assessment with an examination of gov-ernment budget priorities as well as other development strat-egy documents.
6. A more authoritative approach would include explicit input from fragile state governments concerning their priorities for addressing private sector constraints and supporting specific economic sectors. Information sourced directly from policy-makers (such as that obtained by World Bank Group country teams) could more accurately assess government priorities.
7. Firm-level data are drawn from the respective World Bank Enterprise Surveys cited earlier in the report. Results are reported as a simple average for 10 of the 12 fragile state coun-tries (excluding the Central African Republic and Sudan due to the lack of business enterprise survey data). For the purposes of this comparison, “regulatory framework” is measured as the simple average of five separate business enterprise survey cate-gories: political instability, business licensing, labor regulation, corruption, and access to land. Two constraint categories (secu-rity and human capital) are compared with the enterprise sur-vey categories of “crime” and “worker skills.” The “tax policy” constraint is compared with the simple average of two enter-prise survey categories (“tax rate” and “tax administration”). Finally, the business enterprise surveys do not include response data on three of the examined categories: macroeconomic sta-bility, telecommunications, and water.
8. One reason that fewer businesses cite transport infrastructure as a major constraint could be that poor roads are a greater obstacle for exporting businesses. These businesses would have higher costs associated with shipping cargo, and there-fore would consider transport to be a more binding constraint. This is not true of all businesses that export goods, however. Regulatory constraints may be less of a concern for many
Figure 4.1 World Bank Group alignment with countries’ PSD priorities
Source: World Bank and authors’ calculations.
0
25
50
75
100
World Bank Grouptotal
MIGAIFCIDA
Activities aligned with government priorities (percent)
Percentage of activities (by value)Percentage of activities (by number)
93
82
56
99
83
58
83
93
26G
over
nm
ent
pri
orit
ies
in f
ragile
sta
tes
businesses because less-complex regulations could lead to increased competition — something that might be undesirable for firms that are already in operation.
9. The Liberian government’s emphasis on transportation infra-structure is examined in greater detail below.
10. See appendix 10 for country-specific information.11. Additional analysis of the overlap between IFC advisory
services and governments’ priorities about private sector
constraints (such as business climate issues) would be worth-while. But project-level data are not publicly available.
12. Three projects in Côte d’Ivoire, Angola, and Guinea account for more than 83 percent of all MIGA projects in our sample of 14 countries.
13. Several of these countries, such as Sudan, had World Bank Group arrears during this period, which explains IFC’s lack of engagement.
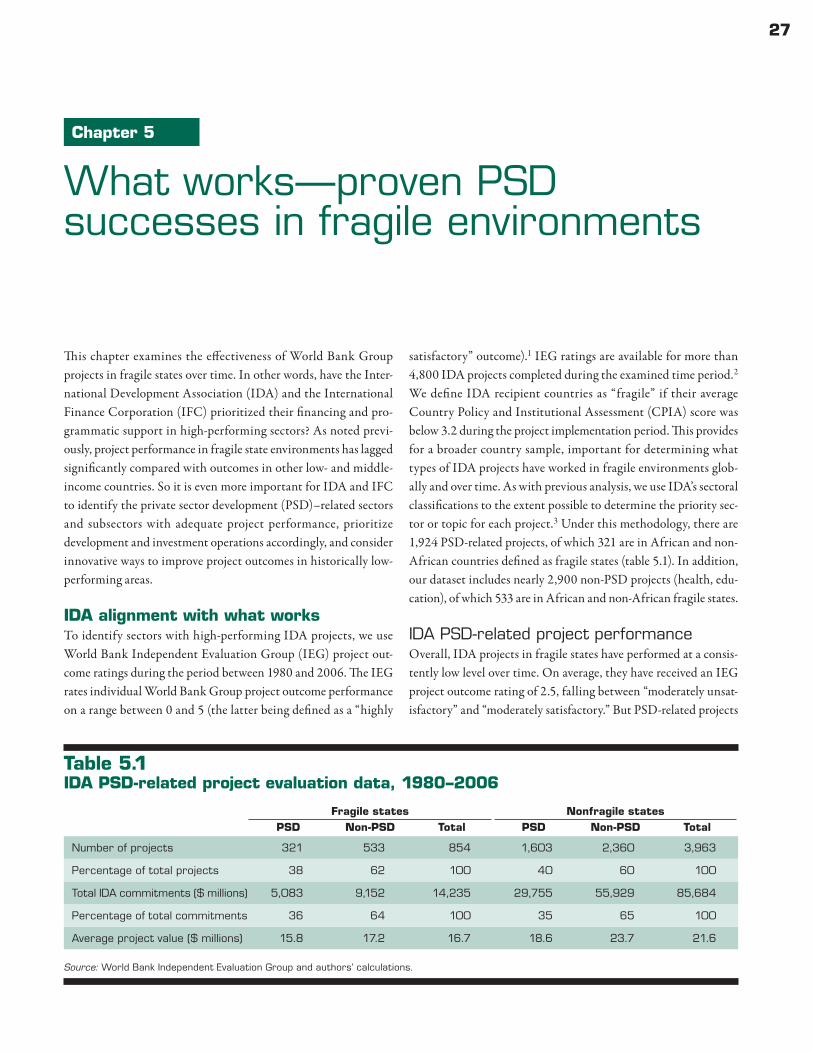
27
This chapter examines the effectiveness of World Bank Group projects in fragile states over time. In other words, have the Inter-national Development Association (IDA) and the International Finance Corporation (IFC) prioritized their financing and pro-grammatic support in high-performing sectors? As noted previ-ously, project performance in fragile state environments has lagged significantly compared with outcomes in other low- and middle- income countries. So it is even more important for IDA and IFC to identify the private sector development (PSD)–related sectors and subsectors with adequate project performance, prioritize development and investment operations accordingly, and consider innovative ways to improve project outcomes in historically low-performing areas.
IDA alignment with what worksTo identify sectors with high-performing IDA projects, we use World Bank Independent Evaluation Group (IEG) project out-come ratings during the period between 1980 and 2006. The IEG rates individual World Bank Group project outcome performance on a range between 0 and 5 (the latter being defined as a “highly
satisfactory” outcome).1 IEG ratings are available for more than 4,800 IDA projects completed during the examined time period.2 We define IDA recipient countries as “fragile” if their average Country Policy and Institutional Assessment (CPIA) score was below 3.2 during the project implementation period. This provides for a broader country sample, important for determining what types of IDA projects have worked in fragile environments glob-ally and over time. As with previous analysis, we use IDA’s sectoral classifications to the extent possible to determine the priority sec-tor or topic for each project.3 Under this methodology, there are 1,924 PSD-related projects, of which 321 are in African and non-African countries defined as fragile states (table 5.1). In addition, our dataset includes nearly 2,900 non-PSD projects (health, edu-cation), of which 533 are in African and non-African fragile states.
IDA PSD-related project performanceOverall, IDA projects in fragile states have performed at a consis-tently low level over time. On average, they have received an IEG project outcome rating of 2.5, falling between “moderately unsat-isfactory” and “moderately satisfactory.” But PSD-related projects
Chapter 5
What works — proven PSD successes in fragile environments
Table 5.1 IDA PSD-related project evaluation data, 1980–2006
Source: World Bank Independent Evaluation Group and authors’ calculations.
Fragile states Nonfragile statesPSD Non-PSD Total PSD Non-PSD Total
Number of projects 321 533 854 1,603 2,360 3,963
Percentage of total projects 38 62 100 40 60 100
Total IDA commitments ($ millions) 5,083 9,152 14,235 29,755 55,929 85,684
Percentage of total commitments 36 64 100 35 65 100
Average project value ($ millions) 15.8 17.2 16.7 18.6 23.7 21.6

28W
hat
wor
ks —
pro
ven P
SD
succ
esse
s in
fra
gile
envi
ronm
ents
in fragile states have performed at a slightly higher level when com-pared with non-PSD–related projects, with an average IEG rating of 2.60 versus 2.43. The same is true for nonfragile states as well (3.23 versus 3.16). Within PSD-related areas, extractive industry
and regulatory reform projects have produced the best outcomes, followed by infrastructure (table 5.2). Financial sector and gen-eral PSD (that is, multisector) projects have produced the lowest outcome scores on average. Compared with nonfragile states, the
Table 5.2 IDA project outcome ratings by PSD-related sector, 1980–2006
Note: Several sectors have very low project counts, which can skew their average ratings. Further, the averages here do not capture the country-specific information contained in the project evaluations. When making project decisions in fragile states, the World Bank should consider both fragile states aggregates and country-specific evaluations.
Source: World Bank Independent Evaluation Group and authors’ calculations.
PSD sector
Fragile states Nonfragile statesAverage IEG
outcome rating
Number of projects
Percentage of all PSD projects
Commit-ments
($ million)
Average IEG outcome rating
Number of projects
Percentage of all PSD projects
Commit-ments
($ million)
Infrastructure 2.6 156 49 3,155 3.4 810 51 14,352
Telecommunications 3.3 14 4 172 3.6 57 4 827
Roads 2.9 79 25 1,635 3.5 336 21 7,623
Electricity 2.4 44 14 920 3.1 310 19 4,951
Railways 2.0 5 2 134 3.1 52 3 640
Ports 1.6 14 4 294 3.7 55 3 311
Regulatory 2.7 45 14 714 3.2 229 14 6,706
Legal system 3.6 5 2 21 2.9 16 1 115
General industry 3.5 6 2 80 3.6 20 1 449
Trade 2.8 6 2 11 3.3 48 3 1,243
Economic management 2.5 19 6 312 3.2 45 3 1,957
Financial sector 2.0 9 3 290 3.1 100 6 2,943
Finance 2.2 26 8 254 3.0 177 11 3,222
Agriculture 2.4 13 4 131 3.0 80 5 1,489
Banking 1.7 3 1 21 3.2 19 1 275
Micro, small, and medium enterprise
1.9 8 2 52 2.9 77 5 1,447
Extractive 3.0 48 15 340 3.3 161 10 1,365
Oil and gas 3.2 37 12 283 3.4 111 7 1,028
Mining 2.3 11 3 58 3.0 50 3 337
General PSD 2.2 46 14 620 2.9 226 14 4,111
Total 2.6 321 100 5,083 3.2 1,603 100 29,755
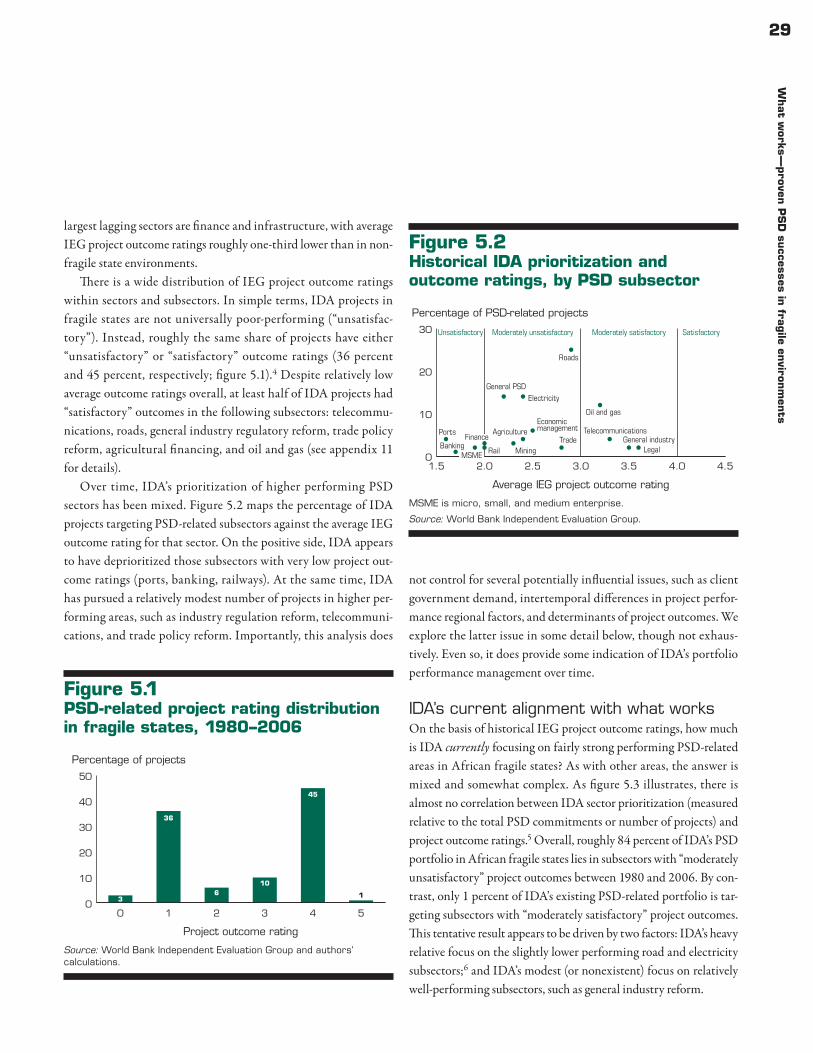
29W
hat w
orks — proven
PS
D su
ccesses in fra
gile en
vironm
ents
largest lagging sectors are finance and infrastructure, with average IEG project outcome ratings roughly one-third lower than in non-fragile state environments.
There is a wide distribution of IEG project outcome ratings within sectors and subsectors. In simple terms, IDA projects in fragile states are not universally poor-performing (“unsatisfac-tory”). Instead, roughly the same share of projects have either “unsatisfactory” or “satisfactory” outcome ratings (36 percent and 45 percent, respectively; figure 5.1).4 Despite relatively low average outcome ratings overall, at least half of IDA projects had “satisfactory” outcomes in the following subsectors: telecommu-nications, roads, general industry regulatory reform, trade policy reform, agricultural financing, and oil and gas (see appendix 11 for details).
Over time, IDA’s prioritization of higher performing PSD sectors has been mixed. Figure 5.2 maps the percentage of IDA projects targeting PSD-related subsectors against the average IEG outcome rating for that sector. On the positive side, IDA appears to have deprioritized those subsectors with very low project out-come ratings (ports, banking, railways). At the same time, IDA has pursued a relatively modest number of projects in higher per-forming areas, such as industry regulation reform, telecommuni-cations, and trade policy reform. Importantly, this analysis does
not control for several potentially influential issues, such as client government demand, intertemporal differences in project perfor-mance regional factors, and determinants of project outcomes. We explore the latter issue in some detail below, though not exhaus-tively. Even so, it does provide some indication of IDA’s portfolio performance management over time.
IDA’s current alignment with what worksOn the basis of historical IEG project outcome ratings, how much is IDA currently focusing on fairly strong performing PSD-related areas in African fragile states? As with other areas, the answer is mixed and somewhat complex. As figure 5.3 illustrates, there is almost no correlation between IDA sector prioritization (measured relative to the total PSD commitments or number of projects) and project outcome ratings.5 Overall, roughly 84 percent of IDA’s PSD portfolio in African fragile states lies in subsectors with “moderately unsatisfactory” project outcomes between 1980 and 2006. By con-trast, only 1 percent of IDA’s existing PSD-related portfolio is tar-geting subsectors with “moderately satisfactory” project outcomes. This tentative result appears to be driven by two factors: IDA’s heavy relative focus on the slightly lower performing road and electricity subsectors;6 and IDA’s modest (or nonexistent) focus on relatively well-performing subsectors, such as general industry reform.
Figure 5.1 PSD-related project rating distribution in fragile states, 1980–2006
Source: World Bank Independent Evaluation Group and authors’ calculations.
0
10
20
30
40
50
543210
Percentage of projects
Project outcome rating
1
45
106
36
3
Figure 5.2 Historical IDA prioritization and outcome ratings, by PSD subsector
MSME is micro, small, and medium enterprise.
Source: World Bank Independent Evaluation Group.
Percentage of PSD-related projects
Average IEG project outcome rating
Unsatisfactory Moderately unsatisfactory Moderately satisfactory Satisfactory
Roads
Oil and gas
TelecommunicationsGeneral industry
LegalTrade
MiningRailBanking
Ports Agriculture
Electricity
Economicmanagement
General PSD
1.5 2.0 2.5 3.0 3.5 4.0 4.5
Finance
0
10
20
30
MSME
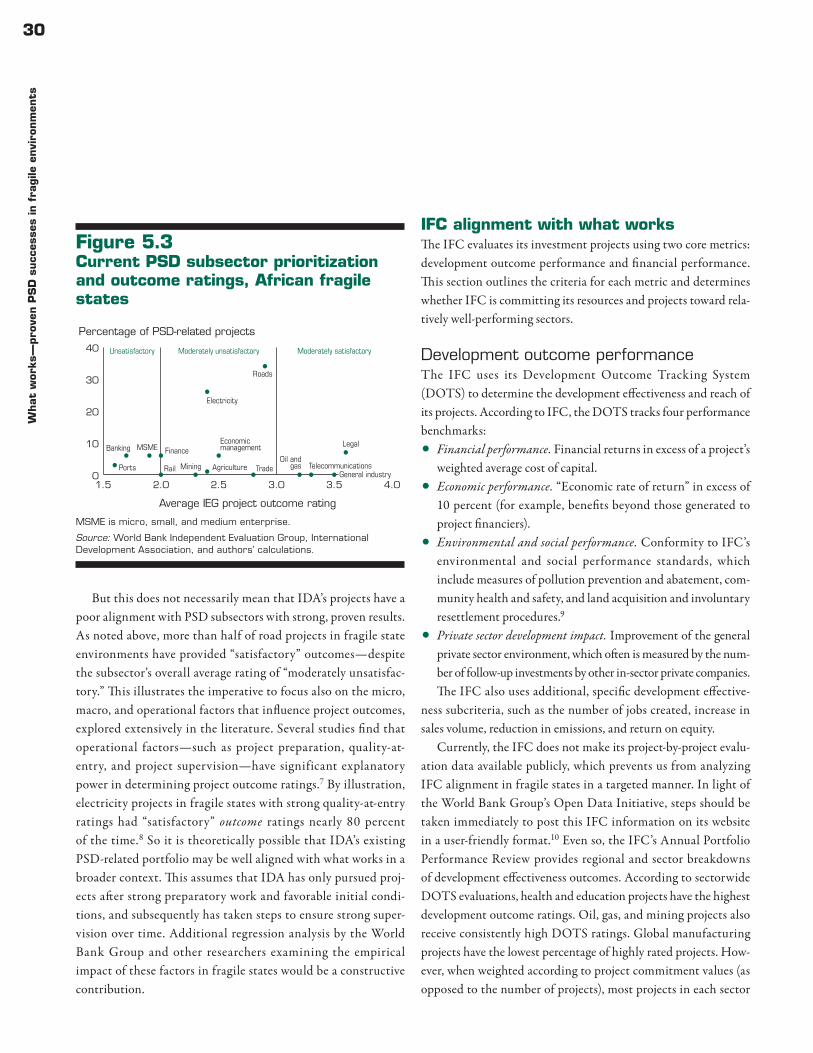
30W
hat
wor
ks —
pro
ven P
SD
succ
esse
s in
fra
gile
envi
ronm
ents
But this does not necessarily mean that IDA’s projects have a poor alignment with PSD subsectors with strong, proven results. As noted above, more than half of road projects in fragile state environments have provided “satisfactory” outcomes — despite the subsector’s overall average rating of “moderately unsatisfac-tory.” This illustrates the imperative to focus also on the micro, macro, and operational factors that influence project outcomes, explored extensively in the literature. Several studies find that operational factors — such as project preparation, quality-at-entry, and project supervision — have significant explanatory power in determining project outcome ratings.7 By illustration, electricity projects in fragile states with strong quality-at-entry ratings had “satisfactory” outcome ratings nearly 80 percent of the time.8 So it is theoretically possible that IDA’s existing PSD-related portfolio may be well aligned with what works in a broader context. This assumes that IDA has only pursued proj-ects after strong preparatory work and favorable initial condi-tions, and subsequently has taken steps to ensure strong super-vision over time. Additional regression analysis by the World Bank Group and other researchers examining the empirical impact of these factors in fragile states would be a constructive contribution.
IFC alignment with what worksThe IFC evaluates its investment projects using two core metrics: development outcome performance and financial performance. This section outlines the criteria for each metric and determines whether IFC is committing its resources and projects toward rela-tively well-performing sectors.
Development outcome performanceThe IFC uses its Development Outcome Tracking System (DOTS) to determine the development effectiveness and reach of its projects. According to IFC, the DOTS tracks four performance benchmarks:•Financial performance. Financial returns in excess of a project’s
weighted average cost of capital.•Economic performance. “Economic rate of return” in excess of
10 percent (for example, benefits beyond those generated to project financiers).
•Environmental and social performance. Conformity to IFC’s environmental and social performance standards, which include measures of pollution prevention and abatement, com-munity health and safety, and land acquisition and involuntary resettlement procedures.9
•Private sector development impact. Improvement of the general private sector environment, which often is measured by the num-ber of follow-up investments by other in-sector private companies.The IFC also uses additional, specific development effective-
ness subcriteria, such as the number of jobs created, increase in sales volume, reduction in emissions, and return on equity.
Currently, the IFC does not make its project-by-project evalu-ation data available publicly, which prevents us from analyzing IFC alignment in fragile states in a targeted manner. In light of the World Bank Group’s Open Data Initiative, steps should be taken immediately to post this IFC information on its website in a user-friendly format.10 Even so, the IFC’s Annual Portfolio Performance Review provides regional and sector breakdowns of development effectiveness outcomes. According to sectorwide DOTS evaluations, health and education projects have the highest development outcome ratings. Oil, gas, and mining projects also receive consistently high DOTS ratings. Global manufacturing projects have the lowest percentage of highly rated projects. How-ever, when weighted according to project commitment values (as opposed to the number of projects), most projects in each sector
Figure 5.3 Current PSD subsector prioritization and outcome ratings, African fragile states
MSME is micro, small, and medium enterprise.
Source: World Bank Independent Evaluation Group, International Development Association, and authors’ calculations.
0
10
20
30
40
1.5 2.0 2.5 3.0 3.5 4.0
Percentage of PSD-related projects
Average IEG project outcome rating
Unsatisfactory Moderately unsatisfactory Moderately satisfactory
Roads
Oil andgas Telecommunications
Legal
TradeMiningRail
Banking
Ports Agriculture
Electricity
EconomicmanagementFinanceMSME
General industry
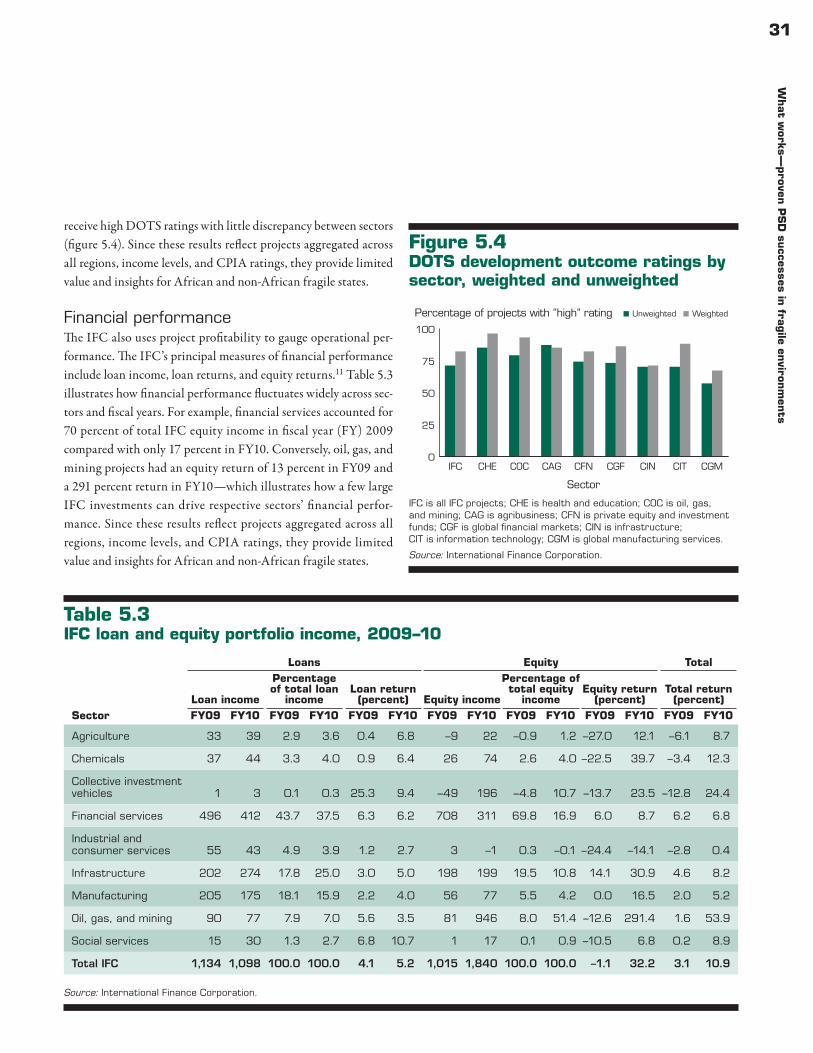
31W
hat w
orks — proven
PS
D su
ccesses in fra
gile en
vironm
ents
receive high DOTS ratings with little discrepancy between sectors (figure 5.4). Since these results reflect projects aggregated across all regions, income levels, and CPIA ratings, they provide limited value and insights for African and non- African fragile states.
Financial performanceThe IFC also uses project profitability to gauge operational per-formance. The IFC’s principal measures of financial performance include loan income, loan returns, and equity returns.11 Table 5.3 illustrates how financial performance fluctuates widely across sec-tors and fiscal years. For example, financial services accounted for 70 percent of total IFC equity income in fiscal year (FY) 2009 compared with only 17 percent in FY10. Conversely, oil, gas, and mining projects had an equity return of 13 percent in FY09 and a 291 percent return in FY10 — which illustrates how a few large IFC investments can drive respective sectors’ financial perfor-mance. Since these results reflect projects aggregated across all regions, income levels, and CPIA ratings, they provide limited value and insights for African and non-African fragile states.
Figure 5.4 DOTS development outcome ratings by sector, weighted and unweighted
IFC is all IFC projects; CHE is health and education; COC is oil, gas, and mining; CAG is agribusiness; CFN is private equity and investment funds; CGF is global financial markets; CIN is infrastructure; CIT is information technology; CGM is global manufacturing services.
Source: International Finance Corporation.
0
25
50
75
100
CGMCITCINCGFCFNCAGCOCCHEIFC
Percentage of projects with “high” rating
Sector
Unweighted Weighted
Table 5.3 IFC loan and equity portfolio income, 2009–10
Source: International Finance Corporation.
Sector
Loans Equity Total
Loan income
Percentage of total loan
incomeLoan return (percent) Equity income
Percentage of total equity
incomeEquity return
(percent)Total return
(percent)FY09 FY10 FY09 FY10 FY09 FY10 FY09 FY10 FY09 FY10 FY09 FY10 FY09 FY10
Agriculture 33 39 2.9 3.6 0.4 6.8 –9 22 –0.9 1.2 –27.0 12.1 –6.1 8.7
Chemicals 37 44 3.3 4.0 0.9 6.4 26 74 2.6 4.0 –22.5 39.7 –3.4 12.3
Collective investment vehicles 1 3 0.1 0.3 25.3 9.4 –49 196 –4.8 10.7 –13.7 23.5 –12.8 24.4
Financial services 496 412 43.7 37.5 6.3 6.2 708 311 69.8 16.9 6.0 8.7 6.2 6.8
Industrial and consumer services 55 43 4.9 3.9 1.2 2.7 3 –1 0.3 –0.1 –24.4 –14.1 –2.8 0.4
Infrastructure 202 274 17.8 25.0 3.0 5.0 198 199 19.5 10.8 14.1 30.9 4.6 8.2
Manufacturing 205 175 18.1 15.9 2.2 4.0 56 77 5.5 4.2 0.0 16.5 2.0 5.2
Oil, gas, and mining 90 77 7.9 7.0 5.6 3.5 81 946 8.0 51.4 –12.6 291.4 1.6 53.9
Social services 15 30 1.3 2.7 6.8 10.7 1 17 0.1 0.9 –10.5 6.8 0.2 8.9
Total IFC 1,134 1,098 100.0 100.0 4.1 5.2 1,015 1,840 100.0 100.0 –1.1 32.2 3.1 10.9
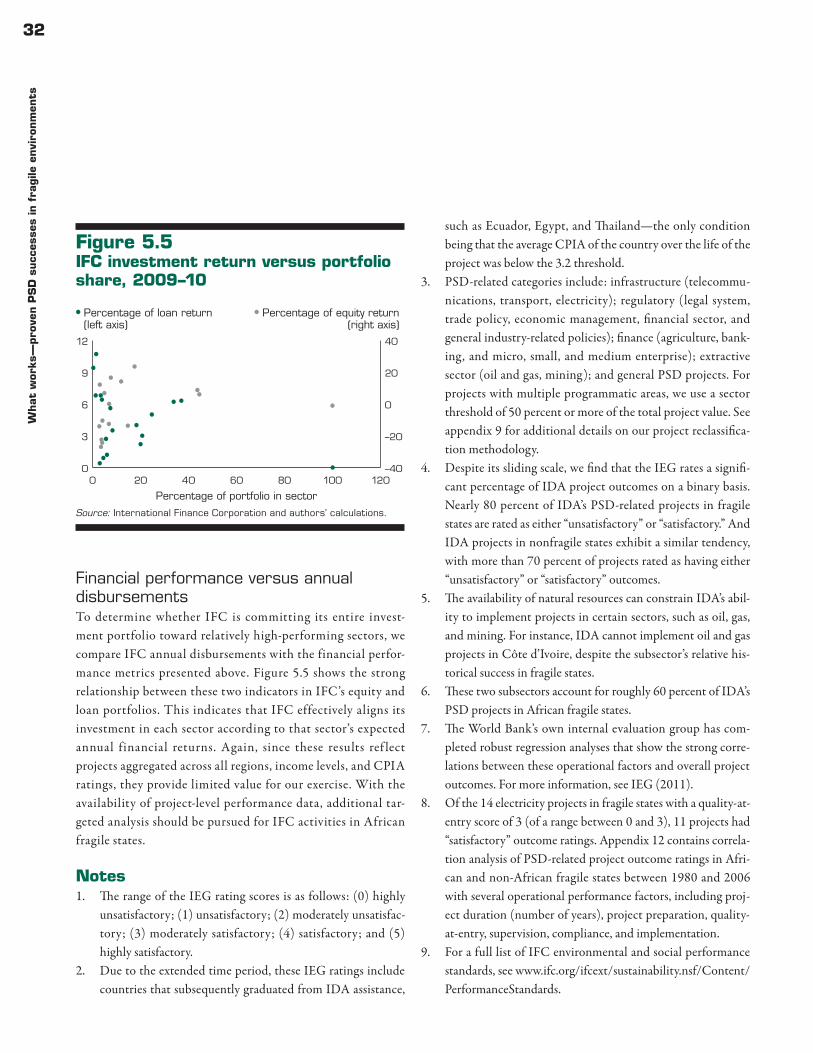
32W
hat
wor
ks —
pro
ven P
SD
succ
esse
s in
fra
gile
envi
ronm
ents
Financial performance versus annual disbursementsTo determine whether IFC is committing its entire invest-ment portfolio toward relatively high-performing sectors, we compare IFC annual disbursements with the financial perfor-mance metrics presented above. Figure 5.5 shows the strong relationship between these two indicators in IFC’s equity and loan portfolios. This indicates that IFC effectively aligns its investment in each sector according to that sector’s expected annual financial returns. Again, since these results ref lect projects aggregated across all regions, income levels, and CPIA ratings, they provide limited value for our exercise. With the availability of project-level performance data, additional tar-geted analysis should be pursued for IFC activities in African fragile states.
Notes1. The range of the IEG rating scores is as follows: (0) highly
unsatisfactory; (1) unsatisfactory; (2) moderately unsatisfac-tory; (3) moderately satisfactory; (4) satisfactory; and (5) highly satisfactory.
2. Due to the extended time period, these IEG ratings include countries that subsequently graduated from IDA assistance,
such as Ecuador, Egypt, and Thailand — the only condition being that the average CPIA of the country over the life of the project was below the 3.2 threshold.
3. PSD-related categories include: infrastructure (telecommu-nications, transport, electricity); regulatory (legal system, trade policy, economic management, financial sector, and general industry-related policies); finance (agriculture, bank-ing, and micro, small, and medium enterprise); extractive sector (oil and gas, mining); and general PSD projects. For projects with multiple programmatic areas, we use a sector threshold of 50 percent or more of the total project value. See appendix 9 for additional details on our project reclassifica-tion methodology.
4. Despite its sliding scale, we find that the IEG rates a signifi-cant percentage of IDA project outcomes on a binary basis. Nearly 80 percent of IDA’s PSD-related projects in fragile states are rated as either “unsatisfactory” or “satisfactory.” And IDA projects in nonfragile states exhibit a similar tendency, with more than 70 percent of projects rated as having either “unsatisfactory” or “satisfactory” outcomes.
5. The availability of natural resources can constrain IDA’s abil-ity to implement projects in certain sectors, such as oil, gas, and mining. For instance, IDA cannot implement oil and gas projects in Côte d’Ivoire, despite the subsector’s relative his-torical success in fragile states.
6. These two subsectors account for roughly 60 percent of IDA’s PSD projects in African fragile states.
7. The World Bank’s own internal evaluation group has com-pleted robust regression analyses that show the strong corre-lations between these operational factors and overall project outcomes. For more information, see IEG (2011).
8. Of the 14 electricity projects in fragile states with a quality-at-entry score of 3 (of a range between 0 and 3), 11 projects had “satisfactory” outcome ratings. Appendix 12 contains correla-tion analysis of PSD-related project outcome ratings in Afri-can and non-African fragile states between 1980 and 2006 with several operational performance factors, including proj-ect duration (number of years), project preparation, quality-at-entry, supervision, compliance, and implementation.
9. For a full list of IFC environmental and social performance standards, see www.ifc.org/ifcext/sustainability.nsf/Content/PerformanceStandards.
Figure 5.5 IFC investment return versus portfolio share, 2009–10
Source: International Finance Corporation and authors’ calculations.
–40
–20
0
20
40
Percentage of portfolio in sector
Percentage of equity return(right axis)
Percentage of loan return(left axis)
0 20 40 60 80 100 1200
3
6
9
12
33W
hat w
orks — proven
PS
D su
ccesses in fra
gile en
vironm
ents
10. See World Bank (2010c).11. Another core measurement of financial performance is IFC’s
internal rate of return (IRR). IRR is a measure of an invest-ment’s financial performance over the entire holding period.
The IRR takes into account both the amount and timing of disbursements and cash receipts. In the case of an outstanding equity investment, an estimated valuation of the investment is included as an element in calculating the IRR.
34
Chapter 6
Country case study — South Sudan
This chapter applies the proposed private sector development (PSD) guiding framework to the specific case study of South Sudan. First, it examines the private sector profile and major busi-ness constraints. Next, it outlines the guiding priorities of the gov-ernment of South Sudan. Then it gauges how well donor institu-tions’ PSD-related projects are aligned to what matters in South Sudan and what has worked well over time.
Contextual overviewIn July 2011, the Republic of South Sudan became the world’s newest nation. When Sudan’s destructive two-decades-long civil war ended in 2005, South Sudan was left with almost no physical or institutional infrastructure. Since then, substantial rebuild-ing and rehabilitation of destroyed or damaged structures has taken place. National, state, and local governments have been established along with the passage of a broad range of new leg-islation. Modern banking services have been introduced, and courts, schools, and health clinics across the region have been established.
Despite this significant progress, the new nation still faces monumental challenges in fostering broad-based private sec-tor growth and economic opportunities for its people. Among the major economic challenges facing South Sudan: weak or nonexistent physical infrastructure (especially power and trans-port); inadequate access to and cost of finance; dependence on subsistence agriculture; a poor business regulatory climate; and the overwhelming dominance of the oil sector for national out-put, exports, and government revenues. At the same time, the nation is endowed with significant natural resources beyond oil, such as timber, gold, and plentiful water for agriculture. More-over, South Sudan will undoubtedly receive strong support from bilateral donors and international financial institutions, which have already initiated comprehensive economic and social sup-port programs.
Private sector overviewDespite significant challenges, the private sector in South Sudan has expanded rapidly over recent years, shown by the registration of more than 6,000 new firms since 2005.1 Despite the strong new business growth, the private sector in South Sudan remains con-strained and is dominated by micro and small firms in the retail sector. As of 2010, roughly 93 percent of registered firms had fewer than six employees (table 6.1). By extension, there is a nearly com-plete lack of medium or large firms, with only 20 firms having 50 or more employees.
As noted previously, private enterprises are heavily concen-trated in the wholesale and retail trade sector, accounting for 70 percent of registered firms (see table 6.1). Another 14 percent of firms operate in hospitality-related sectors, such as lodging and food service. Less than 5 percent of registered South Sudanese firms are in industry-related sectors, such as manufacturing, con-struction, or mining. In geographical terms, nearly two-thirds of private enterprises are located in South Sudan’s three largest cit-ies (Juba, Malakal, and Wau). Even in these urban areas, business density remains very low, whether measured in per capita or per household terms. For example, there are only 0.014 businesses per household in Juba and 0.006 in Malakal.
Given the business profile in South Sudan, the government and its donor supporters face a dual challenge of both creat-ing enabling conditions for micro-entrepreneurs to grow and simultaneously preparing the environment for the establish-ment of larger, formal sectors such as food processing, mining, or light manufacturing.2 In this context, the government must take concerted steps to reduce operating costs and associated investment risks through an improved policy framework, infra-structure network (such as reliable electricity and transport), supply chains, access to finance, and technical and managerial skills. The next section examines these constraints in greater detail.
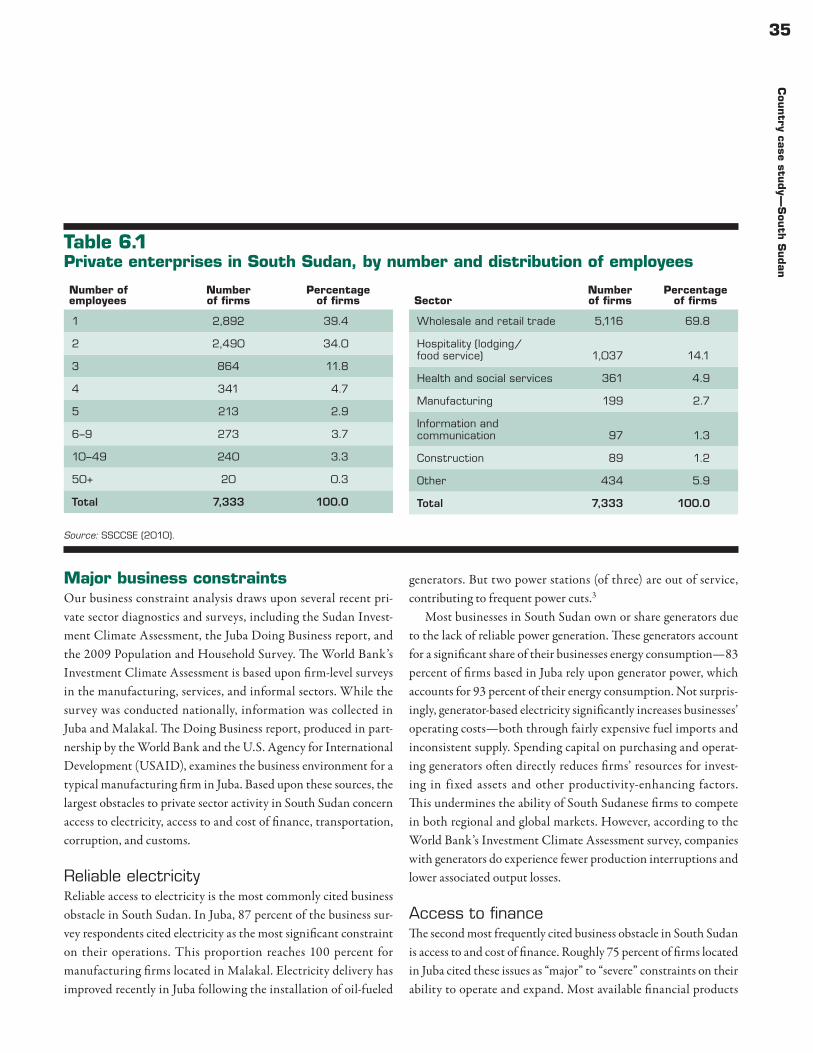
35C
ountry ca
se study—
Sou
th S
udan
Major business constraintsOur business constraint analysis draws upon several recent pri-vate sector diagnostics and surveys, including the Sudan Invest-ment Climate Assessment, the Juba Doing Business report, and the 2009 Population and Household Survey. The World Bank’s Investment Climate Assessment is based upon firm-level surveys in the manufacturing, services, and informal sectors. While the survey was conducted nationally, information was collected in Juba and Malakal. The Doing Business report, produced in part-nership by the World Bank and the U.S. Agency for International Development (USAID), examines the business environment for a typical manufacturing firm in Juba. Based upon these sources, the largest obstacles to private sector activity in South Sudan concern access to electricity, access to and cost of finance, transportation, corruption, and customs.
Reliable electricityReliable access to electricity is the most commonly cited business obstacle in South Sudan. In Juba, 87 percent of the business sur-vey respondents cited electricity as the most significant constraint on their operations. This proportion reaches 100 percent for manufacturing firms located in Malakal. Electricity delivery has improved recently in Juba following the installation of oil-fueled
generators. But two power stations (of three) are out of service, contributing to frequent power cuts.3
Most businesses in South Sudan own or share generators due to the lack of reliable power generation. These generators account for a significant share of their businesses energy consumption — 83 percent of firms based in Juba rely upon generator power, which accounts for 93 percent of their energy consumption. Not surpris-ingly, generator-based electricity significantly increases businesses’ operating costs — both through fairly expensive fuel imports and inconsistent supply. Spending capital on purchasing and operat-ing generators often directly reduces firms’ resources for invest-ing in fixed assets and other productivity-enhancing factors. This undermines the ability of South Sudanese firms to compete in both regional and global markets. However, according to the World Bank’s Investment Climate Assessment survey, companies with generators do experience fewer production interruptions and lower associated output losses.
Access to financeThe second most frequently cited business obstacle in South Sudan is access to and cost of finance. Roughly 75 percent of firms located in Juba cited these issues as “major” to “severe” constraints on their ability to operate and expand. Most available financial products
Table 6.1 Private enterprises in South Sudan, by number and distribution of employees
Source: SSCCSE (2010).
Number of employees
Number of firms
Percentage of firms
1 2,892 39.4
2 2,490 34.0
3 864 11.8
4 341 4.7
5 213 2.9
6–9 273 3.7
10–49 240 3.3
50+ 20 0.3
Total 7,333 100.0
SectorNumber of firms
Percentage of firms
Wholesale and retail trade 5,116 69.8
Hospitality (lodging/food service) 1,037 14.1
Health and social services 361 4.9
Manufacturing 199 2.7
Information and communication 97 1.3
Construction 89 1.2
Other 434 5.9
Total 7,333 100.0
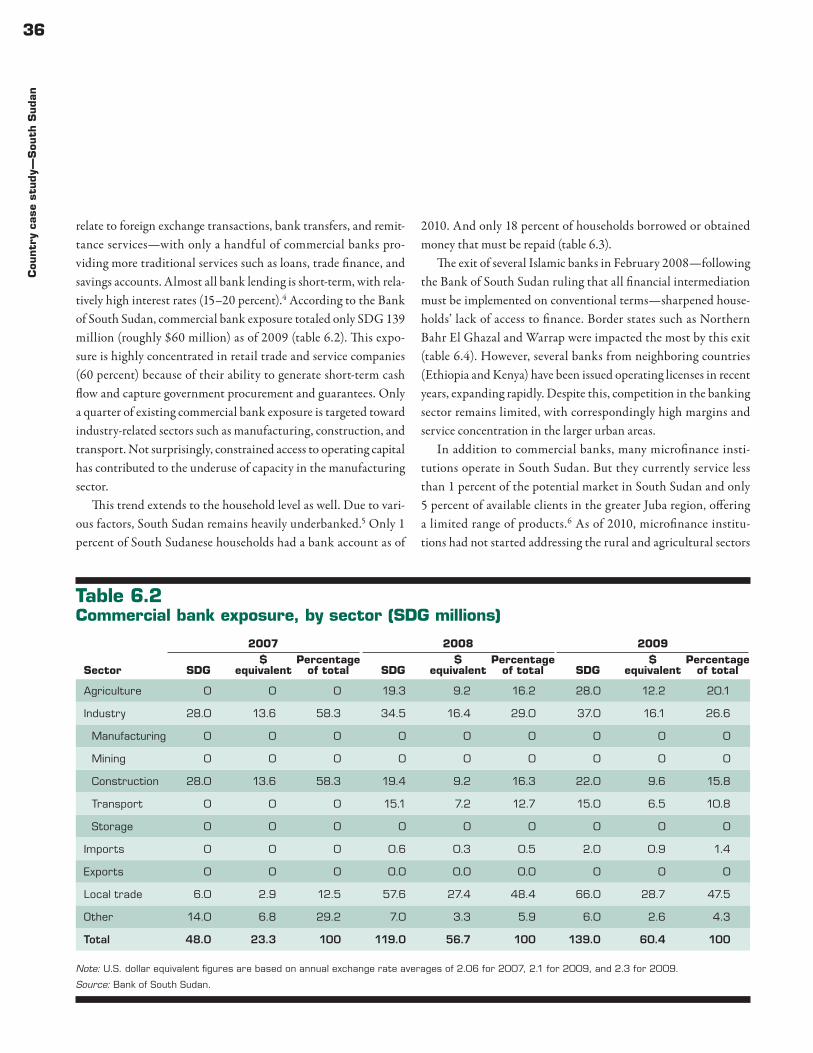
36C
ountr
y ca
se s
tudy—
Sou
th S
uda
n
relate to foreign exchange transactions, bank transfers, and remit-tance services — with only a handful of commercial banks pro-viding more traditional services such as loans, trade finance, and savings accounts. Almost all bank lending is short-term, with rela-tively high interest rates (15–20 percent).4 According to the Bank of South Sudan, commercial bank exposure totaled only SDG 139 million (roughly $60 million) as of 2009 (table 6.2). This expo-sure is highly concentrated in retail trade and service companies (60 percent) because of their ability to generate short-term cash flow and capture government procurement and guarantees. Only a quarter of existing commercial bank exposure is targeted toward industry-related sectors such as manufacturing, construction, and transport. Not surprisingly, constrained access to operating capital has contributed to the underuse of capacity in the manufacturing sector.
This trend extends to the household level as well. Due to vari-ous factors, South Sudan remains heavily underbanked.5 Only 1 percent of South Sudanese households had a bank account as of
2010. And only 18 percent of households borrowed or obtained money that must be repaid (table 6.3).
The exit of several Islamic banks in February 2008 — following the Bank of South Sudan ruling that all financial intermediation must be implemented on conventional terms — sharpened house-holds’ lack of access to finance. Border states such as Northern Bahr El Ghazal and Warrap were impacted the most by this exit (table 6.4). However, several banks from neighboring countries (Ethiopia and Kenya) have been issued operating licenses in recent years, expanding rapidly. Despite this, competition in the banking sector remains limited, with correspondingly high margins and service concentration in the larger urban areas.
In addition to commercial banks, many microfinance insti-tutions operate in South Sudan. But they currently service less than 1 percent of the potential market in South Sudan and only 5 percent of available clients in the greater Juba region, offering a limited range of products.6 As of 2010, microfinance institu-tions had not started addressing the rural and agricultural sectors
Table 6.2 Commercial bank exposure, by sector (SDG millions)
Note: U.S. dollar equivalent figures are based on annual exchange rate averages of 2.06 for 2007, 2.1 for 2009, and 2.3 for 2009.
Source: Bank of South Sudan.
Sector
2007 2008 2009
SDG$
equivalentPercentage
of total SDG$
equivalentPercentage
of total SDG$
equivalentPercentage
of total
Agriculture 0 0 0 19.3 9.2 16.2 28.0 12.2 20.1
Industry 28.0 13.6 58.3 34.5 16.4 29.0 37.0 16.1 26.6
Manufacturing 0 0 0 0 0 0 0 0 0
Mining 0 0 0 0 0 0 0 0 0
Construction 28.0 13.6 58.3 19.4 9.2 16.3 22.0 9.6 15.8
Transport 0 0 0 15.1 7.2 12.7 15.0 6.5 10.8
Storage 0 0 0 0 0 0 0 0 0
Imports 0 0 0 0.6 0.3 0.5 2.0 0.9 1.4
Exports 0 0 0 0.0 0.0 0.0 0 0 0
Local trade 6.0 2.9 12.5 57.6 27.4 48.4 66.0 28.7 47.5
Other 14.0 6.8 29.2 7.0 3.3 5.9 6.0 2.6 4.3
Total 48.0 23.3 100 119.0 56.7 100 139.0 60.4 100
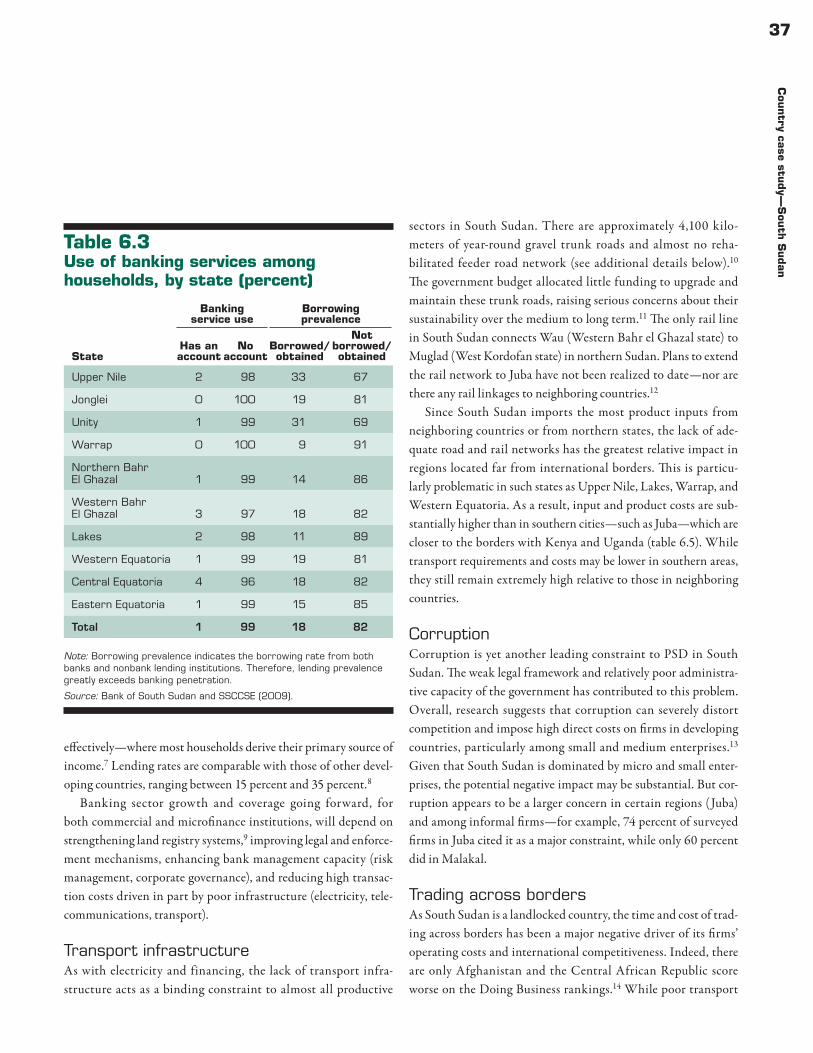
37C
ountry ca
se study—
Sou
th S
udan
effectively — where most households derive their primary source of income.7 Lending rates are comparable with those of other devel-oping countries, ranging between 15 percent and 35 percent.8
Banking sector growth and coverage going forward, for both commercial and microfinance institutions, will depend on strengthening land registry systems,9 improving legal and enforce-ment mechanisms, enhancing bank management capacity (risk management, corporate governance), and reducing high transac-tion costs driven in part by poor infrastructure (electricity, tele-communications, transport).
Transport infrastructureAs with electricity and financing, the lack of transport infra-structure acts as a binding constraint to almost all productive
sectors in South Sudan. There are approximately 4,100 kilo-meters of year-round gravel trunk roads and almost no reha-bilitated feeder road network (see additional details below).10 The government budget allocated little funding to upgrade and maintain these trunk roads, raising serious concerns about their sustainability over the medium to long term.11 The only rail line in South Sudan connects Wau (Western Bahr el Ghazal state) to Muglad (West Kordofan state) in northern Sudan. Plans to extend the rail network to Juba have not been realized to date — nor are there any rail linkages to neighboring countries.12
Since South Sudan imports the most product inputs from neighboring countries or from northern states, the lack of ade-quate road and rail networks has the greatest relative impact in regions located far from international borders. This is particu-larly problematic in such states as Upper Nile, Lakes, Warrap, and Western Equatoria. As a result, input and product costs are sub-stantially higher than in southern cities — such as Juba — which are closer to the borders with Kenya and Uganda (table 6.5). While transport requirements and costs may be lower in southern areas, they still remain extremely high relative to those in neighboring countries.
CorruptionCorruption is yet another leading constraint to PSD in South Sudan. The weak legal framework and relatively poor administra-tive capacity of the government has contributed to this problem. Overall, research suggests that corruption can severely distort competition and impose high direct costs on firms in developing countries, particularly among small and medium enterprises.13 Given that South Sudan is dominated by micro and small enter-prises, the potential negative impact may be substantial. But cor-ruption appears to be a larger concern in certain regions (Juba) and among informal firms — for example, 74 percent of surveyed firms in Juba cited it as a major constraint, while only 60 percent did in Malakal.
Trading across bordersAs South Sudan is a landlocked country, the time and cost of trad-ing across borders has been a major negative driver of its firms’ operating costs and international competitiveness. Indeed, there are only Afghanistan and the Central African Republic score worse on the Doing Business rankings.14 While poor transport
Table 6.3 Use of banking services among households, by state (percent)
Note: Borrowing prevalence indicates the borrowing rate from both banks and nonbank lending institutions. Therefore, lending prevalence greatly exceeds banking penetration.
Source: Bank of South Sudan and SSCCSE (2009).
State
Banking service use
Borrowing prevalence
Has an account
No account
Borrowed/obtained
Not borrowed/obtained
Upper Nile 2 98 33 67
Jonglei 0 100 19 81
Unity 1 99 31 69
Warrap 0 100 9 91
Northern Bahr El Ghazal 1 99 14 86
Western Bahr El Ghazal 3 97 18 82
Lakes 2 98 11 89
Western Equatoria 1 99 19 81
Central Equatoria 4 96 18 82
Eastern Equatoria 1 99 15 85
Total 1 99 18 82
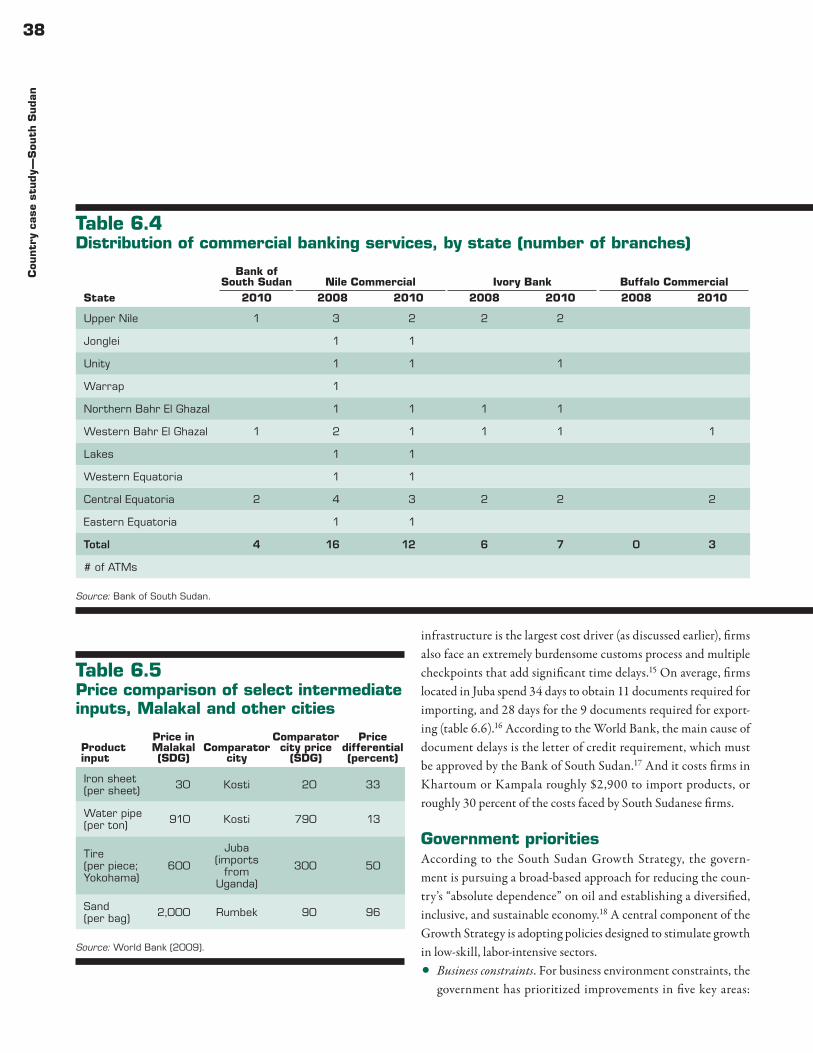
38C
ountr
y ca
se s
tudy—
Sou
th S
uda
n
infrastructure is the largest cost driver (as discussed earlier), firms also face an extremely burdensome customs process and multiple checkpoints that add significant time delays.15 On average, firms located in Juba spend 34 days to obtain 11 documents required for importing, and 28 days for the 9 documents required for export-ing (table 6.6).16 According to the World Bank, the main cause of document delays is the letter of credit requirement, which must be approved by the Bank of South Sudan.17 And it costs firms in Khartoum or Kampala roughly $2,900 to import products, or roughly 30 percent of the costs faced by South Sudanese firms.
Government prioritiesAccording to the South Sudan Growth Strategy, the govern-ment is pursuing a broad-based approach for reducing the coun-try’s “absolute dependence” on oil and establishing a diversified, inclusive, and sustainable economy.18 A central component of the Growth Strategy is adopting policies designed to stimulate growth in low-skill, labor-intensive sectors.•Business constraints. For business environment constraints, the
government has prioritized improvements in five key areas:
Table 6.5 Price comparison of select intermediate inputs, Malakal and other cities
Source: World Bank (2009).
Product input
Price in Malakal (SDG)
Comparator city
Comparator city price
(SDG)
Price differential (percent)
Iron sheet (per sheet) 30 Kosti 20 33
Water pipe (per ton) 910 Kosti 790 13
Tire (per piece; Yokohama)
600
Juba (imports
from Uganda)
300 50
Sand (per bag) 2,000 Rumbek 90 96
Table 6.4 Distribution of commercial banking services, by state (number of branches)
Source: Bank of South Sudan.
State
Bank of South Sudan Nile Commercial Ivory Bank Buffalo Commercial Agricultural Bank Kenya Commercial Equity Bank
Commercial Bank of Ethiopia Total
Δ2010 2008 2010 2008 2010 2008 2010 2008 2010 2008 2010 2008 2010 2008 2010 2008 2010
Upper Nile 1 3 2 2 2 2 2 — 7 7 0
Jonglei 1 1 1 — 1 2 1
Unity 1 1 1 1 — 1 3 2
Warrap 1 — 1 0 –1
Northern Bahr El Ghazal 1 1 1 1 1 — 3 2 –1
Western Bahr El Ghazal 1 2 1 1 1 1 1 1 — 4 5 1
Lakes 1 1 1 1 — 2 2 0
Western Equatoria 1 1 1 — 1 2 1
Central Equatoria 2 4 3 2 2 2 1 1 1 4 1 1 — 3 9 18 9
Eastern Equatoria 1 1 — 1 1 0
Total 4 16 12 6 7 0 3 5 4 2 8 1 1 0 3 30 42 12
# of ATMs 10 1 11 —
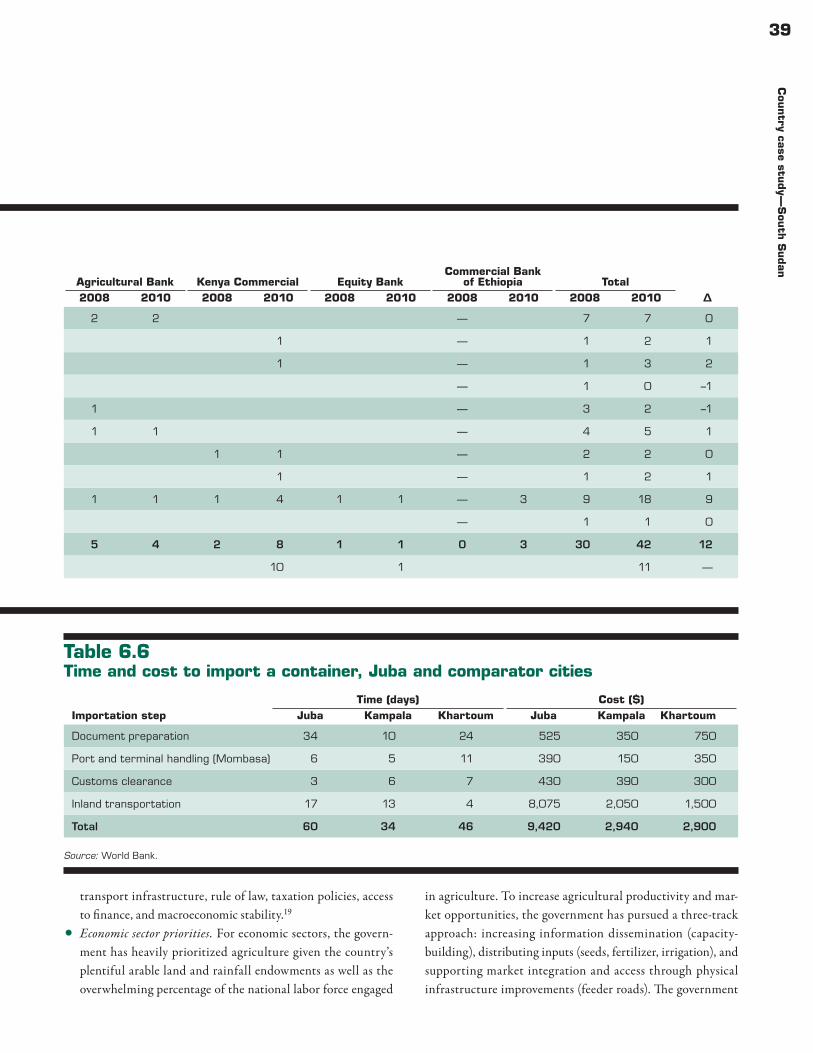
39C
ountry ca
se study—
Sou
th S
udan
transport infrastructure, rule of law, taxation policies, access to finance, and macroeconomic stability.19
•Economic sector priorities. For economic sectors, the govern-ment has heavily prioritized agriculture given the country’s plentiful arable land and rainfall endowments as well as the overwhelming percentage of the national labor force engaged
in agriculture. To increase agricultural productivity and mar-ket opportunities, the government has pursued a three-track approach: increasing information dissemination (capacity-building), distributing inputs (seeds, fertilizer, irrigation), and supporting market integration and access through physical infrastructure improvements (feeder roads). The government
Table 6.4 Distribution of commercial banking services, by state (number of branches)
Source: Bank of South Sudan.
State
Bank of South Sudan Nile Commercial Ivory Bank Buffalo Commercial Agricultural Bank Kenya Commercial Equity Bank
Commercial Bank of Ethiopia Total
Δ2010 2008 2010 2008 2010 2008 2010 2008 2010 2008 2010 2008 2010 2008 2010 2008 2010
Upper Nile 1 3 2 2 2 2 2 — 7 7 0
Jonglei 1 1 1 — 1 2 1
Unity 1 1 1 1 — 1 3 2
Warrap 1 — 1 0 –1
Northern Bahr El Ghazal 1 1 1 1 1 — 3 2 –1
Western Bahr El Ghazal 1 2 1 1 1 1 1 1 — 4 5 1
Lakes 1 1 1 1 — 2 2 0
Western Equatoria 1 1 1 — 1 2 1
Central Equatoria 2 4 3 2 2 2 1 1 1 4 1 1 — 3 9 18 9
Eastern Equatoria 1 1 — 1 1 0
Total 4 16 12 6 7 0 3 5 4 2 8 1 1 0 3 30 42 12
# of ATMs 10 1 11 —
Table 6.6 Time and cost to import a container, Juba and comparator cities
Source: World Bank.
Importation stepTime (days) Cost ($)
Juba Kampala Khartoum Juba Kampala Khartoum
Document preparation 34 10 24 525 350 750
Port and terminal handling (Mombasa) 6 5 11 390 150 350
Customs clearance 3 6 7 430 390 300
Inland transportation 17 13 4 8,075 2,050 1,500
Total 60 34 46 9,420 2,940 2,900
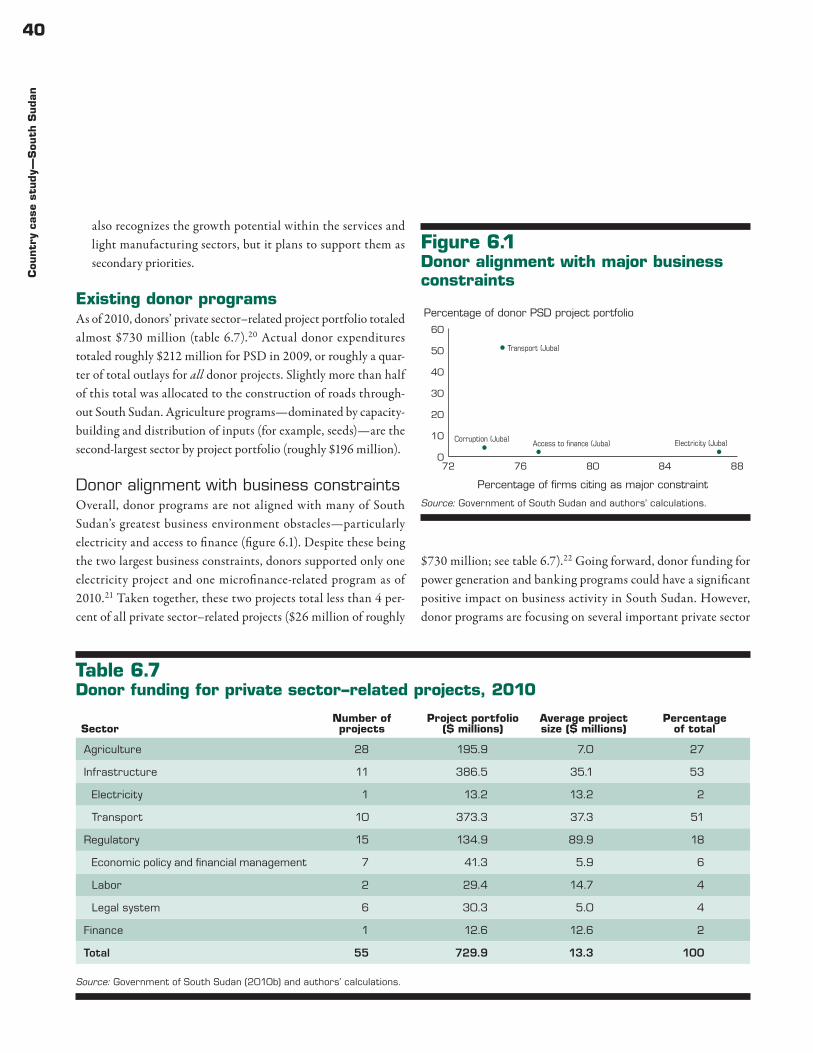
40C
ountr
y ca
se s
tudy—
Sou
th S
uda
n
also recognizes the growth potential within the services and light manufacturing sectors, but it plans to support them as secondary priorities.
Existing donor programsAs of 2010, donors’ private sector–related project portfolio totaled almost $730 million (table 6.7).20 Actual donor expenditures totaled roughly $212 million for PSD in 2009, or roughly a quar-ter of total outlays for all donor projects. Slightly more than half of this total was allocated to the construction of roads through-out South Sudan. Agriculture programs — dominated by capacity-building and distribution of inputs (for example, seeds) — are the second-largest sector by project portfolio (roughly $196 million).
Donor alignment with business constraintsOverall, donor programs are not aligned with many of South Sudan’s greatest business environment obstacles — particularly electricity and access to finance (figure 6.1). Despite these being the two largest business constraints, donors supported only one electricity project and one microfinance-related program as of 2010.21 Taken together, these two projects total less than 4 per-cent of all private sector–related projects ($26 million of roughly
$730 million; see table 6.7).22 Going forward, donor funding for power generation and banking programs could have a significant positive impact on business activity in South Sudan. However, donor programs are focusing on several important private sector
Table 6.7 Donor funding for private sector–related projects, 2010
Source: Government of South Sudan (2010b) and authors’ calculations.
SectorNumber of projects
Project portfolio ($ millions)
Average project size ($ millions)
Percentage of total
Agriculture 28 195.9 7.0 27
Infrastructure 11 386.5 35.1 53
Electricity 1 13.2 13.2 2
Transport 10 373.3 37.3 51
Regulatory 15 134.9 89.9 18
Economic policy and financial management 7 41.3 5.9 6
Labor 2 29.4 14.7 4
Legal system 6 30.3 5.0 4
Finance 1 12.6 12.6 2
Total 55 729.9 13.3 100
Figure 6.1 Donor alignment with major business constraints
Source: Government of South Sudan and authors’ calculations.
72 76 80 84 880
10
20
30
40
50
60
Percentage of donor PSD project portfolio
Percentage of firms citing as major constraint
Transport (Juba)
Corruption (Juba)Access to finance (Juba) Electricity (Juba)
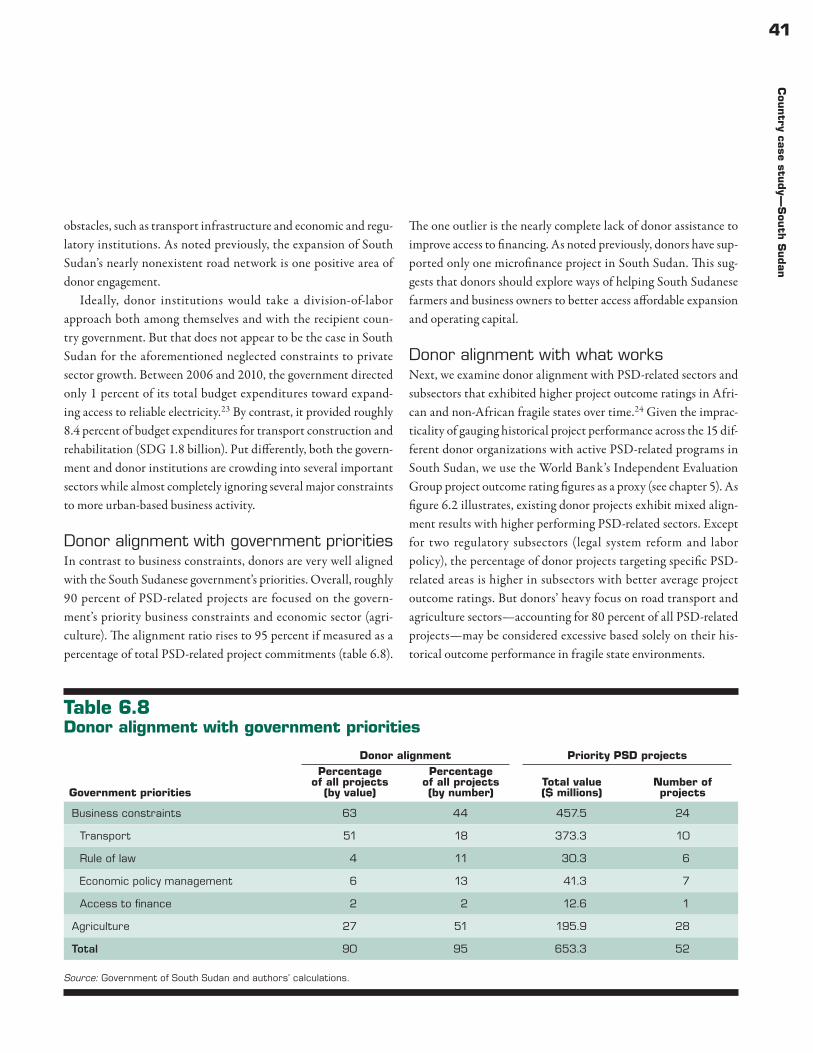
41C
ountry ca
se study—
Sou
th S
udan
obstacles, such as transport infrastructure and economic and regu-latory institutions. As noted previously, the expansion of South Sudan’s nearly nonexistent road network is one positive area of donor engagement.
Ideally, donor institutions would take a division-of-labor approach both among themselves and with the recipient coun-try government. But that does not appear to be the case in South Sudan for the aforementioned neglected constraints to private sector growth. Between 2006 and 2010, the government directed only 1 percent of its total budget expenditures toward expand-ing access to reliable electricity.23 By contrast, it provided roughly 8.4 percent of budget expenditures for transport construction and rehabilitation (SDG 1.8 billion). Put differently, both the govern-ment and donor institutions are crowding into several important sectors while almost completely ignoring several major constraints to more urban-based business activity.
Donor alignment with government prioritiesIn contrast to business constraints, donors are very well aligned with the South Sudanese government’s priorities. Overall, roughly 90 percent of PSD-related projects are focused on the govern-ment’s priority business constraints and economic sector (agri-culture). The alignment ratio rises to 95 percent if measured as a percentage of total PSD-related project commitments (table 6.8).
The one outlier is the nearly complete lack of donor assistance to improve access to financing. As noted previously, donors have sup-ported only one microfinance project in South Sudan. This sug-gests that donors should explore ways of helping South Sudanese farmers and business owners to better access affordable expansion and operating capital.
Donor alignment with what worksNext, we examine donor alignment with PSD-related sectors and subsectors that exhibited higher project outcome ratings in Afri-can and non-African fragile states over time.24 Given the imprac-ticality of gauging historical project performance across the 15 dif-ferent donor organizations with active PSD-related programs in South Sudan, we use the World Bank’s Independent Evaluation Group project outcome rating figures as a proxy (see chapter 5). As figure 6.2 illustrates, existing donor projects exhibit mixed align-ment results with higher performing PSD-related sectors. Except for two regulatory subsectors (legal system reform and labor policy), the percentage of donor projects targeting specific PSD-related areas is higher in subsectors with better average project outcome ratings. But donors’ heavy focus on road transport and agriculture sectors — accounting for 80 percent of all PSD-related projects — may be considered excessive based solely on their his-torical outcome performance in fragile state environments.
Table 6.8 Donor alignment with government priorities
Source: Government of South Sudan and authors’ calculations.
Government priorities
Donor alignment Priority PSD projectsPercentage
of all projects (by value)
Percentage of all projects (by number)
Total value ($ millions)
Number of projects
Business constraints 63 44 457.5 24
Transport 51 18 373.3 10
Rule of law 4 11 30.3 6
Economic policy management 6 13 41.3 7
Access to finance 2 2 12.6 1
Agriculture 27 51 195.9 28
Total 90 95 653.3 52
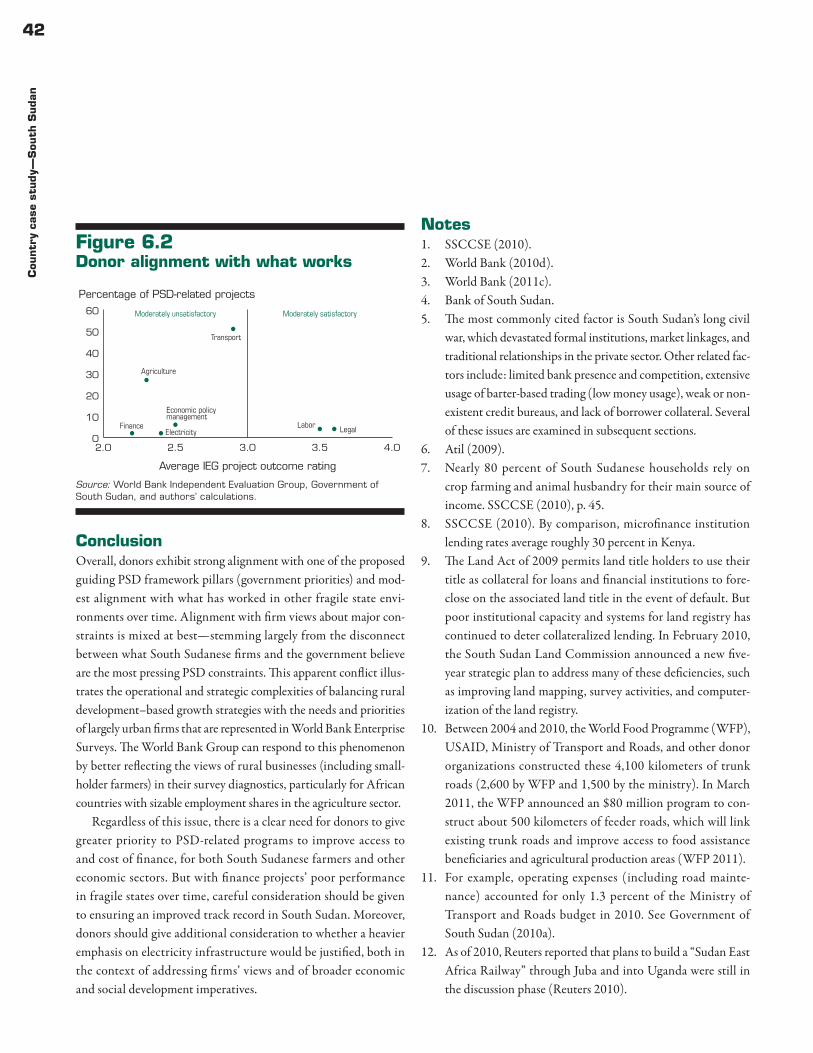
42C
ountr
y ca
se s
tudy—
Sou
th S
uda
n
ConclusionOverall, donors exhibit strong alignment with one of the proposed guiding PSD framework pillars (government priorities) and mod-est alignment with what has worked in other fragile state envi-ronments over time. Alignment with firm views about major con-straints is mixed at best — stemming largely from the disconnect between what South Sudanese firms and the government believe are the most pressing PSD constraints. This apparent conflict illus-trates the operational and strategic complexities of balancing rural development–based growth strategies with the needs and priorities of largely urban firms that are represented in World Bank Enterprise Surveys. The World Bank Group can respond to this phenomenon by better reflecting the views of rural businesses (including small-holder farmers) in their survey diagnostics, particularly for African countries with sizable employment shares in the agriculture sector.
Regardless of this issue, there is a clear need for donors to give greater priority to PSD-related programs to improve access to and cost of finance, for both South Sudanese farmers and other economic sectors. But with finance projects’ poor performance in fragile states over time, careful consideration should be given to ensuring an improved track record in South Sudan. Moreover, donors should give additional consideration to whether a heavier emphasis on electricity infrastructure would be justified, both in the context of addressing firms’ views and of broader economic and social development imperatives.
Notes1. SSCCSE (2010).2. World Bank (2010d).3. World Bank (2011c).4. Bank of South Sudan.5. The most commonly cited factor is South Sudan’s long civil
war, which devastated formal institutions, market linkages, and traditional relationships in the private sector. Other related fac-tors include: limited bank presence and competition, extensive usage of barter-based trading (low money usage), weak or non-existent credit bureaus, and lack of borrower collateral. Several of these issues are examined in subsequent sections.
6. Atil (2009).7. Nearly 80 percent of South Sudanese households rely on
crop farming and animal husbandry for their main source of income. SSCCSE (2010), p. 45.
8. SSCCSE (2010). By comparison, microfinance institution lending rates average roughly 30 percent in Kenya.
9. The Land Act of 2009 permits land title holders to use their title as collateral for loans and financial institutions to fore-close on the associated land title in the event of default. But poor institutional capacity and systems for land registry has continued to deter collateralized lending. In February 2010, the South Sudan Land Commission announced a new five-year strategic plan to address many of these deficiencies, such as improving land mapping, survey activities, and computer-ization of the land registry.
10. Between 2004 and 2010, the World Food Programme (WFP), USAID, Ministry of Transport and Roads, and other donor organizations constructed these 4,100 kilometers of trunk roads (2,600 by WFP and 1,500 by the ministry). In March 2011, the WFP announced an $80 million program to con-struct about 500 kilometers of feeder roads, which will link existing trunk roads and improve access to food assistance beneficiaries and agricultural production areas (WFP 2011).
11. For example, operating expenses (including road mainte-nance) accounted for only 1.3 percent of the Ministry of Transport and Roads budget in 2010. See Government of South Sudan (2010a).
12. As of 2010, Reuters reported that plans to build a “Sudan East Africa Railway” through Juba and into Uganda were still in the discussion phase (Reuters 2010).
Figure 6.2 Donor alignment with what works
Source: World Bank Independent Evaluation Group, Government of South Sudan, and authors’ calculations.
0
10
20
30
40
50
60
2.0 2.5 3.0 3.5 4.0
Percentage of PSD-related projects
Average IEG project outcome rating
Moderately unsatisfactory Moderately satisfactory
Transport
Labor Legal
Agriculture
Electricity
Economic policymanagement
Finance
43C
ountry ca
se study—
Sou
th S
udan
13. Emerson (2006).14. World Bank (2011c).15. World Bank (2011c). Imports must pass through six separate
checkpoints along the 200 kilometers between Juba and the Ugandan border crossing (Nimule).
16. World Bank (2011c).17. This is required every time a firm imports or exports products
and involves the submission of six separate documents to the Bank of South Sudan. On average, this step takes more than 20 days to complete.
18. Government of South Sudan (2010c).19. Government of South Sudan (2010c).20. Additional donor programs have been initiated or proposed
since the publication of the Government of South Sudan’s Donor Book 2010. For example, the IFC proposed a modest new program in early 2011 focused on generating at least 15 new high-quality investments in non-oil sectors, especially agribusiness; increasing new business registrations from 8,000 to 13,000; decentralizing the business registration to locations in at least three states; and using alternative dispute resolution
in at least 200 business disputes. For more information, see www.ifc.org for all available project documents.
21. USAID’s Sudan Infrastructure Services Project (Electrifica-tion Program) will provide $13 million to support the con-struction of electricity infrastructure in Kapoeta and Maridi and the training of Electricity Corporation personnel. The 894-kilowatt power plant was inaugurated in February 2011. See Ruati (2011). USAID’s Generating Economic Develop-ment through Microfinance in Southern Sudan will provide $12.6 million to improve microfinance institution’s manage-rial capacity and to provide loan capital for the expansion of microfinance facilities and geographic coverage. See Govern-ment of South Sudan (2010b).
22. Of course, donor projects across sectors will vary in terms of size and cost. As such, relative funding volume is an imperfect measure for comparing donor priorities.
23. Government of South Sudan (2010b) and authors’ calculations.
24. As in chapter 5, this analysis is based on average IEG project outcome ratings by sector and subsector.
44
Chapter 7
Conclusion
The World Bank Group and other development institutions have committed to further prioritize programmatic operations in fragile states. The strategic imperative for this focus is par-ticularly warranted given the projected IDA graduation by more than half of its existing client countries by 2025. And the World Bank Group’s existing efforts to devise a new Group-wide strat-egy for fragile states present an opportune time to reexamine one key aspect of its operations — promoting private sector develop-ment. This report examines three key private sector–related fac-tors in African fragile states: what businesses cite as the most binding constraints to private sector growth; what government priorities are for business climate improvements or strategic eco-nomic sectors; and what types of projects have been more effective over time. Subsequently, we assess the alignment of World Bank Group operations within these three areas over the past decade. Overall, we find that project alignment varies widely across the World Bank Group’s three largest subsidiaries — the International Development Association (IDA), International Finance Corpo-ration (IFC), and Multilateral Investment Guarantee Agency (MIGA).•IDA exhibits very strong alignment with government priorities
and reasonably good prioritization in sectors with higher proj-ect outcome ratings. But it has a more mixed performance with respect to focusing on what businesses cite as the most binding private sector–related constraints. IDA has pursued compara-tively few projects focusing on the most binding constraints, such as electricity and access to finance.
•By contrast, IFC and MIGA projects are only modestly aligned with the private sector’s most binding constraints or fragile state government priorities. Instead, projects have been heavily con-centrated in low-risk sectors, such as the extractive sector. Taken together, IFC activities over time suggest that the orga-nization lacks a comprehensive, systematic strategy in African fragile states.1
Moving forwardDespite several bright spots, our analysis suggests that strate-gic changes in the World Bank Group’s operations are needed — particularly for IFC and MIGA. Given this, we propose a new methodology by which they could prioritize and structure assis-tance and investment programs in fragile states. Our conceptual model brings together three simple, yet fundamental, components for policy design — what is needed, what is wanted, and what works.•What is needed. To generate growth, policymakers must create
a conducive environment for business owners and managers of small, medium, and large firms. Understanding the business community’s concrete and most binding constraints is the cru-cial first step toward good policy design.
•What is wanted. Policymakers in fragile states operate in very difficult environments. Understanding their perspective and private sector objectives is important, especially for policy-makers in multilateral institutions.
•What works. We must use the lessons learned from past proj-ects and policy interventions. Understanding what has worked in very difficult environments will be useful to the design of new policies, programs, and projects — particularly when these findings are referenced against public and private sector con-straints and priorities.When viewed together, these three analytical components can
help the World Bank Group and other development organizations prioritize private sector–related programs in fragile states. Ideally, donor institutions would pursue projects in sectors or areas where all three components intersect (what the private sector needs, what the government wants, and what donors do effectively). But there will be situations or environments in which multilateral organiza-tions may wish to pursue projects or investments that do not meet this condition.
The challenge will be ensuring flexible operational and institu-tional structures to implement these objectives. Broadly speaking,
45C
onclu
sion
three main areas need to be addressed: improving managerial capacity to enable a bolder approach to fragile states; significantly changing human resources strategies to attract and retain staff who are willing to take risks and understand the conditions of operating in fragile states; and improving the incentives of exist-ing staff so that they are more willing to take on riskier projects. Each of these areas is enormously challenging, but must receive concerted efforts in order for a fragile states–specific agenda to be implemented.
Note1. As chapter 5 notes, evaluation results vary widely by country
and sector. IDA, IFC, and MIGA might consider country pri-orities, business constraints, and evaluation results on a country-level basis. Further, evaluation results by sector might be consid-ered in relative terms compared with other sectors. For example, if single country evaluation results are low across the board (as, for example, in the Democratic Republic of Congo), road proj-ects with an average score of just 2.5 might be prioritized over oil, gas, and mining projects, which have an average score of 1.5.
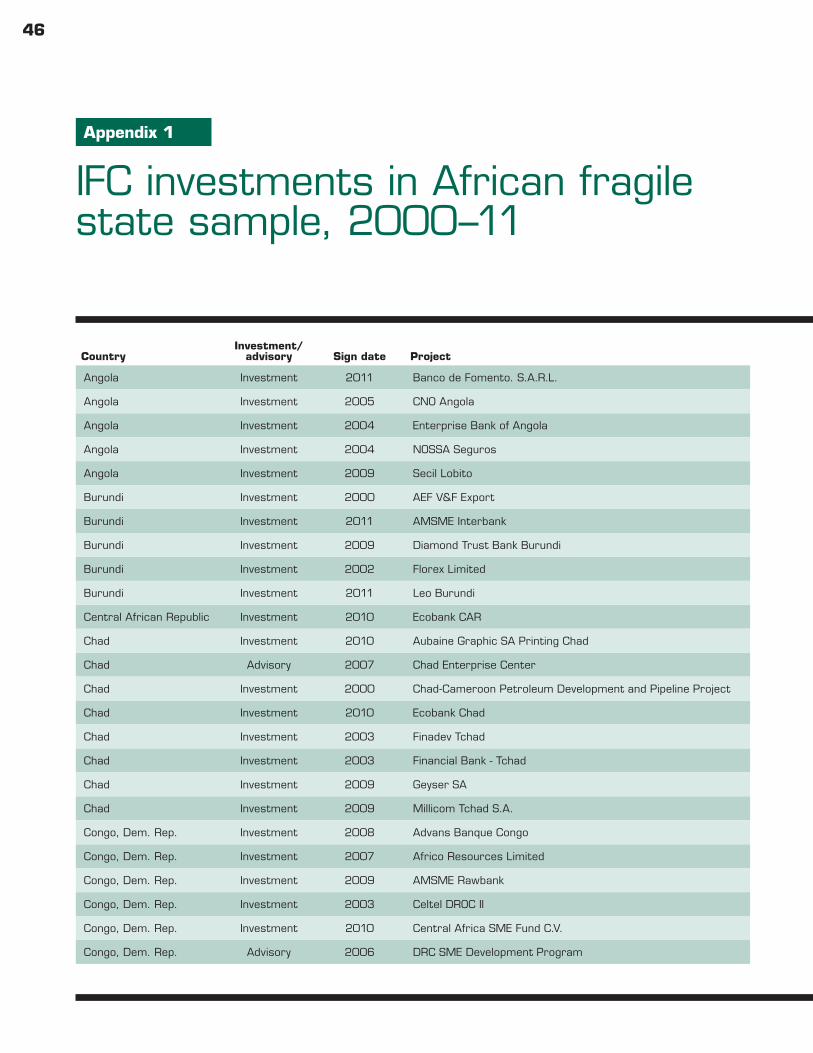
46
Appendix 1
IFC investments in African fragile state sample, 2000–11
(continued)
CountryInvestment/
advisory Sign date Project Company Sector SubsectorInvestment ($ millions)
Angola Investment 2011 Banco de Fomento. S.A.R.L. Banco de Fomento. S.A.R.L. Finance Banking 31.8
Angola Investment 2005 CNO Angola OSEL Industry Construction 10.0
Angola Investment 2004 Enterprise Bank of Angola Enterprise Bank of Angola Finance Micro, small, and medium enterprise 0.7
Angola Investment 2004 NOSSA Seguros Nossa Seguros Finance Insurance 1.0
Angola Investment 2009 Secil Lobito Secil - Companhia de Cimentos do Lobito, S.A. Industry Construction 27.0
Burundi Investment 2000 AEF V&F Export Vegetables and Flowers Exports S.A. Agriculture Horticulture 0.5
Burundi Investment 2011 AMSME Interbank Interbank Burundi Finance Banking 0.1
Burundi Investment 2009 Diamond Trust Bank Burundi Diamond Trust Bank Burundi S.A. Finance Banking 0.8
Burundi Investment 2002 Florex Limited Florex Limited Agriculture Fruits and vegetables 0.3
Burundi Investment 2011 Leo Burundi U-com Burundi S.A. Infrastructure Telecommunications 25.0
Central African Republic Investment 2010 Ecobank CAR Ecobank Centrafrique SA Finance Banking 0.1
Chad Investment 2010 Aubaine Graphic SA Printing Chad Imprimerie Aubaine Graphic SA Industry Paper products 2.8
Chad Advisory 2007 Chad Enterprise Center Chad Enterprise Center Finance Micro, small, and medium enterprise 2.1
Chad Investment 2000 Chad-Cameroon Petroleum Development and Pipeline Project Tchad Oil Transportation Company, S.A Extractive Oil and gas 27.8
Chad Investment 2010 Ecobank Chad Ecobank Tchad S.A. Finance Banking 2.9
Chad Investment 2003 Finadev Tchad Finadev Tchad Finance Micro, small, and medium enterprise 0.5
Chad Investment 2003 Financial Bank - Tchad Financial Bank - Tchad Finance Banking 1.0
Chad Investment 2009 Geyser SA Geyser SA Industry Construction 3.3
Chad Investment 2009 Millicom Tchad S.A. Millicom Tchad S.A. Infrastructure Telecommunications 21.2
Congo, Dem. Rep. Investment 2008 Advans Banque Congo Advans Banque Congo Finance Micro, small, and medium enterprise 2.2
Congo, Dem. Rep. Investment 2007 Africo Resources Limited Africo Resources Limited Extractive Mining 7.9
Congo, Dem. Rep. Investment 2009 AMSME Rawbank Rawbank Commercial Banking Finance Banking 9.9
Congo, Dem. Rep. Investment 2003 Celtel DROC II Celtel Congo (RDC) Infrastructure Telecommunications 139.0
Congo, Dem. Rep. Investment 2010 Central Africa SME Fund C.V. Central Africa SME Fund C.V. Finance Micro, small, and medium enterprise 12.5
Congo, Dem. Rep. Advisory 2006 DRC SME Development Program DRC SME Development Program Finance Micro, small, and medium enterprise 2.4
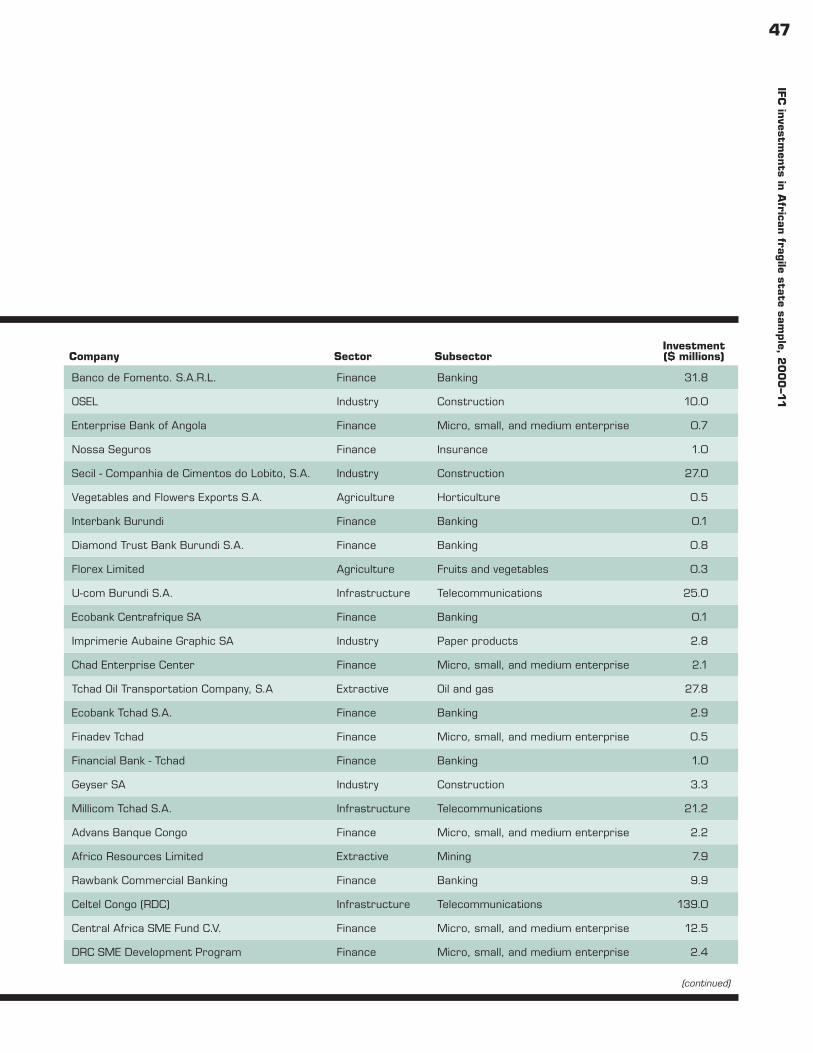
47IF
C in
vestmen
ts in A
frican fra
gile sta
te sample, 2
00
0–1
1
(continued)
CountryInvestment/
advisory Sign date Project Company Sector SubsectorInvestment ($ millions)
Angola Investment 2011 Banco de Fomento. S.A.R.L. Banco de Fomento. S.A.R.L. Finance Banking 31.8
Angola Investment 2005 CNO Angola OSEL Industry Construction 10.0
Angola Investment 2004 Enterprise Bank of Angola Enterprise Bank of Angola Finance Micro, small, and medium enterprise 0.7
Angola Investment 2004 NOSSA Seguros Nossa Seguros Finance Insurance 1.0
Angola Investment 2009 Secil Lobito Secil - Companhia de Cimentos do Lobito, S.A. Industry Construction 27.0
Burundi Investment 2000 AEF V&F Export Vegetables and Flowers Exports S.A. Agriculture Horticulture 0.5
Burundi Investment 2011 AMSME Interbank Interbank Burundi Finance Banking 0.1
Burundi Investment 2009 Diamond Trust Bank Burundi Diamond Trust Bank Burundi S.A. Finance Banking 0.8
Burundi Investment 2002 Florex Limited Florex Limited Agriculture Fruits and vegetables 0.3
Burundi Investment 2011 Leo Burundi U-com Burundi S.A. Infrastructure Telecommunications 25.0
Central African Republic Investment 2010 Ecobank CAR Ecobank Centrafrique SA Finance Banking 0.1
Chad Investment 2010 Aubaine Graphic SA Printing Chad Imprimerie Aubaine Graphic SA Industry Paper products 2.8
Chad Advisory 2007 Chad Enterprise Center Chad Enterprise Center Finance Micro, small, and medium enterprise 2.1
Chad Investment 2000 Chad-Cameroon Petroleum Development and Pipeline Project Tchad Oil Transportation Company, S.A Extractive Oil and gas 27.8
Chad Investment 2010 Ecobank Chad Ecobank Tchad S.A. Finance Banking 2.9
Chad Investment 2003 Finadev Tchad Finadev Tchad Finance Micro, small, and medium enterprise 0.5
Chad Investment 2003 Financial Bank - Tchad Financial Bank - Tchad Finance Banking 1.0
Chad Investment 2009 Geyser SA Geyser SA Industry Construction 3.3
Chad Investment 2009 Millicom Tchad S.A. Millicom Tchad S.A. Infrastructure Telecommunications 21.2
Congo, Dem. Rep. Investment 2008 Advans Banque Congo Advans Banque Congo Finance Micro, small, and medium enterprise 2.2
Congo, Dem. Rep. Investment 2007 Africo Resources Limited Africo Resources Limited Extractive Mining 7.9
Congo, Dem. Rep. Investment 2009 AMSME Rawbank Rawbank Commercial Banking Finance Banking 9.9
Congo, Dem. Rep. Investment 2003 Celtel DROC II Celtel Congo (RDC) Infrastructure Telecommunications 139.0
Congo, Dem. Rep. Investment 2010 Central Africa SME Fund C.V. Central Africa SME Fund C.V. Finance Micro, small, and medium enterprise 12.5
Congo, Dem. Rep. Advisory 2006 DRC SME Development Program DRC SME Development Program Finance Micro, small, and medium enterprise 2.4
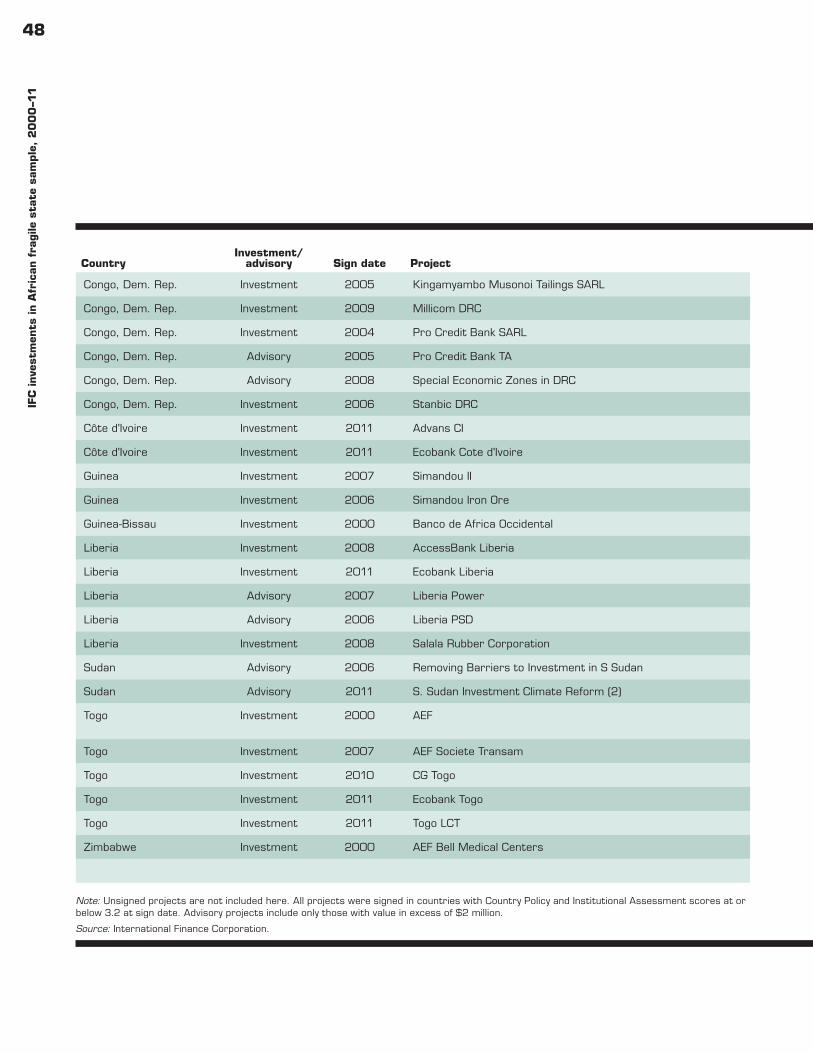
48IF
C inve
stm
ents
in A
fric
an f
ragile
sta
te s
ample
, 20
00
–11
Note: Unsigned projects are not included here. All projects were signed in countries with Country Policy and Institutional Assessment scores at or below 3.2 at sign date. Advisory projects include only those with value in excess of $2 million.
Source: International Finance Corporation.
CountryInvestment/
advisory Sign date Project Company Sector SubsectorInvestment ($ millions)
Congo, Dem. Rep. Investment 2005 Kingamyambo Musonoi Tailings SARL Kingamyambo Musonoi Tailings SARL Extractive Mining 5.4
Congo, Dem. Rep. Investment 2009 Millicom DRC Millicom DRC Infrastructure Telecommunications 80.0
Congo, Dem. Rep. Investment 2004 Pro Credit Bank SARL Pro Credit Bank SARL Finance Micro, small, and medium enterprise 1.3
Congo, Dem. Rep. Advisory 2005 Pro Credit Bank TA Pro Credit Bank TA Finance Banking 2.5
Congo, Dem. Rep. Advisory 2008 Special Economic Zones in DRC Special Economic Zones in DRC Industry Other 3.3
Congo, Dem. Rep. Investment 2006 Stanbic DRC Stanbic DRC Finance Insurance 3.0
Côte d'Ivoire Investment 2011 Advans CI Advans Côte d'Ivoire Finance Micro, small, and medium enterprise 1.0
Côte d'Ivoire Investment 2011 Ecobank Cote d'Ivoire Ecobank Côte d'Ivoire Finance Banking 0.9
Guinea Investment 2007 Simandou II SIMFER S.A. Extractive Mining 30.0
Guinea Investment 2006 Simandou Iron Ore SIMFER S.A. Extractive Mining 5.0
Guinea-Bissau Investment 2000 Banco de Africa Occidental Banco de Africa Occidental Finance Banking 0.3
Liberia Investment 2008 AccessBank Liberia AccessBank Liberia Finance Micro, small, and medium enterprise 1.5
Liberia Investment 2011 Ecobank Liberia Ecobank Liberia Finance Banking 6.0
Liberia Advisory 2007 Liberia Power Liberia Power Infrastructure Electricity 2.3
Liberia Advisory 2006 Liberia PSD Liberia PSD Industry Other 4.6
Liberia Investment 2008 Salala Rubber Corporation Salala Rubber Corporation Industry Natural fibers 10.0
Sudan Advisory 2006 Removing Barriers to Investment in S Sudan Removing Barriers to Investment in S Sudan Industry Other 2.8
Sudan Advisory 2011 S. Sudan Investment Climate Reform (2) S. Sudan Investment Climate Reform (2) Industry Other 3.0
Togo Investment 2000 AEF Centre d'Assistance de Formation et d'Etudes Informatique
ICT Internet 0.4
Togo Investment 2007 AEF Societe Transam Societe Transam-P Industry Other 1.7
Togo Investment 2010 CG Togo ContourGlobal Togo S.A. Infrastructure Electricity 14.0
Togo Investment 2011 Ecobank Togo Ecobank Togo Finance Banking 5.4
Togo Investment 2011 Togo LCT Lome Container Terminal Infrastructure Ports 122.4
Zimbabwe Investment 2000 AEF Bell Medical Centers Bell Medical Centers Services Health 0.8
Total 640.4
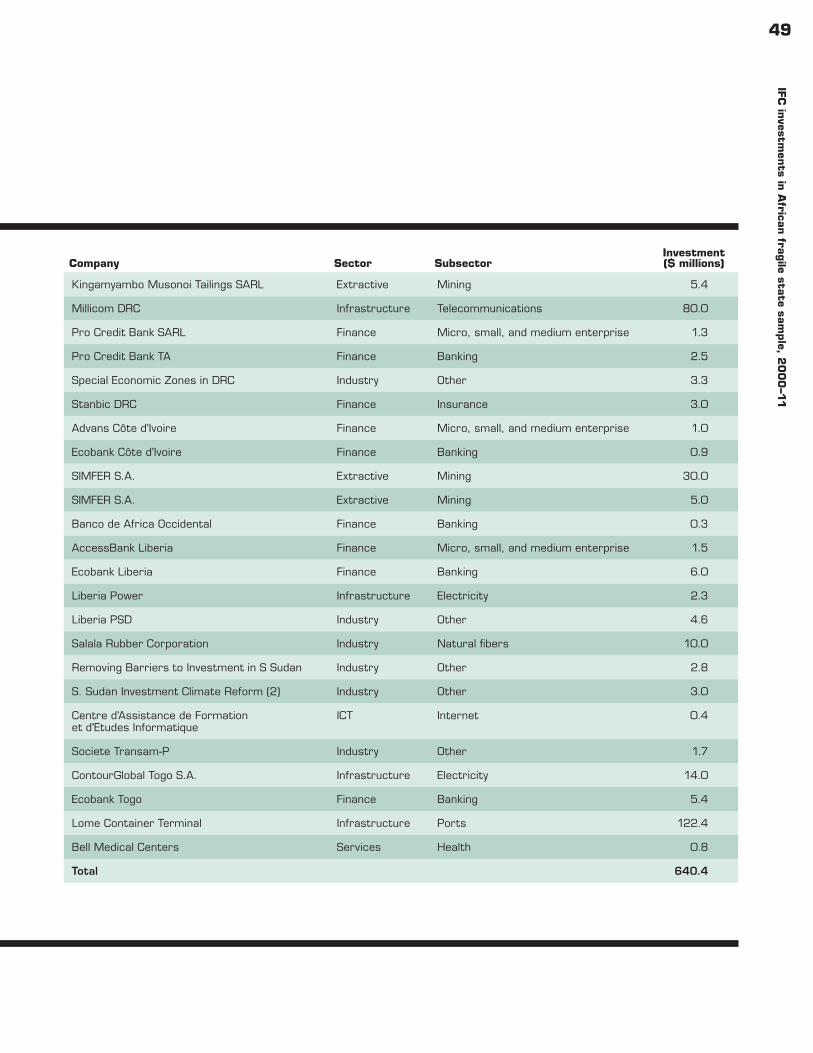
49IF
C in
vestmen
ts in A
frican fra
gile sta
te sample, 2
00
0–1
1
Note: Unsigned projects are not included here. All projects were signed in countries with Country Policy and Institutional Assessment scores at or below 3.2 at sign date. Advisory projects include only those with value in excess of $2 million.
Source: International Finance Corporation.
CountryInvestment/
advisory Sign date Project Company Sector SubsectorInvestment ($ millions)
Congo, Dem. Rep. Investment 2005 Kingamyambo Musonoi Tailings SARL Kingamyambo Musonoi Tailings SARL Extractive Mining 5.4
Congo, Dem. Rep. Investment 2009 Millicom DRC Millicom DRC Infrastructure Telecommunications 80.0
Congo, Dem. Rep. Investment 2004 Pro Credit Bank SARL Pro Credit Bank SARL Finance Micro, small, and medium enterprise 1.3
Congo, Dem. Rep. Advisory 2005 Pro Credit Bank TA Pro Credit Bank TA Finance Banking 2.5
Congo, Dem. Rep. Advisory 2008 Special Economic Zones in DRC Special Economic Zones in DRC Industry Other 3.3
Congo, Dem. Rep. Investment 2006 Stanbic DRC Stanbic DRC Finance Insurance 3.0
Côte d'Ivoire Investment 2011 Advans CI Advans Côte d'Ivoire Finance Micro, small, and medium enterprise 1.0
Côte d'Ivoire Investment 2011 Ecobank Cote d'Ivoire Ecobank Côte d'Ivoire Finance Banking 0.9
Guinea Investment 2007 Simandou II SIMFER S.A. Extractive Mining 30.0
Guinea Investment 2006 Simandou Iron Ore SIMFER S.A. Extractive Mining 5.0
Guinea-Bissau Investment 2000 Banco de Africa Occidental Banco de Africa Occidental Finance Banking 0.3
Liberia Investment 2008 AccessBank Liberia AccessBank Liberia Finance Micro, small, and medium enterprise 1.5
Liberia Investment 2011 Ecobank Liberia Ecobank Liberia Finance Banking 6.0
Liberia Advisory 2007 Liberia Power Liberia Power Infrastructure Electricity 2.3
Liberia Advisory 2006 Liberia PSD Liberia PSD Industry Other 4.6
Liberia Investment 2008 Salala Rubber Corporation Salala Rubber Corporation Industry Natural fibers 10.0
Sudan Advisory 2006 Removing Barriers to Investment in S Sudan Removing Barriers to Investment in S Sudan Industry Other 2.8
Sudan Advisory 2011 S. Sudan Investment Climate Reform (2) S. Sudan Investment Climate Reform (2) Industry Other 3.0
Togo Investment 2000 AEF Centre d'Assistance de Formation et d'Etudes Informatique
ICT Internet 0.4
Togo Investment 2007 AEF Societe Transam Societe Transam-P Industry Other 1.7
Togo Investment 2010 CG Togo ContourGlobal Togo S.A. Infrastructure Electricity 14.0
Togo Investment 2011 Ecobank Togo Ecobank Togo Finance Banking 5.4
Togo Investment 2011 Togo LCT Lome Container Terminal Infrastructure Ports 122.4
Zimbabwe Investment 2000 AEF Bell Medical Centers Bell Medical Centers Services Health 0.8
Total 640.4
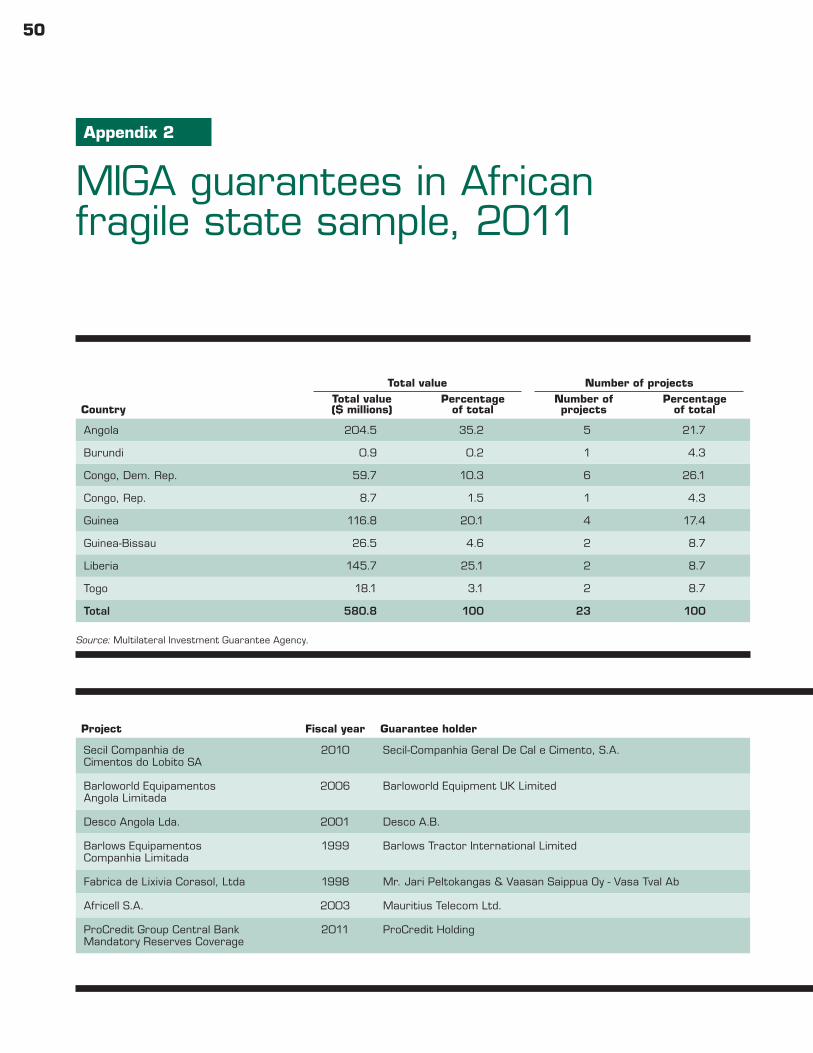
50
(continued)
Project Fiscal year Guarantee holder Investor country Sector Host countryGross
($ millions)
Secil Companhia de Cimentos do Lobito SA
2010 Secil-Companhia Geral De Cal e Cimento, S.A. Portugal Manufacturing Angola 168
Barloworld Equipamentos Angola Limitada
2006 Barloworld Equipment UK Limited United Kingdom Manufacturing Angola 14.7
Desco Angola Lda. 2001 Desco A.B. Sweden Services Angola 1
Barlows Equipamentos Companhia Limitada
1999 Barlows Tractor International Limited United Kingdom Manufacturing Angola 18.5
Fabrica de Lixivia Corasol, Ltda 1998 Mr. Jari Peltokangas & Vaasan Saippua Oy - Vasa Tval Ab Finland and Portugal Manufacturing Angola 2.3
Africell S.A. 2003 Mauritius Telecom Ltd. Mauritius Telecommunications Burundi 0.91
ProCredit Group Central Bank Mandatory Reserves Coverage
2011 ProCredit Holding Germany Banking Congo, Dem. Rep. 5
Appendix 2
MIGA guarantees in African fragile state sample, 2011
Source: Multilateral Investment Guarantee Agency.
Country
Total value Number of projectsTotal value ($ millions)
Percentage of total
Number of projects
Percentage of total
Angola 204.5 35.2 5 21.7
Burundi 0.9 0.2 1 4.3
Congo, Dem. Rep. 59.7 10.3 6 26.1
Congo, Rep. 8.7 1.5 1 4.3
Guinea 116.8 20.1 4 17.4
Guinea-Bissau 26.5 4.6 2 8.7
Liberia 145.7 25.1 2 8.7
Togo 18.1 3.1 2 8.7
Total 580.8 100 23 100
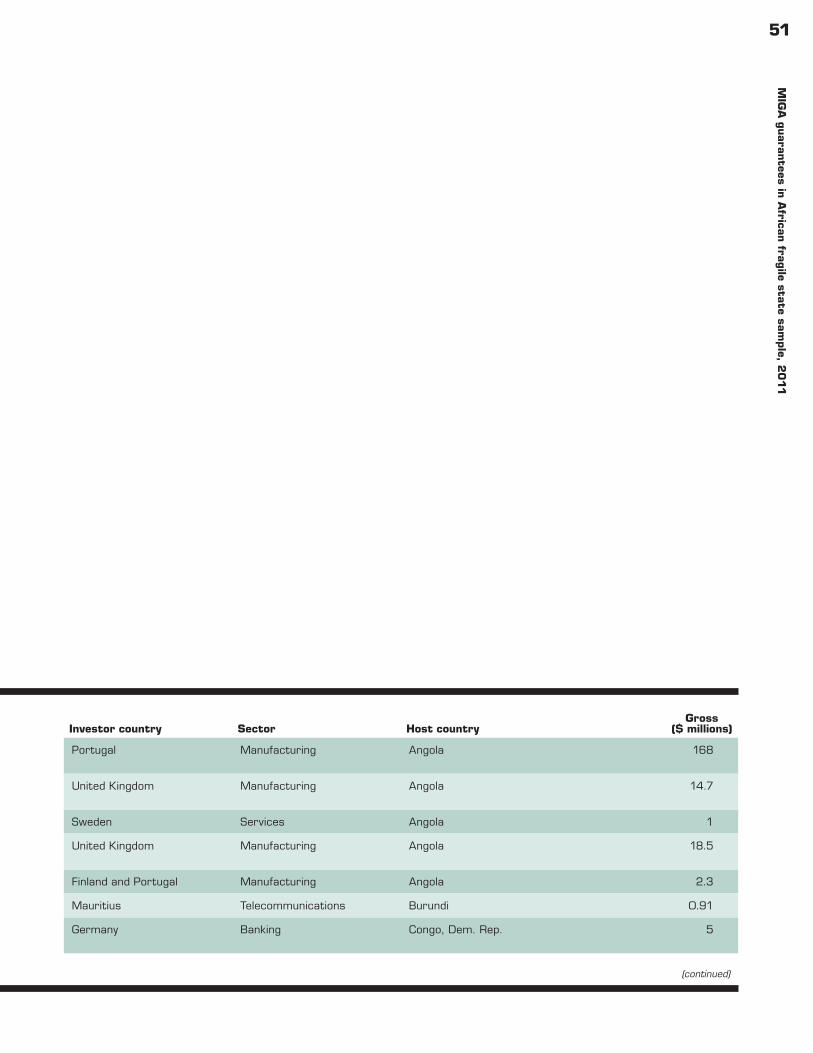
51M
IGA
guaran
tees in A
frican fra
gile sta
te sample, 2
011
(continued)
Project Fiscal year Guarantee holder Investor country Sector Host countryGross
($ millions)
Secil Companhia de Cimentos do Lobito SA
2010 Secil-Companhia Geral De Cal e Cimento, S.A. Portugal Manufacturing Angola 168
Barloworld Equipamentos Angola Limitada
2006 Barloworld Equipment UK Limited United Kingdom Manufacturing Angola 14.7
Desco Angola Lda. 2001 Desco A.B. Sweden Services Angola 1
Barlows Equipamentos Companhia Limitada
1999 Barlows Tractor International Limited United Kingdom Manufacturing Angola 18.5
Fabrica de Lixivia Corasol, Ltda 1998 Mr. Jari Peltokangas & Vaasan Saippua Oy - Vasa Tval Ab Finland and Portugal Manufacturing Angola 2.3
Africell S.A. 2003 Mauritius Telecom Ltd. Mauritius Telecommunications Burundi 0.91
ProCredit Group Central Bank Mandatory Reserves Coverage
2011 ProCredit Holding Germany Banking Congo, Dem. Rep. 5
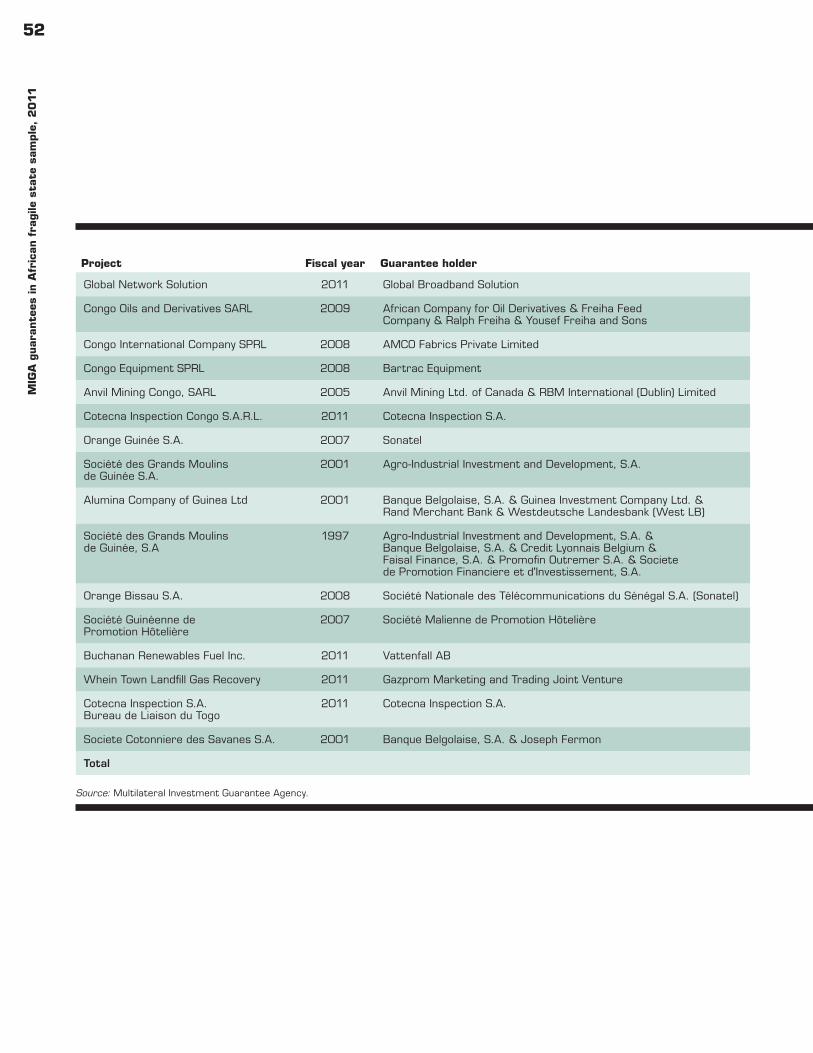
52M
IGA
guar
ante
es in A
fric
an f
ragile
sta
te s
ample
, 20
11
Source: Multilateral Investment Guarantee Agency.
Project Fiscal year Guarantee holder Investor country Sector Host countryGross
($ millions)
Global Network Solution 2011 Global Broadband Solution United States Telecommunications Congo, Dem. Rep. 11.1
Congo Oils and Derivatives SARL 2009 African Company for Oil Derivatives & Freiha Feed Company & Ralph Freiha & Yousef Freiha and Sons
Lebanon andVirgin Islands (British)
Agribusiness Congo, Dem. Rep. 4.32
Congo International Company SPRL 2008 AMCO Fabrics Private Limited India Manufacturing Congo, Dem. Rep. 0.63
Congo Equipment SPRL 2008 Bartrac Equipment Mauritius Services Congo, Dem. Rep. 25
Anvil Mining Congo, SARL 2005 Anvil Mining Ltd. of Canada & RBM International (Dublin) Limited Canada and Ireland Mining Congo, Dem. Rep. 13.6
Cotecna Inspection Congo S.A.R.L. 2011 Cotecna Inspection S.A. Switzerland Services Congo, Rep. 8.7
Orange Guinée S.A. 2007 Sonatel Senegal Telecommunications Guinea 59.4
Société des Grands Moulins de Guinée S.A.
2001 Agro-Industrial Investment and Development, S.A. Panama Agribusiness Guinea 9
Alumina Company of Guinea Ltd 2001 Banque Belgolaise, S.A. & Guinea Investment Company Ltd. & Rand Merchant Bank & Westdeutsche Landesbank (West LB)
Cayman Islands Manufacturing Guinea 40
Société des Grands Moulins de Guinée, S.A
1997 Agro-Industrial Investment and Development, S.A. & Banque Belgolaise, S.A. & Credit Lyonnais Belgium & Faisal Finance, S.A. & Promofin Outremer S.A. & Societe de Promotion Financiere et d'Investissement, S.A.
Belgium, Luxembourg, and Switzerland
Manufacturing Guinea 8.35
Orange Bissau S.A. 2008 Société Nationale des Télécommunications du Sénégal S.A. (Sonatel) Senegal Telecommunications Guinea-Bissau 25.9
Société Guinéenne de Promotion Hôtelière
2007 Société Malienne de Promotion Hôtelière Mali Tourism Guinea-Bissau 0.6
Buchanan Renewables Fuel Inc. 2011 Vattenfall AB Sweden Agribusiness Liberia 142.2
Whein Town Landfill Gas Recovery 2011 Gazprom Marketing and Trading Joint Venture United Kingdom Solid waste management Liberia 3.5
Cotecna Inspection S.A. Bureau de Liaison du Togo
2011 Cotecna Inspection S.A. Switzerland Services Togo 10.7
Societe Cotonniere des Savanes S.A. 2001 Banque Belgolaise, S.A. & Joseph Fermon Belgium Agribusiness Togo 7.4
Total 580.81
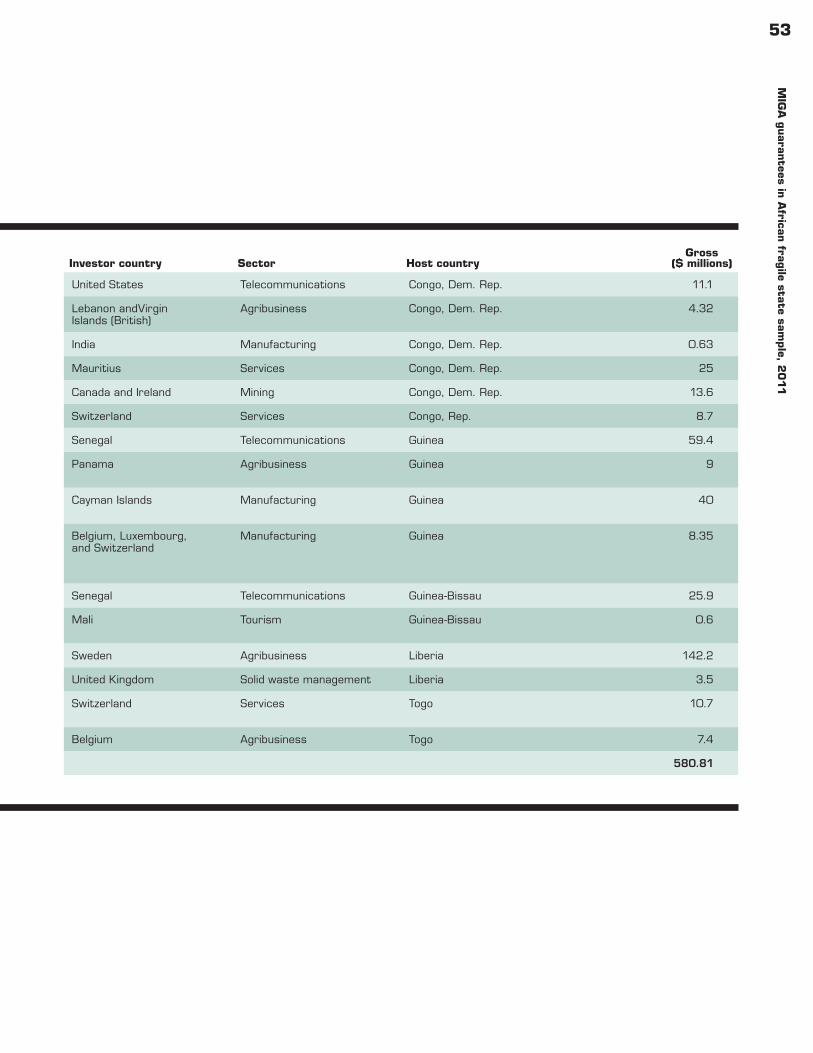
53M
IGA
guaran
tees in A
frican fra
gile sta
te sample, 2
011
Source: Multilateral Investment Guarantee Agency.
Project Fiscal year Guarantee holder Investor country Sector Host countryGross
($ millions)
Global Network Solution 2011 Global Broadband Solution United States Telecommunications Congo, Dem. Rep. 11.1
Congo Oils and Derivatives SARL 2009 African Company for Oil Derivatives & Freiha Feed Company & Ralph Freiha & Yousef Freiha and Sons
Lebanon andVirgin Islands (British)
Agribusiness Congo, Dem. Rep. 4.32
Congo International Company SPRL 2008 AMCO Fabrics Private Limited India Manufacturing Congo, Dem. Rep. 0.63
Congo Equipment SPRL 2008 Bartrac Equipment Mauritius Services Congo, Dem. Rep. 25
Anvil Mining Congo, SARL 2005 Anvil Mining Ltd. of Canada & RBM International (Dublin) Limited Canada and Ireland Mining Congo, Dem. Rep. 13.6
Cotecna Inspection Congo S.A.R.L. 2011 Cotecna Inspection S.A. Switzerland Services Congo, Rep. 8.7
Orange Guinée S.A. 2007 Sonatel Senegal Telecommunications Guinea 59.4
Société des Grands Moulins de Guinée S.A.
2001 Agro-Industrial Investment and Development, S.A. Panama Agribusiness Guinea 9
Alumina Company of Guinea Ltd 2001 Banque Belgolaise, S.A. & Guinea Investment Company Ltd. & Rand Merchant Bank & Westdeutsche Landesbank (West LB)
Cayman Islands Manufacturing Guinea 40
Société des Grands Moulins de Guinée, S.A
1997 Agro-Industrial Investment and Development, S.A. & Banque Belgolaise, S.A. & Credit Lyonnais Belgium & Faisal Finance, S.A. & Promofin Outremer S.A. & Societe de Promotion Financiere et d'Investissement, S.A.
Belgium, Luxembourg, and Switzerland
Manufacturing Guinea 8.35
Orange Bissau S.A. 2008 Société Nationale des Télécommunications du Sénégal S.A. (Sonatel) Senegal Telecommunications Guinea-Bissau 25.9
Société Guinéenne de Promotion Hôtelière
2007 Société Malienne de Promotion Hôtelière Mali Tourism Guinea-Bissau 0.6
Buchanan Renewables Fuel Inc. 2011 Vattenfall AB Sweden Agribusiness Liberia 142.2
Whein Town Landfill Gas Recovery 2011 Gazprom Marketing and Trading Joint Venture United Kingdom Solid waste management Liberia 3.5
Cotecna Inspection S.A. Bureau de Liaison du Togo
2011 Cotecna Inspection S.A. Switzerland Services Togo 10.7
Societe Cotonniere des Savanes S.A. 2001 Banque Belgolaise, S.A. & Joseph Fermon Belgium Agribusiness Togo 7.4
Total 580.81

55
The effectiveness of traditional aid (as opposed to private sector development) programs in fragile states can provide helpful, albeit cautionary, lessons for private sector–focused efforts. In examin-ing the World Bank’s performance-based allocation process, Gelb (2010) highlights the alarmingly low success rate of International Development Association (IDA) projects in fragile states.1 Gelb attributes much of this failure to improper incentive structures and poor performance feedback loops. His paper contends that the extended time between project preparation, approval, and formal results evaluation (either intermediate or final) is incon-sistent with staffing timelines — diffusing any potential incentive effects.2 In other words, project designers and often task managers have long since left the scene by the time the projects receive their formal evaluations.
In addition, recipient countries’ project portfolio performance scores have little effect on their overarching IDA allocations, an attribute that often perpetuates the low success rate of future proj-ects.3 Currently, portfolio performance scores account for only 8 percent of the total IDA allocation determination formula.4 But a host country’s Country Policy and Institutional Assessment
(CPIA) score accounts for a much larger portion. For example, a 10 percent increase in a given country’s CPIA rating would pro-duce a 55 percent increase in its total IDA allocation. By con-trast, a 10 percent increase in its portfolio rating would only raise a country’s total IDA allocation by slightly more than 4 percent. Therefore, the existing IDA allocation process may provide little incentive for fragile state governments and IDA staff to maximize the effectiveness of development funds in the short and medium term.5
Notes1. States with CPIA scores below 3.0 are considered “core” frag-
ile states, while those with scores between 3.0 and 3.2 are con-sidered “marginal” fragile states.
2. Gelb (2010).3. Portfolio performance scores account for only 8 percent of the
IDA allocation determination formula.4. The African Development Fund has a similar project portfolio
performance weighting.5. Gelb (2010).
Appendix 3
Traditional aid modality limitations in fragile states
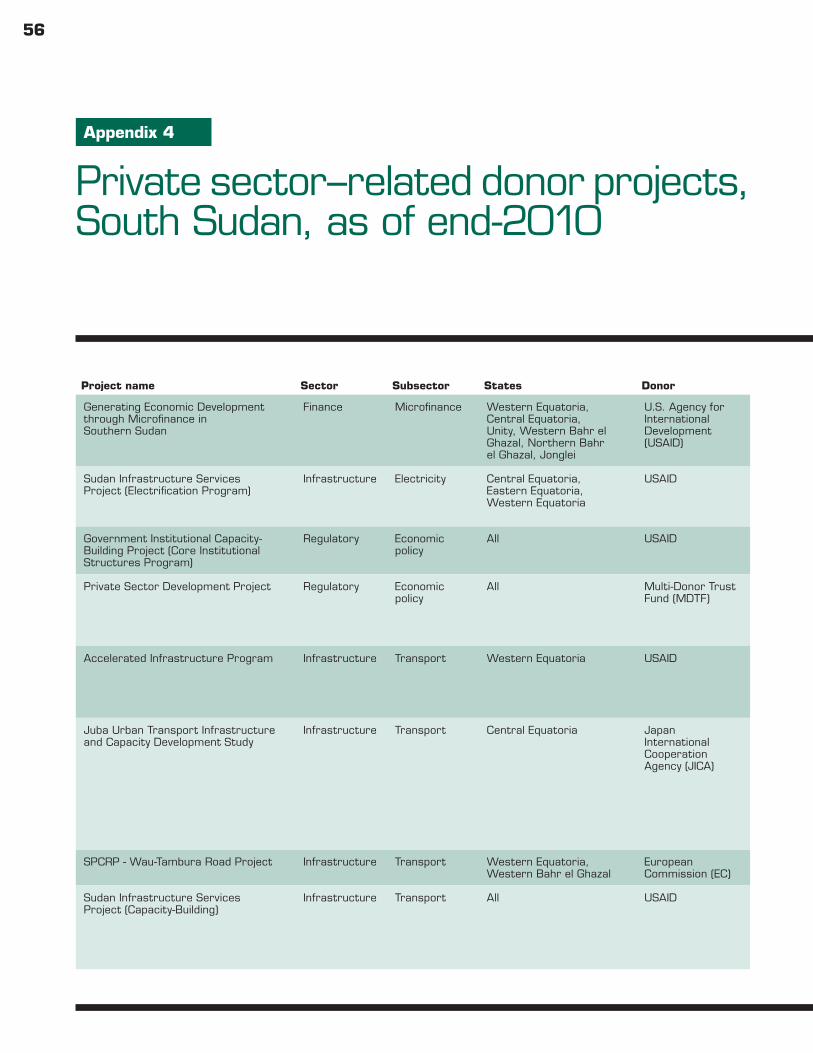
56
Appendix 4
Private sector–related donor projects, South Sudan, as of end-2010
(continued)
Project name Sector Subsector States Donor Overview
Project total ($)
Disbursements ($)
2009 2010 2011 2012
Generating Economic Development through Microfinance in Southern Sudan
Finance Microfinance Western Equatoria, Central Equatoria, Unity, Western Bahr el Ghazal, Northern Bahr el Ghazal, Jonglei
U.S. Agency for International Development (USAID)
Technical assistance and managerial capacity for microfinance institutions. Increased support for the microfinance sector in Southern Sudan. Expanding microfinance facilities by providing loan capital. Creating new products and extending services to new locations.
12,615,000 4,615,000 4,295,000 3,705,000 —
Sudan Infrastructure Services Project (Electrification Program)
Infrastructure Electricity Central Equatoria, Eastern Equatoria, Western Equatoria
USAID Constructing electricity infrastructure in Kapoeta and Maridi. Training and capacity-building for public sector to improve electricity services. Developing an electricity policy.
13,202,600 4,000,000 4,500,000 3,702,600 —
Government Institutional Capacity-Building Project (Core Institutional Structures Program)
Regulatory Economic policy
All USAID Support for Bank of South Sudan operations through technical assistance and focus on key areas associated with government of South Sudan priorities.
13,767,562 3,190,000 3,190,000 — —
Private Sector Development Project Regulatory Economic policy
All Multi-Donor Trust Fund (MDTF)
Developing a policy and regulatory framework that promotes trade and investment. Drafting of trade bills. MCI Institutional Capacity Review. Establishment of Public Private Dialogue Forum. Developing a microfinance policy framework.
20,200,000 18,196,653 2,000,000 — —
Accelerated Infrastructure Program Infrastructure Transport Western Equatoria USAID Rehabilitating 100 kilometers (km) of Yambio-Tambura road, regrading the 75-km Dabio-Ezzo road, constructing the Bandame Bridge in Yei. Rehabilitating remaining 85 km of the Yambio-Tambura road and regrading the 75 km Dabio-Ezzo road.
40,289,703 17,000,000 1,500,000 — —
Juba Urban Transport Infrastructure and Capacity Development Study
Infrastructure Transport Central Equatoria Japan International Cooperation Agency (JICA)
Formulating a transport network master plan for Juba and its surrounding area with a target year 2025. Formulating a project for reconstruction of bridge/culverts. Conducting feasibility studies on high-priority projects. Preparing capacity development plan for engineers in charge of road improvement/maintenance in MTR/MoPI and supporting execution of the capacity development plan. Supporting planning and implementation of pilot projects as an important part of capacity development.
4,000,000 2,000,000 900,000 — —
SPCRP - Wau-Tambura Road Project Infrastructure Transport Western Equatoria, Western Bahr el Ghazal
European Commission (EC)
Constructing the Busheri, Duma, and Bo bridges on Wau-Tambura road.
8,400,000 4,340,000 4,060,000 — —
Sudan Infrastructure Services Project (Capacity-Building)
Infrastructure Transport All USAID Capacity-building for MTR and state Ministries of Physical Infrastructure to procure services and maintain roads. Training people in transportation-related policy and regulatory practices. Providing training, equipment, and contracts for private sector to rehabilitate and maintain up to 1,000 km of feeder roads.
13,850,000 5,750,000 5,550,000 4,550,000 —
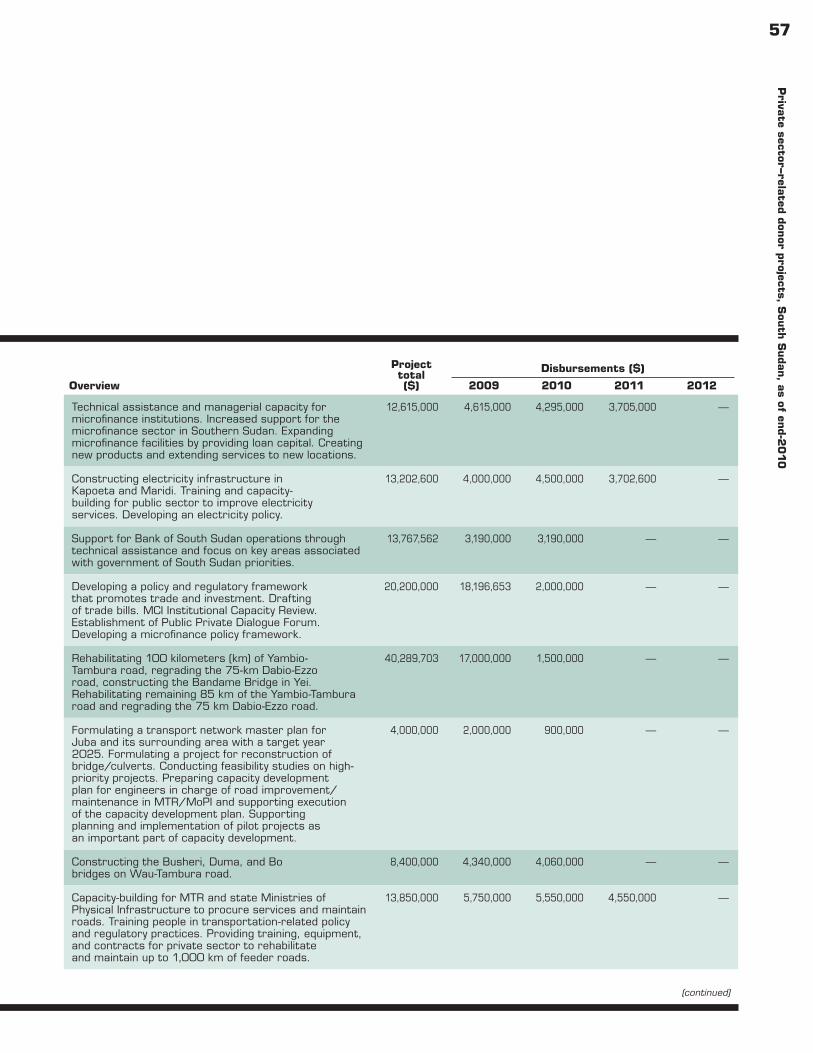
57P
rivate sector–rela
ted don
or projects, S
outh
Sudan, a
s of end-2
010
(continued)
Project name Sector Subsector States Donor Overview
Project total ($)
Disbursements ($)
2009 2010 2011 2012
Generating Economic Development through Microfinance in Southern Sudan
Finance Microfinance Western Equatoria, Central Equatoria, Unity, Western Bahr el Ghazal, Northern Bahr el Ghazal, Jonglei
U.S. Agency for International Development (USAID)
Technical assistance and managerial capacity for microfinance institutions. Increased support for the microfinance sector in Southern Sudan. Expanding microfinance facilities by providing loan capital. Creating new products and extending services to new locations.
12,615,000 4,615,000 4,295,000 3,705,000 —
Sudan Infrastructure Services Project (Electrification Program)
Infrastructure Electricity Central Equatoria, Eastern Equatoria, Western Equatoria
USAID Constructing electricity infrastructure in Kapoeta and Maridi. Training and capacity-building for public sector to improve electricity services. Developing an electricity policy.
13,202,600 4,000,000 4,500,000 3,702,600 —
Government Institutional Capacity-Building Project (Core Institutional Structures Program)
Regulatory Economic policy
All USAID Support for Bank of South Sudan operations through technical assistance and focus on key areas associated with government of South Sudan priorities.
13,767,562 3,190,000 3,190,000 — —
Private Sector Development Project Regulatory Economic policy
All Multi-Donor Trust Fund (MDTF)
Developing a policy and regulatory framework that promotes trade and investment. Drafting of trade bills. MCI Institutional Capacity Review. Establishment of Public Private Dialogue Forum. Developing a microfinance policy framework.
20,200,000 18,196,653 2,000,000 — —
Accelerated Infrastructure Program Infrastructure Transport Western Equatoria USAID Rehabilitating 100 kilometers (km) of Yambio-Tambura road, regrading the 75-km Dabio-Ezzo road, constructing the Bandame Bridge in Yei. Rehabilitating remaining 85 km of the Yambio-Tambura road and regrading the 75 km Dabio-Ezzo road.
40,289,703 17,000,000 1,500,000 — —
Juba Urban Transport Infrastructure and Capacity Development Study
Infrastructure Transport Central Equatoria Japan International Cooperation Agency (JICA)
Formulating a transport network master plan for Juba and its surrounding area with a target year 2025. Formulating a project for reconstruction of bridge/culverts. Conducting feasibility studies on high-priority projects. Preparing capacity development plan for engineers in charge of road improvement/maintenance in MTR/MoPI and supporting execution of the capacity development plan. Supporting planning and implementation of pilot projects as an important part of capacity development.
4,000,000 2,000,000 900,000 — —
SPCRP - Wau-Tambura Road Project Infrastructure Transport Western Equatoria, Western Bahr el Ghazal
European Commission (EC)
Constructing the Busheri, Duma, and Bo bridges on Wau-Tambura road.
8,400,000 4,340,000 4,060,000 — —
Sudan Infrastructure Services Project (Capacity-Building)
Infrastructure Transport All USAID Capacity-building for MTR and state Ministries of Physical Infrastructure to procure services and maintain roads. Training people in transportation-related policy and regulatory practices. Providing training, equipment, and contracts for private sector to rehabilitate and maintain up to 1,000 km of feeder roads.
13,850,000 5,750,000 5,550,000 4,550,000 —

58P
riva
te s
ecto
r–re
late
d don
or p
roje
cts,
Sou
th S
uda
n, a
s of
end-2
010
(continued)
Project name Sector Subsector States Donor Overview
Project total ($)
Disbursements ($)
2009 2010 2011 2012
Sudan Infrastructure Services Project (Juba-Nimule Road)
Infrastructure Transport Central Equatoria, Eastern Equatoria
USAID Rehabilitating the 192-km Juba-Nimuli road and seven bridges.
135,044,000 35,600,000 63,444,000 16,000,000 —
WFP Emergency Road Project Infrastructure Transport Warrap, Western Bahr el Ghazal
U.K. Department For International Development (DfID)
Repairing the Wau-Wunrock road; socioeconomic report; emergency bridging.
6,011,525 150,000 — — —
WFP Road Repair Infrastructure Transport Eastern Equatoria, Central Equatoria, Western Equatoria, Lakes, Warrap, Western Bahr el Ghazal
CHF International Repairing road sections and structures to keep access open on key roads (including repairs to 20 bridges).
754,000 754,000 — — —
WFP Road Repairs Infrastructure Transport Central Equatoria, Western Equatoria, Lakes
Japan Bank for International Cooperation
Maintaining three roads: Yei-Faraksika, Faraksika-Rumbek, and Rumbek-Yirol.
11,990,826 6,000,000 — — —
Sudan Emergency Transport and Infrastructure Project
Infrastructure Transport All MDTF Studying 7,000 km of rural roads in 10 states. Doing design, social, environmental, and economic studies for Kaya-Yei-Juba and Nadapal-Juba roads. Carrying out emergency road repairs by rehabilitating 285 km of roads, maintaining 579 km of roads, doing gravel road construction of 170 km, and providing technical assistance to MTR.
150,000,000 4,150,000 41,500,000 — —
Capacity Project for Urban Street Improvement and Maintenance in Juba
Infrastructure Transport Central Equatoria JICA Establishing MoPI's system and organization for urban street improvement/maintenance. Improving MoPI's capacity in resurfacing and gravel pavement construction and maintenance. Studying how to efficiently maintain resurfacing and gravel pavement roads and finding a means of improving their serviceable period.
3,000,000 — 1,000,000 1,000,000 1,000,000
Community Livelihood Security Agriculture Product inputs
Western Bahr el Ghazal Sudan Recovery Fund (SRF)
Providing agricultural inputs to 1,400 households. Specifically supporting 270 households for crop diversification. Assisting 240 individuals to become commercial vegetable producers.
503,178 288,312 214,867 — —
Creating Opportunities through Livestock and Dairy Development Project
Agriculture Eastern Equatoria SRF N/A 1,499,940 1,059,071 440,869 — —
Emergency Agriculture Assistance to Vulnerable Groups in Central and Western Equatoria States
Agriculture Product inputs
Central Equatoria, Eastern Equatoria
Central Emergency Response Fund
Providing seeds and tools to low resource–affected internally displaced persons and refugees.
385,414 385,414 — — —
Enhancing Self-Reliance for Communities in Northern Bahr el Ghazal State
Agriculture Capacity-building, inputs
Northern Bahr el Ghazal SRF Organizing farmers into larger groups. Providing seeds and training. Establishing 24 large farms benefiting 260 households
974,347 — — — —
Gogrial Livelihoods and Income Production Recovery Project in Warrap State
Agriculture Capacity-building
Warrap SRF Constructing one training center. Supporting eight groups. Providing seeds to 3,000 households. Supporting 40 adaptive research farmers. Training 3,000 farmers in horticulture.
745,389 626,904 118,485 — —
Bridging the Gap between Relief and Rural Economic Development in Juba County
Agriculture Capacity-building
Central Equatoria SRF Poultry production, seeds and agricultural tools provision; skills training
1,834,804 1,454,401 380,403 — —
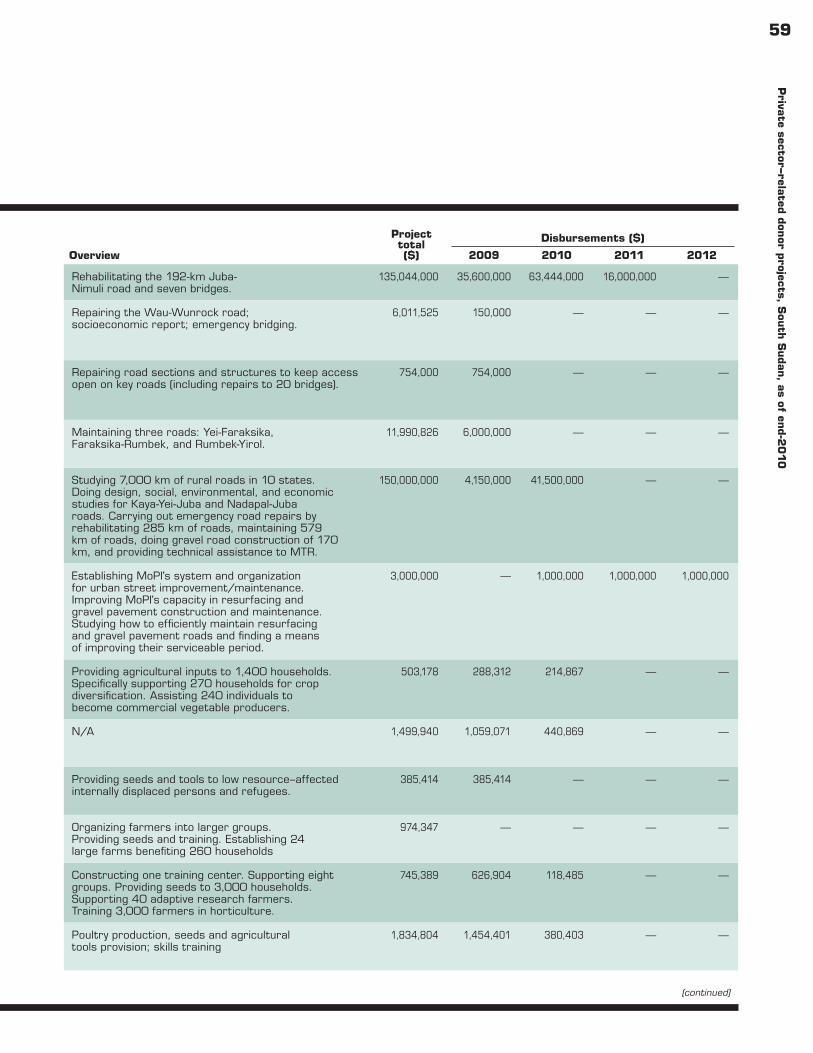
59P
rivate sector–rela
ted don
or projects, S
outh
Sudan, a
s of end-2
010
(continued)
Project name Sector Subsector States Donor Overview
Project total ($)
Disbursements ($)
2009 2010 2011 2012
Sudan Infrastructure Services Project (Juba-Nimule Road)
Infrastructure Transport Central Equatoria, Eastern Equatoria
USAID Rehabilitating the 192-km Juba-Nimuli road and seven bridges.
135,044,000 35,600,000 63,444,000 16,000,000 —
WFP Emergency Road Project Infrastructure Transport Warrap, Western Bahr el Ghazal
U.K. Department For International Development (DfID)
Repairing the Wau-Wunrock road; socioeconomic report; emergency bridging.
6,011,525 150,000 — — —
WFP Road Repair Infrastructure Transport Eastern Equatoria, Central Equatoria, Western Equatoria, Lakes, Warrap, Western Bahr el Ghazal
CHF International Repairing road sections and structures to keep access open on key roads (including repairs to 20 bridges).
754,000 754,000 — — —
WFP Road Repairs Infrastructure Transport Central Equatoria, Western Equatoria, Lakes
Japan Bank for International Cooperation
Maintaining three roads: Yei-Faraksika, Faraksika-Rumbek, and Rumbek-Yirol.
11,990,826 6,000,000 — — —
Sudan Emergency Transport and Infrastructure Project
Infrastructure Transport All MDTF Studying 7,000 km of rural roads in 10 states. Doing design, social, environmental, and economic studies for Kaya-Yei-Juba and Nadapal-Juba roads. Carrying out emergency road repairs by rehabilitating 285 km of roads, maintaining 579 km of roads, doing gravel road construction of 170 km, and providing technical assistance to MTR.
150,000,000 4,150,000 41,500,000 — —
Capacity Project for Urban Street Improvement and Maintenance in Juba
Infrastructure Transport Central Equatoria JICA Establishing MoPI's system and organization for urban street improvement/maintenance. Improving MoPI's capacity in resurfacing and gravel pavement construction and maintenance. Studying how to efficiently maintain resurfacing and gravel pavement roads and finding a means of improving their serviceable period.
3,000,000 — 1,000,000 1,000,000 1,000,000
Community Livelihood Security Agriculture Product inputs
Western Bahr el Ghazal Sudan Recovery Fund (SRF)
Providing agricultural inputs to 1,400 households. Specifically supporting 270 households for crop diversification. Assisting 240 individuals to become commercial vegetable producers.
503,178 288,312 214,867 — —
Creating Opportunities through Livestock and Dairy Development Project
Agriculture Eastern Equatoria SRF N/A 1,499,940 1,059,071 440,869 — —
Emergency Agriculture Assistance to Vulnerable Groups in Central and Western Equatoria States
Agriculture Product inputs
Central Equatoria, Eastern Equatoria
Central Emergency Response Fund
Providing seeds and tools to low resource–affected internally displaced persons and refugees.
385,414 385,414 — — —
Enhancing Self-Reliance for Communities in Northern Bahr el Ghazal State
Agriculture Capacity-building, inputs
Northern Bahr el Ghazal SRF Organizing farmers into larger groups. Providing seeds and training. Establishing 24 large farms benefiting 260 households
974,347 — — — —
Gogrial Livelihoods and Income Production Recovery Project in Warrap State
Agriculture Capacity-building
Warrap SRF Constructing one training center. Supporting eight groups. Providing seeds to 3,000 households. Supporting 40 adaptive research farmers. Training 3,000 farmers in horticulture.
745,389 626,904 118,485 — —
Bridging the Gap between Relief and Rural Economic Development in Juba County
Agriculture Capacity-building
Central Equatoria SRF Poultry production, seeds and agricultural tools provision; skills training
1,834,804 1,454,401 380,403 — —
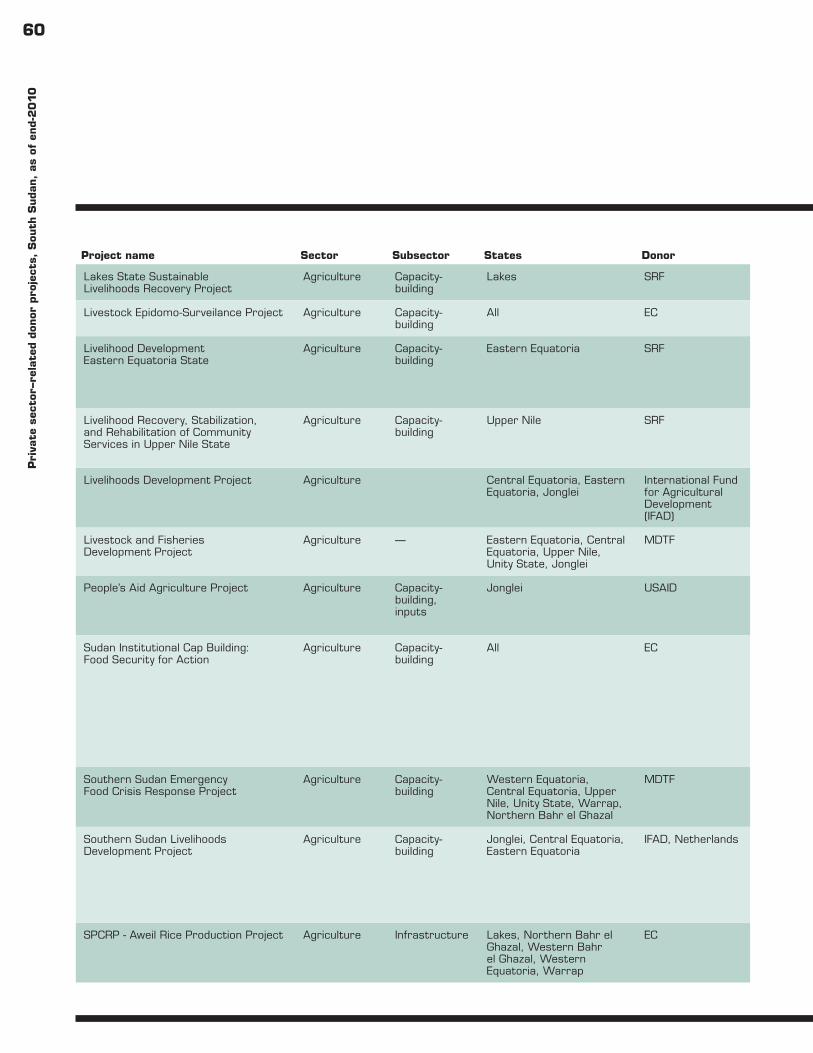
60P
riva
te s
ecto
r–re
late
d don
or p
roje
cts,
Sou
th S
uda
n, a
s of
end-2
010
(continued)
Project name Sector Subsector States Donor Overview
Project total ($)
Disbursements ($)
2009 2010 2011 2012
Lakes State Sustainable Livelihoods Recovery Project
Agriculture Capacity-building
Lakes SRF Providing agricultural inputs and small-scale irrigation. Promoting poultry production.
1,278,328 912,912 365,416 — —
Livestock Epidomo-Surveilance Project Agriculture Capacity-building
All EC N/A 4,970,000 1,631,409 1,631,409 — —
Livelihood Development Eastern Equatoria State
Agriculture Capacity-building
Eastern Equatoria SRF Constructing seven marketplaces. Establishing seven demonstration farms. Constructing 5,000 meters of feeder roads to agricultural marketplaces. Training 420 farmers in agricultural production and 140 persons in management.
1,500,000 870,606 629,394 — —
Livelihood Recovery, Stabilization, and Rehabilitation of Community Services in Upper Nile State
Agriculture Capacity-building
Upper Nile SRF Establishing three cooperative farms with 50 members, three livestock production and health cooperatives with 50 members each, and three animal health centers. Training 500 individuals in basics of horticulture.
1,476,453 1,004,867 471,586 — —
Livelihoods Development Project Agriculture Central Equatoria, Eastern Equatoria, Jonglei
International Fund for Agricultural Development (IFAD)
Supporting community-based development of productive activities in agricultural, livestock, and fisheries sector, including access to markets.
25,900,000 500,000 3,500,000 4,500,000 4,500,000
Livestock and Fisheries Development Project
Agriculture — Eastern Equatoria, Central Equatoria, Upper Nile, Unity State, Jonglei
MDTF N/A 7,670,000 14,236,700 4,692,706 — —
People’s Aid Agriculture Project Agriculture Capacity-building, inputs
Jonglei USAID Providing seeds (141 tonnes) and tools to returnees and the flood-affected. Training 2,200 farmers, 170 promoters, and 147 outreach groups, and doing additional training.
1,494,996 1,494,996 — — —
Sudan Institutional Cap Building: Food Security for Action
Agriculture Capacity-building
All EC Food security policymaking and planning systems component covers the support to the various processes needed to convert data collection into food security and livelihoods analysis and decisionmaking. Developing baseline and information systems component that covers different surveys and supports existing and future food security–related information systems. Increasing food security research and capacity-building fund to support small-scale interventions in food-insecure areas.
14,000,000 2,619,516 1,876,184 800,000 —
Southern Sudan Emergency Food Crisis Response Project
Agriculture Capacity-building
Western Equatoria, Central Equatoria, Upper Nile, Unity State, Warrap, Northern Bahr el Ghazal
MDTF Providing targeted agricultural technologies to groups and extension through nongovernmental organizations.
5,000,000 850,000 2,500,000 — —
Southern Sudan Livelihoods Development Project
Agriculture Capacity-building
Jonglei, Central Equatoria, Eastern Equatoria
IFAD, Netherlands Sensitizing and training 62 boma committees. Benefiting 3,800 households with productivity programs. Training 186 interest groups and managing their agriculture projects effectively. Strengthening technical capacity and office environment of six county offices. Supporting increase of county capacity to prevent or resolve conflicts over access to grazing and water.
25,900,000 2,113,100 3,591,900 5,671,000 3,560,000
SPCRP - Aweil Rice Production Project Agriculture Infrastructure Lakes, Northern Bahr el Ghazal, Western Bahr el Ghazal, Western Equatoria, Warrap
EC Rehabilitating 30 percent of the Aweil Rice Scheme, especially the irrigation channels and dykes. Producing rice and other crops in collaboration with local farmers.
7,000,000 2,500,000 2,500,000 852,373 —
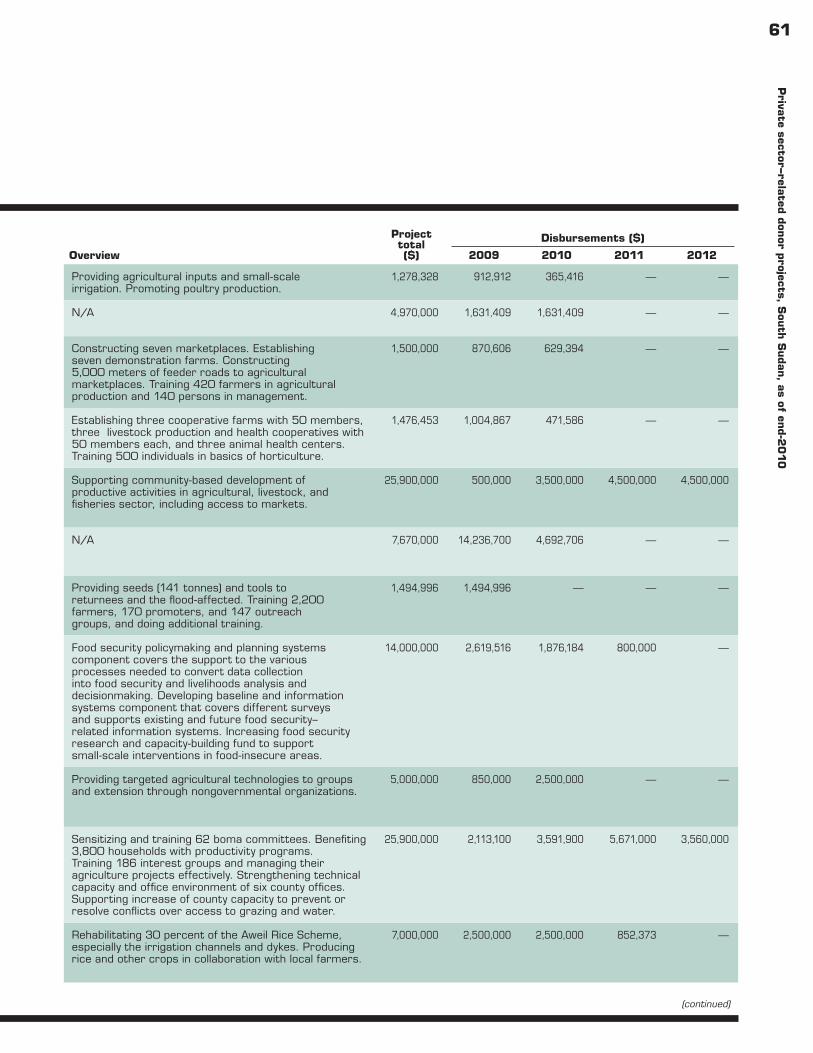
61P
rivate sector–rela
ted don
or projects, S
outh
Sudan, a
s of end-2
010
(continued)
Project name Sector Subsector States Donor Overview
Project total ($)
Disbursements ($)
2009 2010 2011 2012
Lakes State Sustainable Livelihoods Recovery Project
Agriculture Capacity-building
Lakes SRF Providing agricultural inputs and small-scale irrigation. Promoting poultry production.
1,278,328 912,912 365,416 — —
Livestock Epidomo-Surveilance Project Agriculture Capacity-building
All EC N/A 4,970,000 1,631,409 1,631,409 — —
Livelihood Development Eastern Equatoria State
Agriculture Capacity-building
Eastern Equatoria SRF Constructing seven marketplaces. Establishing seven demonstration farms. Constructing 5,000 meters of feeder roads to agricultural marketplaces. Training 420 farmers in agricultural production and 140 persons in management.
1,500,000 870,606 629,394 — —
Livelihood Recovery, Stabilization, and Rehabilitation of Community Services in Upper Nile State
Agriculture Capacity-building
Upper Nile SRF Establishing three cooperative farms with 50 members, three livestock production and health cooperatives with 50 members each, and three animal health centers. Training 500 individuals in basics of horticulture.
1,476,453 1,004,867 471,586 — —
Livelihoods Development Project Agriculture Central Equatoria, Eastern Equatoria, Jonglei
International Fund for Agricultural Development (IFAD)
Supporting community-based development of productive activities in agricultural, livestock, and fisheries sector, including access to markets.
25,900,000 500,000 3,500,000 4,500,000 4,500,000
Livestock and Fisheries Development Project
Agriculture — Eastern Equatoria, Central Equatoria, Upper Nile, Unity State, Jonglei
MDTF N/A 7,670,000 14,236,700 4,692,706 — —
People’s Aid Agriculture Project Agriculture Capacity-building, inputs
Jonglei USAID Providing seeds (141 tonnes) and tools to returnees and the flood-affected. Training 2,200 farmers, 170 promoters, and 147 outreach groups, and doing additional training.
1,494,996 1,494,996 — — —
Sudan Institutional Cap Building: Food Security for Action
Agriculture Capacity-building
All EC Food security policymaking and planning systems component covers the support to the various processes needed to convert data collection into food security and livelihoods analysis and decisionmaking. Developing baseline and information systems component that covers different surveys and supports existing and future food security–related information systems. Increasing food security research and capacity-building fund to support small-scale interventions in food-insecure areas.
14,000,000 2,619,516 1,876,184 800,000 —
Southern Sudan Emergency Food Crisis Response Project
Agriculture Capacity-building
Western Equatoria, Central Equatoria, Upper Nile, Unity State, Warrap, Northern Bahr el Ghazal
MDTF Providing targeted agricultural technologies to groups and extension through nongovernmental organizations.
5,000,000 850,000 2,500,000 — —
Southern Sudan Livelihoods Development Project
Agriculture Capacity-building
Jonglei, Central Equatoria, Eastern Equatoria
IFAD, Netherlands Sensitizing and training 62 boma committees. Benefiting 3,800 households with productivity programs. Training 186 interest groups and managing their agriculture projects effectively. Strengthening technical capacity and office environment of six county offices. Supporting increase of county capacity to prevent or resolve conflicts over access to grazing and water.
25,900,000 2,113,100 3,591,900 5,671,000 3,560,000
SPCRP - Aweil Rice Production Project Agriculture Infrastructure Lakes, Northern Bahr el Ghazal, Western Bahr el Ghazal, Western Equatoria, Warrap
EC Rehabilitating 30 percent of the Aweil Rice Scheme, especially the irrigation channels and dykes. Producing rice and other crops in collaboration with local farmers.
7,000,000 2,500,000 2,500,000 852,373 —
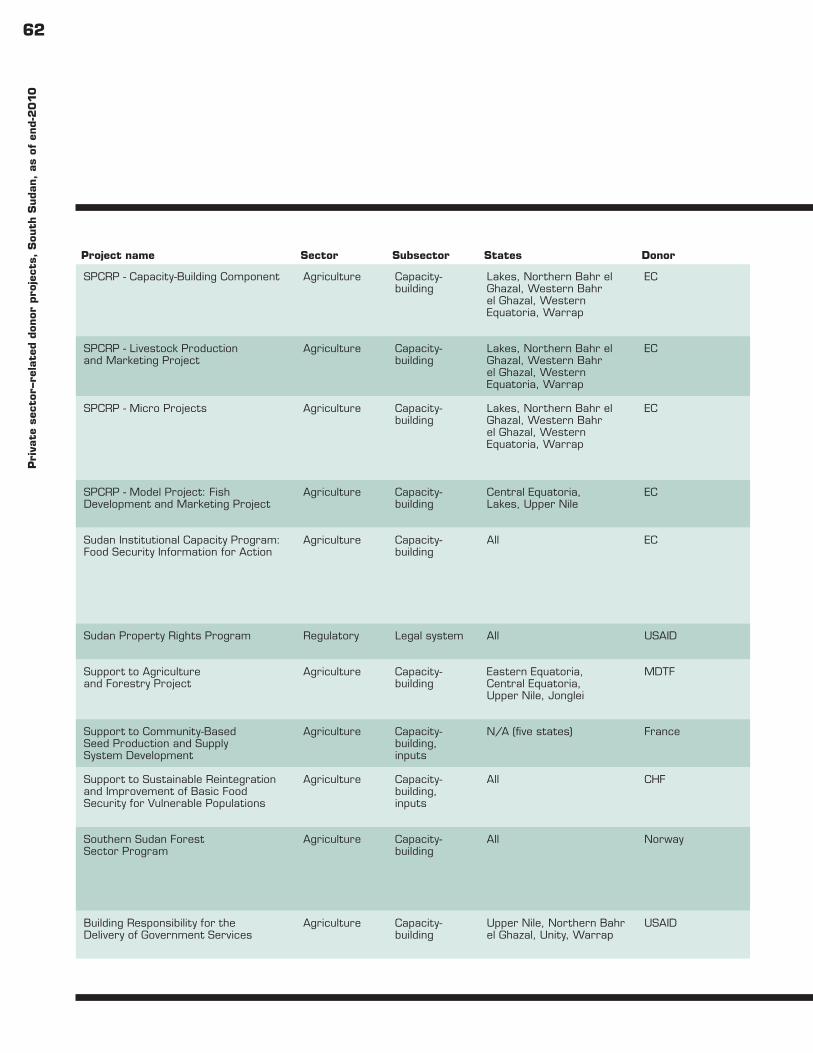
62P
riva
te s
ecto
r–re
late
d don
or p
roje
cts,
Sou
th S
uda
n, a
s of
end-2
010
(continued)
Project name Sector Subsector States Donor Overview
Project total ($)
Disbursements ($)
2009 2010 2011 2012
SPCRP - Capacity-Building Component Agriculture Capacity-building
Lakes, Northern Bahr el Ghazal, Western Bahr el Ghazal, Western Equatoria, Warrap
EC Undertaking strategic planning for all the five states. Constructing state headquarters for the Ministry of Agriculture and Animal Resources and at least three county offices from each of the five states. Providing equipment for the offices to support implementation.
25,900,000 8,470,000 4,470,000 4,470,000 —
SPCRP - Livestock Production and Marketing Project
Agriculture Capacity-building
Lakes, Northern Bahr el Ghazal, Western Bahr el Ghazal, Western Equatoria, Warrap
EC Increasing knowledge and improving management of livestock production and marketing. Improving and increasing trade in livestock and livestock products and the livelihoods of livestock owners and traders.
5,880,000 2,000,000 1,500,000 525,431 —
SPCRP - Micro Projects Agriculture Capacity-building
Lakes, Northern Bahr el Ghazal, Western Bahr el Ghazal, Western Equatoria, Warrap
EC Making micro grants to support private institutions and rural businesses such as development corporations, private sector organizations, cooperatives and farmers, pastoralists, and fishers’ unions, and to develop a mechanism to support investment in agribusiness initiatives and marketing systems.
2,800,000 500,000 1,800,000 500,000 —
SPCRP - Model Project: Fish Development and Marketing Project
Agriculture Capacity-building
Central Equatoria, Lakes, Upper Nile
EC Doing needs assessment and baseline surveys. Procuring fishing equipment. Supporting production, processing, and marketing activities.
4,500,000 — — — —
Sudan Institutional Capacity Program: Food Security Information for Action
Agriculture Capacity-building
All EC Building the institutional capacity for food security information collection. Strengthening government food security and livelihoods policy analysis capacity. Supporting a functioning crop and livestock information system, and functioning crop and livestock monitoring and forecasting systems. Establishing food security natural resources information system.
12,360,000 3,500,000 3,300,000 1,770,000 —
Sudan Property Rights Program Regulatory Legal system All USAID Improving laws and regulations affecting property rights of the urban and rural poor.
5,000,000 2,000,000 3,000,000 — —
Support to Agriculture and Forestry Project
Agriculture Capacity-building
Eastern Equatoria, Central Equatoria, Upper Nile, Jonglei
MDTF Developing legislation, codes, and guidelines. Helping benefit 81,000 people with improved technologies. Forming a research forum. Developing a research framework. Increasing support to adoptive research.
10,000,000 7,000,000 14,000,000 — —
Support to Community-Based Seed Production and Supply System Development
Agriculture Capacity-building, inputs
N/A (five states) France Training extension agents and farmers in seed production and quality control. Multiplying the locally preferred seeds in the five selected states.
781,371 590,000 191,371 — —
Support to Sustainable Reintegration and Improvement of Basic Food Security for Vulnerable Populations
Agriculture Capacity-building, inputs
All CHF Supporting 100,000 beneficiary households in accessing their seeds and tools needed to improve their food security and livelihoods. Training 1,500 farmers in improved agronomic practices.
4,500,000 4,500,000 — — —
Southern Sudan Forest Sector Program
Agriculture Capacity-building
All Norway Developing methodologies and systems for forest resource assessment of plantations and natural forests. Implementing forest inventories in selected pilot areas. Developing a concession agreement baseline for Southern Sudan based on the interim government constitution and emerging forest law.
1,558,950 1,558,950 — — —
Building Responsibility for the Delivery of Government Services
Agriculture Capacity-building
Upper Nile, Northern Bahr el Ghazal, Unity, Warrap
USAID Providing an increased number of livestock owners with extension services and training. Increased incomes from animal and fish resources.
15,000,000 4,402,000 5,410,000 — —
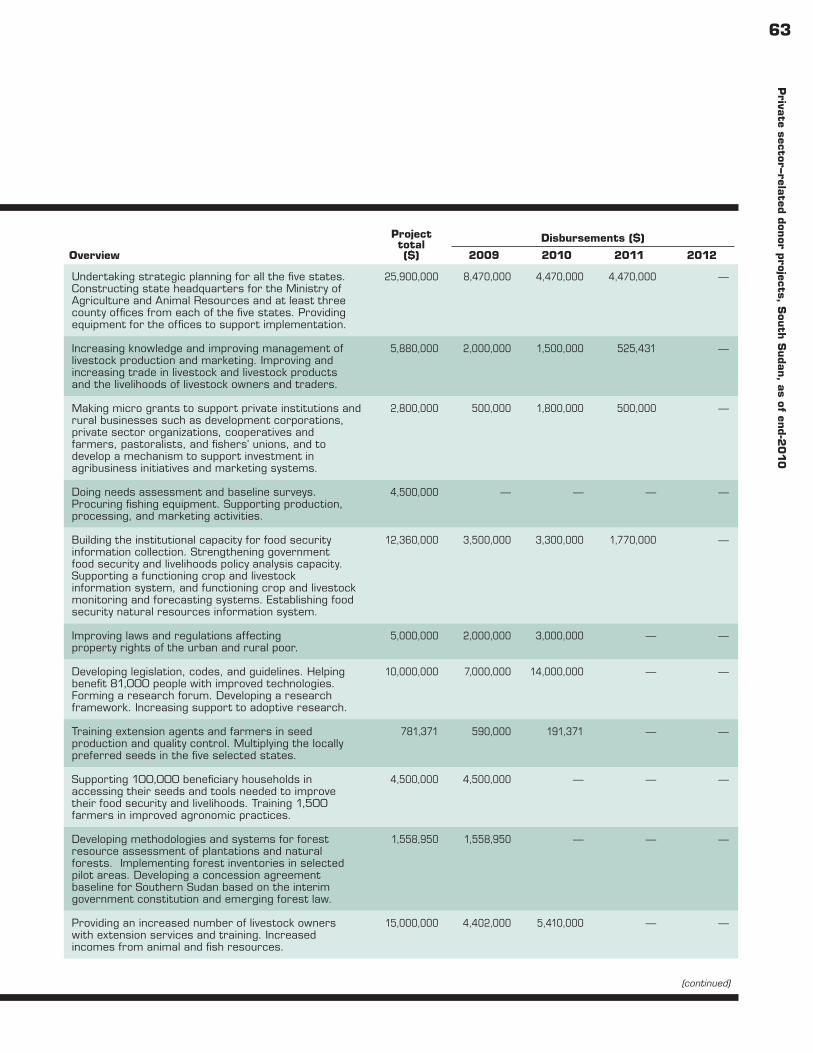
63P
rivate sector–rela
ted don
or projects, S
outh
Sudan, a
s of end-2
010
(continued)
Project name Sector Subsector States Donor Overview
Project total ($)
Disbursements ($)
2009 2010 2011 2012
SPCRP - Capacity-Building Component Agriculture Capacity-building
Lakes, Northern Bahr el Ghazal, Western Bahr el Ghazal, Western Equatoria, Warrap
EC Undertaking strategic planning for all the five states. Constructing state headquarters for the Ministry of Agriculture and Animal Resources and at least three county offices from each of the five states. Providing equipment for the offices to support implementation.
25,900,000 8,470,000 4,470,000 4,470,000 —
SPCRP - Livestock Production and Marketing Project
Agriculture Capacity-building
Lakes, Northern Bahr el Ghazal, Western Bahr el Ghazal, Western Equatoria, Warrap
EC Increasing knowledge and improving management of livestock production and marketing. Improving and increasing trade in livestock and livestock products and the livelihoods of livestock owners and traders.
5,880,000 2,000,000 1,500,000 525,431 —
SPCRP - Micro Projects Agriculture Capacity-building
Lakes, Northern Bahr el Ghazal, Western Bahr el Ghazal, Western Equatoria, Warrap
EC Making micro grants to support private institutions and rural businesses such as development corporations, private sector organizations, cooperatives and farmers, pastoralists, and fishers’ unions, and to develop a mechanism to support investment in agribusiness initiatives and marketing systems.
2,800,000 500,000 1,800,000 500,000 —
SPCRP - Model Project: Fish Development and Marketing Project
Agriculture Capacity-building
Central Equatoria, Lakes, Upper Nile
EC Doing needs assessment and baseline surveys. Procuring fishing equipment. Supporting production, processing, and marketing activities.
4,500,000 — — — —
Sudan Institutional Capacity Program: Food Security Information for Action
Agriculture Capacity-building
All EC Building the institutional capacity for food security information collection. Strengthening government food security and livelihoods policy analysis capacity. Supporting a functioning crop and livestock information system, and functioning crop and livestock monitoring and forecasting systems. Establishing food security natural resources information system.
12,360,000 3,500,000 3,300,000 1,770,000 —
Sudan Property Rights Program Regulatory Legal system All USAID Improving laws and regulations affecting property rights of the urban and rural poor.
5,000,000 2,000,000 3,000,000 — —
Support to Agriculture and Forestry Project
Agriculture Capacity-building
Eastern Equatoria, Central Equatoria, Upper Nile, Jonglei
MDTF Developing legislation, codes, and guidelines. Helping benefit 81,000 people with improved technologies. Forming a research forum. Developing a research framework. Increasing support to adoptive research.
10,000,000 7,000,000 14,000,000 — —
Support to Community-Based Seed Production and Supply System Development
Agriculture Capacity-building, inputs
N/A (five states) France Training extension agents and farmers in seed production and quality control. Multiplying the locally preferred seeds in the five selected states.
781,371 590,000 191,371 — —
Support to Sustainable Reintegration and Improvement of Basic Food Security for Vulnerable Populations
Agriculture Capacity-building, inputs
All CHF Supporting 100,000 beneficiary households in accessing their seeds and tools needed to improve their food security and livelihoods. Training 1,500 farmers in improved agronomic practices.
4,500,000 4,500,000 — — —
Southern Sudan Forest Sector Program
Agriculture Capacity-building
All Norway Developing methodologies and systems for forest resource assessment of plantations and natural forests. Implementing forest inventories in selected pilot areas. Developing a concession agreement baseline for Southern Sudan based on the interim government constitution and emerging forest law.
1,558,950 1,558,950 — — —
Building Responsibility for the Delivery of Government Services
Agriculture Capacity-building
Upper Nile, Northern Bahr el Ghazal, Unity, Warrap
USAID Providing an increased number of livestock owners with extension services and training. Increased incomes from animal and fish resources.
15,000,000 4,402,000 5,410,000 — —
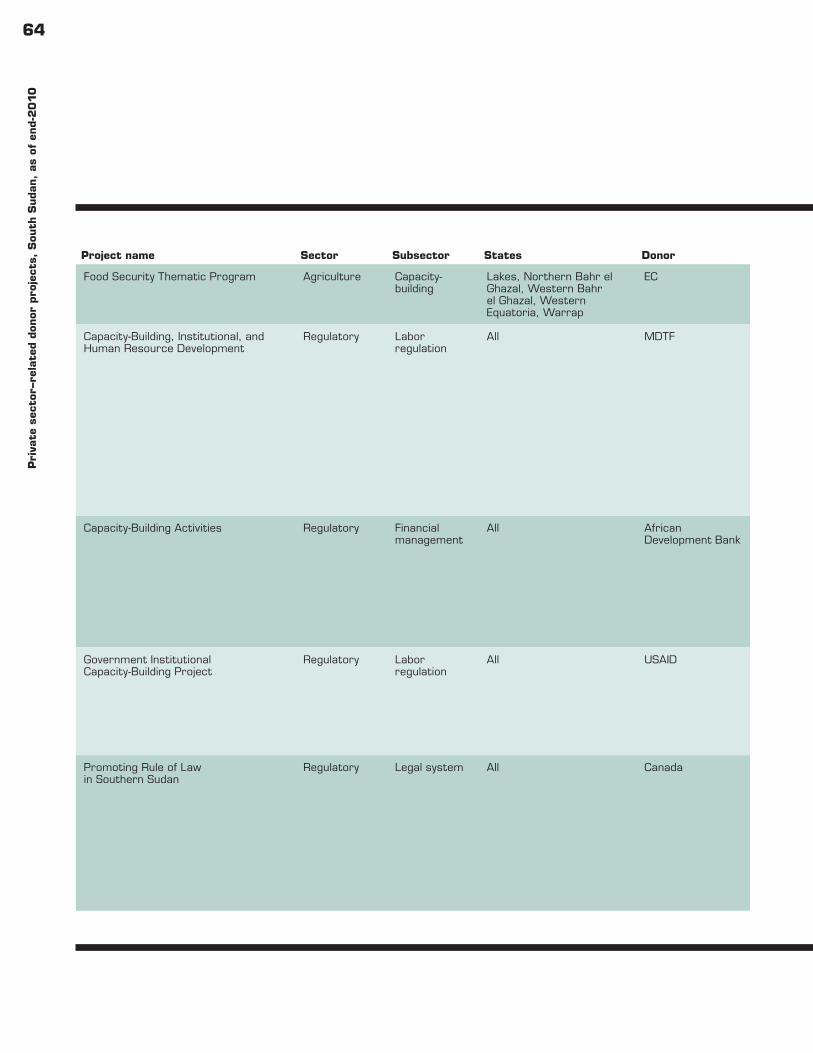
64P
riva
te s
ecto
r–re
late
d don
or p
roje
cts,
Sou
th S
uda
n, a
s of
end-2
010
(continued)
Project name Sector Subsector States Donor Overview
Project total ($)
Disbursements ($)
2009 2010 2011 2012
Food Security Thematic Program Agriculture Capacity-building
Lakes, Northern Bahr el Ghazal, Western Bahr el Ghazal, Western Equatoria, Warrap
EC Supporting various productive activities including crop farming, livestock production, and income generation.
10,448,769 3,000,000 4,000,000 2,500,000 948,769
Capacity-Building, Institutional, and Human Resource Development
Regulatory Labor regulation
All MDTF Renovating, reactivating, equipping, and furnishing three labor offices in 2009. Training 37 labor officers in labor administration in 2009. Establishing three emergency employment centers in 2009. Finalizing labor policy and handing it over to the government in 2009. Training ex-combatant men and women in vocational skills in the three vocational training centers in 2009. Finalizing vocational training policy and handing it over to the government in 2009. Equipping and furnishing four labor offices in 2010. Training 20 labor officers in labor administration. Establishing four emergency employment centers. Rehabilitating three vocational training centers by 2010. Training about 1,800 students in vocational skills by 2010. Furnishing and equipping one vocational training center.
13,732,000 8,134,081 2,788,706 — —
Capacity-Building Activities Regulatory Financial management
All African Development Bank
Enhancing capacities at Budget Sector Working Groups at state levels and at Independent Commissions. Building training center built and making it operational. Training support for public financial management courses. Developing a robust public procurement policy and regulation and regulations on public financial management law. Doing a study on non-oil revenue taxation. Conducting three growth seminars. Providing a policy advisor at the Ministry of Finance and Economic Planning (Fragile States Facility).
11,589,000 2,500,000 1,000,000 1,000,000 2,500,000
Government Institutional Capacity-Building Project
Regulatory Labor regulation
All USAID Supporting the organizational capacity of the Ministry of Labor, Public Service, and Human Resource Development in development and implementation of the government Public Service Act and regulations. Supporting public sector reforms, developing human resource information system, developing training policy, supporting the Capacity-Building Unit, and developing/updating the ministry's three-year strategic plan.
15,666,536 3,630,000 3,630,000 — —
Promoting Rule of Law in Southern Sudan
Regulatory Legal system All Canada Constructing a court building in a location to be decided upon by the judiciary. Consultancy on e-Library for the Judiciary. Planning and procurement of the Judiciary of South Sudan furniture and equipment. Training support for professional and support staff. Recruiting a capacity development specialist. Judicial training program (to be decided by the judiciary). Computer skills training for staff of the judiciary. Distributing legal documents in the judiciary. Publishing, printing, and distributing legal documents to the courts of the judiciary around South Sudan. United Nations Development Programme project management for activities to support the judiciary.
3,049,582 2,712,290 337,292 — —
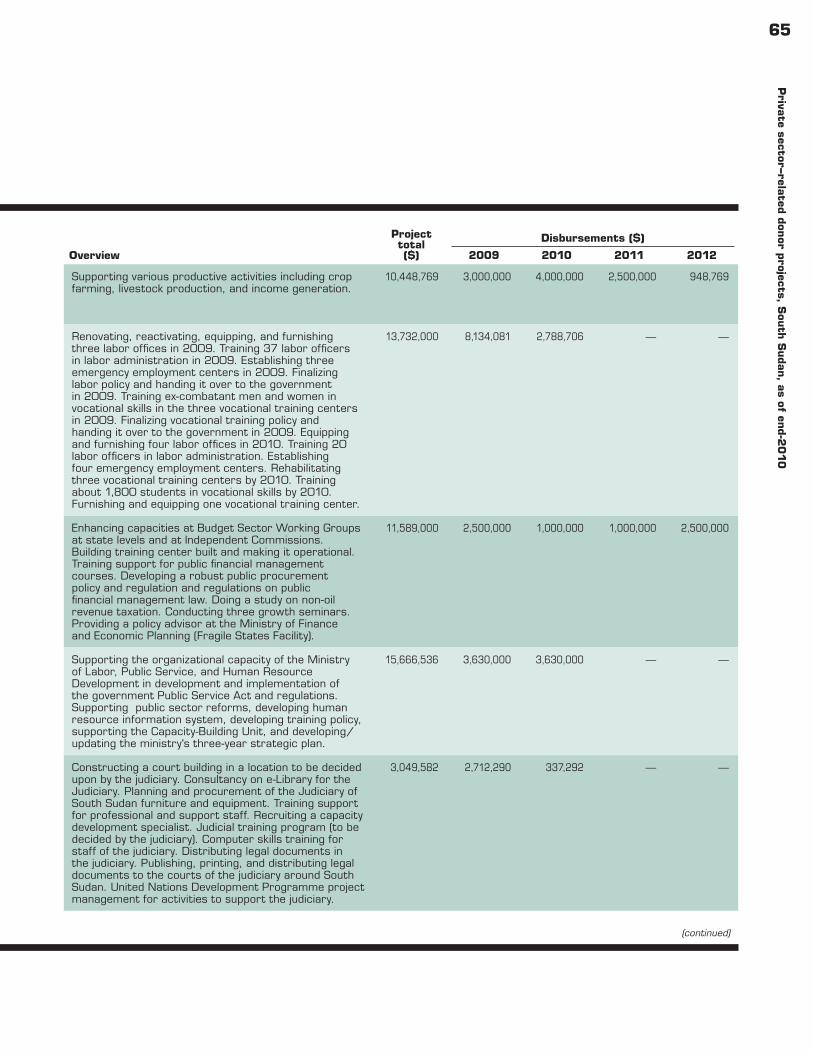
65P
rivate sector–rela
ted don
or projects, S
outh
Sudan, a
s of end-2
010
(continued)
Project name Sector Subsector States Donor Overview
Project total ($)
Disbursements ($)
2009 2010 2011 2012
Food Security Thematic Program Agriculture Capacity-building
Lakes, Northern Bahr el Ghazal, Western Bahr el Ghazal, Western Equatoria, Warrap
EC Supporting various productive activities including crop farming, livestock production, and income generation.
10,448,769 3,000,000 4,000,000 2,500,000 948,769
Capacity-Building, Institutional, and Human Resource Development
Regulatory Labor regulation
All MDTF Renovating, reactivating, equipping, and furnishing three labor offices in 2009. Training 37 labor officers in labor administration in 2009. Establishing three emergency employment centers in 2009. Finalizing labor policy and handing it over to the government in 2009. Training ex-combatant men and women in vocational skills in the three vocational training centers in 2009. Finalizing vocational training policy and handing it over to the government in 2009. Equipping and furnishing four labor offices in 2010. Training 20 labor officers in labor administration. Establishing four emergency employment centers. Rehabilitating three vocational training centers by 2010. Training about 1,800 students in vocational skills by 2010. Furnishing and equipping one vocational training center.
13,732,000 8,134,081 2,788,706 — —
Capacity-Building Activities Regulatory Financial management
All African Development Bank
Enhancing capacities at Budget Sector Working Groups at state levels and at Independent Commissions. Building training center built and making it operational. Training support for public financial management courses. Developing a robust public procurement policy and regulation and regulations on public financial management law. Doing a study on non-oil revenue taxation. Conducting three growth seminars. Providing a policy advisor at the Ministry of Finance and Economic Planning (Fragile States Facility).
11,589,000 2,500,000 1,000,000 1,000,000 2,500,000
Government Institutional Capacity-Building Project
Regulatory Labor regulation
All USAID Supporting the organizational capacity of the Ministry of Labor, Public Service, and Human Resource Development in development and implementation of the government Public Service Act and regulations. Supporting public sector reforms, developing human resource information system, developing training policy, supporting the Capacity-Building Unit, and developing/updating the ministry's three-year strategic plan.
15,666,536 3,630,000 3,630,000 — —
Promoting Rule of Law in Southern Sudan
Regulatory Legal system All Canada Constructing a court building in a location to be decided upon by the judiciary. Consultancy on e-Library for the Judiciary. Planning and procurement of the Judiciary of South Sudan furniture and equipment. Training support for professional and support staff. Recruiting a capacity development specialist. Judicial training program (to be decided by the judiciary). Computer skills training for staff of the judiciary. Distributing legal documents in the judiciary. Publishing, printing, and distributing legal documents to the courts of the judiciary around South Sudan. United Nations Development Programme project management for activities to support the judiciary.
3,049,582 2,712,290 337,292 — —
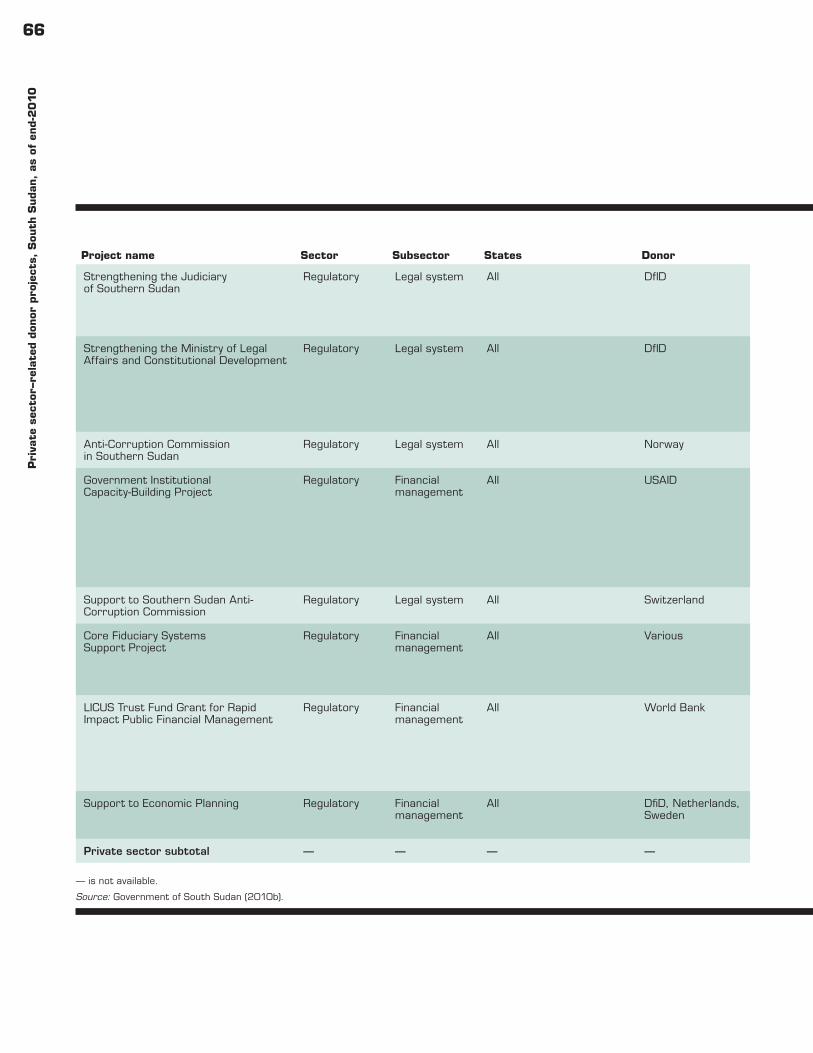
66P
riva
te s
ecto
r–re
late
d don
or p
roje
cts,
Sou
th S
uda
n, a
s of
end-2
010
— is not available.
Source: Government of South Sudan (2010b).
Project name Sector Subsector States Donor Overview
Project total ($)
Disbursements ($)
2009 2010 2011 2012
Strengthening the Judiciary of Southern Sudan
Regulatory Legal system All DfID Constructing and rehabilitating/renovating judiciary infrastructural facilities. Procuring equipment and furniture for the judiciary. Providing capacity development support to the judiciary, and advisory, research, and technical support on judicial issues.
10,994,995 3,785,885 — — —
Strengthening the Ministry of Legal Affairs and Constitutional Development
Regulatory Legal system All DfID Facilitating policy dialogue and developing policy development capacity. Developing legal training capacity through technical, logistical, and infrastructural support, including the Legal Studies Institute. Developing customary law regulatory framework through technical, logistical, and infrastructural support, including of the Customary Law Development Center.
10,640,060 2,671,478 — — —
Anti-Corruption Commission in Southern Sudan
Regulatory Legal system All Norway N/A 464,000 294,000 — — —
Government Institutional Capacity-Building Project
Regulatory Financial management
All USAID Supporting the Ministry of Finance and Economic Planning, which includes developing efficient and transparent payment and approval systems called the Financial Management Information System (FMIS) and a pilot of the FMIS in two states, Northern Bahr El Ghazal and Upper Nile. In addition, supporting the establishment of the treasury, the development and implementation of revenue administration policies and procedures, and the provision of training and capacity-building.
8,490,000 5,300,000 3,190,000 — —
Support to Southern Sudan Anti-Corruption Commission
Regulatory Legal system All Switzerland N/A 107,000 29,000 — — —
Core Fiduciary Systems Support Project
Regulatory Financial management
All Various Providing a project accounting agent to the government. Tasks include processing replenishment, processing payments, recording all financial transactions and keeping records, preparing financial reports, and supporting line ministries on financial matters.
5,573,600 2,799,407 2,500,000 1,500,000 —
LICUS Trust Fund Grant for Rapid Impact Public Financial Management
Regulatory Financial management
All World Bank Supporting the government to process payments to government suppliers, record all government financial transactions, and keep records. Preparing financial reports for the public funds. Supporting the government to develop structured accounting procedures manuals. Supporting the government internal audit to develop internal audit programs and manuals.
3,500,000 1,500,000 2,000,000 — —
Support to Economic Planning Regulatory Financial management
All DfiD, Netherlands, Sweden
Increasing alignment of government budget allocations and expenditures with donor projects in line with the government's stated development priorities.
12,098,064 3,098,064 3,000,000 3,000,000 3,000,000
Private sector subtotal — — — — — 729,891,992 212,269,016 210,969,588 56,046,404 15,508,769
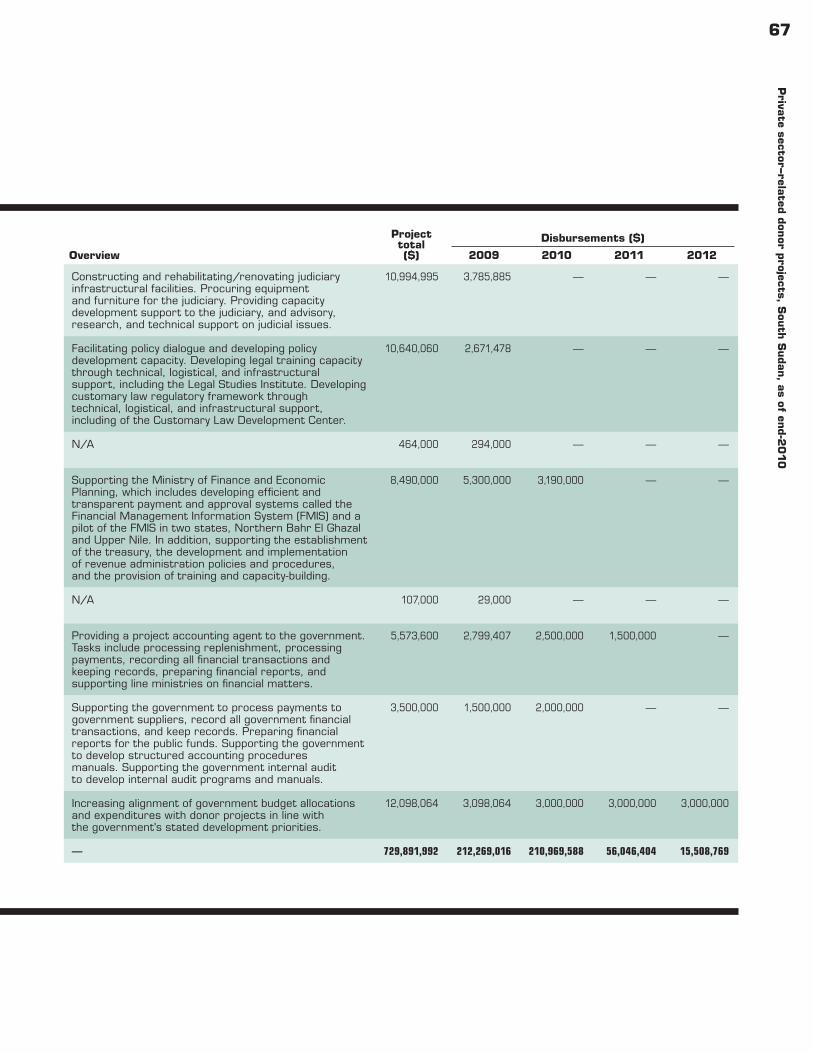
67P
rivate sector–rela
ted don
or projects, S
outh
Sudan, a
s of end-2
010
— is not available.
Source: Government of South Sudan (2010b).
Project name Sector Subsector States Donor Overview
Project total ($)
Disbursements ($)
2009 2010 2011 2012
Strengthening the Judiciary of Southern Sudan
Regulatory Legal system All DfID Constructing and rehabilitating/renovating judiciary infrastructural facilities. Procuring equipment and furniture for the judiciary. Providing capacity development support to the judiciary, and advisory, research, and technical support on judicial issues.
10,994,995 3,785,885 — — —
Strengthening the Ministry of Legal Affairs and Constitutional Development
Regulatory Legal system All DfID Facilitating policy dialogue and developing policy development capacity. Developing legal training capacity through technical, logistical, and infrastructural support, including the Legal Studies Institute. Developing customary law regulatory framework through technical, logistical, and infrastructural support, including of the Customary Law Development Center.
10,640,060 2,671,478 — — —
Anti-Corruption Commission in Southern Sudan
Regulatory Legal system All Norway N/A 464,000 294,000 — — —
Government Institutional Capacity-Building Project
Regulatory Financial management
All USAID Supporting the Ministry of Finance and Economic Planning, which includes developing efficient and transparent payment and approval systems called the Financial Management Information System (FMIS) and a pilot of the FMIS in two states, Northern Bahr El Ghazal and Upper Nile. In addition, supporting the establishment of the treasury, the development and implementation of revenue administration policies and procedures, and the provision of training and capacity-building.
8,490,000 5,300,000 3,190,000 — —
Support to Southern Sudan Anti-Corruption Commission
Regulatory Legal system All Switzerland N/A 107,000 29,000 — — —
Core Fiduciary Systems Support Project
Regulatory Financial management
All Various Providing a project accounting agent to the government. Tasks include processing replenishment, processing payments, recording all financial transactions and keeping records, preparing financial reports, and supporting line ministries on financial matters.
5,573,600 2,799,407 2,500,000 1,500,000 —
LICUS Trust Fund Grant for Rapid Impact Public Financial Management
Regulatory Financial management
All World Bank Supporting the government to process payments to government suppliers, record all government financial transactions, and keep records. Preparing financial reports for the public funds. Supporting the government to develop structured accounting procedures manuals. Supporting the government internal audit to develop internal audit programs and manuals.
3,500,000 1,500,000 2,000,000 — —
Support to Economic Planning Regulatory Financial management
All DfiD, Netherlands, Sweden
Increasing alignment of government budget allocations and expenditures with donor projects in line with the government's stated development priorities.
12,098,064 3,098,064 3,000,000 3,000,000 3,000,000
Private sector subtotal — — — — — 729,891,992 212,269,016 210,969,588 56,046,404 15,508,769
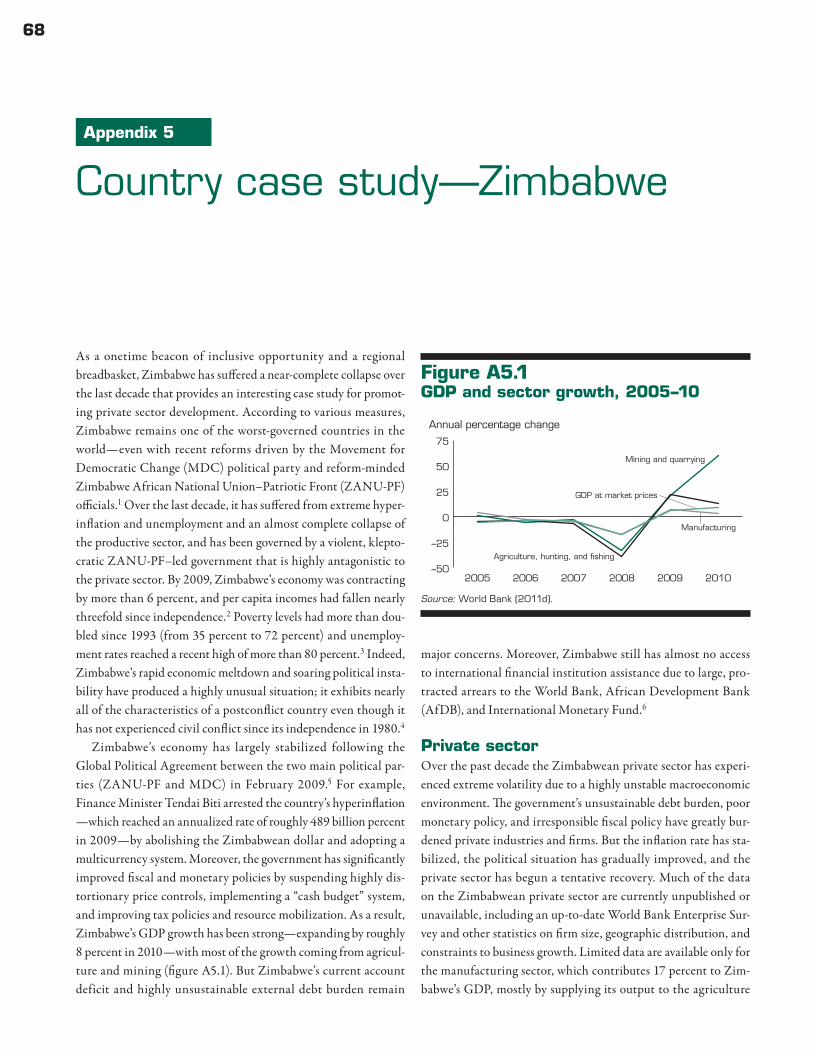
68
As a onetime beacon of inclusive opportunity and a regional breadbasket, Zimbabwe has suffered a near-complete collapse over the last decade that provides an interesting case study for promot-ing private sector development. According to various measures, Zimbabwe remains one of the worst-governed countries in the world — even with recent reforms driven by the Movement for Democratic Change (MDC) political party and reform-minded Zimbabwe African National Union–Patriotic Front (ZANU-PF) officials.1 Over the last decade, it has suffered from extreme hyper-inflation and unemployment and an almost complete collapse of the productive sector, and has been governed by a violent, klepto-cratic ZANU-PF–led government that is highly antagonistic to the private sector. By 2009, Zimbabwe’s economy was contracting by more than 6 percent, and per capita incomes had fallen nearly threefold since independence.2 Poverty levels had more than dou-bled since 1993 (from 35 percent to 72 percent) and unemploy-ment rates reached a recent high of more than 80 percent.3 Indeed, Zimbabwe’s rapid economic meltdown and soaring political insta-bility have produced a highly unusual situation; it exhibits nearly all of the characteristics of a postconflict country even though it has not experienced civil conflict since its independence in 1980.4
Zimbabwe’s economy has largely stabilized following the Global Political Agreement between the two main political par-ties (ZANU-PF and MDC) in February 2009.5 For example, Finance Minister Tendai Biti arrested the country’s hyperinflation — which reached an annualized rate of roughly 489 billion percent in 2009 — by abolishing the Zimbabwean dollar and adopting a multicurrency system. Moreover, the government has significantly improved fiscal and monetary policies by suspending highly dis-tortionary price controls, implementing a “cash budget” system, and improving tax policies and resource mobilization. As a result, Zimbabwe’s GDP growth has been strong — expanding by roughly 8 percent in 2010 — with most of the growth coming from agricul-ture and mining (figure A5.1). But Zimbabwe’s current account deficit and highly unsustainable external debt burden remain
major concerns. Moreover, Zimbabwe still has almost no access to international financial institution assistance due to large, pro-tracted arrears to the World Bank, African Development Bank (AfDB), and International Monetary Fund.6
Private sectorOver the past decade the Zimbabwean private sector has experi-enced extreme volatility due to a highly unstable macroeconomic environment. The government’s unsustainable debt burden, poor monetary policy, and irresponsible fiscal policy have greatly bur-dened private industries and firms. But the inflation rate has sta-bilized, the political situation has gradually improved, and the private sector has begun a tentative recovery. Much of the data on the Zimbabwean private sector are currently unpublished or unavailable, including an up-to-date World Bank Enterprise Sur-vey and other statistics on firm size, geographic distribution, and constraints to business growth. Limited data are available only for the manufacturing sector, which contributes 17 percent to Zim-babwe’s GDP, mostly by supplying its output to the agriculture
Appendix 5
Country case study — Zimbabwe
Figure A5.1 GDP and sector growth, 2005–10
Source: World Bank (2011d).
–50
–25
0
25
50
75
201020092008200720062005
Annual percentage change
Mining and quarrying
Agriculture, hunting, and fishing
GDP at market prices
Manufacturing
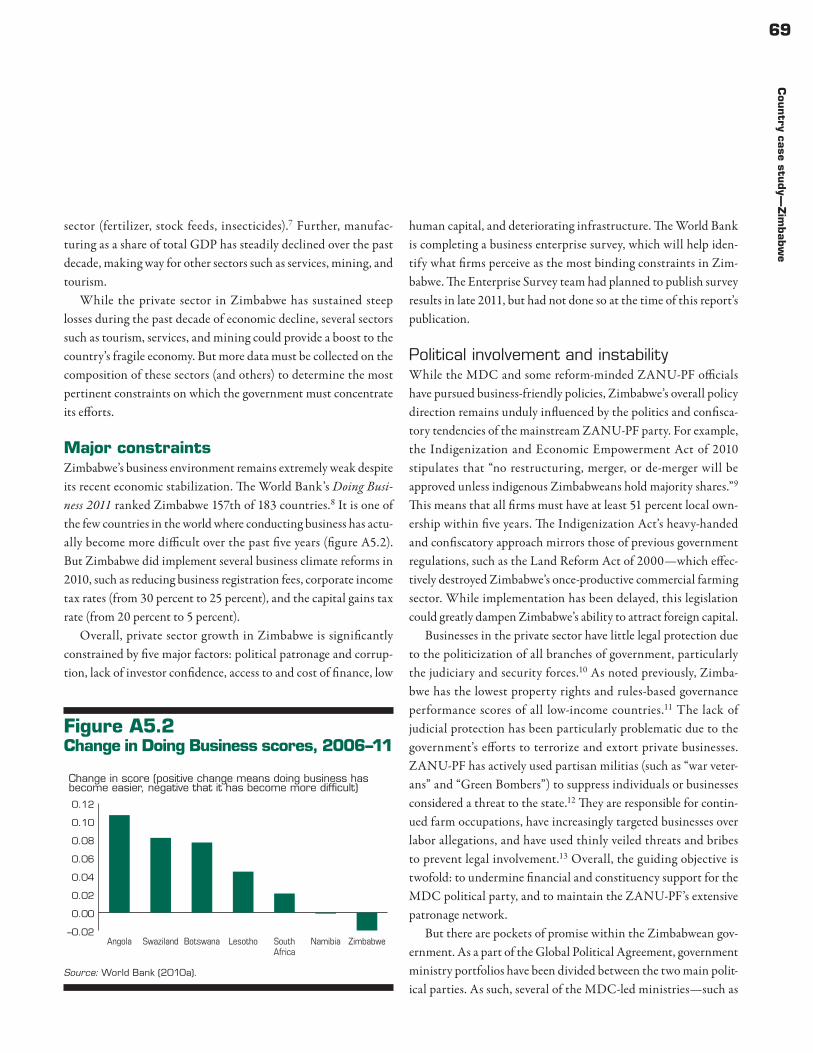
69C
ountry ca
se study—
Zim
bab
we
sector (fertilizer, stock feeds, insecticides).7 Further, manufac-turing as a share of total GDP has steadily declined over the past decade, making way for other sectors such as services, mining, and tourism.
While the private sector in Zimbabwe has sustained steep losses during the past decade of economic decline, several sectors such as tourism, services, and mining could provide a boost to the country’s fragile economy. But more data must be collected on the composition of these sectors (and others) to determine the most pertinent constraints on which the government must concentrate its efforts.
Major constraintsZimbabwe’s business environment remains extremely weak despite its recent economic stabilization. The World Bank’s Doing Busi-ness 2011 ranked Zimbabwe 157th of 183 countries.8 It is one of the few countries in the world where conducting business has actu-ally become more difficult over the past five years (figure A5.2). But Zimbabwe did implement several business climate reforms in 2010, such as reducing business registration fees, corporate income tax rates (from 30 percent to 25 percent), and the capital gains tax rate (from 20 percent to 5 percent).
Overall, private sector growth in Zimbabwe is significantly constrained by five major factors: political patronage and corrup-tion, lack of investor confidence, access to and cost of finance, low
human capital, and deteriorating infrastructure. The World Bank is completing a business enterprise survey, which will help iden-tify what firms perceive as the most binding constraints in Zim-babwe. The Enterprise Survey team had planned to publish survey results in late 2011, but had not done so at the time of this report’s publication.
Political involvement and instabilityWhile the MDC and some reform-minded ZANU-PF officials have pursued business-friendly policies, Zimbabwe’s overall policy direction remains unduly influenced by the politics and confisca-tory tendencies of the mainstream ZANU-PF party. For example, the Indigenization and Economic Empowerment Act of 2010 stipulates that “no restructuring, merger, or de-merger will be approved unless indigenous Zimbabweans hold majority shares.”9 This means that all firms must have at least 51 percent local own-ership within five years. The Indigenization Act’s heavy-handed and confiscatory approach mirrors those of previous government regulations, such as the Land Reform Act of 2000 — which effec-tively destroyed Zimbabwe’s once-productive commercial farming sector. While implementation has been delayed, this legislation could greatly dampen Zimbabwe’s ability to attract foreign capital.
Businesses in the private sector have little legal protection due to the politicization of all branches of government, particularly the judiciary and security forces.10 As noted previously, Zimba-bwe has the lowest property rights and rules-based governance performance scores of all low-income countries.11 The lack of judicial protection has been particularly problematic due to the government’s efforts to terrorize and extort private businesses. ZANU-PF has actively used partisan militias (such as “war veter-ans” and “Green Bombers”) to suppress individuals or businesses considered a threat to the state.12 They are responsible for contin-ued farm occupations, have increasingly targeted businesses over labor allegations, and have used thinly veiled threats and bribes to prevent legal involvement.13 Overall, the guiding objective is twofold: to undermine financial and constituency support for the MDC political party, and to maintain the ZANU-PF’s extensive patronage network.
But there are pockets of promise within the Zimbabwean gov-ernment. As a part of the Global Political Agreement, government ministry portfolios have been divided between the two main polit-ical parties. As such, several of the MDC-led ministries — such as
Figure A5.2 Change in Doing Business scores, 2006–11
Source: World Bank (2010a).
–0.02
0.00
0.02
0.04
0.06
0.08
0.10
0.12
ZimbabweNamibiaSouthAfrica
LesothoBotswanaSwazilandAngola
Change in score (positive change means doing business hasbecome easier, negative that it has become more difficult)
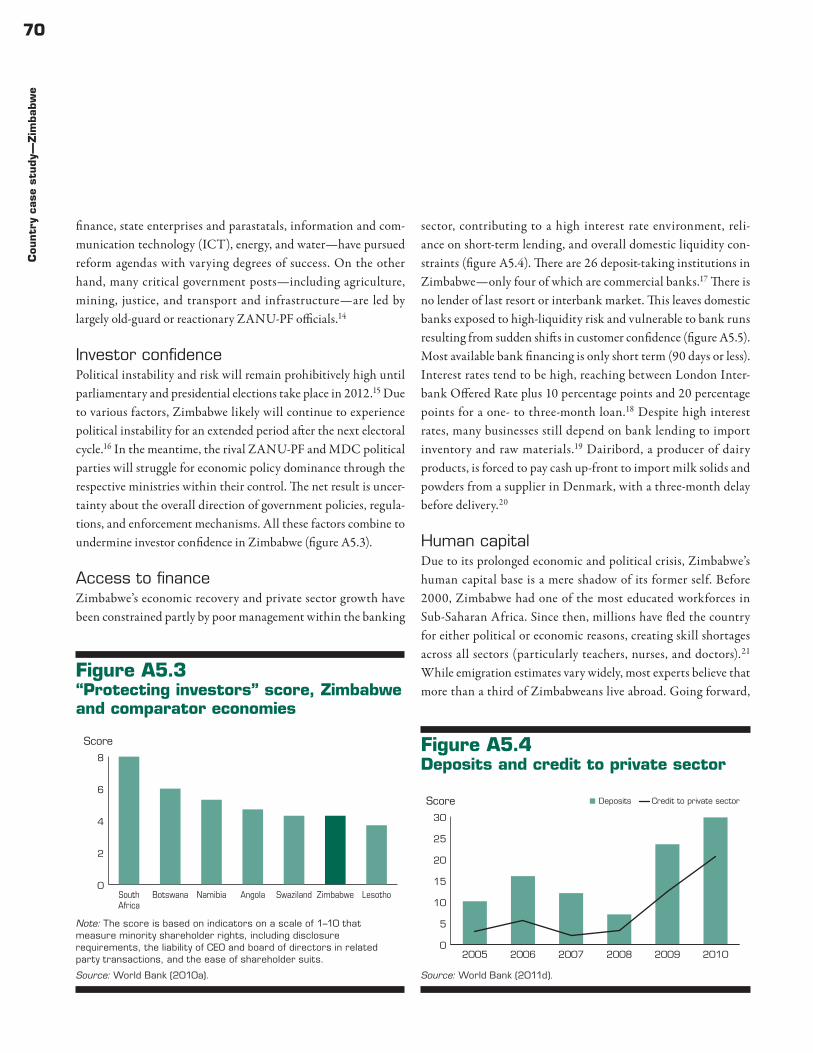
70C
ountr
y ca
se s
tudy—
Zim
bab
we
finance, state enterprises and parastatals, information and com-munication technology (ICT), energy, and water — have pursued reform agendas with varying degrees of success. On the other hand, many critical government posts — including agriculture, mining, justice, and transport and infrastructure — are led by largely old-guard or reactionary ZANU-PF officials.14
Investor confidencePolitical instability and risk will remain prohibitively high until parliamentary and presidential elections take place in 2012.15 Due to various factors, Zimbabwe likely will continue to experience political instability for an extended period after the next electoral cycle.16 In the meantime, the rival ZANU-PF and MDC political parties will struggle for economic policy dominance through the respective ministries within their control. The net result is uncer-tainty about the overall direction of government policies, regula-tions, and enforcement mechanisms. All these factors combine to undermine investor confidence in Zimbabwe (figure A5.3).
Access to financeZimbabwe’s economic recovery and private sector growth have been constrained partly by poor management within the banking
sector, contributing to a high interest rate environment, reli-ance on short-term lending, and overall domestic liquidity con-straints (figure A5.4). There are 26 deposit-taking institutions in Zimbabwe — only four of which are commercial banks.17 There is no lender of last resort or interbank market. This leaves domestic banks exposed to high-liquidity risk and vulnerable to bank runs resulting from sudden shifts in customer confidence (figure A5.5). Most available bank financing is only short term (90 days or less). Interest rates tend to be high, reaching between London Inter-bank Offered Rate plus 10 percentage points and 20 percentage points for a one- to three-month loan.18 Despite high interest rates, many businesses still depend on bank lending to import inventory and raw materials.19 Dairibord, a producer of dairy products, is forced to pay cash up-front to import milk solids and powders from a supplier in Denmark, with a three-month delay before delivery.20
Human capitalDue to its prolonged economic and political crisis, Zimbabwe’s human capital base is a mere shadow of its former self. Before 2000, Zimbabwe had one of the most educated workforces in Sub-Saharan Africa. Since then, millions have fled the country for either political or economic reasons, creating skill shortages across all sectors (particularly teachers, nurses, and doctors).21 While emigration estimates vary widely, most experts believe that more than a third of Zimbabweans live abroad. Going forward,
Figure A5.3 “Protecting investors” score, Zimbabwe and comparator economies
Note: The score is based on indicators on a scale of 1–10 that measure minority shareholder rights, including disclosure requirements, the liability of CEO and board of directors in related party transactions, and the ease of shareholder suits.
Source: World Bank (2010a).
0
2
4
6
8
LesothoZimbabweSwazilandAngolaNamibiaBotswanaSouthAfrica
Score Figure A5.4 Deposits and credit to private sector
Source: World Bank (2011d).
0
5
10
15
20
25
30
201020092008200720062005
Score Deposits Credit to private sector
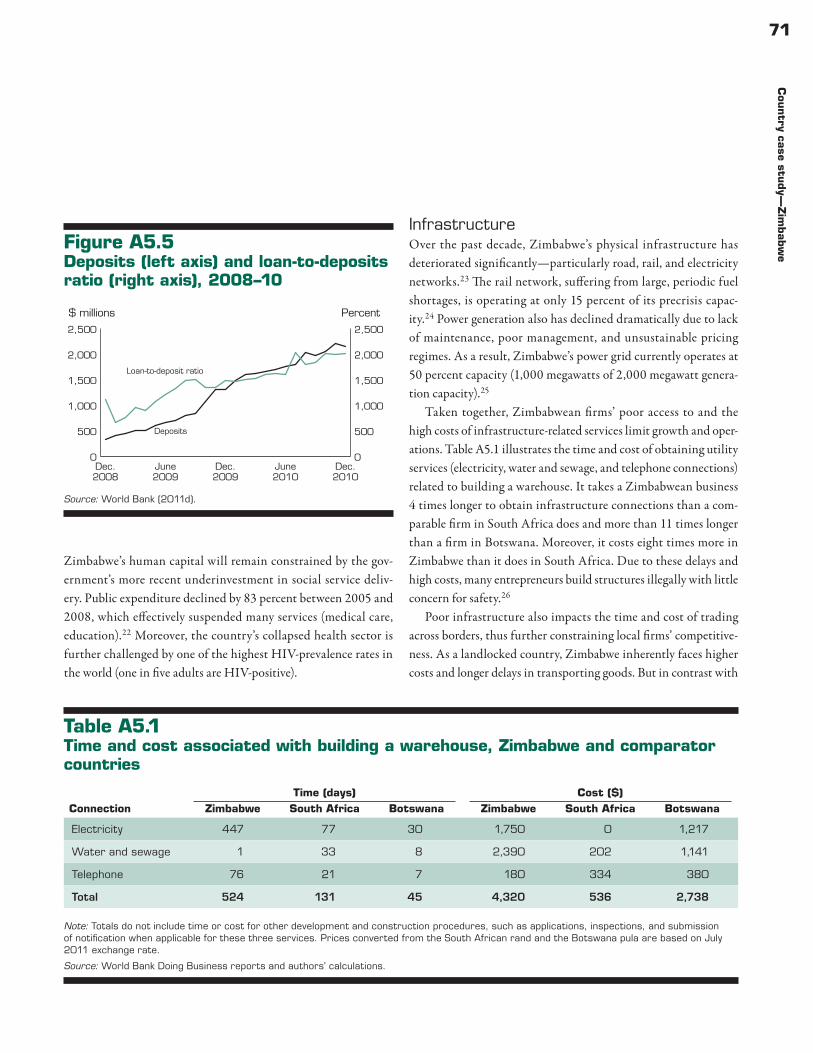
71C
ountry ca
se study—
Zim
bab
we
Zimbabwe’s human capital will remain constrained by the gov-ernment’s more recent underinvestment in social service deliv-ery. Public expenditure declined by 83 percent between 2005 and 2008, which effectively suspended many services (medical care, education).22 Moreover, the country’s collapsed health sector is further challenged by one of the highest HIV-prevalence rates in the world (one in five adults are HIV-positive).
InfrastructureOver the past decade, Zimbabwe’s physical infrastructure has deteriorated significantly — particularly road, rail, and electricity networks.23 The rail network, suffering from large, periodic fuel shortages, is operating at only 15 percent of its precrisis capac-ity.24 Power generation also has declined dramatically due to lack of maintenance, poor management, and unsustainable pricing regimes. As a result, Zimbabwe’s power grid currently operates at 50 percent capacity (1,000 megawatts of 2,000 megawatt genera-tion capacity).25
Taken together, Zimbabwean firms’ poor access to and the high costs of infrastructure-related services limit growth and oper-ations. Table A5.1 illustrates the time and cost of obtaining utility services (electricity, water and sewage, and telephone connections) related to building a warehouse. It takes a Zimbabwean business 4 times longer to obtain infrastructure connections than a com-parable firm in South Africa does and more than 11 times longer than a firm in Botswana. Moreover, it costs eight times more in Zimbabwe than it does in South Africa. Due to these delays and high costs, many entrepreneurs build structures illegally with little concern for safety.26
Poor infrastructure also impacts the time and cost of trading across borders, thus further constraining local firms’ competitive-ness. As a landlocked country, Zimbabwe inherently faces higher costs and longer delays in transporting goods. But in contrast with
Figure A5.5 Deposits (left axis) and loan-to-deposits ratio (right axis), 2008–10
Source: World Bank (2011d).
0
500
1,000
1,500
2,000
2,500
0
500
1,000
1,500
2,000
2,500
Dec.2010
June2010
Dec.2009
June2009
Dec.2008
$ millions Percent
Loan-to-deposit ratio
Deposits
Table A5.1 Time and cost associated with building a warehouse, Zimbabwe and comparator countries
Note: Totals do not include time or cost for other development and construction procedures, such as applications, inspections, and submission of notification when applicable for these three services. Prices converted from the South African rand and the Botswana pula are based on July 2011 exchange rate.
Source: World Bank Doing Business reports and authors’ calculations.
ConnectionTime (days) Cost ($)
Zimbabwe South Africa Botswana Zimbabwe South Africa Botswana
Electricity 447 77 30 1,750 0 1,217
Water and sewage 1 33 8 2,390 202 1,141
Telephone 76 21 7 180 334 380
Total 524 131 45 4,320 536 2,738
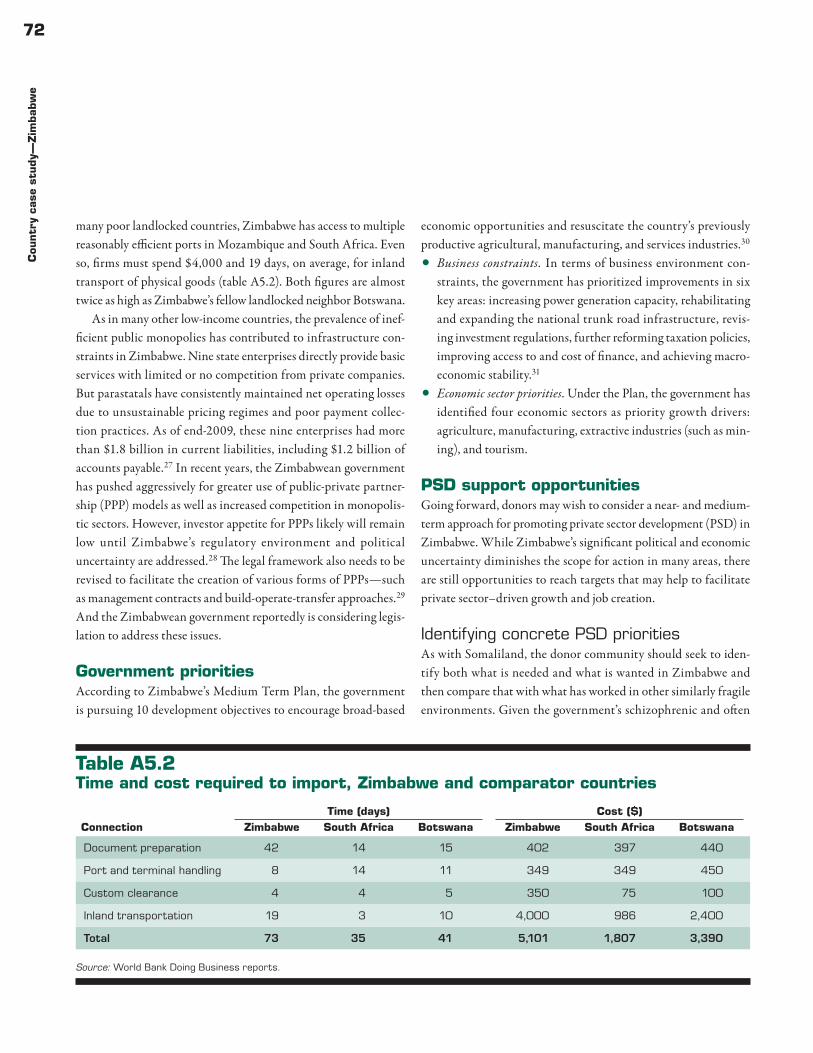
72C
ountr
y ca
se s
tudy—
Zim
bab
we
many poor landlocked countries, Zimbabwe has access to multiple reasonably efficient ports in Mozambique and South Africa. Even so, firms must spend $4,000 and 19 days, on average, for inland transport of physical goods (table A5.2). Both figures are almost twice as high as Zimbabwe’s fellow landlocked neighbor Botswana.
As in many other low-income countries, the prevalence of inef-ficient public monopolies has contributed to infrastructure con-straints in Zimbabwe. Nine state enterprises directly provide basic services with limited or no competition from private companies. But parastatals have consistently maintained net operating losses due to unsustainable pricing regimes and poor payment collec-tion practices. As of end-2009, these nine enterprises had more than $1.8 billion in current liabilities, including $1.2 billion of accounts payable.27 In recent years, the Zimbabwean government has pushed aggressively for greater use of public-private partner-ship (PPP) models as well as increased competition in monopolis-tic sectors. However, investor appetite for PPPs likely will remain low until Zimbabwe’s regulatory environment and political uncertainty are addressed.28 The legal framework also needs to be revised to facilitate the creation of various forms of PPPs — such as management contracts and build-operate-transfer approaches.29 And the Zimbabwean government reportedly is considering legis-lation to address these issues.
Government prioritiesAccording to Zimbabwe’s Medium Term Plan, the government is pursuing 10 development objectives to encourage broad-based
economic opportunities and resuscitate the country’s previously productive agricultural, manufacturing, and services industries.30
•Business constraints. In terms of business environment con-straints, the government has prioritized improvements in six key areas: increasing power generation capacity, rehabilitating and expanding the national trunk road infrastructure, revis-ing investment regulations, further reforming taxation policies, improving access to and cost of finance, and achieving macro-economic stability.31
•Economic sector priorities. Under the Plan, the government has identified four economic sectors as priority growth drivers: agriculture, manufacturing, extractive industries (such as min-ing), and tourism.
PSD support opportunitiesGoing forward, donors may wish to consider a near- and medium-term approach for promoting private sector development (PSD) in Zimbabwe. While Zimbabwe’s significant political and economic uncertainty diminishes the scope for action in many areas, there are still opportunities to reach targets that may help to facilitate private sector–driven growth and job creation.
Identifying concrete PSD prioritiesAs with Somaliland, the donor community should seek to iden-tify both what is needed and what is wanted in Zimbabwe and then compare that with what has worked in other similarly fragile environments. Given the government’s schizophrenic and often
Table A5.2 Time and cost required to import, Zimbabwe and comparator countries
Source: World Bank Doing Business reports.
ConnectionTime (days) Cost ($)
Zimbabwe South Africa Botswana Zimbabwe South Africa Botswana
Document preparation 42 14 15 402 397 440
Port and terminal handling 8 14 11 349 349 450
Custom clearance 4 4 5 350 75 100
Inland transportation 19 3 10 4,000 986 2,400
Total 73 35 41 5,101 1,807 3,390
73C
ountry ca
se study—
Zim
bab
we
antagonistic approach to private enterprise, these efforts should focus on firms’ priorities in the near term, and government minis-tries controlled by MDC and progressive ZANU-PF officials. The forthcoming World Bank Business Enterprise survey will help to identify opportunities and develop approaches for addressing the most important PSD-related constraints. Once the political envi-ronment stabilizes, donors could incorporate government priori-ties into a broader PSD strategy.
Near-term approachIn the short term, opportunities for donor organizations to con-structively support the Zimbabwean private sector are somewhat limited. But there are achievable targets in select areas and sectors, which can help to create economic and employment opportunities.•Regulatory framework. Donors can provide targeted capacity-
building support to several PSD-related government minis-tries that are led by progressive MDC officials, such as finance, energy, state enterprises and parastatals, ICT, and water. Several possibilities include revising national investment regulations and policies, streamlining customs documentation require-ments, and improving banking sector policies and oversight.
•Infrastructure development. Donors should consider ways to help address Zimbabwe’s deteriorating infrastructure, particu-larly power generation, coupled with policy reforms designed to boost coverage and financial sustainability.
•Enclave investments. Donors could consider supporting direct and indirect investments in selected sectors with potentially lower political risk, such as tourism (game parks, hotels), ser-vices (consulting, business process outsourcing), and banking.
Medium-term approachOnce the political environment in Zimbabwe stabilizes with the installation of a uniformly responsible, representative government supportive of private sector activities, donors could incorporate government priorities wholesale into a broader PSD strategy and expand to additional areas with active government involvement, including in the following areas:•High operating costs. Donors should consider holistic
approaches for reducing high operating costs for Zimbabwean businesses, such as rehabilitating the trunk road network, reha-bilitating the national rail network, and improving access to and cost of finance.
•Regulatory environment. Donors could expand capacity-build-ing and advisory assistance to additional government min-istries controlled by ZANU-PF officials and hostile to the private sector, such as Mines and Mining Development, and Justice and Legal Affairs.
•Sector-specific investments. In a more benign political environ-ment, agriculture, manufacturing, and mining could present sizable opportunities for raising livelihoods and creating jobs.
Notes1. For example, its World Bank Country Policy and Institutional
Assessment (CPIA) score of 2.0 puts it behind every other low-income country. Moreover, Zimbabwe has the lowest performance rating in 11 of the 16 CPIA indicators, such as property rights, corruption, and fiscal policy. It is tied for the second-worst performance on an additional three indicators (financial sector policies, business regulatory environment, and gender equality). In fact, Zimbabwe scores reasonably well on only two CPIA indicators: trade policy and resource mobilization effectiveness. For additional details, see www.worldbank.org/ida.
2. Makochekanwa and Kwaramba (2011).3. AfDB (2011).4. Moss and Patrick (2005).5. In September 2008, the two parties reached a power-sharing
agreement whereby Robert Mugabe (ZANU-PF) remained president and Morgan Tsvangirai (MDC) became executive prime minister. Due to various conflicts, the agreement was not implemented until February 13, 2009.
6. The only assistance is provided through World Bank and AfDB trust funds.
7. Confederation of Zimbabwe Industries (2010).8. World Bank (2010a).9. IHS (2010).10. Over time, President Mugabe has systematically undermined
judicial independence by replacing court justices with politi-cal supporters. In July 2001, he appointed four partisan sup-porters to the previously five-member Supreme Court, three of whom had no experience. Moreover, a September 2005 constitutional amendment ensured that the judiciary branch had no power to protect human or property rights. See IHS (2010).
74C
ountr
y ca
se s
tudy—
Zim
bab
we
11. According to IDA’s 2010 CPIA ratings, Zimbabwe’s score for the property rights and rules-based governance indicator was 1.5 (of 6).
12. Economic Intelligence Unit (2010).13. IHS (2010).14. They include Joseph Made (Agriculture, Mechanization, and
Irrigation Development); Obert Mpofu (Mines and Mining Development); Patrick Chinamasa ( Justice); and Nicholas Goche (Transport and Infrastructural Development). Both Made and Chinamasa hold these ministerial positions despite being defeated in the 2008 parliamentary elections.
15. The timing for these elections remains in dispute. President Mugabe has insisted that they take place in 2011, while the MDC and the Southern Africa Development Community have argued that they should take place in 2012 after the country’s constitutional process and electoral reforms are completed.
16. The presidential and parliamentary elections of 2008 pro-vide an illustrative cautionary tale. After losing the first round of elections by a sizable margin, President Mugabe initiated a systematic, vicious campaign of violence to ensure his vic-tory in the run-off election. Following this, Zimbabwe was gripped by a political impasse for nearly a year while the inter-national community attempted to broker the Global Political Agreement.
17. In 2004, Zimbabwe’s banking system collapsed, resulting in 11 financial institutions being placed under curatorship of
the central bank. Those that remain are highly vulnerable and depend on the distressed central bank, leading many custom-ers to flee to subsidiaries of foreign banks. See Imara Africa Securities (2010).
18. IMF (2010).19. Economic Intelligence Unit (2010).20. Imara Africa Securities (2010).21. Economic Intelligence Unit (2010).22. Makochekanwa and Kwaramba (2011).23. AfDB (2011).24. AfDB (2011).25. Low public expenditure for maintenance has directly contrib-
uted to the deterioration of Zimbabwe’s infrastructure. For instance, the government spends only $10 million annually to maintain the nation’s transportation infrastructure while actual costs are estimated to total roughly $4 billion. See AfDB (2011).
26. World Bank (2010a).27. AfDB (2011).28. Of 118 countries examined, the African Competitiveness
Report currently ranks Zimbabwe’s regulatory environment as the worst. See AfDB (2011).
29. AfDB (2011).30. The Medium Term Plan builds upon Zimbabwe’s previous
strategy documents, such as the Short-Term Economic Recov-ery Plan (STERP) and STERP-II.
31. Republic of Zimbabwe (2011).
75
Country case study—SomalilandAppendix 6
While Somaliland claimed formal independence in May 1991, the international community still considers it an autonomous region within Somalia. It is self-governed with an elected democratic government and a relatively stable society — especially compared with the rest of Somalia. Somaliland’s economy has continued to grow while broader Somalia has been devastated by continual civil conflict over the past two decades. According to rough estimates, its income and human development levels are significantly higher than those of its parent nation.1 Indeed, relatively robust economic development has been the crucial ingredient in its existence as a political entity.2 In the absence of a strong public sector and reg-ulatory oversight, the private sector has flourished, making for a unique, illustrative case study.
What makes Somaliland unique is the government’s over-whelming reliance on the private sector. As an unrecognized terri-tory, Somaliland is not eligible for most traditional aid programs. Except modest funding delivered through broader regional Somali programs, it receives very limited levels of bilateral or multilateral contributions. Therefore, the Somaliland government has relied on the business sector for significant financial backing. Business leaders provided the government with a crucial start-up loan of $7 million in 1993 and have continued to provide loans since then. In practice, the loans often are repaid in tax breaks, hindering the government’s ability to raise revenue.3 As a result, government revenue mobilization is precarious — between 1999 and 2007, it ranged from only $20 million to $40 million a year.4 Eighty-five percent of total revenue is from customs tariffs with the rest from inland revenue sources.5 There is no common inland system for tax collection. And the income tax rate is arbitrarily determined and can be lowered based on oral agreements.6
The weakness of the public sector has also led to the dominance of public-private partnerships (PPPs) in providing public goods, such as municipal water supplies, hospitals, and universities. Due to fiscal constraints and other spending priorities, namely security, the government allocates only 10 percent of its budget for social
projects.7 So the private sector has filled the void — for instance, private businesses or individuals have taken over supplying water to most municipalities.8 Although this has ensured a more reliable service supply than otherwise would be provided by a fiscally con-strained government, it also has resulted in the monopolization of key resource flows and prices for basic services that citizens can-not afford. Taken together, the vague division between private and public sector roles limits the government’s ability to effectively and objectively regulate the private sector and encourage competition.9
Private sectorPrior to the state’s collapse in 1991, much of the Somali economy was dominated by strict regulations and state monopolies. As a result, there was little room for the struggling pastoral economy to expand. As the monopolies and state controls fell apart, the pri-vate sector of the newly autonomous Somaliland thrived.10 Four factors drive Somaliland’s economy: livestock production and exports, foreign remittances, transit trade, and an expanding ser-vice sector.11 Livestock accounts for 60–65 percent of the domestic economy, with almost two-thirds of the population relying on it for at least part of their household income.12 Foreign remittances, however, have become the main source of income, leading to the growth of industries related to money transfers and telecommuni-cations, as mobile phones are increasingly used as mobile banks.13 Two key sectors with large growth opportunities include telecom-munications and air transport.•Telecommunications. Telecommunications, financed mainly
through remittances and members of the Somaliland-born diaspora, has been a key driver of recent economic growth. Competition between providers in Somaliland and the rest of Somalia has led phone services to be among the cheapest in all of Africa.14
•Air transport. In recent years, air traffic has grown rapidly. The number of flights to Hargeisa rose from 419 in 1997 to more than 3,000 in 2003. Daallo Airlines, Somaliland’s
76C
ountr
y ca
se s
tudy—
Som
alila
nd
second-largest company, provides a fascinating case study for how private firms can develop and thrive in fragile environ-ments. Daallo initially began its operations with only one used plane and a $30,000 investment. A decade later it had grown into an international carrier, offering flights as far as Paris and Amsterdam.15
Data limitationsDue to Somaliland’s uncertain international status and weak cen-tral government capacity, little information is available publicly on the specific breakdown of private businesses by sector, revenues, and number of employees. Moreover, there is a near-complete lack of quantitative and authoritative data on business constraints and operating obstacles. Instead, existing information has been gath-ered through academic field research, informal interviews, and collected anecdotes from Somaliland’s businesspeople. Going for-ward, donor organizations should work with the government and business community to fill this analytical gap, such as through busi-ness enterprise surveys and subnational Doing Business indicators.
Major business constraintsDespite the strength of the private sector, Somaliland faces dra-matic obstacles in creating broad-based economic development and private sector growth. Similar to those in South Sudan and other fragile states, the main challenges relate to lack of interna-tional recognition, absence of government regulations and formal financial institutions, limited access to finance, corruption and monopolization, poor physical infrastructure, and dependence on livestock production.
Lack of international recognitionThe absence of government regulations in Somaliland has proved to be a double-edged sword. While it allows the private sector to flourish, it also creates major challenges for broader-based private sector development (PSD) efforts. First and foremost, the lack of legitimacy in the international community prohibits Somaliland from attracting foreign direct investment. In 2000, the only sub-stantial foreign company investing in the region was Total Mer Rough, which rebuilt the fuel storage depot at the port of Ber-bera.16 Foreign companies are hesitant to invest in a region not recognized internationally and with a government slow to adapt foreign investment laws.
Lack of government regulationThe lack of international recognition and regulations also con-strains trade relationships. Although political separation has not hindered trade relationships with Somalia or neighboring coun-tries, the lack of government regulations has. Somaliland suf-fered a significant blow in 2003 when Ethiopia, its largest trading partner, closed its borders in an attempt to curtail Somali traders’ avoidance of customs payments.17 And Somaliland’s government revenues collapsed from $45 million in 1996 to $27 million in 1998 due to a 16-month Saudi ban on livestock trade, driven by the lack of internationally recognized veterinary certifications.18 In addition, the lack of full diplomatic relations with key trading partners means that it is difficult to facilitate transit agreements. For example, foreign vessels that use Berbera as a port of entry must pay higher insurance premiums and lack access to in-country financial facilities and related letters of credit.19 The lack of inter-national recognition along with a weak regulatory environment often creates insurmountable barriers. Foreign companies and nations will be reluctant to provide the investment or partnership necessary to fully develop Somaliland’s private sector until there are formal financial institutions and state regulations, and the ter-ritory’s international status is resolved.
Limited access to financeAs noted above, the lack of formal financial institutions constrains business transactions and growth, leading to dependency on neighboring banking and financial sectors. Somaliland businesses have been forced to creatively maneuver the lack of financial insti-tutions, with many resorting to offices incorporated in Djibouti or Dubai. The Somaliland government holds its foreign reserves in Ethiopia.20 The lack of international banks also has led to the emergence of hawaala (money transfer agents), who offer financial services ranging from business loans to check-cashing facilities.21 A leaked cable revealed that an official of the United Kingdom’s largest Somalia remittances transfer firm believed that the lack of a legislative framework in the financial services sector was hinder-ing economic growth.22
CorruptionPartly due to the proliferation of PPPs in Somaliland, corrup-tion and a lack of competition in the private sector also remain key obstacles to growth. Put simply, when private elites bankroll
77C
ountry ca
se study—
Som
aliland
the public budget, the government is left precariously vulner-able to their interests. Large private businesses, often run by the wealthiest Isaaq (one of Somalia’s main clans) merchants, control social services and dominate important economic sectors. More-over, they often push smaller, non-Isaaq traders out of the mar-ket.23 PPPs, often managed without parliamentary oversight, do not always pass through state ledgers, exacerbating a culture of nontransparency. For example, one report cited that of $1.7 mil-lion that flowed to the Berbera Port Authority, only $158,000 was transferred to the treasury.24 Petty corruption also is common as public servants seek to supplement salaries that are substantially less than those in the private sector.
Lack of physical infrastructureAs in many other fragile states, a lack of physical infrastructure acts as a binding constraint to PSD in Somaliland. After the Somali civil war, much of the Somaliland territory was left in ruins. According to a War-Torn Societies report, Hargeisa (the future capital) was left with less than 10 percent of its physical infrastructure intact. The city was “only a vast field of blasted rubble strewn with explosives. … Burco, to the east, had suffered roughly 70 percent destruction, and countless villages in the inte-rior had been razed to the ground.”25 But Somaliland has substan-tially rebuilt much of its physical infrastructure since then, includ-ing utilities and telecommunication systems.26 On a household level, private remittances have been key sources for funding the reconstruction of homes and businesses.27
Partly due to neighboring countries’ strategic interests, the port of Berbera has been the focus of development.28 There is ongoing collaboration between the city and UN-HABITAT to create a strategy for effective and integrated urban development. The most urgent problem identified by the Berbera City Consultation con-cerns the provision of services, including the problems of “inad-equate and expensive electricity” and “water scarcity, poor water distribution, and poor water quality.”29 Water supply is sporadic and ill-equipped for hard times, as illustrated by the drought in 2009 that threatened more than 700,000 pastoralists.30
Dependence on livestock productionA final constraint to broad-based PSD in Somaliland is a lack of economic diversification. As noted previously, livestock is the foundation of the economy, accounting for about 90 percent of
export receipts (roughly $175 million a year).31 This leaves the economy highly vulnerable to trade restrictions and other market disruptions. Despite their large potential, several key industries remain largely underdeveloped. Fisheries are untapped in Somali-land despite the region’s 850-kilometer coastline. According to Food and Agriculture Organization of the United Nations esti-mates, a maximum of 40,000 tons could be harvested annually without endangering the sustainability of fish stocks.32 Others believe that the country has the potential for small-scale, low-tech gemstone mining after the discovery of a high-quality emerald reef off the coast.33 Somaliland may also have an untapped potential for oil extraction given its geological similarities with Yemen.34 Ultimately, the pursuit of these markets may hinge on a resolu-tion of Somaliland’s official status. Further, as with many other low-income countries, there is a danger that concentrating devel-opment efforts on extractive industries without proper regulation and transparency may further heighten Somaliland’s endemic cor-ruption and monopolistic business structure.
PSD support opportunitiesGoing forward, donors should consider a near- and medium-term approach for promoting PSD in Somaliland. While Somaliland’s uncertain international status diminishes the scope for action in certain areas, there are still opportunities for facilitating private sector–driven growth.
Concrete PSD prioritiesConsistent with our proposed PSD framework approach, the donor community should seek to identify both what is needed and what is wanted in Somaliland. In other words, they should solicit specific priorities from both the Somaliland government and businesses.•Data diagnostics. Donor organizations should work with the
government and business community to complete PSD-related diagnostics, such as business enterprise surveys. This informa-tion will help identify the most pressing constraints to business growth and prioritize areas for donor support. Importantly, the enterprise survey should ensure broad-based participa-tion across disparate regions, clans, and business sizes. This approach will help to ensure that any resulting PSD strategy addresses widespread constraints and not simply those experi-enced by the existing elite.
78C
ountr
y ca
se s
tudy—
Som
alila
nd
•Government priorities. Similarly, donor organizations should seek to identify the government’s key PSD-related priorities. Since Somaliland does not have a poverty reduction strategy paper or publicly available national growth strategy, this pro-cess may take the form of informal consultations with various government entities. The key objective is to identify consisten-cies, or contradictions, with the private sector’s views about the most binding constraints on PSD-related growth.
Regulatory environmentDonor organizations should consider working with the govern-ment on targeted, regulatory environmental issues that may unlock significant growth opportunities. Several possibilities include improving livestock certification regimes, investment laws, customs procedures, and banking laws and oversight. Additional consideration should be given to improving the government’s rev-enue mobilization capacity. This will help reduce the government’s dependence on large, monopolistic business interests and increase its institutional capacity over time. In addition, donors should seek ways to enhance transparency across all regulatory areas as a means of reducing opportunities for corruption and improving predictability for private firms.
High operating costsDonor organizations should support approaches for reducing high operating costs for Somaliland businesses, which reduce profitabil-ity and prevent the establishment of low-skill sectors, such as light manufacturing and services. Three immediate constraints deserve priority attention: road transport, access to and the cost of reliable electricity, and access to and the cost of capital.
Economic diversificationAs noted previously, Somaliland depends highly on livestock production. Donor organizations should carefully consider ways of supporting diversification into other promising economic sectors such as fishing and mining. Due to extensive corrup-tion, weak government capacity, and the power of Somaliland’s monopolies, donors should proceed with significant caution, broad-based consultations, and a focus on ensuring proper programmatic transparency. Deploying modest amounts of risk capital on a targeted, pilot basis may be the most effective approach.
Notes1. Eubank (forthcoming).2. Bradbury (2008).3. Bradbury (2008).4. Eubank (2010).5. Bradbury (2008). There is no direct tax on remittances,
though that revenue is indirectly taxed through customs tar-iffs. Additionally, one source reports that 12 percent of gov-ernment revenue comes from taxing the qaad trade. Qaad is a shrub chewed for its amphetamine-like effects, grown primar-ily in Ethiopia, Kenya, and Yemen. More than $70 million a year (more than three times larger than government revenue) is spent on importing the good.
6. JSL Times (2011).7. Eubank (2010). The priority of the government has been
the maintenance of peace and security, with 50–70 percent of the budget going to the National Security Services. See Bradbury(2008).
8. Bradbury (2008).9. Eubank (2010).10. Eubank (2010).11. Eubank (2010).12. Somaliland Ministry of Planning and Coordination (2010).13. Bradbury (2008).14. Bradbury (2008).15. Bradbury (2008).16. Bradbury (2008).17. Bradbury (2008).18. The Economist (1999).19. Bradbury (2008).20. Bradbury (2008).21. ICG (2003).22. For more information, see www.telegraph.co.uk/news/
wikileaks-files/london-wikileaks/8305259/SOMALILAND -LACK-OF-FINANCIAL-SECTOR-REGULATIONS -INHIBITS-PRIVATE-SECTOR-DEVELOPMENT .html.
23. Bradbury (2008).24. Gulaid (2003), cited in Bradbury (2008).25. Eubank (forthcoming).26. Bradbury (2008).27. ICG (2003).
79C
ountry ca
se study—
Som
aliland
28. Ethiopia relies on Berbera as its easiest point of access to the sea. See The Economist (2001).
29. UN-HABITAT (2008).30. AllAfrica (2009).
31. ICG (2003).32. Somaliland Ministry of Planning and Coordination (2010).33. The Economist (2001).34. Bradbury (2008).
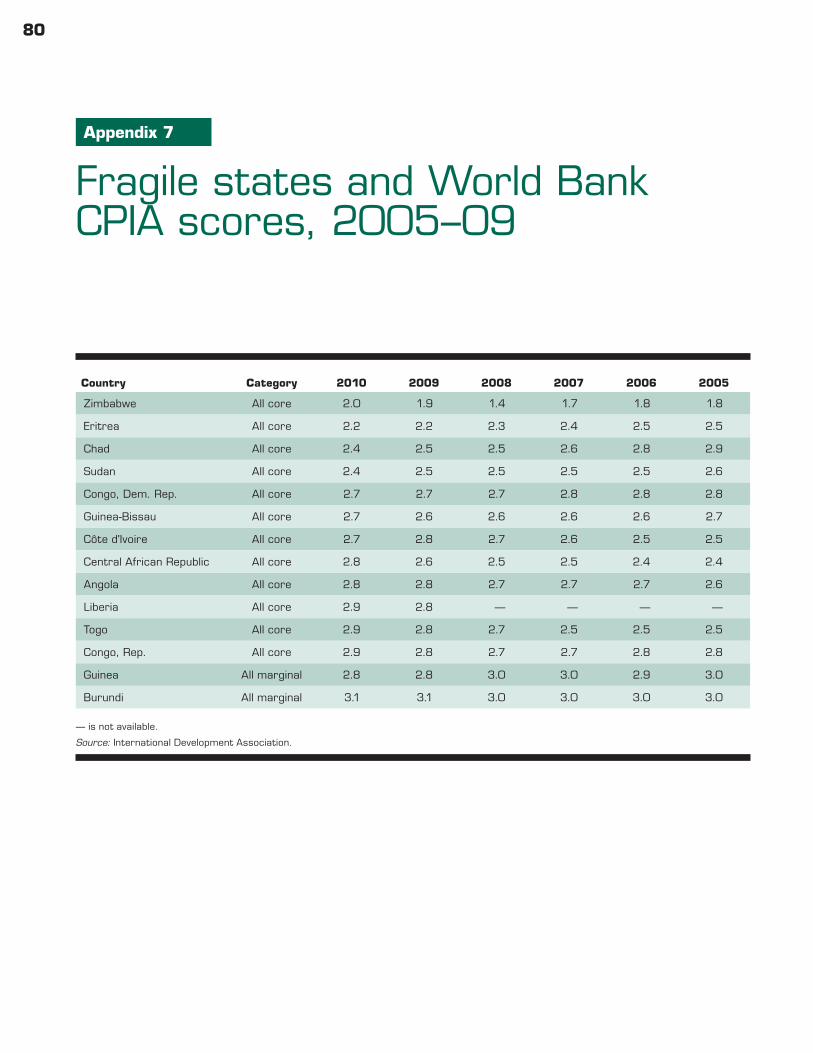
80
Fragile states and World Bank CPIA scores, 2005–09
Appendix 7
— is not available.
Source: International Development Association.
Country Category 2010 2009 2008 2007 2006 2005
Zimbabwe All core 2.0 1.9 1.4 1.7 1.8 1.8
Eritrea All core 2.2 2.2 2.3 2.4 2.5 2.5
Chad All core 2.4 2.5 2.5 2.6 2.8 2.9
Sudan All core 2.4 2.5 2.5 2.5 2.5 2.6
Congo, Dem. Rep. All core 2.7 2.7 2.7 2.8 2.8 2.8
Guinea-Bissau All core 2.7 2.6 2.6 2.6 2.6 2.7
Côte d'Ivoire All core 2.7 2.8 2.7 2.6 2.5 2.5
Central African Republic All core 2.8 2.6 2.5 2.5 2.4 2.4
Angola All core 2.8 2.8 2.7 2.7 2.7 2.6
Liberia All core 2.9 2.8 — — — —
Togo All core 2.9 2.8 2.7 2.5 2.5 2.5
Congo, Rep. All core 2.9 2.8 2.7 2.7 2.8 2.8
Guinea All marginal 2.8 2.8 3.0 3.0 2.9 3.0
Burundi All marginal 3.1 3.1 3.0 3.0 3.0 3.0
81
Other private sector development initiatives in fragile states
Appendix 8
While private sector development (PSD)–focused programs face several performance constraints and obstacles, they also have the potential to avoid many of the pitfalls associated with traditional aid programs.1 Fundamentally, private enterprises are profit-gener-ating operations that should rationally evaluate their own perfor-mance and adjust strategies accordingly. And they are reasonably efficient allocators of capital (loans, equity, or convertible debt). In addition, they often are more capable of absorbing new financing because they are capital-constrained.
United StatesOverseas Private Investment Corporation. The Overseas Private Investment Corporation (OPIC) provides medium- to long-term financing through direct loans and guarantees. Through these mechanisms, OPIC can provide financing in business environ-ments that otherwise make conventional lending difficult or impossible. OPIC’s small and medium enterprise (SME) financ-ing window is available for firms with annual revenues of less than $250 million. OPIC frequently partners with local financial institutions to mobilize project capital requirements. Through its insurance instruments and co-financing mechanisms, OPIC has provided 16 loans and roughly $377 million of project financing in our sample of 14 fragile states since 2004 (table A8.1).2 Similar to the International Finance Corporation, OPIC invests less capi-tal in African fragile states than in nonfragile states. But OPIC has recently begun several large projects (totaling more than $200 million) in Liberia, with a specific focus on renewable energy.3 Further, OPIC’s numerous investment funds — many devoted specifically to private sector financing in Africa — provide sizable financing to businesses located in fragile states.4
Development Credit Authority. The Development Credit Author-ity (DCA) uses partial credit guarantees (similar to those used by OPIC) to leverage financial resources for an array of development projects, which often extend capital to private sector businesses.5
DCA shares up to 50 percent of loan default losses with the in-country financial institution. DCA’s loan portfolio guarantee is the only lending-based product currently used for fragile states, provid-ing one loan each in Burundi, the Democratic Republic of Congo, Zimbabwe, and Liberia.6 The guaranteed amounts of the four loans total around $9 million, while the credit leveraged (in relation to actual cost to the U.S. Agency for International Development, or USAID) totals near $55 million.7 While the leveraging ratio is often higher for loans based in more stable African countries,8 the loan guarantee instrument could be very useful as DCA expands its operations in fragile states. While DCA experience may not pro-vide large-scale support to private sector growth in fragile states, its leveraging model could provide utility and insight for PSD efforts focused exclusively on fragile state business environments.
African Development BankFund for African Private Sector Assistance. The Fund for African Private Sector Assistance, established in 2005, serves as one of the African Development Bank’s (AfDB) key operational instru-ments.9 The Fund provides grant financing for technical assistance and capacity-building for both public and private sector clients.10 Typically these grants complement the Af DB’s conventional financing instruments, such as equity investments, project loans, and guarantees. Despite its small capital base (roughly $40 mil-lion), the Fund has supported infrastructure and microfinance initiatives in several African fragile states such as the Democratic Republic of Congo, Liberia, and Mauritania. Pending the success of these projects, the Fund could be an effective tool for further extending infrastructure financing and advisory services to other fragile states. The Fund plans to approve an average of 10 new proj-ects annually (totaling roughly $9 million) and progress toward 20 new projects annually ($17 million) by 2012.
Accelerated Co-financing Facility for Africa. The Accelerated Co-financing Facility for Africa operates under the AfDB’s Enhanced
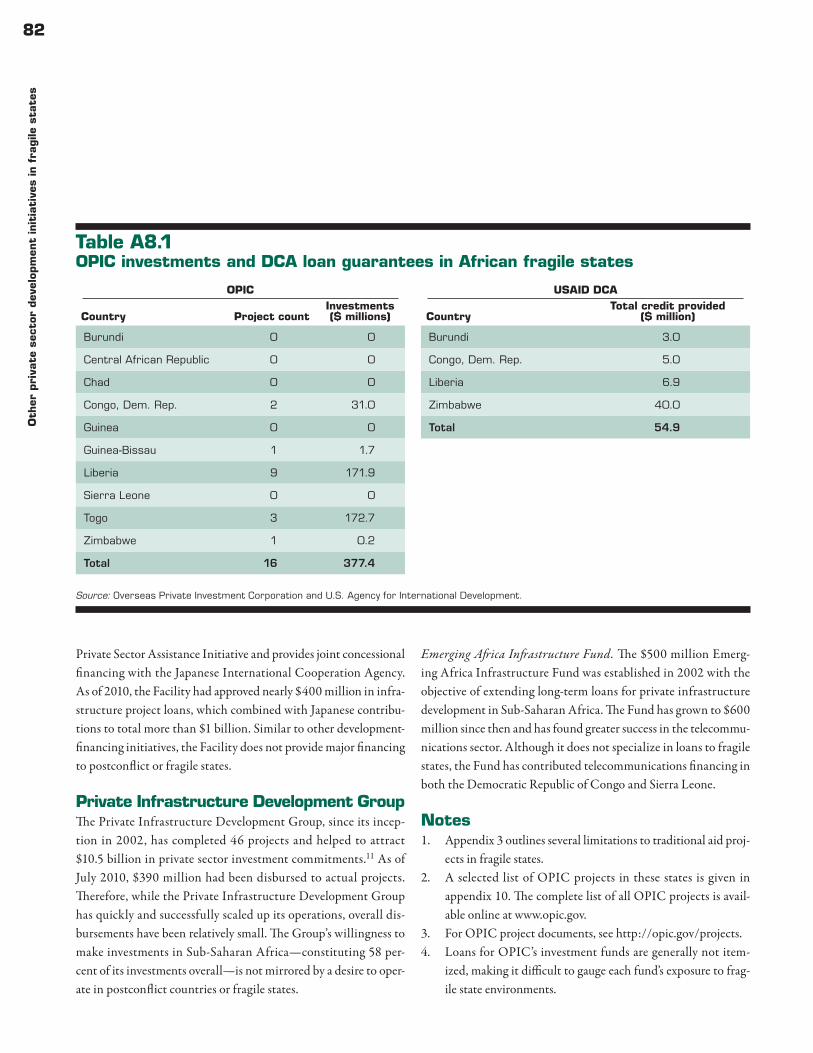
82O
ther
pri
vate
sec
tor
dev
elop
men
t in
itia
tive
s in
fra
gile
sta
tes
Private Sector Assistance Initiative and provides joint concessional financing with the Japanese International Cooperation Agency. As of 2010, the Facility had approved nearly $400 million in infra-structure project loans, which combined with Japanese contribu-tions to total more than $1 billion. Similar to other development-financing initiatives, the Facility does not provide major financing to postconflict or fragile states.
Private Infrastructure Development GroupThe Private Infrastructure Development Group, since its incep-tion in 2002, has completed 46 projects and helped to attract $10.5 billion in private sector investment commitments.11 As of July 2010, $390 million had been disbursed to actual projects. Therefore, while the Private Infrastructure Development Group has quickly and successfully scaled up its operations, overall dis-bursements have been relatively small. The Group’s willingness to make investments in Sub-Saharan Africa — constituting 58 per-cent of its investments overall — is not mirrored by a desire to oper-ate in postconflict countries or fragile states.
Emerging Africa Infrastructure Fund. The $500 million Emerg-ing Africa Infrastructure Fund was established in 2002 with the objective of extending long-term loans for private infrastructure development in Sub-Saharan Africa. The Fund has grown to $600 million since then and has found greater success in the telecommu-nications sector. Although it does not specialize in loans to fragile states, the Fund has contributed telecommunications financing in both the Democratic Republic of Congo and Sierra Leone.
Notes1. Appendix 3 outlines several limitations to traditional aid proj-
ects in fragile states.2. A selected list of OPIC projects in these states is given in
appendix 10. The complete list of all OPIC projects is avail-able online at www.opic.gov.
3. For OPIC project documents, see http://opic.gov/projects.4. Loans for OPIC’s investment funds are generally not item-
ized, making it difficult to gauge each fund’s exposure to frag-ile state environments.
Table A8.1 OPIC investments and DCA loan guarantees in African fragile states
Source: Overseas Private Investment Corporation and U.S. Agency for International Development.
OPIC
Country Project countInvestments ($ millions)
Burundi 0 0
Central African Republic 0 0
Chad 0 0
Congo, Dem. Rep. 2 31.0
Guinea 0 0
Guinea-Bissau 1 1.7
Liberia 9 171.9
Sierra Leone 0 0
Togo 3 172.7
Zimbabwe 1 0.2
Total 16 377.4
USAID DCA
CountryTotal credit provided
($ million)
Burundi 3.0
Congo, Dem. Rep. 5.0
Liberia 6.9
Zimbabwe 40.0
Total 54.9
83O
ther p
rivate sector d
evelopm
ent in
itiatives in
fragile sta
tes
5. The bulk of DCA’s loan guarantees come in the SME, micro-finance, and agriculture sectors, which comprised 72 percent of DCA’s overall portfolio between 1999 and 2010. DCA maintains a smaller portfolio in the energy, housing, and tech-nology sectors.
6. Since its inception in 1999, DCA has continued to expand both in the number of loans guaranteed and in the over-all portfolio amount. Loans to the three mentioned fragile states have only begun to be made in the past three years, indicating DCA’s willingness to expand into riskier invest-ment climates.
7. Between 2008 and 2010, DCA altered the reporting of the credit extended through its guarantees. Before 2009, DCA disclosed the amount guaranteed by the Authority and the total credit extended. For 2009 and 2010, USAID refers to
the leveraging ratio as total credit loaned to cost to USAID. These new metrics give no indication of the actual amount that DCA is guaranteeing.
8. For instance, a 2010 SME loan in Kenya was leveraged at a 21:1 ratio, while an SME loan in Liberia was leveraged at less than 6:1. Similar patterns exist for other fragile/nonfragile state pairs.
9. AfDB (2009).10. The Fund for African Private Sector Assistance’s principal
objectives include creating an enabling business environment, strengthening financial systems, promoting SME develop-ment, and promoting trade access and competitiveness.
11. Figures are current as of September 2010. See Multilateral Aid Review: Assessment of the PIDG, available at http://www.dfid.gov.uk/Documents/publications1/mar/pidg.pdf.
84
Appendix 9
Methodology for reclassifying IDA PSD-related projects
The World Bank Group classifies each project into one or more categories. Due to the large number of categories, projects are spread across a wide array of subcategories and sub-subcategories. With the multitude of categories and the broad scope of many projects, the International Development Association (IDA) will often categorize two very similar projects into two different cat-egories. So for the purposes of our analysis, we have reclassified projects and have created a new category for those that have a direct effect on the private sector or the constraints to growth in the private sector. After a complete recategorization of nearly 5,000 IDA projects, we find that IDA private sector–related projects fall under five broad categories: infrastructure, regula-tory, finance, extractive, and general private sector development (table A9.1).
Projects not included in PSD projects•Catchall “Structural Adjustment Programs” or poverty alle-
viation projects are not included. Many of these projects are spread across sectors, some or all of which may not be in direct support of private sector business.
•Public sector management programs.•Social service projects, such as health and education projects,
unless they exhibit direct relevance to private sector training.•Environmental projects (except those relating to renewable
energy generation, such as solar or geothermal projects).•Projects missing outcome scores or projects in countries or ter-
ritories not assigned a Country Policy and Institutional Assess-ment score (such as in the West Bank and Gaza), as they cannot be defined as fragile or nonfragile.
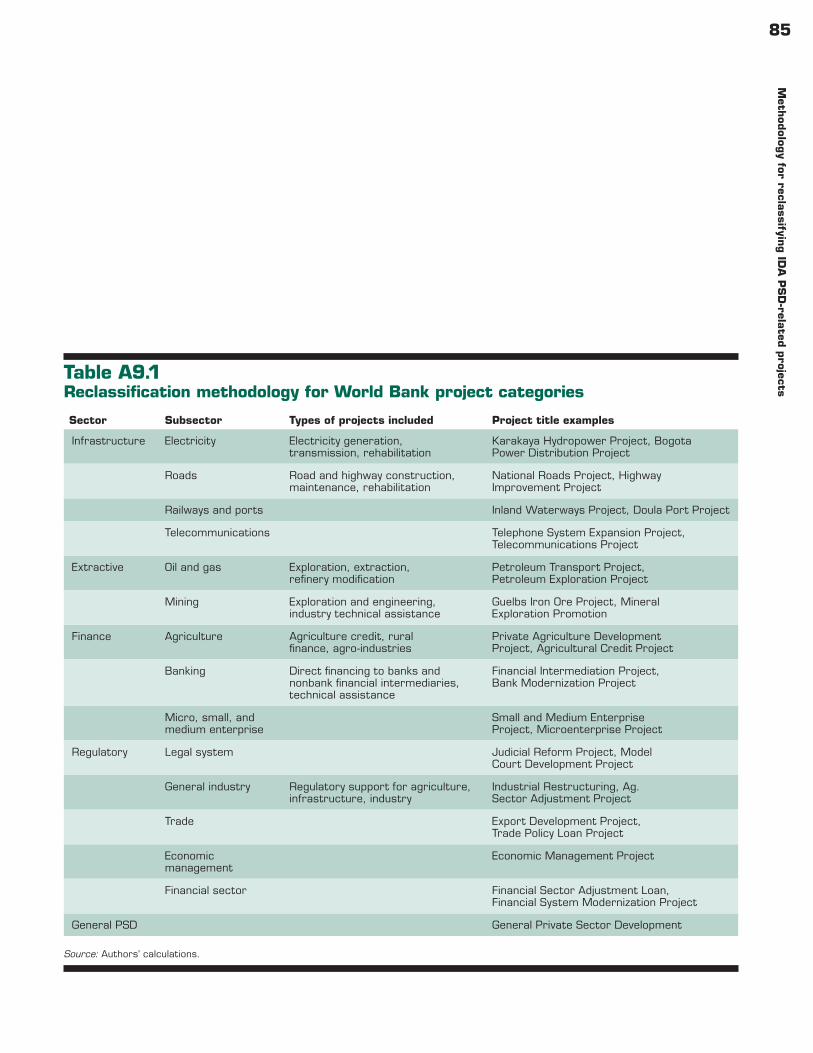
85M
ethod
ology for recla
ssifying ID
A P
SD
-related p
rojects
Table A9.1 Reclassification methodology for World Bank project categories
Source: Authors’ calculations.
Sector Subsector Types of projects included Project title examples
Infrastructure Electricity Electricity generation, transmission, rehabilitation
Karakaya Hydropower Project, Bogota Power Distribution Project
Roads Road and highway construction, maintenance, rehabilitation
National Roads Project, Highway Improvement Project
Railways and ports Inland Waterways Project, Doula Port Project
Telecommunications Telephone System Expansion Project, Telecommunications Project
Extractive Oil and gas Exploration, extraction, refinery modification
Petroleum Transport Project, Petroleum Exploration Project
Mining Exploration and engineering, industry technical assistance
Guelbs Iron Ore Project, Mineral Exploration Promotion
Finance Agriculture Agriculture credit, rural finance, agro-industries
Private Agriculture Development Project, Agricultural Credit Project
Banking Direct financing to banks and nonbank financial intermediaries, technical assistance
Financial Intermediation Project, Bank Modernization Project
Micro, small, and medium enterprise
Small and Medium Enterprise Project, Microenterprise Project
Regulatory Legal system Judicial Reform Project, Model Court Development Project
General industry Regulatory support for agriculture, infrastructure, industry
Industrial Restructuring, Ag. Sector Adjustment Project
Trade Export Development Project, Trade Policy Loan Project
Economic management
Economic Management Project
Financial sector Financial Sector Adjustment Loan, Financial System Modernization Project
General PSD General Private Sector Development
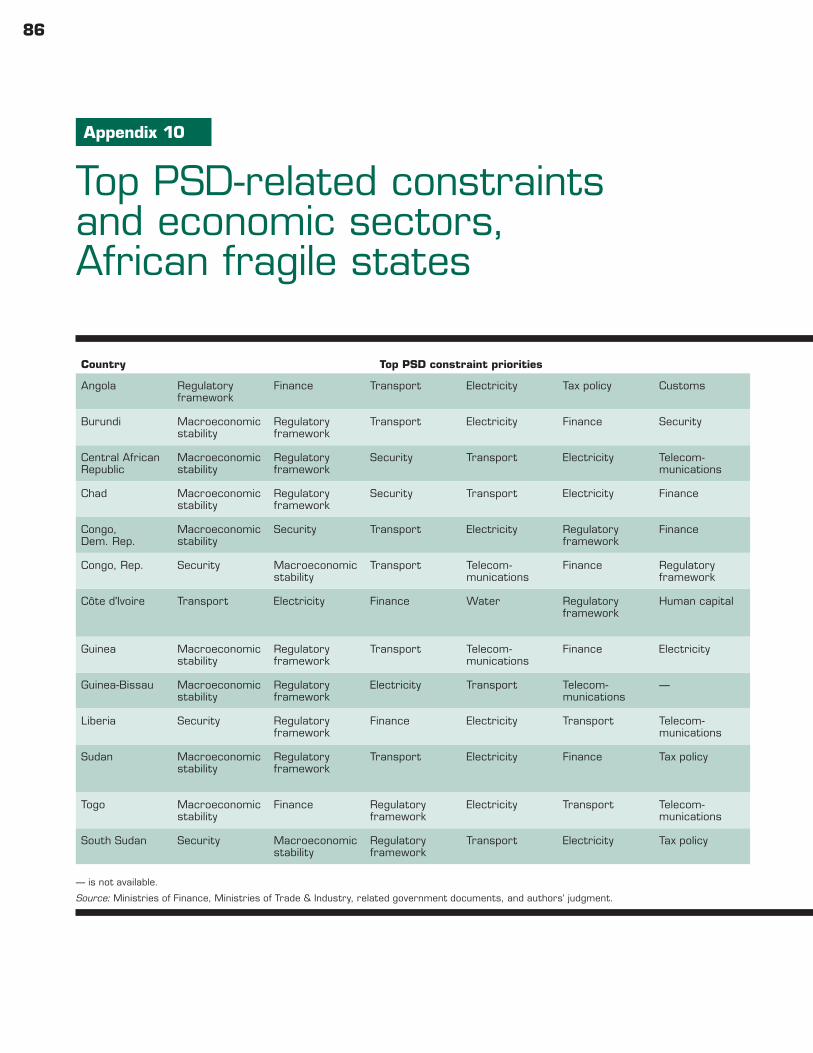
86
— is not available.
Source: Ministries of Finance, Ministries of Trade & Industry, related government documents, and authors’ judgment.
Country Top PSD constraint priorities Economic sector—PSD focus Source documents
Angola Regulatory framework
Finance Transport Electricity Tax policy Customs Agriculture, manufacturing, services, extractive (oil, mining) Strategy to Combat Poverty (2003), Vision 2025
Burundi Macroeconomic stability
Regulatory framework
Transport Electricity Finance Security Agriculture (food security and export crops), fishing, manufacturing, extractive (mining), tourism
PRSP Evaluation Report (October 2010)
Central African Republic
Macroeconomic stability
Regulatory framework
Security Transport Electricity Telecom-munications
Extractive (mining), agriculture (food security), industry, tourism
Interim PRSP (2000), PRSP (2007)
Chad Macroeconomic stability
Regulatory framework
Security Transport Electricity Finance Agriculture (farming, livestock), extractive (oil, mining), industry (mainly construction-related)
Interim PRSP (2000), PRSP (2003)
Congo, Dem. Rep.
Macroeconomic stability
Security Transport Electricity Regulatory framework
Finance Agriculture, extractive (mining, forestry), power, industry PRSP Progress Report (2010)
Congo, Rep. Security Macroeconomic stability
Transport Telecom-munications
Finance Regulatory framework
Extractive (oil), agriculture, small and medium enterprises Interim PRSP (2004), p. 29 (PSD strategy overview)
Côte d'Ivoire Transport Electricity Finance Water Regulatory framework
Human capital Agriculture (food security and export crops), industry (ag processing, chemicals, utilities, construction, textiles, electrical), extractive, tourism, services (ICT)
Interim PRSP (2002), PRSP (2009)
Guinea Macroeconomic stability
Regulatory framework
Transport Telecom-munications
Finance Electricity Agriculture, extractive (mining), retail/hospitality, tourism, fishing
Interim PRSP (2000)
Guinea-Bissau Macroeconomic stability
Regulatory framework
Electricity Transport Telecom-munications
— Agriculture, fishing, extractive Interim PRSP (2000), PRSP Progress Report (2010)
Liberia Security Regulatory framework
Finance Electricity Transport Telecom-munications
Agriculture, extractive (forestry, mining), manufacturing, construction, agro-processing
Interim PRSP (2007), PRSP (2008)
Sudan Macroeconomic stability
Regulatory framework
Transport Electricity Finance Tax policy Agriculture, extractive (oil, mining), manufacturing, services National Economic Program 2001–2002 (2000), Five Year Strategic Plan (2007–2011), Twenty-Five Year Strategy Plan (2007–2031)
Togo Macroeconomic stability
Finance Regulatory framework
Electricity Transport Telecom-munications
Agriculture, finance/banking, fishing, industry, tourism Interim PRSP (2007), PRSP Progress Report (2010)
South Sudan Security Macroeconomic stability
Regulatory framework
Transport Electricity Tax policy Agriculture, extractive (oil, timber, mining) Southern Sudan Growth Strategy 2010–2012, Approved GoSS Budgets (2006, 2007, 2008, 2009, 2010)
Appendix 10
Top PSD-related constraints and economic sectors, African fragile states
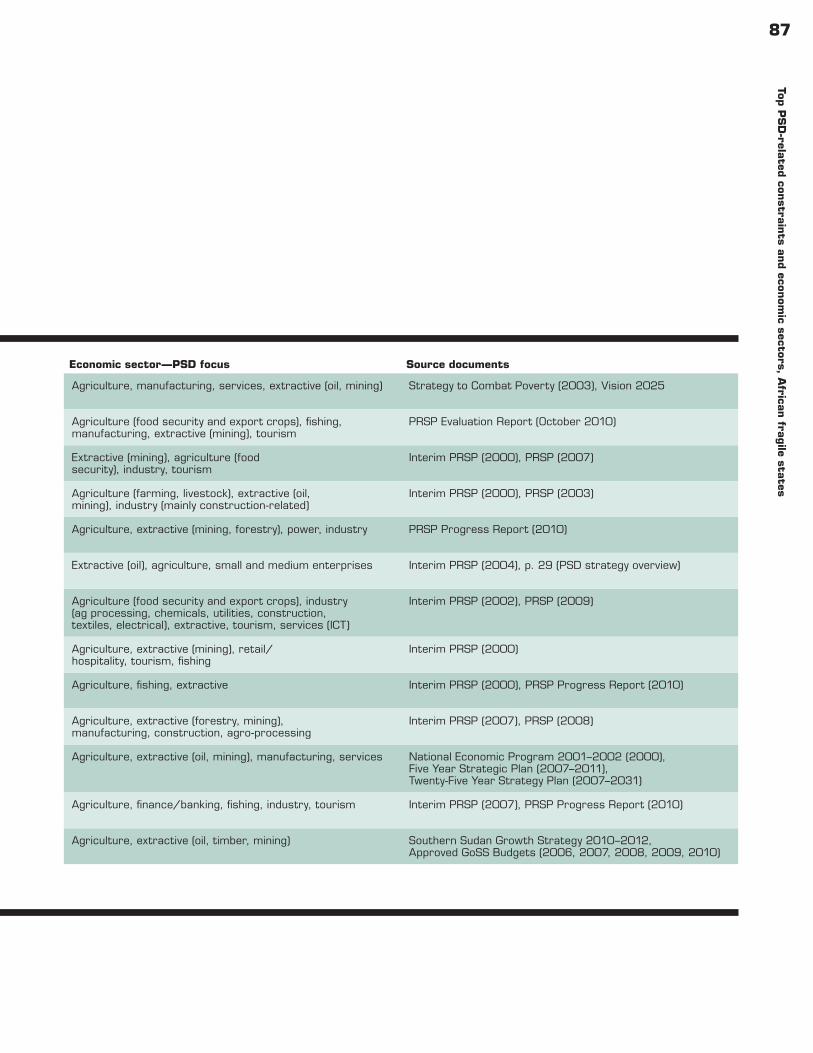
87Top P
SD
-related con
strain
ts and econ
omic sectors, A
frican fra
gile sta
tes
— is not available.
Source: Ministries of Finance, Ministries of Trade & Industry, related government documents, and authors’ judgment.
Country Top PSD constraint priorities Economic sector—PSD focus Source documents
Angola Regulatory framework
Finance Transport Electricity Tax policy Customs Agriculture, manufacturing, services, extractive (oil, mining) Strategy to Combat Poverty (2003), Vision 2025
Burundi Macroeconomic stability
Regulatory framework
Transport Electricity Finance Security Agriculture (food security and export crops), fishing, manufacturing, extractive (mining), tourism
PRSP Evaluation Report (October 2010)
Central African Republic
Macroeconomic stability
Regulatory framework
Security Transport Electricity Telecom-munications
Extractive (mining), agriculture (food security), industry, tourism
Interim PRSP (2000), PRSP (2007)
Chad Macroeconomic stability
Regulatory framework
Security Transport Electricity Finance Agriculture (farming, livestock), extractive (oil, mining), industry (mainly construction-related)
Interim PRSP (2000), PRSP (2003)
Congo, Dem. Rep.
Macroeconomic stability
Security Transport Electricity Regulatory framework
Finance Agriculture, extractive (mining, forestry), power, industry PRSP Progress Report (2010)
Congo, Rep. Security Macroeconomic stability
Transport Telecom-munications
Finance Regulatory framework
Extractive (oil), agriculture, small and medium enterprises Interim PRSP (2004), p. 29 (PSD strategy overview)
Côte d'Ivoire Transport Electricity Finance Water Regulatory framework
Human capital Agriculture (food security and export crops), industry (ag processing, chemicals, utilities, construction, textiles, electrical), extractive, tourism, services (ICT)
Interim PRSP (2002), PRSP (2009)
Guinea Macroeconomic stability
Regulatory framework
Transport Telecom-munications
Finance Electricity Agriculture, extractive (mining), retail/hospitality, tourism, fishing
Interim PRSP (2000)
Guinea-Bissau Macroeconomic stability
Regulatory framework
Electricity Transport Telecom-munications
— Agriculture, fishing, extractive Interim PRSP (2000), PRSP Progress Report (2010)
Liberia Security Regulatory framework
Finance Electricity Transport Telecom-munications
Agriculture, extractive (forestry, mining), manufacturing, construction, agro-processing
Interim PRSP (2007), PRSP (2008)
Sudan Macroeconomic stability
Regulatory framework
Transport Electricity Finance Tax policy Agriculture, extractive (oil, mining), manufacturing, services National Economic Program 2001–2002 (2000), Five Year Strategic Plan (2007–2011), Twenty-Five Year Strategy Plan (2007–2031)
Togo Macroeconomic stability
Finance Regulatory framework
Electricity Transport Telecom-munications
Agriculture, finance/banking, fishing, industry, tourism Interim PRSP (2007), PRSP Progress Report (2010)
South Sudan Security Macroeconomic stability
Regulatory framework
Transport Electricity Tax policy Agriculture, extractive (oil, timber, mining) Southern Sudan Growth Strategy 2010–2012, Approved GoSS Budgets (2006, 2007, 2008, 2009, 2010)
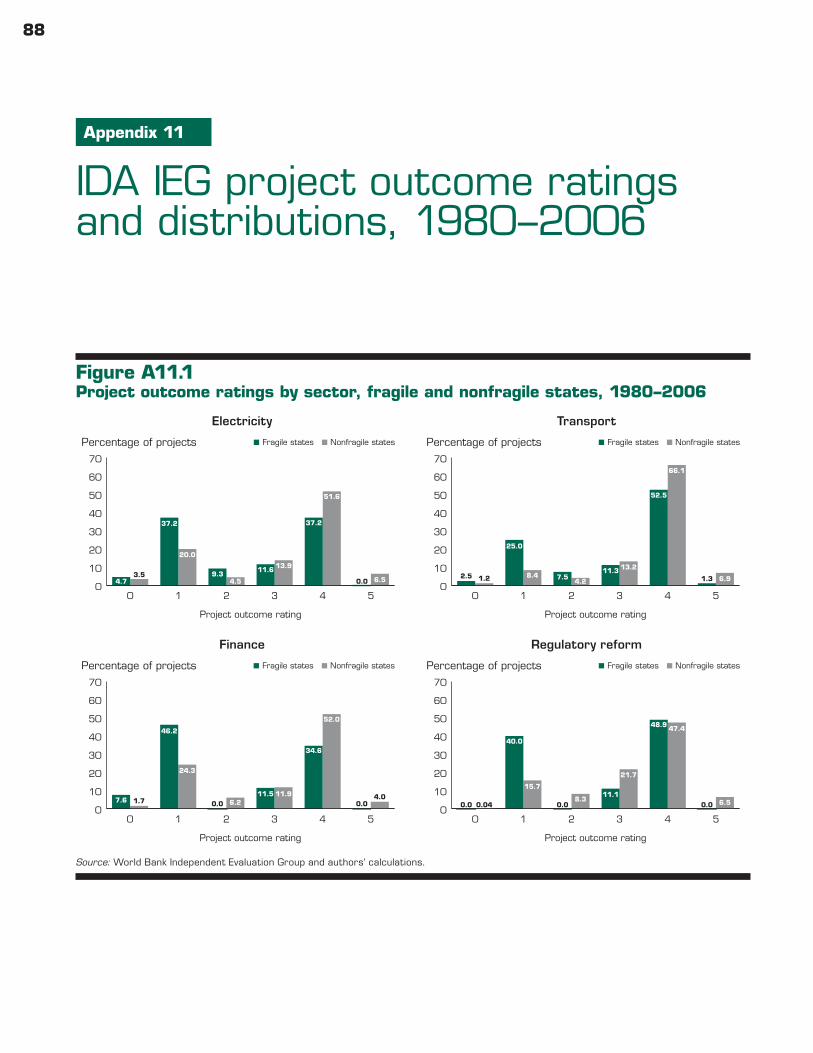
88
IDA IEG project outcome ratings and distributions, 1980–2006
Appendix 11
Figure A11.1 Project outcome ratings by sector, fragile and nonfragile states, 1980–2006
Electricity Transport
Finance Regulatory reform
Source: World Bank Independent Evaluation Group and authors’ calculations.
543210
Percentage of projects
0
10
20
30
40
50
60
70
Project outcome rating
Fragile states Nonfragile states
1.3
52.5
11.37.5
25.0
2.5 6.9
66.1
13.2
4.28.41.2
543210
Percentage of projects
0
10
20
30
40
50
60
70
Project outcome rating
0.0
37.2
11.69.3
37.2
4.7 6.5
51.6
13.9
4.5
20.0
3.5
Fragile states Nonfragile states
543210
Percentage of projects
0
10
20
30
40
50
60
70
Project outcome rating
0.0
48.9
11.1
0.0
40.0
0.0 6.5
47.4
21.7
8.3
15.7
0.04
Fragile states Nonfragile states
543210
Percentage of projects
0
10
20
30
40
50
60
70
Project outcome rating
0.0
34.6
11.50.0
46.2
7.6 4.0
52.0
11.96.2
24.3
1.7
Fragile states Nonfragile states
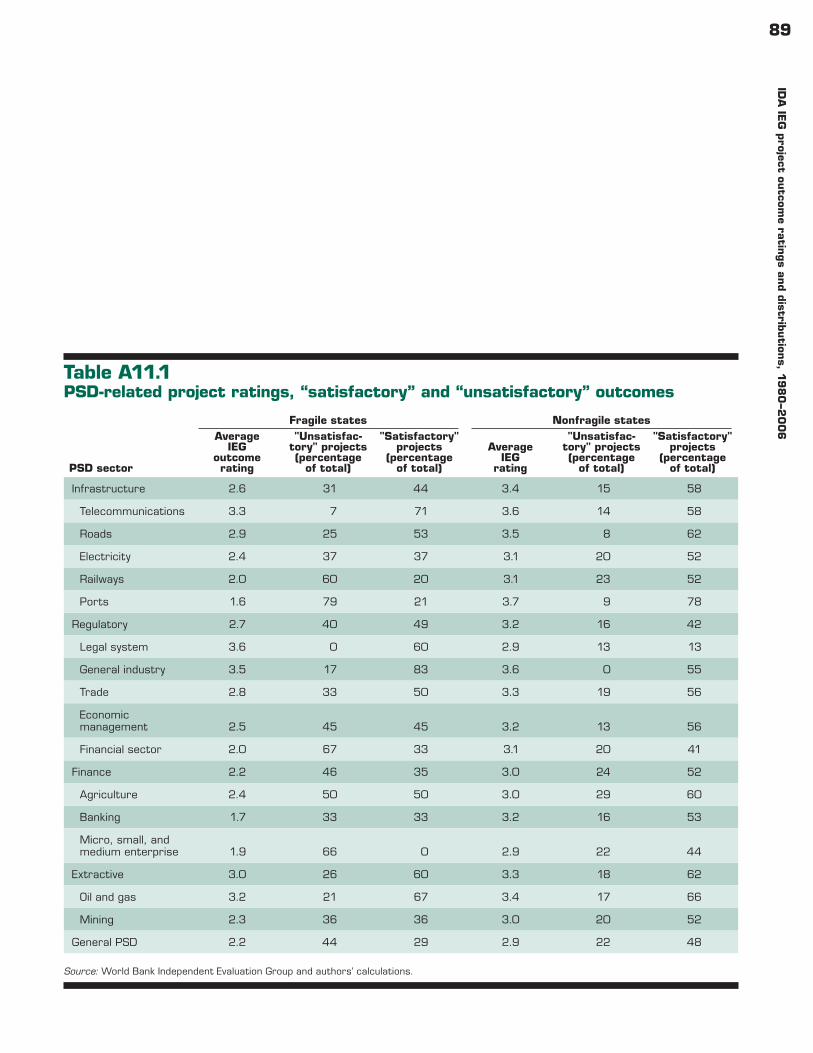
89ID
A IE
G p
roject outcom
e ratin
gs an
d distrib
ution
s, 1980
–20
06
Table A11.1 PSD-related project ratings, “satisfactory” and “unsatisfactory” outcomes
Source: World Bank Independent Evaluation Group and authors’ calculations.
PSD sector
Fragile states Nonfragile statesAverage
IEG outcome rating
"Unsatisfac-tory" projects (percentage
of total)
"Satisfactory" projects
(percentage of total)
Average IEG
rating
"Unsatisfac-tory" projects (percentage
of total)
"Satisfactory" projects
(percentage of total)
Infrastructure 2.6 31 44 3.4 15 58
Telecommunications 3.3 7 71 3.6 14 58
Roads 2.9 25 53 3.5 8 62
Electricity 2.4 37 37 3.1 20 52
Railways 2.0 60 20 3.1 23 52
Ports 1.6 79 21 3.7 9 78
Regulatory 2.7 40 49 3.2 16 42
Legal system 3.6 0 60 2.9 13 13
General industry 3.5 17 83 3.6 0 55
Trade 2.8 33 50 3.3 19 56
Economic management 2.5 45 45 3.2 13 56
Financial sector 2.0 67 33 3.1 20 41
Finance 2.2 46 35 3.0 24 52
Agriculture 2.4 50 50 3.0 29 60
Banking 1.7 33 33 3.2 16 53
Micro, small, and medium enterprise 1.9 66 0 2.9 22 44
Extractive 3.0 26 60 3.3 18 62
Oil and gas 3.2 21 67 3.4 17 66
Mining 2.3 36 36 3.0 20 52
General PSD 2.2 44 29 2.9 22 48
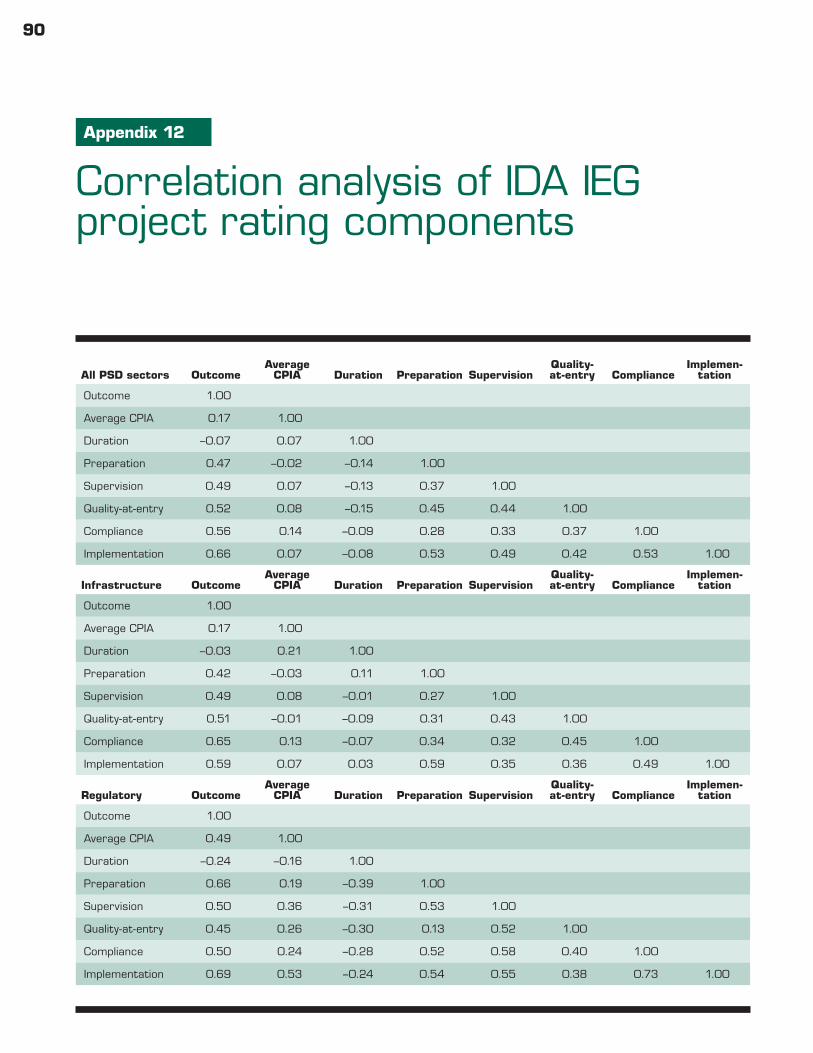
90
Appendix 12
Correlation analysis of IDA IEG project rating components
All PSD sectors OutcomeAverage
CPIA Duration Preparation SupervisionQuality-at-entry Compliance
Implemen-tation
Outcome 1.00
Average CPIA 0.17 1.00
Duration –0.07 0.07 1.00
Preparation 0.47 –0.02 –0.14 1.00
Supervision 0.49 0.07 –0.13 0.37 1.00
Quality-at-entry 0.52 0.08 –0.15 0.45 0.44 1.00
Compliance 0.56 0.14 –0.09 0.28 0.33 0.37 1.00
Implementation 0.66 0.07 –0.08 0.53 0.49 0.42 0.53 1.00
Infrastructure OutcomeAverage
CPIA Duration Preparation SupervisionQuality-at-entry Compliance
Implemen-tation
Outcome 1.00
Average CPIA 0.17 1.00
Duration –0.03 0.21 1.00
Preparation 0.42 –0.03 0.11 1.00
Supervision 0.49 0.08 –0.01 0.27 1.00
Quality-at-entry 0.51 –0.01 –0.09 0.31 0.43 1.00
Compliance 0.65 0.13 –0.07 0.34 0.32 0.45 1.00
Implementation 0.59 0.07 0.03 0.59 0.35 0.36 0.49 1.00
Regulatory OutcomeAverage
CPIA Duration Preparation SupervisionQuality-at-entry Compliance
Implemen-tation
Outcome 1.00
Average CPIA 0.49 1.00
Duration –0.24 –0.16 1.00
Preparation 0.66 0.19 –0.39 1.00
Supervision 0.50 0.36 –0.31 0.53 1.00
Quality-at-entry 0.45 0.26 –0.30 0.13 0.52 1.00
Compliance 0.50 0.24 –0.28 0.52 0.58 0.40 1.00
Implementation 0.69 0.53 –0.24 0.54 0.55 0.38 0.73 1.00

91C
orrelation
analysis of ID
A IE
G p
roject ratin
g compon
ents
Source: International Development Association and authors’ calculations.
Finance OutcomeAverage
CPIA Duration Preparation SupervisionQuality-at-entry Compliance
Implemen-tation
Outcome 1.00
Average CPIA –0.11 1.00
Duration –0.38 –0.34 1.00
Preparation 0.91 –0.20 –0.08 1.00
Supervision 0.41 –0.05 0.07 0.71 1.00
Quality-at-entry 0.67 –0.23 –0.11 0.65 0.63 1.00
Compliance 0.08 –0.18 0.39 0.09 0.53 0.40 1.00
Implementation 0.76 0.00 –0.10 0.82 0.60 0.20 –0.07 1.00
Extractive OutcomeAverage
CPIA Duration Preparation SupervisionQuality-at-entry Compliance
Implemen-tation
Outcome 1.00
Average CPIA 0.18 1.00
Duration –0.03 0.25 1.00
Preparation 0.26 –0.13 –0.42 1.00
Supervision 0.45 –0.05 0.20 0.10 1.00
Quality-at-entry 0.49 0.47 –0.30 0.51 0.15 1.00
Compliance 0.53 0.28 0.21 0.12 0.24 0.02 1.00
Implementation 0.66 0.03 –0.06 0.59 0.42 0.22 0.53 1.00
92
References
Af DB (African Development Bank). 2009. FAPA Annual Report 2008–2009. Tunis.
———. 2011. Infrastructure and Growth in Zimbabwe: An Action Plan for Sustained Strong Economic Growth. Tunis.
AllAfrica. 2009. “Desperate Water Shortage in Somaliland.” August 4. http://allafrica.com/stories/200908040796.html.
Atil, Melody. 2009. Expanding the Provision and Impact of Microfinance in Southern Sudan. Washington, DC: World Bank.
Bradbury, Mark. 2008. Becoming Somaliland. Bloomington, IN: Indiana University Press.
Commander and Nikoloski. 2010.Commission on Growth and Development. 2008. The Growth
Report: Strategies for Sustained Growth and Inclusive Develop-ment. Washington, DC: World Bank.
Confederation of Zimbabwe Industries. 2010. “Manufacturing Survey 2010.” Harare.
Df ID (U.K. Department for International Development). 2010. Multilateral Aid Review 2010: International Finance Corporation. London.
Economic Intelligence Unit. 2010. “Risk Briefing Zimbabwe.” Accessed from EIU Online Database of Country Risk Brief-ings, December 1, 2010.
The Economist. 1999. “Somaliland: A Nomad’s Life Is Hard.” August 5. www.economist.com/node/230314.
———. 2001. “The Nation Nobody Knows.” 2001. April 12. www.economist.com/node/569115.
Emerson, Patrick M. 2006. “Corruption, Competition and Democracy.” Journal of Development Economics 81 (1): 193–212.
Eubank, Nicholas. 2010. “Peace-Building without External Assis-tance: Lessons from Somaliland.” CGD Working Papers 198, Center for Global Development, Washington, DC.
———. Forthcoming. “Taxation, Political Accountability, and Foreign Aid: Lessons from Somaliland.” Journal of Develop-ment Studies.
Everest-Phillips, Max. 2008. “Business Tax as State-Building in Developing Countries: Applying Governance Principles in Private Sector Development.” International Journal of Regula-tion and Governance 8 (2): 123–154.
FIAS (Financial Investment Advisory Service). 2010. 2010 Annual Review. Washington, DC.
Forni, Mario, and Sergio Paba. 2002. “Spillovers and the Growth of Local Industries.” Journal of Industrial Economics 50 (2): 151–171.
Gelb, Alan. 2010 “How Can Donors Create Incentives for Results and Flexibility for Fragile States? A Proposal for IDA.” CGD Working Paper 227, Center for Global Development, Wash-ington, DC.
Gelb, Alan, and Gene Tidrick. 2000. “Growth and Job Creation in Africa.” In Economic Policy in Labor Surplus Economies — Strategies for Growth and Job Creation in Southern Africa. Report on the Proceedings of a Southern African Conference, Gaborone, May 3–5.
Government of South Sudan. 2010a. Approved Budget 2010. Juba.———. 2010b. Donor Book 2010. Juba. www.goss-online.
o r g / m a g n o l i a P u b l i c / e n / m i n i s t r i e s / F i n a n c e /mainColumnParagraphs/0/content_files/file7/2010%20Donor%20Book_FINAL.pdf.
———. 2010c. “The Opportunities and Challenges of Delivering Rapid and Inclusive Growth in Southern Sudan.” Juba.
Gulaid, Ali. 2003. “Corruption, Corruption Everywhere.” The Republican 7 (26): 23–29.
Harris, Geoff T. 1999. Recovery from Armed Conflict in Developing Countries. London and New York: Routledge.
Heritage Foundation. 2011. 2011 Index of Economic Freedom. Washington, DC and New York: Heritage Foundation and Dow Jones & Company.
International Crisis Group. 2003. Somaliland: Democratisation and Its Discontents. Nairobi/Brussels. www.crisisgroup.org/en/regions/africa/horn-of-africa/somalia/066-somaliland -democratisation-and-its-discontents.aspx
93R
eferences
IEG (Independent Evaluation Group). 2011. “Appendix D: Determinants of Project Performance.” In Evaluative Les-sons from World Bank Group Experience: Growth and Pro-ductivity in Agriculture and Agribusiness, 126–141. Washing-ton, DC: World Bank. http://siteresources.worldbank.org/INTGPAA/Resources/AppendixD.pdf.
IFC (International Finance Corporation). 2010a. Df ID Multi-lateral Aid Review 2010. Washington, DC.
———. 2010b. IFC Road Map FY11–13: Maximizing Impact, Unlocking Our Potential. Washington, DC.
IHS (Information Handling Services). 2010. “Global Insight Report: Zimbabwe (Country Intelligence).” Englewood, CO.
ILO (International Labour Organization). 2011. Global Employ-ment Trends 2011. Geneva: International Labour Office.
Imara Africa Securities. 2010. “2nd Annual Imara Zimbabwe Investor Conference Post Conference Insights.” June 21, Harare.
IMF (International Monetary Fund). 2007. “Liberia: Interim Poverty Reduction Strategy Paper.” IMF Country Report 07/60, Washington, DC.
———. 2010. “Zimbabwe: 2010 Article IV Consultation.” IMF Country Report 10/186, Washington, DC.
JSL Times. 2011. “Somaliland — Interest Free but Not yet Shari’ah-Compliant Economy.” July 6. www.jsltimes.com/somaliland -interest-free-but-not-yet-shari%E2%80%99ah-compliant -economy.
Kurokawa, Kiyoto, Fletcher Tembo, and Dirk Willem te Velde. 2008. “Donor Support to Private Sector Development in Sub-Saharan Africa: Understanding the Japanese Ovop Pro-gramme.” ODI Working Paper 290, Overseas Development Institute, London.
Makochekanwa, Albert, and Marko Kwaramba. “Dwindling Access to Basic Services in Zimbabwe.” Prepared for Cen-ter for Global Development’s Fragile States book.
McKinsey & Company. 2010. McKinsey on Africa: A Continent on the Move. London.
McKinsey Global Institute. 2010. Lions on the Move: The Prog-ress and Potential of African Economies. London: McKinsey & Company.
Moss, Todd, and Benjamin Leo. 2011. “IDA at 65: Head-ing Toward Retirement or a Fragile Lease on Life?” CGD
Working Paper 246, Center for Global Development, Wash-ington, DC.
Moss, Todd, and Stewart Patrick. 2005. “The Day After Com-rade Bob: Applying Post-Conflict Reconstruction Lessons to Zimbabwe.” CGD Working Paper 72, Center for Global Development, Washington, DC.
Perry, Guillermo. 2011. Growing Business or Development Prior-ity? Multilateral Development Banks’ Direct Support to Private Firms. Washington, DC: Center for Global Development.
Ramachandran, Vijaya, and Manju Kedia Shah. “Business Envi-ronment Constraints to Private Sector Development in Africa: Evidence from Enterprise Surveys.” African Devel-opment Report 2011. Tunis: African Development Bank.
Ramachandran, Vijaya, Alan Gelb, and Manju Kedia Shah. 2009. Africa’s Private Sector: What’s Wrong with the Business Environment and What to Do About It. Washington, DC: Center for Global Development.
Republic of Zimbabwe. 2011. “Zimbabwe Medium Term Plan, 2011–2015.” Harare. www.agbiz.co.za/LinkClick.aspx? fileticket=GbVmM2kyaeg%3D&tabid=337.
Reuters. 2010. “New Railway Links North and South Sudan.” March 12. http ://af.reuters.com/article/topNews/idAFJOE62B01Y20100312.
Ruati, Richard. 2011. “USAID inaugurates power plant in Kapoeta, E. Equatoria.” Sudan Tribune, February 4. www.sudantribune.com/USAID-inaugurates-power-plant-in,37878.
SSCCSE (Southern Sudan Centre for Census, Statistics and Evaluation). 2009. National Baseline Household Survey 2009. Juba.
———. 2010. Statistical Yearbook for Southern Sudan 2010. Juba.Somaliland Ministry of Planning and Coordination. 2010.
Somaliland in Figures. Hargeisa. http://somalilandlaw.com/Somaliland_in_Figures_20010.pdf.
Timmer, Peter. 2006. “How Countries Get Rich.” CGD Brief, February, Center for Global Development, Washington, DC.
UN-HABITAT (United Nations Human Settlements Pro-gramme). 2008. “Berbera: First Steps towards Strategic Urban Planning.” Nairobi. www.somalilandlaw.com/Berbera_Urban_Planning.pdf.
WFP (World Food Programme). 2011. Feeder Road Construction in Support of WFP Operations in Southern Sudan. Rome.
94R
efer
ence
s
World Bank. 2009. Sudan — The Road Towards Sustainable and Broad-Based Growth. Washington, DC.
———. 2010a. Doing Business in Zimbabwe 2011. Washington, DC.
———.2010b. Investing Across Borders. Washington, DC.———. 2010c. “Open Data Measures Progress.” April 22. http://
data.worldbank.org/news/open-data-measures-progress.———. 2010d. Sudan Investment Climate Assessment. Washington,
DC.———. 2011a. 2011 World Development Report: Conflict, Security,
and Development. Washington, DC.
———. 2011b. Doing Business 2011: Making a Difference for Entre-preneurs. Washington, DC.
———. 2011c. Doing Business in Juba 2011. Washington, DC. www.doingbusiness.org/reports/subnational-reports/juba.
———. 2011d. “Zimbabwe Economic Monitor Indicators.” http://siteresources.worldbank.org/INTZIMBABWE/Resources/zimbabawe_Monitor_tables.xlsx.
World Bank Group Development Committee. 2011. “Opera-tionalizing the 2011 World Development Report: Conflict, Security, and Development.” Washington, DC.

For an electronic version of this report, visit www.cgdev.org.
ISBN 978-1-933286-68-6
Supporting Private Business Growth in African Fragile StatesA Guiding Framework for the World Bank Group in South Sudan and Other Nations
Benjamin Leo, Vijaya Ramachandran, and Ross Thuotte
Cente
r for G
lobal D
eve
lopm
ent
Sup
portin
g Private B
usiness G
rowth
in A
frican Fragile S
tates Leo, R
amachan
dran, and Thuotte
CG
D
Recommended