�������� ����� ��
Splat morphology of plasma sprayed aluminum oxide reinforced with carbonnanotubes: A comparison between experiments and simulation
Anup Kumar Keshri, Arvind Agarwal
PII: S0257-8972(11)00709-2DOI: doi: 10.1016/j.surfcoat.2011.07.025Reference: SCT 16889
To appear in: Surface & Coatings Technology
Received date: 21 December 2010Revised date: 30 April 2011Accepted date: 11 July 2011
Please cite this article as: Anup Kumar Keshri, Arvind Agarwal, Splat morphologyof plasma sprayed aluminum oxide reinforced with carbon nanotubes: A compari-son between experiments and simulation, Surface & Coatings Technology (2011), doi:10.1016/j.surfcoat.2011.07.025
This is a PDF file of an unedited manuscript that has been accepted for publication.As a service to our customers we are providing this early version of the manuscript.The manuscript will undergo copyediting, typesetting, and review of the resulting proofbefore it is published in its final form. Please note that during the production processerrors may be discovered which could affect the content, and all legal disclaimers thatapply to the journal pertain.

ACC
EPTE
D M
ANU
SCR
IPT
ACCEPTED MANUSCRIPT
1
Splat Morphology of Plasma Sprayed Aluminum Oxide Reinforced with
Carbon Nanotubes: A Comparison between Experiments and
Simulation
Anup Kumar Keshri
1, 2 and Arvind Agarwal
1,*
1Plasma Forming Laboratory Mechanical and Materials Engineering,
Florida International University, Miami, FL 33174, USA
2Manufacturing Division, School of Mechanical and Building Sciences Vellore Institute of Technology University, Vellore 632 014, Tamil Nadu, India
Abstract
This study elucidates the effect of carbon nanotube (CNT) addition on the splat formation
in plasma sprayed aluminum oxide (Al2O3) composite coating using experimental and
computational methods. CNT content was varied as 0, 4 and 8 wt. % in Al2O3 matrix.
With an increasing CNT content, splat morphology became more circular and disk-
shaped. The average diameter of disk-shaped splats increased from 28.6±1.4 µm for
Al2O3 to 43.2±1.3 µm for Al2O3-8 wt. % CNT. The population density of splats with
fingers, fragments, and voids was the lowest for the highest (8 wt. %) CNT content. The
addition of CNTs resulted in two simultaneously competing phenomena viz. increased
thermal capacity and increased viscosity of the melt. Increased thermal capacity delayed
the localized solidification resulting in higher splat diameter while agglomeration of
CNTs at the periphery of the splat results higher viscosity of the melt which suppresses
the splat fragmentation that leads to increased population density of disc shaped splats.
Splat morphology of three compositions was also simulated using SIMDROP software,
which showed a good agreement with the experimentally collected splats.
Keywords: Aluminum oxide, Carbon nanotube, Plasma spraying, Splat
* Corresponding Author: Arvind Agarwal, Ph: +1-305-348-1701, Fax: +1-305-348-1932 Email: [email protected]

ACC
EPTE
D M
ANU
SCR
IPT
ACCEPTED MANUSCRIPT
2
1. Introduction
Splat is the smallest unit of the microstructure of plasma sprayed coatings. The
properties of the coatings are largely dependent on the splat morphology and their
stacking [1-4]. Incomplete melting and improper stacking of splats can result in globular
voids, poor adhesion at the inter-splat boundary which can have adverse effect on the
mechanical, thermal and electrical properties of the coatings [5-7]. Hence splat formation
and its morphology play a significant role in tailoring the coating properties. Several
studies have been reported on the morphological aspect of splats [1, 3, 4, 8-10] which
suggest that splat morphology largely dependent on (i) feedstock material properties [8],
(ii) thermal and kinetic state of the in-flight particle [8, 10] and (iii) substrate chemical
state, roughness and temperature [3, 4, 11].
Elsebaei et al. [8] performed a study on the morphology of individual splats for
different set of plasma operating parameters (arc current: 700, 870 A, stand-off distance:
80, 100 mm) for the regular yittria stabilized zirconia (YSZ) (particle size: 45-100 µm)
and the spherical agglomerate of YSZ (agglomerate size: 20-40 µm) synthesized from the
nano-YSZ powder particle. Spherical agglomerate of nano YSZ was used with the intent
to melt the periphery of the agglomerate and to retain the nano-features in the core. Such
coating resulted in bimodal microstructure. Lima et al. [12] studied thermal spray
coatings synthesized from the nanostructured ceramic agglomerated powder and
concluded that it was necessary to avoid the full melting of the agglomerates to preserve
nanostructure in the coating. Elsebaei et al [8] concluded that circularity (degree of
roundness) and flattening degree (ratio of the diameter of splat to starting droplet) of YSZ

ACC
EPTE
D M
ANU
SCR
IPT
ACCEPTED MANUSCRIPT
3
splats synthesized from the spherical agglomerate were larger than the regular-YSZ
splats. This was attributed to the smaller particle size, higher particle temperature and
velocity of agglomerated-YSZ particles [8]. Splats synthesized using spherical
agglomerates of YSZ were more disk shaped (i.e. better circularity) as compared to
regular-YSZ splats at a higher stand-off distance [8]. This was due to the higher particle
velocity of agglomerated-YSZ compared to regular-YSZ particle [8].
Bianchi et al. [13] deposited single splats by spraying micron-size zirconia on
“cold” 304L stainless steel substrate (~100°C) and observed a highly fragmented
morphology. Perfect disc shaped splats were obtained for the substrate heated to 300°C
[13]. Fukumoto et al. [14, 15] studied the relationship between the splat morphology
(from the micron-sized feedstock particles) and the substrate temperature and observed
distinct changes in the splat morphology. Threshold transition temperature for the
substrate was first identified by Fukumoto et al. [15], beyond which splat morphology
changes from fragmented to disk shaped. Sampath et al. [3, 4] carried out a study on the
effect of substrate temperature on the splat formation for partially stabilized micron-sized
zirconia particles. The threshold transition temperature was found in the range of 250-
300°C [3]. In the case of “cold” substrates, initiation or localized solidification is
responsible for spreading instability which leads to flattening splashing [3, 4]. Preheated
substrate above the transition temperature provides better contact and uniform heat
conduction which minimizes the localized solidification [3, 4]. The substrate heating also
allows condensates and adsorbates desorbtion. Li et al. [16] studied the effect of substrate
preheating temperature and surface organic covering on splat formation. Splats
(aluminum, nickel, copper, Al2O3 and molybdenum) were deposited on polished stainless

ACC
EPTE
D M
ANU
SCR
IPT
ACCEPTED MANUSCRIPT
4
steel substrate surface covered with different organic substances (xylene, glycol and
glycerol). It was found that when the preheating temperature exceeded 50°C over the
boiling point of organic substance, the regular disk type splats were formed [16]. An
optimum substrate preheating is required to strike a balance between better splat
formation and minimal residual stress. These studies indicate that powder feedstock,
processing conditions and substrate conditions have significant effect on the splat
formation.
Our research group has worked extensively on the synthesis of CNT reinforced
aluminum oxide coatings by plasma spray technique [17-27]. Comprehensive process
maps have been successfully developed to synthesize “lowest porosity” plasma sprayed
Al2O3 composite coatings with 0, 4 and 8 wt. % CNT reinforcement [26]. Balani et al.
obtained ~200% improvement in the elastic modulus [19], 57% improvement in the
fracture toughness [17] and 49 times enhancement in dry sliding wear resistance [21] by
adding 8 wt. % CNTs in Al2O3 coatings. Improved elastic modulus, fracture toughness
and wear resistance was mainly attributed to excellent dispersion of CNTs in the Al2O3
matrix that promotes toughening mechanisms such as CNT bridging, crack deflection at
CNT/Al2O3 interface [17-21]. A majority of our past work on Al2O3–CNT coatings was
focused on studying the materials property as function of process, microstructure and
CNT content. However, the role of CNT in the splat formation was never addressed.
Bakshi et al. [27] did a preliminary study on the role of CNT in metallic Al-Si splat
formation and concluded that splat shape is governed by the viscosity and thermal
conductivity of the droplet which are dependent on the CNT content. Higher CNT

ACC
EPTE
D M
ANU
SCR
IPT
ACCEPTED MANUSCRIPT
5
content (10 wt. %) leads to disc shaped Al-Si splat as compared to lower CNT content (5
wt. %), which was attributed to increase in the viscosity of the melt due to increased CNT
content [27].
Motivated by this scenario, the objective of this study is to understand the role of
CNT in the Al2O3 splat formation. The effect of varying CNT content on the splat
morphologies has been investigated. Splat formation can be optimized by
experimentation but it requires extensive and time consuming experiments due to large
number of processing variables involved in plasma spraying. Splat morphology
simulation for the given processing variables can save considerable amount of time. In
this study, splat morphology simulation has also been performed using SIMDROP
(Simulent Drop 3.0, Simulent Inc, Toronto, Canada) and comparison has been made with
experimentally deposited splats.
2. Experimental
2.1 Powder Feedstock
Sub-micron sized Al2O3 (~150 nm, average diameter) powder and multiwall
carbon nanotubes (95% +purity, 40–70 nm outer diameter, 0.5–2.0 μm in length) were
used as starting materials. Since sub-micron sized fine powder and CNTs cannot be fed in
the plasma flow using conventional carrier gas due to their high interparticle friction and
resulting inconsistent flow, spray drying was implemented to manufacture micron-sized
agglomerates. Spray drying also allows homogeneous dispersion of CNTs in Al2O3
matrix. Sub-micron Al2O3 powder was spray dried (referred as A-SD) to obtain spherical

ACC
EPTE
D M
ANU
SCR
IPT
ACCEPTED MANUSCRIPT
6
agglomerates of 30±10 μm in diameter. The diameter of the spherical agglomerates was
measured from the 5-6 different SEM images. From each image, 15-20 measurements of
agglomerate diameter were taken. Powder size distribution of A-SD, A4C-SD and A8C-
SD are shown in Figure 1a-c respectively. Spray drying of sub-micron Al2O3 with 4 wt.
% CNTs (referred as A4C-SD) and 8 wt. % CNTs (referred as A8C-SD) resulted in
spherical agglomerates of 26±7 μm and 24±5 μm respectively. A-SD powder served as
the control sample to investigate the effect of CNT addition.
2.2 Synthesis of Single Splat
A-SD, A4C-SD, A8C-SD powders were plasma sprayed using SG 100 gun
(Praxair Surface Technology, Danbury, CT, USA) on polished (Ra= 0.03 m, RZ =0.098
m) AISI 1020 steel substrate (22 mm ×19 mm ×3.2 mm) to collect splats. Diameters of
the splats were measured using Image J software (http://rsbweb.nih.gov/ij/index.html). A
total of ~100 splats were taken into consideration from 5-6 different SEM images. Splats
were deposited at optimized plasma process parameters which showed lowest porosity in
the coating [26]. Details of the optimization of plasma process parameters can be found
elsewhere [26]. Substrate preheat temperature was maintained at 453 K which was same
as in the optimization study for the lowest porosity coating [26]. Table I summarizes the
plasma spray operating parameters for splat experiments. Carrier gas flow rate was
adjusted for three different powder feedstock to maintain a constant powder feed rate of 3
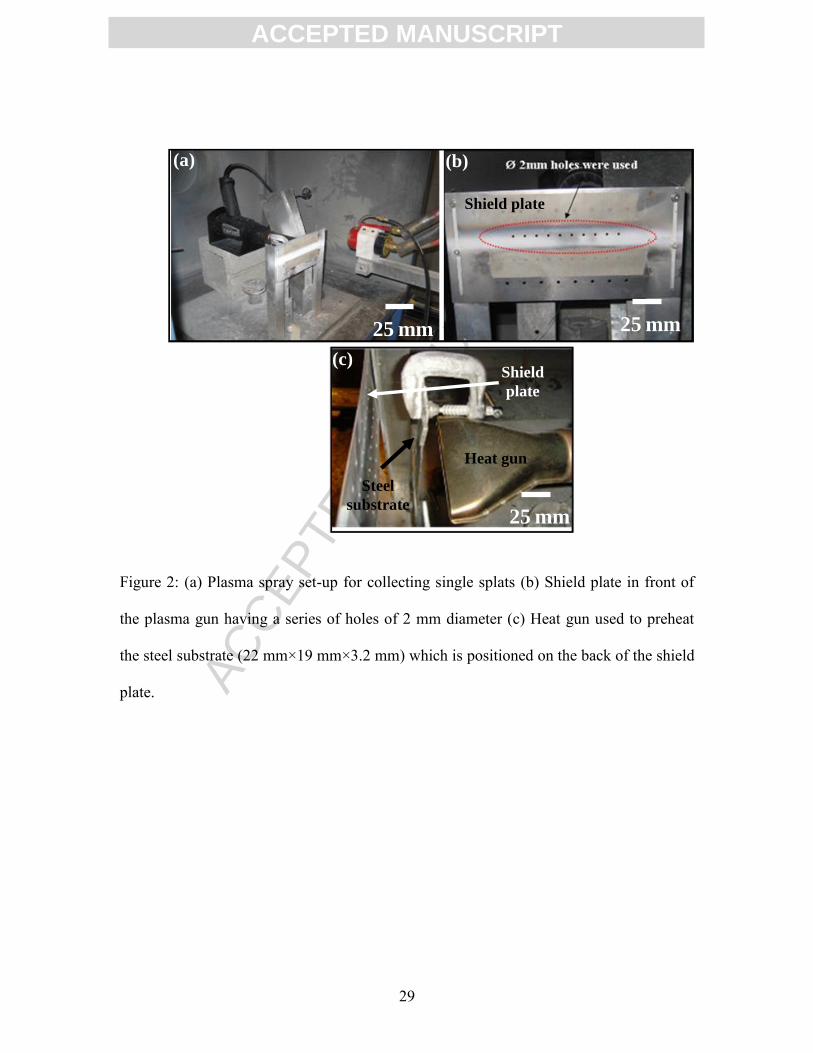
g/min. Figure 2a shows the set up for plasma spraying of single splats. Temperature and
velocity of the in-flight powder particle were measured using AccuraSpray™ in-flight
diagnostic sensor (Tecnar Automation Ltée, QC, Canada). In-flight particle flow pattern
ACC
EPTE
D M
ANU
SCR
IPT
ACCEPTED MANUSCRIPT
7
was diagnosed at 75 mm of spray distance which was same at which splats of Al2O3 and
Al2O3-CNT were deposited. The sensor was located at the middle of the particle flow
pattern. Accuraspray diagnostic system provides ensemble average data which represents
the particle characteristics in a measurement volume of approximate 75 mm3. The
minimum temperature that can be measured with the sensor is 900°C with 0.5% precision
while the minimum velocity that can be measured is 5 m/s with 0.5% precision. Error in
the velocity and temperature measurement is <1.5 m/s, and <15°C respectively at cross-
correlation factor > 0.9. Experimentally obtained ensemble surface temperature and
velocity of in-flight particles were used for the splat simulation of A-SD, A4C-SD and
A8C-SD.
A shield plate with a series of 2 mm diameter holes was used to collect well
dispersed splats as shown in Figure 2b. The holes in the shield plate were aligned with
the particle flow pattern. The steel substrate was positioned behind the shield plate at a
total spray distance of 75 mm. The substrate was preheated to 453 K using a heating gun
(STEINEL, HG 2510 ESD, MN, USA) as shown in Figure 2c. The substrate temperature
was continuously measured using K-type thermocouple (KMQSS-020U, Omega
Engineering Inc., wire diameter: 1 mm) inserted through the substrate thickness. Figure
3a is the picture of the substrate showing hole (1 mm diameter) at the center of the
substrate and through thickness. One end of the thermocouple was positioned into this
hole while the other end was connected to the data logger for the substrate temperature
measurement. The reading rate of the data logger was 12 measurements/minute. Figure
3b illustrates the schematic of substrate showing dimension of all faces and hole. Plasma

ACC
EPTE
D M
ANU
SCR
IPT
ACCEPTED MANUSCRIPT
8
gun speed was 25 mm/sec, which was same as used for the optimization study for the
lowest porosity coating [26].
2.3 Microstructural Characterization
FEI PHENOM (in back scattered mode) and JEOL JSM-633OF field emission (in
secondary electron image mode) scanning electron microscopes were used at an
operating voltage of 15 kV to investigate the powder morphology and splat morphology
of A-SD, A4C-SD and A8C-SD.
2.4 Splat Simulation
Splat morphology simulation has been performed using SIMDROP (Simulent
Drop 3.0, Simulent Inc, Toronto, Canada) software. SIMDROP software, developed by
Pasandideh-Fard et al. employs three-dimensional finite-difference algorithm which
solves the Navier-Stokes equation including heat transfer and phase change [28-31].
Volume of fluid (VoF) tracking algorithm is used in this model to track the droplet-free
surface [28-31]. Also, thermal contact resistance (usually 10-7 m2K/W for thermal spray
process) at the droplet-substrate interface is included in this model [28-31]. Splat
simulation was performed for A-SD, A4C-SD, and A8C-SD powders. Experimental data
from the plasma spraying was used as the input for the simulation. One of the major
challenges encountered in the simulation was the non-availability of materials properties
(Kinematic viscosity, thermal conductivity, specific heat, surface tension of the liquid
phase, thermal conductivity and specific heat of solid phase, heat of fusion etc.)
especially for CNT reinforced Al2O3, because high temperature thermophysical

ACC
EPTE
D M
ANU
SCR
IPT
ACCEPTED MANUSCRIPT
9
properties of CNTs are non-existent in the literature. Thermophysical properties of CNT
were approximated as of graphite [32]. Thermophysical properties for Al2O3 were
obtained from the literature [33, 34]. However, most of the thermophysical properties in
the literature are listed at temperatures different than in-flight temperature of A-SD, A4C-
SD and A8C-SD particles exiting from the plasma. SIMDROP software is capable of
making the best fit of the materials property as a function of temperature from the
available data [35]. Thus, it can generate the property at the desired temperature by
interpolating or extrapolating the fitted curve [35]. For example, in case of one of the
materials property i.e. solid phase specific heat, format of the input file is as following:
N = n T = T1, T2, T3, T4 ……………………..Tn C = C1, C2, C3, C4……………………..Cn where, N is the total number of paired data sets, T is the array of temperatures (K), and C
is the array of solid phase specific heat at corresponding temperature (in W/m-K).
SIMDROP can generate best fitting curve as C=f(T). Similarly, other thermophysical
properties were inserted in the above format for the splat simulation. Rule of mixtures
(ROM) was used to estimate the apparent thermophysical properties of the complex
Al2O3-CNT composite materials from intrinsic properties of both Al2O3 and CNT and
inserted as an input parameter for the splat simulation. Hence, splat simulation was
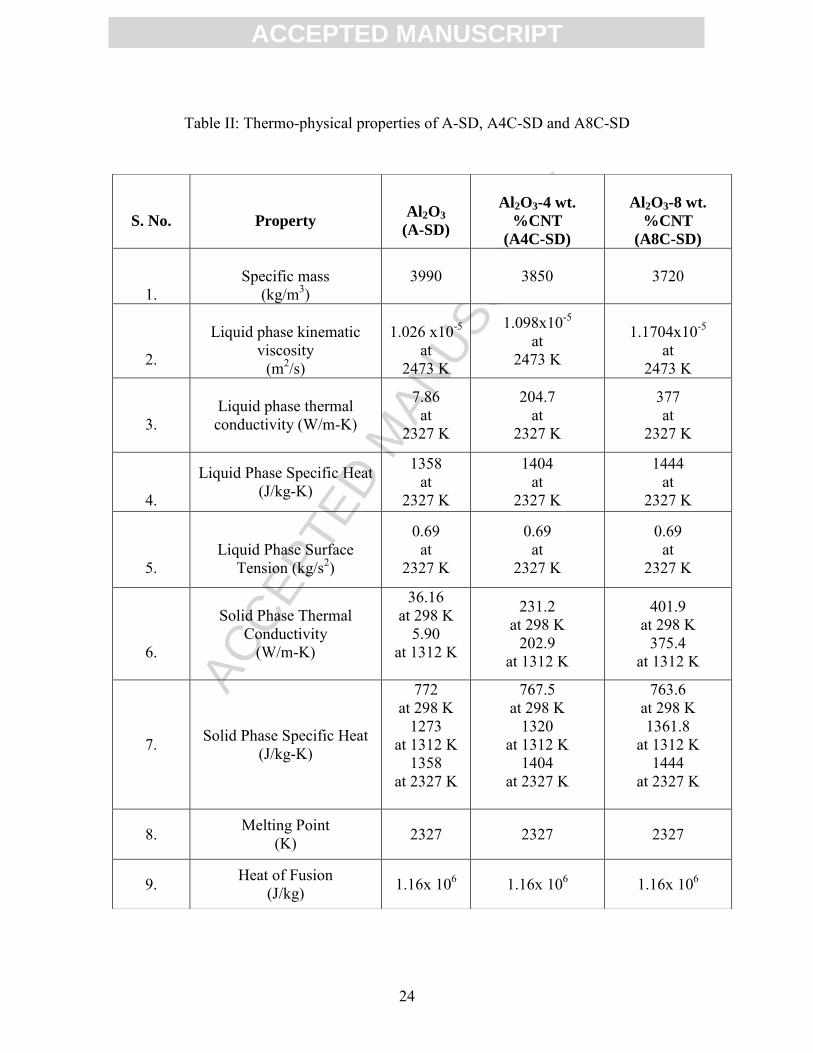
treated as a single phase flow problem. Table II shows the calculated ROM values of the
thermophyical properties for A-SD, A4C-SD, and A8C-SD. The accuracy of the
computed ROM values has been addressed by comparing the simulated results with the
experimental results in section 3.3. Table III lists droplet size, droplet surface
temperature, droplet velocity, substrate temperature and substrate roughness, which were

ACC
EPTE
D M
ANU
SCR
IPT
ACCEPTED MANUSCRIPT
10
considered as input parameters for A-SD, A4C-SD and A8C-SD splat simulation. The
average powder size for each composition was assumed to be the droplet impinging
diameter. The powder size distribution for all compositions ranged between 24-30 μm in
diameter (A-SD: 30±10 μm, A4C-SD: 26±7 μm, A8C-SD: 24±5 μm). Surface
temperature and velocity of the particles were obtained experimentally using an in-flight
particle diagnostic sensor, as explained in previous section 2.2. As a consequence of the
splat simulation, two output files were obtained: (i) substrate temperature vs. time (i.e.
solidification curve) and (ii) the volume fraction of the solid vs. time.
3. Results and Discussion
3.1 Powder Morphology
Figures 4 (a), (b), and (c) show high magnification SEM micrographs of A-SD,
A4C-SD and A8C-SD agglomerates, respectively. The inset shows lower magnification
images of spherical agglomerates of each composition. The spray dried agglomerates
have improved flowability into the powder hoses and injector, due to their spherical
shape and reduced interparticle friction. From Figure 4(b) and (c), it can be seen that the
CNTs were dispersed uniformly on the surface of agglomerate. Uniform dispersion of
CNTs is critical in splats morphology which is discussed later.
3.2 Effect of CNT Content on Splat Formation
Figure 5a-c shows SEM images of A-SD, A4C-SD and A8C-SD splats. Splat
morphology changed from splashed and fragmented to almost disc-shaped with an
increase in CNT content. In addition, relatively higher splat diameter and lower finger

ACC
EPTE
D M
ANU
SCR
IPT
ACCEPTED MANUSCRIPT
11
length was observed with the increasing CNT content. Figure 6a-c shows the splat size
distribution for A-SD, A4C-SD and A8C-SD splats. The average splat diameters are
plotted in Figure 7a. Diameter of the fingered splat was calculated by measuring the
radius of the splat from the center to the end of the finger. Only those fingered splats
were considered for the measurement which showed lowest variation in the finger length.
Since the frequency of the fingered splats with lowest deviation in finger length was
much higher, it is safe to consider only these splats for the diameter measurement. Figure
7a shows the variation in the splat diameter as a function of CNT content. Splat diameter
increases with an increasing CNT content. Similarly, Figure 7b shows that with the
increasing CNT content, the average length of the fingers radiating from the periphery of
the splat reduced. Splats obtained from these experiments can be categorized into four
different types based on their geometry and are shown in Figure 8a. These splat
categories are shown schematically in Figure 8b: (1) disc shape, (2) splats with finger, (3)
fragmented splats, and (4) splats with voids. Perfect disk shape splat is formed due to
longer time of the melt. The fragmented or splashed splat might be the result of localized
solidification of melt. The solidified layer could obstruct the outward spreading liquid
which leads to the fingers radiating out from the periphery of the splat. Splat with voids
might be formed due to the entrapped gas.
Experimental population density of these splat geometries was measured using
image analysis from several images and has been plotted as a function of CNT content.
Figure 9 show the population density for four splat geometries in A-SD, A4C-SD and
A8C-SD samples. The percentage of disc shape splats increased with an increasing CNT

ACC
EPTE
D M
ANU
SCR
IPT
ACCEPTED MANUSCRIPT
12
content. Population density of splats with finger, fragmented splats and splats with voids
is the lowest for the highest (8 wt. %) CNT content.
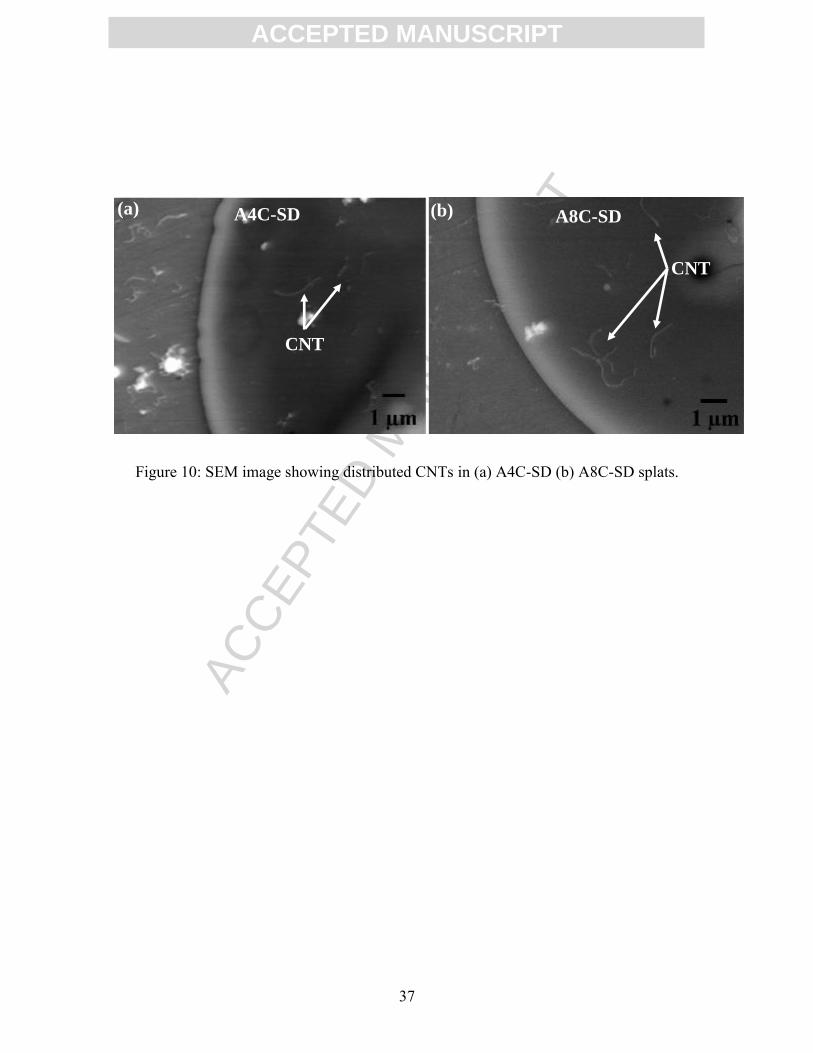
To understand the underlying mechanism, splats were observed in SEM at a
higher magnification. Figures 10a-b show the single splat of A4C-SD and A8C-SD,
respectively with CNTs distributed in the splat matrix. In addition, agglomeration of
CNTs at the periphery of A4C-SD (Figure 11a) and A8C-SD (Figure 11b) splats is also
observed. Since, splat diameter of A8C-SD was relatively larger, complete splat is shown
as an inset in Figure 11b.
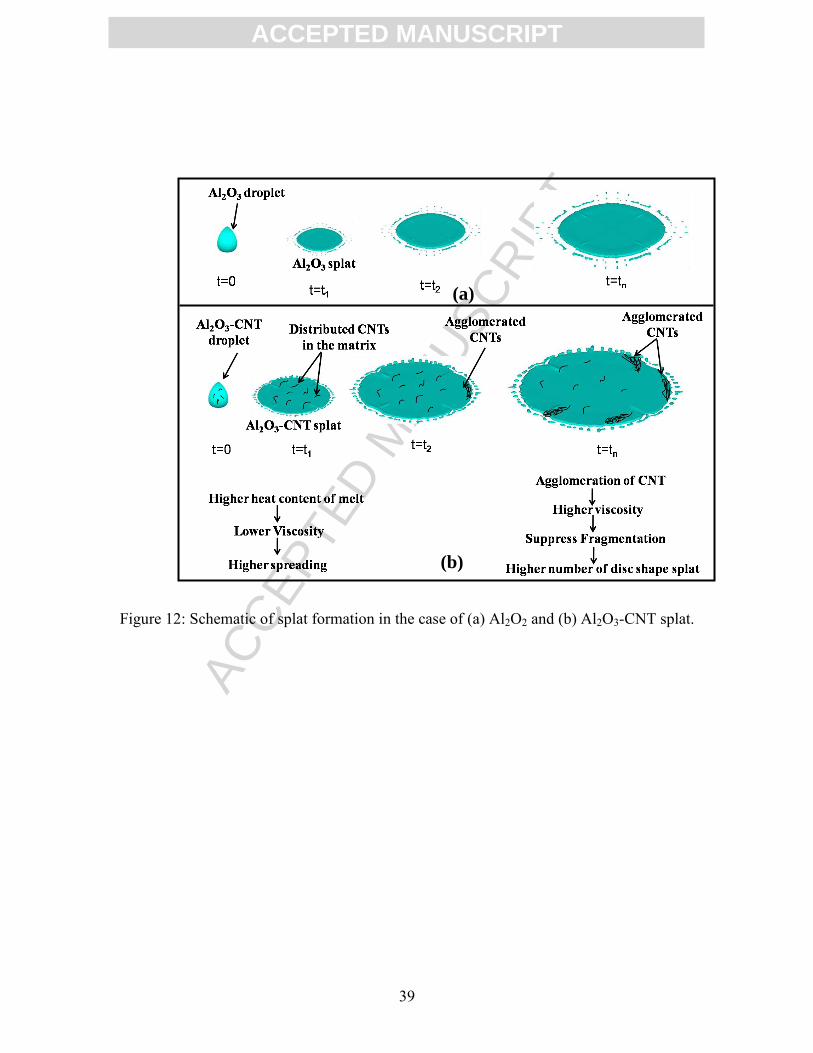
Such a varying degree of CNT dispersion in the splat is responsible for the
increased splat diameter and increased percentage of disc shaped splat. “Distributed
CNTs” in the melt (Figure 10) leads to enhanced thermal capacity resulting in the lower
viscosity. Specific heat capacity of Al2O3 is 1358 Jkg-1K-1 while the specific heat capacity
for CNT is 2145 Jkg-1K-1 at 2327 K [32]. Hence, specific heat capacity calculated using
ROM (as shown in Table-II) for A4C-SD is 1404 Jkg-1K-1 while its 1444 Jkg-1K-1 for
A8C-SD respectively at 2327 K. Specific heat capacity for A4C-SD and A8C-SD are
3.38 % and 6.33 % respectively higher than A-SD at 2327 K. The higher thermal capacity
of the melt would increase the time required for the heat loss to occur for identical
thermal resistance at the substrate/splat interface. Hence, localized solidification of the
melt will be delayed, which results in enhanced spreading and larger splat diameter in
CNT reinforced splats (figure 7). “Agglomeration of CNTs” (Figure 11) at the periphery
of the melt will produce a counter effect resulting in an increased viscosity. Increased

ACC
EPTE
D M
ANU
SCR
IPT
ACCEPTED MANUSCRIPT
13
viscosity of the melt will suppress fragmentation and hence, higher percentage of disc
shaped splat was observed in case of CNT reinforced splats. Both of the above
phenomena are schematically elucidated in Figure 12, which shows the droplet of Al2O3
(Figure 12a) and Al2O3-CNT (Figure 12b) at t=0 sec i.e. just before the impact on the
steel substrate. At t=t1, higher spreading of Al2O3-CNT will take place due to higher
thermal capacity of the melt as a result of CNT addition. Higher thermal capacity of the
melt leads to lower viscosity which contributes towards higher spreading of CNT
containing splats. At t > t1, localized solidification occurs in Al2O3 splats, that restricts
their size and causes finger formation. In case of Al2O3-CNT splats, CNTs flow easily
towards the periphery of the splat due to their lower specific mass (2.1 g/cc) as compared
to Al2O3 (3.9 g/cc) and start agglomerating at the edges (as seen in Figure 11).
Agglomeration of CNTs at the edges will contribute towards increased viscosity and
suppresses the splat fragmentation resulting in higher population of the disc shape splats.
Thus, it is clear that CNTs play an important role in modifying the splat shape and
size which ultimately affect the final properties of the coating. The experimental
optimization of the splat geometry by varying in-flight temperature and velocity, CNT
content and substrate conditions requires lots of intensive effort and time. Computer
simulation of the splat geometry can provide valuable information about the processing
conditions. Simulation of Al2O3-CNT single splat is discussed in the following section.

ACC
EPTE
D M
ANU
SCR
IPT
ACCEPTED MANUSCRIPT
14
3.3. Simulated Splat Morphology
Figures 13a, c, and e depict the simulated views of A-SD, A4C-SD and A8C-SD
splats. All distances in the simulated view are in millimeter. The simulation was
performed at cells per radius (CPR) value of 15. The CPR is an indicator of the resolution
and can be calculated for each calculation domain from the following equation [35].
A higher CPR number is an indicator of a higher resolution. It is recommended that CPR
to be at least 10 and the optimum number of CPR is 15 [35]. Increasing the CPR number
greater than 15 requires lots of extra computational time and resources [35]. Figures 13b,
d, f are SEM images of the experimentally obtained splats of A-SD, A4C-SD and A8C-
SD at the same parameters as simulation. Relatively higher splashing with broken fingers
was observed in the simulated view of A-SD (Figure 13a) which is also seen in the
experimental A-SD splat (Figure 13b). Lowest splashing of the droplet was observed in
both simulated and experimental results of A8C-SD splat (Figures 13c and f). Hence,
splats geometries obtained from the experiment and simulation showed good qualitative
agreement.
It was observed experimentally that splat diameter increases with an increasing
CNT content. In order to compare the experimental results with the simulated results,
spreading ratio (D/D0) for experimental and simulated splats were plotted. D is the final
diameter of splat and D0 is the initial diameter of the droplet considered here as the
average diameter of the size distribution. Figure 14 shows the spreading ratio as a
Calculation domain
Radius of the impinging droplet No of grids × CPR =

ACC
EPTE
D M
ANU
SCR
IPT
ACCEPTED MANUSCRIPT
15
function of CNT content for experimental and simulated splats. Both, experimental and
simulation results show the similar increasing trend in spreading ratio (D/D0) with an
increasing CNT content. However, experimentally obtained spreading ratio is lower than
computed which is attributed to the powder feedstock characteristics. Spray dried
powder, which contains ~30-40% of voids [20, 24, 26] was used for synthesizing the
splats. Due to the presence of those voids in powder, molten droplet size is expected to be
smaller resulting in smaller splat diameter and lower spreading ratio. During simulation,
molten droplet size was assumed to be of as initial powder size which leads to larger
diameter of splats as compared to experimentally obtained splats. An accurate method to
obtain droplet size could be to collect the plasma sprayed powder in a liquid and then
analyze the particle size distribution. Mean diameter obtained by this size distribution can
be put as a more accurate input parameter (initial droplet diameter) into the simulation.
The simulation also provides the volume percentage of solid in A-SD, A4C-SD,
and A8C-SD splats at different time intervals, as shown in Figure 15. 0.24 µs of the after
impact, the volume percentage of solid in A-SD splat is 26% while it is 14% and 8% in
A4C-SD and A8C-SD, respectively. This indicates a delayed solidification process in
CNT reinforced splat which is attributed to enhanced thermal capacity of the melt as a
result of higher specific heat of graphite [32]. 0.75 µs of the after impact, the volume
percentage of solid in A-SD splat is 66%, while it is 58% and 53% in A4C-SD and A8C-
SD splat, respectively which becomes constant. Between 1.5 and 5 µs after impact, small
increment in volume fraction of solid was observed for all splats (ΔV=+ 2% for A-SD
splat, ΔV=+ 1.2% for A4C-SD splat and ΔV=+ 0.91% for A8C-SD splat). These results

ACC
EPTE
D M
ANU
SCR
IPT
ACCEPTED MANUSCRIPT
16
indicate that complete solidification may be occurring over a greater time interval, which
could be order of magnitude greater. This is in accordance with the solidification of the
real molten droplets in plasma spraying. Typically, molten ceramic droplet solidify at a
cooling rate of ~106 K/s during plasma spraying [36-38], which indicates that droplet
solidification time is ~ 0.5 milliseconds for the in-flight particle temperature of 2750 K.
Since, cooling does not follow a linear relationship (according to Newton’s law of
cooling) in between 1-5 µs, the solidification time is much lower (in microseconds) in the
present study.
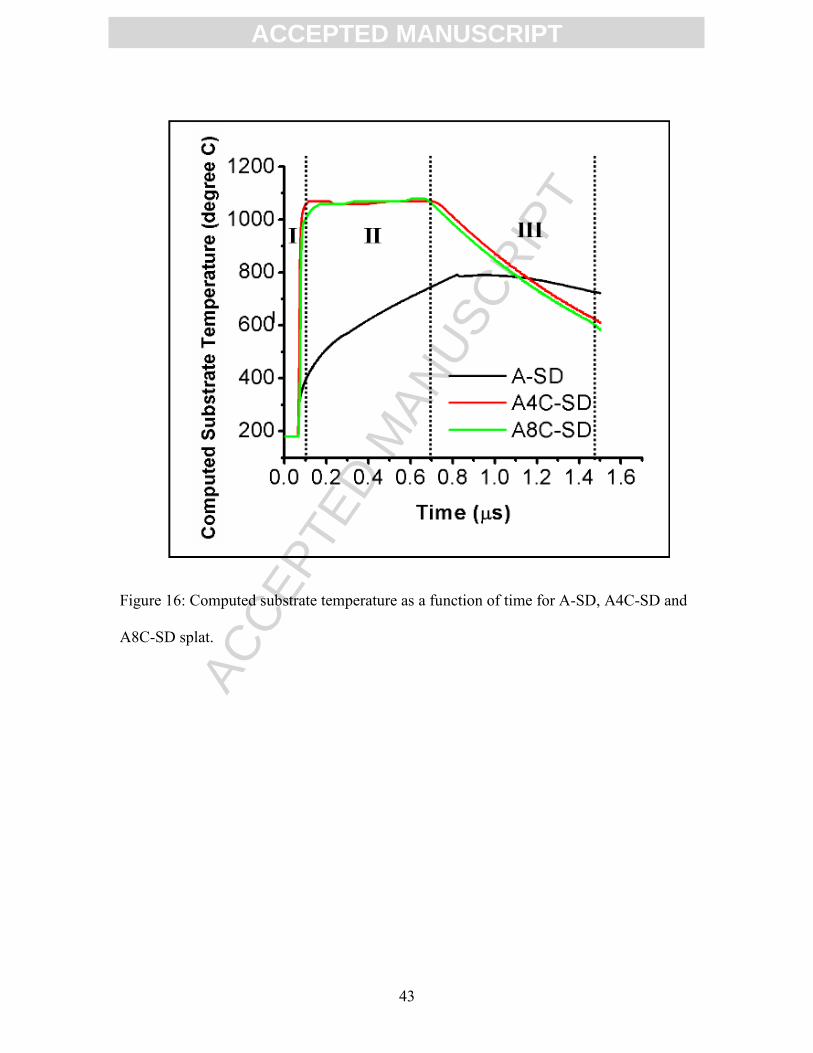
Solidification behavior of the splat can also be understood from the change in the
substrate temperature obtained from simulation. Figure 16 shows the computed substrate
temperature variation vs. time for A-SD, A4C-SD and A8C-SD splats. Three different
zones can be observed in Figure 16. Region I shows a significant increase in the substrate
temperature at 0.1 µs for A-SD, A4C-SD and A8C-SD splats. This is attributed to the
heat transfer from the molten droplet to the substrate immediately after its initial impact.
Higher increase (ΔT= + 650°C) in the substrate temperature was seen for CNT reinforced
splats which is attributed to higher thermal capacity of CNT containing molten Al2O3
melt resulting in higher heat transfer to the substrate.
In region II, substrate temperature increases for A-SD splats whereas substrate
temperature remains constant for A4C-SD and A8C-SD splats. Increasing substrate
temperature in case of A-SD splat is due to higher rate of solidification (as shown in
Figure 15) resulting in higher amount of heat energy release. Released latent heat of

ACC
EPTE
D M
ANU
SCR
IPT
ACCEPTED MANUSCRIPT
17
solidification will be absorbed by the substrate and substrate temperature will increase.
CNT reinforced melt has higher thermal capacity and remains molten for a long time.
The substrate temperature in CNT containing melts has reached maximum in Region II.
The further change in the temperature of CNT containing melt will occur only if it loses
heat due to solidification. Since solidification rate is lower in CNT containing melt
(Figure 15), hence no appreciable change in the substrate temperature was observed in
region II for A4C-SD and A8C-SD splats.
In region III, substrate temperature decreased for all splats (A-SD, A4C-SD and
A8C-SD). However, higher rate of change (dT/dt) of temperature was observed for A4C-
SD and A8C-SD splats compared to A-SD. This is attributed to lower solidification rate
in CNT reinforced melt (volume of solid: 58% and 53% in A4C-SD and A8C-SD splat
respectively at 0.75 µs) compared to A-SD (volume of solid: 66% in A-SD splat at 0.75
µs), as seen in Fig. 15. Lower solidification rate will lead to lower latent heat release and
hence less heat is available for the substrate to absorb. While, higher solidification rate in
A-SD splat leads to higher latent heat release, which will be absorbed by the substrate.
Due to the additional higher heat absorbed by the substrate (i.e. substrate will loose heat
slowly with time); lower rate of change of temperature (dT/dt) was observed in A-SD
splat. In the case of CNT reinforced melt, since, there is less heat available for the
substrate to absorb (i.e. substrate will loose heat slowly with time), higher rate of change
of temperature was observed in case of CNT reinforced melt.

ACC
EPTE
D M
ANU
SCR
IPT
ACCEPTED MANUSCRIPT
18
Though, computed substrate temperature decreases in the 0.75-1.5 µs range (in
region III), whereas, volume percentage of solid remains almost constant as shown in
Figure 15. This can be understood from Figure 17 which shows a liquid droplet
impacting on the substrate and spreading into a thin splat at two different interval of time.
Once the droplet impacts on the substrate, molten liquid which is in contact with the
substrate, starts solidifying. A solid layer of thickness “s” exists between the top and
bottom surface of the splat as shown in Figure 14. As the time progresses from t1 to t2, the
thickness of the solid layer, which has already solidified and in contact with the substrate,
increases to “s+s1”. With the growth of solidified layer, a temperature gradient exists
between the top and bottom surface of the splat. Temperature at the bottom surface of the
splat keeps on decreasing with the increase in the fraction of solid, and hence reduction in
the substrate temperature is observed in region III. However, the percentage volume of
solid is constant in region III in Figure 15 which is attributed to the lost material due to
flattening splashing. These lost solidified particles do not contribute in the computations
of volume percentage of solid. Salimijazi et al. [39] studied the solidification behavior
and splat morphology of vacuum plasma sprayed Ti alloy by computational modeling
using SIMDROP software and by the experimental results and mentioned that
approximately 30% of the droplet material is lost due to flattening splashing. The
splashing mechanism of the droplet at the time of impact and during its flattening has
been well explained by Cedelle et al. [40].
It is concluded that CNTs play an important role in tailoring the morphology of
splat, which ultimately affect the coating’s final properties. CNT reinforcement resulted

ACC
EPTE
D M
ANU
SCR
IPT
ACCEPTED MANUSCRIPT
19
in relatively lower splashing and increased population density of disc shape, which will
contribute towards obtaining the denser coating due to effective packing. Further, splat
simulation is an effective tool for simulating the plasma sprayed single splat morphology.
This can contribute significantly towards optimization of splat morphology and can
reduce the large number of experiments which involves lots of time and money.
Conclusions
Plasma sprayed CNT reinforced (0, 4 and 8 wt. %) Al2O3 single splats were
obtained on the polished steel substrate at the preheat temperature of 453 K. Results
strongly indicates that CNTs play a critical role in the splat morphology. Splat diameter
increased from 28.6±1.4 µm to 43.2±1.3 µm with the reinforcement of 8 wt. % of CNT.
Increased splat diameter was due to enhanced temperature of the melt as a result of
higher specific heat of Al2O3-8 wt. % CNT (1444 Jkg-1K-1) compared to Al2O3 (1358 Jkg-
1K-1). “Agglomeration of CNTs” at the periphery of the melt produced a counter effect
resulting in an increased viscosity. Increased viscosity of the melt suppresses
fragmentation and hence, higher percentage of disc shaped splat was observed in case of
CNT reinforced splats. Simulation of single splat showed good match in splat
morphology with the experimentally obtained splat. Volume percentage of the solid and
substrate temperature during splat formation elucidates the solidification behavior of
CNT reinforced splats.
ACC
EPTE
D M
ANU
SCR
IPT
ACCEPTED MANUSCRIPT
20
Acknowledgements
Authors acknowledge the financial support received from Office of Naval
Research (N00014-08-1-0494). AKK also acknowledge the support from the Dissertation
Year Fellowship awarded by University Graduate School at FIU. The support from
Advanced Materials Engineering Research Institute (AMERI), FIU for facilitating the
characterization facilities is greatly appreciated.
References
[1] P. Fauchais, A. Vardelle, B. Dussoubs, J. Therm. Spray Technol. 10 (2001) 44-66 [2] X. Jiang, J. Matejicek, S. Sampath, Mater. Sci. Eng. A 272 (1999) 189-198 [3] S. Sampath, X. Y. Jiang, J. Matejicek, A. C. Leger, A. Vardelle, Mater. Sci. Eng.
A 272 (1999) 181-188 [4] S. Sampath, X. Jiang, Mater. Sci. Eng. A 304-306 (2001) 144–150 [5] E. E. Balic, M. Hadad, P. P. Bandyopadhyay, J. Michler, Acta Mater. 57 (2009)
5921–5926. [6] T. Chraska, A. H. King, Surf. Coat. Technol. 157 (2002) 238–246 [7] R. Dhiman, A. G. McDonald, S. Chandra, Surf. Coat. Technol. 201 (2007) 7789–
7801 [8] A. Elsebaei, J. Heberlein, M. Elshaer, A. Farouk, J. Therm. Spray Technol. 19
(2009) 1-10. [9] S. Fantassi, M. Vardeue, A. Vardelle, P. Fauchais, J. Therm. Spray Technol. 2
(1993) 379-384. [10] K. Shinoda, T. Koseki, T. Yoshida, J. Appl. Phys. 100 (2006) 074903 [11] S. Amada, K. Imagawa, S. Aoki, Surf. Coat. Technol. 154 (2002) 27-33 [12] R. S. Lima, B. R. Marple, J. Therm. Spray Technol. 16 (2007) 40-63

ACC
EPTE
D M
ANU
SCR
IPT
ACCEPTED MANUSCRIPT
21
[13] L. Bianchi, A. C. Leger, M. Vardelle, A. Vardelle, P. Fauchais, Thin Sol. Films 305 (1997) 35-47
[14] M. Fukumoto, Y. Huang, M. Ohwatari, C. Coddet, Thermal Spray, Meeting the
Challenge of the 21st century, ASM International, Metals Park, OH 401 (1998) [15] M. Fukumoto, S. Katoh, I. Okane, in: A. Ohmori (Ed.), Proceeding of the
Integrated Thermal Spray Conference, Kobe Japan, (1995) 353–358 [16] C.J. Li, J.L. Li, W.B. Wang. In: C. Coddet, Editor, Thermal Spray, Meeting
the Challenges of the 21st Century,, ASM International, Metals Park, OH (1998), p. 473.
[17] K. Balani, A. Agarwal, Surf. Coat. Technol. 202 (2008) 4270-4277 [18] K. Balani, A. Agarwal, Nanotechnology 19 (2008) 165701 [19] K. Balani, A. Agarwal, J. Appl. Phys. 104 (2008) 063517 [20] K. Balani, S. R. Bakshi, Y. Chen, T. Laha, A. Agarwal, J. Nanosci. Nanotechnol.
7 (2007) 1-10 [21] K. Balani, S. P. Harimkar, A. Keshri, Y. Chen, N. B. Dahotre, A. Agarwal, Acta
Mater. 56 (2008) 5984-5994 [22] K. Balani, T. Zhang, A. Karakoti, W. Z. Li, S. Seal, A. Agarwal, Acta Mater. 56
(2008) 571-579 [23] Y. Chen, K. Balani, A. Agarwal, Appl. Phys. Lett. 92 (2008) 011916 [24] A. K. Keshri, J. Huang, V. Singh, W. Choi, S. Seal, A. Agarwal, Carbon 48
(2010) 431-442 [25] A. K. Keshri, J. Huang, W. Choi, A. Agarwal, Surf. Coat. Technol. 204 (2010)
1847-1855 [26] A. K. Keshri, R. Patel, A. Agarwal, Surf. Coat. Technol. 205 (2010) 690-702 [27] S. R. Bakshi, V. Singh, S. Seal, A. Agarwal, Surf. Coat. Technol. 203 (2009)
1544-1554 [28] M. Pasandideh-Fard, S. Chandra, J. Mostaghimi, 1st International Thermal Spray
Conference, Montreal, Quebec pp. 125. 2000. [29] M. Pasandideh-Fard, S. Chandra, J. Mostaghimi, Int. J. of Heat Mass Transfer, 45
(2002) 2229-2242.

ACC
EPTE
D M
ANU
SCR
IPT
ACCEPTED MANUSCRIPT
22
[30] M. Pasandideh-Fard, V. Pershin, S. Chandra, J. Mostaghimi, J. Therm. Spray
Technol., 11 (2002) 206-217. [31] J. Mostaghimi, M. Pasandideh-Fard, S. Chandra, Plasma Chemistry and Plasma
Processing, 22 (2002) 59-84.
[32] FACTSAGE Thermodynamic Equilibrium Software, version 5.0, GmbH, Aachen, Germany, 2001
[33] E. Dorre, H. Hubner, Alumina-processing, properties and applications. Berlin:
Springer-Verlag; 1984: 1-267. [34] Y. S. Touloukian, E. H. Buyco, Specific heat-nonmetallic solids. Thermophysical
properties of matter. New York: IFI/Plenum; 1970: 5 [35] Simulent Drop 2.2, Droplet impact and solidification software, Totonto, Canada
(http://www.simulent.com) [36] P. Fauchais, M. Fukumoto, M. Vardelle, J. Therm. Spray Technol. 13 (2004) 13
337-360 [37] H. B. Parizi, L. Rosenzweig, J. Mostaghimi, S. Chandra, T. Coyle, H. Salimi, L.
Pershin, A. McDonald, C. Moreau, J. Therm. Spray Technol. 16 (2007) 713-721 [38] J. Suffner, H. Hahn, S. Dosta, I. G. Cano, J. M. Guilemany, Surf. Coat. Technolo.
204 (2009) 149-155. [39] H. R. Salimijazi, M. Raessi, J. Mostaghimi, T. W. Coyle, Surf. Coat. Technolo.
201 (2007) 7924-7931. [40] J. Cedelle, M. Vardelle, B. Pateyron, P. Fauchais, Thermal spray 2004: Advances
in technology and application: Proceedings of the international thermal spray conference (2004) 1008-1013

ACC
EPTE
D M
ANU
SCR
IPT
ACCEPTED MANUSCRIPT
23
List of Tables
Table I: Plasma spray operating parameters for splat formation
Plasma process parameters for synthesizing single splat
Current
(A) Voltage
(V)
Primary
Gas, Argon
(slm)
Secondary
Gas, Helium
(slm)
Stand-off
(mm) from the
substrate
Powder feed
rate
(g/min)
Substrate
preheat
temperature
(K)
850 40 56.6 59.5 75 3 453
ACC
EPTE
D M
ANU
SCR
IPT
ACCEPTED MANUSCRIPT
24
Table II: Thermo-physical properties of A-SD, A4C-SD and A8C-SD
S. No.
Property
Al2O3
(A-SD)
Al2O3-4 wt.
%CNT
(A4C-SD)
Al2O3-8 wt.
%CNT
(A8C-SD)
1.
Specific mass
(kg/m3) 3990 3850 3720
2.
Liquid phase kinematic
viscosity (m2/s)
1.026 x10⁻⁵
at 2473 K
1.098x10⁻⁵ at
2473 K
1.1704x10⁻⁵
at 2473 K
3.
Liquid phase thermal conductivity (W/m-K)
7.86
at 2327 K
204.7 at
2327 K
377 at
2327 K
4.
Liquid Phase Specific Heat (J/kg-K)
1358 at
2327 K
1404 at
2327 K
1444 at
2327 K
5.
Liquid Phase Surface
Tension (kg/s2)
0.69 at
2327 K
0.69 at
2327 K
0.69 at
2327 K
6.
Solid Phase Thermal Conductivity
(W/m-K)
36.16 at 298 K
5.90 at 1312 K
231.2 at 298 K
202.9 at 1312 K
401.9 at 298 K
375.4 at 1312 K
7. Solid Phase Specific Heat (J/kg-K)
772 at 298 K
1273 at 1312 K
1358 at 2327 K
767.5 at 298 K
1320 at 1312 K
1404 at 2327 K
763.6 at 298 K 1361.8
at 1312 K 1444
at 2327 K
8. Melting Point (K) 2327 2327 2327
9. Heat of Fusion (J/kg) 1.16x 10⁶ 1.16x 10⁶ 1.16x 10⁶

ACC
EPTE
D M
ANU
SCR
IPT
ACCEPTED MANUSCRIPT
25
Table III: List of molten droplet and substrate parameters used for simulation of A-SD, A4C-SD and A8C-SD splats
A-SD A4C-SD A8C-SD
Initial particle diameter (µm) 30 26 24 Particle surface temperature (K) 2745 2423 2397 Particle velocity (m/s) 338 319 314 Initial substrate temperature (K) 453 453 453 Substrate surface roughness( µm) 0.03 0.03 0.03

ACC
EPTE
D M
ANU
SCR
IPT
ACCEPTED MANUSCRIPT
26
List of Figure Captions:
Figure 1: Particle size distribution of (a) Al2O3 (A-SD) spherical agglomerates (b) Al2O3-4 wt. % CNT (A4C-SD) spherical agglomerates (c) Al2O3-8 wt. % CNT (A8C-SD) spherical agglomerates.
Figure 2: (a) Plasma spray set-up for collecting single splats (b) Shield plate in front of the plasma gun having a series of holes of 2 mm diameter (c) Heat gun used to preheat the steel substrate (22 mm×19 mm×3.2 mm) which is positioned on the back of the shield plate.
Figure 3: (a) Digital picture of the steel substrate showing through thickness hole (Ø=1
mm) for inserting thermocouple (b) schematic of steel substrate showing dimensions of all faces and hole.
Figure 4: High magnification SEM images of spray dried (a) Al2O3 (A-SD) powder
particle (b) Al2O3-4 wt.% CNT (A4C-SD) particle showing homogeneous dispersion of CNTs on the surface (c) Al2O3-8 wt.% CNT (A8C-SD) particle showing homogeneous dispersion of CNTs on surface. Inset shows low magnification image of spray dried agglomerate of each composition.
Figure 5: SEM images of plasma sprayed single splat on polished steel substrate for (a) A-SD (b) A4C-SD (c) A8C-SD. Substrate was preheated to 453 K.
Figure 6: Splat size distribution of (a) A-SD (b) A4C-SD (c) A8C-SD. Total of ~100 splats were considered from 5-6 different SEM images to plot the splat size distribution.
Figure 7: (a) Variation in average splat diameter with function of CNT content. (b)
Variation in finger length with function of CNT content. Figure 8: (a) Experimentally collected splats showing different morphology (b)
Schematic showing different morphology of splats Figure 9: Population density of different type of splats as function of CNT content.
Figure 10: SEM image showing distributed CNTs in (a) A4C-SD (b) A8C-SD splats. Figure 11: SEM image showing distributed CNTs in the matrix and agglomerated
CNTsat the periphery of (a) A4C-SD (b) A8C-SD splats.
Figure 12: Schematic of splat formation in the case of Al2O2 and Al2O3-CNT splat.

ACC
EPTE
D M
ANU
SCR
IPT
ACCEPTED MANUSCRIPT
27
Figure 13: (a) Simulated top view of A-SD splat (b) SEM image of experimentally obtained A-SD splat (c) Simulated top view of A4C-SD splat (d) SEM image of experimentally obtained A4C-SD splat (e) Simulated top view of A8C-SD splat (f) SEM image of experimentally obtained A8C-SD splat.
Figure 14: Spreading ratio with varying CNT content for experimental and simulated splats.
Figure 15: Volume percentage of solid as a function of time for A-SD, A4C-SD and
A8C-SD splats.
Figure 16: Substrate temperature as a function of time for A-SD, A4C-SD and A8C-SD splat.
Figure 17: Schematic of the liquid droplet landing on the substrate and spreading into a thin splat at two different interval of time.

ACC
EPTE
D M
ANU
SCR
IPT
ACCEPTED MANUSCRIPT
28
Figures
Figure 1: Particle size distribution of (a) Al2O3 (A-SD) spherical agglomerates (b) Al2O3-
4 wt. % CNT (A4C-SD) spherical agglomerates (c) Al2O3-8 wt. % CNT (A8C-SD)
spherical agglomerates. A total of ~100 particles were considered from 5-6 different
SEMimages. .
(c)
10 15 20 25 30 35 40 4502468
101214 Al2O3- 8wt% CNT (A8C-SD)
Mean : 24.04 mSD : 7.3 m
No
. o
f P
art
icle
s
Particles Size ( m)
(a)
20 25 30 35 40 45 500
5
10
15
20 Al2O3 (A-SD)Mean : 30.18 mSD : 7.72 m
No
. o
f P
art
icle
s
Particles Size ( m)
(b)
20 25 30 35 40 45 500
5
10
15
20Al2O3- 4wt. % CNT (A4C-SD)Mean : 26.48 mSD : 6.92 m
No
. o
f P
art
icle
s
Particle Size ( m)
ACC
EPTE
D M
ANU
SCR
IPT
ACCEPTED MANUSCRIPT
29
Figure 2: (a) Plasma spray set-up for collecting single splats (b) Shield plate in front of
the plasma gun having a series of holes of 2 mm diameter (c) Heat gun used to preheat
the steel substrate (22 mm×19 mm×3.2 mm) which is positioned on the back of the shield
plate.
(a) (b)
(c)
Shield plate
Steel
substrate
Heat gun
Shield
plate
25 mm
25 mm
25 mm

ACC
EPTE
D M
ANU
SCR
IPT
ACCEPTED MANUSCRIPT
30
Figure 3: (a) Steel substrates showing through thickness hole (Ø=1 mm) for inserting
thermocouple and (b) schematic of the steel substrate showing dimensions of all faces
and hole.
22 mm
19 mm
3.2 mm
1.0 mm
(a) (b)

ACC
EPTE
D M
ANU
SCR
IPT
ACCEPTED MANUSCRIPT
31
Figure 4: High magnification SEM images of spray dried (a) Al2O3 (A-SD) powder
particle (b) Al2O3-4 wt.% CNT (A4C-SD) particle showing homogeneous dispersion of
CNTs on the surface (c) Al2O3-8 wt.% CNT (A8C-SD) particle showing homogeneous
dispersion of CNTs on surface. Inset shows low magnification image of spray dried
agglomerate of each composition.
(a)
(b) (c)

ACC
EPTE
D M
ANU
SCR
IPT
ACCEPTED MANUSCRIPT
32
Figure 5: SEM images of plasma sprayed single splat on polished steel substrate for (a)
A-SD (b) A4C-SD (c) A8C-SD. Substrate was preheated to 453 K.

ACC
EPTE
D M
ANU
SCR
IPT
ACCEPTED MANUSCRIPT
33
Figure 6: Splat size distribution of (a) A-SD (b) A4C-SD (c) A8C-SD. Total of ~100
splats were considered from 5-6 different SEM images to plot the splat size distribution.
26 27 28 29 30 31 3202468
101214
No
. o
f S
pla
ts
Splats Diameter ( m)
A-SD SplatsMean Diameter : 28.6 mSD : 1.43 m
(a)
32 33 34 35 36 37 380369
121518
A4C-SD SplatsMean Diameter : 34.7 mSD : 1.48 m
No
. o
f S
pla
ts
Splats Diameter ( m)
(b)
40 41 42 43 44 45 46 4702468
10121416
A8C-SD SplatsMean Diameter : 43.3 mSD : 1.31 m
No
. o
f S
pla
ts
Splats Diameter ( m)
(c)

ACC
EPTE
D M
ANU
SCR
IPT
ACCEPTED MANUSCRIPT
34
Figure 7: (a) Variation in average splat diameter (based upon ~100 splats) with function
of CNT content. (b) Variation in the finger length with function of CNT content. Error
bars corresponds to standard deviations associated to average value.
0 4 807
1421283542
Sp
lat
dia
mete
r (
m)
CNT content (wt.%)0 4 8
05
1015202530
Fin
ger
len
gth
(m
)
CNT content (wt%)
(a) (b)

ACC
EPTE
D M
ANU
SCR
IPT
ACCEPTED MANUSCRIPT
35
Figure 8: (a) Experimentally collected splats showing different morphology (b)
Schematic showing different morphology of splats
Disc splat Fingered splat Fragmented splat
Splats with
voids
Void
(1) (2) (3) (4)
Splat with
voids
(b)
(a)

ACC
EPTE
D M
ANU
SCR
IPT
ACCEPTED MANUSCRIPT
36
Figure 9: Population density (based upon total ~100 splats) of different type of splats as
function of CNT content
0 4 80
12243648607284
Po
pu
lati
on
(%
)
CNT content (wt.%)
Perfect disc splats with finger Fragmented splats having voids
ACC
EPTE
D M
ANU
SCR
IPT
ACCEPTED MANUSCRIPT
37
Figure 10: SEM image showing distributed CNTs in (a) A4C-SD (b) A8C-SD splats.
A4C-SD
CNT
(a) (b) A8C-SD
CNT
(a)

ACC
EPTE
D M
ANU
SCR
IPT
ACCEPTED MANUSCRIPT
38
Figure 11: SEM image showing distributed CNTs in the matrix and agglomerated CNTs
at the periphery of (a) A4C-SD (b) A8C-SD splats.
(a) (b)
Distributed
CNTs
Distributed
CNTs
Agglomeration
of CNTs
Agglomeration
of CNTs
A4C-SD A8C-SD
ACC
EPTE
D M
ANU
SCR
IPT
ACCEPTED MANUSCRIPT
39
Figure 12: Schematic of splat formation in the case of (a) Al2O2 and (b) Al2O3-CNT splat.
(b)
(a)

ACC
EPTE
D M
ANU
SCR
IPT
ACCEPTED MANUSCRIPT
40
Figure 13: (a) Simulated top view of A-SD splat (b) SEM image of experimentally
obtained A-SD splat (c) Simulated top view of A4C-SD splat (d) SEM image of
experimentally obtained A4C-SD splat (e) Simulated top view of A8C-SD splat (f) SEM
image of experimentally obtained A8C-SD splat.
(a) (b)
(c) (d)
(f) (e)
Splashing Broken finger
Finger
Finger Finger
Splashing
Splashing
Broken
Finger
Splashing
Splashing

ACC
EPTE
D M
ANU
SCR
IPT
ACCEPTED MANUSCRIPT
41
Figure 14: Spreading ratio (ratio of final splat diameter to initial droplet diameter) with
varying CNT content for experimental and simulated splats.
0 4 80.51.01.52.02.53.03.54.04.55.0
Experimental results
Simulation resultsS
pre
ad
ing
rati
o (
D/D
0)
CNT Content (wt. %)

ACC
EPTE
D M
ANU
SCR
IPT
ACCEPTED MANUSCRIPT
42
Figure 15: Volume percentage of solid as a function of time for A-SD, A4C-SD and
A8C-SD splats.
0.0 0.2 0.4 0.6 0.8 1.0 1.2 1.4 1.60
10
20
30
40
50
60
70
Vo
lum
e o
f S
olid
(%
)
Time ( s)
HD-A-SD-180C HD-A4C-SD-180C HD-A8C-SD-180C
A-SDA4C-SDA8C-SD
0.0 0.2 0.4 0.6 0.8 1.0 1.2 1.4 1.60
10
20
30
40
50
60
70
Vo
lum
e o
f S
olid
(%
)
Time ( s)
HD-A-SD-180C HD-A4C-SD-180C HD-A8C-SD-180C
A-SDA4C-SDA8C-SD
T= 0.75 µs
ACC
EPTE
D M
ANU
SCR
IPT
ACCEPTED MANUSCRIPT
43
Figure 16: Computed substrate temperature as a function of time for A-SD, A4C-SD and
A8C-SD splat.

ACC
EPTE
D M
ANU
SCR
IPT
ACCEPTED MANUSCRIPT
44
Figure 17: Schematic of the liquid droplet landing on the substrate and spreading into a
thin splat at two different interval of time.

ACC
EPTE
D M
ANU
SCR
IPT
ACCEPTED MANUSCRIPT
45
Research Highlights
The effect of carbon nanotube (CNT) addition on the splat formation in plasma
sprayed aluminum oxide (Al2O3) composite coating using experimental and
computational methods is studied in this article.
The addition of CNTs makes splat morphology more disk-shaped with an increasing
diameter and lower splashing.
The addition of CNTs resulted in two simultaneously competing phenomena viz.
increased heat content and increased viscosity of the melt, which were responsible for
higher splat diameter and increased population density of disc shaped splats
respectively.
Splat morphology was also simulated and showed a good agreement with the
experimentally obtained splats.
Recommended