DIVERSITY OF CHILDBEARING BEHAVIOUR WITHIN POPULATION IN THE
CONTEXT OF BELOW REPLACEMENT FERTILITY IN BRAZIL
Suzana CavenaghiJosé Eustáquio Diniz Alves
ENCE/IBGE
United Nations Expert Group Meeting on Recent and Future Trends in Fertility, Population Division Department of Economic and Social Affairs, United
Nations Secretariat, New York, 2 – 4 December 2009.
2
Overview
Pre-background on Fertility in Brazil
The current panorama of fertility in Brazil
Theoretical approaches
Data and methods
Results
Discussion
3
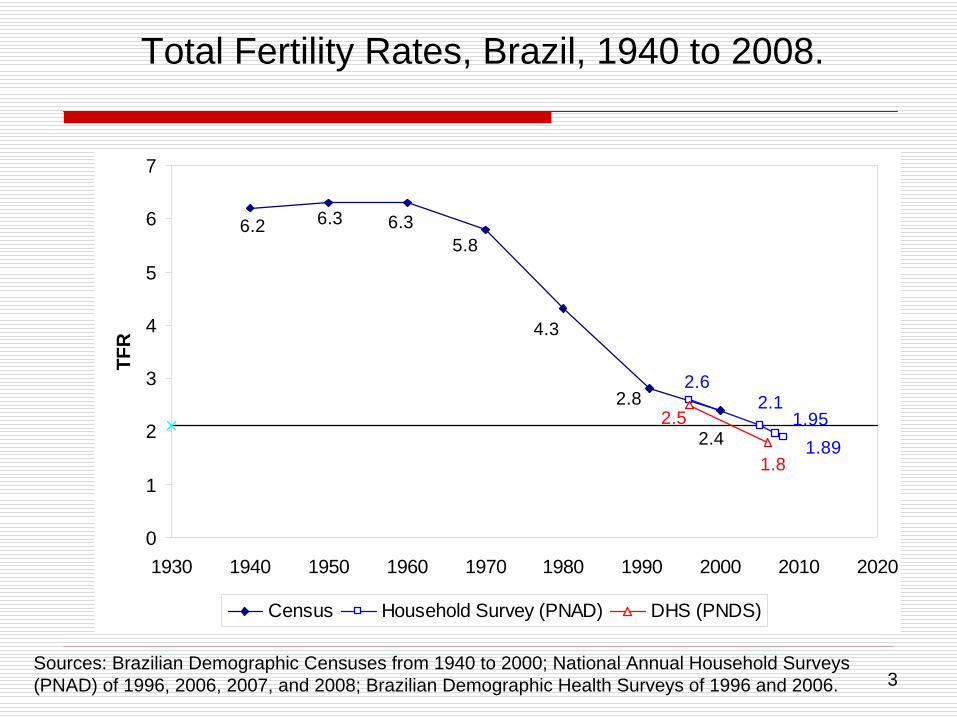
Total Fertility Rates, Brazil, 1940 to 2008.
Sources: Brazilian Demographic Censuses from 1940 to 2000; National Annual Household Surveys (PNAD) of 1996, 2006, 2007, and 2008; Brazilian Demographic Health Surveys of 1996 and 2006.
2.8
2.4
4.3
5.86.36.36.2
1.89
2.12.6
1.95
1.8
2.5
0
1
2
3
4
5
6
7
1930 1940 1950 1960 1970 1980 1990 2000 2010 2020
TFR
Census Household Survey (PNAD) DHS (PNDS)
4
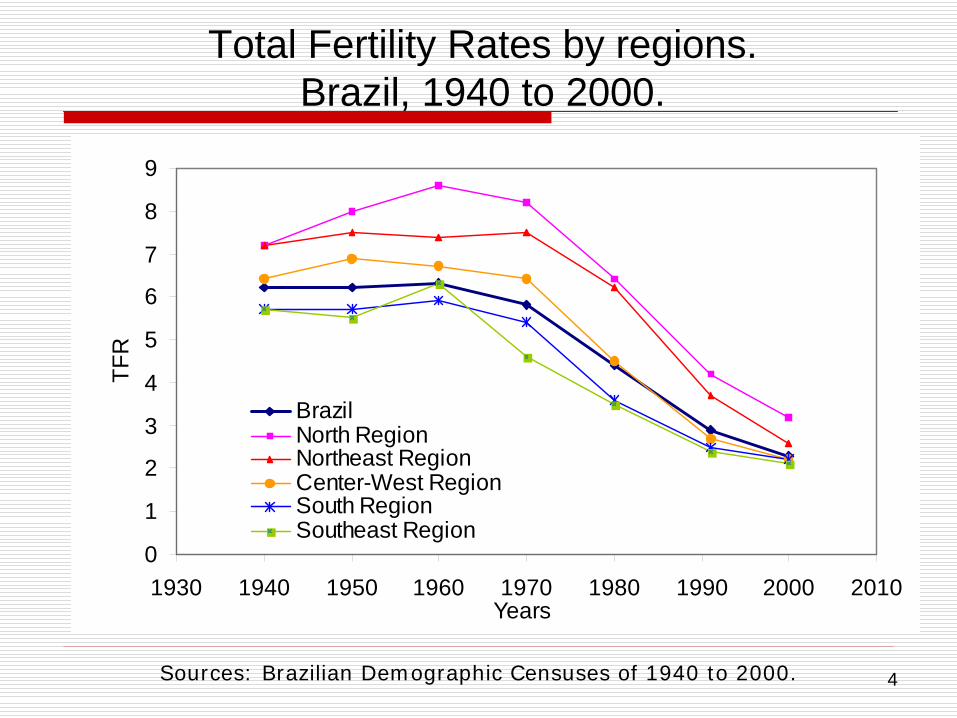
Total Fertility Rates by regions. Brazil, 1940 to 2000.
Sources: Brazilian Demographic Censuses of 1940 to 2000.
0
1
2
3
4
5
6
7
8
9
1930 1940 1950 1960 1970 1980 1990 2000 2010Years
TFR
BrazilNorth RegionNortheast RegionCenter-West RegionSouth RegionSoutheast Region
5
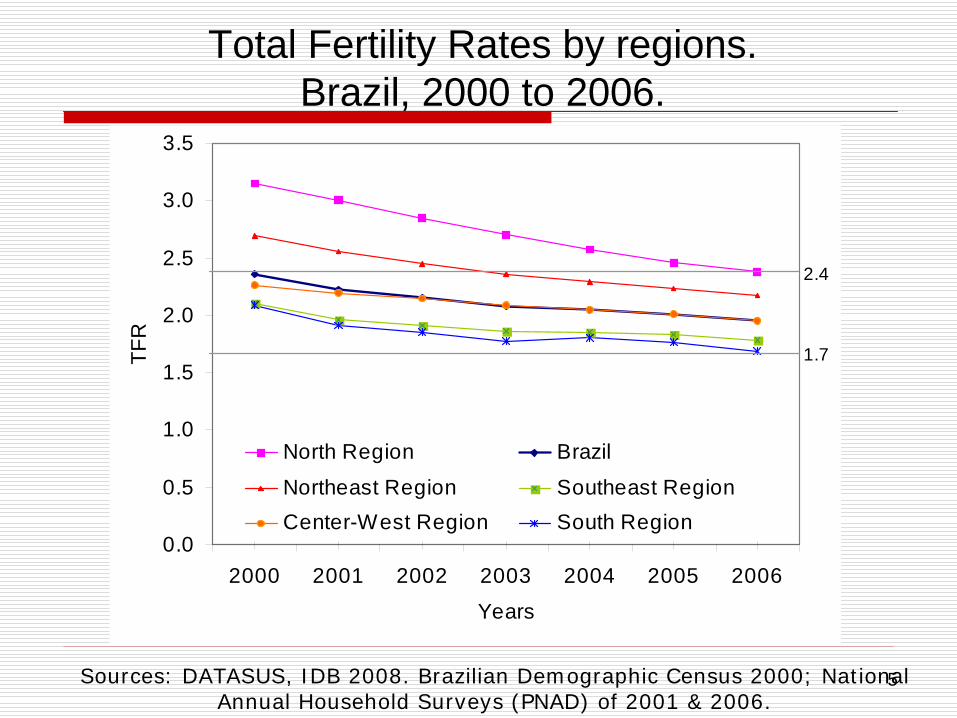
Total Fertility Rates by regions. Brazil, 2000 to 2006.
Sources: DATASUS, IDB 2008. Brazilian Demographic Census 2000; National Annual Household Surveys (PNAD) of 2001 & 2006.
0.0
0.5
1.0
1.5
2.0
2.5
3.0
3.5
2000 2001 2002 2003 2004 2005 2006
Years
TFR
North Region Brazil
Northeast Region Southeast RegionCenter-West Region South Region
2.4
1.7
6
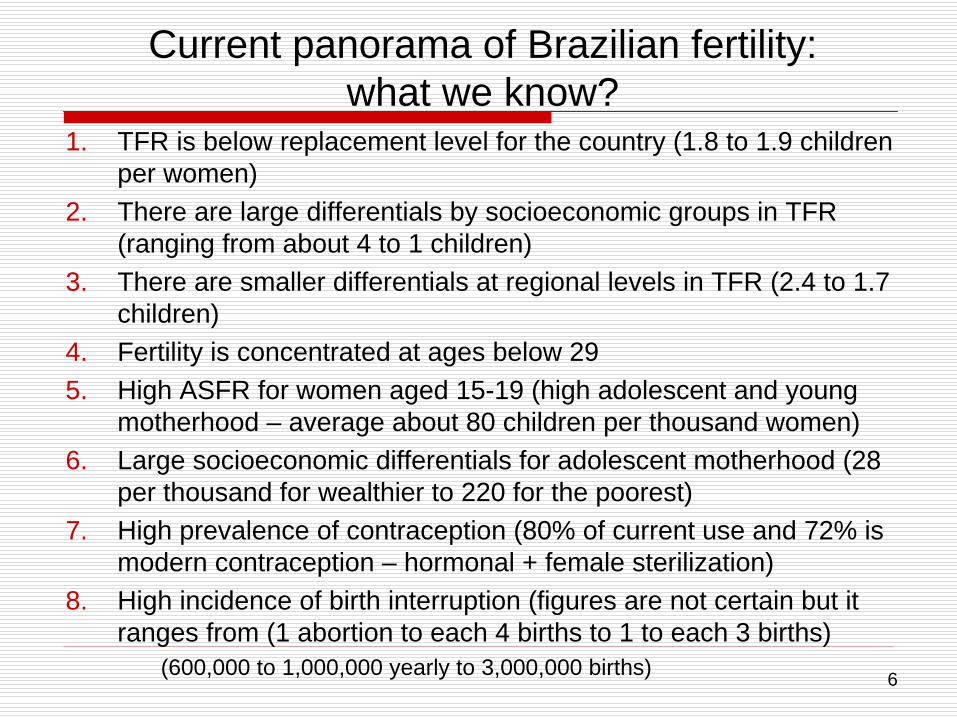
Current panorama of Brazilian fertility: what we know?
1. TFR is below replacement level for the country (1.8 to 1.9 children per women)
2. There are large differentials by socioeconomic groups in TFR (ranging from about 4 to 1 children)
3. There are smaller differentials at regional levels in TFR (2.4 to 1.7 children)
4. Fertility is concentrated at ages below 295. High ASFR for women aged 15-19 (high adolescent and young
motherhood – average about 80 children per thousand women)6. Large socioeconomic differentials for adolescent motherhood (28
per thousand for wealthier to 220 for the poorest)7. High prevalence of contraception (80% of current use and 72% is
modern contraception – hormonal + female sterilization)8. High incidence of birth interruption (figures are not certain but it
ranges from (1 abortion to each 4 births to 1 to each 3 births) (600,000 to 1,000,000 yearly to 3,000,000 births)
7
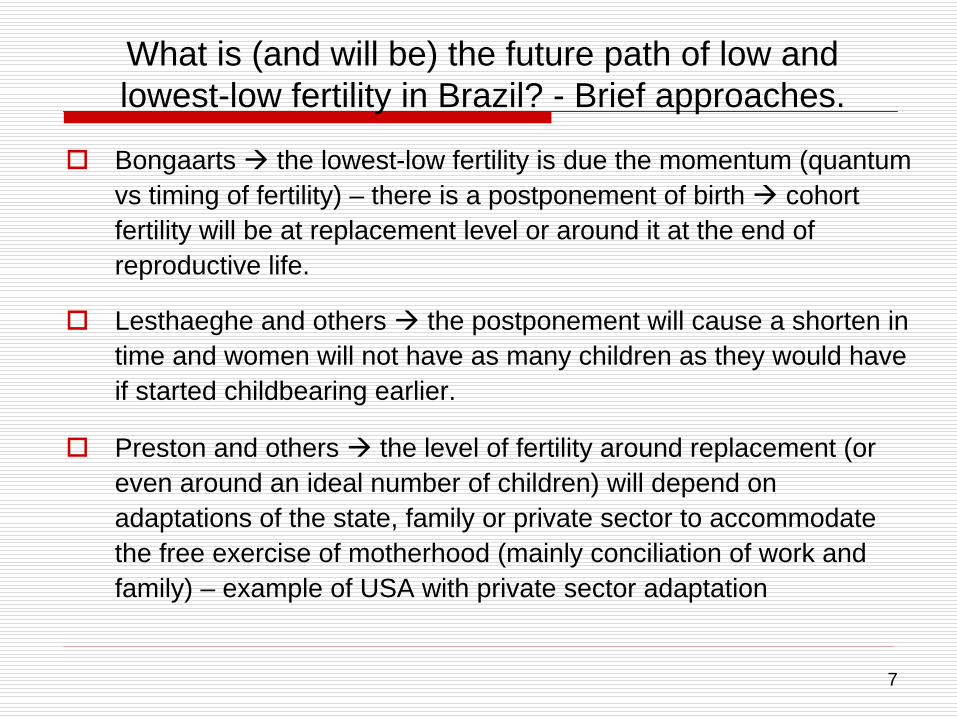
What is (and will be) the future path of low and lowest-low fertility in Brazil? - Brief approaches.
Bongaarts the lowest-low fertility is due the momentum (quantum vs timing of fertility) – there is a postponement of birth cohort fertility will be at replacement level or around it at the end of reproductive life.
Lesthaeghe and others the postponement will cause a shorten in time and women will not have as many children as they would have if started childbearing earlier.
Preston and others the level of fertility around replacement (or even around an ideal number of children) will depend on adaptations of the state, family or private sector to accommodate the free exercise of motherhood (mainly conciliation of work and family) – example of USA with private sector adaptation
8
Objective
The objective is to investigate whether the timing of childbearing in Brazil has the same pattern: having fewer children and having them early, for several socioeconomic groups, in order to predict the path of fertility in the future in Brazil, and to understand why and how the fertility schedule is so different from other low fertility experiences.
9
Data and methods
Data: for TFR and ASFR calculations from:
Demographic Census
Population and household annual surveys (PNAD)
Demographic and Health Surveys (PNDS=DHS)
Method
For Census and PNAD data: indirect method (P/F Brass)
For DHS: direct method as average of previous 5-years
10
0.00
0.05
0.10
0.15
0.20
0.25
0.30
15-19 20-24 25-29 30-34 35-39 40-44 45-49
Age Groups
Age
Spe
cific
Fer
tility
Rat
es
1980 (TFR=4.30)1991 (TFR=2.69)2000 (TFR=2.37)2004 (TFR=2.11)2007 (TFR=1.96)
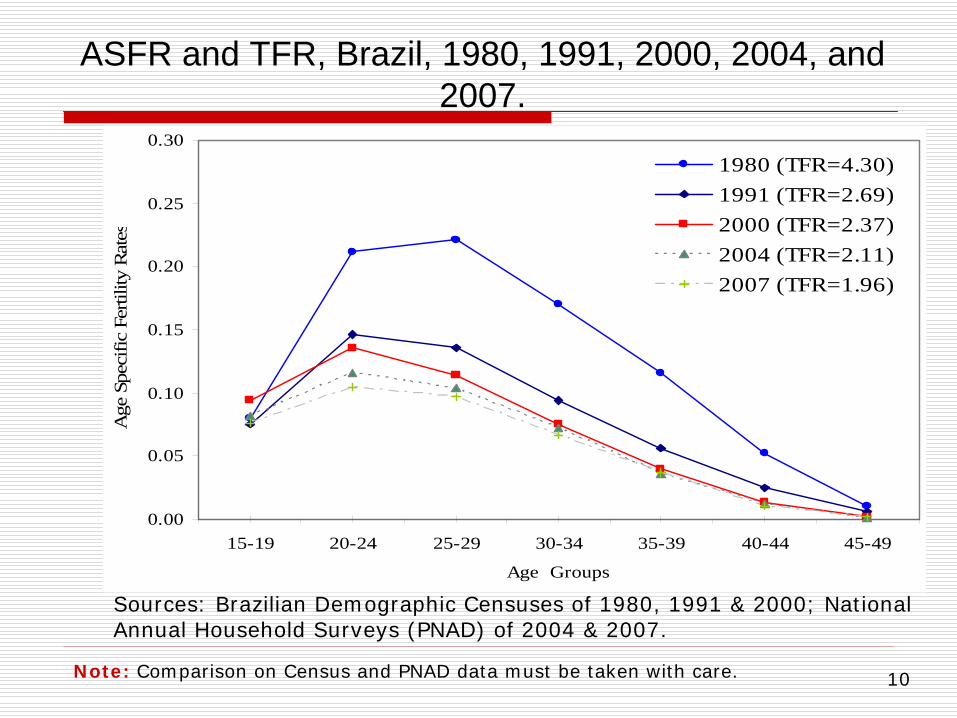
ASFR and TFR, Brazil, 1980, 1991, 2000, 2004, and 2007.
Sources: Brazilian Demographic Censuses of 1980, 1991 & 2000; National Annual Household Surveys (PNAD) of 2004 & 2007.
Note: Comparison on Census and PNAD data must be taken with care.
11
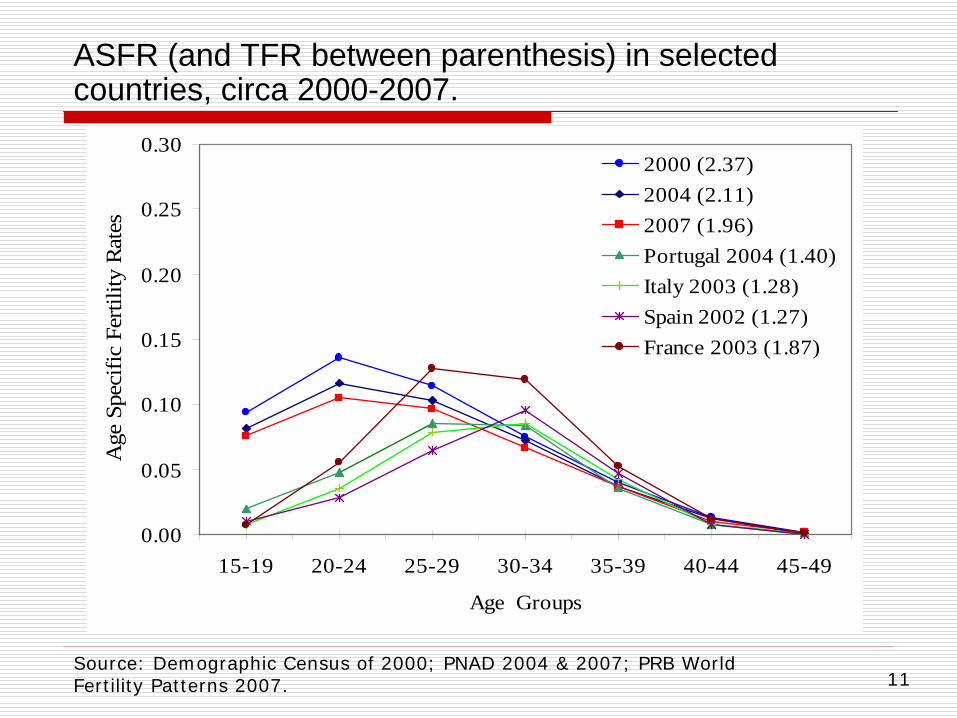
ASFR (and TFR between parenthesis) in selected countries, circa 2000-2007.
0.00
0.05
0.10
0.15
0.20
0.25
0.30
15-19 20-24 25-29 30-34 35-39 40-44 45-49
Age Groups
Age
Spe
cific
Fer
tility
Rat
es
2000 (2.37)2004 (2.11)2007 (1.96)Portugal 2004 (1.40)Italy 2003 (1.28)Spain 2002 (1.27)France 2003 (1.87)
Source: Demographic Census of 2000; PNAD 2004 & 2007; PRB World Fertility Patterns 2007.
12
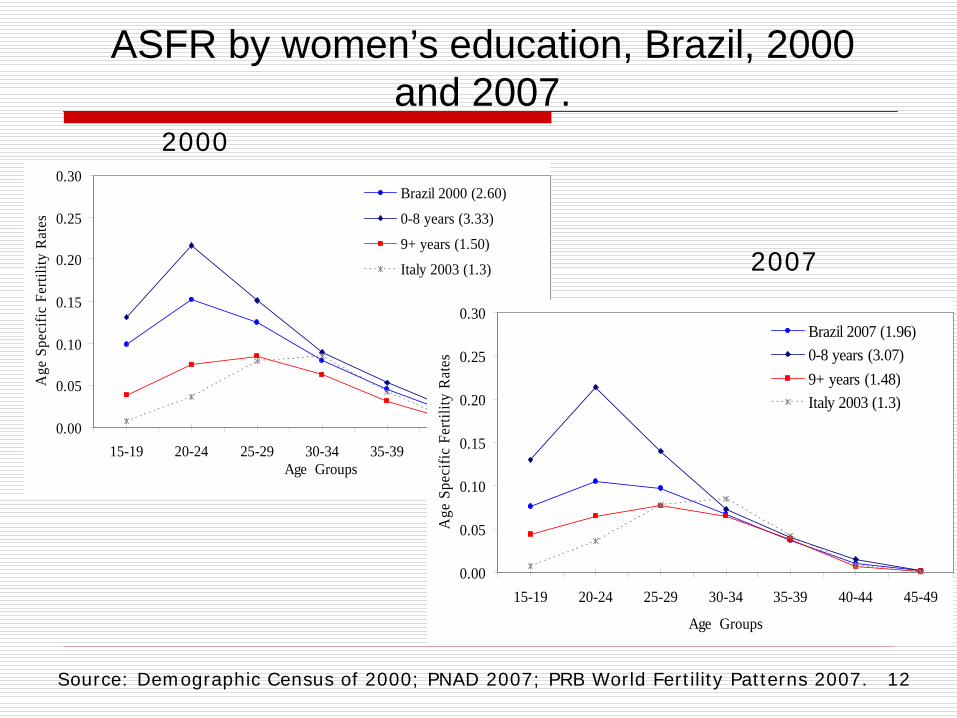
ASFR by women’s education, Brazil, 2000 and 2007.
0.00
0.05
0.10
0.15
0.20
0.25
0.30
15-19 20-24 25-29 30-34 35-39 40-44 45-49Age Groups
Age
Spe
cific
Fer
tility
Rat
es
Brazil 2000 (2.60)
0-8 years (3.33)
9+ years (1.50)
Italy 2003 (1.3)
2000
2007
0.00
0.05
0.10
0.15
0.20
0.25
0.30
15-19 20-24 25-29 30-34 35-39 40-44 45-49
Age Groups
Age
Spe
cific
Fer
tility
Rat
es
Brazil 2007 (1.96)0-8 years (3.07)9+ years (1.48)Italy 2003 (1.3)
Source: Demographic Census of 2000; PNAD 2007; PRB World Fertility Patterns 2007.
13
0.00
0.05
0.10
0.15
0.20
0.25
0.30
15-19 20-24 25-29 30-34 35-39 40-44 45-49
Age Groups
Age
Spe
cific
Fer
tility
Rat
es
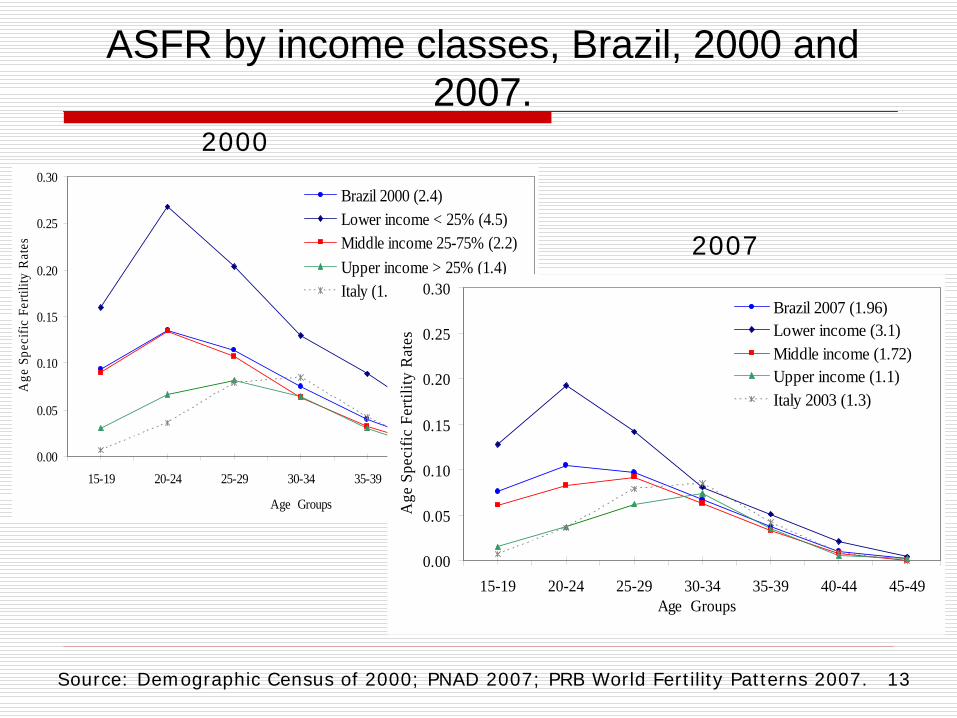
Brazil 2000 (2.4)Lower income < 25% (4.5)Middle income 25-75% (2.2)Upper income > 25% (1.4)Italy (1.3)
ASFR by income classes, Brazil, 2000 and 2007.
2000
Source: Demographic Census of 2000; PNAD 2007; PRB World Fertility Patterns 2007.
2007
0.00
0.05
0.10
0.15
0.20
0.25
0.30
15-19 20-24 25-29 30-34 35-39 40-44 45-49Age Groups
Age
Spe
cific
Fer
tility
Rat
es
Brazil 2007 (1.96)Lower income (3.1)Middle income (1.72)Upper income (1.1)Italy 2003 (1.3)
14
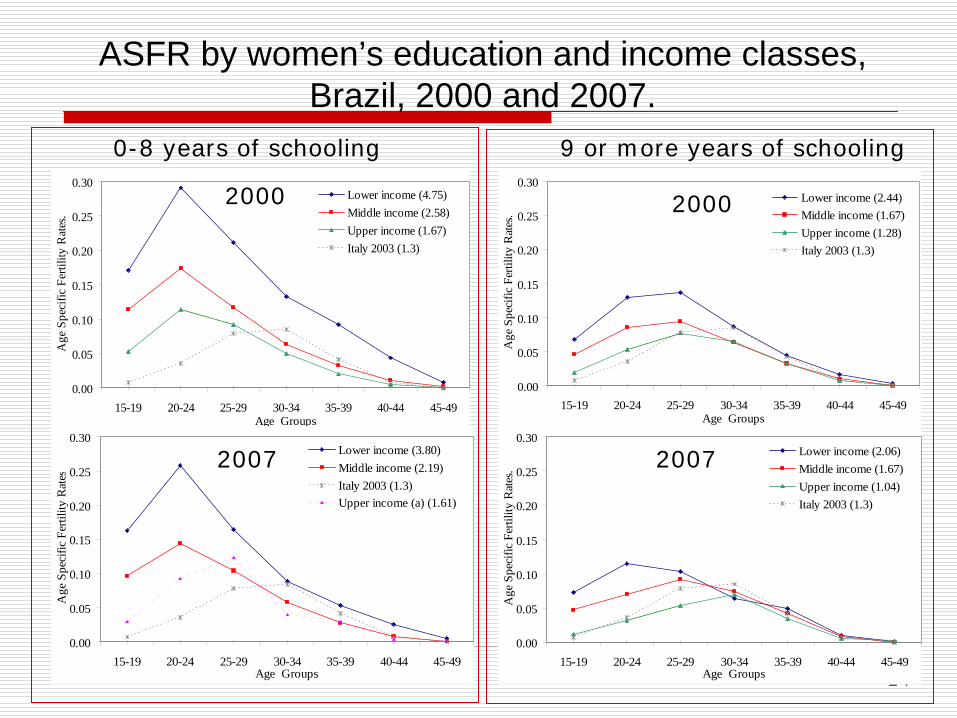
ASFR by women’s education and income classes, Brazil, 2000 and 2007.
0.00
0.05
0.10
0.15
0.20
0.25
0.30
15-19 20-24 25-29 30-34 35-39 40-44 45-49Age Groups
Age
Spe
cific
Fer
tility
Rat
es.
Lower income (4.75)Middle income (2.58)Upper income (1.67)Italy 2003 (1.3)
0.00
0.05
0.10
0.15
0.20
0.25
0.30
15-19 20-24 25-29 30-34 35-39 40-44 45-49Age Groups
Age
Spe
cific
Fer
tility
Rat
es.
Lower income (2.44)Middle income (1.67)Upper income (1.28)Italy 2003 (1.3)
0.00
0.05
0.10
0.15
0.20
0.25
0.30
15-19 20-24 25-29 30-34 35-39 40-44 45-49Age Groups
Age
Spe
cific
Fer
tility
Rat
es
Lower income (3.80)Middle income (2.19)Italy 2003 (1.3)Upper income (a) (1.61)
0.00
0.05
0.10
0.15
0.20
0.25
0.30
15-19 20-24 25-29 30-34 35-39 40-44 45-49Age Groups
Age
Spe
cific
Fer
tility
Rat
es.
Lower income (2.06)Middle income (1.67)Upper income (1.04)Italy 2003 (1.3)
0-8 years of schooling 9 or more years of schooling
2000 2000
2007 2007
15
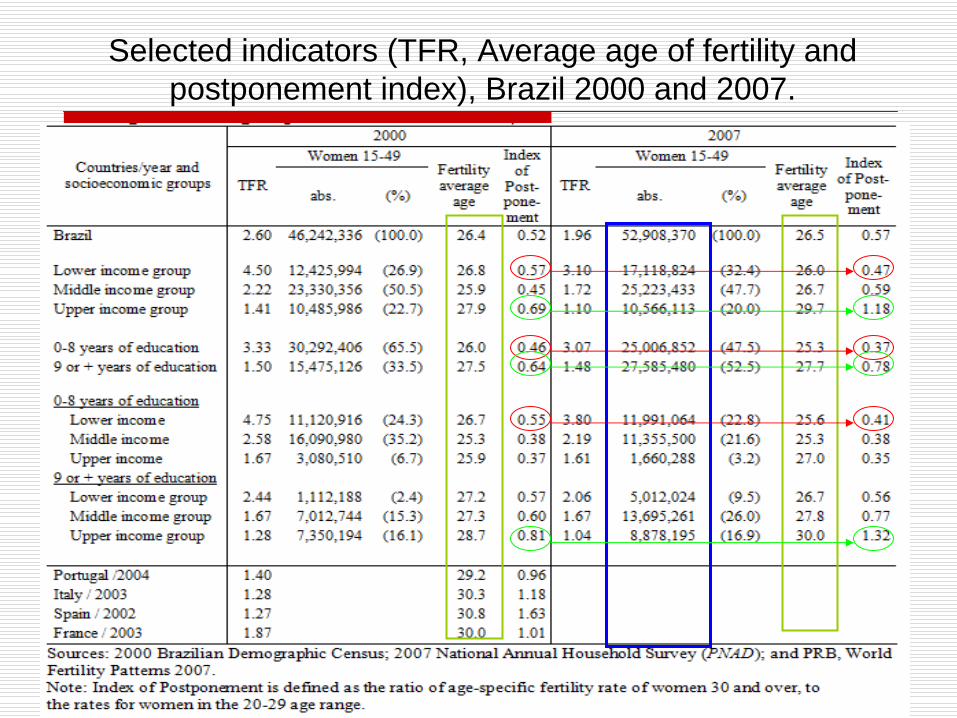
Selected indicators (TFR, Average age of fertility and postponement index), Brazil 2000 and 2007.
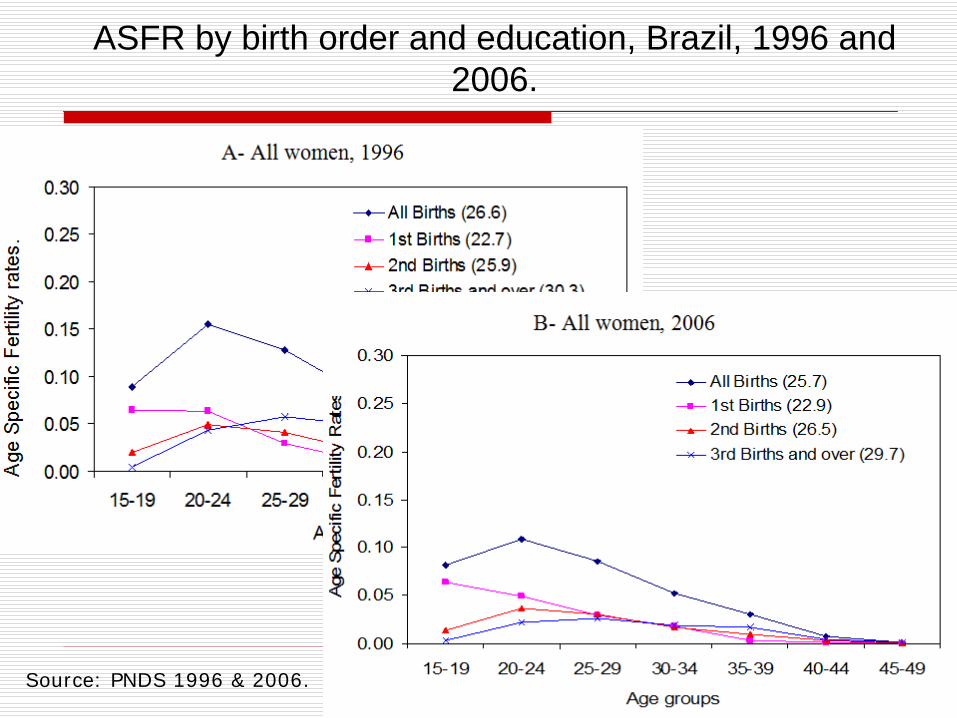
16Source: PNDS 1996 & 2006.
ASFR by birth order and education, Brazil, 1996 and 2006.
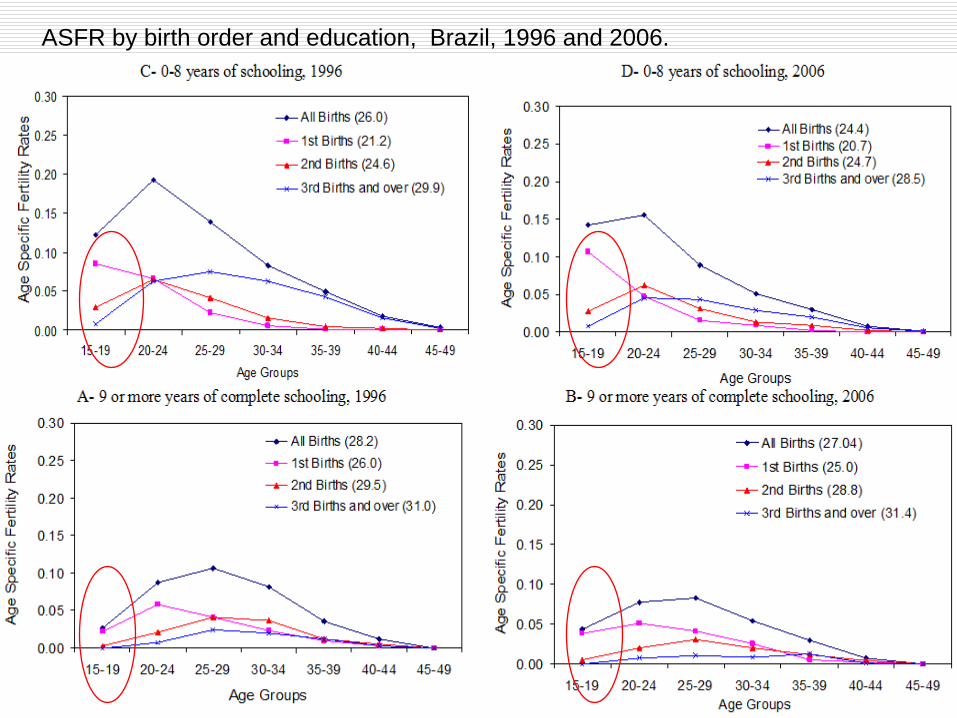
17
ASFR by birth order and education, Brazil, 1996 and 2006.
18
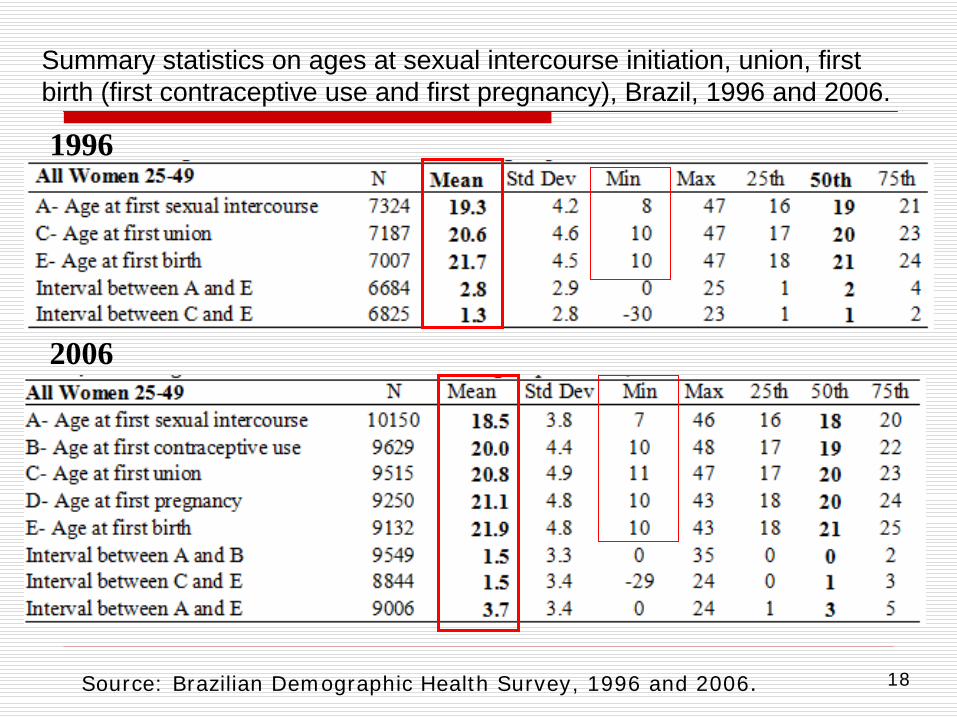
Summary statistics on ages at sexual intercourse initiation, union, first birth (first contraceptive use and first pregnancy), Brazil, 1996 and 2006.
1996
2006
Source: Brazilian Demographic Health Survey, 1996 and 2006.
19
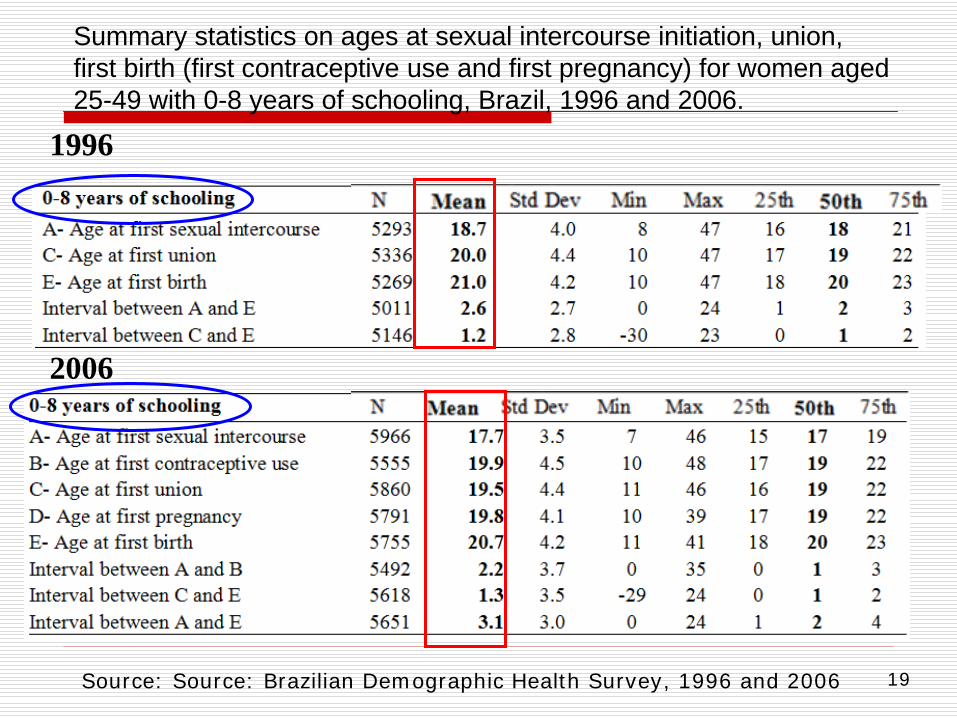
Summary statistics on ages at sexual intercourse initiation, union, first birth (first contraceptive use and first pregnancy) for women aged 25-49 with 0-8 years of schooling, Brazil, 1996 and 2006.
Source: Source: Brazilian Demographic Health Survey, 1996 and 2006
1996
2006
20
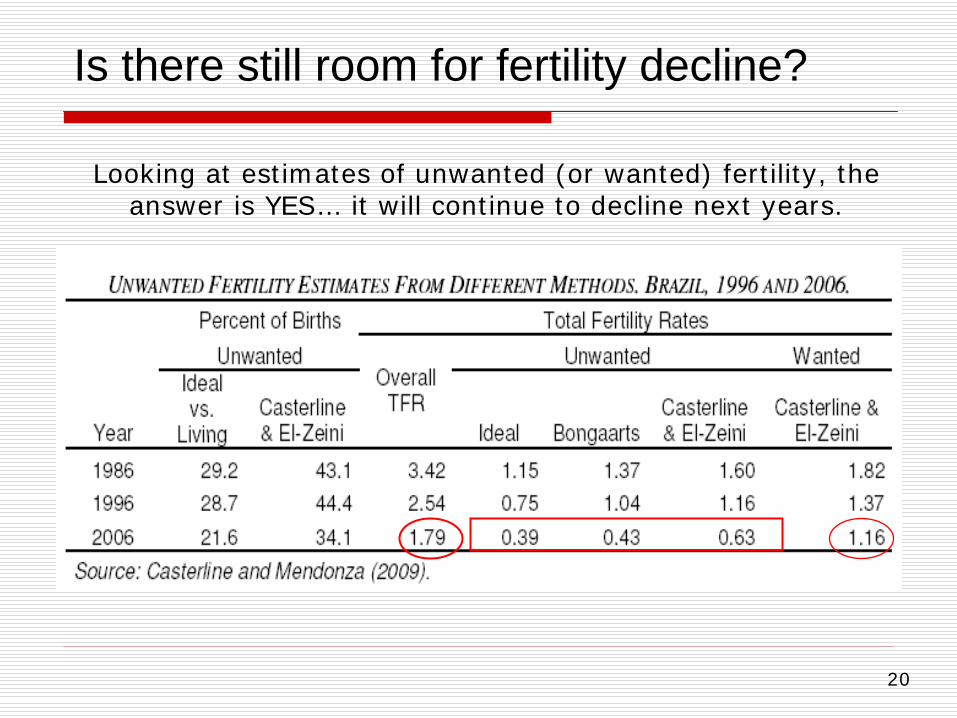
Is there still room for fertility decline?
Looking at estimates of unwanted (or wanted) fertility, the answer is YES… it will continue to decline next years.
21
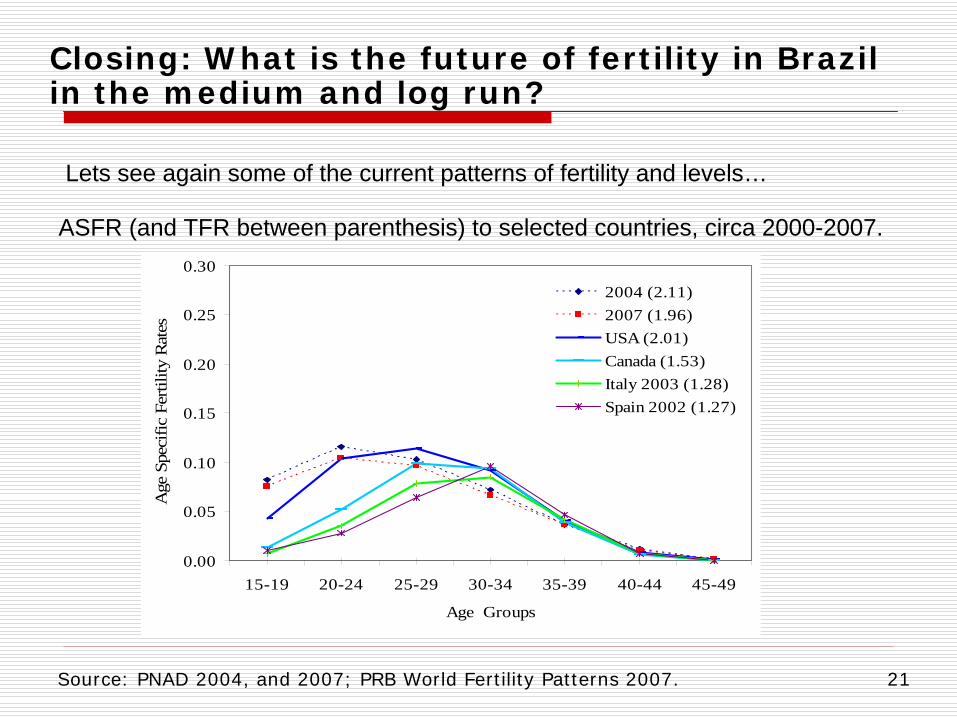
Lets see again some of the current patterns of fertility and levels…
0.00
0.05
0.10
0.15
0.20
0.25
0.30
15-19 20-24 25-29 30-34 35-39 40-44 45-49
Age Groups
Age
Spe
cific
Fer
tility
Rat
es
2004 (2.11)2007 (1.96)USA (2.01)Canada (1.53)Italy 2003 (1.28)Spain 2002 (1.27)
Closing: What is the future of fertility in Brazil in the medium and log run?
Source: PNAD 2004, and 2007; PRB World Fertility Patterns 2007.
ASFR (and TFR between parenthesis) to selected countries, circa 2000-2007.
22
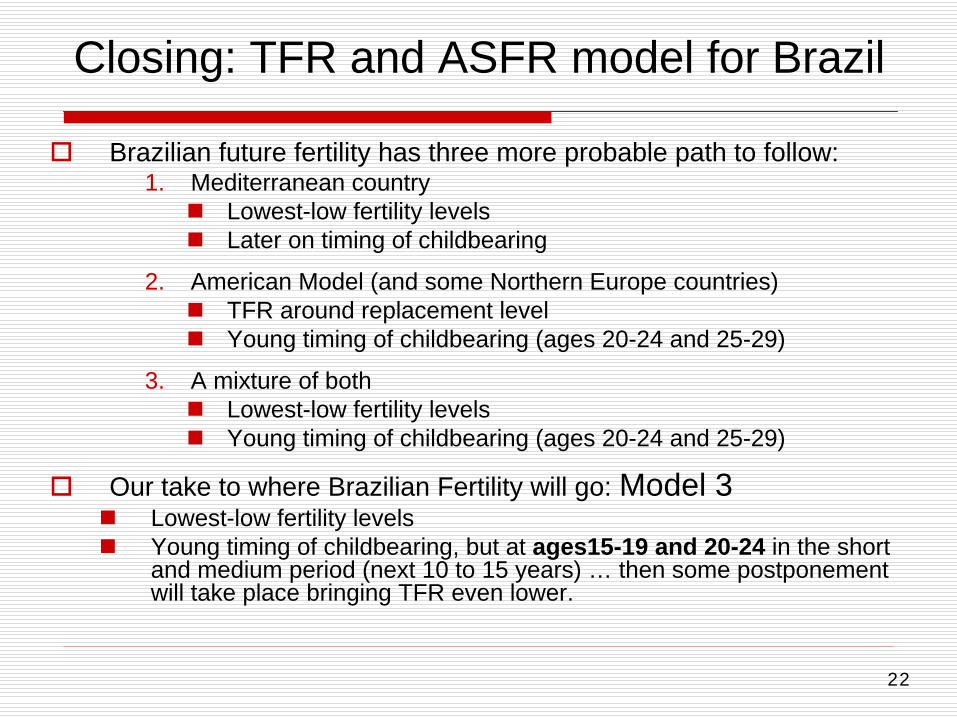
Closing: TFR and ASFR model for Brazil
Brazilian future fertility has three more probable path to follow: 1. Mediterranean country
Lowest-low fertility levels
Later on timing of childbearing
2. American Model (and some Northern Europe countries)
TFR around replacement level
Young timing of childbearing (ages 20-24 and 25-29)
3. A mixture of both
Lowest-low fertility levels
Young timing of childbearing (ages 20-24 and 25-29)
Our take to where Brazilian Fertility will go: Model 3
Lowest-low fertility levels
Young timing of childbearing, but at ages15-19 and 20-24 in the short and medium period (next 10 to 15 years) … then some postponement will take place bringing TFR even lower.
The future of population in Brazil will depend on both:
1. The lowest-low levels of TFR
2. Young fertility schedules regimes
Future work: The impacts of lowest-low levels of TFR on a rejuvenated schedule of fertility in the population growth and age structure.

Thanks!
Recommended