Agenda• Sydney 2016• HydroChem’s response• Legionella• Cooling towers• Risk factors• OH&S• Q&A

Sydney outbreaks – 2016
Location Date Illness Deaths
CBD – Town Hall area Feb / March 9 1
Kogarah – St George Hospital area March / April 3
CBD – Circular Quay area May 6
Burwood / Hurstville May 5 1


NSW Legionnaires’ infections
58% increase on 4 year average
2012 2013 2014 2015 20160
10
20
30
40
50
60
70
80
Legionnaires Infections - Legionella pneumophilaJan to Sept
4 YEAR AVG
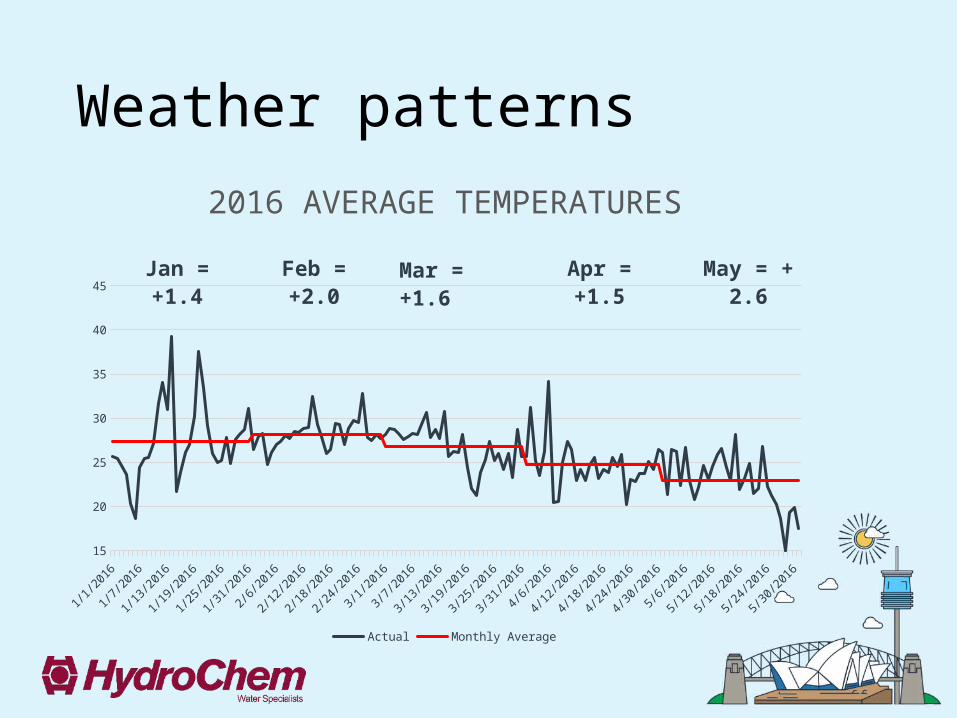
Weather patterns
1/1/2
016
1/5/2
016
1/9/2
016
1/13/2
016
1/17/2
016
1/21/2
016
1/25/2
016
1/29/2
016
2/2/2
016
2/6/2
016
2/10/2
016
2/14/2
016
2/18/2
016
2/22/2
016
2/26/2016
3/1/2
016
3/5/2
016
3/9/2
016
3/13/2
016
3/17/2
016
3/21/2
016
3/25/2
016
3/29/2
016
4/2/2
016
4/6/2
016
4/10/2016
4/14/2
016
4/18/2
016
4/22/2
016
4/26/2
016
4/30/2
016
5/4/2
016
5/8/2
016
5/12/2
016
5/16/2016
5/20/2016
5/24/2
016
5/28/2
01615
20
25
30
35
40
45
2016 AVERAGE TEMPERATURES
Actual Monthly Average
Mar = +1.6
Feb = +2.0
Apr = +1.5
May = + 2.6
Jan = +1.4

NSW Government response• Inspected over 400 cooling towers• Source of Legionella not determined• Requested 6 months of paperwork from all CBD
cooling tower systems• NSW Health Legionella expert panel


Clarity reports

Clive Broadbent AM

After presentationClive Broadbent then presented on controlling Legionella in a variety of water systems and environments.
Recommended