T h e e c o n o m i c i m pa c T o f T h e 2013 R i m f i R e o n n aT u R a l l a n d s
p R e l i m i n a R y a s s e s s m e n T
Preliminary assessment: the economic imPact of the 2013 rim fire on natural lands
November 26, 2013
authorsDavid Batker, Zachary Christin, Rowan Schmidt, Isabel de la Torre
acknowledgmentsSan Francisco Public Utilities Commission (SFPUC) funded this rapid assessment. Earth Economics would like to thank Tim Ramirez, Todd Rydstrom, Cheryl Taylor, William Sears, and Jeremy Lukins – all with the SFPUC. Joe Meyer of the Yosemite National Park Service, and Jim Schmidt of the Stanislaus National Forest, both provided important data that provide the foundation of our analysis. Earth Economics would also like to thank Angela Fletcher, Cameron Otsuka, Martha Johnson, Can Huynh, Greg Schundler, and Corinne Cooley.
image creditsTim Ramirez and Bill Sears provided the images on page 4.All other images are courtesy of the Rim BAER Team.Cover Image by NASA.
Layout by Angela Fletcher.
The content and findings of this study are the sole responsibility of its authors. It does not reflect the positions of the persons or institutions mentioned or cited in this study.
© 2013 by Earth Economics. Reproduction of this publication for educational or other non-commercial purposes is authorized without prior written permission from the copyright holder provided the source is fully acknowledged. Reproduction of this publication for resale or other commercial purposes is prohibited without prior written permission of the copyright holder.
Prepared by:
107 N. Tacoma AvenueTacoma, WA 98403(253) 539 - [email protected]
iEARTH ECONOMICS
PURPOSE AND BACKGROUND ....................................................................................... iv
EXECUTIVE SUMMARY .....................................................................................................1
1. ENVIRONMENTAL BENEFITS AND ECONOMIC VALUATION .................................. 3
2. MAINTENANCE OF NATURAL CAPITAL AND THE RIM FIRE .................................. 3
3. DESCRIPTION OF THE RIM FIRE BURN AREA ........................................................... 5
4. VALUATION OF ENVIRONMENTAL BENEFITS BEFORE THE RIM FIRE ................... 6
4.1. Land Cover In The rIm FIre Burn area ......................................................... 64.2. Land ownershIp In The Burned area ............................................................ 74.3. vaLuaTIon meThodoLogy ............................................................................... 84.4. annuaL vaLue oF envIronmenTaL BeneFITs BeFore The rIm FIre ................... 114.5. CarBon sTorage vaLue BeFore The rIm FIre ................................................ 144.6. properTy vaLues adjaCenT To The rIm FIre Burn area ............................... 17
5. VALUATION OF ENVIRONMENTAL BENEFITS LOST TO THE RIM FIRE ............... 17
5.1. envIronmenTaL BeneFITs LosT To The rIm FIre By Land ownershIp .............. 205.2. CarBon sTorage vaLue LosT To The rIm FIre .............................................. 235.3. properTy vaLue LosT due To The rIm FIre ...................................................245.4. vaLue ranges ..............................................................................................24
6. CONCLUSIONS ...........................................................................................................25
7. FUTURE RESEARCH ....................................................................................................26
7.1. ImprovemenT oF CaLIFornIa eCosysTem servICe vaLues ................................267.2. InCorporaTIon oF hIsTorICaL FIres and sTand age daTa ............................. 277.3. ImpaCT on waTer suppLy, QuaLITy, TImIng and reLIaBILITy .......................... 277.4. ImpaCT on snowpaCk and groundwaTer ..................................................... 277.5. hydrophoBIC soILs ......................................................................................287.6. ImpaCT on reCreaTIon ..................................................................................287.7. ImpaCT on aIr QuaLITy and human heaLTh .................................................28
REFERENCES ....................................................................................................................29
CONTENTS
THE ECONOMIC IMPACT OF THE 2013 RIM FIRE ON NATURAL LANDSPreliminary assessment
ii
APPENDICES A. ADDITIONAL CARBON TABLES ....................................................... 32
B. ECOSYSTEM SERVICE LOSSES IN PRIVATE LANDS ........................ 33
C. ECOSYSTEM SERVICE VALUES REFERENCE TABLE .......................34
D. VALUATION STUDIES USED ............................................................. 37
E. STUDY LIMITATIONS AND CAVEATS .............................................39
F. ECOSYSTEM SERVICE VALUATION FAQ .......................................... 41
FIGURES 1. Historic fires in the rim fire region .................................................................................... 5
2. Vegetation map before rim fire .........................................................................................6
3. Land Ownership in the Rim Fire Burn Area ......................................................................8
4. Valuation Methods Used to Value Ecosystem Services in Primary Studies .................9
iiiEARTH ECONOMICS
TABLES 1. Total Environmental Benefits Lost to the Rim Fire in the First Year Post-Fire ............................................ 1
2. Land Cover Descriptions and Acreages in the Rim Fire Burn Area .............................................................7
3. Ecosystem Services Identified and Valued within the Rim Fire Burn Area ............................................... 10
4. Dollar/Acre Estimates for Aesthetic Information and Biological Control ................................................. 11
5. Dollar/Acre Estimates for Moderation of extreme events and Pollination ............................................... 11
6. Dollar/Acre Estimates for Air Quality and Habitat and Nursery .............................................................. 12
7. Dollar/Acre Estimates for Soil Retention and Water regulation ................................................................ 12
8. Dollar/Acre Estimates for Recreation and Tourism .................................................................................... 13
9. Total Annual Environmental Benefits before the Rim Fire ......................................................................... 13
10. Carbon Biomass of Rim Fire Region by Land Cover .................................................................................. 14
11. Values for Carbon Sequestration ................................................................................................................. 14
12. Total Potential Value of Non-soil Stored Carbon by Land Cover ............................................................. 15
13. Tree Size Statistics ....................................................................................................................................... 15
14. Value of Carbon Stock Pre-Rim Fire (1/2) ................................................................................................. 16
15. Value of Carbon Stock Pre-Rim Fire (2/2) ................................................................................................. 16
16. Property Value within or near the Rim Fire Burn Area .............................................................................. 17
17. Acreage of Vegetation Types Categorized by Basal Area Loss ................................................................ 18
18. Ecosystem Service Function Capacity at Basal Area Loss ........................................................................ 18
19. Annual Value of Ecosystem Services Lost due to Rim Fire by Basal Area Loss (1/2) ......................................................................................................................................... 19
20. Annual Value of Ecosystem Services Lost due to Rim Fire by Basal Area Loss (2/2) ........................................................................................................................................ 19
21. Total Rim Fire First-year Ecosystem Service Values Lost by Land Cover ................................................ 19
22. Total Annual Ecosystem Services Lost to the Rim Fire by Ecosystem Service ...................................... 20
23. Acreage by Land Ownership ...................................................................................................................... 20
24. Total First Post Fire Year Ecosystem Service Lost by Land Ownership and Land Cover (1/2) ......................................................................................................................................... 21
25. Total First Post Fire Year Ecosystem Service Lost by Land Ownership and Land Cover (2/2) ........................................................................................................................................ 21
26. Total Annual Ecosystem Services Lost by Land Ownership and Ecosystem Service (1/2) ................................................................................................................................... 22
27. Total First Post Fire Year Ecosystem Service Lost by Land Ownership and Ecosystem Service (2/2) 22
28. Carbon Storage Lost by Land Cover and Land Ownership ...................................................................... 23
29. Carbon Storage Lost by Land Cover and Land Ownership ...................................................................... 23
30. Literature Demonstrating the Impact on Property Values due to a Wildfire ........................................ 24
31. Property Value Reduction Due to the Rim Fire ......................................................................................... 24
THE ECONOMIC IMPACT OF THE 2013 RIM FIRE ON NATURAL LANDSPreliminary assessment
iv
REPORT PURPOSE AND BACKGROUNDEnvironmental benefits, or “ecosystem services,” are benefits that humans receive from nature. This rapid assessment provides an economic valuation and analysis of the damage caused by the 2013 Rim Fire to the environmental benefits within the burn area.
The Federal government recognizes the economic value of natural systems. In 2013, the Federal Emergency Management Agency (FEMA) adopted Mitigation Policy FP-108-024-01, which provides explicit environmental benefit dollar values for use in all flood and hurricane disaster mitigation.1
Also in 2013, the President’s Council on Environmental Quality approved a new Principles and Requirements for Investments in Water Resources, recognizing ecosystem service values in project benefit-cost analysis.2
In 2012, the US Forest Service adopted a new land management planning rule, governing 155 National Forests. The rule systematically incorporates ecosystem services into land management planning.3
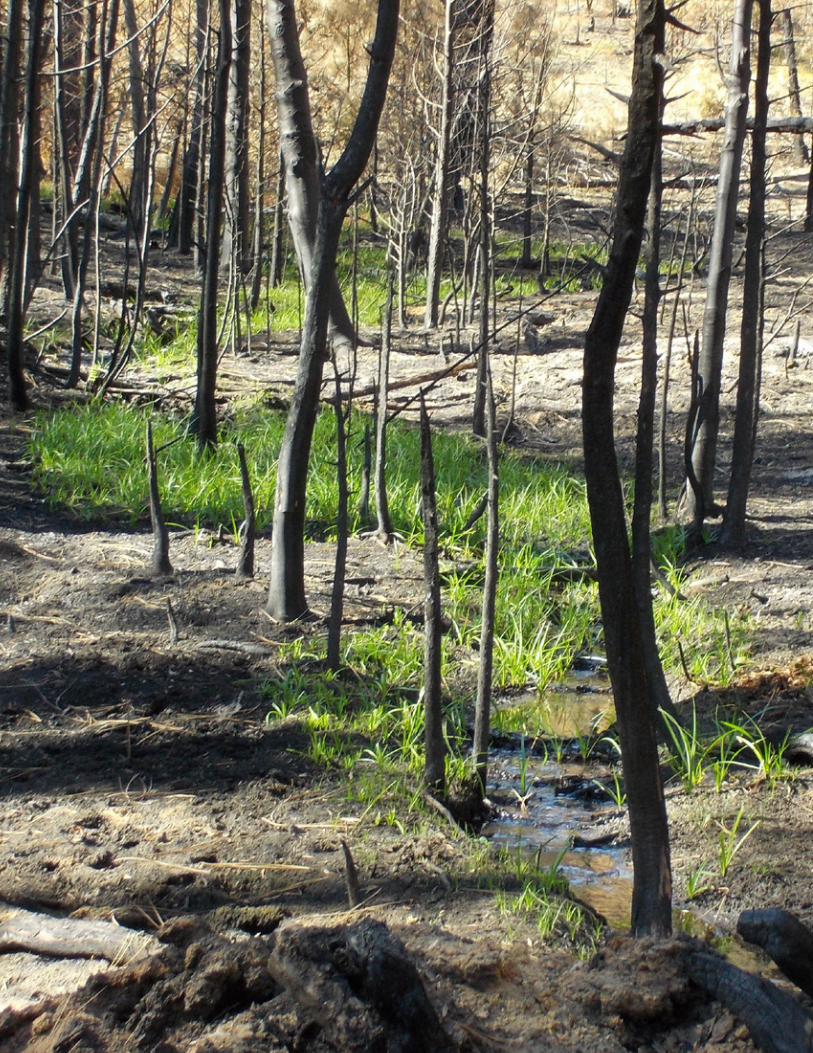
This assessment was conducted while the fire was still burning. Some trees partially fire damaged and green in satellite imagery will suffer mortality within the next year, thus, this analysis represents an initial and conservative underestimate of fire damage.
This assessment also discusses important areas for future research including scientific analysis of the impact of fires on water supply, storage, quality, flow and temperature as well as economic valuation studies based on scientific data and sound valuation methods.
vEARTH ECONOMICS
THE ECONOMIC IMPACT OF THE 2013 RIM FIRE ON NATURAL LANDSPreliminary assessment
1
TABLE 1 TOTAL ENVIRONMENTAL BENEFITS LOST TO THE RIM FIRE IN THE FIRST YEAR POST-FIRE
land cover
area (acres) descriPtion
low ($/year)
high ($/year)
Grassland and
Meadow20,201
Includes annual and perennial grasslands that dominate major regions around coniferous forests
$30,569,395 $69,202,212
Herbaceous Wetland 577
Includes wetlands dominated by herbaceous meadow vegetation; areas where total herbaceous wetland vegetation coverage is greater than 20%
$515,158 $20,284,851
Shrub 31,923Riparian areas alongside riverine and wetland regions; exists through various altitudes
$541,959 $37,247,933
Lake 447
Contains areas dominated by shrubs less than 5 meters tall. This class includes chaparral shrubs and mixed montane shrubs
$93,926 $2,877,038
River 161Includes areas of open water, generally with less than 25% cover of vegetation or soil
$4,073 $907,523
Riparian 190Includes stream and creek systems and sometimes areas of open water
$47,071 $325,824
Forest (Broad Leaf and Mixed)
32,213
Includes a mixture of aspen, blue oak woodlands, and montane hardwoods that occur sporadically throughout National Parks Service and Forest Service lands
$5,098,191 $284,804,356
Forest (Coniferous) 168,941
Includes many conifer-dominated vegetation types such as Blue Oak-Foothill Pine, Closed-Cone Pine-Cypress, Douglas Fir, Jeffrey Pine, Lodgepole Pine, Ponderosa Pine, Red Fir, Sierran Mixed Conifer, and Mixed Montane Hardwoods Conifers
$63,147,300 $320,363,902
Total 254,654 $100,017,074 $736,013,639
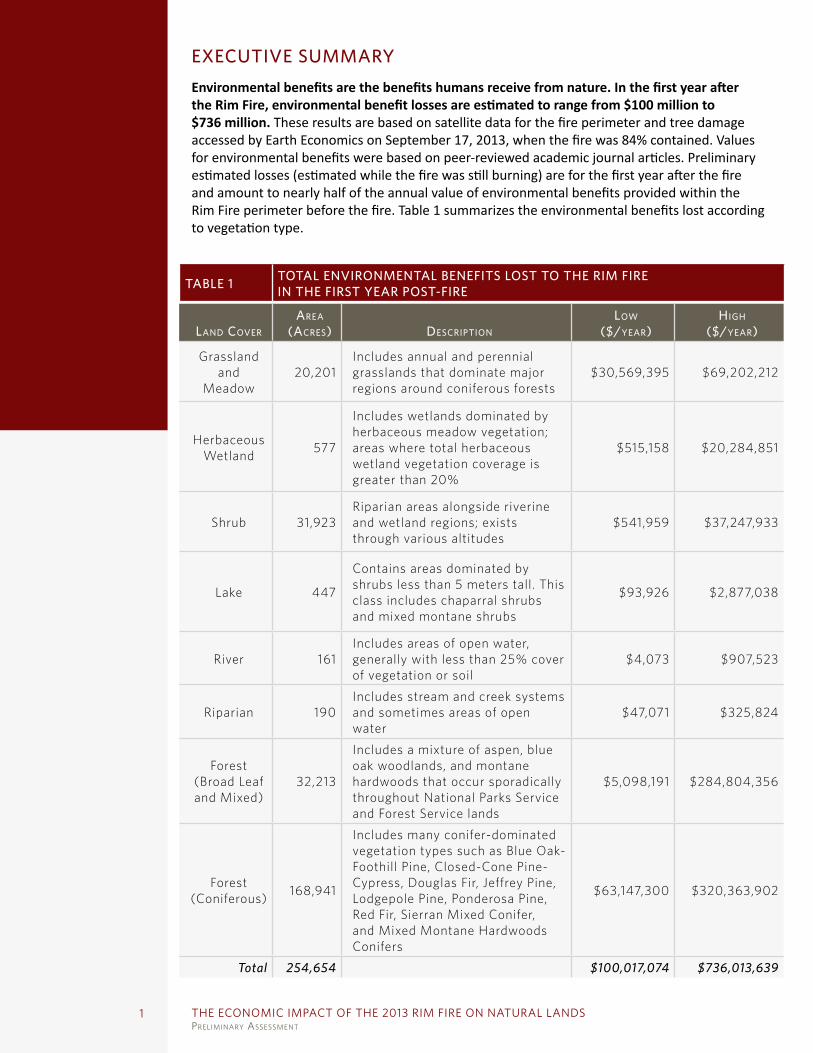
EXECUTIVE SUMMARYEnvironmental benefits are the benefits humans receive from nature. In the first year after the Rim Fire, environmental benefit losses are estimated to range from $100 million to $736 million. These results are based on satellite data for the fire perimeter and tree damage accessed by Earth Economics on September 17, 2013, when the fire was 84% contained. Values for environmental benefits were based on peer-reviewed academic journal articles. Preliminary estimated losses (estimated while the fire was still burning) are for the first year after the fire and amount to nearly half of the annual value of environmental benefits provided within the Rim Fire perimeter before the fire. Table 1 summarizes the environmental benefits lost according to vegetation type.
2EARTH ECONOMICS
This study provides monetary values for 10 out of 18 identified categories of environmental benefits (also called “ecosystem services”) identified within the burn area. Eight categories of ecosystem services damaged by the fire have no estimated value in this study. A valuation of one or more environmental benefits for each of the eight land cover types burned by the fire was completed. The ten environmental benefits valued were: (1) air quality; (2) carbon sequestration; (3) moderation of extreme events; (4) Soil Retention; (5) biological control; (6) water regulation; (7) pollination; (8) habitat and biodiversity; (9) property and aesthetic values; and (10) recreational values. The eight land cover types were: (1) grassland/meadow; (2) herbaceous wetland; (3) shrub; (4) river; (5) lake; (6) riparian; (7) forest broad leaf and mixed forest; and (8) coniferous forest.
The $100 million to $736 million range represents the lower and upper boundaries for environmental benefit losses that were examined. Because only 10 environmental benefits were valued of 18 that were identified, this value range signifies a “below the basement” appraisal, an underestimate of the true range of damages. Highly valuable environmental benefits were not valued because: (1) Scientific data is lacking (fire impact on snow pack, for example); (2) primary valuation studies have not been conducted (soil retention by coniferous forests); or (3) existing valuation studies are not appropriate for this area.
Benefit Transfer Methodology was applied to estimate the total ecosystem service value loss before and after the Rim Fire. Benefit Transfer Methodology is a federally-accepted economic valuation methodology that utilizes local values where possible, and previous valuation studies of similar goods or services in comparable locations where local values are not available. These valuation studies each utilize one of eight primary valuation techniques, which include market pricing, cost avoidance, replacement cost, travel cost and contingent valuation. Inherent uncertainty exists, and because site specific studies for each environmental benefits would be cost and time prohibitive, the results of this valuation are provided as a range of high and low values per-acre, based on peer reviewed studies.
Satellite data for tree damage based on basal area losses was used to estimate burn damage. This approach can result in an underestimate of damage; previous fires have shown that trees still green during an initial satellite survey die later due to fire-related stress. As burn data is refined, this estimate will be improved.
The loss of environmental benefits is also estimated by land ownership category. Four land ownership categories were identified in the burn area: (1) Bureau of Land Management, (2) Private Lands, (3) Stanislaus National Forest, and (4) Yosemite National Park. Direct damage to environmental benefits provided by Private Lands within the Rim Fire perimeter was estimated at $10 million to $62 million, or about 10% of the total year 1 post-fire damages.
A supplemental analysis was used to estimate the economic value of stored carbon within the Rim Fire burn area both before and after the fire. US Forest Service data on the carbon content of different forest stand ages for each forest type, combined with pre-fire timber diameter size data and burn data, were used to compare pre-fire carbon storage with post-fire carbon storage. The value of total carbon storage losses is estimated at $102 million to $797 million.
In addition, private properties close to wildfires lose asset value (assessed property value) immediately after a wildfire. A supplemental analysis was conducted to estimate this loss of value, over and above the loss of environmental benefits. Applying previous estimates from the economic literature to property values in selected zip codes near the Rim Fire, the fire-related private property value loss is estimated at between $49.7 million and $265 million. These estimates imply (but do not include) associated declines in property taxes for local and state tax districts.
THE ECONOMIC IMPACT OF THE 2013 RIM FIRE ON NATURAL LANDSPreliminary assessment
3
1. ENVIRONMENTAL BENEFITS AND ECONOMIC VALUATIONThe Federal Government recognizes the economic value of natural systems (wetlands, forests, floodplains, green space) and working lands (commercial forest, ranch lands, agricultural lands). These benefits are called environmental benefits or ecosystem services. Environmental benefits can often be monetarily valued.
The USFS and NPS maintain vast natural assets that have economic value and a high rate of return for investments in healthy forests and ecosystems. Nationwide, the USFS manages 193 million acres of public land. Through visitor spending alone, Forest Service lands contribute more than $13 billion to the economy each year. These lands provide 20% of the country’s clean water supply, a value estimated at $27 billion per year.4
The NPS maintains 84 million acres of public land, including 43 million acres of oceans, lakes and reservoirs, 85,049 miles of perennial rivers and streams, and 43,162 miles of shoreline.5 A 2011 Michigan State University report showed that the American public receives $4 in economic value for each $1 invested in the NPS. In 2011, national parks generated $30.1 billion in economic activity and 252,000 jobs nationwide. Thirteen billion of that income went directly into predominantly rural communities within 60 miles of an NPS unit.6 Moreover, for every million dollars invested in park construction and maintenance, 14 – 16 jobs are generated.
The Federal Emergency Management Agency (FEMA) in June 2013 adopted Mitigation Policy FP-108-024-01 providing dollar values for environmental benefits for use in all flood and hurricane mitigation. This policy was adopted because including environmental benefits in FEMA economic analysis helps meet the agency’s mission to “prepare for, protect against, respond to, recover from and mitigate against all hazards.”7
The President’s Council on Environmental Quality recently updated the Principles and Requirements for Federal Investments in Water Resources, which recognizes ecosystem service values for federal project benefit cost analysis. The 2012 US Forest Service (USFS) Planning Rule for land management systematically includes ecosystem services with 72 references to the term. This rule governs 193 million acres of forests and grasslands, including 155 National Forests. Including the actual economic value of natural and working lands strengthens economic analysis, saves taxpayer money, improves investment decisions, and raises rates of return on investments and federal expenditures.
2. MAINTENANCE OF NATURAL CAPITAL AND THE RIM FIREFires are an essential part of the ecology of the Sierra Nevada. Many plant species native to the north-central Sierra Nevada — including the Sequoia and Lodgepole Pine — tolerate, benefit from, or even promote fire. Native Americans used controlled burning as hunting and foraging aids, without causing significant damage to the greater ecosystems.8 However, the Rim Fire, and fires like it, are highly damaging, tremendously costly, and becoming more common.
The expansion of human population and inhabited areas has also resulted in more human-caused fires.9 Climatic changes resulting in earlier snowmelt and higher temperatures mean longer fire seasons – two months longer on the average – than in the 1970s.10 Additionally, a past policy of aggressive fire suppression has built up fuel loads in many forests. Wildfires now burn twice as many acres per year than they did 40 years ago. On average, each year there are now seven times as many wildfires greater than 10,000 acres.11
4EARTH ECONOMICS
There are forest management techniques that reduce the severity and size of wildfires while increasing biodiversity and better sustaining water production and quality. These techniques include thinning and controlled burns.12 However, these actions all require sufficient funding for forest maintenance. Economic assets left unattended, usually result in economic losses. Forests require management – including capital, operational, and maintenance costs – to produce the high value suite of goods and services, such as water regulation and supply, biodiversity, timber, recreation, aesthetic value and other benefits that society depends upon. The USFS, National Park Service (NPS), private timber companies, water utilities, states, counties and private land owners all steward economically valuable natural assets that require sufficient operations and management funding to manage these assets. Often the benefits of these lands accrue to people living downstream. Benefits in the Tuolumne watershed include the role of healthy forests in producing high quality water for municipal and regional water supplies and irrigation.
Fire can be beneficial in the maintenance of forested lands, leading to “healthy,” diverse forests. Fire can also be ecologically destructive, depending on fire frequency, intensity, and the nature of vegetation communities subject to fire. More frequent, slower burning understory fires eliminate fuel build-up, liberate fire-activated seeds and do not burn deeply into the soil, while high intensity burns consume vegetation from tree crowns to roots, burning deep into the ground and damaging soils.
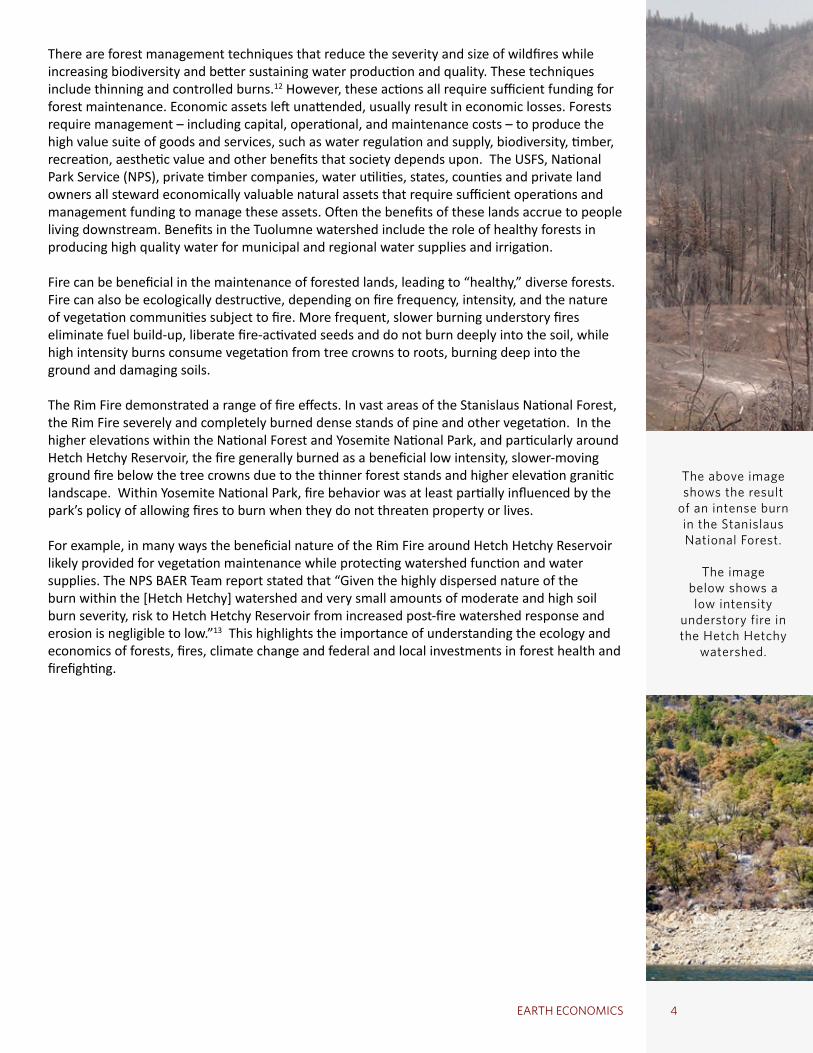
The Rim Fire demonstrated a range of fire effects. In vast areas of the Stanislaus National Forest, the Rim Fire severely and completely burned dense stands of pine and other vegetation. In the higher elevations within the National Forest and Yosemite National Park, and particularly around Hetch Hetchy Reservoir, the fire generally burned as a beneficial low intensity, slower-moving ground fire below the tree crowns due to the thinner forest stands and higher elevation granitic landscape. Within Yosemite National Park, fire behavior was at least partially influenced by the park’s policy of allowing fires to burn when they do not threaten property or lives.
For example, in many ways the beneficial nature of the Rim Fire around Hetch Hetchy Reservoir likely provided for vegetation maintenance while protecting watershed function and water supplies. The NPS BAER Team report stated that “Given the highly dispersed nature of the burn within the [Hetch Hetchy] watershed and very small amounts of moderate and high soil burn severity, risk to Hetch Hetchy Reservoir from increased post-fire watershed response and erosion is negligible to low.”13 This highlights the importance of understanding the ecology and economics of forests, fires, climate change and federal and local investments in forest health and firefighting.
The above image shows the result
of an intense burn in the Stanislaus National Forest.
The image below shows a low intensity
understory fire in the Hetch Hetchy
watershed.
THE ECONOMIC IMPACT OF THE 2013 RIM FIRE ON NATURAL LANDSPreliminary assessment
5
Source: CAL FIRE14
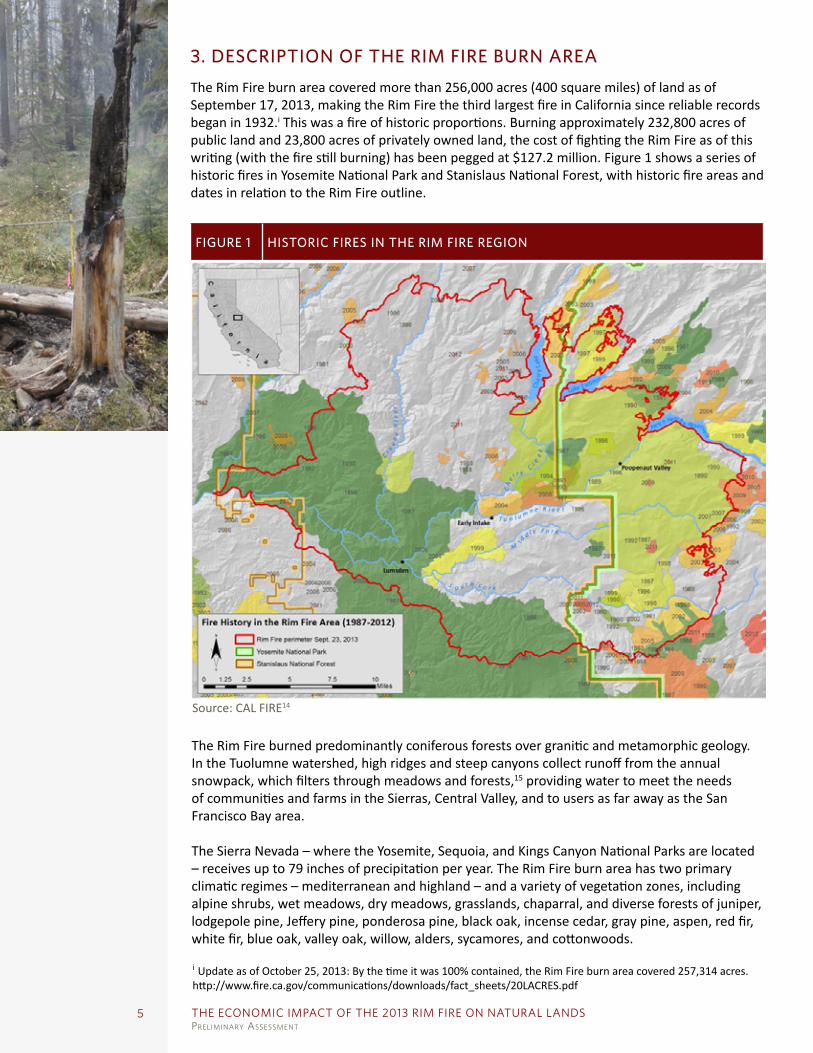
3. DESCRIPTION OF THE RIM FIRE BURN AREAThe Rim Fire burn area covered more than 256,000 acres (400 square miles) of land as of September 17, 2013, making the Rim Fire the third largest fire in California since reliable records began in 1932.i This was a fire of historic proportions. Burning approximately 232,800 acres of public land and 23,800 acres of privately owned land, the cost of fighting the Rim Fire as of this writing (with the fire still burning) has been pegged at $127.2 million. Figure 1 shows a series of historic fires in Yosemite National Park and Stanislaus National Forest, with historic fire areas and dates in relation to the Rim Fire outline.
FIGURE 1 HISTORIC FIRES IN THE RIM FIRE REGION
i Update as of October 25, 2013: By the time it was 100% contained, the Rim Fire burn area covered 257,314 acres. http://www.fire.ca.gov/communications/downloads/fact_sheets/20LACRES.pdf
The Rim Fire burned predominantly coniferous forests over granitic and metamorphic geology. In the Tuolumne watershed, high ridges and steep canyons collect runoff from the annual snowpack, which filters through meadows and forests,15 providing water to meet the needs of communities and farms in the Sierras, Central Valley, and to users as far away as the San Francisco Bay area.
The Sierra Nevada – where the Yosemite, Sequoia, and Kings Canyon National Parks are located – receives up to 79 inches of precipitation per year. The Rim Fire burn area has two primary climatic regimes – mediterranean and highland – and a variety of vegetation zones, including alpine shrubs, wet meadows, dry meadows, grasslands, chaparral, and diverse forests of juniper, lodgepole pine, Jeffery pine, ponderosa pine, black oak, incense cedar, gray pine, aspen, red fir, white fir, blue oak, valley oak, willow, alders, sycamores, and cottonwoods.
6EARTH ECONOMICS
Water from the burn area both supplies the San Francisco Bay Area with water and the Central Valley of California with drinking and irrigation water. The San Francisco Bay Area is one of the country’s most productive urban areas. The area generated a GDP of over $360 billion in 2012, the fastest real GDP growth of any major metropolitan area in the US.16 The Central Valley of California is one of the country’s most productive farming regions. The Central Valley contains 1% of the US farmlands, but produces 8% of the US agricultural output that totals to $13 billion17 in food products annually.
4. VALUATION OF ENVIRONMENTAL BENEFITS BEFORE THE RIM FIRE
4.1. land cover in the rim fire Burn area
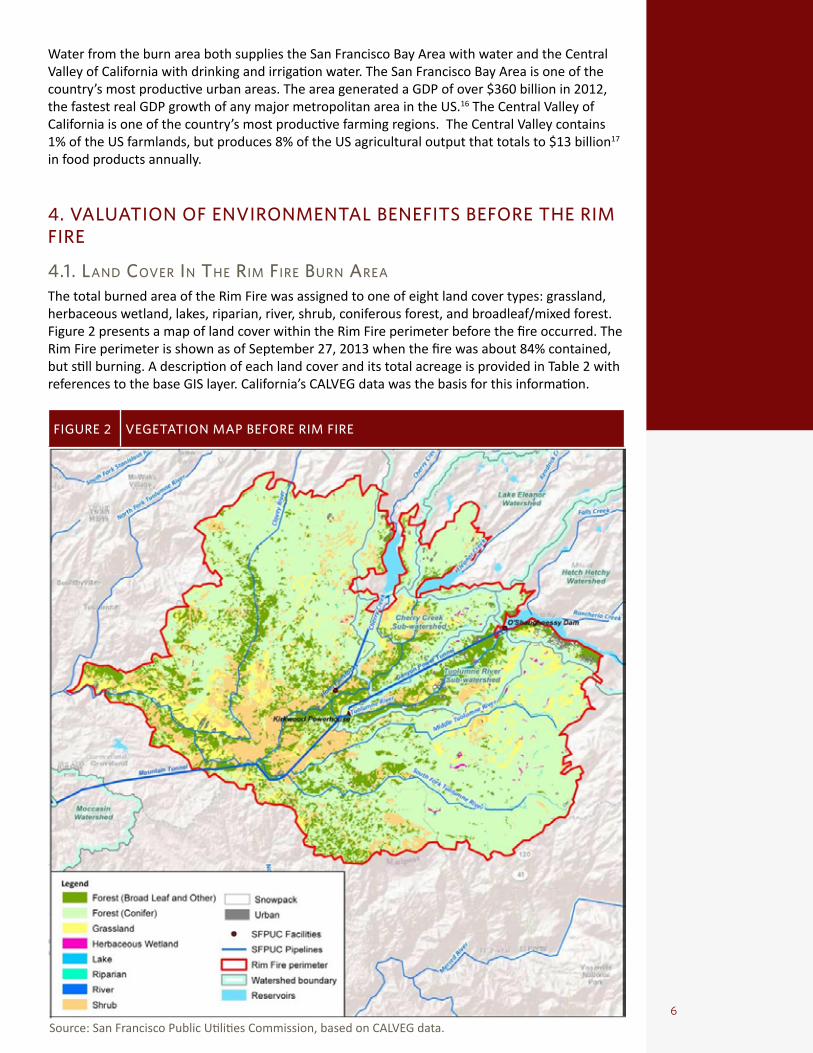
The total burned area of the Rim Fire was assigned to one of eight land cover types: grassland, herbaceous wetland, lakes, riparian, river, shrub, coniferous forest, and broadleaf/mixed forest. Figure 2 presents a map of land cover within the Rim Fire perimeter before the fire occurred. The Rim Fire perimeter is shown as of September 27, 2013 when the fire was about 84% contained, but still burning. A description of each land cover and its total acreage is provided in Table 2 with references to the base GIS layer. California’s CALVEG data was the basis for this information.
FIGURE 2 VEGETATION MAP BEFORE RIM FIRE
Source: San Francisco Public Utilities Commission, based on CALVEG data.
THE ECONOMIC IMPACT OF THE 2013 RIM FIRE ON NATURAL LANDSPreliminary assessment
7
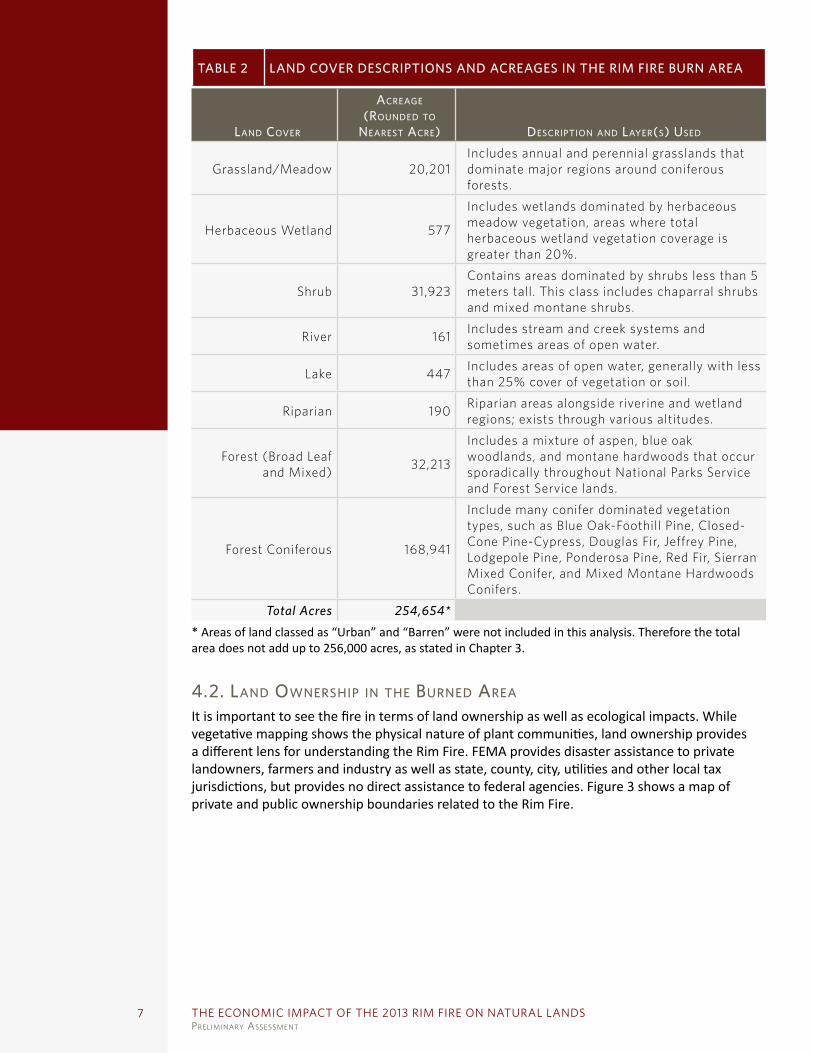
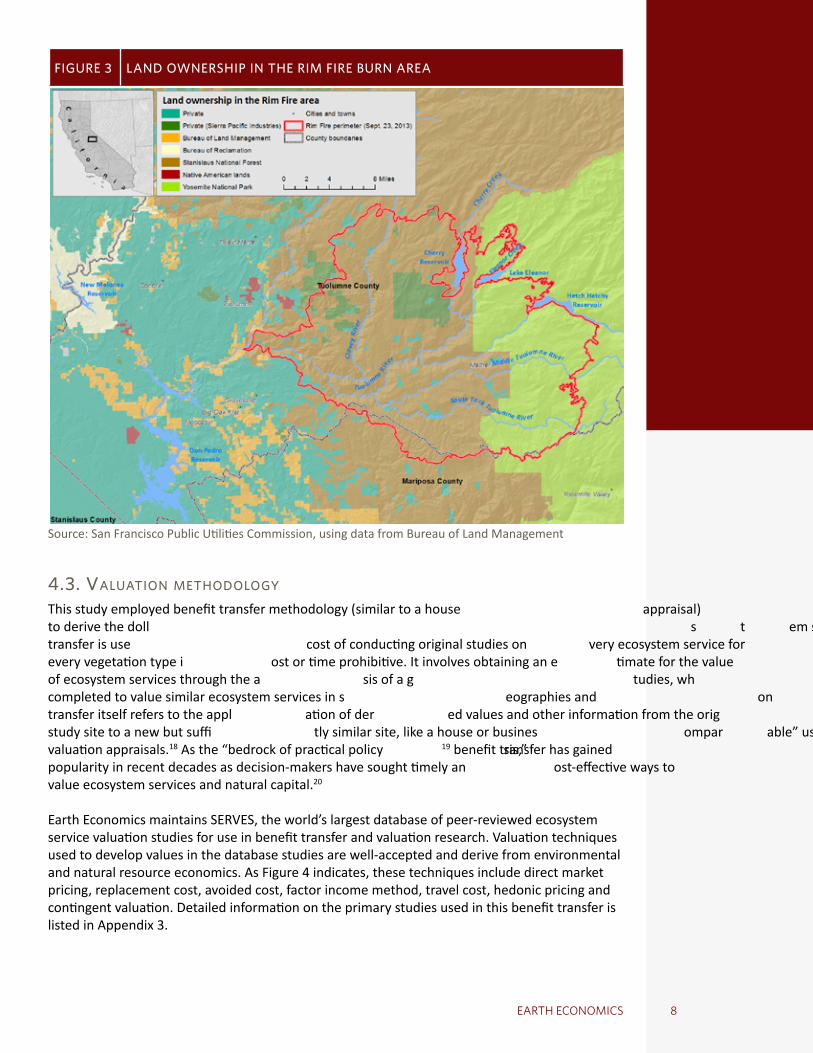
4.2. land ownershiP in the Burned area
It is important to see the fire in terms of land ownership as well as ecological impacts. While vegetative mapping shows the physical nature of plant communities, land ownership provides a different lens for understanding the Rim Fire. FEMA provides disaster assistance to private landowners, farmers and industry as well as state, county, city, utilities and other local tax jurisdictions, but provides no direct assistance to federal agencies. Figure 3 shows a map of private and public ownership boundaries related to the Rim Fire.
TABLE 2 LAND COVER DESCRIPTIONS AND ACREAGES IN THE RIM FIRE BURN AREA
land cover
acreage (rounded to
nearest acre) descriPtion and layer(s) used
Grassland/Meadow 20,201Includes annual and perennial grasslands that dominate major regions around coniferous forests.
Herbaceous Wetland 577
Includes wetlands dominated by herbaceous meadow vegetation, areas where total herbaceous wetland vegetation coverage is greater than 20%.
Shrub 31,923Contains areas dominated by shrubs less than 5 meters tall. This class includes chaparral shrubs and mixed montane shrubs.
River 161 Includes stream and creek systems and sometimes areas of open water.
Lake 447 Includes areas of open water, generally with less than 25% cover of vegetation or soil.
Riparian 190 Riparian areas alongside riverine and wetland regions; exists through various altitudes.
Forest (Broad Leaf and Mixed) 32,213
Includes a mixture of aspen, blue oak woodlands, and montane hardwoods that occur sporadically throughout National Parks Service and Forest Service lands.
Forest Coniferous 168,941
Include many conifer dominated vegetation types, such as Blue Oak-Foothill Pine, Closed-Cone Pine-Cypress, Douglas Fir, Jeffrey Pine, Lodgepole Pine, Ponderosa Pine, Red Fir, Sierran Mixed Conifer, and Mixed Montane Hardwoods Conifers.
Total Acres 254,654** Areas of land classed as “Urban” and “Barren” were not included in this analysis. Therefore the total area does not add up to 256,000 acres, as stated in Chapter 3.
8EARTH ECONOMICS
FIGURE 3 LAND OWNERSHIP IN THE RIM FIRE BURN AREA
Source: San Francisco Public Utilities Commission, using data from Bureau of Land Management
4.3. valuation methodology
This study employed benefit transfer methodology (similar to a house or business appraisal) to derive the dollar values for each ecosystem service across each land cover type. Benefit transfer is used when the cost of conducting original studies on every ecosystem service for every vegetation type is cost or time prohibitive. It involves obtaining an estimate for the value of ecosystem services through the analysis of a group of studies, which have been previously completed to value similar ecosystem services in similar geographies and/or contexts. The transfer itself refers to the application of derived values and other information from the original study site to a new but sufficiently similar site, like a house or business “comparable” used for valuation appraisals.18 As the “bedrock of practical policy analysis,”19 benefit transfer has gained popularity in recent decades as decision-makers have sought timely and cost-effective ways to value ecosystem services and natural capital.20
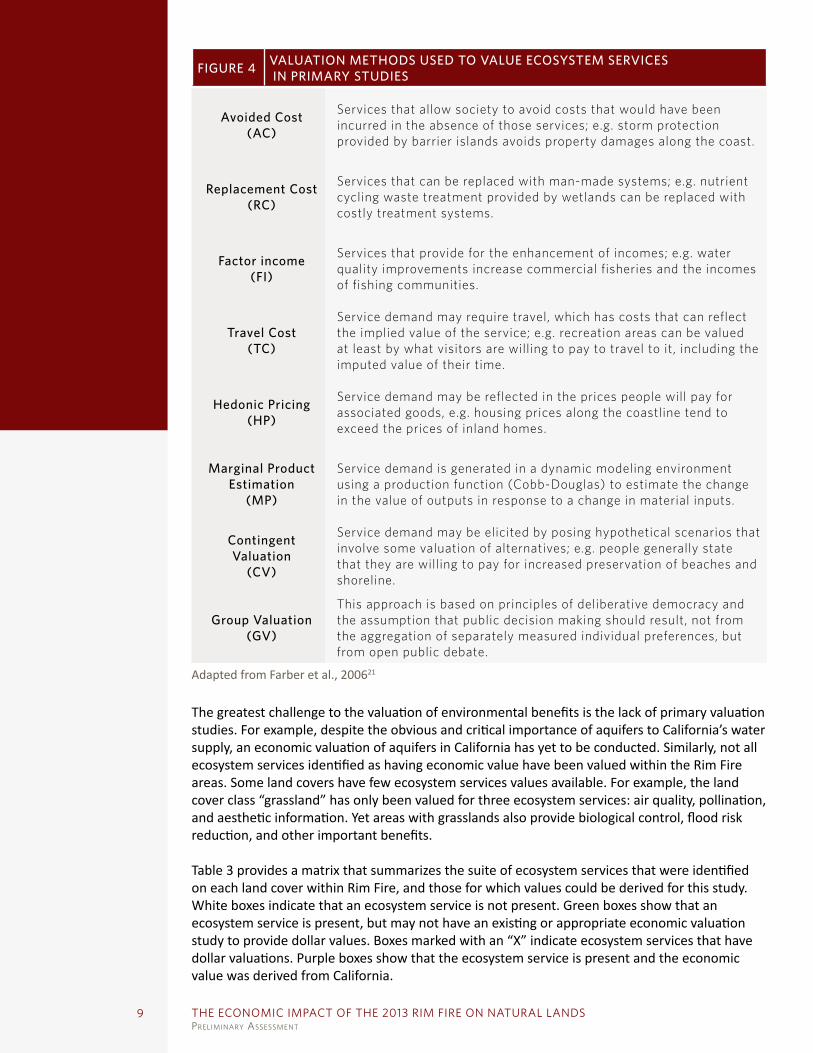
Earth Economics maintains SERVES, the world’s largest database of peer-reviewed ecosystem service valuation studies for use in benefit transfer and valuation research. Valuation techniques used to develop values in the database studies are well-accepted and derive from environmental and natural resource economics. As Figure 4 indicates, these techniques include direct market pricing, replacement cost, avoided cost, factor income method, travel cost, hedonic pricing and contingent valuation. Detailed information on the primary studies used in this benefit transfer is listed in Appendix 3.
THE ECONOMIC IMPACT OF THE 2013 RIM FIRE ON NATURAL LANDSPreliminary assessment
9
FIGURE 4 VALUATION METHODS USED TO VALUE ECOSYSTEM SERVICES IN PRIMARY STUDIES
Avoided Cost (AC)
Services that allow society to avoid costs that would have been incurred in the absence of those services; e.g. storm protection provided by barrier islands avoids property damages along the coast.
Replacement Cost (RC)
Services that can be replaced with man-made systems; e.g. nutrient cycling waste treatment provided by wetlands can be replaced with costly treatment systems.
Factor income (FI)
Services that provide for the enhancement of incomes; e.g. water quality improvements increase commercial fisheries and the incomes of fishing communities.
Travel Cost (TC)
Service demand may require travel, which has costs that can reflect the implied value of the service; e.g. recreation areas can be valued at least by what visitors are willing to pay to travel to it, including the imputed value of their time.
Hedonic Pricing (HP)
Service demand may be reflected in the prices people will pay for associated goods, e.g. housing prices along the coastline tend to exceed the prices of inland homes.
Marginal Product Estimation
(MP)
Service demand is generated in a dynamic modeling environment using a production function (Cobb-Douglas) to estimate the change in the value of outputs in response to a change in material inputs.
Contingent Valuation
(CV)
Service demand may be elicited by posing hypothetical scenarios that involve some valuation of alternatives; e.g. people generally state that they are willing to pay for increased preservation of beaches and shoreline.
Group Valuation (GV)
This approach is based on principles of deliberative democracy and the assumption that public decision making should result, not from the aggregation of separately measured individual preferences, but from open public debate.
Adapted from Farber et al., 200621
The greatest challenge to the valuation of environmental benefits is the lack of primary valuation studies. For example, despite the obvious and critical importance of aquifers to California’s water supply, an economic valuation of aquifers in California has yet to be conducted. Similarly, not all ecosystem services identified as having economic value have been valued within the Rim Fire areas. Some land covers have few ecosystem services values available. For example, the land cover class “grassland” has only been valued for three ecosystem services: air quality, pollination, and aesthetic information. Yet areas with grasslands also provide biological control, flood risk reduction, and other important benefits.
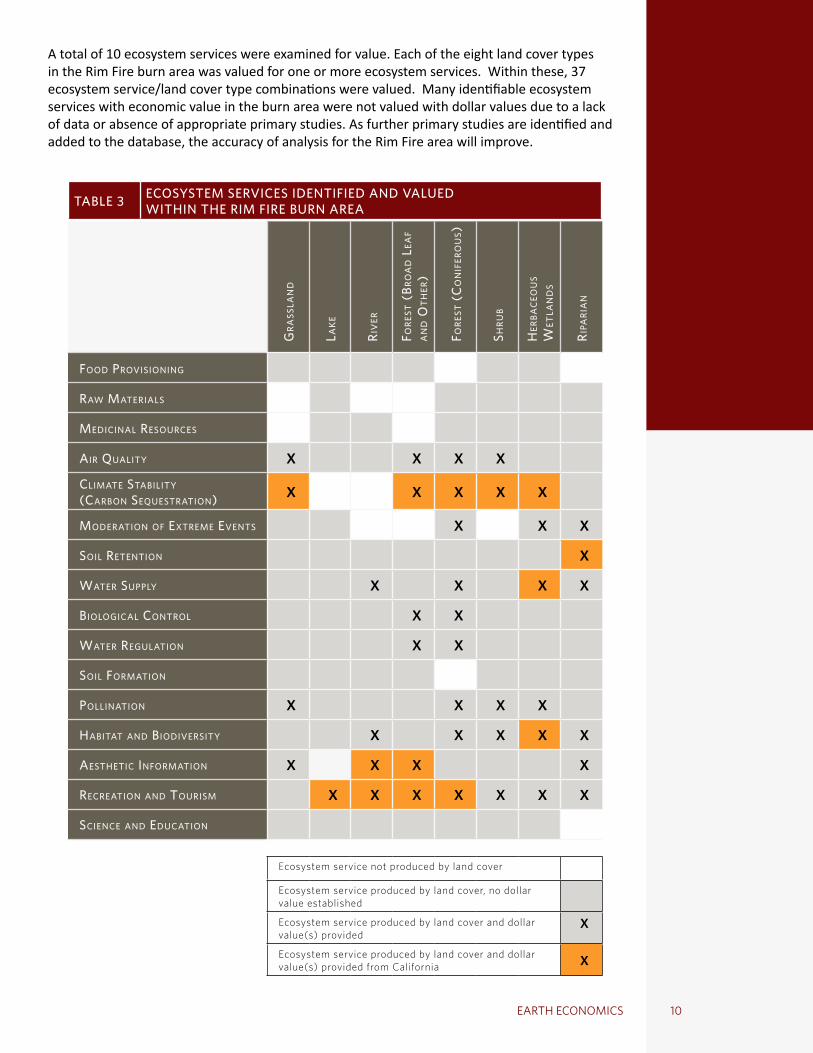
Table 3 provides a matrix that summarizes the suite of ecosystem services that were identified on each land cover within Rim Fire, and those for which values could be derived for this study. White boxes indicate that an ecosystem service is not present. Green boxes show that an ecosystem service is present, but may not have an existing or appropriate economic valuation study to provide dollar values. Boxes marked with an “X” indicate ecosystem services that have dollar valuations. Purple boxes show that the ecosystem service is present and the economic value was derived from California.
10EARTH ECONOMICS
A total of 10 ecosystem services were examined for value. Each of the eight land cover types in the Rim Fire burn area was valued for one or more ecosystem services. Within these, 37 ecosystem service/land cover type combinations were valued. Many identifiable ecosystem services with economic value in the burn area were not valued with dollar values due to a lack of data or absence of appropriate primary studies. As further primary studies are identified and added to the database, the accuracy of analysis for the Rim Fire area will improve.
TABLE 3 ECOSYSTEM SERVICES IDENTIFIED AND VALUED WITHIN THE RIM FIRE BURN AREA
gra
ssla
nd
lak
e
riv
er
fore
st (
Bro
ad
lea
f a
nd
ot
her
)
fore
st (c
on
ifer
ou
s)
shru
B
her
Bac
eou
s w
etla
nd
s
riPa
ria
n
food Provisioning
raw materials
medicinal resources
air Quality X X X X
climate staBility (carBon seQuestration) X X X X X
moderation of extreme events X X X
soil retention X
water suPPly X X X X
Biological control X X
water regulation X X
soil formation
Pollination X X X X
haBitat and Biodiversity X X X X X
aesthetic information X X X X
recreation and tourism X X X X X X X
science and education
Ecosystem service not produced by land cover
Ecosystem service produced by land cover, no dollar value established
Ecosystem service produced by land cover and dollar value(s) provided
X
Ecosystem service produced by land cover and dollar value(s) provided from California X
THE ECONOMIC IMPACT OF THE 2013 RIM FIRE ON NATURAL LANDSPreliminary assessment
11
4.4. annual value of environmental Benefits Before the rim fire
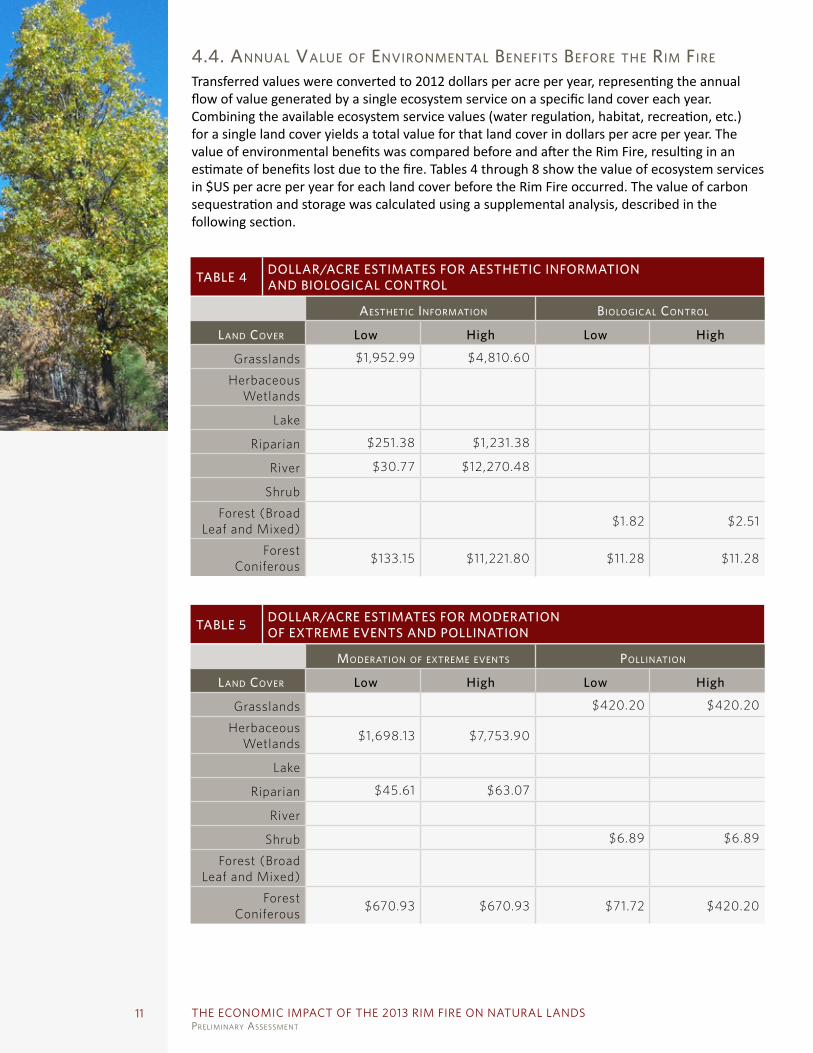
Transferred values were converted to 2012 dollars per acre per year, representing the annual flow of value generated by a single ecosystem service on a specific land cover each year. Combining the available ecosystem service values (water regulation, habitat, recreation, etc.) for a single land cover yields a total value for that land cover in dollars per acre per year. The value of environmental benefits was compared before and after the Rim Fire, resulting in an estimate of benefits lost due to the fire. Tables 4 through 8 show the value of ecosystem services in $US per acre per year for each land cover before the Rim Fire occurred. The value of carbon sequestration and storage was calculated using a supplemental analysis, described in the following section.
TABLE 5 DOLLAR/ACRE ESTIMATES FOR MODERATION OF EXTREME EVENTS AND POLLINATION
moderation of extreme events Pollination
land cover Low High Low High
Grasslands $420.20 $420.20
Herbaceous Wetlands $1,698.13 $7,753.90
Lake
Riparian $45.61 $63.07
River
Shrub $6.89 $6.89
Forest (Broad Leaf and Mixed)
Forest Coniferous $670.93 $670.93 $71.72 $420.20
TABLE 4 DOLLAR/ACRE ESTIMATES FOR AESTHETIC INFORMATION AND BIOLOGICAL CONTROL
aesthetic information Biological control
land cover Low High Low High
Grasslands $1,952.99 $4,810.60
Herbaceous Wetlands
Lake
Riparian $251.38 $1,231.38
River $30.77 $12,270.48
Shrub
Forest (Broad Leaf and Mixed) $1.82 $2.51
Forest Coniferous $133.15 $11,221.80 $11.28 $11.28
12EARTH ECONOMICS
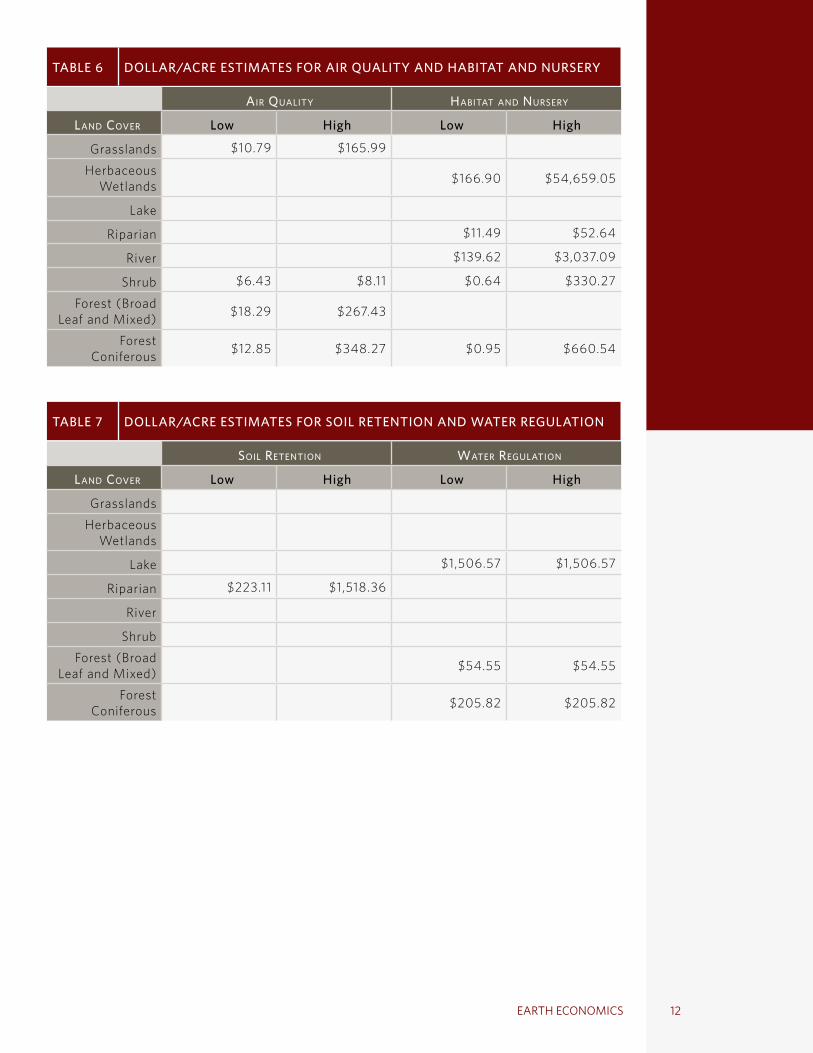
TABLE 6 DOLLAR/ACRE ESTIMATES FOR AIR QUALITY AND HABITAT AND NURSERY
air Quality haBitat and nursery
land cover Low High Low High
Grasslands $10.79 $165.99
Herbaceous Wetlands $166.90 $54,659.05
Lake
Riparian $11.49 $52.64
River $139.62 $3,037.09
Shrub $6.43 $8.11 $0.64 $330.27
Forest (Broad Leaf and Mixed) $18.29 $267.43
Forest Coniferous $12.85 $348.27 $0.95 $660.54
TABLE 7 DOLLAR/ACRE ESTIMATES FOR SOIL RETENTION AND WATER REGULATION
soil retention water regulation
land cover Low High Low High
Grasslands
Herbaceous Wetlands
Lake $1,506.57 $1,506.57
Riparian $223.11 $1,518.36
River
Shrub
Forest (Broad Leaf and Mixed) $54.55 $54.55
Forest Coniferous $205.82 $205.82
THE ECONOMIC IMPACT OF THE 2013 RIM FIRE ON NATURAL LANDSPreliminary assessment
13
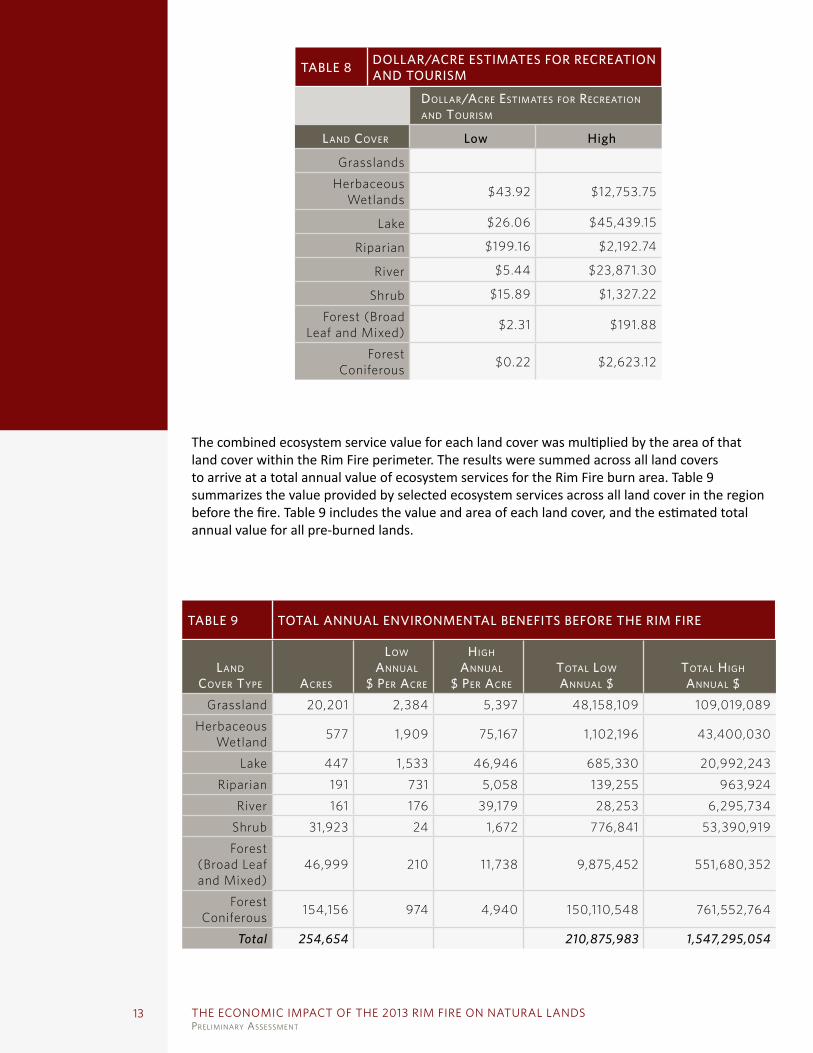
TABLE 8 DOLLAR/ACRE ESTIMATES FOR RECREATION AND TOURISM
dollar/acre estimates for recreation and tourism
land cover Low High
Grasslands
Herbaceous Wetlands $43.92 $12,753.75
Lake $26.06 $45,439.15
Riparian $199.16 $2,192.74
River $5.44 $23,871.30
Shrub $15.89 $1,327.22
Forest (Broad Leaf and Mixed) $2.31 $191.88
Forest Coniferous $0.22 $2,623.12
TABLE 9 TOTAL ANNUAL ENVIRONMENTAL BENEFITS BEFORE THE RIM FIRE
land cover tyPe acres
low annual
$ Per acre
high annual
$ Per acre
total low annual $
total high annual $
Grassland 20,201 2,384 5,397 48,158,109 109,019,089
Herbaceous Wetland 577 1,909 75,167 1,102,196 43,400,030
Lake 447 1,533 46,946 685,330 20,992,243
Riparian 191 731 5,058 139,255 963,924
River 161 176 39,179 28,253 6,295,734
Shrub 31,923 24 1,672 776,841 53,390,919
Forest (Broad Leaf and Mixed)
46,999 210 11,738 9,875,452 551,680,352
Forest Coniferous 154,156 974 4,940 150,110,548 761,552,764
Total 254,654 210,875,983 1,547,295,054
The combined ecosystem service value for each land cover was multiplied by the area of that land cover within the Rim Fire perimeter. The results were summed across all land covers to arrive at a total annual value of ecosystem services for the Rim Fire burn area. Table 9 summarizes the value provided by selected ecosystem services across all land cover in the region before the fire. Table 9 includes the value and area of each land cover, and the estimated total annual value for all pre-burned lands.
14EARTH ECONOMICS
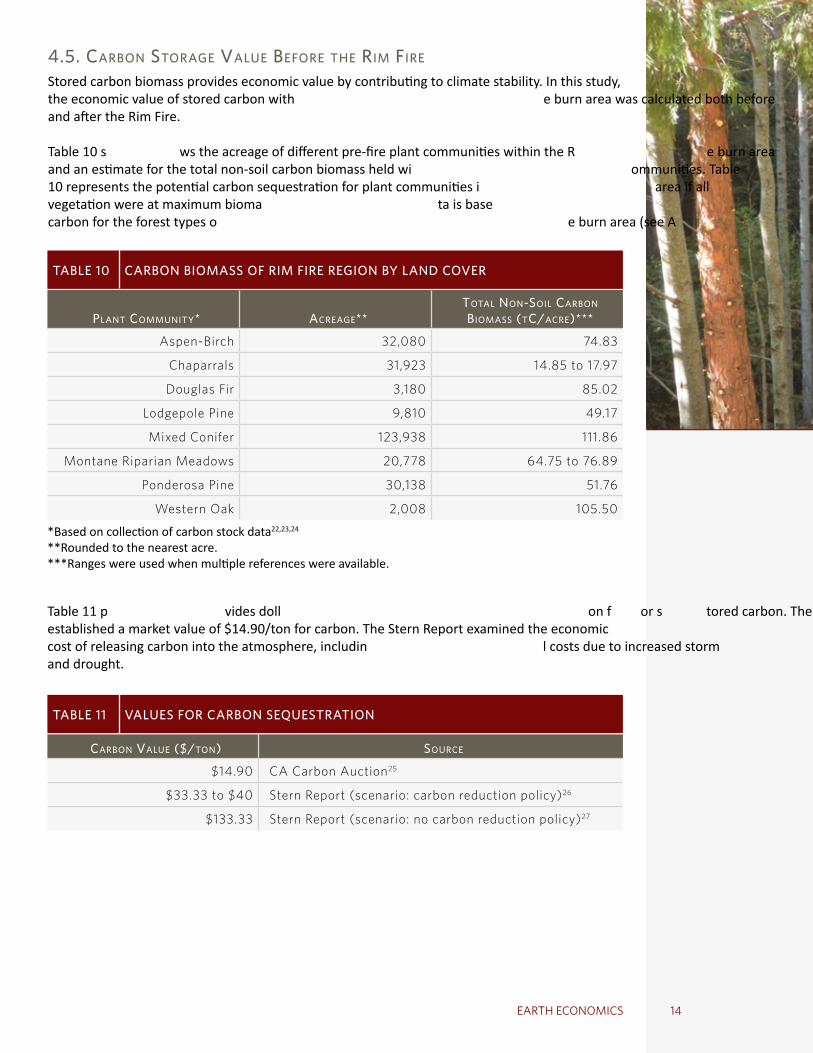
TABLE 10 CARBON BIOMASS OF RIM FIRE REGION BY LAND COVER
Plant community* acreage**total non-soil carBon Biomass (tc/acre)***
Aspen-Birch 32,080 74.83
Chaparrals 31,923 14.85 to 17.97
Douglas Fir 3,180 85.02
Lodgepole Pine 9,810 49.17
Mixed Conifer 123,938 111.86
Montane Riparian Meadows 20,778 64.75 to 76.89
Ponderosa Pine 30,138 51.76
Western Oak 2,008 105.50
*Based on collection of carbon stock data22,23,24
**Rounded to the nearest acre.***Ranges were used when multiple references were available.
4.5. carBon storage value Before the rim fire
Stored carbon biomass provides economic value by contributing to climate stability. In this study, the economic value of stored carbon within the Rim Fire burn area was calculated both before and after the Rim Fire.
Table 10 shows the acreage of different pre-fire plant communities within the Rim Fire burn area and an estimate for the total non-soil carbon biomass held within those communities. Table 10 represents the potential carbon sequestration for plant communities in the burn area if all vegetation were at maximum biomass. This data is based on the USFS data and sources for forest carbon for the forest types occurring in the Rim Fire burn area (see Appendix 1).
Table 11 provides dollar values per ton for stored carbon. The California Carbon Auction established a market value of $14.90/ton for carbon. The Stern Report examined the economic cost of releasing carbon into the atmosphere, including the social costs due to increased storm and drought.
TABLE 11 VALUES FOR CARBON SEQUESTRATION
carBon value ($/ton) source
$14.90 CA Carbon Auction25
$33.33 to $40 Stern Report (scenario: carbon reduction policy)26
$133.33 Stern Report (scenario: no carbon reduction policy)27
THE ECONOMIC IMPACT OF THE 2013 RIM FIRE ON NATURAL LANDSPreliminary assessment
15
TABLE 12 TOTAL POTENTIAL VALUE OF NON-SOIL STORED CARBON BY LAND COVER
Plant community
total non-soil carBon Biomass
(tc/acre)*
value Per acre
Low High
Aspen-Birch 74.83 $1,114.91 $8,480.08
Chaparrals 14.85 to 17.97 $221.27 $2,036.54
Douglas Fir 85.02 $1,266.87 $9,635.83
Lodgepole Pine 49.17 $732.62 $5,572.36
Mixed Conifer 111.86 $1,666.64 $12,676.55
Montane Riparian Meadows 64.75 to 76.89 $964.78 $8,713.94
Ponderosa Pine 51.76 $771.21 $5,865.89
Western Oak 105.50 $1,571.97 $11,956.50
* Non-soil carbon biomass estimates are based on plant communities aged between 90 and 125 years.
TABLE 13 TREE SIZE STATISTICS
tree diameter acreage
Percent of total acreage
carBon stock caPacity
< 1" 5,642 2.20% 5%
1 - 6" 11,967 4.66% 20%
6 - 11" 33,888 13.20% 45%
11 - 24" 107,589 41.92% 90%
> 24" 50,927 19.84% 100%
NA 46,630 18.17% 50%
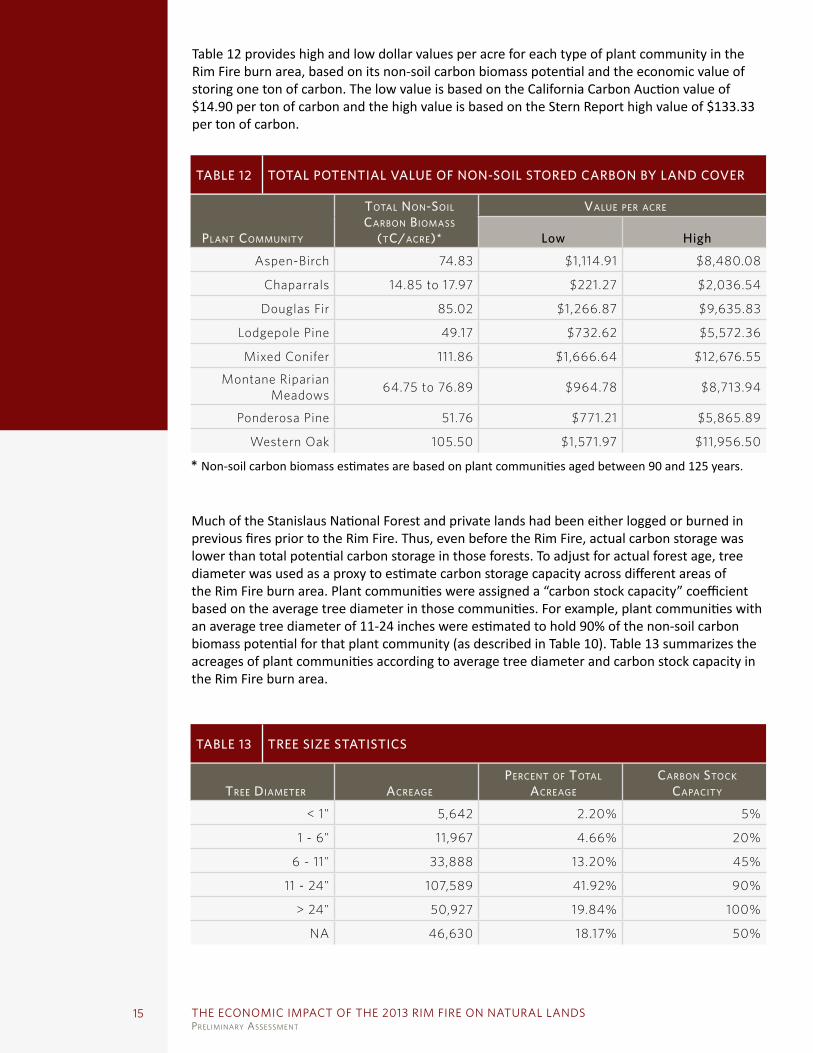
Table 12 provides high and low dollar values per acre for each type of plant community in the Rim Fire burn area, based on its non-soil carbon biomass potential and the economic value of storing one ton of carbon. The low value is based on the California Carbon Auction value of $14.90 per ton of carbon and the high value is based on the Stern Report high value of $133.33 per ton of carbon.
Much of the Stanislaus National Forest and private lands had been either logged or burned in previous fires prior to the Rim Fire. Thus, even before the Rim Fire, actual carbon storage was lower than total potential carbon storage in those forests. To adjust for actual forest age, tree diameter was used as a proxy to estimate carbon storage capacity across different areas of the Rim Fire burn area. Plant communities were assigned a “carbon stock capacity” coefficient based on the average tree diameter in those communities. For example, plant communities with an average tree diameter of 11-24 inches were estimated to hold 90% of the non-soil carbon biomass potential for that plant community (as described in Table 10). Table 13 summarizes the acreages of plant communities according to average tree diameter and carbon stock capacity in the Rim Fire burn area.
16EARTH ECONOMICS
TABLE 14 VALUE OF CARBON STOCK PRE-RIM FIRE (1/2)
Blm Private
land cover tyPe Low High Low High
Aspen-Birch $19,919 $151,502 $1,415,659 $10,767,556
Chaparrals $16,375 $150,720 $447,897 $4,122,479
Douglas Fir $0 $0 $37,190 $282,870
Lodgepole Pine $0 $0 $258,735 $1,967,946
Mixed Conifer $58,645 $446,058 $18,705,133 $142,271,996
Montane Riparian
Meadows$5,531 $49,956 $2,327,837 $21,025,257
Ponderosa Pine $0 $0 $4,743,567 $36,079,758
Western Oak $2,059 $15,659 $458,012 $3,483,657
$102,529 $813,895 $28,394,029 $220,001,519
TABLE 15 VALUE OF CARBON STOCK PRE-RIM FIRE (2/2)
snf ynP
land cover tyPe Low High Low High
Aspen-Birch $26,040,318 $198,063,707 $8,290,576 $63,058,456
Chaparrals $5,978,390 $55,025,558 $620,776 $5,713,674
Douglas Fir $75,538 $574,548 $3,915,483 $29,781,322
Lodgepole Pine $564,411 $4,292,934 $6,363,563 $48,401,520
Mixed Conifer $116,096,138 $883,031,902 $71,700,744 $545,358,749
Montane Riparian
Meadows$11,319,715 $102,240,790 $6,393,109 $57,743,195
Ponderosa Pine $15,267,984 $116,128,902 $3,231,561 $24,579,386
Western Oak $1,717,070 $13,060,102 $980,389 $7,456,878
$177,059,564 $1,372,418,443 $101,496,203 $782,093,181
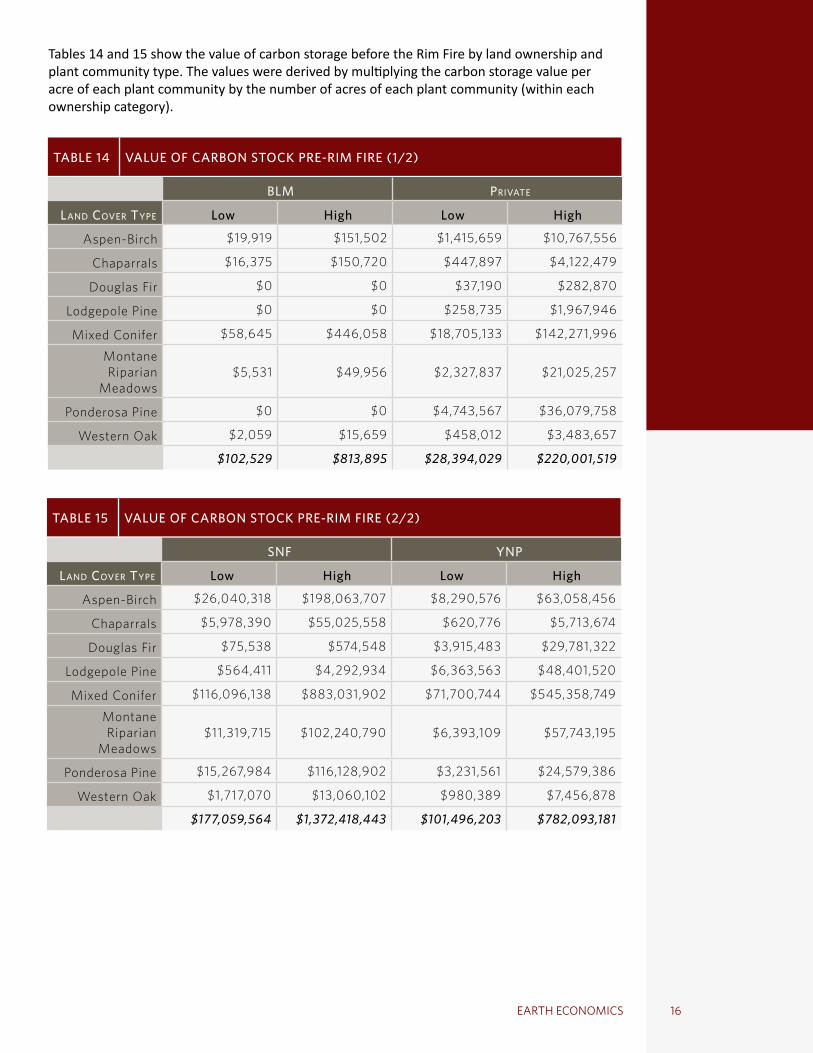
Tables 14 and 15 show the value of carbon storage before the Rim Fire by land ownership and plant community type. The values were derived by multiplying the carbon storage value per acre of each plant community by the number of acres of each plant community (within each ownership category).
THE ECONOMIC IMPACT OF THE 2013 RIM FIRE ON NATURAL LANDSPreliminary assessment
17
4.6. ProPerty values adjacent to the rim fire Burn area
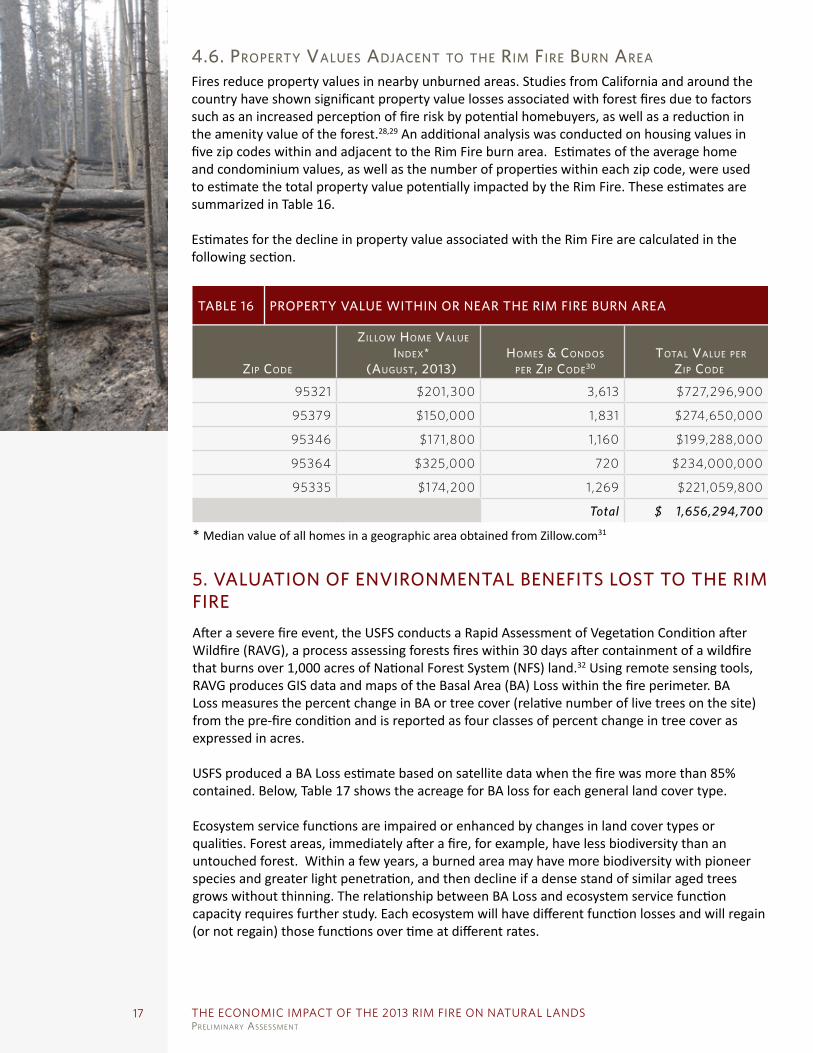
Fires reduce property values in nearby unburned areas. Studies from California and around the country have shown significant property value losses associated with forest fires due to factors such as an increased perception of fire risk by potential homebuyers, as well as a reduction in the amenity value of the forest.28,29 An additional analysis was conducted on housing values in five zip codes within and adjacent to the Rim Fire burn area. Estimates of the average home and condominium values, as well as the number of properties within each zip code, were used to estimate the total property value potentially impacted by the Rim Fire. These estimates are summarized in Table 16.
Estimates for the decline in property value associated with the Rim Fire are calculated in the following section.
TABLE 16 PROPERTY VALUE WITHIN OR NEAR THE RIM FIRE BURN AREA
ZiP code
Zillow home value index*
(august, 2013) homes & condos
Per ZiP code30 total value Per
ZiP code
95321 $201,300 3,613 $727,296,900
95379 $150,000 1,831 $274,650,000
95346 $171,800 1,160 $199,288,000
95364 $325,000 720 $234,000,000
95335 $174,200 1,269 $221,059,800
Total $ 1,656,294,700
* Median value of all homes in a geographic area obtained from Zillow.com31
5. VALUATION OF ENVIRONMENTAL BENEFITS LOST TO THE RIM FIREAfter a severe fire event, the USFS conducts a Rapid Assessment of Vegetation Condition after Wildfire (RAVG), a process assessing forests fires within 30 days after containment of a wildfire that burns over 1,000 acres of National Forest System (NFS) land.32 Using remote sensing tools, RAVG produces GIS data and maps of the Basal Area (BA) Loss within the fire perimeter. BA Loss measures the percent change in BA or tree cover (relative number of live trees on the site) from the pre-fire condition and is reported as four classes of percent change in tree cover as expressed in acres.
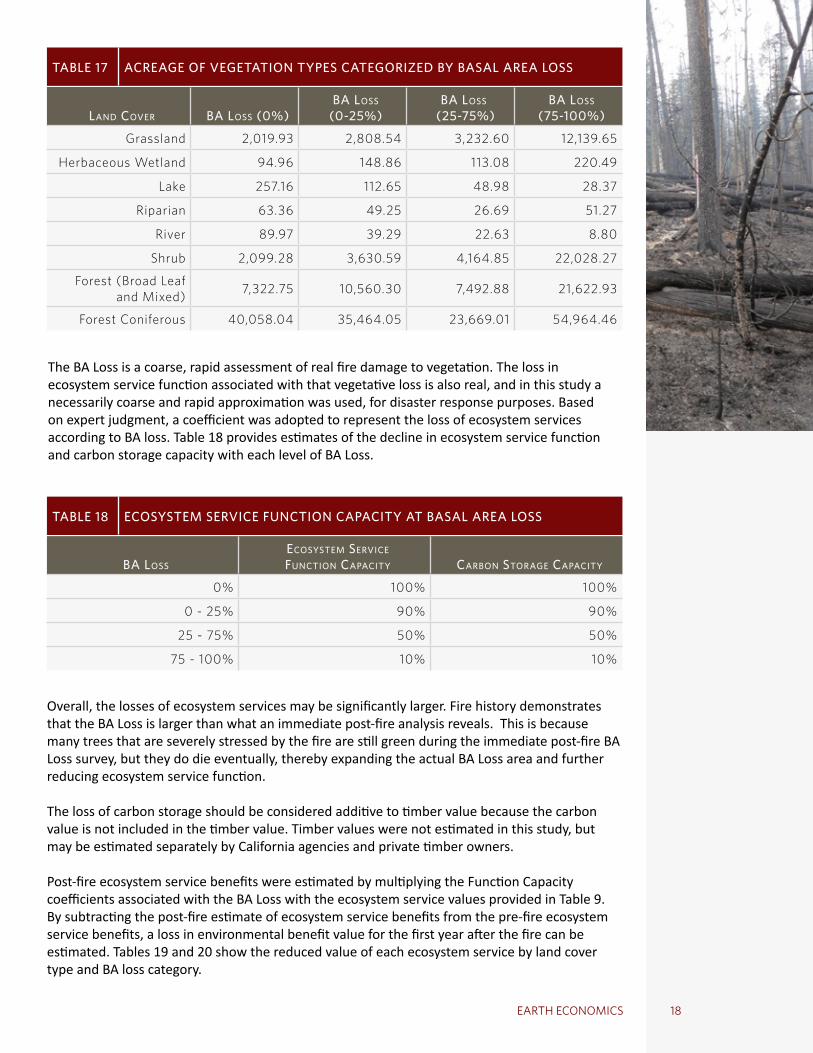
USFS produced a BA Loss estimate based on satellite data when the fire was more than 85% contained. Below, Table 17 shows the acreage for BA loss for each general land cover type.
Ecosystem service functions are impaired or enhanced by changes in land cover types or qualities. Forest areas, immediately after a fire, for example, have less biodiversity than an untouched forest. Within a few years, a burned area may have more biodiversity with pioneer species and greater light penetration, and then decline if a dense stand of similar aged trees grows without thinning. The relationship between BA Loss and ecosystem service function capacity requires further study. Each ecosystem will have different function losses and will regain (or not regain) those functions over time at different rates.
18EARTH ECONOMICS
TABLE 17 ACREAGE OF VEGETATION TYPES CATEGORIZED BY BASAL AREA LOSS
land cover Ba loss (0%)Ba loss
(0-25%)Ba loss
(25-75%)Ba loss
(75-100%)
Grassland 2,019.93 2,808.54 3,232.60 12,139.65
Herbaceous Wetland 94.96 148.86 113.08 220.49
Lake 257.16 112.65 48.98 28.37
Riparian 63.36 49.25 26.69 51.27
River 89.97 39.29 22.63 8.80
Shrub 2,099.28 3,630.59 4,164.85 22,028.27
Forest (Broad Leaf and Mixed) 7,322.75 10,560.30 7,492.88 21,622.93
Forest Coniferous 40,058.04 35,464.05 23,669.01 54,964.46
The BA Loss is a coarse, rapid assessment of real fire damage to vegetation. The loss in ecosystem service function associated with that vegetative loss is also real, and in this study a necessarily coarse and rapid approximation was used, for disaster response purposes. Based on expert judgment, a coefficient was adopted to represent the loss of ecosystem services according to BA loss. Table 18 provides estimates of the decline in ecosystem service function and carbon storage capacity with each level of BA Loss.
TABLE 18 ECOSYSTEM SERVICE FUNCTION CAPACITY AT BASAL AREA LOSS
Ba loss
ecosystem service function caPacity carBon storage caPacity
0% 100% 100%
0 - 25% 90% 90%
25 - 75% 50% 50%
75 - 100% 10% 10%
Overall, the losses of ecosystem services may be significantly larger. Fire history demonstrates that the BA Loss is larger than what an immediate post-fire analysis reveals. This is because many trees that are severely stressed by the fire are still green during the immediate post-fire BA Loss survey, but they do die eventually, thereby expanding the actual BA Loss area and further reducing ecosystem service function.
The loss of carbon storage should be considered additive to timber value because the carbon value is not included in the timber value. Timber values were not estimated in this study, but may be estimated separately by California agencies and private timber owners.
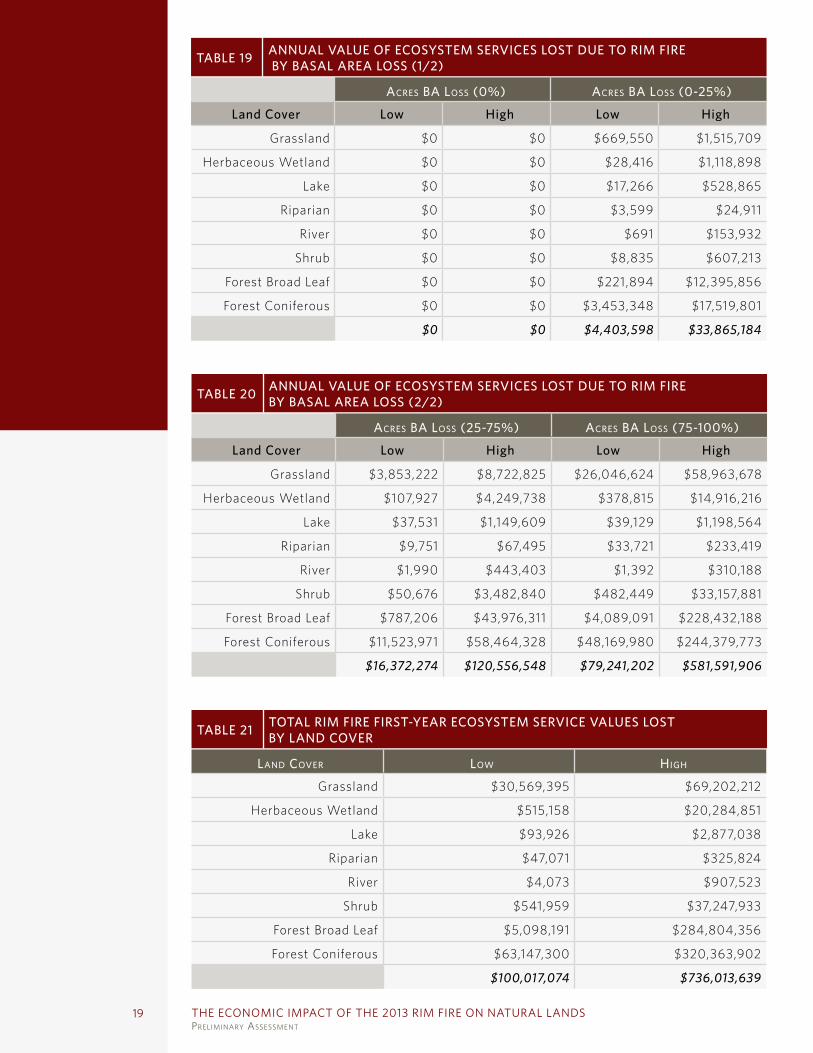
Post-fire ecosystem service benefits were estimated by multiplying the Function Capacity coefficients associated with the BA Loss with the ecosystem service values provided in Table 9. By subtracting the post-fire estimate of ecosystem service benefits from the pre-fire ecosystem service benefits, a loss in environmental benefit value for the first year after the fire can be estimated. Tables 19 and 20 show the reduced value of each ecosystem service by land cover type and BA loss category.
THE ECONOMIC IMPACT OF THE 2013 RIM FIRE ON NATURAL LANDSPreliminary assessment
19
TABLE 19 ANNUAL VALUE OF ECOSYSTEM SERVICES LOST DUE TO RIM FIRE BY BASAL AREA LOSS (1/2)
acres Ba loss (0%) acres Ba loss (0-25%)
Land Cover Low High Low High
Grassland $0 $0 $669,550 $1,515,709
Herbaceous Wetland $0 $0 $28,416 $1,118,898
Lake $0 $0 $17,266 $528,865
Riparian $0 $0 $3,599 $24,911
River $0 $0 $691 $153,932
Shrub $0 $0 $8,835 $607,213
Forest Broad Leaf $0 $0 $221,894 $12,395,856
Forest Coniferous $0 $0 $3,453,348 $17,519,801
$0 $0 $4,403,598 $33,865,184
TABLE 20 ANNUAL VALUE OF ECOSYSTEM SERVICES LOST DUE TO RIM FIREBY BASAL AREA LOSS (2/2)
acres Ba loss (25-75%) acres Ba loss (75-100%)
Land Cover Low High Low High
Grassland $3,853,222 $8,722,825 $26,046,624 $58,963,678
Herbaceous Wetland $107,927 $4,249,738 $378,815 $14,916,216
Lake $37,531 $1,149,609 $39,129 $1,198,564
Riparian $9,751 $67,495 $33,721 $233,419
River $1,990 $443,403 $1,392 $310,188
Shrub $50,676 $3,482,840 $482,449 $33,157,881
Forest Broad Leaf $787,206 $43,976,311 $4,089,091 $228,432,188
Forest Coniferous $11,523,971 $58,464,328 $48,169,980 $244,379,773
$16,372,274 $120,556,548 $79,241,202 $581,591,906
TABLE 21 TOTAL RIM FIRE FIRST-YEAR ECOSYSTEM SERVICE VALUES LOST BY LAND COVER
land cover low high
Grassland $30,569,395 $69,202,212
Herbaceous Wetland $515,158 $20,284,851
Lake $93,926 $2,877,038
Riparian $47,071 $325,824
River $4,073 $907,523
Shrub $541,959 $37,247,933
Forest Broad Leaf $5,098,191 $284,804,356
Forest Coniferous $63,147,300 $320,363,902
$100,017,074 $736,013,639
20EARTH ECONOMICS
BA losses were summed for each land cover to arrive at the estimated first-year losses of ecosystem service goods and services caused by the Rim Fire. Table 21 shows these estimated losses by land cover type.
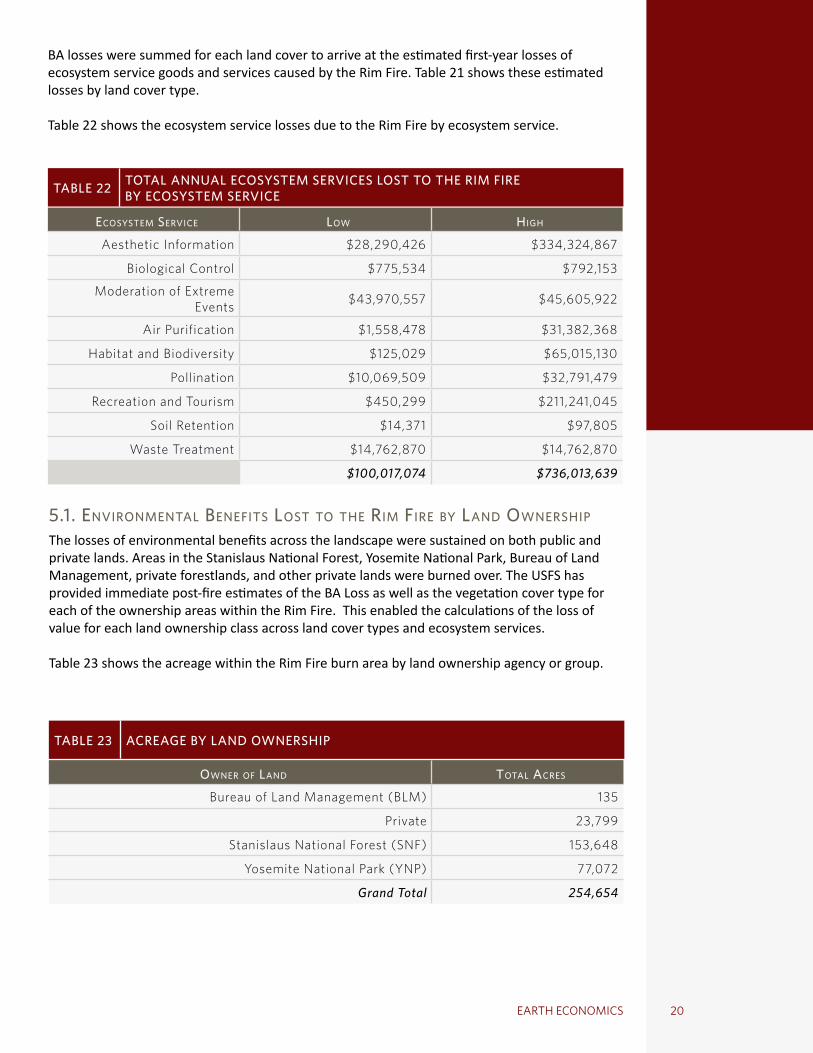
Table 22 shows the ecosystem service losses due to the Rim Fire by ecosystem service.
TABLE 22 TOTAL ANNUAL ECOSYSTEM SERVICES LOST TO THE RIM FIRE BY ECOSYSTEM SERVICE
ecosystem service low high
Aesthetic Information $28,290,426 $334,324,867
Biological Control $775,534 $792,153
Moderation of Extreme Events $43,970,557 $45,605,922
Air Purification $1,558,478 $31,382,368
Habitat and Biodiversity $125,029 $65,015,130
Pollination $10,069,509 $32,791,479
Recreation and Tourism $450,299 $211,241,045
Soil Retention $14,371 $97,805
Waste Treatment $14,762,870 $14,762,870
$100,017,074 $736,013,639
5.1. environmental Benefits lost to the rim fire By land ownershiP
The losses of environmental benefits across the landscape were sustained on both public and private lands. Areas in the Stanislaus National Forest, Yosemite National Park, Bureau of Land Management, private forestlands, and other private lands were burned over. The USFS has provided immediate post-fire estimates of the BA Loss as well as the vegetation cover type for each of the ownership areas within the Rim Fire. This enabled the calculations of the loss of value for each land ownership class across land cover types and ecosystem services.
Table 23 shows the acreage within the Rim Fire burn area by land ownership agency or group.
TABLE 23 ACREAGE BY LAND OWNERSHIP
owner of land total acres
Bureau of Land Management (BLM) 135
Private 23,799
Stanislaus National Forest (SNF) 153,648
Yosemite National Park (YNP) 77,072
Grand Total 254,654
THE ECONOMIC IMPACT OF THE 2013 RIM FIRE ON NATURAL LANDSPreliminary assessment
21
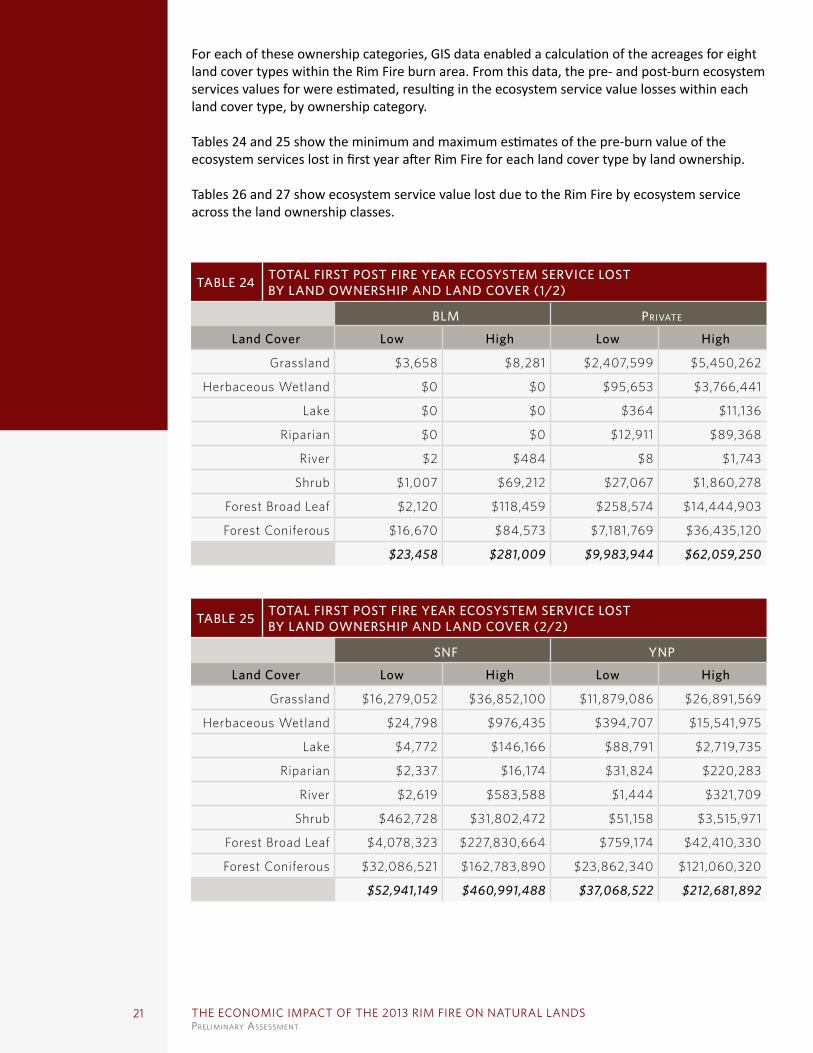
For each of these ownership categories, GIS data enabled a calculation of the acreages for eight land cover types within the Rim Fire burn area. From this data, the pre- and post-burn ecosystem services values for were estimated, resulting in the ecosystem service value losses within each land cover type, by ownership category.
Tables 24 and 25 show the minimum and maximum estimates of the pre-burn value of the ecosystem services lost in first year after Rim Fire for each land cover type by land ownership.
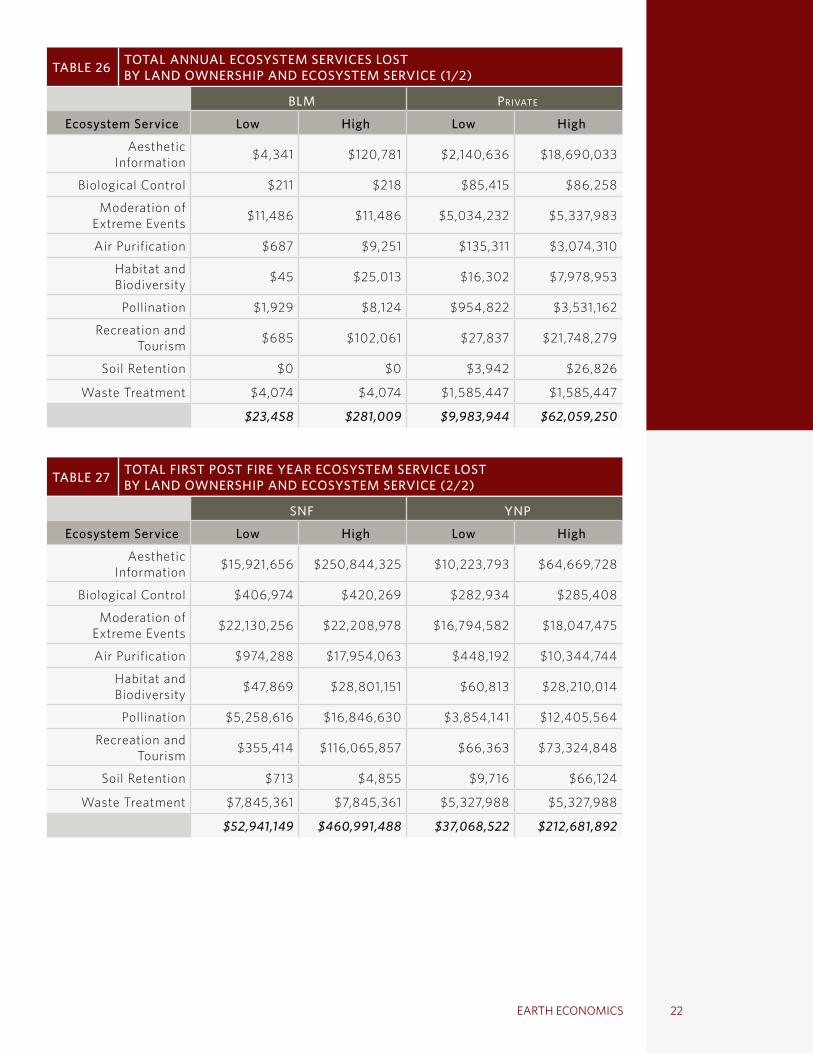
Tables 26 and 27 show ecosystem service value lost due to the Rim Fire by ecosystem service across the land ownership classes.
TABLE 24 TOTAL FIRST POST FIRE YEAR ECOSYSTEM SERVICE LOST BY LAND OWNERSHIP AND LAND COVER (1/2)
Blm Private
Land Cover Low High Low High
Grassland $3,658 $8,281 $2,407,599 $5,450,262
Herbaceous Wetland $0 $0 $95,653 $3,766,441
Lake $0 $0 $364 $11,136
Riparian $0 $0 $12,911 $89,368
River $2 $484 $8 $1,743
Shrub $1,007 $69,212 $27,067 $1,860,278
Forest Broad Leaf $2,120 $118,459 $258,574 $14,444,903
Forest Coniferous $16,670 $84,573 $7,181,769 $36,435,120
$23,458 $281,009 $9,983,944 $62,059,250
TABLE 25 TOTAL FIRST POST FIRE YEAR ECOSYSTEM SERVICE LOST BY LAND OWNERSHIP AND LAND COVER (2/2)
snf ynP
Land Cover Low High Low High
Grassland $16,279,052 $36,852,100 $11,879,086 $26,891,569
Herbaceous Wetland $24,798 $976,435 $394,707 $15,541,975
Lake $4,772 $146,166 $88,791 $2,719,735
Riparian $2,337 $16,174 $31,824 $220,283
River $2,619 $583,588 $1,444 $321,709
Shrub $462,728 $31,802,472 $51,158 $3,515,971
Forest Broad Leaf $4,078,323 $227,830,664 $759,174 $42,410,330
Forest Coniferous $32,086,521 $162,783,890 $23,862,340 $121,060,320
$52,941,149 $460,991,488 $37,068,522 $212,681,892
22EARTH ECONOMICS
TABLE 26 TOTAL ANNUAL ECOSYSTEM SERVICES LOST BY LAND OWNERSHIP AND ECOSYSTEM SERVICE (1/2)
Blm Private
Ecosystem Service Low High Low High
Aesthetic Information $4,341 $120,781 $2,140,636 $18,690,033
Biological Control $211 $218 $85,415 $86,258
Moderation of Extreme Events $11,486 $11,486 $5,034,232 $5,337,983
Air Purification $687 $9,251 $135,311 $3,074,310
Habitat and Biodiversity $45 $25,013 $16,302 $7,978,953
Pollination $1,929 $8,124 $954,822 $3,531,162
Recreation and Tourism $685 $102,061 $27,837 $21,748,279
Soil Retention $0 $0 $3,942 $26,826
Waste Treatment $4,074 $4,074 $1,585,447 $1,585,447
$23,458 $281,009 $9,983,944 $62,059,250
TABLE 27 TOTAL FIRST POST FIRE YEAR ECOSYSTEM SERVICE LOST BY LAND OWNERSHIP AND ECOSYSTEM SERVICE (2/2)
snf ynP
Ecosystem Service Low High Low High
Aesthetic Information $15,921,656 $250,844,325 $10,223,793 $64,669,728
Biological Control $406,974 $420,269 $282,934 $285,408
Moderation of Extreme Events $22,130,256 $22,208,978 $16,794,582 $18,047,475
Air Purification $974,288 $17,954,063 $448,192 $10,344,744
Habitat and Biodiversity $47,869 $28,801,151 $60,813 $28,210,014
Pollination $5,258,616 $16,846,630 $3,854,141 $12,405,564
Recreation and Tourism $355,414 $116,065,857 $66,363 $73,324,848
Soil Retention $713 $4,855 $9,716 $66,124
Waste Treatment $7,845,361 $7,845,361 $5,327,988 $5,327,988
$52,941,149 $460,991,488 $37,068,522 $212,681,892

THE ECONOMIC IMPACT OF THE 2013 RIM FIRE ON NATURAL LANDSPreliminary assessment
23
5.2. carBon storage value lost to the rim fire
Tables 28 and 29 show low and high estimates of the carbon storage value lost by land cover across the four land ownership classes. Total carbon storage losses are estimated at $102 million to $797 million.
TABLE 28 CARBON STORAGE LOST BY LAND COVER AND LAND OWNERSHIP
Blm Private
Land Cover Type Low High Low High
Aspen-Birch $4,985 $37,915 $466,311 $3,546,777
Chaparrals $6,743 $62,064 $181,240 $1,668,147
Douglas Fir $0 $0 $378 $2,876
Lodgepole Pine $0 $0 $86,633 $658,932
Mixed Conifer $25,142 $191,233 $6,211,438 $47,244,449
Montane Riparian Meadows $1,090 $9,847 $753,122 $6,802,277
Ponderosa Pine $0 $0 $1,561,224 $11,874,734
Western Oak $758 $5,766 $77,796 $591,721
$38,719 $306,825 $9,338,142 $72,389,913
TABLE 29 CARBON STORAGE LOST BY LAND COVER AND LAND OWNERSHIP
snf ynP
Land Cover Type Low High Low High
Aspen-Birch $10,859,965 $82,601,334 $2,419,439 $18,402,354
Chaparrals $3,098,397 $28,517,884 $342,548 $3,152,838
Douglas Fir $4,438 $33,754 $1,147,756 $8,729,880
Lodgepole Pine $245,673 $1,868,598 $1,732,824 $13,179,925
Mixed Conifer $34,915,402 $265,567,956 $21,766,041 $165,553,387
Montane Riparian Meadows $4,860,773 $43,902,982 $3,687,153 $33,302,735
Ponderosa Pine $5,551,090 $42,221,815 $1,578,446 $12,005,727
Western Oak $522,911 $3,977,281 $250,306 $1,903,839
$60,058,649 $468,691,604 $32,924,515 $256,230,686
24EARTH ECONOMICS
5.3. ProPerty value lost due to the rim fire
Fires cause home values to decline where the homes are near a burn area. Three studies provide California-based values and values outside of California showing the degree of house value declines related to wildfires. Property values in California were shown to decline between 3% and 16% following a fire. This literature and the values associated with each study (high and low) are shown in Table 30.
Using the average housing values for zip codes within or bordering the Rim Fire from Table 14, and the low and high home value declines from Table 30, total private property value reductions due to the Rim Fire were estimated and are provided in Table 29. Distance from the fire or viewshed of the fire influences the value decline.39
Table 31 shows substantial property value loss within Tuolumne County, which may be reflected in property assessment reductions and declines in property tax receipts for the County, State, and other tax districts.
5.4. value ranges
The range in values represents an appraisal of the natural capital value provided and lost by Yosemite National Park, the Stanislaus National Forest, Bureau of Land Management and private lands within the Rim Fire area. The range provided is wide, but will narrow as more detailed analysis of key ecosystem services, land cover types, and spatial mapping of the fire’s damage is completed.
TABLE 30 LITERATURE DEMONSTRATING THE IMPACT ON PROPERTY VALUESDUE TO A WILDFIRE
decline in housing value source
3.00% Price-Waterhouse Coopers, 200133
7.60% Stetler, et al. 201034
11.00% Price-Waterhouse Coopers, 200135
13.70% Stetler, et al. 201036
15.00% Loomis, J. 200437
16.00% Loomis, J. 200438
TABLE 31 PROPERTY VALUE REDUCTION DUE TO THE RIM FIRE
ProPerty value lost to fire
Total Value per Zip Code Low High
$727,296,900 $21,818,907 $116,367,504
$274,650,000 $8,239,500 $43,944,000
$199,288,000 $5,978,640 $31,886,080
$234,000,000 $7,020,000 $37,440,000
$221,059,800 $6,631,794 $35,369,568
$1,656,294,700 $49,688,841 $265,007,152

THE ECONOMIC IMPACT OF THE 2013 RIM FIRE ON NATURAL LANDSPreliminary assessment
25
The low end of the ecosystem service ranges in this study can be considered as “below the basement” baseline value, an underestimate of the true value, because while up to 20 known ecosystem services for each land cover were identified, only between 2 - 10 of the services could be valued for each land cover type. Due to a lack of valuation studies, some highly valuable ecosystem services were not valued. For example, the storage value of ice and snowpack – which is critically valuable for water supply, energy generation, and timing of water release in the dry summer – is not included.
6. CONCLUSIONS The immediate damage caused by the Rim Fire is estimated at between $100 million and $736 million to environmental benefits for the first year after the fire. This is based on satellite data for the fire perimeter and tree damage that were accessed by Earth Economics on September 17, 2013 when the fire was 84% contained. These estimated losses for the first year after the fire amount to nearly half of the pre-fire annual value. These are preliminary values that were developed while the fire was still burning. The fire burn perimeter was then estimated at over 250,000 acres, but both the burn area and subsequent damages have grown larger. The range in values represents the lowest and highest appropriate values in the academic peer reviewed literature for each category of environmental benefit. This is an appraisal of natural capital before and after the Rim Fire, similar to a house appraisal before and after a fire or flood.
This study provides the monetary value of 10 out of 18 environmental benefits or ecosystem services that were identified within the burn area as having economic value. One or more ecosystem services were valued for each of the eight land cover types that were burned by the fire. The natural benefits valued include air quality, carbon sequestration, moderation of extreme events, soil retention, biological control, water regulation, pollination, habitat and biodiversity, property and aesthetic values and recreational values. The land cover types include: grassland/meadow, herbaceous wetland, shrub, river, lake, riparian, forest broad leaf and mixed forest, and coniferous forest.
A benefit transfer methodology was applied to estimate the total ecosystem service value loss before and after the Rim Fire. Benefit Transfer Methodology is a federally-accepted economic valuation methodology that utilizes previous valuation studies of similar goods or services in comparable locations. These valuation studies each utilize one of eight primary valuation techniques, which include market pricing, cost avoidance, replacement costs, travel cost and contingent valuation. Inherent uncertainty exists, and because site specific studies for each ecosystem services would be cost prohibitive, the results of this valuation are characterized as a range of high and low values per-acre, based on the summation of up to 10 ecosystem service values across different vegetation types.
The Rim Fire impacted private and public assets, most significantly forests. This includes the Stanislaus National Forest, Yosemite National Park, private timberlands and Bureau of Land Management forestlands. National disaster declarations are based upon damage to non-federal lands and assets. The loss of environmental benefits is also estimated by land ownership category. Four land ownership categories were identified in the burn area: (1) Bureau of Land Management, (2) Private Lands, (3) Stanislaus National Forest, and (4) Yosemite National Park.
Environmental benefit losses for Private Lands within the Rim Fire perimeter was estimated at $10 million to $62 million, or about 10% of the total year 1 post-fire damages.
26EARTH ECONOMICS
In addition, private properties close to wildfires lose asset value (assessed property value) immediately after a wildfire. A supplemental analysis was conducted to estimate this loss of value, over and above the loss of environmental benefits. Applying previous estimates from the economic literature to property values in selected zip codes near the Rim Fire, the fire-related private property value loss is estimated at between $49.7 million and $265 million. These estimates imply (but do not include) associated declines in property taxes for local and state tax districts.
The Federal government recognizes the economic value of natural systems. The Federal Emergency Management Agency (FEMA) adopted Mitigation Policy FP-108-024-01, which provides explicit environmental benefits (ecosystem service) dollar values for use in all flood and hurricane disaster mitigation. This improvement in economic analysis saves significant amounts of taxpayer money. FEMA also conducted an analysis that showed 300% to 1,500% rate of return on one class of flood mitigation projects.
In 2013, the President’s Council on Environmental Quality also approved a new Principles and Requirements for Investments in Water Resources recognizing ecosystem service values in project benefit cost analysis. Also, the 2012 USFS has a new land-management planning rule, governing 155 National Forests, systematically includes ecosystem services with 72 ecosystem service references.
7. FUTURE RESEARCH This is a rapid assessment and valid for inclusion with the other estimates of Rim Fire disaster damages. However, these estimates should be considered preliminary findings. The analysis can be improved as further data about the Rim Fire becomes available.
Fires are becoming more common, larger and more costly. It is critically important to develop the economic analysis to value the fires that are beneficial to overall ecosystem health and to the long-run health of highly valuable services such as timber and water supply, carbon sequestration and recreation. Some recommendations for improvements are included below. 7.1. imProvement of california ecosystem service values
This draft analysis provides a first cut at valuation of ecosystem services for the burn area. More than 30 additional ecosystem service values, which are not included in this analysis, such as snowpack storage value, have no primary studies in California. Louisiana has more primary ecosystem service valuations than California, though the population and geography are significantly smaller, and is using those valuations in Mississippi River Delta to secure a larger scale of restoration ($50 billion). Other studies that are critical to economic development in California and the country include the impact of fire on water supply, quality, release timing, flow and temperature. Studies on soil retention for coniferous and broad leaf forests is highly valuable for water quality, reservoir storage space, slope stability and landslide prevention. Values for recreation in the Sierra Nevada are clearly higher than most mountainous areas in the country and need to be more closely calculated. These include hiking, biking, boating, swimming, hunting, fishing, bird watching, rafting, rafting kayaking, and more.
THE ECONOMIC IMPACT OF THE 2013 RIM FIRE ON NATURAL LANDSPreliminary assessment
27
7.2. incorPoration of historical fires and stand age data
Including the stand age, or tree girth as proxies for stand age, was roughly accomplished in this report. With more time, the inclusion of available data on stand age and tree girth will refine the analysis of this part of the study. In addition, each ecosystem service changes at different rates in service delivery with stand age and diversity. Understanding the science and economics of stand age on ecosystem service values can improve the pre and post fire estimate of ecosystem services. In addition, to calculate the impact on these benefits across time including a recovery curve for forests and their associated ecosystem services would provide a better estimate of future ecosystem flow impacts. It could also help in the calculation of a rate of return for investments in planting and restoration. Another aspect is including tree species diversity with stand age.
7.3. imPact on water suPPly, Quality, timing and reliaBility
Water is becoming a sharper constraint on development and ecosystem health in California. Because most of the precipitation in California falls in the north and east, resulting in little water for the rest of the state, the heavily populated south, west and arid Central Valley require water transfers. Californians have been willing to pay for increased reliability in water supplies and conservation for curbing demand.
Fire has a direct impact on water production and timing, though this impact has not been sufficiently studied. Due to the interplay between built capital and natural capital, the impact of fire may differ significantly between watersheds in California. It is almost certainly worth many tens of billions of dollars to improve our understanding of the science and economics of fires and their impacts on water, provided this is reflected in policy.
Rivers, streams and lakes provide a suite of valuable services to people and economies. This includes water conveyance, cooling, water regulation, and supply of water for drinking, irrigation, industry, salmon habitat and recreational opportunities. However, most of these services depend on the volume, timing and quality of the rivers. Once the Rim Fire’s impact on the watershed is better understood, local biophysical and economic data, along with Benefit Transfer Methodology can be used to better measure the impacts on a range of water-dependent ecosystem services.
The value for Californians of avoiding water shortages can also justify greater resources for forest management and restoration. A study for the California Urban Water Agencies (CUWA) in 1994 demonstrates the importance of this issue. Respondents to a contingent valuation survey administered to CUWA service areas in California were willing to pay large amounts to avoid even the smallest shortage scenarios. Willingness to pay to avoid water shortages ranged from $11.60 to $16.90 per month. These results also indicated that the respondents were willing to pay more in order to avoid larger or more frequent shortages.
7.4. imPact on snowPack and groundwater
The storage value of ice and snowpack, critically valuable for both water supply and energy generation, is not considered in this report. The Sierra Nevada ice and snowpack stores water in the wet winter and releases it in the late spring and early summer, providing value for drinking, agricultural and industrial water, hydroelectric power, flood control, recreation and salmon habitat. This study did not place a dollar value on the water storage value of snowpack, or the impacts of the Rim Fire on Sierra Nevada snowpack. One method for estimating the value of snow pack would be to utilize a replacement cost – the cost of replacing snowpack with additional manmade storage facilities (e.g. in $/acre foot of storage capacity).
28EARTH ECONOMICS
7.5. hydroPhoBic soils
One impact of a large fire is that the ash and soot creates a hydrophobic soil crust, which repels water, resulting in creating faster runoff and less water infiltration for later release from soils or infiltration into groundwater. This problem has caused tremendous costs in other areas, such as the eastern slope of the Rocky Mountains. There should be primary valuation studies completed on the physical influence of post-fire hydrophobic soils and the economic consequences of these physical impacts, but to date none exist.
7.6. imPact on recreation
The Stanislaus National Forest and Yosemite National Park draw millions of visitors each year, many for recreational activities as diverse as hiking, hunting, fishing, water activities, bicycling and horse riding.40 However, the Rim Fire has closed many areas of both parks to recreational activities. The Earth Economics database contains hundreds of values specific to recreational activities on federal lands. Once the impact of the Rim Fire on recreational visitor numbers becomes better known, estimates of the damage to the local economy and businesses could be calculated.
7.7. imPact on air Quality and human health
Damage to human health due to the scale of this forest fire and air pollution could be calculated as a further damage from the fire. This will require further data collection on the smoke plume and impacts on human health in communities close to the fire and in the Central Valley.
Advancing these areas of research would better equip local governments, utilities, counties, the State of California and federal agencies like the USFS and FEMA in setting both damage estimates for fires and investments which reduce fire impacts. For example, one study notes that: “A cost of illness estimate is $9.50 per exposed person per day. However, theory and empirical research consistently find that this measure largely underestimates the true economic cost of health effects from exposure to a pollutant in that it ignores the cost of defensive actions taken as well as disutility. For the first time, the defensive behavior method is applied to calculate the willingness to pay for a reduction in one wildfire smoke induced symptom day, which is estimated to be $84.42 per exposed person per day.”41
THE ECONOMIC IMPACT OF THE 2013 RIM FIRE ON NATURAL LANDSPreliminary assessment
29
REPORT REFERENCES1 FEMA. 2013. FEMA Mitigation Policy – FP-108-024-01, Consideration of Environmental Benefits in the Evaluation of Acquisition Projects under the Hazard Mitigation Assistance (HMA) Programs. Federal Emergency Management Agency.
2 President’s Council on Environmental Quality. March 2013. Principles and Requirements for Federal Investments in Water Resources. CEQ.
3 Federal Register. April 2012. Department of Agriculture Forest Service 36 CFR Part 219 RIN 0596-AD02 National Forest System Land Management Planning, Final Rule and Record of Decision. Federal Register/Vol 77, No. 68/ Monday, April 9, 2012/Rules and Regulations, page 21162.
4 US Forest Service. 2013. “Forest Service seeks public input on planning rule directives,” Accessed October 5, 2013, http://www.fs.fed.us/news/2013/releases/02/planning-rule.shtml
5 National Park Service. 2009. National Park Service, 2008 Director’s Report; U.S. Department of the Interior; Washington, D.C.; 2009
6 Cui, Yue, Ed Mahoney, and Teresa Herbowicz. United States. National Park Service, Department of the Interior. Economic Benefits to Local Communities from National Park Visitation, 2011. Washington, D.C.: 2013. Web.
7 FEMA. 2013. FEMA Mission. Available at: http://www.fema.gov/about-agency
8 Miksicek, C., Roper, K., Simons, D., Farquhar, J., Loeffler, K., Hall, J., Jackson, T.L., Jackson, R.J. 1996.Overview of the Prehistory of the Stanislaus National Forest. BioSystems Analysis. Available at http://www.fs.usda.gov/Internet/FSE_DOCUMENTS/fsm91_057359.pdf
9 Syphard, A.D., Radeloff, V.C., Keeley, J.E., Hawbaker, T.J., Clayton, M.K., Stewart, S.I., Hammer, R.B. 2007. Human Influence on California Fire Regimes. Ecological Applications. 17)5_. 1388-1402.
10 Tidwell, T. 2013. Wildland Fire Management. Committee on Natural Resources. USDA. Available at: http://www.energy.senate.gov/public/index.cfm/files/serve?File_id=e59df65c-09c6-4ffd-9a83-f61f2822a075
11 Climate Solutions. 2012. The Age of Western WildFires: Report Summary. Available at: http://www.climatecentral.org/news/report-the-age-of-western-wildfires-14873
12 Boxall, B. 2013. Rim fire taking ecological toll over thousands of acres. New York Times. August 26. Available at: http://articles.latimes.com/2013/aug/26/local/la-me-rim-effects-20130827
13 Yosemite National Park, National Park Service, 2013. Yosemite NP Rim Fire 2013 Burned Area Emergency Response Plan. Available at: http://www.nps.gov/yose/parkmgmt/upload/RIM_BAER_PLAN2013.pdf
14 CAL FIRE Fire and Resource Assessment Program. Available at: http://frap.fire.ca.gov/.
15 Miksicek, et al., 1996
16 Bureau of Economic Analysis, U.S. Department of Commerce, September 17, 2013. Economic growth widespread across metropolitan areas in 2012. Available at: http://www.bea.gov/newsreleases/regional/gdp_metro/2013/pdf/gdp_metro0913.pdf
30EARTH ECONOMICS
17 Erica Gies, “Agricultural Production in Central Valley Leaves Toxic Legacy for Locals.” Huffington Post, May 8, 2010. http://www.huffingtonpost.com/erica-gies/agricultural-production-i_b_568920.html
18 Brookshire, D.S., Neill, H.R., 1992. Benefit Transfers: Conceptual and Empirical Issues. Water Resources Research 28, 651-655. And Desvousges, W.H., Naughton, M.C., Parsons, G.R., 1992. Benefit transfer: conceptual problems estimating water quality benefits using existing studies. Water Resources Research 28.
19 Desvousges, W.H., Johnson, F.R., Banzhaf, H.S., 1998. Environmental Policy Analysis with Limited Information: Principles and Applications of the Transfer Method. Edward Elgar, Northhampon, MA.
20 Wilson, M., Hoehn, J., 2006. Valuing environmental goods and services using benefit-transfer: state-of-the-art and science. Ecological Economics 60, 335-342.
21 Farber et al., 2006. Linking Ecology and Economics for Ecosystem Management. Bioscience 56, 121-133.
22 Smith, J.E., Heath, L.S., Skog, K.E., Birdsey, R.A. 2006. Methods for Calculating Forest Ecosystem and Harvested Carbon with Standard Estimates for Forest Types of the United States.
23 Graham, R.C., Akers, S.C., Meixner, T., Wechsler, S.P. 2002. Fire and Terrain Controls on Soil Carbon in Chaparral Watersheds. Kearney Foundation of Soil Science: Soil Carbon and California’s Terrestrial Ecosystems. Final Report.
24 Norton, J.B., Jungst, L.J., Norton, N., Olsen, H.R., Tate, K.W., Horwath, W.R. 2001. Soil Carbon and Nitrogen Storage in Upper Montane Riparian Meadows. Ecosystems. 14.
25 Doan, L. 2013. California Carbon Permits Sell Above Expected Clearing Price. Bloomberg. February 22.
26 Nordhause, W. 2000. The Stern Review of the Economics of Climate Change. Available at: http://siteresources.worldbank.org/INTINDONESIA/Resources/226271-1170911056314/3428109-1174614780539/SternReviewEng.pdf
27 Nordhause, W. 2000. The Stern Review of the Economics of Climate Change. Available at: http://siteresources.worldbank.org/INTINDONESIA/Resources/226271-1170911056314/3428109-1174614780539/SternReviewEng.pdf
28 Loomis, J., 2004. Do nearby forest fires cause a reduction in residential property values? Journal of Forest Economics 10 (3), 149–157.
29 Price-Waterhouse Coopers, 2001. Economic study of the Los Alamos post fire residential real estate market. Prepared for the Federal Emergency. Management Agency by the Office of Cerro Grande Fire Claims, pp. 1–35.
30 Advameg. 2013. City-data. Available at: http://www.city-data.com/
31 Zillow. 2013. Available at: http://www.zillow.com/
32 United State Forest Service. 2013. Rapid Assessment of Vegetation Condition after Wildfire. Accessed at: http://www.fs.fed.us/postfirevegcondition/whatis.shtml
33 Price-Waterhouse Coopers, 2001. Economic study of the Los Alamos post fire residential real estate market. Prepared for the Federal Emergency. Management Agency by the Office of Cerro Grande Fire Claims, pp. 1–35.
THE ECONOMIC IMPACT OF THE 2013 RIM FIRE ON NATURAL LANDSPreliminary assessment
31
34 Stetler, K.M., Venn, T.J., Calkin D.E. 2010. The effects of wildfire and environmental amenities on property values in northwest Montana, USA. Ecological Economics. 69. 2233-2243.
35 Price-Waterhouse Coopers, 2001. Economic study of the Los Alamos post fire residential real estate market. Prepared for the Federal Emergency. Management Agency by the Office of Cerro Grande Fire Claims, pp. 1–35.
36 Stetler, K.M., Venn, T.J., Calkin D.E. 2010. The effects of wildfire and environmental amenities on property values in northwest Montana, USA. Ecological Economics. 69. 2233-2243.
37 Loomis, J., 2004. Do nearby forest fires cause a reduction in residential property values? Journal of Forest Economics 10 (3), 149–157.
38 Loomis, J., 2004. Do nearby forest fires cause a reduction in residential property values? Journal of Forest Economics 10 (3), 149–157.
39 Huggett, R.J. 2003. Fire in the Wildland Urban Interface: An Examination of the Effects
40 United State Department of Agriculture. 2013. Recreation. Available at: http://www.fs.usda.gov/recmain/stanislaus/recreation
41 Richardson, L., Champ, P.A., Loomis, J.B. 2012. The hidden cost of wildfires: Economic valuation of health effects of wildfire smoke exposure in Southern California. Journal of Forest Economics. 18. (14-35).
42 United States Forest Service. 2009. Calveg/CWHR Xwalk. Available at: http://www.fs.fed.us/r5/rsl/projects/classification/cv-cwhr-xwalk.html
43 Roy Wright, August, 2013. Cost Effectiveness Determinations for Acquisitions and Elevations in Special Flood Hazard Areas. Federal Emergency Management Agency.
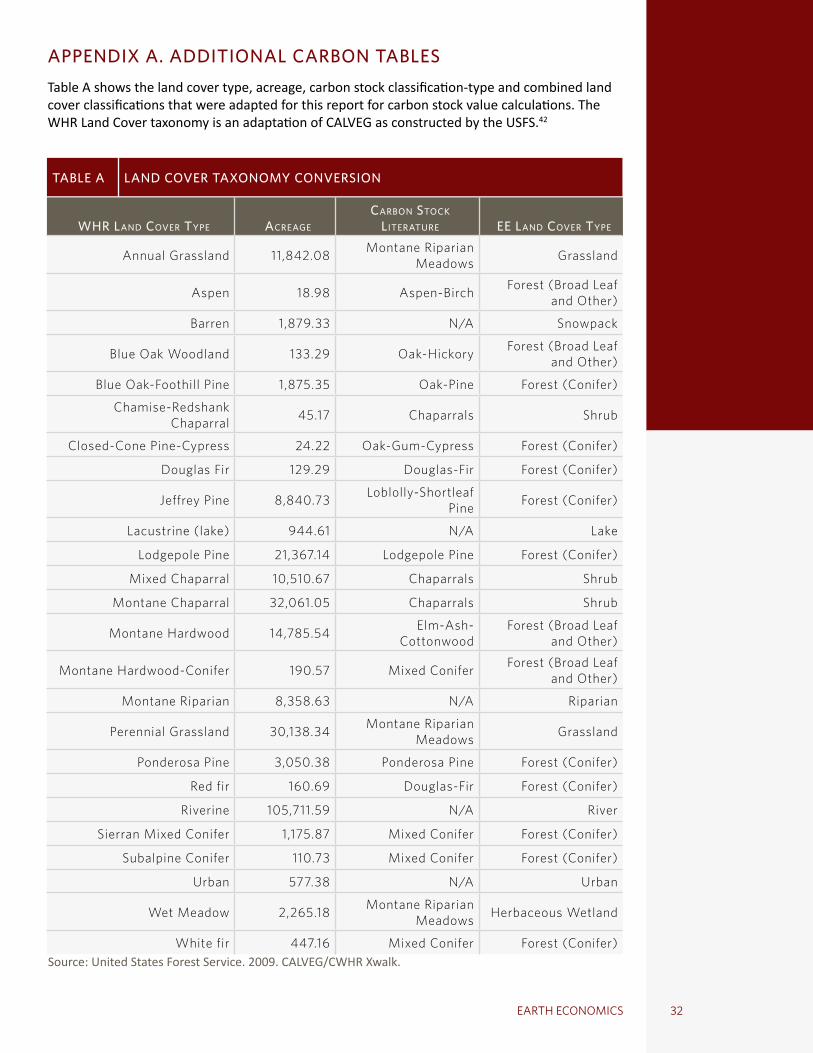
32EARTH ECONOMICS
APPENDIX A. ADDITIONAL CARBON TABLESTable A shows the land cover type, acreage, carbon stock classification-type and combined land cover classifications that were adapted for this report for carbon stock value calculations. The WHR Land Cover taxonomy is an adaptation of CALVEG as constructed by the USFS.42
TABLE A LAND COVER TAXONOMY CONVERSION
whr land cover tyPe acreage
carBon stock literature ee land cover tyPe
Annual Grassland 11,842.08 Montane Riparian Meadows Grassland
Aspen 18.98 Aspen-Birch Forest (Broad Leaf and Other)
Barren 1,879.33 N/A Snowpack
Blue Oak Woodland 133.29 Oak-Hickory Forest (Broad Leaf and Other)
Blue Oak-Foothill Pine 1,875.35 Oak-Pine Forest (Conifer)
Chamise-Redshank Chaparral 45.17 Chaparrals Shrub
Closed-Cone Pine-Cypress 24.22 Oak-Gum-Cypress Forest (Conifer)
Douglas Fir 129.29 Douglas-Fir Forest (Conifer)
Jeffrey Pine 8,840.73 Loblolly-Shortleaf Pine Forest (Conifer)
Lacustrine (lake) 944.61 N/A Lake
Lodgepole Pine 21,367.14 Lodgepole Pine Forest (Conifer)
Mixed Chaparral 10,510.67 Chaparrals Shrub
Montane Chaparral 32,061.05 Chaparrals Shrub
Montane Hardwood 14,785.54 Elm-Ash-Cottonwood
Forest (Broad Leaf and Other)
Montane Hardwood-Conifer 190.57 Mixed Conifer Forest (Broad Leaf and Other)
Montane Riparian 8,358.63 N/A Riparian
Perennial Grassland 30,138.34 Montane Riparian Meadows Grassland
Ponderosa Pine 3,050.38 Ponderosa Pine Forest (Conifer)
Red fir 160.69 Douglas-Fir Forest (Conifer)
Riverine 105,711.59 N/A River
Sierran Mixed Conifer 1,175.87 Mixed Conifer Forest (Conifer)
Subalpine Conifer 110.73 Mixed Conifer Forest (Conifer)
Urban 577.38 N/A Urban
Wet Meadow 2,265.18 Montane Riparian Meadows Herbaceous Wetland
White fir 447.16 Mixed Conifer Forest (Conifer)Source: United States Forest Service. 2009. CALVEG/CWHR Xwalk.
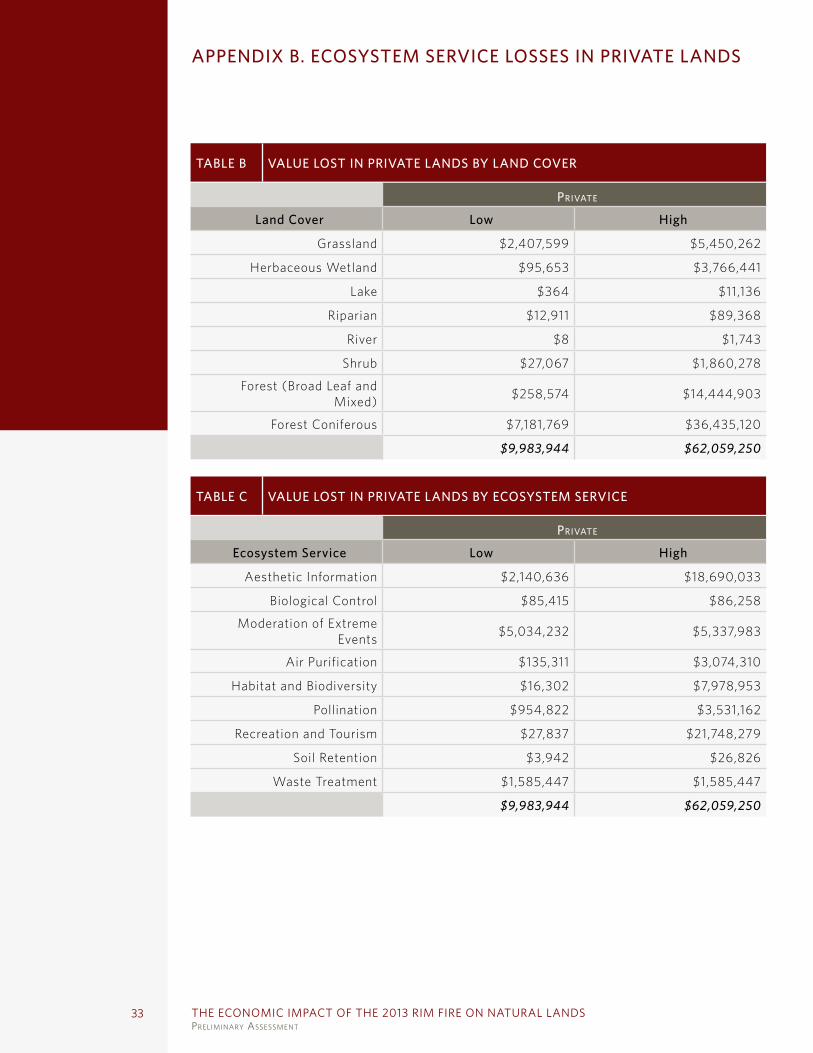
THE ECONOMIC IMPACT OF THE 2013 RIM FIRE ON NATURAL LANDSPreliminary assessment
33
APPENDIX B. ECOSYSTEM SERVICE LOSSES IN PRIVATE LANDS
TABLE B VALUE LOST IN PRIVATE LANDS BY LAND COVER
Private
Land Cover Low High
Grassland $2,407,599 $5,450,262
Herbaceous Wetland $95,653 $3,766,441
Lake $364 $11,136
Riparian $12,911 $89,368
River $8 $1,743
Shrub $27,067 $1,860,278
Forest (Broad Leaf and Mixed) $258,574 $14,444,903
Forest Coniferous $7,181,769 $36,435,120
$9,983,944 $62,059,250
TABLE C VALUE LOST IN PRIVATE LANDS BY ECOSYSTEM SERVICE
Private
Ecosystem Service Low High
Aesthetic Information $2,140,636 $18,690,033
Biological Control $85,415 $86,258
Moderation of Extreme Events $5,034,232 $5,337,983
Air Purification $135,311 $3,074,310
Habitat and Biodiversity $16,302 $7,978,953
Pollination $954,822 $3,531,162
Recreation and Tourism $27,837 $21,748,279
Soil Retention $3,942 $26,826
Waste Treatment $1,585,447 $1,585,447
$9,983,944 $62,059,250
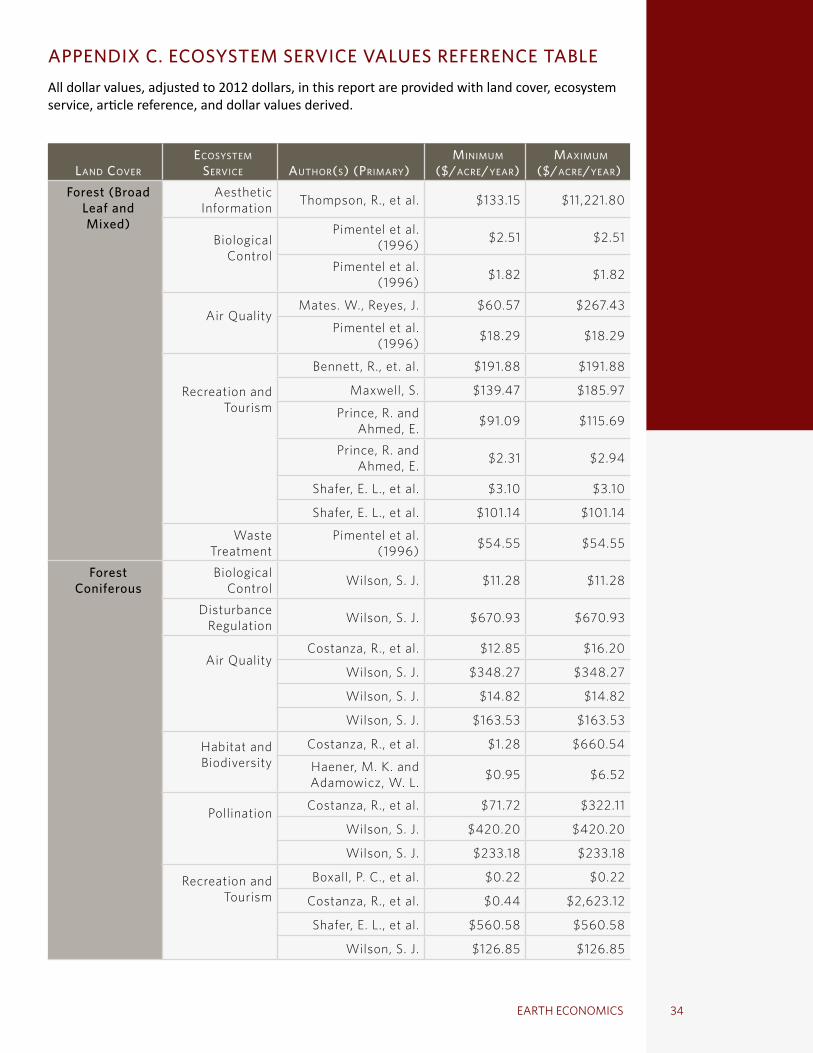
34EARTH ECONOMICS
APPENDIX C. ECOSYSTEM SERVICE VALUES REFERENCE TABLEAll dollar values, adjusted to 2012 dollars, in this report are provided with land cover, ecosystem service, article reference, and dollar values derived.
land cover
ecosystem service author(s) (Primary)
minimum ($/acre/year)
maximum ($/acre/year)
Forest (Broad Leaf and Mixed)
Aesthetic Information Thompson, R., et al. $133.15 $11,221.80
Biological Control
Pimentel et al. (1996) $2.51 $2.51
Pimentel et al. (1996) $1.82 $1.82
Air Quality
Mates. W., Reyes, J. $60.57 $267.43
Pimentel et al. (1996) $18.29 $18.29
Recreation and Tourism
Bennett, R., et. al. $191.88 $191.88
Maxwell, S. $139.47 $185.97
Prince, R. and Ahmed, E. $91.09 $115.69
Prince, R. and Ahmed, E. $2.31 $2.94
Shafer, E. L., et al. $3.10 $3.10
Shafer, E. L., et al. $101.14 $101.14
Waste Treatment
Pimentel et al. (1996) $54.55 $54.55
Forest Coniferous
Biological Control Wilson, S. J. $11.28 $11.28
Disturbance Regulation Wilson, S. J. $670.93 $670.93
Air Quality
Costanza, R., et al. $12.85 $16.20
Wilson, S. J. $348.27 $348.27
Wilson, S. J. $14.82 $14.82
Wilson, S. J. $163.53 $163.53
Habitat and Biodiversity
Costanza, R., et al. $1.28 $660.54
Haener, M. K. and Adamowicz, W. L. $0.95 $6.52
Pollination
Costanza, R., et al. $71.72 $322.11
Wilson, S. J. $420.20 $420.20
Wilson, S. J. $233.18 $233.18
Recreation and Tourism
Boxall, P. C., et al. $0.22 $0.22
Costanza, R., et al. $0.44 $2,623.12
Shafer, E. L., et al. $560.58 $560.58
Wilson, S. J. $126.85 $126.85
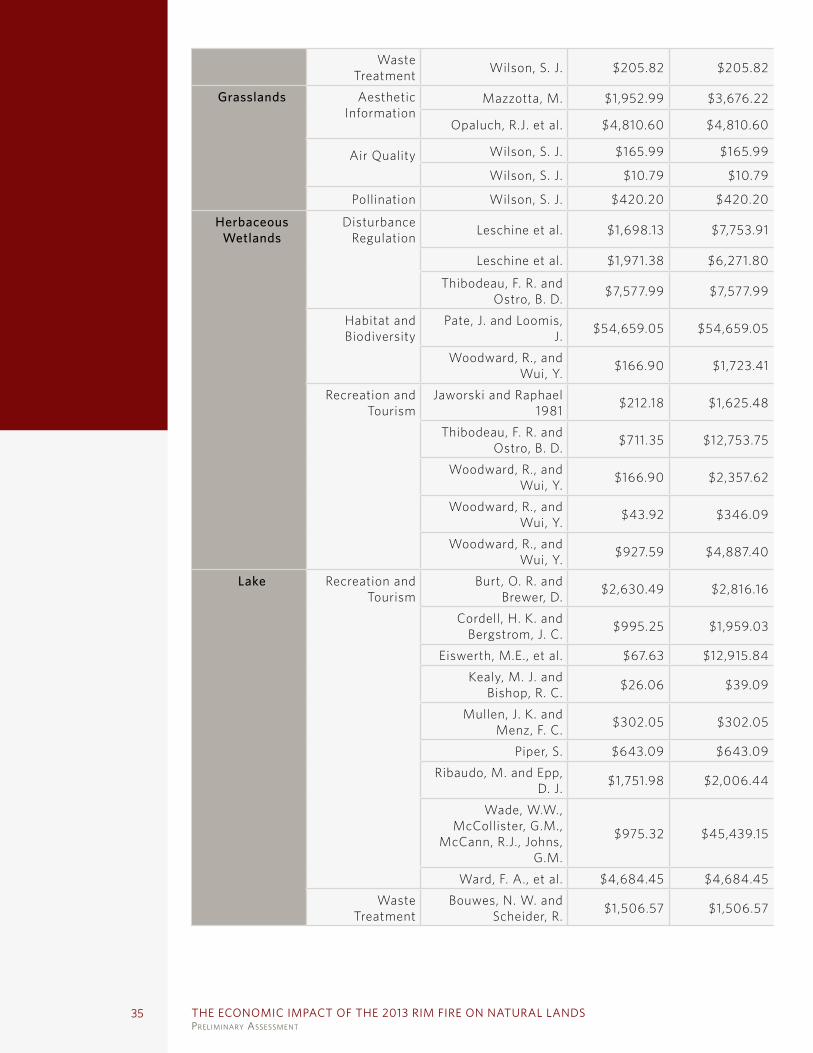
THE ECONOMIC IMPACT OF THE 2013 RIM FIRE ON NATURAL LANDSPreliminary assessment
35
Waste Treatment Wilson, S. J. $205.82 $205.82
Grasslands
Aesthetic Information
Mazzotta, M. $1,952.99 $3,676.22
Opaluch, R.J. et al. $4,810.60 $4,810.60
Air Quality
Wilson, S. J. $165.99 $165.99
Wilson, S. J. $10.79 $10.79
Pollination Wilson, S. J. $420.20 $420.20
Herbaceous Wetlands
Disturbance Regulation Leschine et al. $1,698.13 $7,753.91
Leschine et al. $1,971.38 $6,271.80
Thibodeau, F. R. and Ostro, B. D. $7,577.99 $7,577.99
Habitat and Biodiversity
Pate, J. and Loomis, J. $54,659.05 $54,659.05
Woodward, R., and Wui, Y. $166.90 $1,723.41
Recreation and Tourism
Jaworski and Raphael 1981 $212.18 $1,625.48
Thibodeau, F. R. and Ostro, B. D. $711.35 $12,753.75
Woodward, R., and Wui, Y. $166.90 $2,357.62
Woodward, R., and Wui, Y. $43.92 $346.09
Woodward, R., and Wui, Y. $927.59 $4,887.40
Lake Recreation and Tourism
Burt, O. R. and Brewer, D. $2,630.49 $2,816.16
Cordell, H. K. and Bergstrom, J. C. $995.25 $1,959.03
Eiswerth, M.E., et al. $67.63 $12,915.84
Kealy, M. J. and Bishop, R. C. $26.06 $39.09
Mullen, J. K. and Menz, F. C. $302.05 $302.05
Piper, S. $643.09 $643.09
Ribaudo, M. and Epp, D. J. $1,751.98 $2,006.44
Wade, W.W., McCollister, G.M.,
McCann, R.J., Johns, G.M.
$975.32 $45,439.15
Ward, F. A., et al. $4,684.45 $4,684.45
Waste Treatment
Bouwes, N. W. and Scheider, R. $1,506.57 $1,506.57
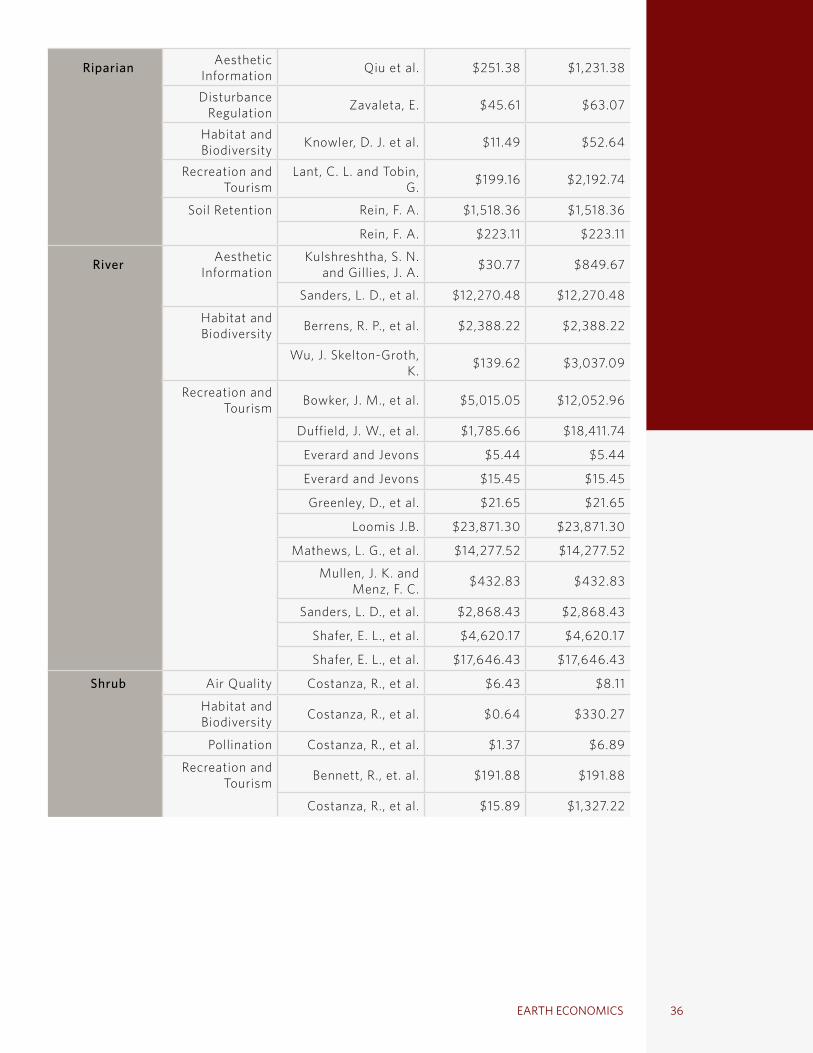
36EARTH ECONOMICS
Riparian Aesthetic Information Qiu et al. $251.38 $1,231.38
Disturbance Regulation Zavaleta, E. $45.61 $63.07
Habitat and Biodiversity Knowler, D. J. et al. $11.49 $52.64
Recreation and Tourism
Lant, C. L. and Tobin, G. $199.16 $2,192.74
Soil Retention Rein, F. A. $1,518.36 $1,518.36
Rein, F. A. $223.11 $223.11
River Aesthetic Information
Kulshreshtha, S. N. and Gillies, J. A. $30.77 $849.67
Sanders, L. D., et al. $12,270.48 $12,270.48
Habitat and Biodiversity Berrens, R. P., et al. $2,388.22 $2,388.22
Wu, J. Skelton-Groth, K. $139.62 $3,037.09
Recreation and Tourism Bowker, J. M., et al. $5,015.05 $12,052.96
Duffield, J. W., et al. $1,785.66 $18,411.74
Everard and Jevons $5.44 $5.44
Everard and Jevons $15.45 $15.45
Greenley, D., et al. $21.65 $21.65
Loomis J.B. $23,871.30 $23,871.30
Mathews, L. G., et al. $14,277.52 $14,277.52
Mullen, J. K. and Menz, F. C. $432.83 $432.83
Sanders, L. D., et al. $2,868.43 $2,868.43
Shafer, E. L., et al. $4,620.17 $4,620.17
Shafer, E. L., et al. $17,646.43 $17,646.43
Shrub Air Quality Costanza, R., et al. $6.43 $8.11
Habitat and Biodiversity Costanza, R., et al. $0.64 $330.27
Pollination Costanza, R., et al. $1.37 $6.89
Recreation and Tourism Bennett, R., et. al. $191.88 $191.88
Costanza, R., et al. $15.89 $1,327.22
THE ECONOMIC IMPACT OF THE 2013 RIM FIRE ON NATURAL LANDSPreliminary assessment
37
APPENDIX D. VALUATION STUDIES USEDAdger, W.N., Brown, K., Cervigini, R., Moran, D. 1995. Towards estimating total economic value of forests in Mexico. Centre for Social and Economic Research on the Global Environment, University of East Anglia and University College London, Working Paper
Alberta-Pacific Forest Industries Inc. 1997. Detailed forest management plan (April 30, 1997 Draft). Alberta-Pacific Forest Industries Inc., Edmonton.
Bennett, R., Tranter, R., Beard, N., Jones, P. 1995. The value of footpath provision in the countryside: a case-study of public access to urbanfringe woodland. Journal of Environmental Planning and Management 38, 409-417.
Berrens, R. P., Ganderton, P., Silva, C.L. 1996. Valuing the protection of minimum instream flows in New Mexico. Journal of Agricultural and Resource Economics 21 294-308.
Bouwes, N. W., Scheider, R. 1979. Procedures in estimating benefits of water quality change. American Journal of Agricultural Economics 61, 635-639.
Bowker, J.M., English, D.B., Donovan, J.A. 1996. Toward a value for guided rafting on southern rivers. Journal of Agricultural and Resource Economics 28, 423-432.
Boxall, P. C., McFarlane, B.L., Gartrell, M. 1996. An aggregate travel cost approach to valuing forest recreation at managed sites. Forestry Chronicle 72, 615-621.
Burt, O.R., Brewer. D. 1971. Estimation of net social benefits from outdoor recreation. Econometrica 39, 813-827.
Cordell, H. K., Bergstrom, J.C. 1993. Comparison of recreation use values among alternative reservoir water level management scenarios. Water Resources Research 29 247-258.
Creel, M., Loomis, J. 1992. Recreation value of water to wetlands in the San-Joaquin Valley - linked multinomial logit and count data trip frequency models. Water Resources Research 28 2597-2606.
Croke, K., Fabian, R., Brenniman, G. 1986. Estimating the value of improved water-quality in an urban river system. Journal of Environmental Systems 16 13-24.
Duffield, J. W., Neher, C.J., Brown, T.C. 1992. Recreation benefits of instream flow - application to Montana Big Hole and Bitterroot Rivers. Water Resources Research 2 2169-2181.
Eiswerth, M.E., Donaldson, S.G., Johnson, W.S. 2000. Potential Environmental Impacts and Economic damages of Eurasian Watermilfoil (Myriophyllum spicatum) in Western Nevada and Northeastern California. Weed Technology. 14(3).
Everard, M. 2009. Ecosystem Services Case Studies. Environment Agency. UK.
Greenley, D., Walsh, R.G., Young, R.A. 1981. Option value: empirical evidence from a case study of recreation and water quality. The Quarterly Journal of Economics 96, 657-673.
Jaworski, E., Raphael, C.N. 1978. Fish, Wildlife, and Recreational Values of Michigan’s Coastal Wetlands. Prepared for Great Lakes Shorelands Section, Division Land Resources Program, Michigan Department of Natural Resources.
38EARTH ECONOMICS
Kealy, M. J., Bishop, R.C. 1986. Theoretical and empirical specifications issues in travel cost demand studies. American Journal of Agricultural Economics 68, 660-667.
Knowler, D.J., MacGregor, B.W., Bradford, M.J., Peterman, R.M. 2003. Valuing freshwater salmon habitat on the west coast of Canada. Journal of Environmental Management 69 261–273.
Kulshreshtha, S. N., Gillies, J.A. 1993. Economic-evaluation of aesthetic amenities - a case-study of river view. Water Resources Bulletin 29 257-266.
Lant, C. L., Tobin, G. 1989. The economic value of riparian corridors in cornbelt floodplains: a research framework. Professional Geographer 41, 337-349.
Leschine, T. M., Wellman, K.F., Green, T.H. 1997. Wetlands’ Role in Flood Protection. October 1997. Report prepared for: Washington State Department of Ecology Publication No. 97-100. http://www.ecy.wa.gov/pubs/97100.pdf
Loomis, J.B. 2002. Quantifying Recreation Use Values from Removing Dams and Restoring Free-Flowing Rivers: A Contingent Behavior Travel Cost Demand Model for the Lower Snake River. Water Resources Research 38.
Mates. W., Reyes, J. 2004. The economic value of New Jersey state parks and forests. New Jersey Department of Environmental Protection, New Jersey.
Mathews, L. G., Homans, F.R., Easter, K.W. 2002. Estimating the benefits of phosphorus pollution reductions: an application in the Minnesota River. Journal of the American Water Resources Association 38 1217-1223.
Maxwell, S. 1994. Valuation of rural environmental improvements using contingent valuation methodology: a case study of the Martson Vale Community Forest Project. Journal of Environmental Management 41, 385-399.
Mazzotta, M. 1996. Measuring Public Values and Priorities for Natural Resources: An Application to the Peconic Estuary System. University of Rhode Island.
Mullen, J. K., Menz, F.C. 1985. The effect of acidification damages on the economic value of the Adirondack Fishery to New-York anglers. American Journal of Agricultural Economics 67 112-119.
THE ECONOMIC IMPACT OF THE 2013 RIM FIRE ON NATURAL LANDSPreliminary assessment
39
APPENDIX E. STUDY LIMITATIONS AND CAVEATS Study limitations can be grouped into three categories: 1) lack of information, 2) benefit transfer limitations, and 3) improvements with modeling and spatial data.
The greatest gap in the valuation of ecosystem services is the lack of values for ecosystem services identified as present and impacted. Of the 137 ecosystem service/land cover type combinations, which were identified as valuable within the Rim Fire burn area, only 37 actually had monetary values attached. For 100 values, no value could be calculated. In some cases the science is not established, for example the loss or gain of water supply due to fire. In other cases, the science is present, but there is no economic analysis showing the value of the service, for example it is known that coniferous forests prevent soil erosion, but there is no economic valuation associated with that benefit. Finally, economic analysis may have been conducted, but it may not be appropriate to transfer the dollar values.
Because the actual valuation studies are so few compared to the known ecosystem services present, the current valuation should be considered a significant underestimate of the actual value of ecosystem service provided by the Rim Fire burn area. A FEMA memorandum on the “Cost Effectiveness Determinations for Acquisitions and Elevations in Special Flood Hazard Areas” from August 2013 provides the result of an analysis of 11,000 acquisition and elevation projects showing a 300% – 1,500% rate of return on mitigation projects.43 Once ecosystem services are included, then the economic benefits of policies that affect natural systems, like the floodplain become apparent.
The second class of limitations involves benefit transfer analysis. Every ecosystem is unique, so per-acre values derived from other locations may not fully reflect local values. This is true for all house, business and asset appraisals, or for calculations in the GDP (all new cars sold for the same price have the same GDP value regardless of the actual value the car provides). For example, although a number of the valuation studies used in this analysis were conducted in California, none were conducted in Tuolumne County.
Ecosystem services are generally increasing in value more quickly than most other economic assets. Because there is a lag in publishing values, services such as water regulation, storm protection, or erosion control are often more valuable. For example, after every hurricane with greater dollar damages, the value of wetland buffering increases. As both the frequency and intensity of hurricanes has increased, wetland buffering values have increased, always outpacing valuation studies.
Burn area and ecosystem health are difficult to estimate and just as basal loss was estimated in quartiles, so were elements of ecosystem health; this could be greatly improved with stronger scientific grounding and more economic research.
Within the burn area, the National Park Service has a more detailed GIS coverage than GIS data covering private and USFS lands only for a subset of the burn area. However, in this study, US Forest burn data was used because it was consistent across the entire burn area of the Rim Fire.
40EARTH ECONOMICS
Finally, improvements in ecosystem service valuation with modeling and spatial data is very exciting, but could not be utilized within the short timeframe (three weeks) of this report. This is a static, partial equilibrium framework that ignores many of the dynamics and interdependencies of the economy and natural systems. Dynamic systems modeling is being developed but is too time and resource intensive for application. Modeling can also include better analysis of uncertainty, sensitivity analysis, and modeling of each ecosystem service and the recovery path under different regrowth or restoration scenarios. Under a three-year National Science Foundation Grant lead by Dr. Ferdinando Villa, Earth Economics with the University of Vermont and Conservation International was able to model ecosystem service changes with landscape changes. This included the value of aesthetic and property values based on the line of sight to aesthetic resources. This would be valuable with the Rim Fire for better understanding the impact on private property values.
Overall, this study provides a robust, rapid estimate of environmental benefit values and the impact of the Rim Fire. There are other tools, being developed which will help eliminate some of the limitations of the current approach.
THE ECONOMIC IMPACT OF THE 2013 RIM FIRE ON NATURAL LANDSPreliminary assessment
41
APPENDIX F. ECOSYSTEM SERVICE VALUATION FAQ
What is Built Capital? Built infrastructure or built capital includes the kinds of things humans create, such as roads, bridges, levees, buildings and machinery. Built capital provides humans with many services but is unable to efficiently replace a number of the essential services provided by natural capital.
What is Natural Capital?Natural capital includes networks of natural lands, working lands, watersheds, landscape features, green spaces, and wildlife corridors. Natural capital operates at all spatial scales from urban centers to wilderness areas, and renders a range of critical environmental benefits or “ecosystem services” for humans.
What is aN ECosystEm sErviCE valuatioN?Ecosystem Service Valuation (ESV) is an economic tool that is used to determine the dollar value of our natural assets and to quantify the (positive or negative) impact of human activities on the environment.
What is BENEfit traNsfEr mEthodology?Benefit Transfer Methodology involves estimating the value of ecosystem services through the analysis of a group of primary valuation studies, which have been previously conducted to determine the value of similar goods and services in similar geographies and contexts.
hoW do you assigN a dollar valuE to NaturE?There are eight categories of primary dollar valuation methodologies to calculate ecosystem service values. Three are included here as examples (All eight are listed in Earth Economics ESV reports):• Market pricing: Valuations are directly obtained from what people are willing to pay for the
service or good on a private market. Example: Timber from US Forest Service lands is often sold on a private market.
• Travel cost: Cost of travel required to consume or enjoy ecosystem services. Travel costs can reflect the implied value of the service. Example: Recreation areas, such as Yosemite National Park, attract tourists who place value on that area based on what they were willing to pay to travel to it.
• Replacement cost: Cost of replacing ecosystem services with man-made systems. Example: the cost of replacing a watershed’s natural filtration services with a man-made water filtration plant.
The full list of primary valuation techniques is described in Earth Economics’ Rim Fire ESV report titled Preliminary Assessment: The Economic Impact of the 2013 Rim Fire on Natural Lands.
42EARTH ECONOMICS
Why do ECosystEm sErviCE valuatioNs typiCally rEturN a raNgE of valuEs?An original and complete valuation requires more than 100 unique scientific studies for a single study area. Due to the extremely high costs associated with conducting original research for ecosystem services, Earth Economics uses benefit transfer methodology for providing a range of values for ecosystem service benefits. This type of valuation is based on peer-reviewed academic articles selected specifically for a study site.
The low and high values correspond to the range of the lowest and highest values in peer-reviewed literature. Although a great deal of research has been completed on ecosystem services in the last 30 years, this is still a new and emerging field; new values are being developed all the time. The low valuation boundaries are typically underestimates of the true economic value. However, they can demonstrate that ecological services in an area are worth at least a certain dollar amount, which can be sufficient to inform policy decisions, such as restoring or maintaining those systems.
Why Not usE primary valuatioN mEthods rathEr thaN BENEfit traNsfEr mEthodology?A primary study generally looks at one or a few ecosystem services and takes up to two years, costing upwards of $100,000. Using benefit transfer methodology with a tool such as the Ecosystem Valuation Toolkit (http://esvaluation.org), a valuation study that assesses up to 23 ecosystem services can now be completed in less than six weeks and at a fraction of the cost. Benefit Transfer Methodology has been approved and used for benefit-cost analysis by federal agencies such as the U.S. Environmental Protection Agency for rule making, and the Federal Emergency Management Agency for hazard mitigation projects.
do you valuE all ECosystEm sErviCEs iN EvEry laNd CovEr typE?Due to limitations of conducting a primary valuation, several gaps exist in the academic literature on the economic analysis of ecosystem services. Therefore, not all ecosystem services identified as valuable for each land cover class can currently be assigned a dollar value.
Why arE ECosystEm sErviCEs Worth so muCh?Scarcity has shifted over the last 100 years from built capital to natural capital. For example, a century ago, to catch more fish we needed to construct more boats and nets. Today, we have an abundance of boats and nets. On the other hand, fish and fish habitat – our natural capital – is scarce.
In addition, nature does an extensive amount of work for free. For example, to replace the filtration of water that is currently accomplished by a forested watershed, Seattle would have to build a $250 million water filtration plant.
hoW CaN aN Esv BE usEd to justify iNvEstmENt?Estimating the value of ecosystem services results in a better valuation than the implicit value of zero – or infinity. While human life is clearly priceless, we put a price tag on the services that people provide to the economy. What is not valued is often lost. The advantage of a valued asset is that a sufficient budget for its operations and maintenance can be justified. The valuation of a natural asset may facilitate borrowing against the asset.
THE ECONOMIC IMPACT OF THE 2013 RIM FIRE ON NATURAL LANDSPreliminary assessment
43
Could ECosystEm sErviCEs valuEs hold up iN Court?Ecosystem service valuation is increasingly being used in court to support Natural Resource Damage Assessments and similar decisions across the world. In 2012 Earth Economics conducted an ecosystem service valuation to estimate the damages of a gold mine in Costa Rica. The values were later upheld by the Supreme Court of Costa Rica. Similarly, ecosystem service valuation has been used to guide compensation for the damages incurred by BP due to the Deep Horizon oil spill in 2010.
Why put a priCE oN NaturE?1. Nature does “work,” i.e. delivers ecosystem services, which provides economic value to
humans. Although nature is priceless in the same way that human life is priceless, we need to put a value on the services that nature provides, in the same way that we put a price and pay humans for their unique services.
2. What is not valued is often lost. We estimate the value of ecosystem services to offer a better appraisal than the implicit value of zero.
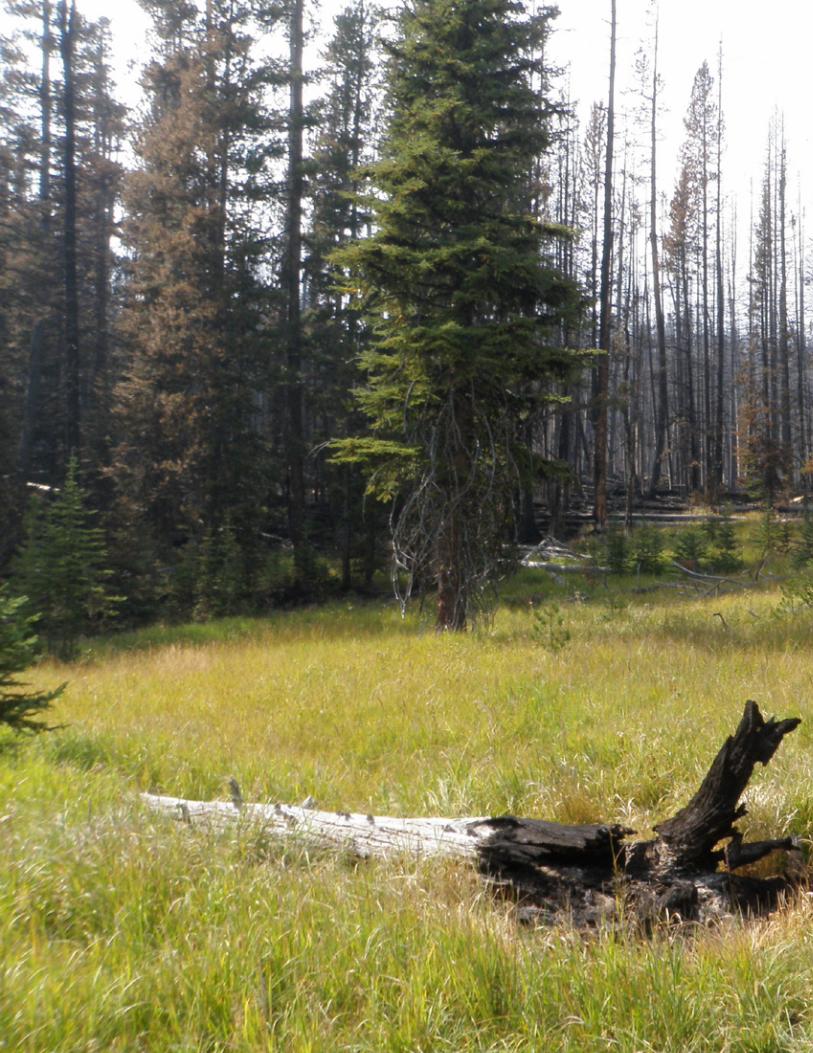
44EARTH ECONOMICS
Earth Economics107 N. Tacoma AvenueTacoma, WA 98403253.539.4801www.eartheconomics.org
Recommended