Tax Morale and Tax Resistance: Evidence from a Representative Japanese Population Survey
Tomomi Miyazaki Masayuki Tamaoka Ayu Tomita Keigo Kameda
Akihiro Kawase Katsuyoshi Nakazawa Hiroyuki Ono Naoko Yokoyama
March , 2020
Discussion Paper No.2004
GRADUATE SCHOOL OF ECONOMICS
KOBE UNIVERSITY
ROKKO, KOBE, JAPAN
1
Tax Morale and Tax Resistance: Evidence from a Representative Japanese Population Survey♣
Tomomi Miyazaki 1 , Masayuki Tamaoka 2 , Ayu Tomita 3 , Keigo Kameda 4 , Akihiro Kawase5, Katsuyoshi Nakazawa6, Hiroyuki Ono7, Naoko Yokoyama8 Abstract:
This paper explains background information and basic descriptive statistics from a
representative survey of Japan’s tax and fiscal policy issues. We found that while the
Japanese taxpayers have high tax morale, half of them disagree with the consumption
tax hike in October 2019.
Keywords: Tax morale, tax compliance, tax resistance, tax hike, questionnaire JEL classification: E62, H62
♣ This is a revised version of our paper “Consumption Tax Hike, Tax Morale, and Tax Resistance:
Taxpayer Paradox in Japan” published in Public Choice Studies No.73. The authors would like to thank for Bernd Hayo, Takashi Shimuzu, and Kazufumi Yugami for their insightful comments and suggestions. This work has been financially supported by the Japan Society for the Promotion of Science (Grant-in-Aid for Scientific Research #16H03637 and #18H00868). The usual disclaimer applies.
1 Corresponding Author. Associate Professor, Graduate School of Economics, Kobe University. E-mail: [email protected]
2 Professor, Graduate School of Economics, Kobe University. 3 Student, Graduate School of Economics, Kobe University. 4 Professor, School of Policy Studies, Kwansei Gakuin University. 5 Professor, Faculty of Economics, Toyo University. 6 Professor, Faculty of Economics, Toyo University. 7 Professor, Faculty of Economics, Toyo University. 8 Professor, Faculty of Economics, Osaka Sangyo University.
2
The government wants our money and if a lot of people were thinking about this kind of peaceful protest, it would get their attention.♠
1. Introduction
This paper explains background information and basic descriptive statistics for our
Internet survey in Japan. Our survey was implemented as a part of our project supported
by the Grant-in-Aid for Scientific Research in August 2019. The survey addresses
important topics with respect to tax and fiscal policy such as: tax morale and tax
compliance, opinion on the Japanese consumption tax hike in October 2019, the effects
of debt accumulation on consumption, etc.
Here we present the parts of our results focusing on tax morale and opinion on the
consumption tax hike. The summary statistics tell us that while tax morale is high in
Japan, half of the respondents oppose the consumption tax hike from 8% to 10%.
Furthermore, the “ideal” consumption tax rate for more than half of them are in the
range between 0 to 5%. The results also reveal that the Japanese taxpayers have strong
tax resistance. The correlation between some answers show weakly but evidently the
source of tax resistance can be attributed to the distrust for politicians and the
government.
The rest of this paper is organized as follows. Section 2 gives the background of the
Japanese consumption tax hike in October 2019 and related policies. Section 3 presents
the design of our survey and the parts of summary statistics with respect to tax morale,
tax compliance, and tax resistance. Section 4 concludes.
♠ The Guardian “We will not pay: the Americans withholding their taxes to fight Trump.” https://www.theguardian.com/us-news/2017/feb/15/tax-refusing-pay-protest-trump
3
2. A brief look at Japan’s consumption tax hike in October 2019
2.1. Overview of the Japan’s consumption tax system
The Japanese consumption tax can be classified into general consumption taxes. Indeed,
the Ministry of Finance Japan defines “consumption tax is levied widely and fairly on
consumption in general1.”
The Japanese government founded the current consumption tax system in April 1989
by repealing excise taxes, which had been imposed on luxury goods. The consumption
tax rate was 3% at first. This was increased to 5 % in April 1997, and up to 8% in April
2014.
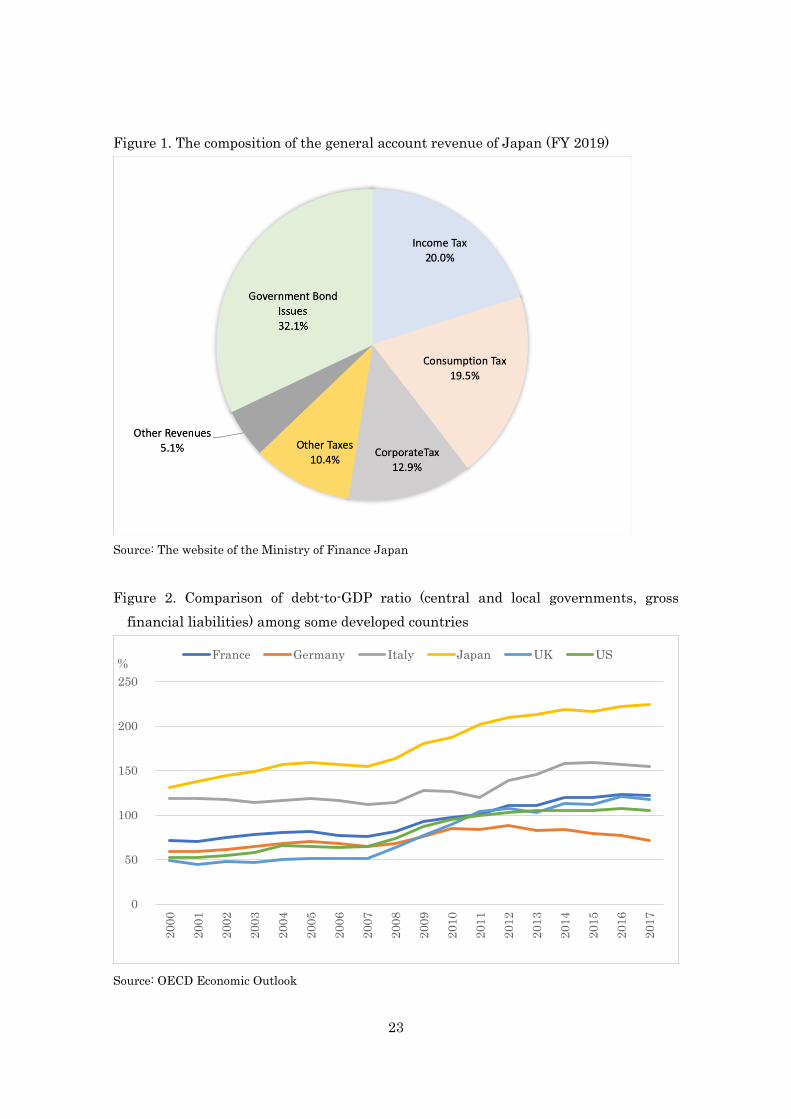
Consumption tax in Japan is a significant revenue source for the government. Figure 1
shows the general account revenue, which is equivalent to the revenue of the central
government in Japan. As can be seen from the figure, consumption tax revenue makes
up 19.5% of the total central government’s revenues, almost the same as income tax
revenue. In this regard, consumption tax is crucial to decide the size of the government
budget in Japan.
2.2. The background of the consumption tax hike
Figure 1 also tells us that the Japanese government heavily relies on the issue of
government bonds. Over the last two decades, no country has been overwhelmed by
enormous amount of government debt and significant budget deficits as Japan. The
central government of Japan has been running budget deficit since the early 1990s. What
is more, as shown in Figure 2, the general government’s gross debt-to-GDP ratio reached
224% in 2017, which is the highest among some developed countries.
1 Please refer to this website: https://www.mof.go.jp/english/tax_policy/publication/tax007/e_06.pdf.
4
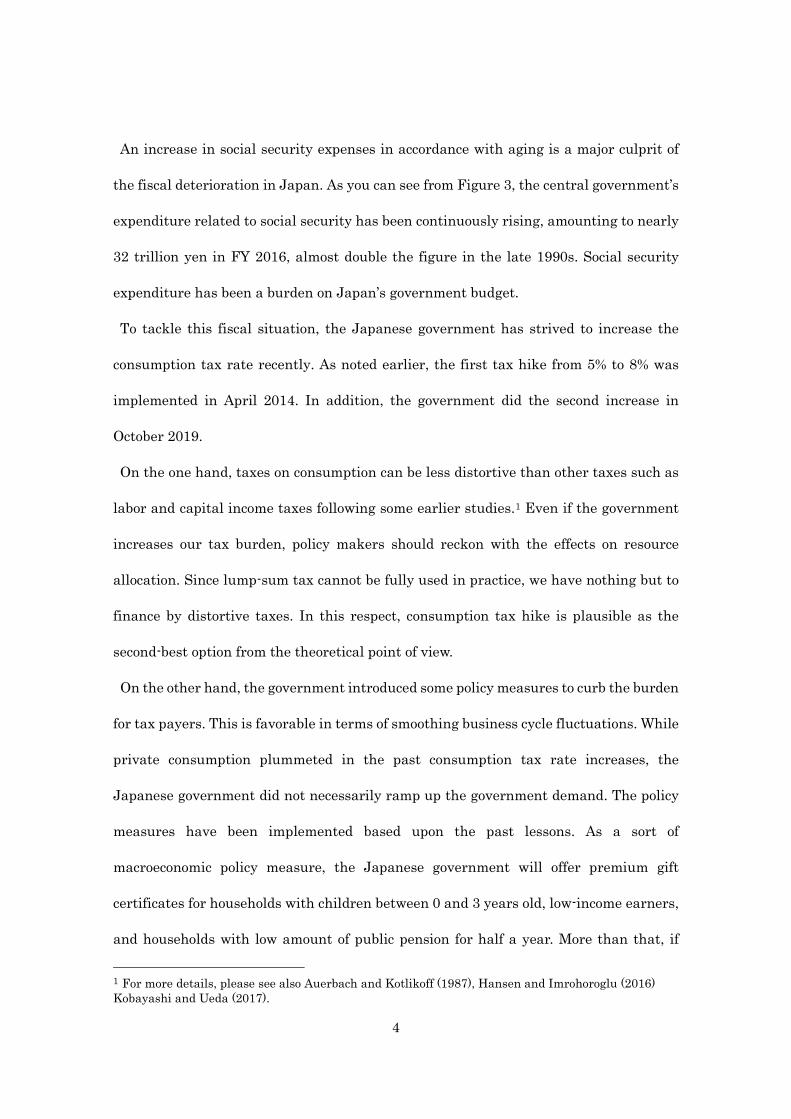
An increase in social security expenses in accordance with aging is a major culprit of
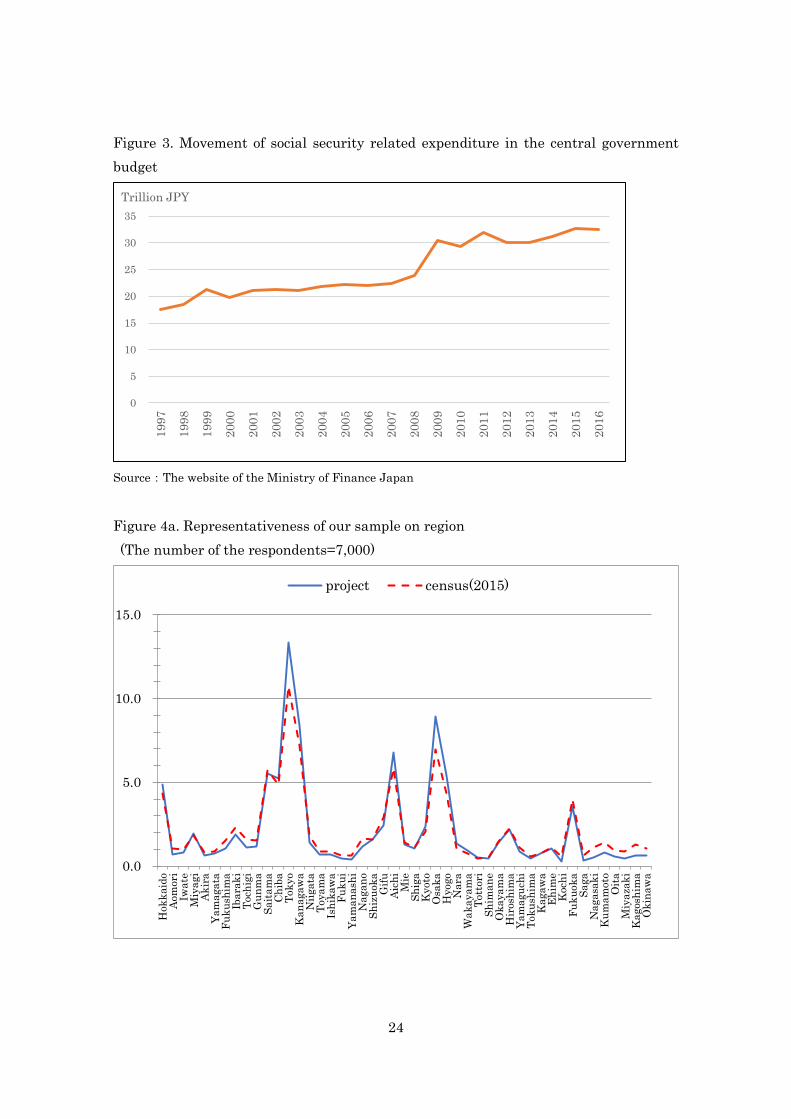
the fiscal deterioration in Japan. As you can see from Figure 3, the central government’s
expenditure related to social security has been continuously rising, amounting to nearly
32 trillion yen in FY 2016, almost double the figure in the late 1990s. Social security
expenditure has been a burden on Japan’s government budget.
To tackle this fiscal situation, the Japanese government has strived to increase the
consumption tax rate recently. As noted earlier, the first tax hike from 5% to 8% was
implemented in April 2014. In addition, the government did the second increase in
October 2019.
On the one hand, taxes on consumption can be less distortive than other taxes such as
labor and capital income taxes following some earlier studies.1 Even if the government
increases our tax burden, policy makers should reckon with the effects on resource
allocation. Since lump-sum tax cannot be fully used in practice, we have nothing but to
finance by distortive taxes. In this respect, consumption tax hike is plausible as the
second-best option from the theoretical point of view.
On the other hand, the government introduced some policy measures to curb the burden
for tax payers. This is favorable in terms of smoothing business cycle fluctuations. While
private consumption plummeted in the past consumption tax rate increases, the
Japanese government did not necessarily ramp up the government demand. The policy
measures have been implemented based upon the past lessons. As a sort of
macroeconomic policy measure, the Japanese government will offer premium gift
certificates for households with children between 0 and 3 years old, low-income earners,
and households with low amount of public pension for half a year. More than that, if
1 For more details, please see also Auerbach and Kotlikoff (1987), Hansen and Imrohoroglu (2016) Kobayashi and Ueda (2017).
5
consumers make a purchase with a credit card or electronic money, they will reinverse a
maximum of 5% of points.
Also, the government introduced a dual-rate structure; the minimum rate is 8% for
necessary items while the standard rate is set as 10%. The government does this in order
to mitigate the regressivity of VAT as in the case of several other countries. This had not
been adopted until the tax hike in October 2019 in Japan2.
3. Survey design and the results
3.1. The attitude for tax policy of the Japanese people and survey design
The Japanese constituents have negative impression with respect to consumption tax.
As stated in Tamaoka (1994), several special interest groups—especially small traders,
retailers, and even consumers—resisted the introduction of consumption tax in a
recalcitrant manner in the 1980s. Furthermore, most of the Japanese administrations
that proposed or implemented consumption tax hike lost national elections. Indeed,
according to polls by newspaper companies, more than half of respondents oppose a
further consumption tax hike
From these facts, it seems that many Japanese tax payers grudgingly pay taxes.
However, it is often said that taxpayers in Japan have a high tax morale. According to
Tekeli (2011), who conducted the research based upon the results of the World Value
Survey (WVS), Japan is the highest with respect to the degree of tax morale.
Furthermore, the Tokyo Metropolitan government declares “the Japanese people has the
highest level of tax compliance among the OECD countries.” These facts tell us that the
2 When it comes to the regiressivity of VAT, please also see Tamaoka (1994).
6
Japanese people are inclined to pay taxes regardless of a sense of duty.
Following these two contradictory facts, we design our survey. Details are shown in the
Appendix.
We set the question 1 to address tax morale by replicating the question of the WVS. At
the same time, we set questions from 2 to 4 in order to clarify the tax compliance of each
respondent.
In parallel with these questions, we would like to ask about the attitude with respect
to the credibility for the government, the party that respondents support, and a sense of
sin following the WVS. These are the questions from 10 to 13.
Regarding the consumption tax hike, we first ask the opinion for the tax increase in
October 2019 by question 4. Question 5 was set in order to make respondents fill out
their conceivable consumption tax rate. We also inquire about the opinion for the
measures to mitigate business fluctuation and dual-rate structure by questions 6 and 7.
As other questions, we ask about the effects of debt accumulation on consumption
(question 9) and the economic literacy (questions 14-17). These questions follow the way
of Hayo et al. (2014), which is a representative survey in Germany. The questions from
18 to 21 are set to ask about risk and time preferences, which are made by replicating
the questionnaire by the Institute of Social and Economic Research of Osaka University
(hereafter OU panel). We also employ the questions of OU panel for questions 25-35.
When it comes to the current and future prospect of each respondent’s economic status,
we set the questions from questions 22 to 24. We do these by following Hayo et al. (2014)
and OU panel, as well as the Japan General Social Survey (hereafter JGSS). Likewise,
we ask about education and job of the respondents based upon these three surveys by
questions 36-38.
7
3.2. Summary statistics
Our Internet survey was conducted from the 26th to the 28th of August 2019. We
delegated our job to Rakuten Insight company, and the number of total respondents is
7,000. They are randomly chosen from the Japanese citizens whose age is over 15.
Meanwhile, we ask about (1) whether or not respondents file tax (question 8), (2) the
amount of salary and assets (questions from 25 to 31), and (3) whether or not they are a
labor union member (question 37). We set the option “not sure” for questions 8 and 37.
We cannot rule out the possibility that the respondents intentionally chose this option
because they refused to answer. This may be also applicable to the questions from 25 to
31. By considering these, we first omit the respondents who answer “not sure” and “none”
for these questions. As a result, sample size is reduced to 2,147.
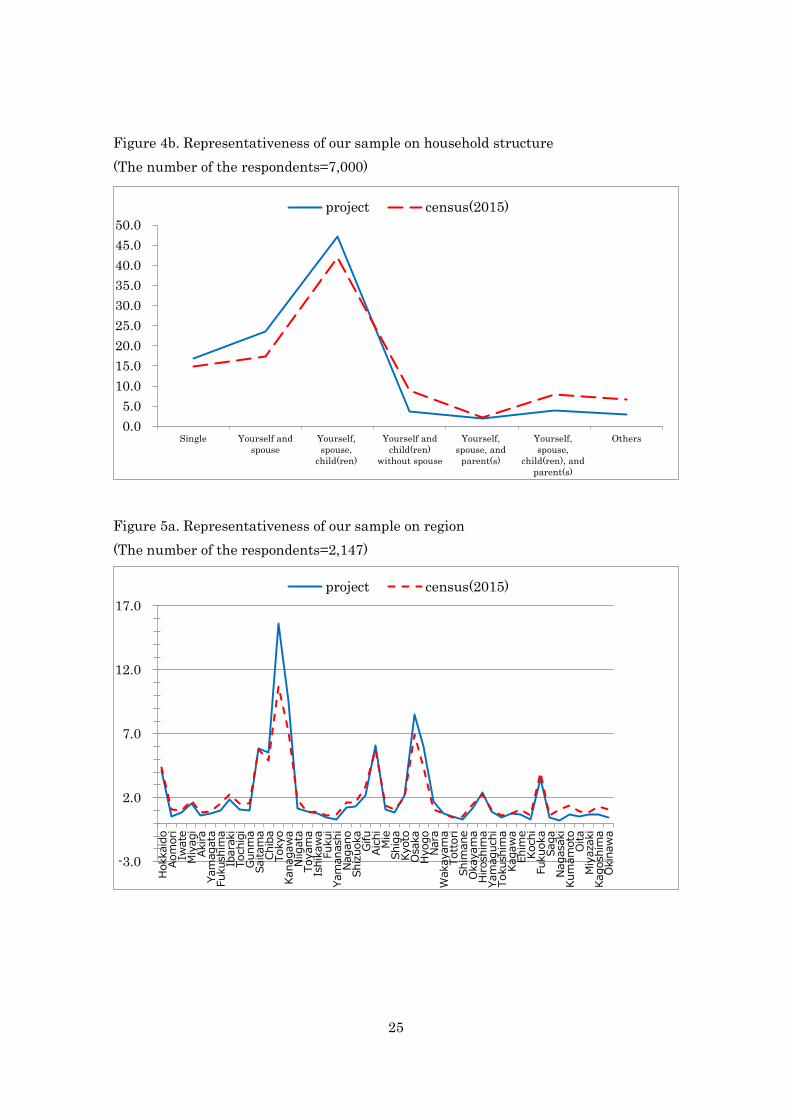
We check the representativeness of our survey. To identify this, we compare the newest
national census (done in 2015) with our survey. As can be seen from Figures 4a and 4b,
the correspondence level is high with respect to the residential areas and the structure
of household when we observe the data for the whole respondents. More than that,
Figures 5a and 5b tell us that even when we limit the sample to 2,147, the distribution
of residential areas and households is almost identical to Figures 4a and 4b. Although
there is a subtle difference, our survey sample is almost a representative of the general
population.
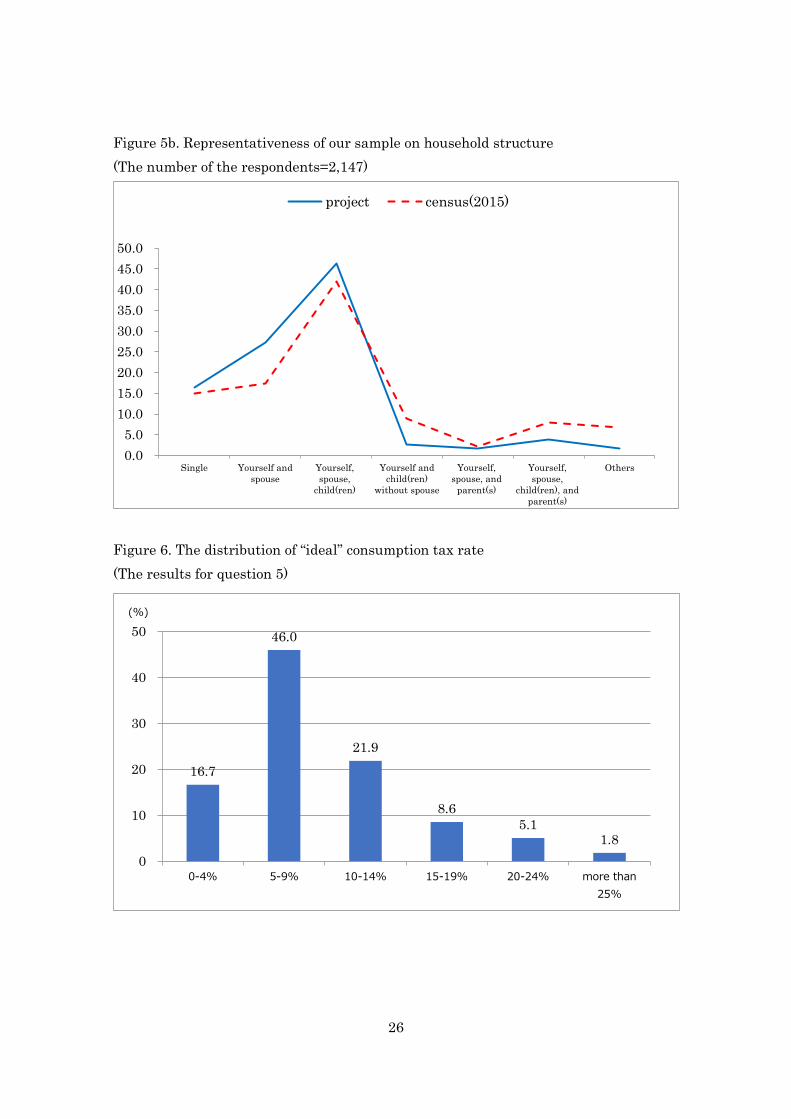
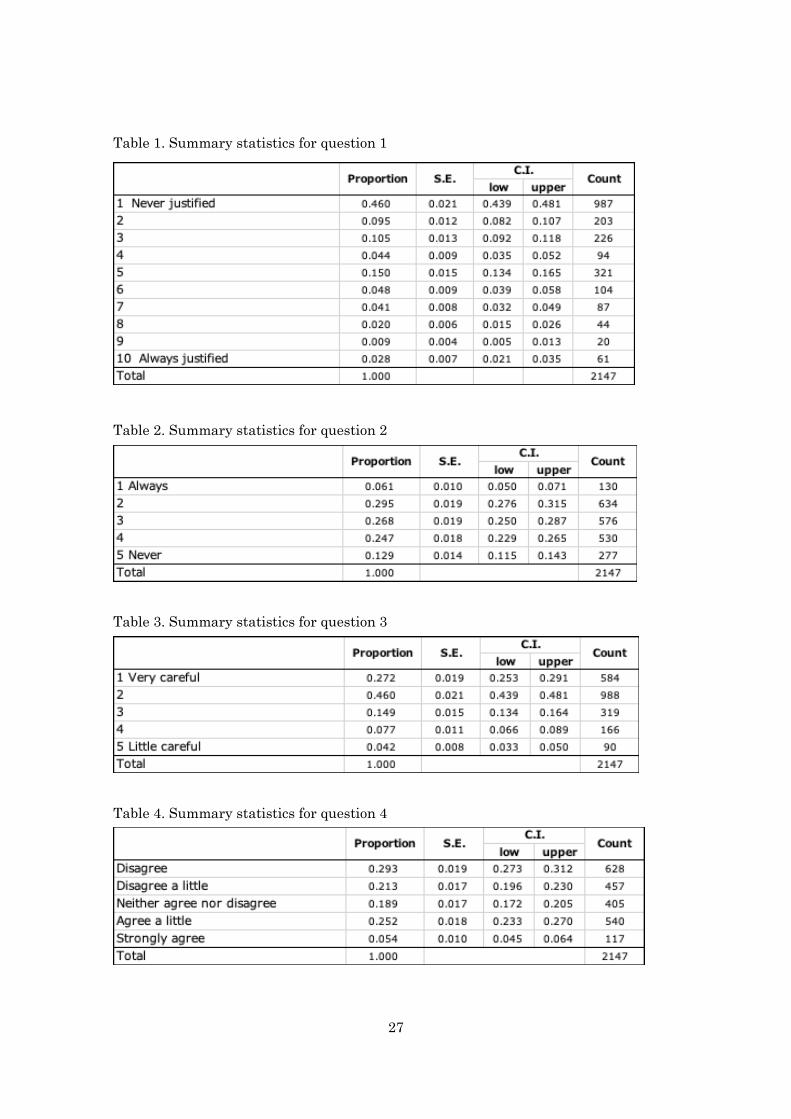
Here we focus on the responses for tax morale and consumption tax hike. We make the
summary statistics following Hayo et al. (2014). First, as shown in Table 1, 46% of the
respondents think that cheating on tax is never justifiable. In total, more than 60%
suppose that it is unfavorable to underreport or conceal their income. However, the
fraction is smaller than when we see the same result for the WVS. While we asked this
8
question through the Internet, WVS was conducted by face-to-face interviews; this
makes the results of WVS less credible because it would be highly probable to hide the
honest opinion in direct interviews for such questions. In this regard, our results may
conquer the bias inherent to the WVS. Tables 2 and 3 imply that tax compliance is also
high.
Meanwhile, Table 4 reveals that almost half respondents are against the tax hike.
Furthermore, Figure 6 tells us that almost half of the respondents assumes their “ideal”
consumption tax rate as the range between 0 to 5 %. On the other hand, it is worth noting
more than 30% respondents think that the consumption tax rate should be over 10%.
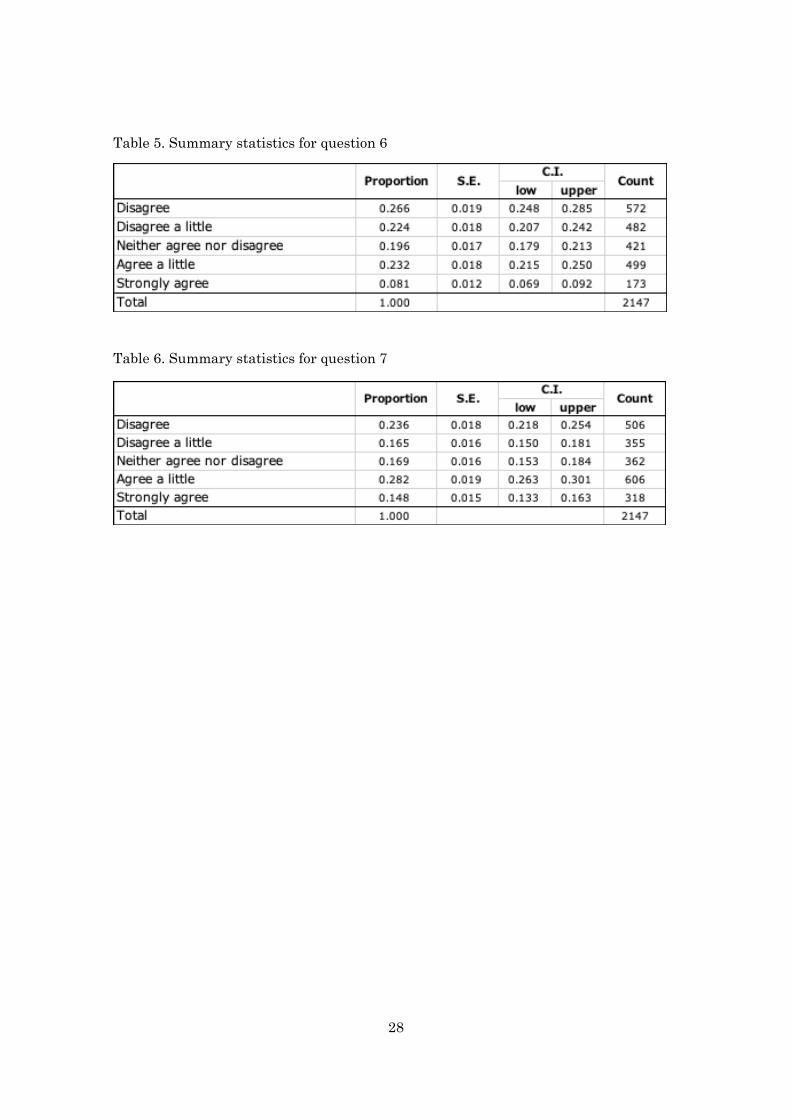
When it comes to the measures to mitigate business fluctuation (Table 5) and the dual-
rate structure (Table 6), we cannot necessarily present decisive results.
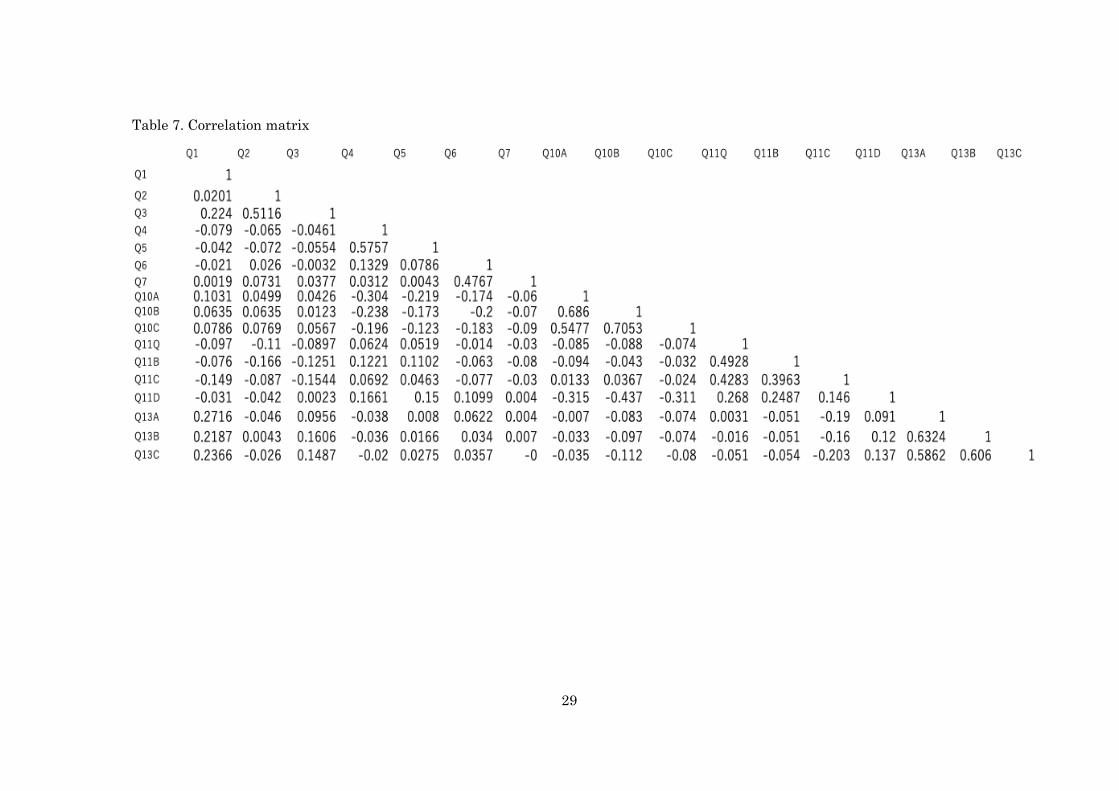
3.3. The correlation matrix
Table 7 reports the correlation matrix for the relevant questions. From these tables, you
can understand first that while there is little relationship between tax morale or tax
compliance and the indicators with respect to the trust for politicians and the
government. Meanwhile, we confirm that there is a slightly positive relationship
between tax morale and the social norm or a sense of sin. This implies that the source of
high tax morale of the Japanese people can partly be explained by their motivation to
abide by the rule or social norm.
When it comes to tax resistance, there is a slightly negative relationship between the
question 4 and the questions 10A or 10B. This implies that the political distrust may
cultivate the resistance for further tax hike as indicated by Scholz and Lubell (1988),
Lacy (1998), and Yamamura (2014).
9
4. Conclusion
This paper gives background information and basic descriptive statistics of the
representative survey on the tax and fiscal policies in Japan. We find that while tax
morale and tax compliance are high among the Japanese taxpayers, they did not
necessarily approve the consumption tax hike scheduled in October 2019.
As a next step, we would like to implement follow-up survey. Also, by taking advantage
of the current results as well as the next survey, we would like to conduct some
econometric exercises to identify the source of high tax morale and strong tax resistance.
References
Auerbach, A. and L. Kotlikoff. (1987), Dynamic Fiscal Policy, Cambridge University
Press, Cambridge.
Hansen, G. and S. Imrohoroglu. (2016), “Fiscal Reform and Government Debt in
Japan: A Neoclassical Perspective,” Review of Economic Dynamics, 21: pp.201-224.
Hayo, B., F. Neumeier., and U. Matthias. (2014), “Topics in Fiscal Policy: Evidence
from a Representative Survey of the German Survey,” MAGKS Discussion Paper
No.12-2014.
Kobayashi, K., and K. Ueda. (2017), “Secular Stagnation and Low Interest Rates under
the Fear of a Government Debt Crisis,” CIGS Working Paper Series No. 17-012E.
http://www.canon-igs.org/en/column/171108_kobayashi_ueda.pdf
Lacy, D. (1998), “Electoral Support for Tax Cuts: A Case Study of the 1980 American
Presidential Election,” American Politics Research 26 (3): pp.288-307.
Scholz, J. T. and Lubell. M. (1988), “Trust and Taxpaying: Testing the Heuristic
Approach to Collective Action,” American Journal of Political Science, 42 (2): pp.
10
398-417.
Tamaoka, T. (1994), “The Regressiveness of a Value Added Tax: Tax Credit Method and
Subtraction Methopp.d—A Japanese Case,” Fiscal Studies, 15 (2): 57-73.
Tekeli, R. (2011), “Determinants of Tax Morale in Japan and in Turkey,”
https://www.mof.go.jp/pri/international_exchange/visiting_scholar_program/ws20
11_d.pdf
Yamamura, E. (2014), “Trust in Government and its Effect on Preferences for Income
Redistribution and Perceived Tax Burden,” Economics of Governance, 15 (1):
pp.71-100.
11
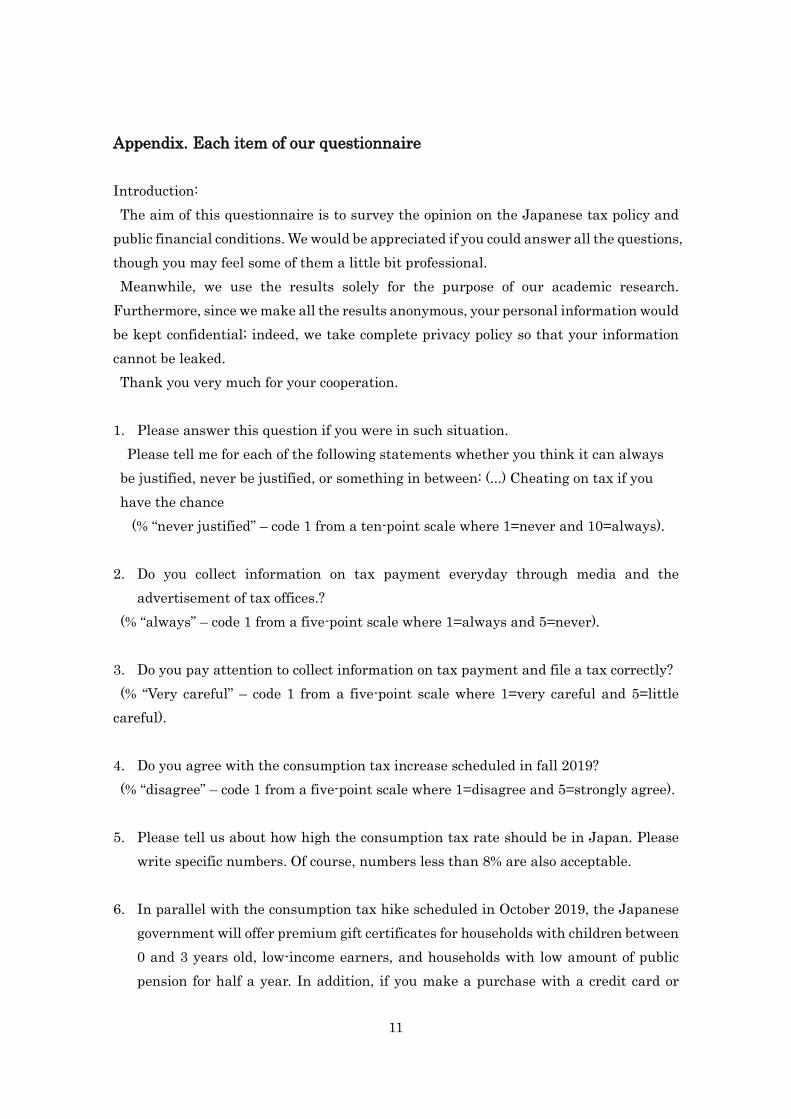
Appendix. Each item of our questionnaire Introduction: The aim of this questionnaire is to survey the opinion on the Japanese tax policy and
public financial conditions. We would be appreciated if you could answer all the questions, though you may feel some of them a little bit professional. Meanwhile, we use the results solely for the purpose of our academic research.
Furthermore, since we make all the results anonymous, your personal information would be kept confidential; indeed, we take complete privacy policy so that your information cannot be leaked. Thank you very much for your cooperation. 1. Please answer this question if you were in such situation. Please tell me for each of the following statements whether you think it can always be justified, never be justified, or something in between: (...) Cheating on tax if you have the chance
(% “never justified” – code 1 from a ten-point scale where 1=never and 10=always). 2. Do you collect information on tax payment everyday through media and the
advertisement of tax offices.? (% “always” – code 1 from a five-point scale where 1=always and 5=never).
3. Do you pay attention to collect information on tax payment and file a tax correctly? (% “Very careful” – code 1 from a five-point scale where 1=very careful and 5=little
careful).
4. Do you agree with the consumption tax increase scheduled in fall 2019? (% “disagree” – code 1 from a five-point scale where 1=disagree and 5=strongly agree).
5. Please tell us about how high the consumption tax rate should be in Japan. Please
write specific numbers. Of course, numbers less than 8% are also acceptable. 6. In parallel with the consumption tax hike scheduled in October 2019, the Japanese
government will offer premium gift certificates for households with children between 0 and 3 years old, low-income earners, and households with low amount of public pension for half a year. In addition, if you make a purchase with a credit card or
12
electronic money, you will reinverse a maximum of 5% of points. Do you agree with these policies to reduce the burden of tax increases?
(% “disagree” – code 1 from a five-point scale where 1=disagree and 5=strongly agree)
7. While the consumption tax rate will be raised to 10% in October 2019, the rate will remain to be 8% for necessities such as some food and drinks. Do you agree with this policy?
(% “disagree” – code 1 from a five-point scale where 1=disagree and 5=strongly agree) 8. Have you consulted a tax accountant for professional advice when you file a tax? 1. All of the time 2. Some of the time 3. Never 4. Not apply (withholding income taxpayers) 5. No response
9. We have seen an acceleration of public debt. It would be inevitable for the
government to increase tax rate or decrease expenditures such as pension and social security benefits, etc. Did this lead to changes in the way you spend or save?
Yes, I now spend a smaller proportion of my income and save a larger proportion □ Yes, I spend a larger proportion of my income and save a smaller proportion □ No, I did not change my behavior in consequence to the rapid increase in public debt □
10. To what extent do you trust the following each A to C? 1. Extremely trust, 2.Rather trust, 3.Neither trust nor mistrust, 4.Rather mistrust, 5. Mistrust
A. Central administrative office 1 2 3 4 5 B. National diet members 1 2 3 4 5 C. Local assembly members 1 2 3 4 5 11. Please choose only one from the following which apply to your opinion of each A to C
for the people and politics. A. Civilians can’t influence a government. (% “agree” – code 1 from a five-point scale where 1=disagree and 5=disagree)
13
B. Government activities and Politics are complicated; thus people don’t understand them. (% “agree” – code 1 from a five-point scale where 1=disagree and 5=disagree)
C. Your vote is too small to influence the election results because quite a number of other people vote in the election. (% “agree” – code 1 from a five-point scale where 1=disagree and 5=disagree)
D. Roughly speaking, it seems that National diet members don’t attempt to attract the peoples after their election win. (% “agree” – code 1 from a five-point scale where 1=disagree and 5=disagree)
12. Please choose one from the following political parties you support. 1. Liberal Democratic Party 2. Constitutional Democratic Party of Japan 3. Democratic Party For the People 4. Japan Innovation Party 5. Komeito 6. Japanese Communist Party 7. Social Democratic Party 8. 8. Other political parties in Japan ( ) 9. Unaffiliated voters
13A. Please tell me for each of the following statements whether you think it can always
be justified, never be justified, or something in between: Claiming government benefits to which you are not entitled. (3=never and 0=always)
13B. Please tell me for each of the following statements whether you think it can always
be justified, never be justified, or something in between: Avoiding a fare on public transportation. (3=never and 0=always)
13C. Please tell me for each of the following statements whether you think it can always
be justified, never be justified, or something in between: Avoiding a fare on public transportation. (3=never and 0=always)
14
14.At the end of Fiscal Year 2018, how much is the debt outstanding of both the central and local governments in Japan? Please choose the answer you think almost right.
1. JPY 1,100 trillion(correct answer) 2. JPY 800 trillion 3. JPY 900 trillion 4. JPY 1,300 trillion 5. Other numbers 6.No response
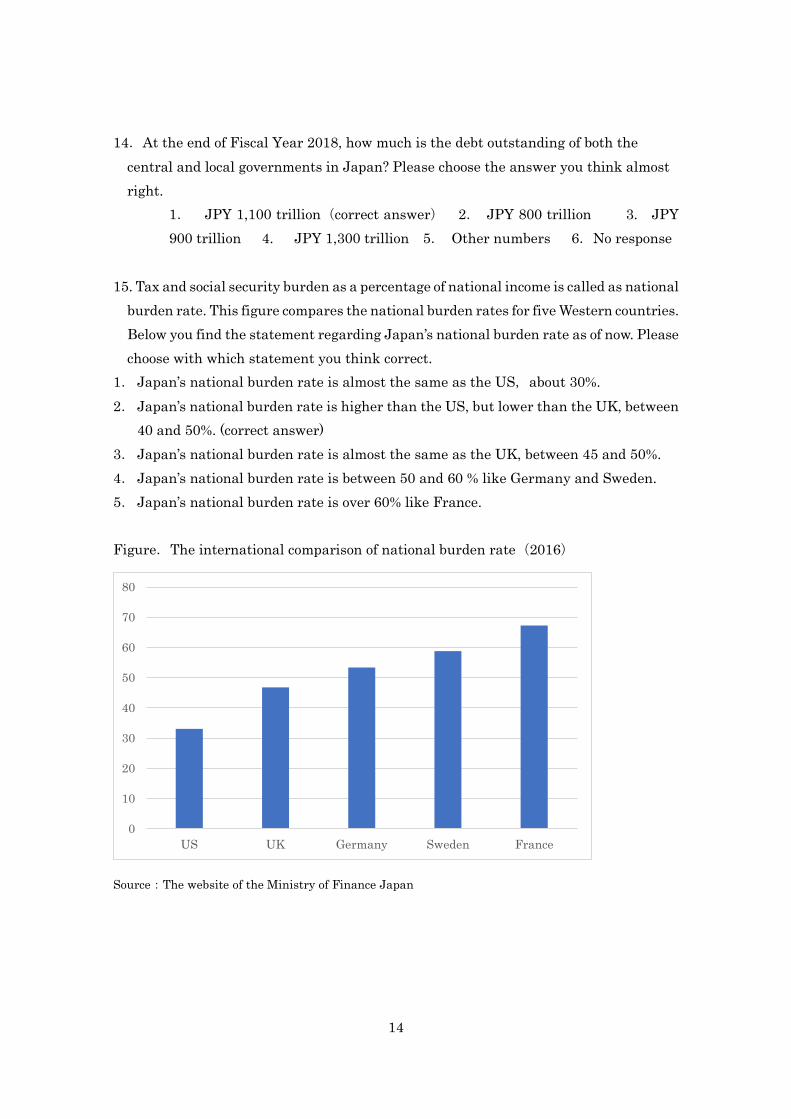
15. Tax and social security burden as a percentage of national income is called as national
burden rate. This figure compares the national burden rates for five Western countries. Below you find the statement regarding Japan’s national burden rate as of now. Please choose with which statement you think correct.
1. Japan’s national burden rate is almost the same as the US,about 30%. 2. Japan’s national burden rate is higher than the US, but lower than the UK, between
40 and 50%. (correct answer) 3. Japan’s national burden rate is almost the same as the UK, between 45 and 50%. 4. Japan’s national burden rate is between 50 and 60 % like Germany and Sweden. 5. Japan’s national burden rate is over 60% like France. Figure.The international comparison of national burden rate(2016)
Source:The website of the Ministry of Finance Japan
0
10
20
30
40
50
60
70
80
US UK Germany Sweden France
15
16. Long-term interest rates mean the interest rates over 1 year for borrowing and lending. Usually they refer to the yields of government bonds maturing in 10 years, which decides mortgage rates as well. How much is the long-term interest rate as of now? Please choose the answer you think almost right.
1. About -0.2%(correct answer) 2. About 0% 3. About 0.2% 4. About 1.2% 5. Other numbers 6.No response
17.Consumer price index (CPI), which captures the average price of goods and average
services in one country, is used in order to judge the deflation or inflation. How much is the CPI in Japan as of now? Please choose the answer you think almost right.
1. -0.6 2. 0.0% 3.0.6%(correct answer) 4.1.2% 5.Other numbers 6.No response
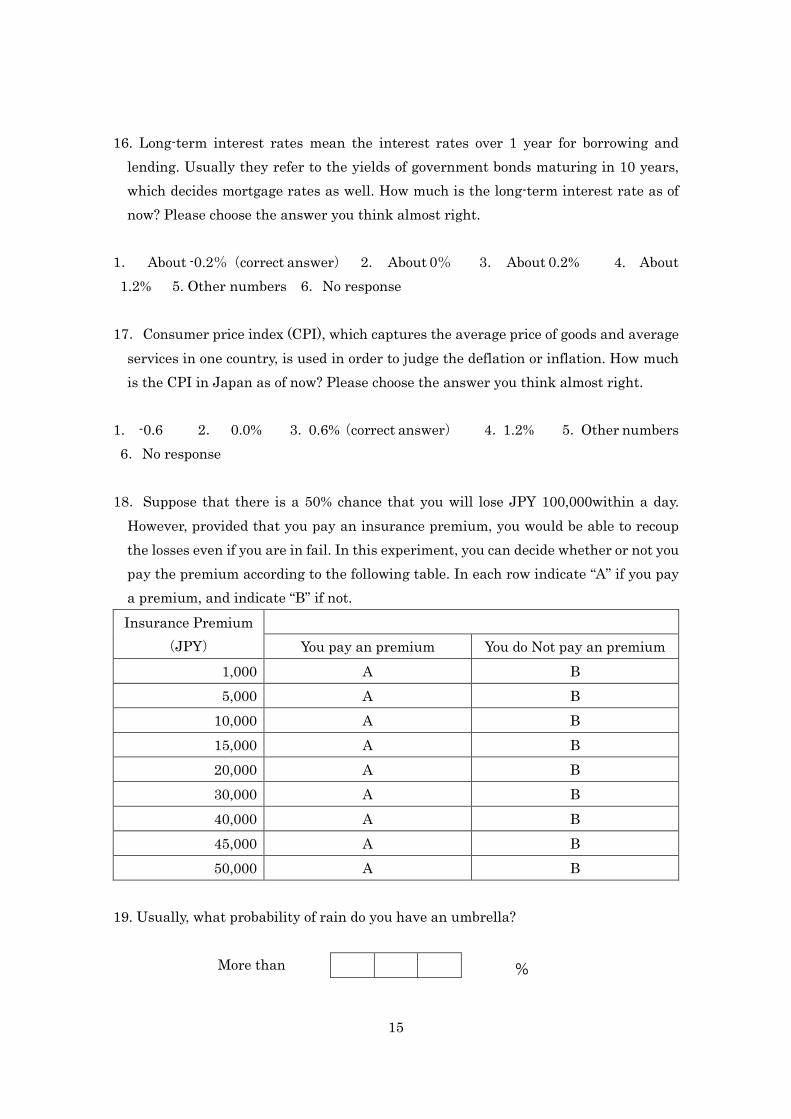
18.Suppose that there is a 50% chance that you will lose JPY 100,000within a day.
However, provided that you pay an insurance premium, you would be able to recoup the losses even if you are in fail. In this experiment, you can decide whether or not you pay the premium according to the following table. In each row indicate “A” if you pay a premium, and indicate “B” if not. Insurance Premium
(JPY)
You pay an premium You do Not pay an premium 1,000 A B 5,000 A B
10,000 A B 15,000 A B 20,000 A B 30,000 A B 40,000 A B 45,000 A B 50,000 A B
19. Usually, what probability of rain do you have an umbrella?
More than
%
16
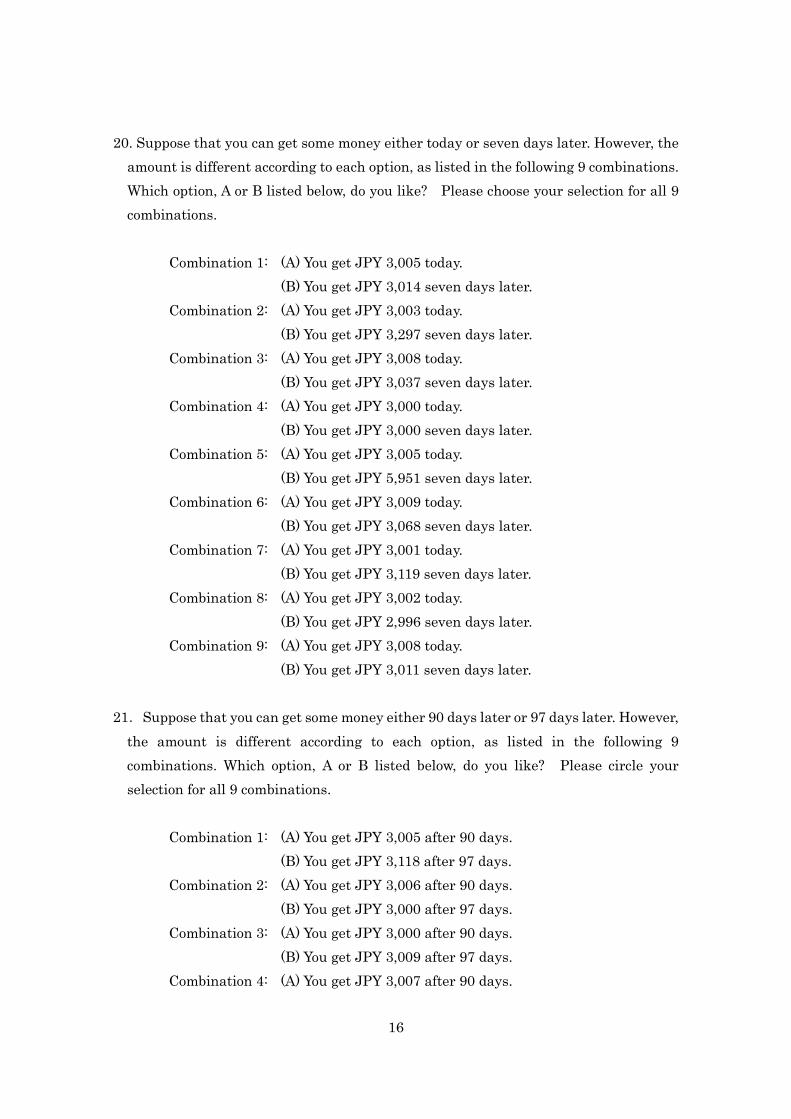
20. Suppose that you can get some money either today or seven days later. However, the amount is different according to each option, as listed in the following 9 combinations. Which option, A or B listed below, do you like? Please choose your selection for all 9 combinations.
Combination 1: (A) You get JPY 3,005 today.
(B) You get JPY 3,014 seven days later. Combination 2: (A) You get JPY 3,003 today.
(B) You get JPY 3,297 seven days later. Combination 3: (A) You get JPY 3,008 today.
(B) You get JPY 3,037 seven days later. Combination 4: (A) You get JPY 3,000 today.
(B) You get JPY 3,000 seven days later. Combination 5: (A) You get JPY 3,005 today.
(B) You get JPY 5,951 seven days later. Combination 6: (A) You get JPY 3,009 today.
(B) You get JPY 3,068 seven days later. Combination 7: (A) You get JPY 3,001 today.
(B) You get JPY 3,119 seven days later. Combination 8: (A) You get JPY 3,002 today.
(B) You get JPY 2,996 seven days later. Combination 9: (A) You get JPY 3,008 today.
(B) You get JPY 3,011 seven days later.
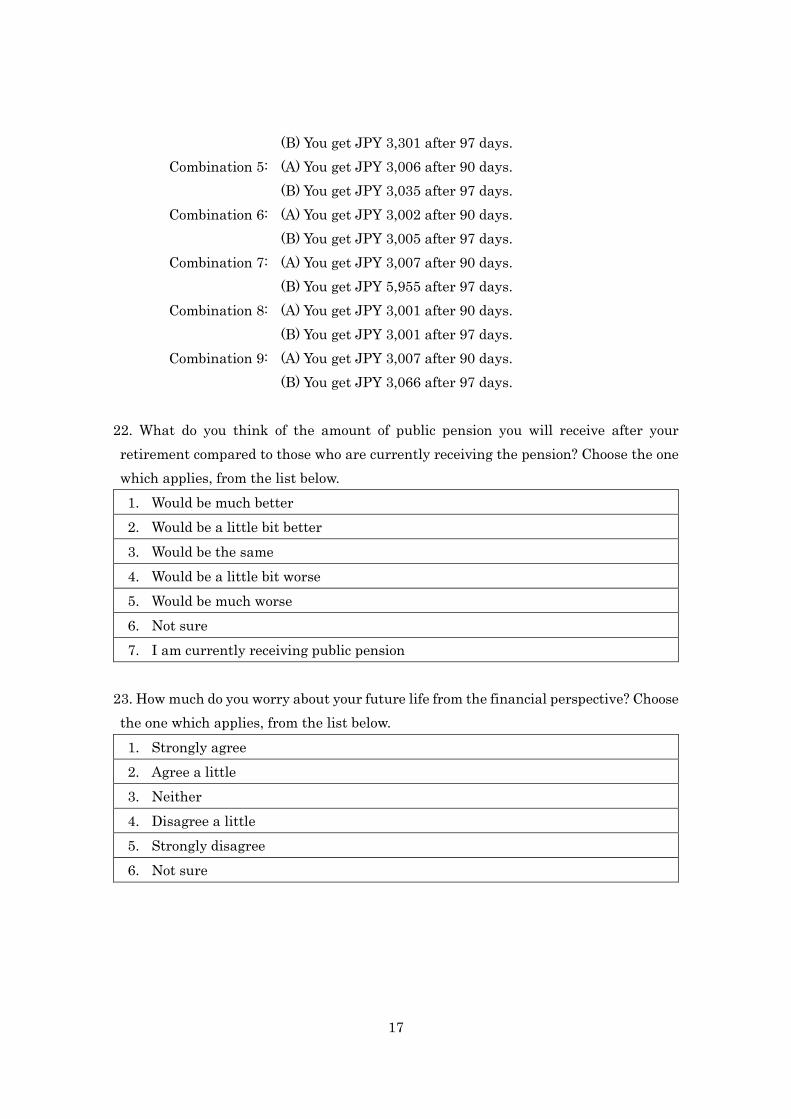
21.Suppose that you can get some money either 90 days later or 97 days later. However, the amount is different according to each option, as listed in the following 9 combinations. Which option, A or B listed below, do you like? Please circle your selection for all 9 combinations.
Combination 1: (A) You get JPY 3,005 after 90 days. (B) You get JPY 3,118 after 97 days.
Combination 2: (A) You get JPY 3,006 after 90 days. (B) You get JPY 3,000 after 97 days.
Combination 3: (A) You get JPY 3,000 after 90 days. (B) You get JPY 3,009 after 97 days.
Combination 4: (A) You get JPY 3,007 after 90 days.
17
(B) You get JPY 3,301 after 97 days. Combination 5: (A) You get JPY 3,006 after 90 days.
(B) You get JPY 3,035 after 97 days. Combination 6: (A) You get JPY 3,002 after 90 days.
(B) You get JPY 3,005 after 97 days. Combination 7: (A) You get JPY 3,007 after 90 days.
(B) You get JPY 5,955 after 97 days. Combination 8: (A) You get JPY 3,001 after 90 days.
(B) You get JPY 3,001 after 97 days. Combination 9: (A) You get JPY 3,007 after 90 days.
(B) You get JPY 3,066 after 97 days. 22. What do you think of the amount of public pension you will receive after your retirement compared to those who are currently receiving the pension? Choose the one which applies, from the list below. 1. Would be much better 2. Would be a little bit better 3. Would be the same 4. Would be a little bit worse 5. Would be much worse 6. Not sure 7. I am currently receiving public pension
23. How much do you worry about your future life from the financial perspective? Choose the one which applies, from the list below. 1. Strongly agree 2. Agree a little 3. Neither 4. Disagree a little 5. Strongly disagree 6. Not sure
18
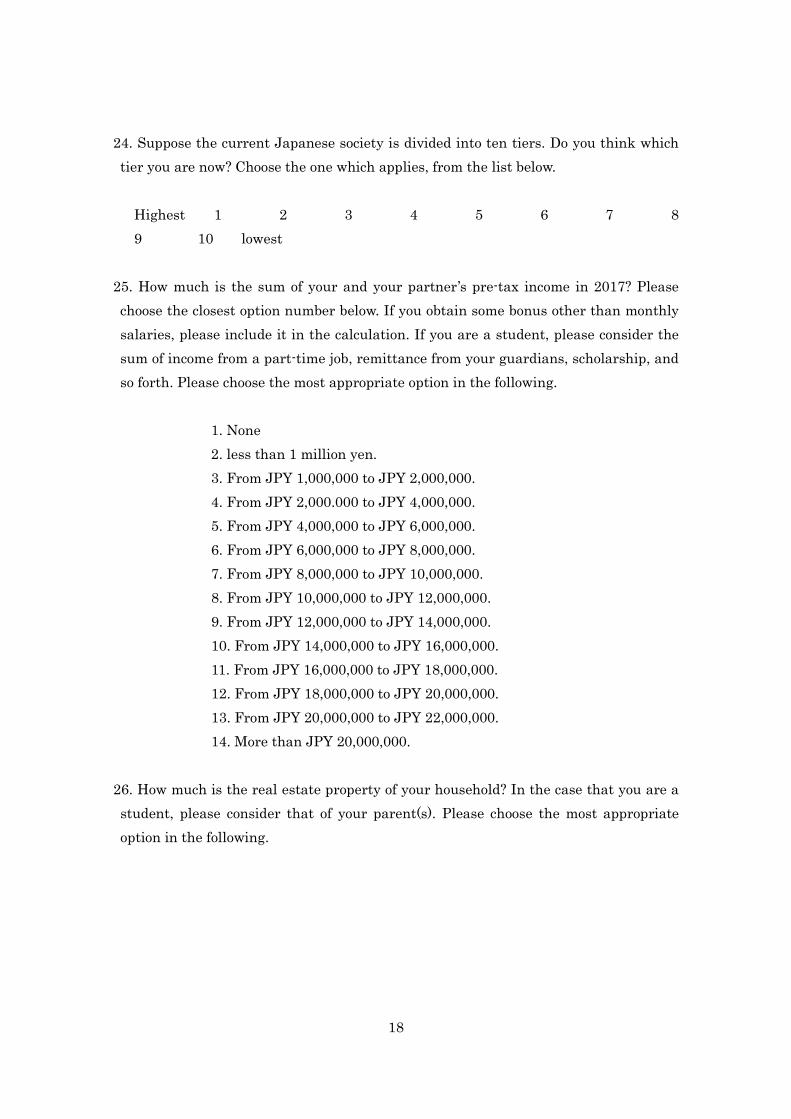
24. Suppose the current Japanese society is divided into ten tiers. Do you think which tier you are now? Choose the one which applies, from the list below.
Highest 1 2 3 4 5 6 7 8
9 10 lowest 25. How much is the sum of your and your partner’s pre-tax income in 2017? Please choose the closest option number below. If you obtain some bonus other than monthly salaries, please include it in the calculation. If you are a student, please consider the sum of income from a part-time job, remittance from your guardians, scholarship, and so forth. Please choose the most appropriate option in the following.
1. None 2. less than 1 million yen. 3. From JPY 1,000,000 to JPY 2,000,000. 4. From JPY 2,000.000 to JPY 4,000,000. 5. From JPY 4,000,000 to JPY 6,000,000. 6. From JPY 6,000,000 to JPY 8,000,000. 7. From JPY 8,000,000 to JPY 10,000,000. 8. From JPY 10,000,000 to JPY 12,000,000. 9. From JPY 12,000,000 to JPY 14,000,000. 10. From JPY 14,000,000 to JPY 16,000,000. 11. From JPY 16,000,000 to JPY 18,000,000. 12. From JPY 18,000,000 to JPY 20,000,000. 13. From JPY 20,000,000 to JPY 22,000,000. 14. More than JPY 20,000,000.
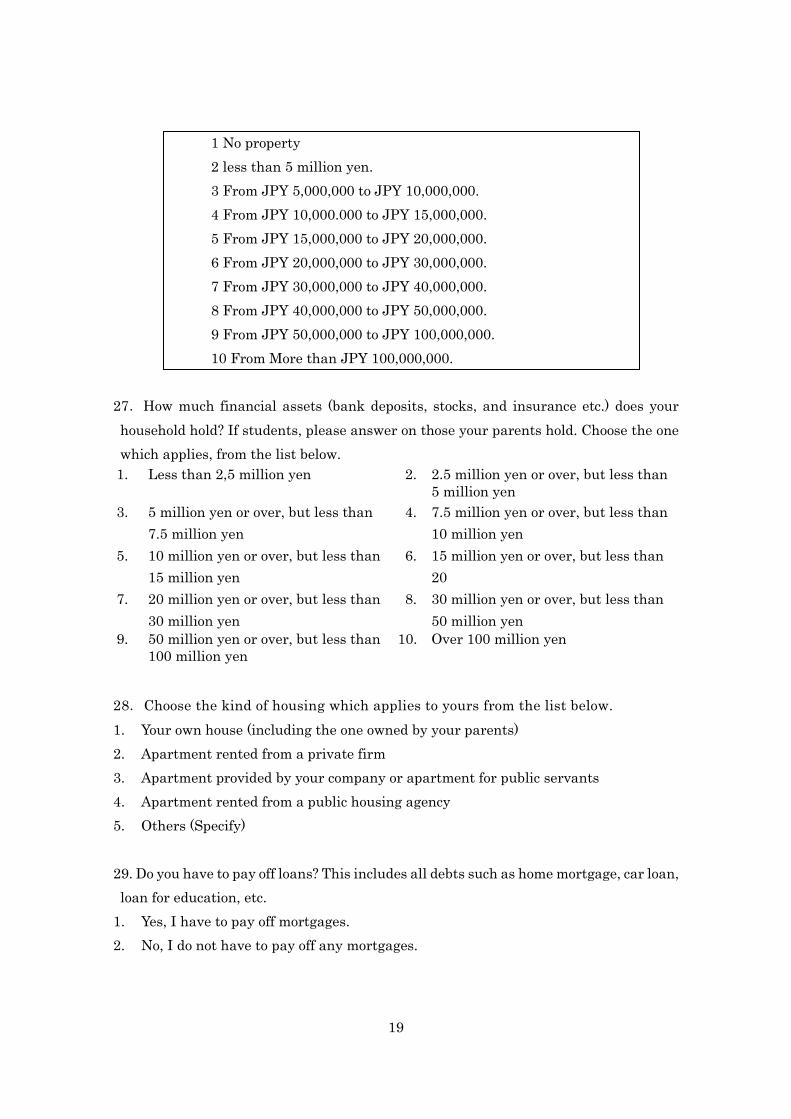
26. How much is the real estate property of your household? In the case that you are a student, please consider that of your parent(s). Please choose the most appropriate option in the following.
19
1 No property 2 less than 5 million yen. 3 From JPY 5,000,000 to JPY 10,000,000. 4 From JPY 10,000.000 to JPY 15,000,000. 5 From JPY 15,000,000 to JPY 20,000,000. 6 From JPY 20,000,000 to JPY 30,000,000. 7 From JPY 30,000,000 to JPY 40,000,000. 8 From JPY 40,000,000 to JPY 50,000,000. 9 From JPY 50,000,000 to JPY 100,000,000. 10 From More than JPY 100,000,000.
27.How much financial assets (bank deposits, stocks, and insurance etc.) does your household hold? If students, please answer on those your parents hold. Choose the one which applies, from the list below. 1. Less than 2,5 million yen 2. 2.5 million yen or over, but less than
5 million yen 3. 5 million yen or over, but less than
7.5 million yen 4. 7.5 million yen or over, but less than
10 million yen 5. 10 million yen or over, but less than
15 million yen 6. 15 million yen or over, but less than
20 7. 20 million yen or over, but less than
30 million yen 8. 30 million yen or over, but less than
50 million yen 9. 50 million yen or over, but less than
100 million yen 10. Over 100 million yen
28.Choose the kind of housing which applies to yours from the list below. 1. Your own house (including the one owned by your parents) 2. Apartment rented from a private firm 3. Apartment provided by your company or apartment for public servants 4. Apartment rented from a public housing agency 5. Others (Specify) 29. Do you have to pay off loans? This includes all debts such as home mortgage, car loan, loan for education, etc.
1. Yes, I have to pay off mortgages. 2. No, I do not have to pay off any mortgages.
20
30. How much home mortgage do you still have to pay off? Choose the one which applies from the list below. 1. No morgage 2. Less than 2.5 million yen 3. 2.5 million yen or over, but less than
5 million yen 4. 5 million yen or over, but less than
7.5 million yen 5. 7.5 million yen or over, but less than
10 million yen 6. 10 million yen or over, but less than
15 million yen 7.
9.
15 million yen or over, but less than 20 million yen Over 30 million yen
8.
20 million yen or over, but less than 30 million yen
31.Do you have loans other than home mortgage? If so, choose the amount outstanding which applies from the list below. Include all kinds of loans that you have to pay interest accrued from. 1. No loans other than mortgage 2. Less than 2.5 million yen 3. 2.5 million yen or over, but less than
5 million yen 4. 5 million yen or over, but less than 7.5
million yen 5. 7.5 million yen or over, but less than
10 million yen 6. 10 million yen or over, but less than 15
million yen 7.
9.
15 million yen or over, but less than 20 million yen Over 30 million yen
8.
20 million yen or over, but less than 30 million yen
32.Who do you live with at present? Choose the one which applies (choose only one) which applies from the list below. Include a cohabitating partner in“spouse.”
1. Live by yourself 2. Your parent(s) 3. Your spouse 4. Your spouse, child(ren) under 18 5. Your spouse, child(ren) at or over 18 6. Children under 18 (No spouse) 7. Children at or over 18 (No spouse) 8. Your spouse, his/her or your parent(s) 9. Your spouse, his/her or your parent(s), and children under age 18 10. Your spouse, his/her or your parent(s), and child(ren) at or over age 18 11. Friend(s) 12. Others (Specify)
21
33. How many people are currently living in your household including yourself? Please write specific numbers.
34. We would like to ask you about dependents in your family. Here, a dependent (one supported) is anyone claimed as such on the last tax return. You are ….
1. Supporting someone in the family 2. Supported by someone in your family 3. Neither supporting nor being supported (single-person household included) 35. How would you describe your current health status? 1. Excellent 2. Very good 3. Good 4. Fair 5. Poor 36. Please indicate your highest level of education completed. If you are still in school, select the one you are in now.
1. Graduated from elementary/ junior high school 2. Graduated from High School 3. Graduated from College - Associate's Degree (2 year) 4. Graduated from University - Bachelor's Degree (4 year) 5. Graduated from graduate school - Doctoral Degree 37.What is your labor union membership status? Choose the one which applies, from the list below. 1. Joins a workplace labor union. 2. Joins a labor union other than the workplace. 3. Not participating in labor union. 4. Not sure
22
38. We would like to ask you about your work. If you have more than one job, please answer one main job. Choose the one which applies, from the list below. 1. Self-employed 2. Regular employment 3. Non-regular employment 4. Dispatched worker 5. Public servant 6. Others 7. In the middle of job seeking
23
Figure 1. The composition of the general account revenue of Japan (FY 2019)
Source: The website of the Ministry of Finance Japan
Figure 2. Comparison of debt-to-GDP ratio (central and local governments, gross
financial liabilities) among some developed countries
Source: OECD Economic Outlook
0
50
100
150
200
250
2000
2001
2002
2003
2004
2005
2006
2007
2008
2009
2010
2011
2012
2013
2014
2015
2016
2017
% France Germany Italy Japan UK US
24
Figure 3. Movement of social security related expenditure in the central government budget
Source:The website of the Ministry of Finance Japan Figure 4a. Representativeness of our sample on region (The number of the respondents=7,000)
0
5
10
15
20
25
30
35
1997
1998
1999
2000
2001
2002
2003
2004
2005
2006
2007
2008
2009
2010
2011
2012
2013
2014
2015
2016
Trillion JPY
0.0
5.0
10.0
15.0
Hok
kaid
oAo
mor
iIw
ate
Miy
agi
Akir
aYa
mag
ata
Fuku
shim
aIb
arak
iTo
chig
iG
unm
aSa
itam
aCh
iba
Toky
oK
anag
awa
Niig
ata
Toya
ma
Ishi
kaw
aFu
kui
Yam
anas
hiN
agan
oSh
izuo
kaG
ifuAi
chi
Mie
Shig
aK
yoto
Osa
kaH
yogo
Nar
aW
akay
ama
Tott
ori
Shim
ane
Oka
yam
aH
iros
him
aYa
mag
uchi
Toku
shim
aK
agaw
aEh
ime
Koc
hiFu
kuok
aSa
gaN
agas
aki
Kum
amot
oO
itaM
iyaz
aki
Kag
oshi
ma
Oki
naw
a
project census(2015)
25
Figure 4b. Representativeness of our sample on household structure (The number of the respondents=7,000)
Figure 5a. Representativeness of our sample on region (The number of the respondents=2,147)
0.05.0
10.015.020.025.030.035.040.045.050.0
Single Yourself andspouse
Yourself,spouse,
child(ren)
Yourself andchild(ren)
without spouse
Yourself,spouse, and
parent(s)
Yourself,spouse,
child(ren), andparent(s)
Others
project census(2015)
-3.0
2.0
7.0
12.0
17.0
Hok
kaid
oAo
mor
iIw
ate
Miy
agi
Akira
Yam
agat
aFu
kush
ima
Ibar
aki
Toch
igi
Gunm
aSa
itam
aCh
iba
Toky
oKa
naga
wa
Niig
ata
Toya
ma
Ishi
kaw
aFu
kui
Yam
anas
hiNa
gano
Shiz
uoka
Gifu
Aich
iM
ieSh
iga
Kyot
oO
saka
Hyo
goNa
raW
akay
ama
Tott
ori
Shim
ane
Oka
yam
aH
irosh
ima
Yam
aguc
hiTo
kush
ima
Kaga
wa
Ehim
eKo
chi
Fuku
oka
Saga
Naga
saki
Kum
amot
oO
itaM
iyaz
aki
Kago
shim
aO
kina
wa
project census(2015)
26
Figure 5b. Representativeness of our sample on household structure (The number of the respondents=2,147)
Figure 6. The distribution of “ideal” consumption tax rate (The results for question 5)
0.05.0
10.015.020.025.030.035.040.045.050.0
Single Yourself andspouse
Yourself,spouse,
child(ren)
Yourself andchild(ren)
without spouse
Yourself,spouse, and
parent(s)
Yourself,spouse,
child(ren), andparent(s)
Others
project census(2015)
16.7
46.0
21.9
8.6 5.1
1.8 0
10
20
30
40
50
0-4% 5-9% 10-14% 15-19% 20-24% more than25%
(%)
27
Table 1. Summary statistics for question 1
Table 2. Summary statistics for question 2
Table 3. Summary statistics for question 3
Table 4. Summary statistics for question 4
28
Table 5. Summary statistics for question 6
Table 6. Summary statistics for question 7
29
Table 7. Correlation matrix
Recommended