Rational use of drugs:an overview
Kathleen HollowayTechnical Briefing Seminar
November 2009
Department of Essential Medicines and Pharmaceutical Policy TBS 2009

Department of Essential Medicines and Pharmaceutical PolicyTBS 2009
Objectives
• Define rational use of medicines and identify the magnitude of the problem
• Understand the reasons underlying irrational use
• Discuss strategies and interventions to promote rational use of medicines
• Discuss the role of government, NGOs, donors and WHO in solving drug use problems

Department of Essential Medicines and Pharmaceutical PolicyTBS 2009
The rational use of drugs requires that patients receive medications appropriate to their clinical needs, in doses that meet their own individual requirements for an adequate period of time, and at the lowest cost to them and their community.
WHO conference of experts Nairobi 1985
• correct drug
• appropriate indication
• appropriate drug considering efficacy, safety, suitability for the patient, and cost
• appropriate dosage, administration, duration
• no contraindications
• correct dispensing, including appropriate information for patients
• patient adherence to treatment

Department of Essential Medicines and Pharmaceutical PolicyTBS 2009
Adequacy of diagnostic processSource: Thaver et al SSM 1998, Guyon et al WHO Bull 1994, Krause et al TMIH 1998, Bitran HPP 1995, Bjork et al HPP 1992, Kanji et al HPP 1995.
0 10 20 30 40 50 60
Tanzania
Angola
Senegal
Burkino Faso
Bangladesh
Pakistan
% observed consultations where the diagnostic process was adequate

Department of Essential Medicines and Pharmaceutical PolicyTBS 2009
5-55% of PHC patients receive injections - 90% may be medically unnecessary
0% 10% 20% 30% 40% 50% 60%
Eastern Caribean
J amaica
El Salvador
Guatemala
Ecuador
L.AMER. & CAR.
Nepal
Indonesia
Yemen
ASIA
Zimbabwe
Tanzania
Sudan
Nigeria
Cameroon
Ghana
AFRICA
% of primary care patients receiving injections
Source: Quick et al, 1997, Managing Drug Supply
15 billion injections per year globally half are with unsterilized needle/syringe2.3-4.7 million infections of hepatitis B/C
and up to 160,000 infections of HIV per year associated with injections

Department of Essential Medicines and Pharmaceutical PolicyTBS 2009
0
5
10
15
20
25
30
35
FR GR LU PT IT BE SK HR PL IS IE ES FI BG CZ SI SE HU NO UK DK DE LV AT EE NL
DD
D p
er
1000 in
h. p
er
day
Variation in outpatient antibiotic use in 26 European countries in 2002
Source: Goosens et al, Lancet, 2005; 365: 579-587; ESAC project.

Department of Essential Medicines and Pharmaceutical PolicyTBS 2009
Database on medicines use
• Database of all medicines use surveys using standard indicators in primary care in developing and transitional countries
• Studies identified from INRUD biliog, PUBMED, WHO archives
• Data on study setting, interventions, methods and drug use extracted & entered
• All data extraction and entry checked by 2 persons
• Now > 900 studies entered• Systematic quantitative review• Evidence from analysis used for
WHA60.16 in 2007

Department of Essential Medicines and Pharmaceutical PolicyTBS 2009
% compliance with guidelines by WB region
0
10
20
30
40
50
60
1982-1994 1995-2000 2001-2006
Sub-Saharan Africa (n=29-48) Lat. America & Carrib (n=5-13)Middle East & C. Asia (n=4-8) East Asia & Pacific (n=7-11)South Asia (n=6-12)

Department of Essential Medicines and Pharmaceutical PolicyTBS 2009
Public / private treatment of acute diarrhoea by doctors, nurses, paramedical staff
0
10
20
30
40
50
60
70
80
% diarrhoea casesprescribed antibiotic
% diarrhoea casesprescribed anti-diarrhoeals
% diarrhoea casesprescribed ORS
Public (n=54-90) Private-for-profit (n=5-10)

Department of Essential Medicines and Pharmaceutical PolicyTBS 2009
Treatment of ARI by prescriber type
0
10
20
30
40
50
60
70
80
% viral URTI casesprescribed antibiotic
% pneumonia casesprescribed antibiotic
% ARI cases treated withcough syrup
Doctor (n=26-62) Nurse/paramedic (n=12-86) Pharmacy staff (n=9-17)

Department of Essential Medicines and Pharmaceutical PolicyTBS 2009
Overuse and misuse of antimicrobials contributes to antimicrobial resistance
• Malaria– choroquine resistance in 81/92 countries
• Tuberculosis– 0-17 % primary multi-drug resistance
• HIV/AIDS– 0-25 % primary resistance to at least one anti-retroviral
• Gonorrhoea – 5-98 % penicillin resistance in N. gonorrhoeae
• Pneumonia and bacterial meningitis – 0-70 % penicillin resistance in S. pneumoniae
• Diarrhoea: shigellosis– 10-90% ampicillin resistance, 5-95% cotrimoxazole resistance
• Hospital infections– 0-70% S. Aureus resistance to all penicillins & cephalosporins
Source: WHO country data 2000-3
Department of Essential Medicines and Pharmaceutical PolicyTBS 2009
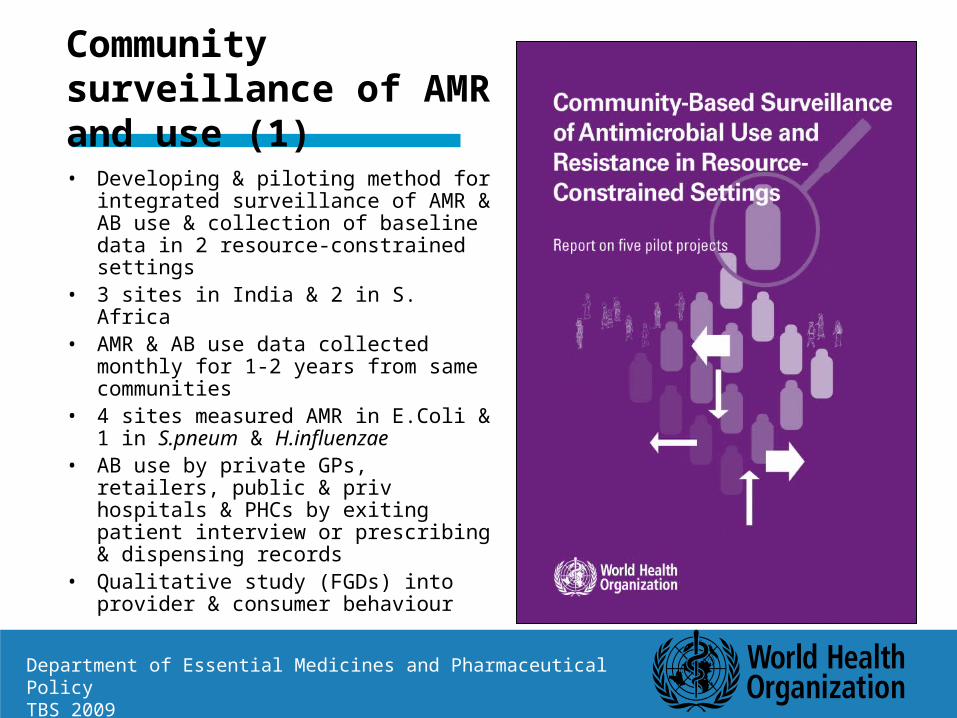
Community surveillance of AMR and use (1)
• Developing & piloting method for integrated surveillance of AMR & AB use & collection of baseline data in 2 resource-constrained settings
• 3 sites in India & 2 in S. Africa• AMR & AB use data collected
monthly for 1-2 years from same communities
• 4 sites measured AMR in E.Coli & 1 in S.pneum & H.influenzae
• AB use by private GPs, retailers, public & priv hospitals & PHCs by exiting patient interview or prescribing & dispensing records
• Qualitative study (FGDs) into provider & consumer behaviour

Department of Essential Medicines and Pharmaceutical PolicyTBS 2009
Community surveillance of AMR and use (2):results
• Antimicrobial resistance– pathogenic E.Coli in pregnant women's urine in India
• Cotrim 46-65%; Ampi 52-85%; Cipro 32-59%; Cefalex 16-50%– S.Pneumoniae & H.influenzae in sputa in S. Africa
• Cotrim > 50% (both organisms); Ampi >70% (H.influenzae)
• Antibiotic use– About ½ patients in India & ¼ or less of patients in S.Africa get ABs – Much inappropriate AB use especially in India e.g. use of fluoroquinolones
for coughs and colds in private sector
• Motivation of providers & consumers– Patient demand – looking for quick cure – Lack of CME & unwillingness to attend for fear of losing custom– Uncontrolled pharmaceutical promotion, involving financial gain

Department of Essential Medicines and Pharmaceutical PolicyTBS 2009
Adverse drug events
• 4-6th leading cause of death in the USA
• estimated costs from drug-related morbidity & mortality 30 million-130 billion US$ in the USA
• 4-6% of hospitalisations in the USA & Australia
• commonest, costliest events include bleeding, cardiac arrhythmia, confusion, diarrhoea, fever, hypotension, itching, vomiting, rash, renal failure
Source: Review by White et al, Pharmacoeconomics, 1999, 15(5):445-458

Department of Essential Medicines and Pharmaceutical PolicyTBS 2009
Changing a Drug Use Problem:An Overview of the Process
1. EXAMINEMeasure Existing
Practices(Descriptive
Quantitative Studies)
2. DIAGNOSEIdentify Specific
Problems and Causes(In-depth Quantitative and Qualitative Studies)
3. TREATDesign and Implement
Interventions (Collect Data to
Measure Outcomes)
4. FOLLOW UPMeasure Changes
in Outcomes (Quantitative and Qualitative
Evaluation)
improveintervention
improvediagnosis

Department of Essential Medicines and Pharmaceutical PolicyTBS 2009
Treatment Choices
Prior Knowledge
HabitsScientific Information
RelationshipsWith Peers
Influenceof DrugIndustry
Workload & Staffing
Infra-structure
Authority & Supervision
Societal
Information
Intrinsic
Workplace
Workgroup
Social &CulturalFactors
Economic &Legal Factors
Many Factors Influence Use of Medicines

Department of Essential Medicines and Pharmaceutical PolicyTBS 2009
Strategies to Improve Use of Drugs
Economic: Offer incentives
– Institutions– Providers and patients
Managerial: Guide clinical practice
– Information systems/STGs– Drug supply / lab capacity
Regulatory: Restrict choices
– Market or practice controls– Enforcement
Educational: Inform or persuade
– Health providers– Consumers
Use of Medicines

Department of Essential Medicines and Pharmaceutical PolicyTBS 2009
Educational StrategiesGoal: to inform or persuade
• Training for Providers– Undergraduate education– Continuing in-service medical education (seminars, workshops)– Face-to-face persuasive outreach e.g. academic detailing– Clinical supervision or consultation
• Printed Materials– Clinical literature and newsletters– Formularies or therapeutics manuals– Persuasive print materials
• Media-Based Approaches– Posters– Audio tapes, plays– Radio, television

Department of Essential Medicines and Pharmaceutical PolicyTBS 2009
Impact of Patient-Provider Discussion Groups on Injection Use in Indonesian PHC Facilities
Intervention Control0
20
40
60
80
% Prescribing Injections
PrePre
PostPost
Source: Hadiyono et al, SSM, 1996, 42:1185

Department of Essential Medicines and Pharmaceutical PolicyTBS 2009
Training for prescribersThe Guide to Good Prescribing
• WHO has produced a Guide for Good Prescribing - a problem-based method
• Developed by Groningen University in collaboration with 15 WHO offices and professionals from 30 countries
• Field tested in 7 sites
• Suitable for medical students, post grads, and nurses
• widely translated and available on the WHO medicines website

Department of Essential Medicines and Pharmaceutical PolicyTBS 2009
Managerial strategies Goal: to structure or guide decisions
• Changes in selection, procurement, distribution to ensure availability of essential drugs– Essential Drug Lists, morbidity-based quantification, kit systems
• Strategies aimed at prescribers– targeted face-to-face supervision with audit, peer group
monitoring, structured order forms, evidence-based standard treatment guidelines
• Dispensing strategies – course of treatment packaging, labelling, generic substitution

Department of Essential Medicines and Pharmaceutical PolicyTBS 2009
RCT in Uganda of the effects of STGs, training and supervision on % of Px conforming to guidelines
Randomisedgroup
No. healthfacilities
Pre-intervention
Post-intervention
Change
Control group 42 24.8% 29.9% +5.1%
Dissemination ofguidelines
42 24.8% 32.3% +7.5%
Guidelines + on-site training
29 24.0% 52.0% +28.0%
Guidelines + on-site training + 4supervisory visits
14 21.4% 55.2% +33.8%
Source: Kafuko et al, UNICEF, 1996.

Department of Essential Medicines and Pharmaceutical PolicyTBS 2009
Economic strategies:Goal: to offer incentives to providers an consumers
• Avoid perverse financial incentives – prescribers’ salaries from drug sales– insurance policies that reimburse non-essential
drugs or incorrect doses – flat prescription fees that encourage polypharmacy
by charging the same amount irrespective of number of drug items or quantity of each item

Department of Essential Medicines and Pharmaceutical PolicyTBS 2009
Pre-post with control study of an economic intervention (user fees) on prescribing quality in Nepal
Fees (completedrug courses)
control fee / Pxn=12
1-band item feen=10
2-band item feen=11
Av. no. itemsper prescription
2.9 2.9(+/- 0)
2.9 2.0(-0.9)
2.8 2.2(-0.6)
% prescriptionsconforming toSTGs
23.5 26.3(+2.7%)
31.5 45.0(+13.5%)
31.2 47.7(+16.5%)
Av.cost (NRs)per prescription
24.3 33.0(+8.7)
27.7 28.0(+0.3)
25.6 24.0(-1.6)
Source: Holloway, Gautam & Reeves, HPP, 2001

Department of Essential Medicines and Pharmaceutical PolicyTBS 2009
PHC prescribing with and without Bamako initiative in Nigeria
5.3
72.8
64.7
93
35.4
2.1
38
25.6
21
15.3
0 20 40 60 80 100
no.drug items/Px
% Px with injections
% Px with antibiotics
% pres EDL drugs
no.EDL drugs avail
21 Bamako PHCs 12 non-Bamako PHCs
Source: Scuzochukwu et al, HPP, 2002

Department of Essential Medicines and Pharmaceutical PolicyTBS 2009
Regulatory strategiesGoal: to restrict or limit decisions
• Drug registration• Banning unsafe drugs - but beware unexpected results
– substitution of a second inappropriate drug after banning a first inappropriate or unsafe drug
• Regulating the use of different drugs to different levels of the health sector e.g.– licensing prescribers and drug outlets– scheduling drugs into prescription-only & over-the-counter
• Regulating pharmaceutical promotional activities
Only work if the regulations are enforced

Department of Essential Medicines and Pharmaceutical PolicyTBS 2009
Intervention impact: largest % change in any medicines use outcome measured in each study
Intervention type No. studies Median impact 25,75th centiles
Printed materials 5 8% 7%, 18%
National policy 6 15% 14%, 24%
Economic strategies 7 15% 14%, 31%
Provider education 25 18% 11%, 24%
Consumer education 3 26% 13%, 27%
Provider+consumer education 12 18% 8%, 21%
Provider supervision 25 22% 16%, 40%
Provider group process 8 37% 21%, 59%
Essential drug program 5 28% 26%, 50%
Community case mgt 5 28% 28%, 37%
Providr+consumr ed & supervis 7 40% 18%, 54%
source: database on medicines use 2009

Department of Essential Medicines and Pharmaceutical PolicyTBS 2009
Impact of multiple interventions on injection use in Indonesia
Source: Long-term impact of small group interventions, Santoso et al., 1996
0%
20%
40%
60%
80%
100%
1 3 5 7 9 11 13 15 17 19 21 23 25
Months
Pro
po
rtio
n o
f vi
sits
wit
h i
nje
ctio
n
Comparison group Interactive group discussion
Interactive group discussion (IGC group only)
Seminar (both groups)
District-wide monitoring(both groups)

Department of Essential Medicines and Pharmaceutical PolicyTBS 2009
What national policies do countries have to promote rational use?
Source: MOH Pharmaceutical policy surveys 2003 and 2007
0 20 40 60 80 100
EML updated in last 2 years
STGs updated in last 2 years
UG doctors trained on EML/STGs
Obligatory CME for doctors
Drug Info Centre for prescribers
DTCs in >half general hospitals
Public education on antibiotic use
Antibiotic OTC non-availability
National strategy to contain AMR
Drug use audit in last 2 years
% countries implementing policies2007 (n>85) 2003 (n>90)
Department of Essential Medicines and Pharmaceutical PolicyTBS 2009
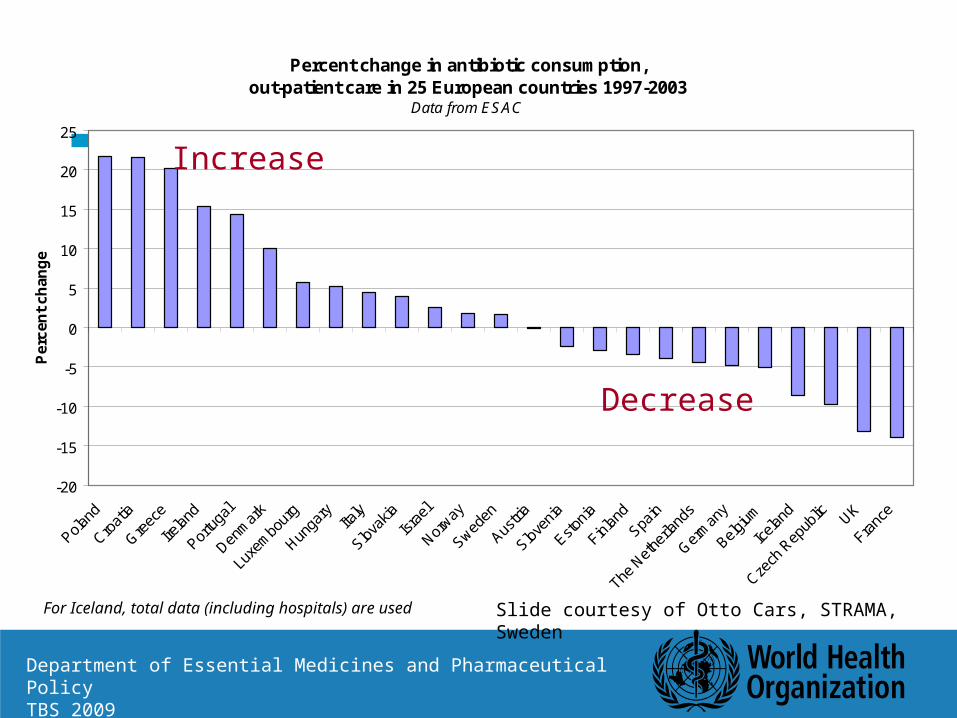
Percent change in antibiotic consumption,out-patient care in 25 European countries 1997-2003
Data from ESAC
-20
-15
-10
-5
0
5
10
15
20
25
Pe
rce
nt
cha
ng
e
For Iceland, total data (including hospitals) are used
Increase
Decrease
Slide courtesy of Otto Cars, STRAMA, Sweden

Department of Essential Medicines and Pharmaceutical PolicyTBS 2009
Percent change in antibiotic consumption,out-patient care in 25 European countries 1997-2003
Data from ESAC
-20
-15
-10
-5
0
5
10
15
20
25
Per
cen
t ch
ang
e
For Iceland, total data (including hospitals) are used
Co-ordination programs and national campaigns
Slide courtesy of Otto Cars, STRAMA, Sweden
Department of Essential Medicines and Pharmaceutical PolicyTBS 2009
Why does irrational use continue?
Very few countries regularly monitor drug use and implement effective nation-wide interventions - because…
• they have insufficient funds or personnel?• they lack of awareness about the funds wasted
through irrational use?• there is insufficient knowledge of concerning the cost-
effectiveness of interventions?

Department of Essential Medicines and Pharmaceutical PolicyTBS 2009
What are we spending to promote rational use of medicines ?
• Global sales of medicines 2002-3 (IMS): US$ 867 billion
• Drug promotion costs in USA 2002-3: US$ >30 billion
• Global WHO expenditure in 2002-3: US$ 2.3 billion
– Essential Medicines expenditure 2% (of 2.3 billion)
– Essential Medicines expenditure on promoting rational use of medicines 10% (of 2%)
– WHO expenditure on promoting rational use of medicines 0.2% (of 2.3 billion)

Department of Essential Medicines and Pharmaceutical PolicyTBS 2009
2nd International Conference for Improving Use of Medicines, Chiang Mai, Thailand, 2004472 participants from 70 countries
Recommendations for countries to:• Implement national medicines programmes to
improve medicines use• Scale up successful interventions • Implement interventions to address community
medicines use
http://www.icium.org

Department of Essential Medicines and Pharmaceutical PolicyTBS 2009
WHO priorities
• Resolution WHA60.16– Urges Member States " to consider establishing and/or
strengthening…a full national programme and/or multidisciplinary national body, involving civil society and professional bodies, to monitor and promote the rational use of medicines "
– WHO to support countries to implement resolution
• Continue to give technical advice to countries– Model EML and formulary– Training on promoting RUM in community, PHC, hospitals– Research to identify cost-effective interventions– Advocacy

Department of Essential Medicines and Pharmaceutical PolicyTBS 2009
Health systems with no national programs:•No coordinated action•No monitoring of use of medicines
Health systems with national programs:•Coordinated action•Regular monitoring of use of medicine
Develop national plans of action
Situational analysis
Modify action plans
Implement & evaluate national action plans using govt & local donor funds
WHO facilitating multi-stakeholder action in countries

Department of Essential Medicines and Pharmaceutical PolicyTBS 2009
Health system rapid appraisal tool (1): structurefor national stakeholders to rapidly appraise their own health systems in order to develop evidence-based national plans of action
• Introduction– How to use the tool (in workbook format) and carry out the assessment
(preparation, data collection, analysis)– Systematic data collection using document review, key informant
interviews and observation with triangulation of results
• Key respondent questionnaires– MOH senior dept managers (incl. dept pharmacy, DRA), – national drug supply organisation, insurance organisation(s), – health training institutions, health professional organisations, – health facility staff and health facility survey
• Data collation and analysis by component– Identify recommendations for each component
• Cross-cutting analysis & presentation to govt & donors– Analysis across components, prioritisation and formulation of national
recommendations (to be completed)

Department of Essential Medicines and Pharmaceutical PolicyTBS 2009
Health system rapid appraisal tool (2): components
• Components– Medicines use surveys and activities– Medicines policy framework– Health system factors
• Service delivery & human resources, insurance, drug supply, regulation, financial (dis)incentives
– Specific technical areas for RUM• National program coordination, MTCs, EMLs, STGs, monitoring,
provider & consumer education, independent medicines info, AMR
• Data for each component – Taken from key informant questionnaires & health facility survey,
identifying relevant data from coding system of questions
• Analysis for each component – Compares actual practice against best practice, choosing solutions from
a menu of interventions

Department of Essential Medicines and Pharmaceutical PolicyTBS 2009
Creating the WHO Essential Drugs Libraryto facilitate the work of national committees
WHOModel List
Summary of clinical guideline
Reasons for inclusionSystematic reviewsKey references
WHO Model Formulary
Cost:- per unit- per treatment- per month- per case prevented
Quality information:- Basic quality tests- Internat. Pharmacopoea- Reference standards
Evidence-based clinical
guideline

Department of Essential Medicines and Pharmaceutical PolicyTBS 2009
WHO-sponsored training programmes
• INRUD/MSH/WHO: Promoting the rational use of drugs
• MSH/WHO: Drug and therapeutic committees
• Groningen University, The Netherlands / WHO: Problem-based pharmacotherapy
• Amsterdam University, The Netherlands / WHO: Promoting rational use of drugs in the community
• Newcastle, Australia / WHO: Pharmaco-economics
• Boston University, USA / WHO: Drug Policy Issues

Department of Essential Medicines and Pharmaceutical PolicyTBS 2009
Global monitoring and identifying effective strategies to promote rational use of medicines
• WHO/EMP databases on drug use and policy– quantitative data on medicines use and interventions to
improve medicines use from 1990 to present day– data from MOHs on pharmaceutical policies every 4 years –
1999, 2003, 2007
• ICIUM3 in 2011– 3rd international conference on improving the use of
medicines (ICIUM3)
• Surveillance of antimicrobial use & resistance– method for community-based surveillance in poor settings– interventional approach for improving use in private sector
Department of Essential Medicines and Pharmaceutical PolicyTBS 2009
Conclusions
• Irrational use of medicines is a very serious global public health problem.
• Much is known about how to improve rational use of medicines but much more needs to be done– policy implementation at the national level– implementation and evaluation of more interventions,
particularly managerial, economic and regulatory interventions
• Rational use of medicines could be greatly improved if a fraction of the resources spent on medicines were spent on improving use.

Department of Essential Medicines and Pharmaceutical PolicyTBS 2009
ActivityDiscuss in groups the following questions
• What should be the roles of:• government, • NGOs and donors, • WHO,
in promoting the rational use of medicines?
Recommended