1
TEACHERS, REMUNERATION AND PERFORMANCE OF SCHOOLS UNDER
UNIVERSAL PRIMARY EDUCATION (UPE) SYSTEM IN UGANDA. A CASE
STUDY OF WAKISO DISTRICT
BY
BABIRYE BARBARA
REG NO. 05/U/8778/EXT
SUPERVISED BY
Ms. MBATUDDE SHEILA
RESEARCH REPORT SUBMITTED IN PARTIAL FULFILMENT OF THE
REQUIREMENTS FOR THE A WARD OF BACHELOR OF COMMERCE OF
MAKERERE UNIVERSITY
AUGUST 2011
i
DECLARATION
I, Babirye Barbara declare that this research report is my original work. It has not been
submitted to any other University or higher institution for any award and where it is
indebted to work of others, due acknowledgement has been made.
Signature …………………………. Date…………………………
BABIRYE BARBARA
REG. NO. 05/U/8778/EXT
ii
APROVAL
This work entitled ―Teachers‘ Remuneration and Performance of schools under Universal
Primary Education (UPE) system in Uganda. A case study of Wakiso district‖ has been
under my supervision.
Signature ………………………………. Date………………………
Ms. MBATUDDE SHEILA
SUPERVISOR
iii
DEDICATION
I dedicate this piece of work to my dear parents, Salongo Ssenfuma Gerald and Nalongo
Ssenfuma Prossy who foresaw the treasure in education, supported and inspired me in my
academic pursuits. I also dedicate this piece of work to my Big Sister Ms. Nakamya
Florence who has missed a lot for my sake
iv
ACKNOWLEDGEMENT
First and foremost, I want to thank the almighty God for sailing me through all that I have
gone through during my course.
I acknowledge my supervisor Ms. Mbatudde Sheila for tirelessly scrutinizing and proof
reading this text and for the support offered during my report writing.
I would further like to thank ma friends for the support and encouraging words in all that
we went through.
I also thank my respondents for allowing me to carryout this research with minimal
obstacles mainly during data collection.
Lastly, I would like to thank my dear parents, sisters and brothers for the moral and
material support they gave me during the struggle. May the good Lord bless them
abundantly!
v
TABLE OF CONTENTS
DECLARATION ........................................................................................................................ i
APROVAL ................................................................................................................................. ii
DEDICATION .......................................................................................................................... iii
ACKNOWLEDGEMENT ........................................................................................................ iv
TABLE OF CONTENTS ........................................................................................................... v
LIST OF TABLES .................................................................................................................... vii
ABSTRACT ............................................................................................................................ viii
CHAPTER ONE ......................................................................................................................... 1
1.0 Introduction ........................................................................................................................... 1
1.1 Background to the study ........................................................................................................ 1
1.2 Problem statement. ................................................................................................................ 3
1.3 Purpose of the study .............................................................................................................. 3
1.4 Objectives of the study .......................................................................................................... 3
1.5 Research questions ................................................................................................................ 3
1.6 Scope of the study ................................................................................................................. 4
1.7 Significance of the study ....................................................................................................... 4
CHAPTER TWO ........................................................................................................................ 5
LITERATURE REVIEW ............................................................................................................ 5
2.1 Indicators of Remuneration.................................................................................................... 5
2.2 Motivation and performance. ................................................................................................. 6
2.3 Fringe benefits and performance .......................................................................................... 10
2.4 Nature of working conditions and performance .................................................................... 11
2.5 Performance ........................................................................................................................ 15
2.5.1 Performance measurements .............................................................................................. 15
2.6 Relationship between remuneration and performance........................................................... 17
2.7 Conclusion .......................................................................................................................... 23
CHAPTER THREE ........................................................................................................................ 24
METHODOLOGY ........................................................................................................................ 24
3.1 Introduction. ........................................................................................................................ 24
3.2 Research design. .................................................................................................................. 24
3.3 Study population. ................................................................................................................ 24
vi
3.4.1 Sample size. ..................................................................................................................... 24
3.4.2 Sampling technique. ......................................................................................................... 25
3.5 Sources of data .................................................................................................................... 25
3.6 Data collection methods. ..................................................................................................... 25
3.7 Measurement of variables .................................................................................................... 25
3.8 Data processing, presentation and analysis ........................................................................... 26
3.9 Limitations of the study. ...................................................................................................... 26
CHAPTER FOUR ..................................................................................................................... 27
PRESENTATION, ANALYSIS AND DISCUSSION OF FINDINGS ....................................... 27
4.0 Introduction ......................................................................................................................... 27
4.1 Response rate ...................................................................................................................... 27
4.2 Findings on general information .......................................................................................... 27
4.3: To establish the relationship teachers‘ Remuneration and performance of schools under UPE
system ....................................................................................................................................... 31
CHAPTER FIVE ...................................................................................................................... 34
SUMMARY, CONCLUSIONS AND RECOMMENDATIONS OF THE FINDINGS ............... 34
5.0 Introduction ......................................................................................................................... 34
5.1 Summary of findings ........................................................................................................... 34
5.2 Conclusions ......................................................................................................................... 35
5.3 Recommendations ............................................................................................................... 35
5.4 Areas for further research .................................................................................................... 36
REFERENCES ......................................................................................................................... 37
APPENDIX I: QUESTIONNAIRE .......................................................................................... 43
APPENDIX II : PROPOSED BUDGET ................................................................................... 47
APPENDIX III: INTRODUCTORY LETTER ......................................................................... 48
vii
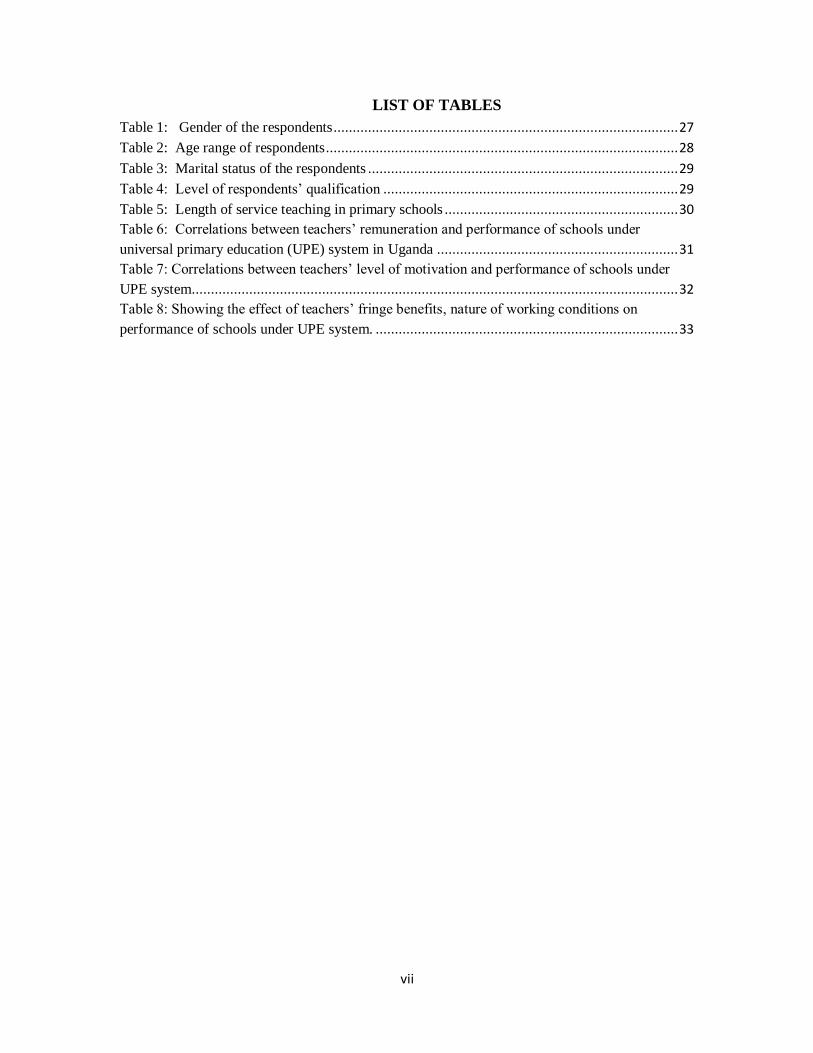
LIST OF TABLES
Table 1: Gender of the respondents .......................................................................................... 27
Table 2: Age range of respondents ............................................................................................ 28
Table 3: Marital status of the respondents ................................................................................. 29
Table 4: Level of respondents‘ qualification ............................................................................. 29
Table 5: Length of service teaching in primary schools ............................................................. 30
Table 6: Correlations between teachers‘ remuneration and performance of schools under
universal primary education (UPE) system in Uganda ............................................................... 31
Table 7: Correlations between teachers‘ level of motivation and performance of schools under
UPE system............................................................................................................................... 32
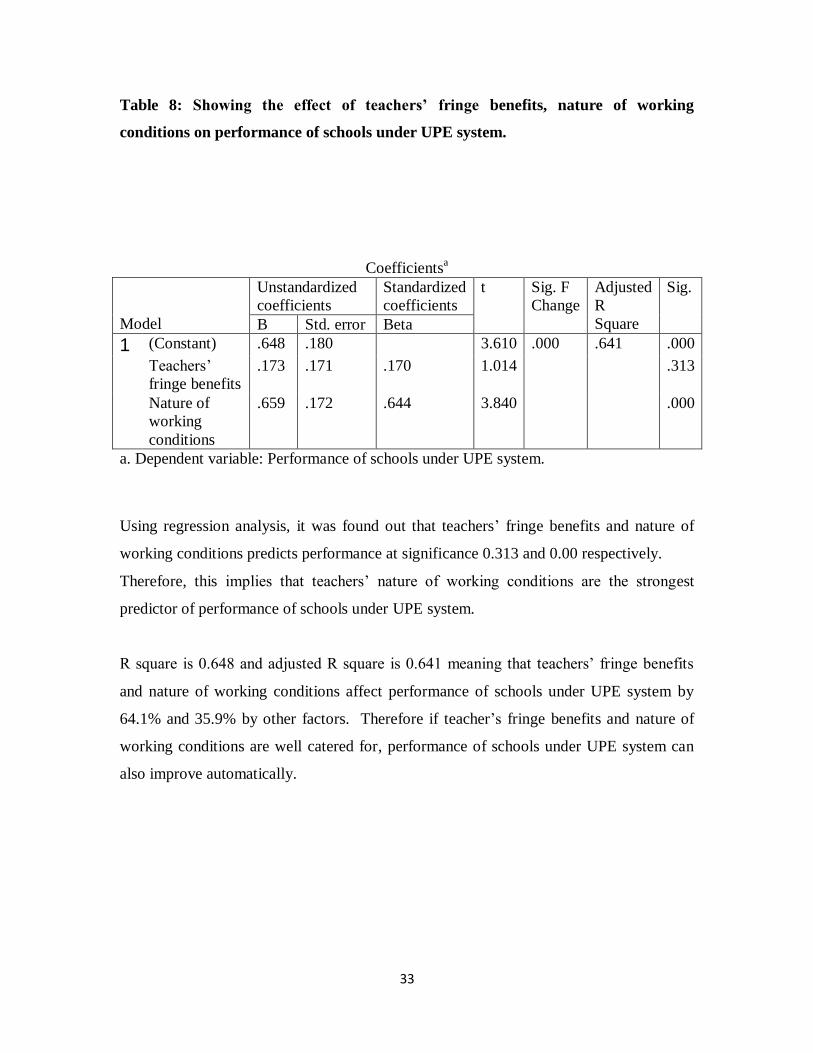
Table 8: Showing the effect of teachers‘ fringe benefits, nature of working conditions on
performance of schools under UPE system. ............................................................................... 33
viii
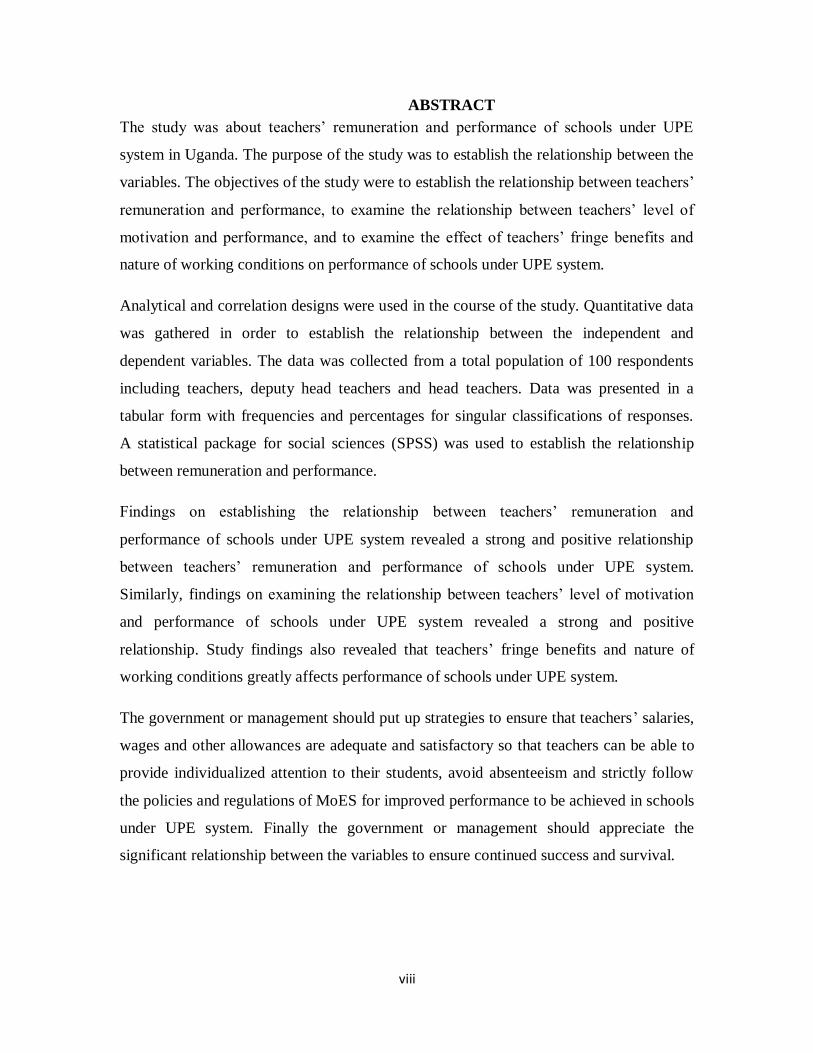
ABSTRACT
The study was about teachers‘ remuneration and performance of schools under UPE
system in Uganda. The purpose of the study was to establish the relationship between the
variables. The objectives of the study were to establish the relationship between teachers‘
remuneration and performance, to examine the relationship between teachers‘ level of
motivation and performance, and to examine the effect of teachers‘ fringe benefits and
nature of working conditions on performance of schools under UPE system.
Analytical and correlation designs were used in the course of the study. Quantitative data
was gathered in order to establish the relationship between the independent and
dependent variables. The data was collected from a total population of 100 respondents
including teachers, deputy head teachers and head teachers. Data was presented in a
tabular form with frequencies and percentages for singular classifications of responses.
A statistical package for social sciences (SPSS) was used to establish the relationship
between remuneration and performance.
Findings on establishing the relationship between teachers‘ remuneration and
performance of schools under UPE system revealed a strong and positive relationship
between teachers‘ remuneration and performance of schools under UPE system.
Similarly, findings on examining the relationship between teachers‘ level of motivation
and performance of schools under UPE system revealed a strong and positive
relationship. Study findings also revealed that teachers‘ fringe benefits and nature of
working conditions greatly affects performance of schools under UPE system.
The government or management should put up strategies to ensure that teachers‘ salaries,
wages and other allowances are adequate and satisfactory so that teachers can be able to
provide individualized attention to their students, avoid absenteeism and strictly follow
the policies and regulations of MoES for improved performance to be achieved in schools
under UPE system. Finally the government or management should appreciate the
significant relationship between the variables to ensure continued success and survival.
1
CHAPTER ONE
1.0 Introduction
This chapter presents background to the study, problem statement, purpose, objectives,
research questions, scope and significance of the study.
1.1 Background to the study
UPE has been implemented as a major strategy for poverty reduction and economic
benefits in the long run (MoES, 2000). It was aimed at providing basic education for all
children aged between 6-12 years (MoES, 1998). Since 1997,UPE has made remarkable
developments like increased teacher enrolment, increment in teacher salaries as a result
of scrapping off of PTA, increase in number of government aided schools and increased
student enrolment whereby in some places like in rural areas pupil to teacher ratio
exceeded 100-one( Ministry of Education and statistics, 2002).
However despite of all the above mentioned achievements, performance of schools under
UPE system has remained very poor and this could be attributed to poor teacher
remuneration. Remuneration was defined by Maicibi (2005) as pay or reward to
individuals‘ work done. He quoted that remuneration was an important factor especially
affecting performance in most organizations. On the other hand, Nkata (2004) defines
performance as levels at which organizations through an aggregation of performance of
individuals are able to accomplish a mission in respect of effectiveness and efficiency in
service delivery so as to attain stakeholders‘ objectives. UNESCO (2006) adds that poor
performance of schools in Uganda in general was documented to be the outcome of poor
remuneration of teachers.
Silvie Lambert (2004) observed that low and irregular wages for teachers especially in
rural areas was a common problem in remuneration of teachers in schools under the UPE
system. In addition, the primary teachers‘ payroll was poorly managed causing delayed
access to it by the teachers. Allegretto, Corcoran and Mishel (2008) compared weakly
wages of fulltime public teachers with those of the people working in occupations
2
requiring comparable education and skills such as accountants, reporters, registered
nurses and computer programmers and concluded that teachers‘ pay fell behind that of
many professionals with similar and comparable education backgrounds and the gap
widened substantially in the recent years. Teachers‘ salaries can be understood in the
context of (PDL), meaning that it‘s not enough for them to meet their needs. David Tash
Lumu (2010) noted that teachers‘ salary scale of about (shs 200,000) has remained
constant for so long despite the ever increasing cost of living and lack of teachers‘ houses
was singled out as across cutting challenge which was reported every where.
Teachers under the UPE system are demoralized by the poor pay and hence teaching
being considered the profession of the last resort while teacher absenteeism is a common
practice (Silvie Lambert, 2004 and ANNAPCAN, 2008). Teacher turnover in schools
under UPE system is high. According to Diane Trim (2010) teacher turnover is higher in
schools with low salaries and poor working conditions. The poor UPE national result is
also another outcome of poor remuneration of teachers. Moreover, there is double
difference in estimates for the examination figures between public (UPE) schools and
private schools. The results in public (UPE) schools are poor as compared to private
schools (Ministry of Education and Statistics, 2002).
In conclusion the government, managers and administrators in institutions should always
appreciate, evaluate positively and allocate rewards and incentives more appropriately to
their staff for maximum performance and to achieve the desired or set goals and
objectives.
3
1.2 Problem statement. Despite of all the efforts, achievements and remarkable developments that the Ugandan
government claims like the increase in government aided primary schools, increased
student enrolment and increase in teachers‘ salaries (MoES, 2000), the performance of
schools under UPE system is still poor and this could be due to poor remuneration of
teachers, fact being that teachers‘ salary scale of shs 200,000 has remained constant for
so long despite of the increasing cost of living in the country (David Tash Lumu, 2010).
And this has also demoralized teachers leading to poor performance of schools under the
UPE system which in the end can result into lack or loss of credibility of the government.
1.3 Purpose of the study
The study is intended to establish the relationship between teachers‘ remuneration and
performance of schools under the UPE system.
1.4 Objectives of the study
To establish the relationship between teachers‘ remuneration and performance of schools
under UPE system.
To examine the relationship between teachers‘ level of motivation and performance of
schools of schools under UPE system.
To examine the effect of teachers‘ fringe benefits and nature of working conditions on
performance of schools under UPE system.
1.5 Research questions
What is the relationship between teachers‘ remuneration and performance of schools
under UPE system?
What is the relationship between teachers‘ level of motivation and performance of
schools under UPE system?
What effect does teachers‘ fringe benefits and nature of working conditions have on
performance of schools under UPE system.
4
1.6 Scope of the study
The study on teachers‘ remuneration and performance of schools under UPE system was
conducted in five schools under UPE system in Wakiso district and these were; St
Aloysius Primary school Kyengera, St Josephs‘ Primary school Nabbingo, Nsangi Mixed
Primary school, Kyengera Muslim Primary school and Muggongo Primary school. The
target population involved teachers, deputy head teachers and head teachers.
Questionnaires were used to collect data. The study was specifically to establish the
relationship between teachers‘ remuneration and performance of schools under UPE
system.
1.7 Significance of the study
The findings of the study may have the following implications;
To researchers, findings would contribute to the existing literature for academicians who
may serve to unearth new areas of research and provide much needed reference materials
at higher levels of learning.
To policy makers and implementers, the study will assist to focus on their action to
remunerate teachers towards improved performance of schools.
The study is also hoped to inspire other researchers to carryout similar studies in respect
to other institutions.
It is aimed at enabling the government to realize the importance of teachers‘
remuneration and the stabilization it creates on performance of schools under UPE
system.
5
CHAPTER TWO
LITERATURE REVIEW
2.1 Indicators of Remuneration According to Maicibi (2005) remuneration is referred to as pay or reward given to
individuals work done. He quoted that remuneration was an important factor especially in
affecting performance in most organizations. The indicators of remuneration include;
basic salary, wages, healthy schemes, pension schemes, transport allowances, overtime
allowances and responsibility allowances.
Basic salary: According to Bratton and Gold (2003:292) a salary is a fixed periodical
payment for non-manual employees usually expressed in annual terms, paid per month
with generally no additions for productivity. Salary is a fixed amount of money or
compensation paid to an employee by an employer in return for work performed. Salary
is paid, most frequently, in a bi-weekly pay check to an exempt or professional employee.
In most years, an employee‘s salary is paid in 26 even pay checks over the course of the
year.
Wage : Refers to payment for labor or services to a worker, especially remuneration on
an hourly, daily, or weekly basis or by the piece. Is also a payment to manual workers,
always calculated on hourly or price rates (Bratton and Gold, 2003:292). According to
the Wages Act 1986, a wage is any sum payable to the employee by an employer in
connection with that employment. Therefore it includes fees, bonuses, commissions,
holiday pay or other emolument relevant to the employment whether specified in the
contract of employment or not. Wages include company sick pay and any other statutory
payments for example payment for time off for trade union duties and jury service.
According to Farazmand (2007) employees who receive the same wages regularly are
more likely to perform poorly than employees who receive some incentives. Increasing
wages motivates employees in the organization and makes it easy for them to perform
well.
Pension scheme: This is one in which an employer promises a specified monthly benefit
on retirement that is predetermined by a formula based on the employee's earnings
6
history, tenure of service and age, rather than depending on investment returns ( Lee Ann
Obringer, 2011).
Health scheme: Another indicator of remuneration is health insurance scheme, which is
not offered by all companies and varies as to quality and cost. Companies typically pay
part of the insurance premium. Health insurance may or may not extend to immediate
family members like spouses and minor children. Dental and life insurance could also be
offered as part of a remuneration package (Lee Ann Obringer, 2011).
Transport allowance: This is granted to an employee to meet his expenditure for purpose
of Commuting between place of his residence & place of duty (Abhishek Raja, 2010). In
the context of the study, transport allowance is given to teachers to commute between
place of residence and school of work.
Accommodation or housing allowance: This is the amount of money paid in
compensation for basic living expenses for employment situations. Amount of money
given to teachers to cater for their living expenses for employment situation (Knyszewska
Elżbieta, 2010).
Overtime allowance: is the additional amounts paid to hourly employees who work more
than 40 hours in a week (Jean Murray, 2010). According to the context of the study this
implies that if teachers work beyond stipulated time, they are entitled to this additional
pay or over time allowance.
2.2 Motivation and performance. Jakolya (2006) defines motivation as incentives that induce an individual to perform.
They are identified as incentives that sharpen the employee‗s drive to satisfy their wants.
For example, people in a business which has developed a reputation for excellence and
high quality tend to be motivated to contribute to this reputation. He further explains
motivation as intrinsic and extrinsic motivation;
Intrinsic motivation refers to self motivated factors that influence people to behave in a
particular manner or to move to a particular direction. Its seen as a behavior for its own
sake in order to experience pleasure and satisfaction such as joy of doing a particular
7
activity or satisfying one‘s curiosity (Dornyei,2001b:49). Ryan and Deci (2000b:71) adds
that extrinsic motivation is concerned with performance of an activity to succeed in
getting separable outcomes, which contracts sharply with intrinsic motivation. He quoted
that positive performance feedback increases intrinsic motivation while negative
performance feedback decreases it. This implies that motivation greatly affects
performance of an organisation.
Motivation according to Harmer (2001:51) pushes some one to do something in order to
achieve something. It is also thought to be responsible for why people decide to do
something, how long they are willing to sustain the activity and how hard they are going
to pursue it (Dornyei, 2001:8). Additionally, Ryan and Deci (2000:54) states that to be
motivated moves some one to do something. Unlike unmotivated people who have lost
impetus and inspiration to act, motivated employees are energized and activated to the
end of the task which ensures better performance in the organization. Farazmand (2007)
postulates that motivation in an organization determines employee performance. He notes
that most organizations have hard poor productivity because they do not motivate their
employees. This implies that motivation affects performance.
In Victor Vroom‘s expectancy theory (1964) people are motivated depending on their
perceived job expectancy. They are also motivated if they feel that performance will lead
to certain outcomes such as praise, pay and promotion. Therefore an employee‘s belief
regarding what is expected out of his job determines his motivational level. J. Stacy
Adams (1965) in his equity theory of motivation adds that motivation of employees is
influenced by the extent to which they perceive that they are treated fairly. They evaluate
their in puts with someone in a comparable organizational situation. For example David
Tash Lumu (2010) points out that teachers are the least motivated civil servants. He
quotes that compared to other civil servants, teachers remain the least motivated. Their
salary scale (about Shs 200,000) has remained constant for so long despite the ever
increasing costs of living. Lack of teacher‘s houses was singled out as a cross-cutting
challenge.
Perry et al (2006) reviewed diverse literature on motivation and concluded that
motivation incentives significantly improve employee performance, but effectiveness is
8
dependent upon organizational conditions. This is especially pertinent for service
organizations when financial reinforcements tend to produce a stronger result as seen
with a composite approach. Jakolya (2006) argued that a person might have job
satisfaction but with a low level of motivation or the reverse is true. Understandably, the
probability exists that highly motivated persons with low job satisfaction will look for
other positions. Likewise people who find their positions rewarding but being paid
considerably less than they desire or think they desire will search for other jobs.
According to the context of the study some teachers have lost love for their profession
because they are poorly motivated.
Farazmand (2007) postulates that performance is higher in those organizations where
employees are adequately motivated. Therefore poor performance in schools under the
UPE system could be due to low level of teacher motivation. Managers are supposed to
create good working environment so as to motivate employees towards improved
performance of the organization. Dornyei (2001c:135) discovered that undesirable
demands of administrators, discouraging team spirit, neglecting rewards, financial
problems are factors related to demotivation. It should be noted that every teacher is not
motivated by entirely by the same demands and needs. Job satisfaction of each employee
is often different from one another and without having intrinsic motivation; lack of
success and poor performance is inevitable. If there are no other factors motivating
teachers, the productivity and performance will decease dramatically.
According to Farazmand (2007) motivation of employees is affected by the wage system.
Employees who receive the same wages regularly are more likely to perform poorly than
employees who receive some incentives. Increasing wages motivates employees in the
organization and makes it easy for them to perform well. Employee motivation is also
affected by rewards. Managers are supposed to appreciate the performance of different
employees in an organization so as to motivate them towards improved performance.
Similarly, Mark Bing (2010) low motivation stems from poor organizational and
behavioral skills. Most of the employees feel less motivated to perform their task and
refrain from using their productive skills to good use. Top management books
recommend that goal setting, regular feedback and an effective reward setup in an
9
organization are very important factors for motivation. If an organization does not keep
up to the expectations of the employees, low employee motivation is inevitable which
greatly affects performance.
In addition, employee motivation is affected by working environment. Poor working
environment affects employee motivation and leads to poor performance among
employees and the organization as well. Promotion helps employee helps employee
motivation in an organization which leads to leads to improved performance. Also job
security and royalty to employees helps to motivate employees to perform better. For
example employees are more likely to perform better if they are assured of their jobs
(Farazmand, 2007).
In institutions like schools, where employees (teachers) have already satisfied their
physiological needs like land shelter clothing education and medical care salary is no
longer a motivator but anything that can help them to meet their other needs (Robbins
2003).
Other scholars like Victor Vroom observed that money becomes a motivator only when
it satisfies individual personal goals and this is dependent on performance criteria
(Robbins,2003:80).This means that workers(teachers) are satisfied with their jobs when
salaries and wages given to them can satisfy their needs.
Research studies by Amstrong (2003), observed that external motivational practices like
salaries and wages have a powerful effect on employees performance but do not
necessarily last long. Maicibi (2003) postulates that salary increment is no longer a
motivator to some employees because every time or moment employees adjust a new
style. This perception makes them feel that the next quantity of money would be
appropriate to meet their needs hence administrators should never expect their staff to
openly say ‗we are satisfied and we no longer need a salary increment‘. This is in line
with the research findings by Robbins (2003) that additional amounts of money offered
for performance, are not always perceived as significant by employees and teachers are
no exception
10
Therefore managers and administrators in institutions should always appreciate, evaluate
positively and allocate rewards and incentives more appropriately to their staff for
maximum performance (Robbins, 2003).
2.3 Fringe benefits and performance
Fringe benefits are extra benefits given to the employees in addition to salary and wages.
Bratton and Gold (2003:292), referred to these allowances (fringe benefits) as the non
financial rewards added to the basic pay, related to work behaviors, performance,
learning and experience. The characteristics of fringe benefits include; promotion,
advancement and job stability, leadership allowance, overload allowance, responsibility
and recognition allowance.
Hanushek (2009) observed that teachers‘ fringe benefits in developing countries include
promotion, advancement, and job stability. However a problem with some third world
countries is that there is poor school quality because little attention is paid to non-
monetary amenities as with monetary amenities. The non-monetary in the study are the
same as fringe benefits and according to Hanushek‘s observation poor provision of
teacher fringe benefits is the result for poor school performance.
Fringe benefits may be in form of leadership allowances, responsibility allowances,
overload and overtime allowances, recognition and promotions. Fringe benefits in
institutions provide a basis on which employees work towards the achievement of set
goals. Therefore schools administrators and managers in institutions often use fringe
benefits as means of improving performance (Dessler2003:204). And this can only mean
that provision of fringe benefits has an effect on performance.
According to Mingat (2002) if teachers‘ compensation becomes too low, it can be feared
that teachers‘ commitment to their jobs will be affected. However in schools where fringe
benefits are on equitable grounds based on performance indicators of individuals, derive
attraction, participation, commitment and improved performance. In schools under the
UPE system, fringe benefits rarely exist and their inadequacy are the reason for
increased teacher absenteeism, corruption, job dissatisfaction, little or no love for the
11
profession, reluctance in teaching and marking and late syllabus coverage hence leading
to poor performance.
More to this, fringe benefits in schools under UPE system only exist in theories, meaning
that teachers do not practically receive them, and where they exist they are not paid or
availed within stipulated time which demoralizes them and little efforts have been put in
place by the government to analyze the situation thus leaving a gap between them hence
affecting performance of schools under UPE system.
Robbins (2003) indicated that employees who are unsatisfied with their jobs had many
absenteeism rates than those with job satisfaction and with many attendance levels. He
concluded that employee satisfaction and performance are connected with absenteeism.
However findings have no significant difference with the study as the majority of
teachers in schools under UPE system absent themselves to conduct private businesses
for a living and collude with others not to perform which greatly affects performance.
It is therefore important to note that the attainment of results in any institution like
schools, lies within the hands of the workers (teachers) therefore how they are
remunerated will enhance achievement of set goals and continued better performance.
Regardless of fringe benefits being financial or non-financial rewards, their existence
and provision in time gives a more concrete reason for employees (teachers) to stay
longer in institutions (schools) and basing on this issue, the government should avail
teachers with adequate fringe benefits to retain the and improve performance of schools
under UPE system.
2.4 Nature of working conditions and performance
Maicibi (2003) adds that the working conditions are hygiene factors which and when
properly manipulated by the management and leadership has the potential of creating job
satisfaction in employees. He also adds that the working conditions are governed by
factors like adequate accommodation for staff, terms of payment, environment itself,
provision and assurance of leave pays, retirement packages, empowerment and
interpersonal relationships. The research findings reveal that favorable working
conditions are associated with higher performance and poor working conditions are the
12
result for poor performance. Therefore the government should improve teachers‘ working
conditions for improved performance of schools under UPE system. The working
conditions that matter the most to teachers‘ include administrative leadership at their
school, working relationships among their colleagues, level of parental support, teaching
load and students discipline problems (Guarino, Satibanez and Daley,2006).
The nature of working conditions in any organization lays a basis for good performance.
Poor working conditions can cause stress and dissatisfaction which may lead to teachers
to leave the teaching profession altogether (Hanushek and Rivkin, 2007). Perry et al
(2006) reviewed diverse literature and financial incentives significantly improve
performance and effectiveness is dependent upon organizational conditions.
According to Herzberg (2003), good working conditions create job satisfaction and
where such conditions are inadequate, yield job dissatisfaction of employees; others leave
the organization and develop negative attitudes towards work thus affecting performance.
Hanushek (2009) acknowledges that a pleasant work environment in the third world
context means better provision of amenities for teachers so as to retain them in their
present job. He also observed rightly that the strategy of creating a pleasant work
environment for all teachers is mostly seen in private schools, but there is no reason why
the public sector could not employ it as well because all schools deal with human beings.
This implies that pleasant working environment for teachers will make them satisfied
with their jobs and retain them.
Richard Kent (2010) observed that although Universal Education is largely recognized as
important, in Uganda the literacy development of the average child is immensely
wretched in rural places. Children and teachers in rural places have a huge load of
carrying out the day today implementation of Universal Education. Their working
conditions are in a sorrowful state, yet this can be changed.
The ill teaching/learning conditions mainly cause low performance of Universal Primary
Education Schools.-and a blow to literacy development in these areas. A poor attitude is
seen amongst communities, and UPE school teachers are now ill-treated or held
responsible for the poor performances of children. So, the government of Uganda has
13
been called upon to put more resources in improving the life and working conditions of
teachers (UNATU, 2010).
The Uganda National Teachers Union (UNATU) expresses concern that in Uganda, being
a teacher means being paid a low salary, sometimes being treated unfairly, and working
in poor conditions.
UNATU says despite the low pay and poor working conditions, teachers continue giving
to society by teaching and improving the life chances of millions of learners. It also adds
that if the country and the world in general is to recover from the economic crisis;
conflicts & wars, school drop outs, natural disasters, low completion levels for girls,
Gender Based Violence, Low learning results; Health and Safety, HIV & AIDS, Child
Labor, Teacher Attrition and Bullying, among other ills, the starting point of any form of
recovery has to begin with the teachers (UNATU, 2010).
A teacher's working conditions directly affect our ability to properly educate our children.
These working conditions also affect the future of our country. Working conditions are
generally defined as the physical environment in which an employee is expected to
complete his or her job. For teachers, this is just the tip of the iceberg. Teachers are often
underpaid and under-supported in their need for educational resources for their students.
Poor working conditions can lead to many negative issues for teachers and the students
they educate, including depression, anger and lack of interest (Angella Atkinson, 2010).
There are several common complaints from teachers about their work environments.
Many don't have their own classroom or even their own desk to store materials. Those
who do have their own classrooms often find that the facilities aren't adequate to handle
their students' needs. Some don't have computers or Internet access in the classroom.
Others don't receive sufficient benefit packages or training hours per year. Some schools
don't even have libraries or playgrounds (Angella Atkinson, 2010). According to the
researcher, this can greatly affect performance of schools.
Gladys Kalibbala (2007) while celebrating the International Teachers Day recently at
Penile Beach in Entebbe, the teachers complained of inadequate facilities like
classrooms, furniture and under stocked libraries, which makes their work difficult.
Kampala — ENTEBBE Municipality teachers have asked the Government for good
14
working conditions in order for their pupils to get better education and improved school
performance (Angella Atkinson, 2010).
Johnson and Susan Moore (2006) describe workplace conditions that support effective
instruction and professional growth according to recent research. Key workplace
conditions include: fair teaching assignments; opportunities for teachers to collaborate
with colleagues; extra induction support, ongoing professional development, and
expanded career opportunities; support for working with students, curricular support for
high standards, adequate and safe facilities, and a supportive school leadership.
A report by Johnson and Susan Moore (2006) emphasizes the influence of substandard
workplace conditions on the high rates at which teachers--especially new teachers--leave
their schools or quit the profession altogether. It suggests greater numbers of talented
teachers can be retained through improvements in workplace conditions, particularly at
hard-to-staff schools.
Schneider, Mark (2003) adds that school facilities directly affect teaching and learning.
Poor conditions make it more difficult for teachers to deliver adequate education to their
students, adversely affect teachers' health, and increase the likelihood that teachers will
leave their school. This study documented how teachers in Chicago and Washington, DC
rated their working conditions and perceived the affect of those conditions on their job
performance and teaching effectiveness. Similarly Perry et al (2006), reviewed diverse
literature and financial incentives significantly improve performance and effectiveness is
dependent on organizational conditions.
The quality of teaching is further compromised by teachers‘ poor working conditions.
Teachers in UPE schools complain of poor and late pay. Only recently, the teachers went
on strike, demanding a minimum pay of Shs 200,000,and now they still want more
(Richard Kavuma, 2006). This is also another indicator of poor remuneration of teachers
so the researcher feels that the government should improve teachers‘ working conditions
for improved performance of schools under UPE system.
15
2.5 Performance
Nkata (2004) performance is defines performance as levels at which an organization
through an aggregation of performance of individuals is able to accomplish its mission
in respect to line for effectiveness and the efficiency in service delivery so as to attain
stake holders needs. Grassing (2002) adds that performance entails effectiveness which
refers to the firm‘s ability to serve and produce what the market requires at a particular
time and efficiency which means that meeting the objectives at the lowest possible
benefits.
Similarly Perry et al (2006), reviewed diverse literature and financial incentives
significantly improve performance and effectiveness is dependent on organizational
conditions. This means that better salaries and wages availability and provision of
adequate fringe benefits will attract better performance, whereas, poor organizational
conditions like poor salaries and wages , inadequate provision of fringe benefits always
attract poor performance in an organization. Robbins (2003) observed that employees
who are unsatisfied with their jobs had many absenteeism rates than those with job
satisfaction and with many attendance levels. He concluded that employee satisfaction
and performance are connected with absenteeism.
2.5.1 Performance measurements
Performance measurement is seen as a means of achieving improvements in the public
sector (Helden, 2006 and Wilson, 2004). Performance measurement is necessary since
government has an obligation to keep track of state funded services (Morris, 2000).
Pressure to measure performance is being placed by a range of stake holders including
government and non-government funders, donors, volunteers, employees, users and
beneficiaries (Wain Wright, 2003).
There is a belief that what an organization should measure depends on what it is trying to
achieve (Johnston and Pongatichat, 2008; Neely and Kennerly, 2002). Nothing is known
about whether performance measures actually achieve the aims of the government agency
(Propper and Wilson, 2003). Measurement clarifies and focuses on long term goals and
strategic objectives. Internal public sector reforms have resulted into pressure for many
public organizations to demonstrate that there have been improvements in performance
16
and that goals and objectives are being achieved (Boyne, 2002; McAdam et al; 2005 and
Pollit, 2000).
Performance measurement involves comparing actual performance against expectations
and setting up targets in which progress objectives can be measured. For nearly 30 years
the performance measurement literature has focused on developing relevant, integrated,
balanced, strategic and improvement-oriented performance measurement systems
(Brititci et al, 2005).
Like the private sector, measuring performance in the public sector has received much
academic and practitioner attention (Andrew et al, Johnsen and kennerly, 2005).
According to Diane Tim (2010) academic performance measures like student national
results are the most direct way to measure performance of different schools and by facts
and by facts and statistics of student percentage performance grades (Joanna, 2007).
Student national results can be measured to determine performance of different schools.
For example based on academic performance Ellior Joseph (2004) observed that private
schools perform better than public schools as evidenced by the national examination
results.
Assessing economy, efficiency and effectiveness through performance is control to the
public sector measurement (Bringnalt and Modell, 2000; Wilson, 2004 and Macpherson,
2001). Grassing (2002) observed that performance entails effectiveness, which refer to
firm‘s ability to serve and produce what the market requires at a particular time and
efficiency which means meeting the objectives at the lowest possible cost with highest
possible benefits. He emphasizes that organizational performance should be looked at in
terms of economy, efficiency and effectiveness which are usually measured in financial
terms.
Teacher turnover. All else being equal teacher turnover is higher in schools with lower
salaries and poor working conditions (Diane Tim, 2010). This implies that low teacher
turnover will only exist where there are higher teacher salaries and better working
conditions. Diane goes on to note that happy teachers are better teachers are happy
performance will be higher and their turnover will be low.
17
Performance driven pay for teachers sounds like a good idea. Teachers would be given
more incentives to improve their teaching and students would be likely to receive better
results (Angella, 2007). According to the ministry of education and statistics (2004)
private schools perform better than government aided schools because teachers in private
schools are adequately remunerated. UNESCO (2006) Poor performance in schools has
been documented to be the result of poor teacher remuneration. Teacher commitment can
be used to measure performance
Absenteeism: Robbins (2003) observed that employees who are unsatisfied with their
jobs had many absenteeism rates than those with job satisfaction and with many
attendance levels. He concluded that employee satisfaction and performance are
connected with absenteeism.
Report cards. District routinely issue report cards highlighting test score outcomes and
other key indicators of educational performance. These have become center pieces of
attention among not only educators but many other stakeholders. Measurement provides
performance information to many stake holders. Performance measures are the most
effective methods of communicating to legislatures and citizens about the success of
Programmes and services. For example public education, states and schools.
2.6 Relationship between remuneration and performance.
School performance is directly linked to quality and quantity of teachers‘ remuneration.
This means that there is a close link between teachers‘ remuneration and performance.
The most provided incentives by schools include housing, transport allowances and
salaries. In order to improve performance, school administrators try to motivate teachers
using job amenities like wage increment, housing allowances, transport allowances and
promotions (UNESCO, 2006). However in schools where remuneration is on equitable
grounds based on performance indicators of individuals, derive attraction, participation,
commitment and improved performance (Mingat 2002).
Hanushek (2009) postulated that people join organizations like schools to satisfy their
varied needs. Teachers for example join the teaching profession to meet their financial
and social needs because in turn they are paid salaries and given other incentives to
18
improve their livelihoods. However due to poor remuneration in schools under the UPE
system, teachers have not been able to satisfy their needs and this directly affects
performance.
Increasing teacher salaries is frequently cited as the best mechanism for reaching this
goal. However, in contrast to the prevailing sentiment, teacher salaries have steadily
declined relative to salaries in the non-teacher labor market since the early 1980s (see
Bacolod, 2007; Goldhaber, 2001; Loeb and Page, 2000).
Although the relationship may not be causal, Hanushek and Rivkin (2007) found that
teacher quality, as measured by teachers‘ scores on standardized tests and the selectivity
of their undergraduate institutions, also declined during the same time period. Thus, the
renewed emphasis on teacher quality forces policymakers, researchers, and school
administrators to focus on whether increasing teacher wages improves teacher quality and
student performance.
Some research suggests that increasing teacher pay, whether it is through salary
increases, performance bonuses, or recruitment incentives, results in better student
achievement on end-of-grade tests (Ferguson and Gilpin, 2009; Hanushek, Kain, and
Rivkin, 1999; Lazear, 2003).
In addition, Loeb and Page (2000) found that increasing wages reduces the dropout rate.
Hanushek, Kain, and Rivkin (1999) hypothesize that higher pay may improve student
achievement by encouraging teachers to exert more effort in an attempt to compensate for
their higher salaries. Despite the evidence that higher salaries have a positive impact on
student achievement, some researchers contend that increasing teacher salaries may not
be worth the investment. For example, there is some evidence that the impact of salary
changes is nominal compared to the impact of non-pecuniary factors—e.g., teacher
working conditions or the percentage of students who receive free or reduced-price
lunches (see Ferguson and Gilpin, 2009; Hanushek, Kain, and Rivkin, 1999).
Goldhaber (2001) argues that, since teachers sort themselves based on non-pecuniary
factors, increasing salaries will not have an effect on the distribution of teachers and,
19
therefore, will leave some students without access to high quality teachers, hence
affecting the performance of the school.
Using this research as a basis, some contend that it may be better for policymakers, state
officials, and school administrators to concentrate on changing non-pecuniary factors
rather than increasing teacher salaries. According to Maicibi (2003) performance and
expectations are high and remuneration is very low, this reduces morale in workers as
well as performance.
Research suggests that higher wages may positively affect the quality of both novice and
experienced teachers. However, there is also evidence that other factors—e.g., a
principal‘s ability to identify quality teachers or the effect of poor working conditions—
may prevent state and local education agencies from fully capturing the benefits of
increasing teacher wages. With this research in mind, when states and/or districts
implement pay-for-performance systems, the evidence indicates that they should not rely
solely on higher salaries to improve teacher quality or performance. They should also be
cognizant of the non-pecuniary factors that influence teacher quality and integrate
measures to address these factors into their pay-for-performance systems.
Ifinedo (2003) demonstrated that a motivated worker is easy to spot by his or her agility,
dedication, enthusiasm, focus, zeal, and general performance and contribution to
organizational objectives and goals. Erdill and Yetkiner (2001) indicated that employee
characteristics had to be taken into consideration and that the link between employee-
remuneration gaps and labor productivity depends on an employee‘s position in the
remuneration structure.
Jirjahn and Kraft (2007) reported that the labor-relations regime and the type of incentive
schemes play an important role in determining the sign and magnitude of the link
between employee-remuneration gaps and labor productivity.
It has furthermore been argued that difference in (1) the size and kind of ownership of
organizations (Beaumont & Harris, 2003) and (2) the kind of management regime
20
(Belfield & Marsden, 2003) also impact on the relation between employee-remuneration
gaps and labor productivity. Lazear (1995) came to a very interesting conclusion: he
argued that (1) the remuneration regimes of employers should be tailored to take the
characteristics of their workforce into account and (2) less-dispersed employee-
remuneration gaps were preferable at management level.
In terms of skill levels, Genre et al. (2005) and Lallermond (2007) indicated that smaller
remuneration gaps are required for higher-skilled employees if labor productivity is to be
enhanced. Heyman (2005), Prendergast (2002) and Turner and Jackson (2009), however,
concluded that the relationship between remuneration gaps and labor productivity
(performance) is stronger when employees are more skilled. According to them, the
reason is that the remuneration regime for higher-skilled employees is linked to firm
performance and that more dispersed employee-remuneration gaps induce these
employees to act in an optimal manner (with higher levels of productivity).
Foss and Laursen (2005) and Mahy et al. (2009) indicated that employee-remuneration
gaps for less-skilled workers should be smaller, as limited performance-linked regimes
are needed to enhance labor productivity.
Uncertainty in the business or economic environment impacts on the sign and magnitude
of the link between employee-remuneration gaps and labor productivity. Brown and
Medoff (1989), Prendergast (2002) and Mahy et al. (2009) confirmed the existence of a
positive relation between uncertainty and the dispersion of employee-remuneration gaps.
The basic argument is that performance-linked remuneration regimes (which entail more
dispersed remuneration gaps) are more prominent when business or economic uncertainty
is high.
Fagio, Salvaness and Van Reenen (2007), however, argued that, in a highly uncertain
business or economic environment, the link between employee-remuneration gaps and
labor productivity should be weaker simply because employees regard performance-
linked remuneration regimes as unfair (since they have less control over their own labor-
output relation).
Companies must also tackle the contentious question of ‗pay-for-performance‘. Robbins
(2003) observed that employees who are unsatisfied with their jobs had many
21
absenteeism rates than those with job satisfaction and with many attendance levels. He
concluded that employee satisfaction and performance are connected with absenteeism.
Seegers says there is cynicism among shareholders that companies pay executives
regardless of performance, exercising their discretion to pay out even when the formula
does not yield the desired result. ―There is a clear need to ensure that the relationship
between pay and performance is robust. Key to this is that companies must demonstrate
when the financial success of a business is as a result of the skills of the senior executive
team - and conversely, where luck played a role. A pay-for-performance approach
requires differentiation of these two and caution should be taken that such a remuneration
policy does not encourage excessive risk- taking to boost performance.‖(Gerald Seegers,
2009)
Reward packages must also be considered in their totality. Executive reward is
multifaceted, typically including fixed short-term pay in the form of salary and benefits;
fixed long-term pay in the form of pension; variable short-term pay in the form of annual
bonus; and variable long-term pay in the form of deferred bonus and long-term incentive
awards. With the exception of salary and benefits, all of the other components of reward
introduce uncertainty. However the remuneration committee must place a value on these
different elements, which can move significantly in value over time, when making
decisions on incentive awards. They must give thought not just to the value of reward
today, but to the potential payouts and the impact on future retention value. Robust
valuation methodologies involving specialist advice may be required to do this
effectively (Gerald Seegers, 2009).
David Tash Lumu (2010) adds that teachers are the least motivated civil servants.
―Compared to other civil servants, teachers remain the least motivated. Their salary scale
(about Shs 200,000) has remained constant for so long despite the ever increasing costs
of living. Lack of teacher‘s houses was singled out as a cross-cutting challenge which
was reported everywhere.
Rural schools in hard to reach districts are the worst affected. In that case, teachers are
left with no choice but to rent from far off places which oftentimes breeds perpetual
absenteeism and hence poor performance for those schools,‖
22
Eric Hanushek and Steven Rivkin examine how salary and working conditions affect the
quality of instruction in the classroom. The wages of teachers relative to those of other
college graduates have fallen steadily since 1940. Today, average wages differ little,
however, between urban and suburban districts. In some metropolitan areas urban
districts pay more, while in others, suburban districts pay more. But working conditions
in urban and suburban districts differ substantially, with urban teachers reporting far less
administrator and parental support, worse materials, and greater student problems.
Difficult working conditions may drive much of the difference in turnover of teachers
and the transfer of teachers across schools and this greatly affects performance
(Hanushek and Rivkin, 2007).
Steven Garry, Erick Alan (2007) Using rich data from Texas public schools, the authors
describe in detail what happens when teachers move from school to school. They
examine how salaries and student characteristics change when teachers move and also
whether turnover affects teacher quality and student achievement. They note that both
wages and student characteristics affect teachers' choices and result in a sorting of
teachers across schools, but they find little evidence that teacher transitions are
detrimental to student learning.
The extent to which variations in salaries and working conditions translate into
differences in the quality of instruction depends importantly on the effectiveness of
school personnel policies in hiring and retaining the most effective teachers and on
constraints on both entry into the profession and the firing of low performers (Hanushek,
Rivkin, 2007).
They conclude that overall salary increases for teachers would be both expensive and
ineffective. The best way to improve the quality of instruction would be to lower barriers
to becoming a teacher, such as certification, and to link compensation and career
advancement more closely with teachers' ability to raise student performance.
UNESCO (2006) noted that poor performance of schools in Uganda in general was
documented to be the outcome of poor remuneration of teachers. Robbins (2003)
concludes that managers and administrators in institutions should always appreciate,
evaluate positively and allocate rewards and incentives more appropriately to their staff
23
for maximum performance. This shows that there is a close link between teachers‘
remuneration and performance.
2.7 Conclusion
The research reveals that proper remuneration of teachers is associated with higher
performance and poor remuneration of teachers is the reason for poor performance of
schools under UPE system. Therefore it is safe to say that teachers‘ remuneration is the
core for effective performance in schools, implying that the government should improve
on teachers‘ remuneration in order to improve performance of schools under the UPE
system.
24
CHAPTER THREE
METHODOLOGY
3.1 Introduction. This chapter covers research design, measurement of variables, study population,
sampling technique, sample size, sources of data, data collection methods, data
processing, data presentation and analysis, and finally winds up with the limitations of
the study.
3.2 Research design.
Analytical and correlation and regression research designs were employed in the study.
Quantitative data was gathered to establish the relationship between teachers‘
remuneration and performance of schools under UPE system.
3.3 Study population. The study was conducted in five (5) schools under UPE system in Wakiso district. Data
was collected from teachers, head teachers, and deputy head masters from the selected
schools. The study population was chosen because was expected to be reasonable enough
to give a fair presentation and to reflect a fair view of the relationship between teachers‘
remuneration and performance of schools under UPE system.
Teachers were involved in the study because they are directly concerned with the
teaching and therefore, expected to give reliable information about their schools.
Head teachers and deputy head masters were involved in the study because they are
directly concerned with the implementation of the teaching and remuneration of teachers
thus, being in the centre of all school activities.
3.4.1 Sample size. The study encompassed a representation of sample of 100 respondents from the selected
UPE schools in Wakiso district including both male and female teachers, deputy head
teachers, and head teachers.
25
3.4.2 Sampling technique. Simple random sampling and purposive sampling were used to select the sample
basically intending to minimize bias so as to attain the purpose of the study and to save
time and money.
3.5 Sources of data
Data was collected from two sources; both primary and secondary sources of data.
Primary data was collected from 100 respondents which included teachers, deputy head
teachers and head teachers from the selected UPE schools in Wakiso district.
Secondary data was obtained from recognized journals, report publications, news letters,
annual reports and text books, documents and written literature on teachers‘ remuneration
and performance of schools.
3.6 Data collection methods.
The method of data collection was questionnaires. Questionnaires were designed
according to five (5) likert scale (strongly agree, agree, not sure, disagree and strongly
disagree) consisting of a set of items which respondents are expected to react to in
writing.
Questionnaires were used because the study was concerned mainly with variables which
could not be directly observed such as views, opinions, perceptions and feelings of
respondents. Given the time constraint, questionnaires were the ideal tool for collecting
reasonable amount of data within a very short period of time and, the study population
being largely literate was unlikely to have difficulties responding to questionnaire items.
3.7 Measurement of variables
The major variables in the study were teachers‘ remuneration and performance of schools
under UPE. Teachers‘ remuneration was measured in terms of adequacy and satisfactory
of wages, salaries, allowances and how it contributes to performance of schools.
Performance was measured in terms of quantity, quality of performance indicators like
teacher commitment, absenteeism, turnover, productivity, and the students‘ national
examination results.
26
3.8 Data processing, presentation and analysis
After collecting data, well answered questionnaires were organized, data carefully edited
to remove errors, coded, analyzed and sorted for the next stage.
Data was presented in a tabular form with frequencies and percentages for singular
classification of responses, easier analysis and visual impression.
A statistical package for social sciences was used to establish the relationship between
teachers‘ remuneration and performance of schools under UPE system.
Descriptive analysis was used so that findings are not generalized beyond the sample and
inferential analysis was used to draw conclusions concerning the relationship and
differences found in the research results and enabled the researcher to use the sample to
draw conclusions about the population from which the sample was drawn.
3.9 Limitations of the study.
Time constraint was encountered during the accomplishment of the study. However, a
timetable was drawn for the research and strictly followed so as to attain the purpose of
the study.
Financial constraint was also another major challenge for the study as research is
believed to be an expensive venture.
Ideally, this study would have been conducted in all schools under UPE system in
Uganda but, time and financial constraints dedicate a smaller sample.
27
CHAPTER FOUR
PRESENTATION, ANALYSIS AND DISCUSSION OF FINDINGS
4.0 Introduction
This Chapter presents findings of the study on the relationship between teachers‘
remuneration and performance of schools under Universal Primary Education (UPE)
system in Uganda according to the data collected. The findings are analyzed, interpreted
and presented according to the important variables, objectives of the study and the
research question.
4.1 Response rate
There was a positive response from the respondents.
4.2 Findings on general information
Personal Data
The researcher identified the respondents‘ bio data in respect of gender, age, level of
education and the length of service or period of stay in UPE schools in order to appreciate
the reliability and the accuracy of the research findings.
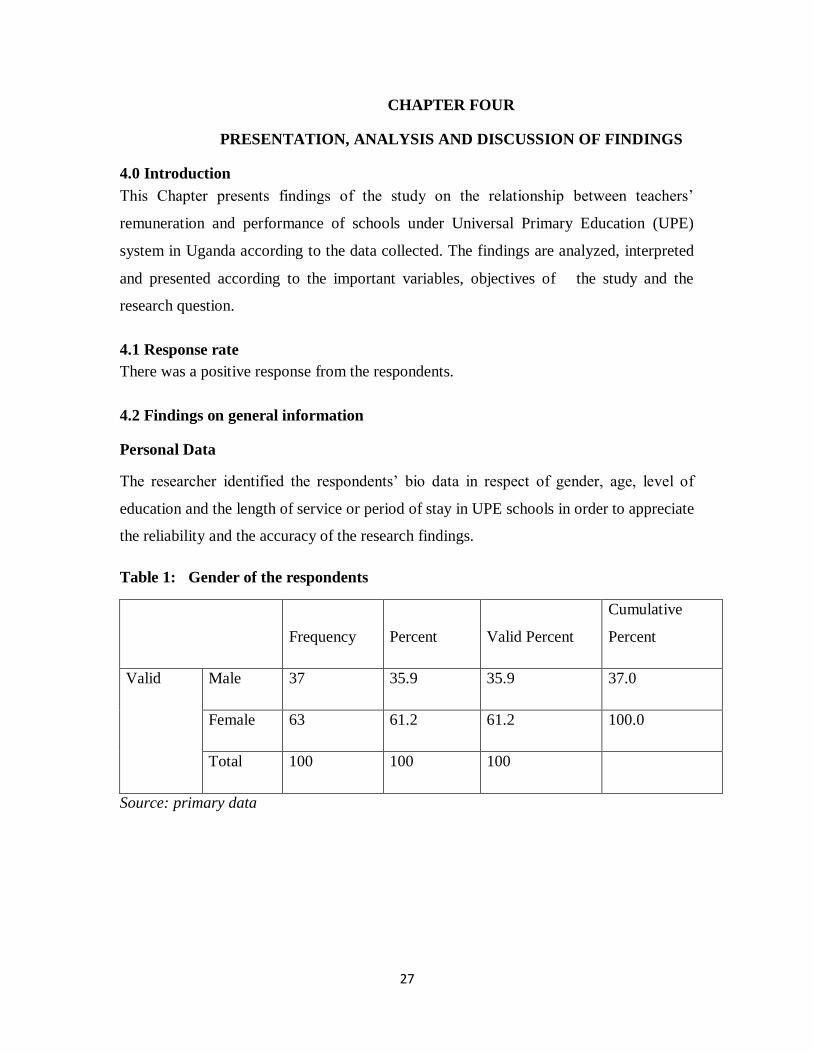
Table 1: Gender of the respondents
Frequency Percent Valid Percent
Cumulative
Percent
Valid Male 37 35.9 35.9 37.0
Female 63 61.2 61.2 100.0
Total 100 100 100
Source: primary data
28
Table 1, indicates that 35.9% of the respondents were male, and 61.2% were female. This
implies that, there was gender bias in the study meaning that men are not all that
interested in teaching in UPE schools as compared to women.
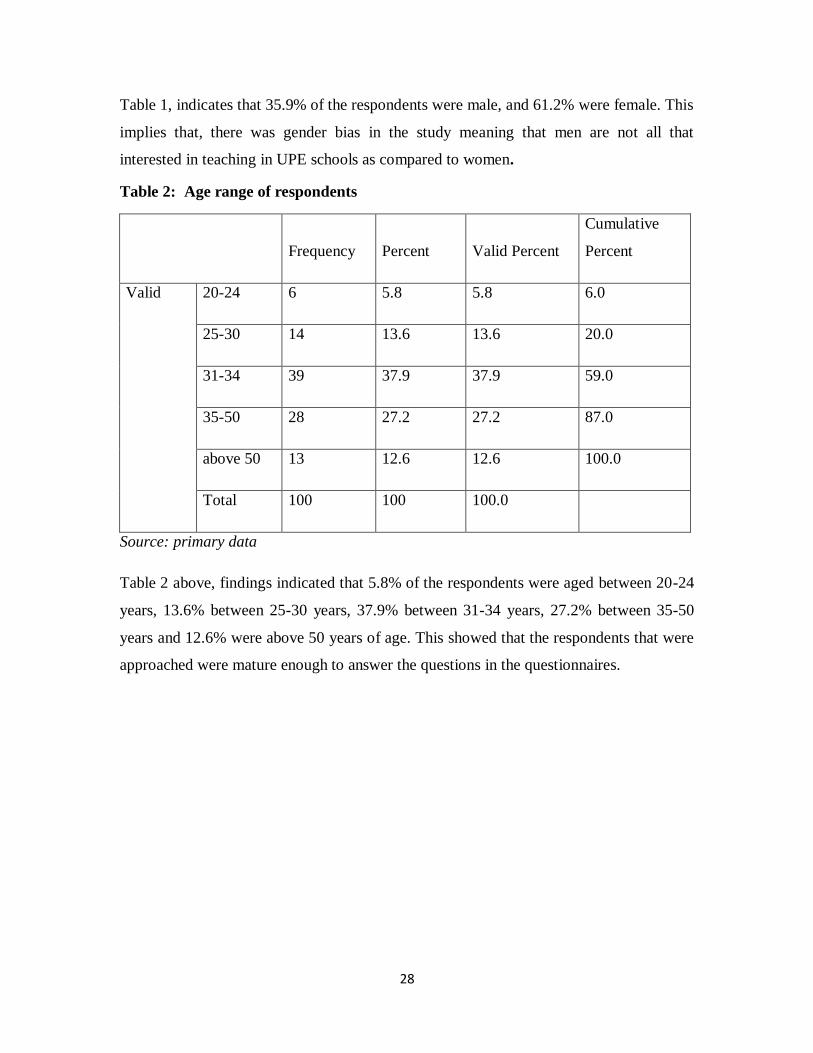
Table 2: Age range of respondents
Frequency Percent Valid Percent
Cumulative
Percent
Valid 20-24 6 5.8 5.8 6.0
25-30 14 13.6 13.6 20.0
31-34 39 37.9 37.9 59.0
35-50 28 27.2 27.2 87.0
above 50 13 12.6 12.6 100.0
Total 100 100 100.0
Source: primary data
Table 2 above, findings indicated that 5.8% of the respondents were aged between 20-24
years, 13.6% between 25-30 years, 37.9% between 31-34 years, 27.2% between 35-50
years and 12.6% were above 50 years of age. This showed that the respondents that were
approached were mature enough to answer the questions in the questionnaires.
29
Table 3: Marital status of the respondents
Frequency Percent Valid Percent
Cumulative
Percent
Valid Single 18 17.5 17.5 18.0
Married 74 71.8 71.8 92.0
Separated 3 2.9 2.9 95.0
Widowed 5 4.9 4.9 100.0
Total 100 100 100
Source: primary data
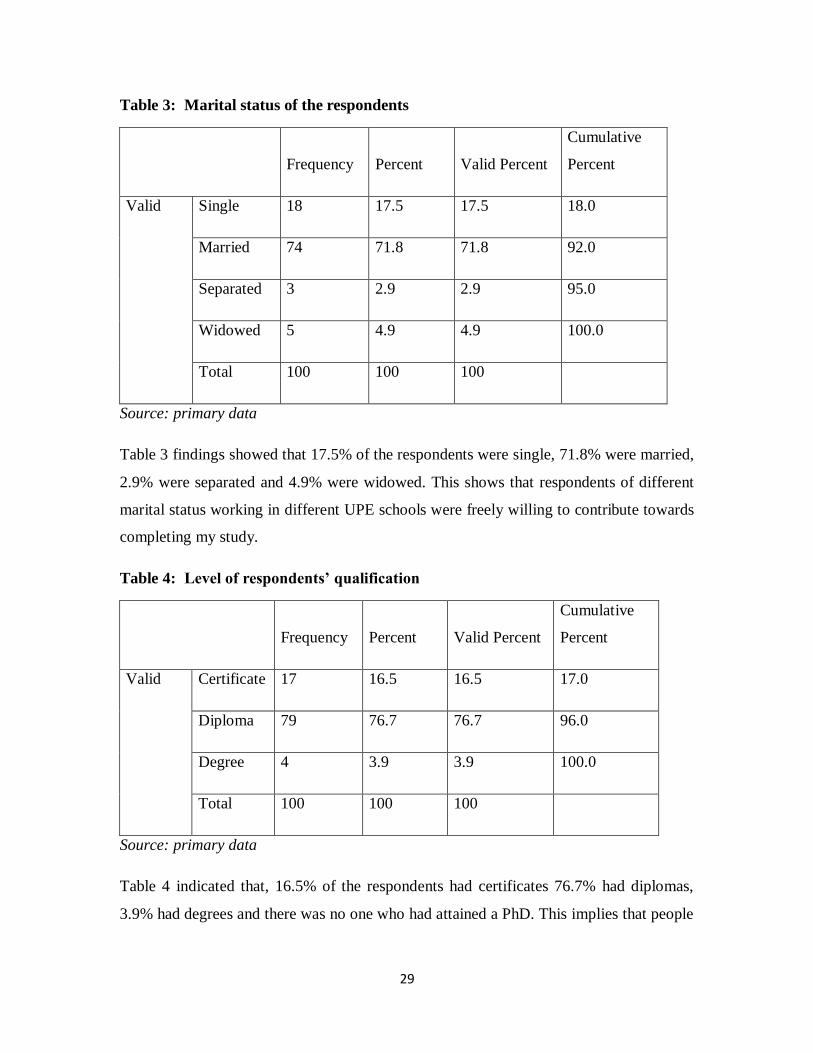
Table 3 findings showed that 17.5% of the respondents were single, 71.8% were married,
2.9% were separated and 4.9% were widowed. This shows that respondents of different
marital status working in different UPE schools were freely willing to contribute towards
completing my study.
Table 4: Level of respondents’ qualification
Frequency Percent Valid Percent
Cumulative
Percent
Valid Certificate 17 16.5 16.5 17.0
Diploma 79 76.7 76.7 96.0
Degree 4 3.9 3.9 100.0
Total 100 100 100
Source: primary data
Table 4 indicated that, 16.5% of the respondents had certificates 76.7% had diplomas,
3.9% had degrees and there was no one who had attained a PhD. This implies that people
30
teaching in UPE schools have at least attained the minimum level of education to
participate in the attainment better performances.
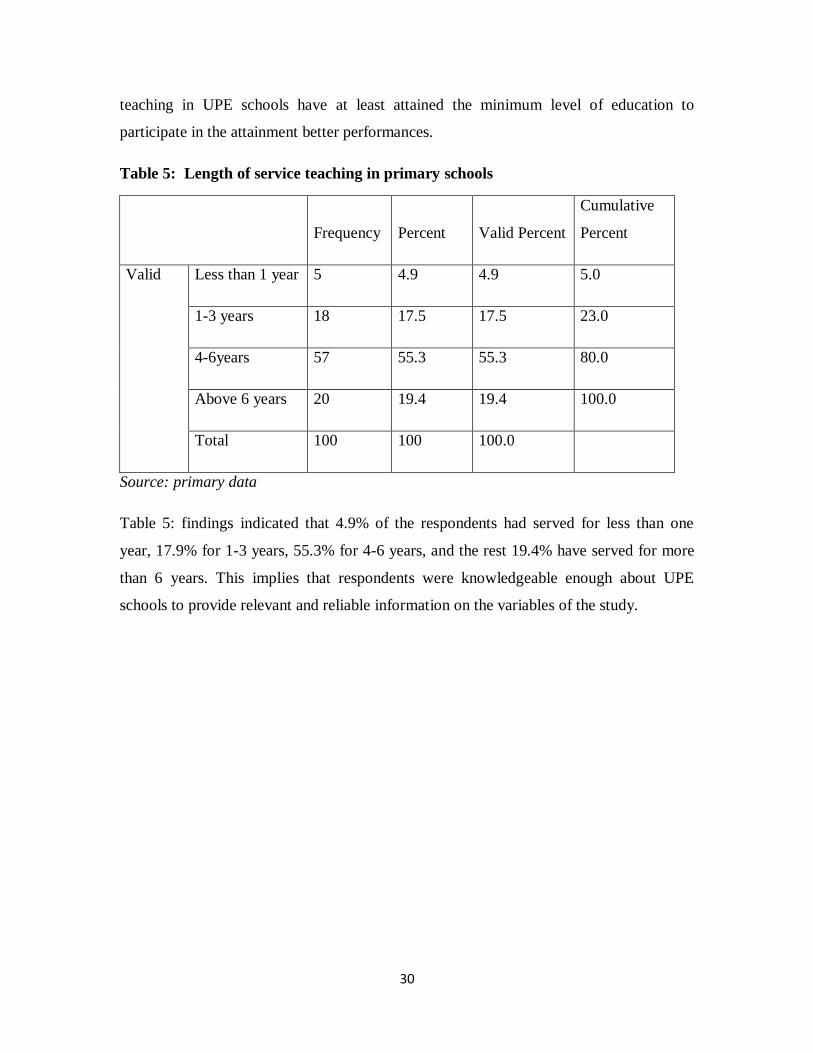
Table 5: Length of service teaching in primary schools
Frequency Percent Valid Percent
Cumulative
Percent
Valid Less than 1 year 5 4.9 4.9 5.0
1-3 years 18 17.5 17.5 23.0
4-6years 57 55.3 55.3 80.0
Above 6 years 20 19.4 19.4 100.0
Total 100 100 100.0
Source: primary data
Table 5: findings indicated that 4.9% of the respondents had served for less than one
year, 17.9% for 1-3 years, 55.3% for 4-6 years, and the rest 19.4% have served for more
than 6 years. This implies that respondents were knowledgeable enough about UPE
schools to provide relevant and reliable information on the variables of the study.
31
4.3: To establish the relationship teachers’ Remuneration and performance of
schools under UPE system.
Findings on the relationship between teachers‘ remuneration and performance of schools
under UPE system.
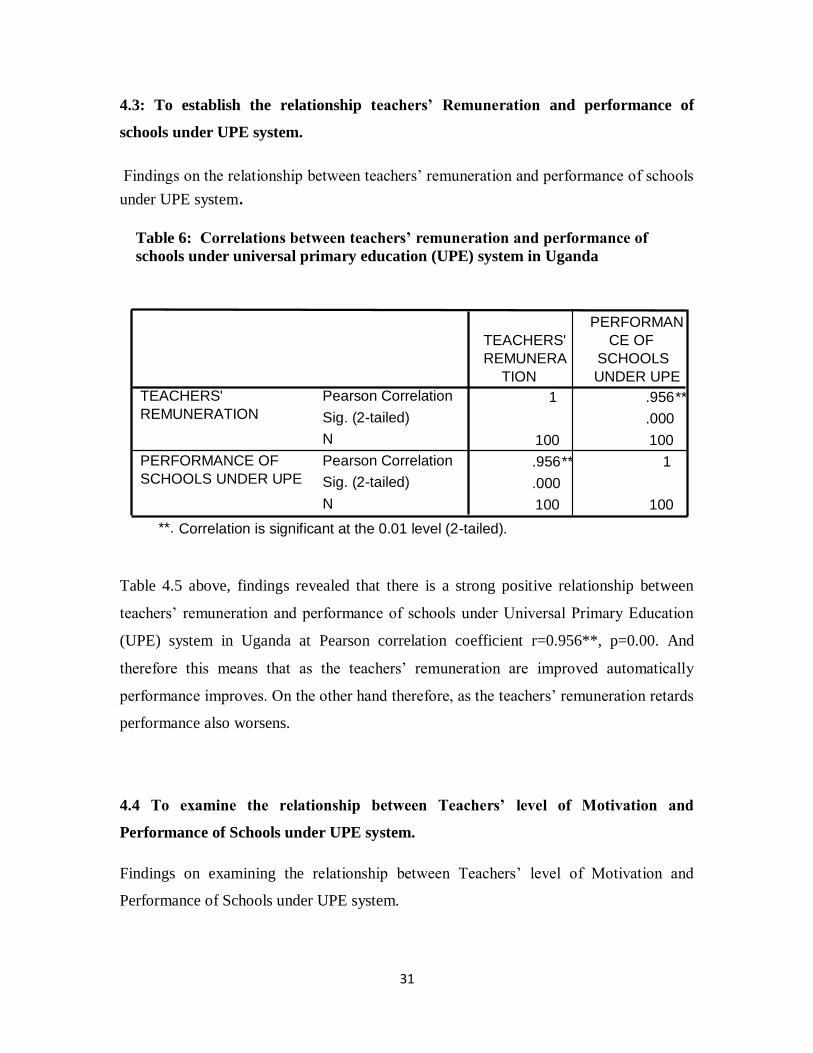
Table 4.5 above, findings revealed that there is a strong positive relationship between
teachers‘ remuneration and performance of schools under Universal Primary Education
(UPE) system in Uganda at Pearson correlation coefficient r=0.956**, p=0.00. And
therefore this means that as the teachers‘ remuneration are improved automatically
performance improves. On the other hand therefore, as the teachers‘ remuneration retards
performance also worsens.
4.4 To examine the relationship between Teachers’ level of Motivation and
Performance of Schools under UPE system.
Findings on examining the relationship between Teachers‘ level of Motivation and
Performance of Schools under UPE system.
Table 6: Correlations between teachers’ remuneration and performance of
schools under universal primary education (UPE) system in Uganda
1 .956 **
.000
100 100
.956 ** 1
.000
100 100
Pearson Correlation
Sig. (2-tailed)
N
Pearson Correlation
Sig. (2-tailed)
N
TEACHERS' REMUNERATION
PERFORMANCE OF SCHOOLS UNDER UPE
TEACHERS' REMUNERA
TION
PERFORMAN CE OF
SCHOOLS UNDER UPE
Correlation is significant at the 0.01 level (2-tailed). **.
32
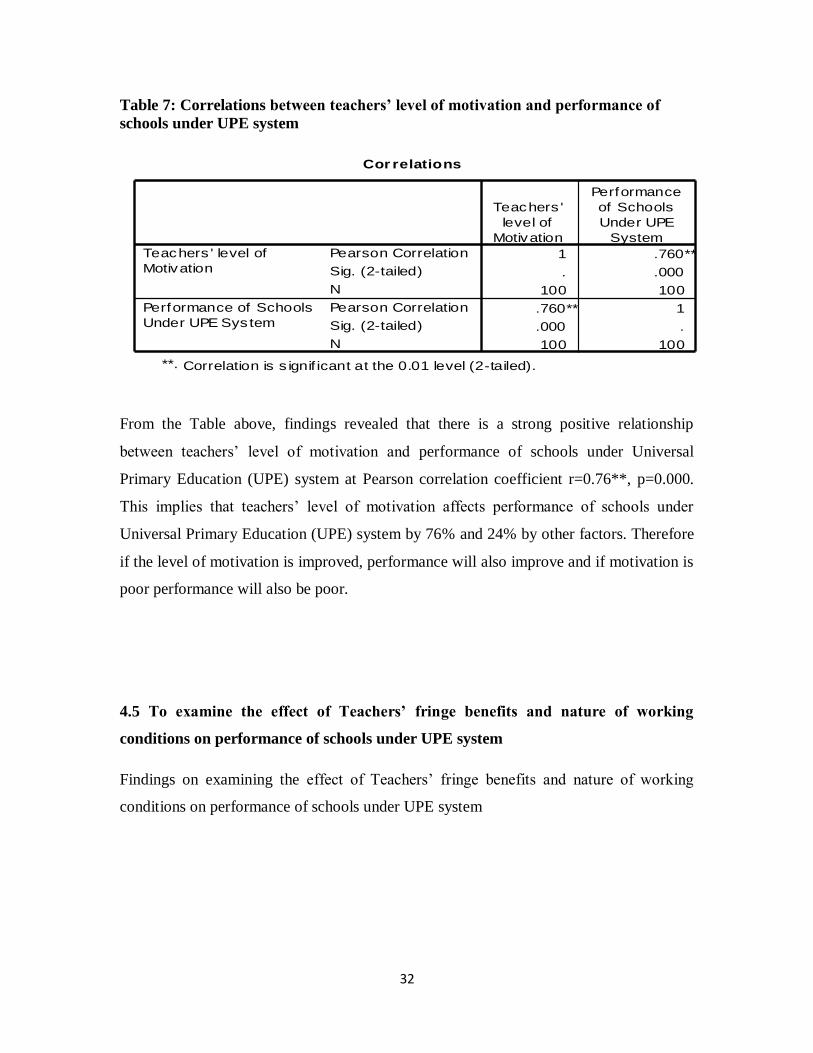
Table 7: Correlations between teachers’ level of motivation and performance of
schools under UPE system
From the Table above, findings revealed that there is a strong positive relationship
between teachers‘ level of motivation and performance of schools under Universal
Primary Education (UPE) system at Pearson correlation coefficient r=0.76**, p=0.000.
This implies that teachers‘ level of motivation affects performance of schools under
Universal Primary Education (UPE) system by 76% and 24% by other factors. Therefore
if the level of motivation is improved, performance will also improve and if motivation is
poor performance will also be poor.
4.5 To examine the effect of Teachers’ fringe benefits and nature of working
conditions on performance of schools under UPE system
Findings on examining the effect of Teachers‘ fringe benefits and nature of working
conditions on performance of schools under UPE system
Cor relations
1 .760**
. .000
100 100
.760** 1
.000 .
100 100
Pearson Correlation
Sig. (2-tailed)
N
Pearson Correlation
Sig. (2-tailed)
N
Teachers ' level of
Motivation
Performance of Schools
Under UPE System
Teachers '
level of
Motivation
Performance
of Schools
Under UPE
System
Correlation is s ignif icant at the 0.01 level (2-tailed).**.
33
Table 8: Showing the effect of teachers’ fringe benefits, nature of working
conditions on performance of schools under UPE system.
Coefficientsa
Model
Unstandardized
coefficients
Standardized
coefficients
t Sig. F
Change
Adjusted
R
Square
Sig.
B Std. error Beta
1 (Constant) .648 .180 3.610 .000 .641 .000
Teachers‘
fringe benefits
.173 .171 .170 1.014 .313
Nature of
working
conditions
.659 .172 .644 3.840 .000
a. Dependent variable: Performance of schools under UPE system.
Using regression analysis, it was found out that teachers‘ fringe benefits and nature of
working conditions predicts performance at significance 0.313 and 0.00 respectively.
Therefore, this implies that teachers‘ nature of working conditions are the strongest
predictor of performance of schools under UPE system.
R square is 0.648 and adjusted R square is 0.641 meaning that teachers‘ fringe benefits
and nature of working conditions affect performance of schools under UPE system by
64.1% and 35.9% by other factors. Therefore if teacher‘s fringe benefits and nature of
working conditions are well catered for, performance of schools under UPE system can
also improve automatically.
34
CHAPTER FIVE
SUMMARY, CONCLUSIONS AND RECOMMENDATIONS OF THE
FINDINGS
5.0 Introduction
This chapter covers summary, conclusions, recommendations of the findings and ends
with areas for further study. The purpose of the study was to establish the relationship
between teachers‘ remuneration and performance of schools under UPE system Uganda,
a case study of Wakiso district.
5.1 Summary of findings
The study was carried out to establish the relationship between teachers‘ remuneration
and performance of schools under UPE system in Uganda. The research was based on the
objectives of the study
Findings on establishing the relationship between teachers‘ remuneration and
performance of schools under UPE system revealed a strong and positive relationship
between teachers‘ remuneration and performance of schools under UPE system
(r=0.956**, p=0.00). UNESCO (2006) notes that poor performance of schools in Uganda
in general has been documented to be the result of poor teacher remuneration. However
in schools where remuneration is on equitable grounds based on performance indicators
of individuals, derive attraction, participation, commitment and improved performance
(Mingat 2002).
Findings on examining the relationship between teachers‘ level of motivation and
performance of schools under UPE system revealed a strong and positive relationship at
Pearson correlation coefficient r=0.76**, p=0.000. Teachers are the least motivated civil
servants and if improved, performance of schools under UPE system can automatically
improve (David Tash Lumu, 2010). Similarly Farazmand (2007) postulates that
performance is higher in those organizations where employees are adequately motivated.
Findings also indicated that an increment in teachers‘ salaries can motivate them towards
improved performance this is in line with research studies by Amstrong (2003), who
35
observed that external motivational practices like salaries and wages have a powerful
effect on employee performance.
Findings on examining the effect of teachers‘ fringe benefits and nature of working
conditions on performance of schools under UPE system were that: Overload allowances,
recognition allowances and leadership allowances are inadequate and unsatisfactory,
Teachers‘ accommodation are uncondusive and inadequate and, teachers are not provided
with adequate facilities to handle student needs. Schneider, Mark (2003) adds that school
facilities directly affect teaching and learning. Poor conditions make it more difficult for
teachers to deliver adequate education to their students. Robbins (2003) indicated that
employees who are unsatisfied with their jobs had many absenteeism rates.
5.2 Conclusions
A significant positive relationship between teachers‘ remuneration and performance of
schools under UPE system was established.
The study findings also indicated that low level of teachers‘ motivation leads to poor
performance of schools under UPE system. Findings also revealed a strong and positive
relationship between teachers‘ level of motivation and performance of schools under
UPE system
Findings revealed that, teachers‘ fringe benefits and nature of working conditions greatly
affects the performance of schools under UPE system.
5.3 Recommendations
From the findings, the government should appreciate the significant positive relationship
which exists between teachers‘ remuneration and performance of schools to ensure
continued survival and success of schools in a competitive nation like Uganda.
The government should also put up strategies like increasing teachers‘ salaries,
promotion and recognition of teachers in order to improve performance of schools under
UPE system.
36
There is also need for the government to put up strategies to ensure that teachers‘
accommodation are conducive and adequate, adequate facilities are put in place for
teachers to handle student needs and overload, recognition and leadership allowances for
teachers are satisfactory for improved performance of schools under UPE system.
5.4 Areas for further research
The study did exhaust all the dependent variables that influence school performance thus
the need for the researchers to conduct an exhaustive study on the variables listed under.
5.4.1 Supervision and performance of UPE schools.
5.4.2 Motivation of teachers and performance of pupils in UPE schools.
5.4.3 Management and performance of schools under UPE system.

37
REFERENCES
Abhishek, R. (2010). Forms of remuneration
Allegretto, Corcoran and Minshell. (2008). Teachers‘ salary and working conditions.
Amstrong, M. (2003). A hand book of human resource management practice.
(9th Ed.)120 Pental Aville London M 19 JN.UK Cambrian printers ltd.
Andrew et al, (2005). External constraints on local service standards: the case of
comprehensive performance in English and local government and public
administration, vol.83No.3,pp.639-56
Atkinson, A. (2010). Working conditions of teachers
Beaumont, P.B., & Harris, R.I.D. (2003). Internal wage structure and organisational
performance. British Journal of Industrial Relations, 41(1), 53–70.
Belfield, R., & Marsden, D. (2003). Performance pay, monitoring environments and
establishment performance. International Journal of Manpower, 24(4), 452–4
Boyne, A. (2002). Public and Private Management: What‘s the difference?, Journal of
management studies, vol. 39 No. 1, pp.97-122.
Braton J. and Gold J. (2003:292). Human resource management: The theory and practice.
(3rd Ed.), Pal Grave Macmillan Publishers ltd. Great Britain.
Brititci et al, (2005). Measuring and managing performance in extended enterpirses.
International Journal of Operations and production Management, vol. 25 No. 4, pp.
333-53.
Brown, C., & Medoff, J. (1989). The employer size-wage effect. Journal of Political
Economy, 97, 1027–1059.
David Tash Lumu, (2010). Teachers‘ salaries and working conditions.
Dessler, G. (2003). Human Resource Management (2nd Ed.), (9th Ed.), Prentice Hall.
38
Diane,T. (2010). Teacher working conditions affect performance: Articles Learning
Community.
Dornyei, (2001 b:49). Teaching and Researching. Motivation Essex: Pearson Education
16.Erdill, A., & Yetkiner, H. (2001). A comparative analysis of inter-industry
wage differentials: Industrialized versus developing countries. Applied
Economics, 33, 1639–1648.
Faggio, G., Salvaness, K.G., & Van Reenen, J. (2007). Understanding wage and
productivity dispersion in the United Kingdom. VOX Occasional Paper Series,
(742).71.
Farazmand, A. (2007). Strategic personnel administration: Building and managing human
capital for the 21st century, vol.1. Green Wood Publishing Group.
Ferguson, C., and Gilpin, G. (2009). Wage Frictions and Teacher Quality: An Empirical
Analysis of Differential Effects across Subject Areas.
Foss, N.J., & Laursen, K. (2005). Performance pay, delegation and multi-tasking under
uncertainty and innovativeness: An empirical investigation. Journal of Economic
Behavior & Organization, 58(2), 246–276.
Genre, V., Momferatou, D., & Mourre, G. (2005). Wage diversity in the Euro area: An
overview of labour cost differentials across industries. Occasional Paper Series, (24),
European Central Bank.
Kalibbala, G. (2007). Entebbe teachers decry for poor working conditions, the new vision
Gerald Seegers, (2009). Employee remuneration policy as an effect of performance in
organizations
Goldhaber, D. (2001). How Has Teacher Compensation Changed? Selected Papers in
School Finance
39
Grassing, R. (2002). Measuring Operational Efficiency, A guide for commercial banker,
commercial lending review vol. 17 No.1.
Guariano, Santibanez and Daley, (2006). Teachers‘ Salaries
Hanushek and Rivkin (2007). Pay, Working Conditions and Teacher Quality. The future
of children, vol.17No.1.
Hanushek, E., and Rivkin, S. (2007). Teacher Quality. Handbook of the Economics of
Education, 2, 1051-1078.
Hanushek, E., Kain, J., and Rivkin, S. (1999). Do Higher Salaries Buy Better Teachers?
Working Paper W7082. Paper presented at the Annual Meeting of the American
Economic Association (New York, NY, January 3-5, 1999).
Hanushek, E. (2009). Teachers‘ Job Amenities in the Developing world: A performance
in Uganda.
Harmer, (2001:51). The Practice of English Language Teaching. Essex: Longman Press.
Herzberg, F. (2003). The motivation to work, 2nd Ed, Chapman and Hall Press
Heyman, F. (2005). Pay inequality and firm performance: Evidence from matched
employer-employee data. Applied Economics, 37(11), 1313–
Jakolya, (2006). The Effect of Motivation on Performance of Organisations
Jean Murray, (2010). Forms of compensation
Jirjahn, U., & Kraft, K. (2007). Intra-firm wage dispersion and firm performance – Is
there a uniform relationship? Kyklos, 60(2), 231–253.
Joanna, (2007). How to judge a teacher‘s performance
Johnson and Susan, M. (2006). The Workplace Matters: Teacher Quality, Retention and
Effectiveness.
Johnston R and Pongatichat P, (2008). Managing the Tension Between Performance
Measurement and Strategy, copying strategies. International Journal of Operations
and Production Management, vol.28 No.10 pp.941-67.
40
Knyszewska, E. (2010). Methods of remuneration
Lallermond, T. (2007). Wage structure and firm productivity in Belgium. Working paper
12978, National Bureau of Economic Research, Cambridge.
Lazear, E. (2003). Teacher Incentives. Swedish Economic Policy Review, 10, 179-214.
Lazear, E.P. (1995). Personnel economics. Cambridge (Mass): MIT Press.
Lee Ann Obringer, (2011), Setting your compensation
Loeb, S., and Page, M., (2000). Examining the Link between Teacher Wages and Student
Outcomes: The Importance of Alternative Labour Market Opportunities and Non-
Pecuniary Variation. The Review of Economics and Statistics, 82(3), 393-408.1327.
Macpherson, M. (2001). Performance measurement in non-profit and public sector
organisations, Measuring Business Excellence, vol. 16 No. 2,pp. 13-18.
Mahy, B., Rycx, F., & Volral, M. (2009). Wage dispersion and firm productivity in
different working environments. IZA working paper no. 4044, Social Science
Research Network, New York.
Maicibi, N.A. (2003). Pertinent issues in employees management. Kampala: MPK
Graphic ltd.
Maicibi, N.A. (2005). Pertinent issues in management: Human Resource and Educational
Management, 1st Ed, Net Media Publishers, Kampala.
Mark, B. (2010). Low Employee Motivation, Is This Your Fault?.
McAdam et al (2005). Performance management in the UK public sector: addressing
multiple stakeholder complexity. International Journal of Public Sector Management,
vol.3, pp.256-73.
Minghat, A. (2002). Teacher Salary Issues in African Countries, World Bank, Africa
Region, Human Development Analysis and Policy Development Support Team,
processed.
41
Ministry of Education and Sports of Uganda (2003). Impact of Primary Education
Reform Programme (PERR) on the Quality of Basic Education in Uganda, ADEA
Country case study
Ministry of Education and Statistics, (2002). Measuring the impact of primary education
Morris, S. (2000). Defining the non profit sector: Some lessons from history, voluntas:
International Journal of Voluntary and Profit Organizations, vol. 11 No.1, pp.25-43.
Neely A and Kennerly M. (2002). A framework of factors affecting the evolution
performance measurement systems, International Journal of Operations and
Production, vol. 23 No. 2, pp 213-24.
Nkata, (2004). Measurement of performance in organizations.
Perry et al (2006). Motivating employees in a new Governance Era: the performance
Paradigm revisited. Public Administration review, 66 505-514.
Pollit C,(2000), Is the emperor in his under wear? An analysis of the impacts of public
management reform, Public management, vol. 2. No 2, pp.181-99.
Prendergast, C. (2002). The tenuous trade-off between risk and incentives. Journal of
Political Economy, 110(5), 1071–1102.
Propper C and Wilson D. (2003). The use and usefulness of performance measures in the
public sector, Oxford Review of Economic Policy, vol. 19 No. 2, pp. 250-67.
Richard Kavuma (2006). UPE goals go offside, the observer ltd
Richard, M. Ryan, Deci and Edward L. (2000 b: 71). Needs, Satisfaction, Motivation and
Well-Being in the World Organizations of a former Eastern Bioc Country: A Cross-
cultural study of self-determination.
Robbins, P.S, (2003). Organizational Behaviour. (10th Ed.), Prentice Hall of India. New
Delhi.
42
Schneider, Mark (2003), Linking School Facility Conditions to Teacher Satisfaction and
Success
See Bacolod, M. (2007). Do Alternative Opportunities Matter? The Role of Female
Labor Markets in the Decline of Teacher Quality. The Review of Economics and
Statistics, 89(4), 737-751.
Silvie, L. (2004). Teachers‘ pay and conditions: An assessment of recent trends in
Africa.
Turner, H.A., & Jackson, D.A. (2009). On the stability of wage differences and
productivity-based wage policies: An international analysis. British Journal of
Industrial Relations, 7(1), 1–18.
UNATU, (2010). Teachers demand for better working conditions, Uganda‘s Education
news
UNESCO, (2006). Scolarisation Primaire Universelle: Un objectif pourtours. Document
statistique.MINEDAF VIII, UNESCO.
Wainwright, S. (2003). Measuring Impact: A guide to Resources, NVCO, London.
Wilson, J. (2004). Comprehensive performance assessment-spring board or dead-weight,
Public Money.
Wilson S. Ed. (2009). Teacher Quality Education Policy White Paper. National Academy
of Education.
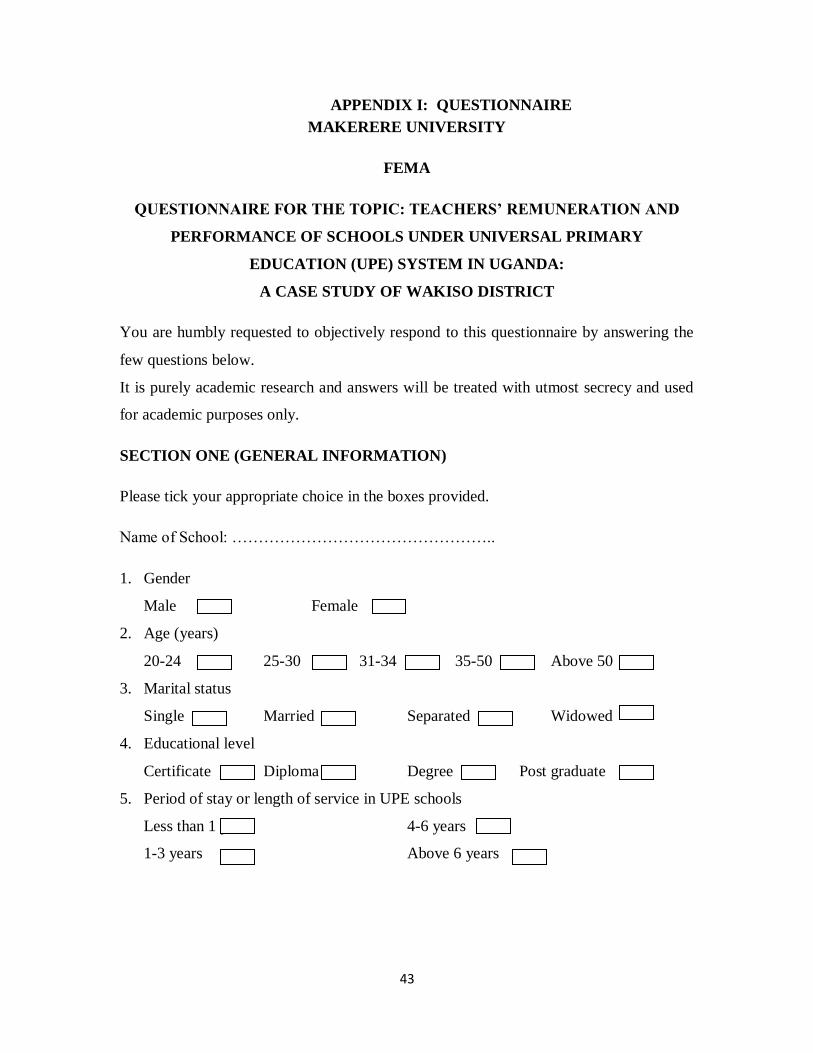
43
APPENDIX I: QUESTIONNAIRE
MAKERERE UNIVERSITY
FEMA
QUESTIONNAIRE FOR THE TOPIC: TEACHERS’ REMUNERATION AND
PERFORMANCE OF SCHOOLS UNDER UNIVERSAL PRIMARY
EDUCATION (UPE) SYSTEM IN UGANDA:
A CASE STUDY OF WAKISO DISTRICT
You are humbly requested to objectively respond to this questionnaire by answering the
few questions below.
It is purely academic research and answers will be treated with utmost secrecy and used
for academic purposes only.
SECTION ONE (GENERAL INFORMATION)
Please tick your appropriate choice in the boxes provided.
Name of School: …………………………………………..
1. Gender
Male Female
2. Age (years)
20-24 25-30 31-34 35-50 Above 50
3. Marital status
Single Married Separated Widowed
4. Educational level
Certificate Diploma Degree Post graduate
5. Period of stay or length of service in UPE schools
Less than 1 year 4-6 years
1-3 years Above 6 years
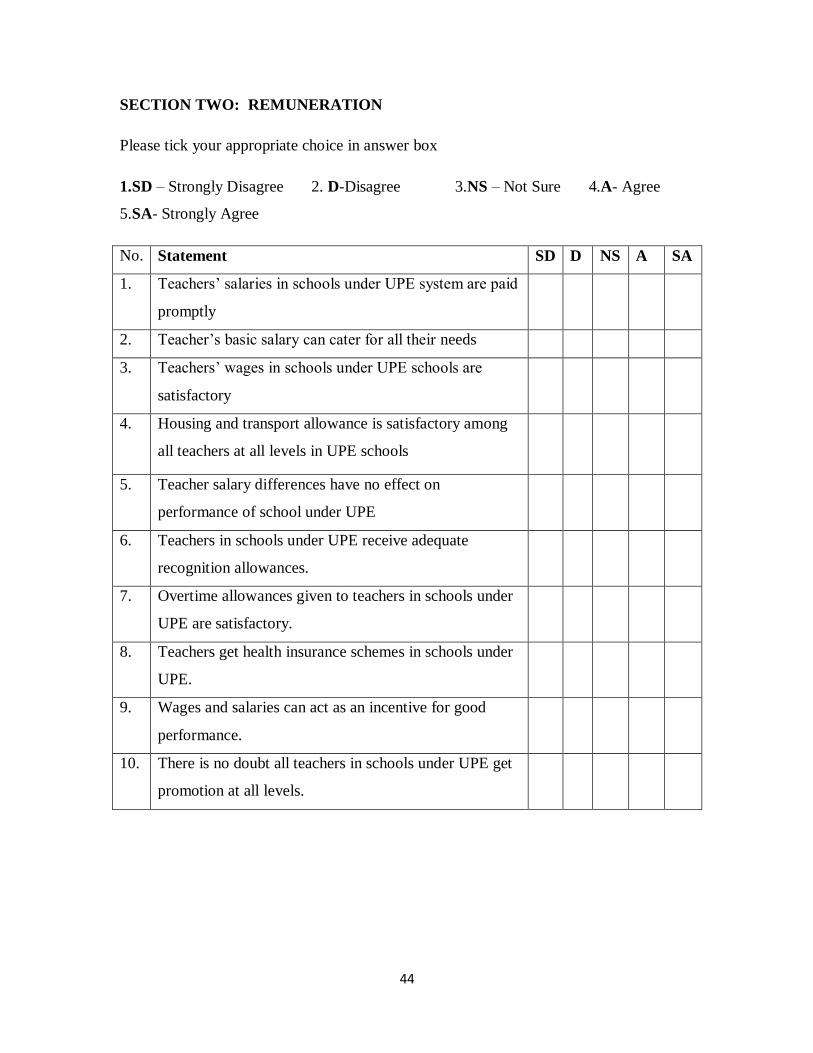
44
SECTION TWO: REMUNERATION
Please tick your appropriate choice in answer box
1.SD – Strongly Disagree 2. D-Disagree 3.NS – Not Sure 4.A- Agree
5.SA- Strongly Agree
No. Statement SD D NS A SA
1. Teachers‘ salaries in schools under UPE system are paid
promptly
2. Teacher‘s basic salary can cater for all their needs
3. Teachers‘ wages in schools under UPE schools are
satisfactory
4. Housing and transport allowance is satisfactory among
all teachers at all levels in UPE schools
5. Teacher salary differences have no effect on
performance of school under UPE
6. Teachers in schools under UPE receive adequate
recognition allowances.
7. Overtime allowances given to teachers in schools under
UPE are satisfactory.
8. Teachers get health insurance schemes in schools under
UPE.
9. Wages and salaries can act as an incentive for good
performance.
10. There is no doubt all teachers in schools under UPE get
promotion at all levels.
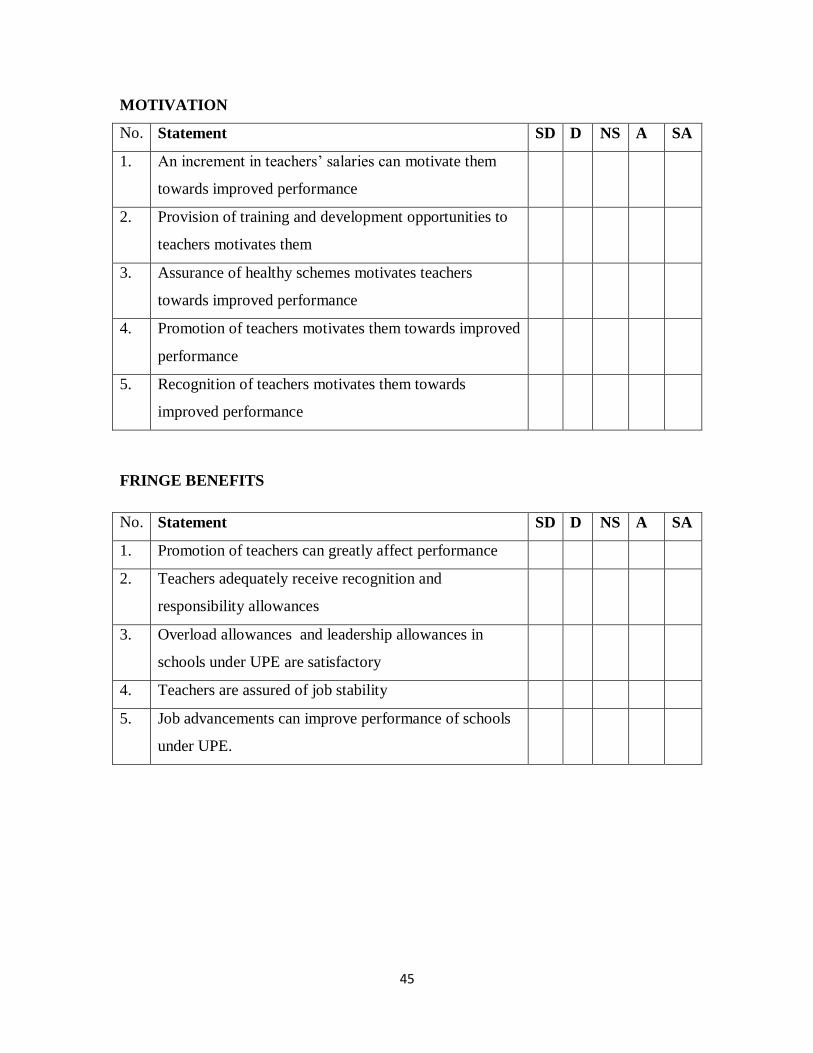
45
MOTIVATION
No. Statement SD D NS A SA
1. An increment in teachers‘ salaries can motivate them
towards improved performance
2. Provision of training and development opportunities to
teachers motivates them
3. Assurance of healthy schemes motivates teachers
towards improved performance
4. Promotion of teachers motivates them towards improved
performance
5. Recognition of teachers motivates them towards
improved performance
FRINGE BENEFITS
No. Statement SD D NS A SA
1. Promotion of teachers can greatly affect performance
2. Teachers adequately receive recognition and
responsibility allowances
3. Overload allowances and leadership allowances in
schools under UPE are satisfactory
4. Teachers are assured of job stability
5. Job advancements can improve performance of schools
under UPE.

46
NATURE OF WORKING CONDITIONS
No. Statement SD D NS A SA
1. Teachers are given opportunities to collaborate with
their colleagues
2. Teachers are provided with adequate and conducive
accommodation
3. Teachers are availed with expanded career opportunities
in schools under UPE
4. There are better terms of teacher payment in schools
under UPE
5. Teachers are provided with adequate facilities to handle
student needs
PERFORMANCE
No. Statement SD D NS A SA
1. Student national results in schools under UPE is high
2. There are no cases of teacher absenteeism in schools
under UPE
3. Teachers provide individualized attention to their
students in schools under UPE system.
4. Teacher turnover is low in schools under UPE system
5. Schools under UPE strictly follow the policies and
regulations of the Ministry of Education and Sports
Thanks for your participation
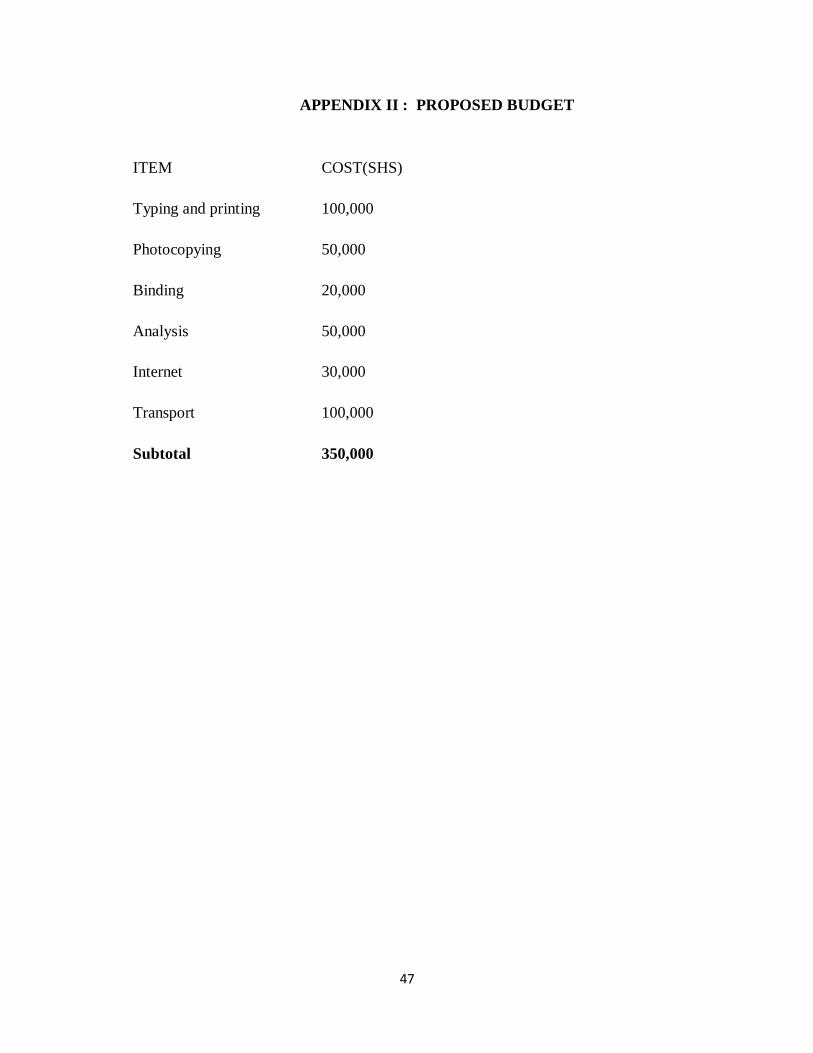
47
APPENDIX II : PROPOSED BUDGET
ITEM COST(SHS)
Typing and printing 100,000
Photocopying 50,000
Binding 20,000
Analysis 50,000
Internet 30,000
Transport 100,000
Subtotal 350,000

48
APPENDIX III: INTRODUCTORY LETTER
Recommended