Technical AnalysisTechnical Analysis
Technical Analysis
• Basics
• Analysis - Trading
• Alternative methods
• Examples
• Discussion

Basics
• The market discounts everything
• Chart types
• Simple tools
The market discounts everything
TA is...
• a research approach, using only historical prices.
• the study of prices, with charts being the primary tool.
• a self fulfilling prophecy.
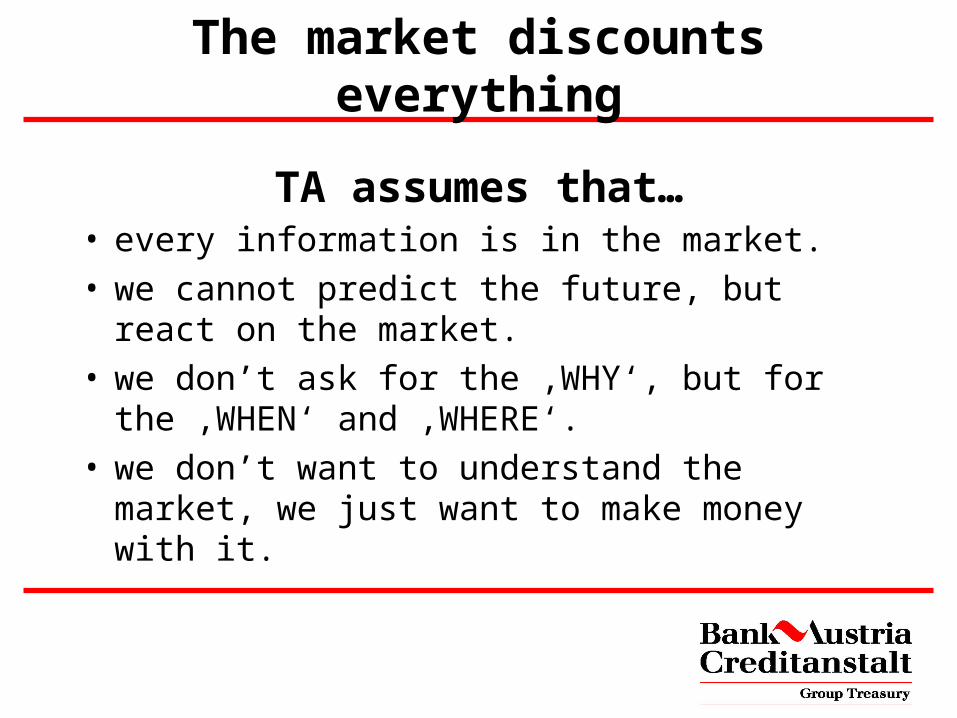
The market discounts everything
TA assumes that…
• every information is in the market.• we cannot predict the future, but react on the
market.• we don’t ask for the ‚WHY‘, but for the
‚WHEN‘ and ‚WHERE‘.• we don’t want to understand the market, we
just want to make money with it.
The market discounts everything
TA has one target:
Discipline
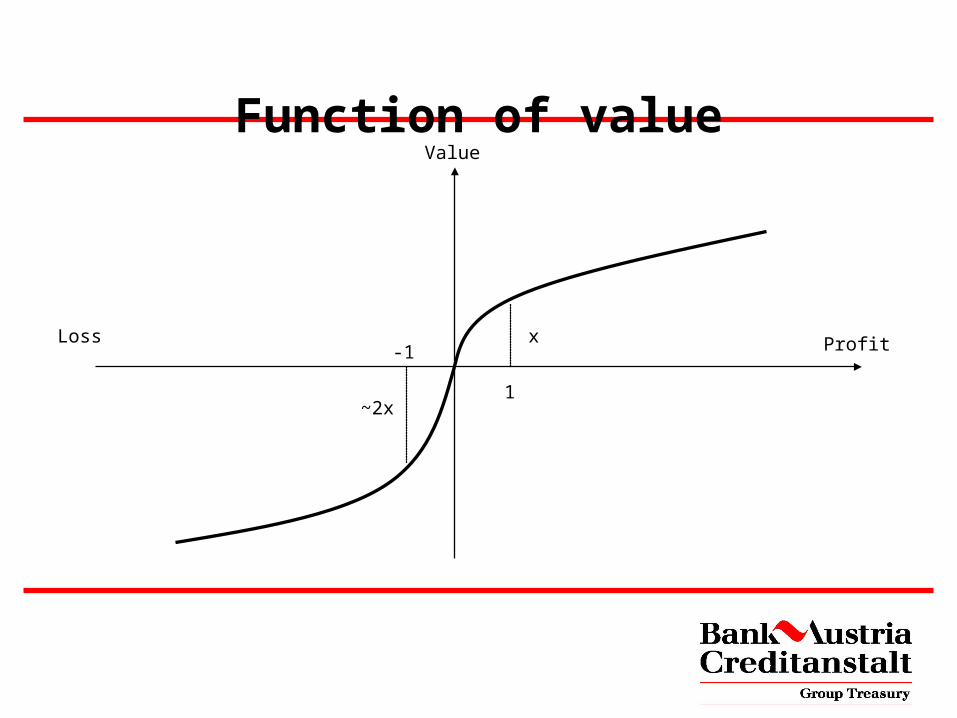
Function of valueValue
ProfitLoss
1
-1x
~2x
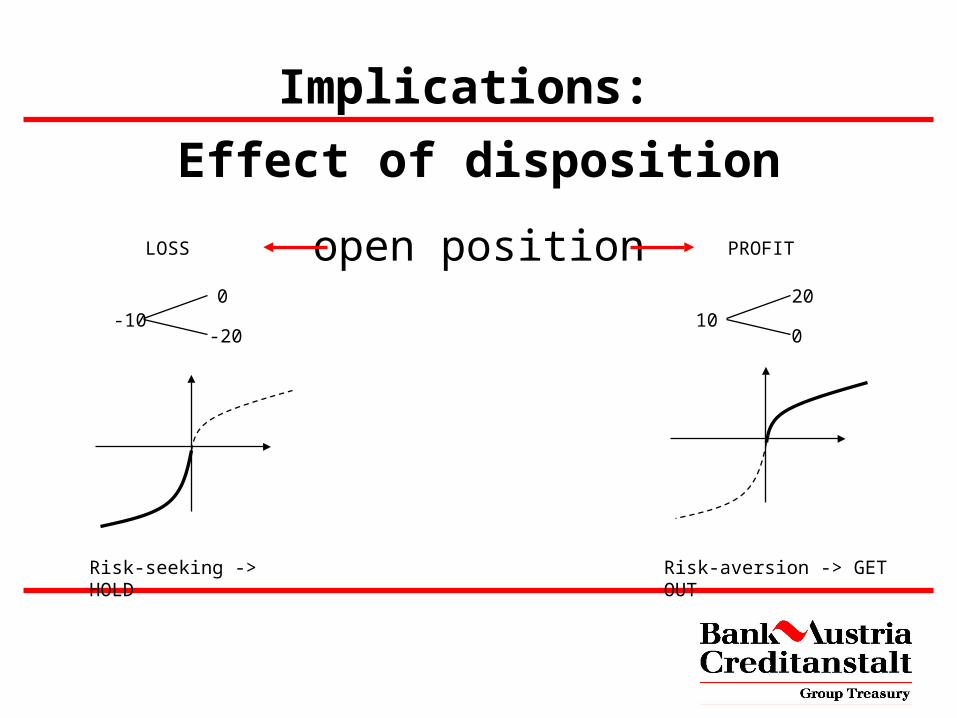
Implications:
Effect of disposition
open positionLOSS PROFIT
-100
-2010
20
0
Risk-seeking -> HOLD Risk-aversion -> GET OUT

Chart types
• Line charts
• Bar charts
• Candlestick charts
Simple tools
• trend channels
• support - resistance
• retracements
• others

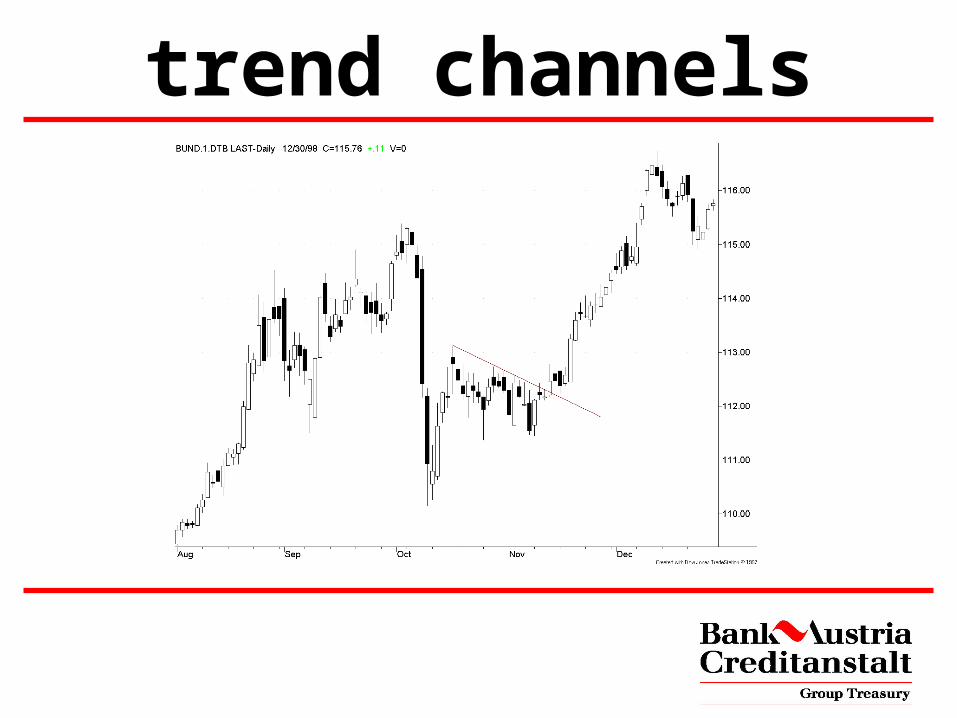
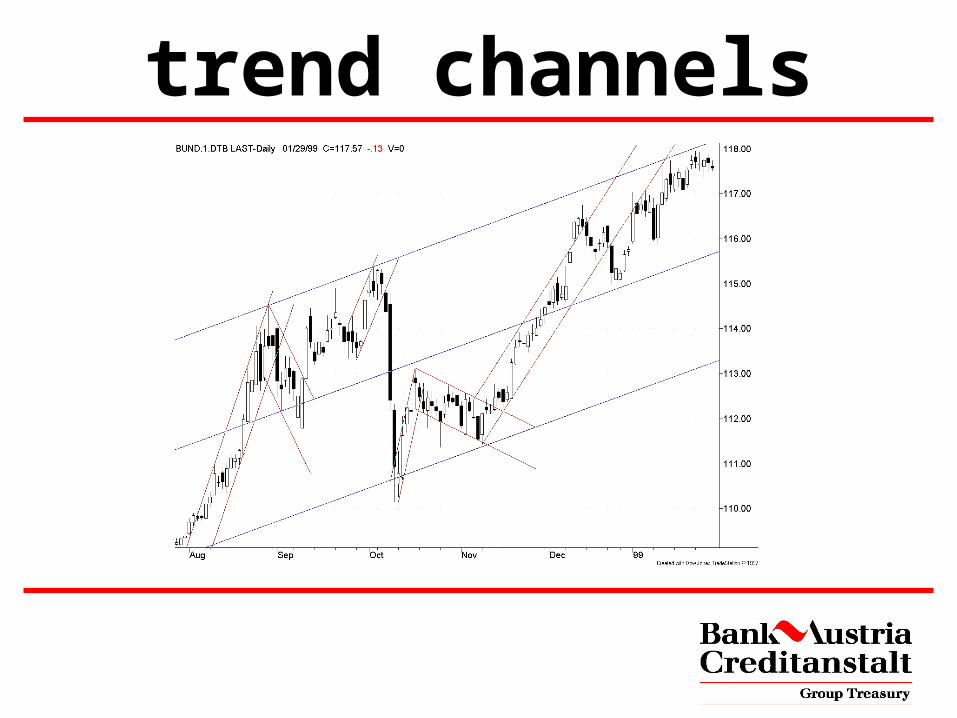
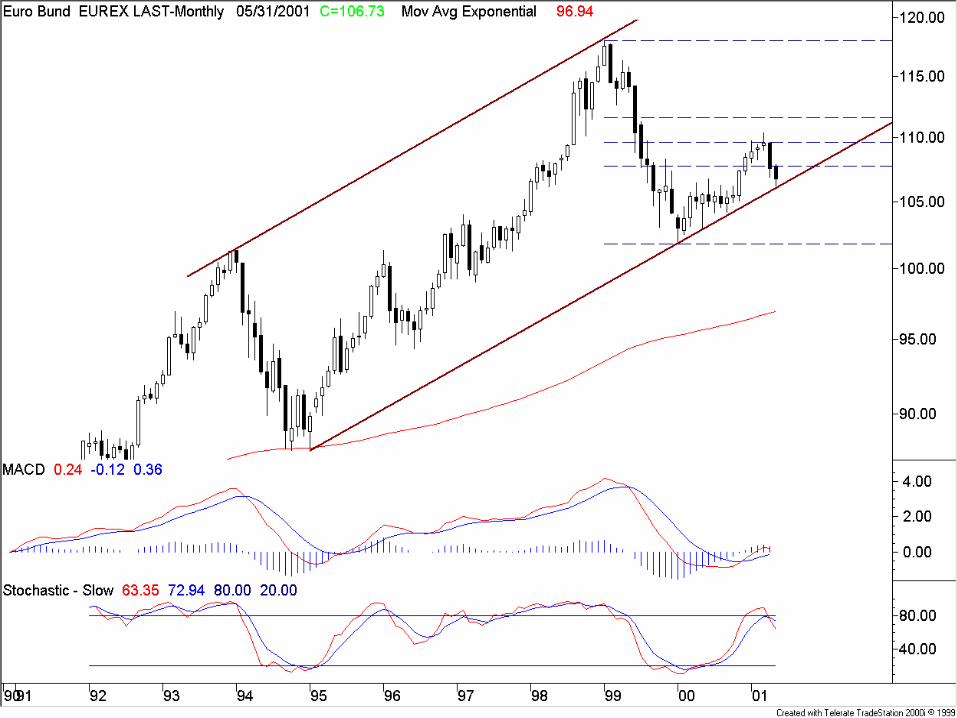
trend channels
trend channels

trend channels

trend channels

trend channels
trend channels
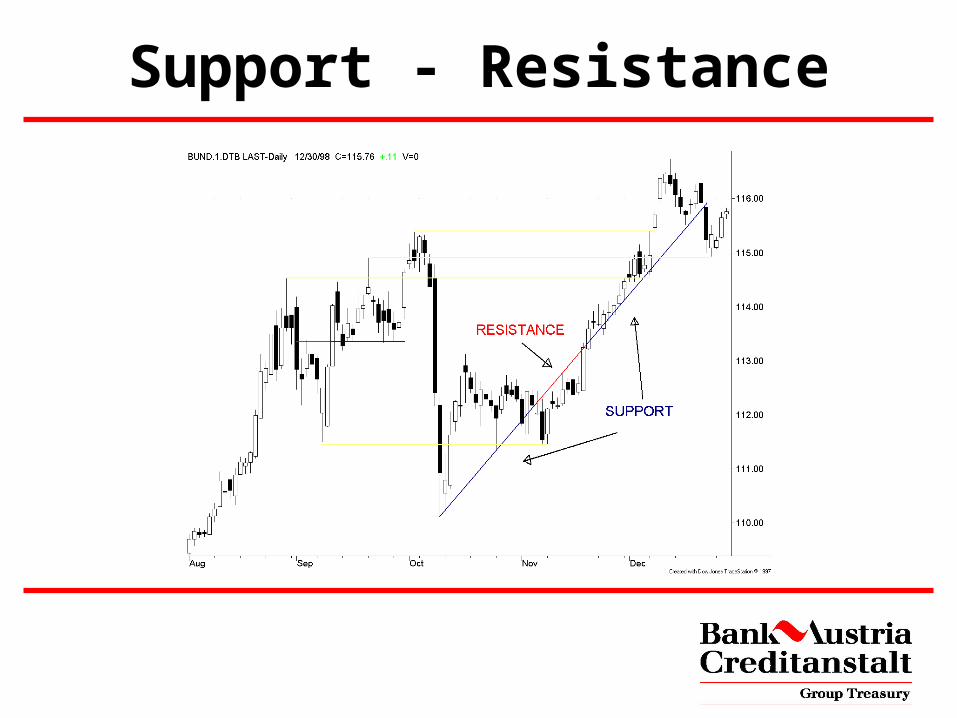
Support - Resistance
Simple tools
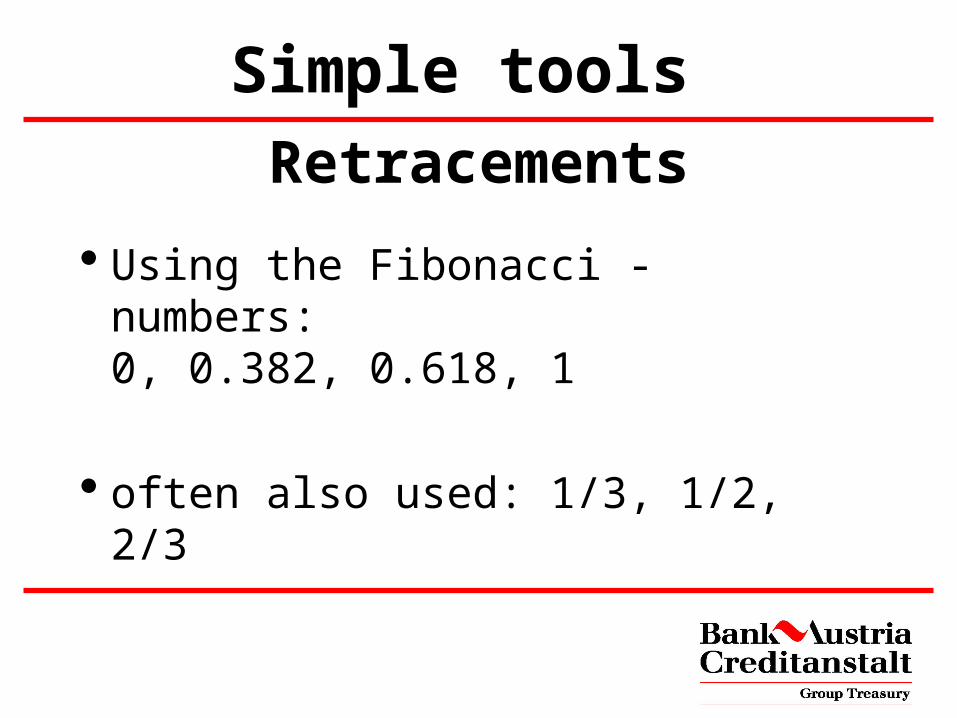
Retracements
Using the Fibonacci - numbers:0, 0.382, 0.618, 1
often also used: 1/3, 1/2, 2/3
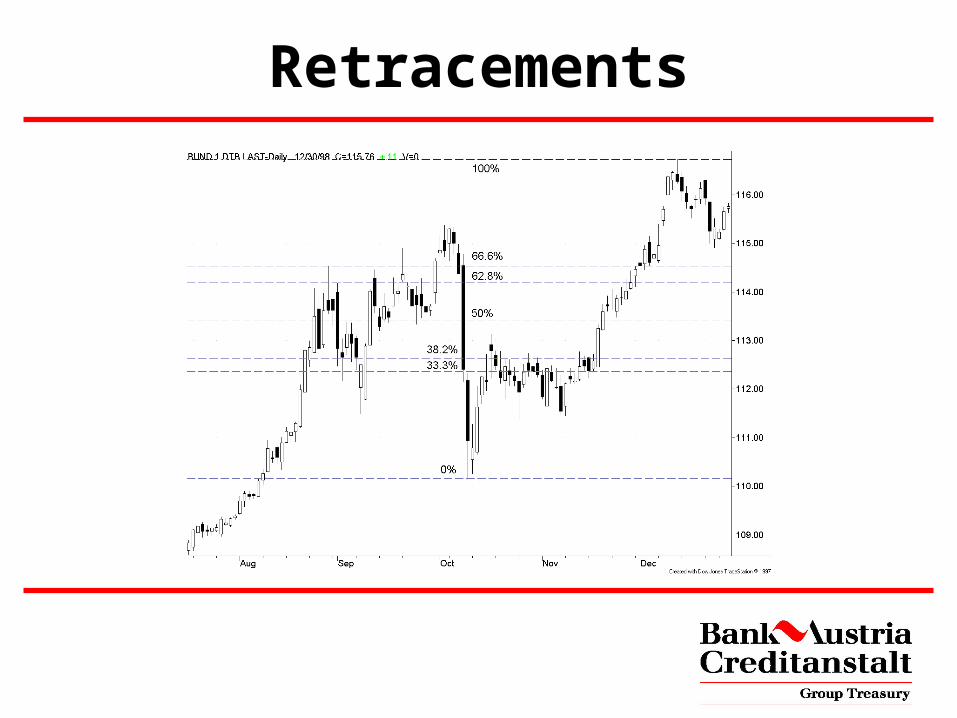
Retracements
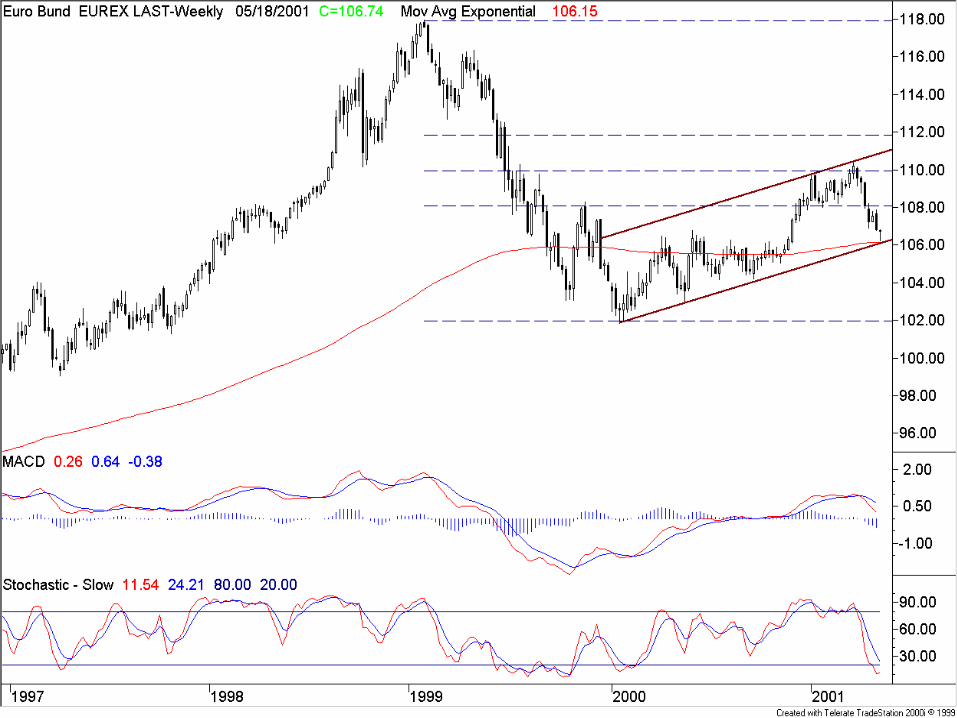
Analysis
• Indicators
• Oscillators
• Volatility

Indicators
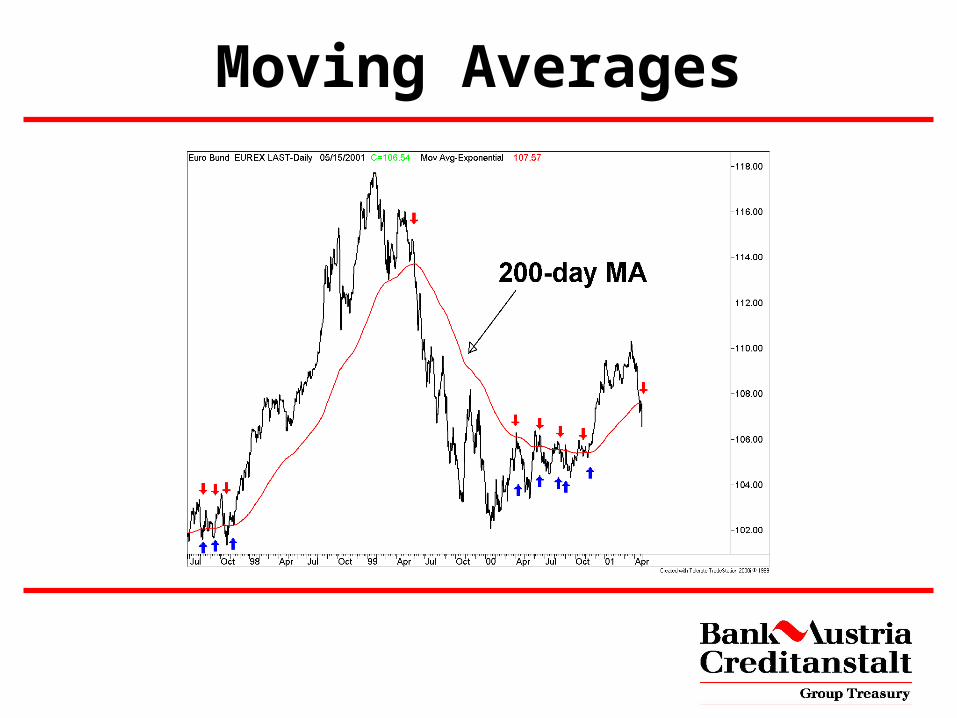
Moving Averages
• simple MA
• weighted MA
• exponential MA
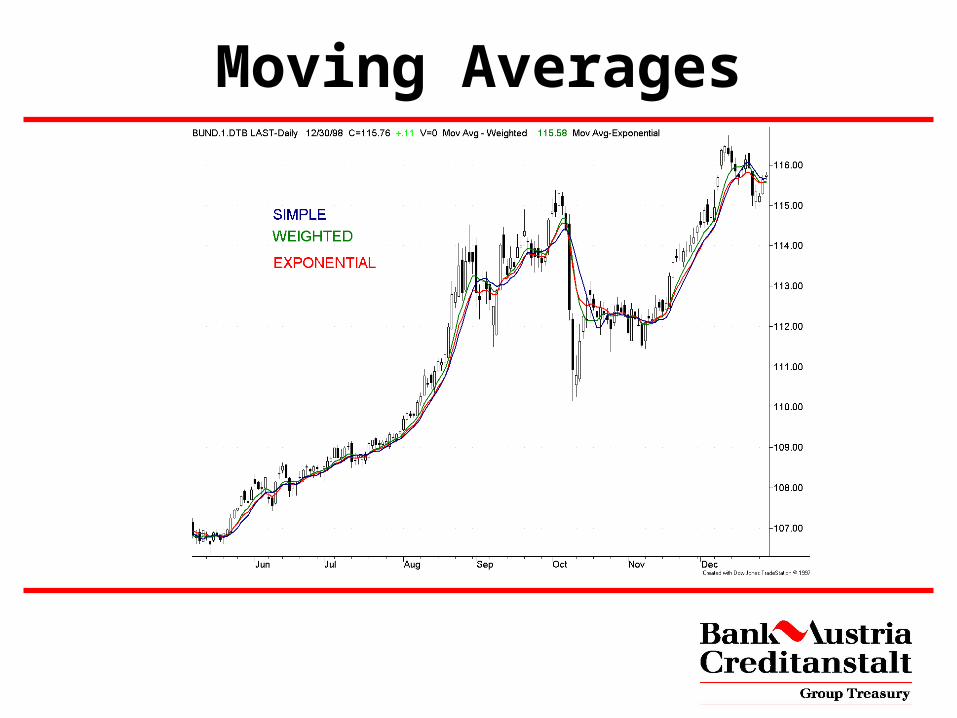
Moving Averages
Moving Averages
Indicators
MACD
• MACD-line: EMAshort-term – EMAlong-term
• Trigger-line:EMA (MACD-Line)
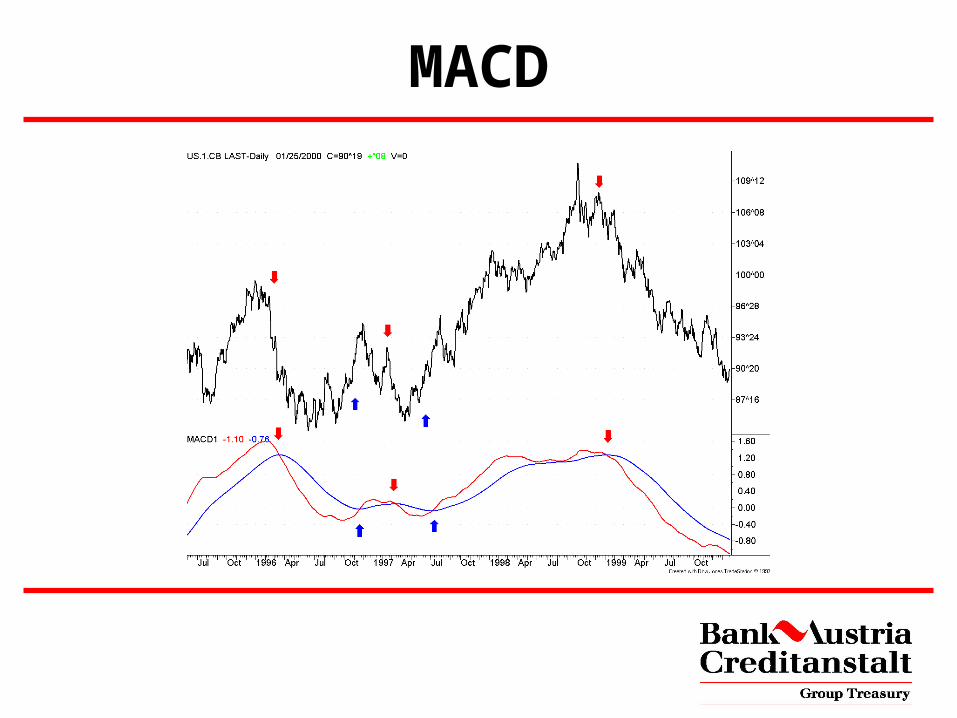
MACD

Oscillators
• Momentum
• Stochastics
• many more (RSI, ROC, …)
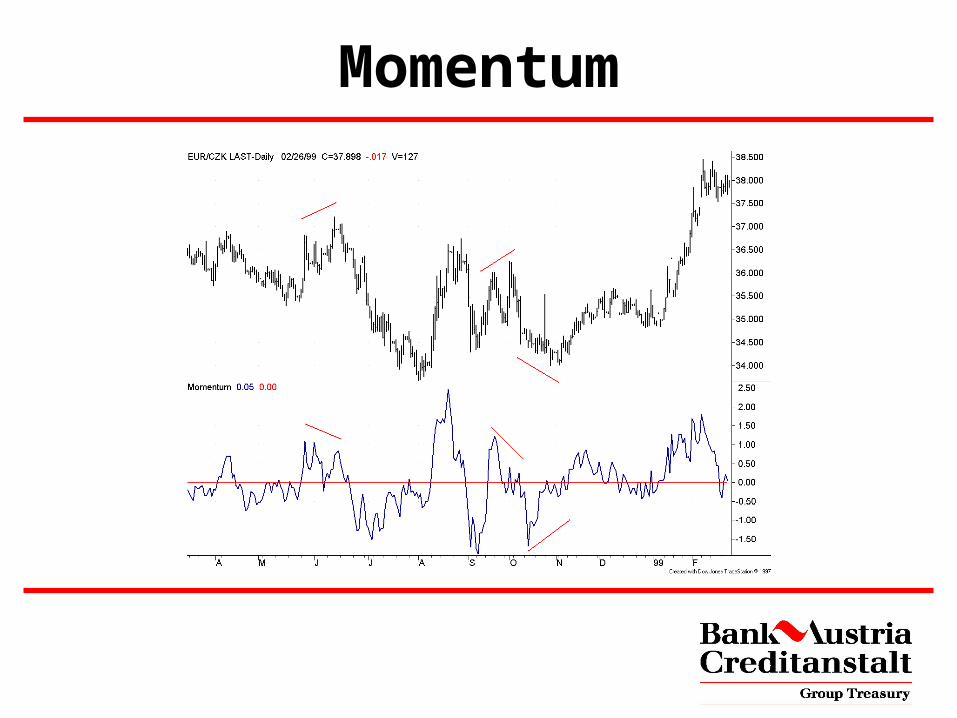
Momentum
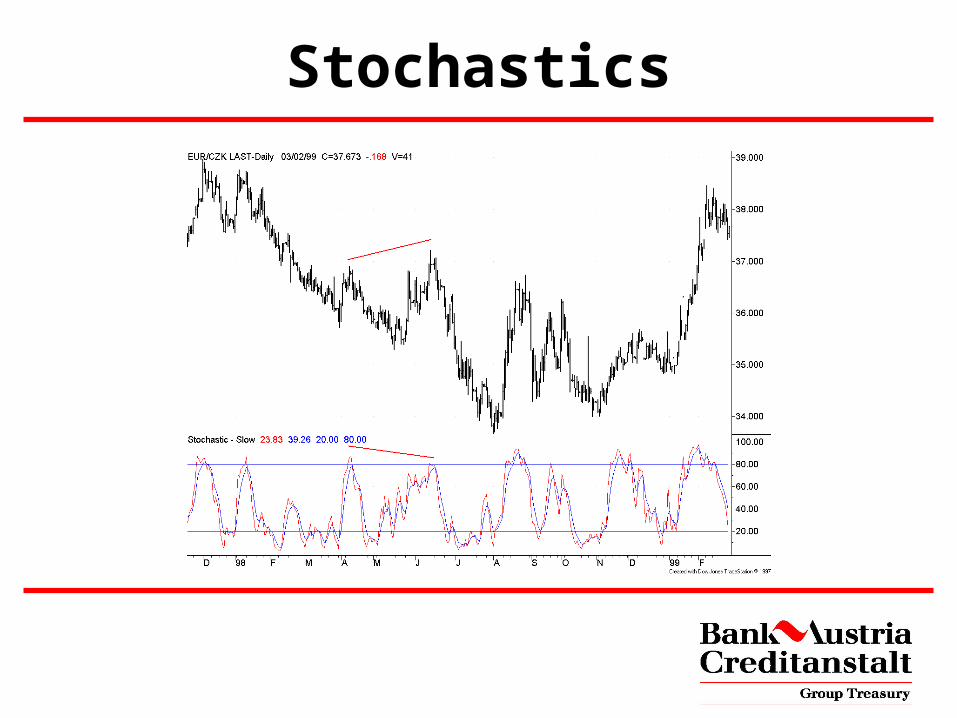
Stochastics

Volatility
Trading
• Noise Trading
• Technical Trading
• System Trading


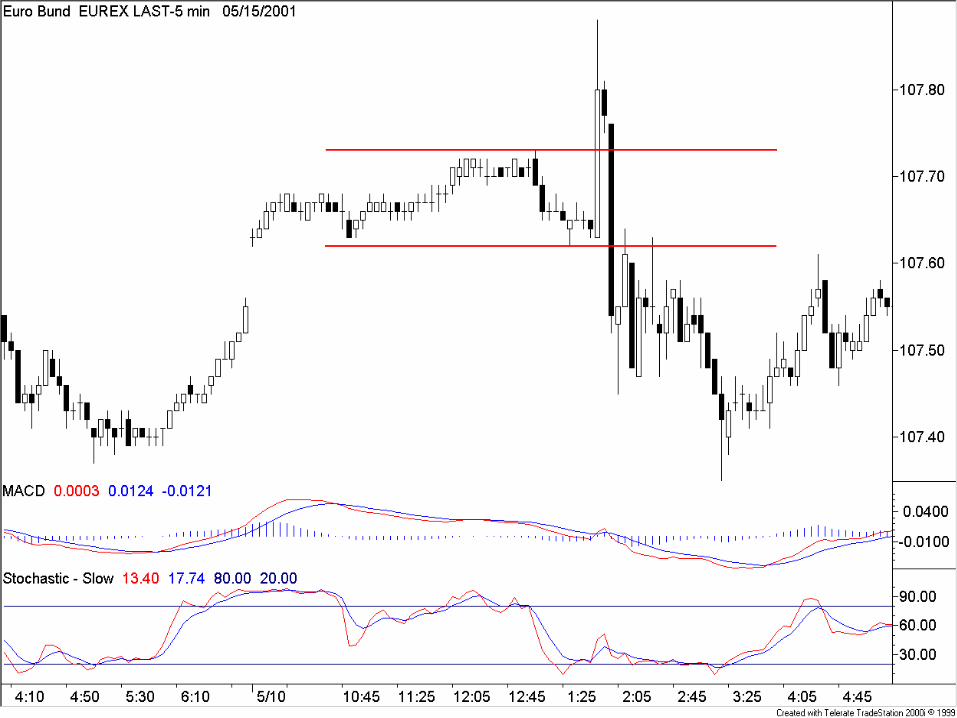
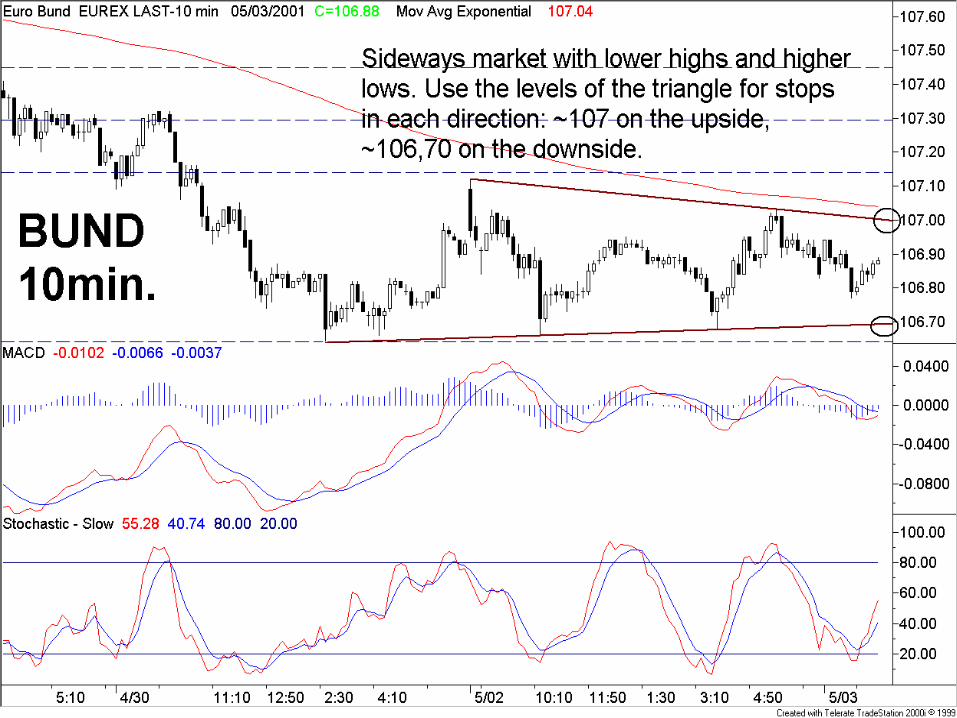
Pre-ECB sideways market
High: 107,23
Low: 107,62


Systems
• defined entry-signals
• winning trades - defined exit-signals
• loosing trades - defined exit-signals
• money management
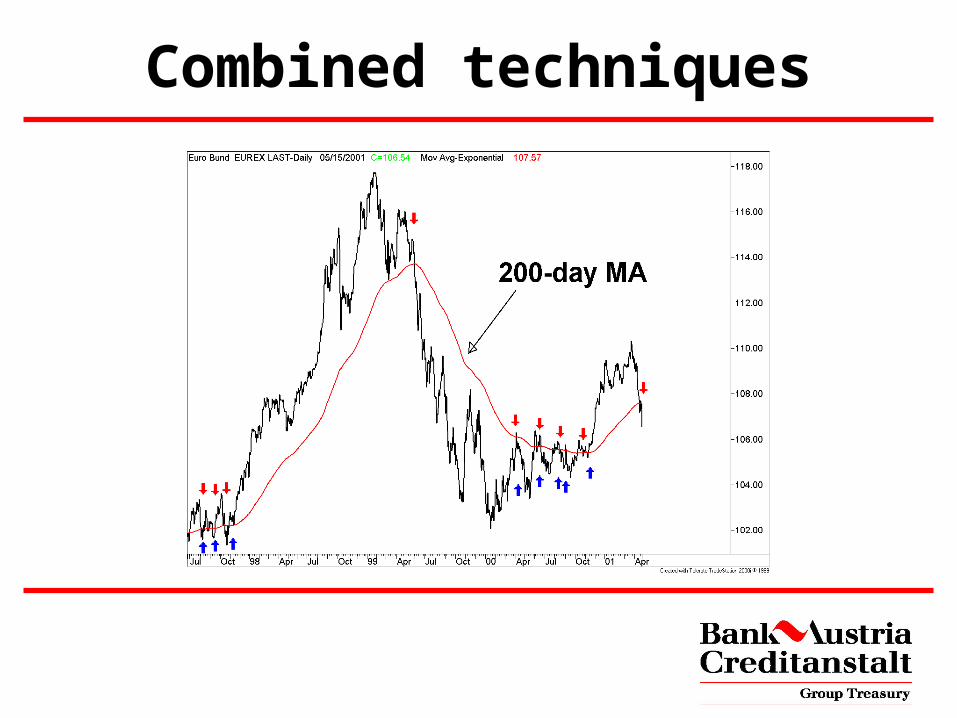
Combined techniques

Combined techniques

Alternative Methods
• Fibonacci
• Elliott Wave Theory
• Japanese Candlesticks
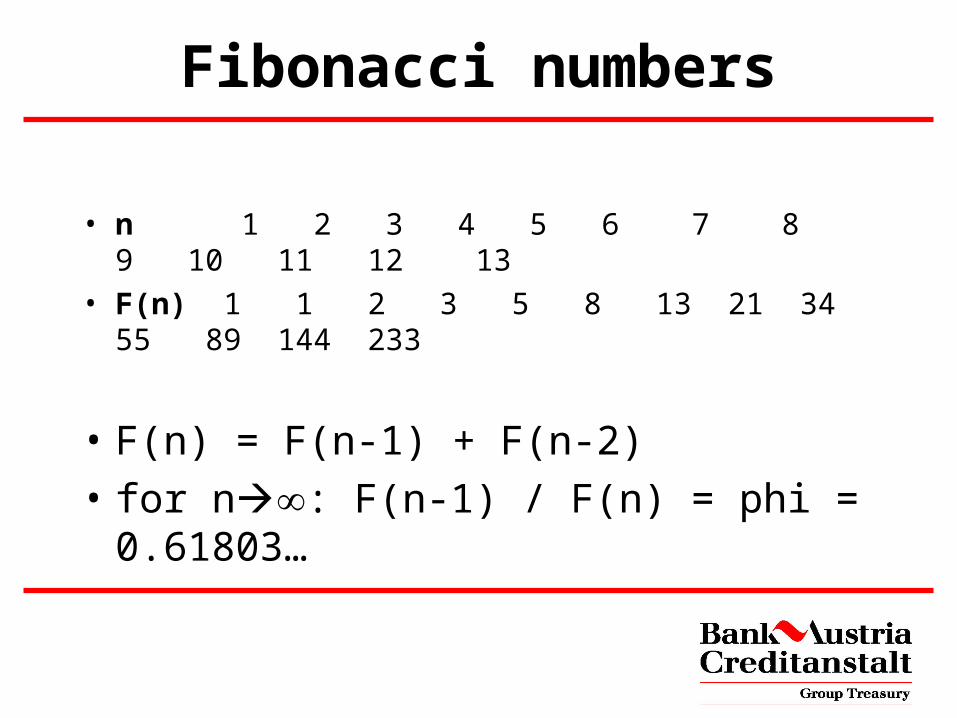
Fibonacci numbers
• n 1 2 3 4 5 6 7 8 9 10 11 12 13
• F(n) 1 1 2 3 5 8 13 21 34 55 89 144 233
• F(n) = F(n-1) + F(n-2)
• for n: F(n-1) / F(n) = phi = 0.61803…
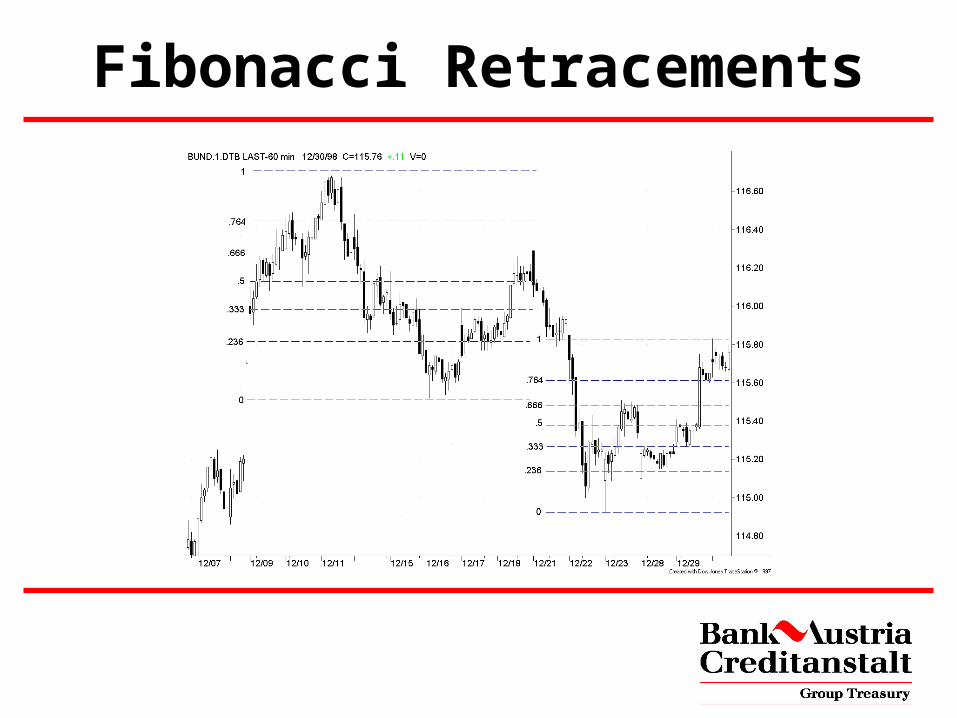
Fibonacci Retracements
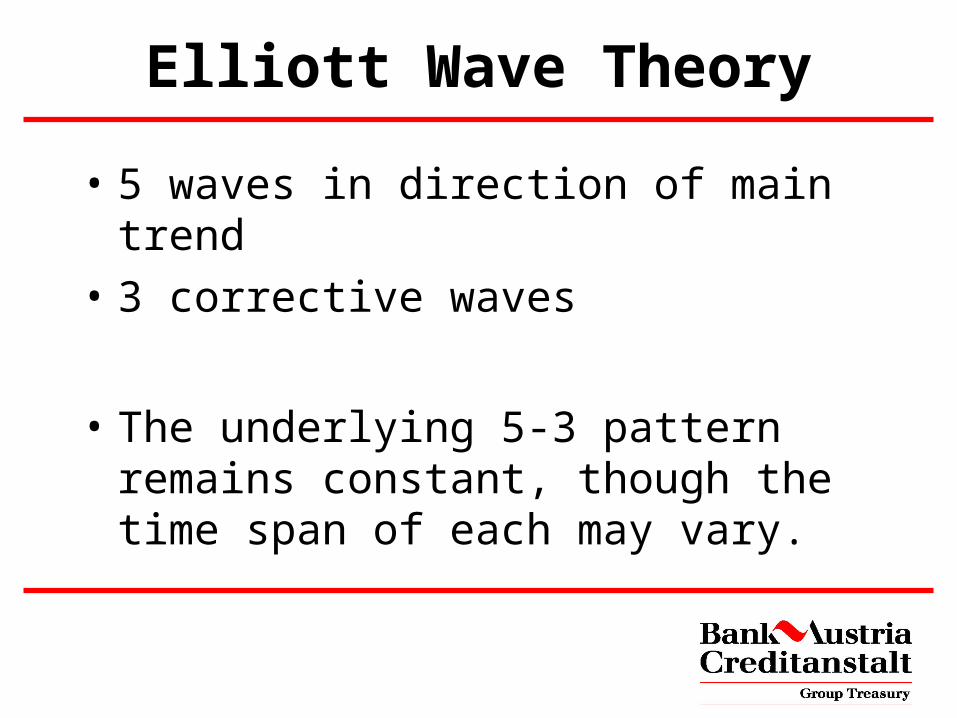
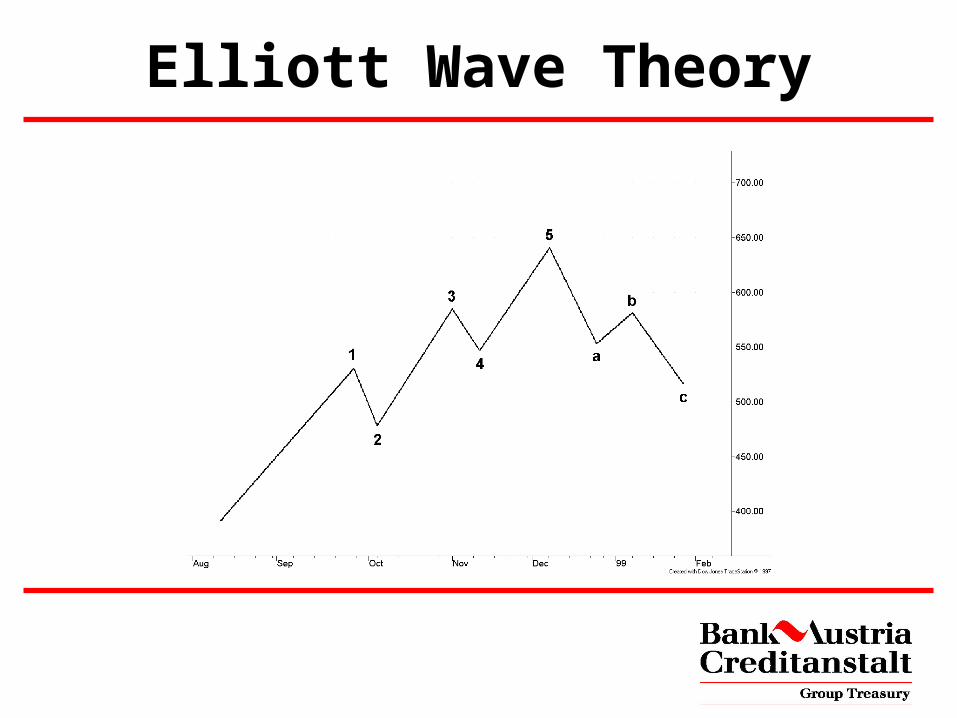
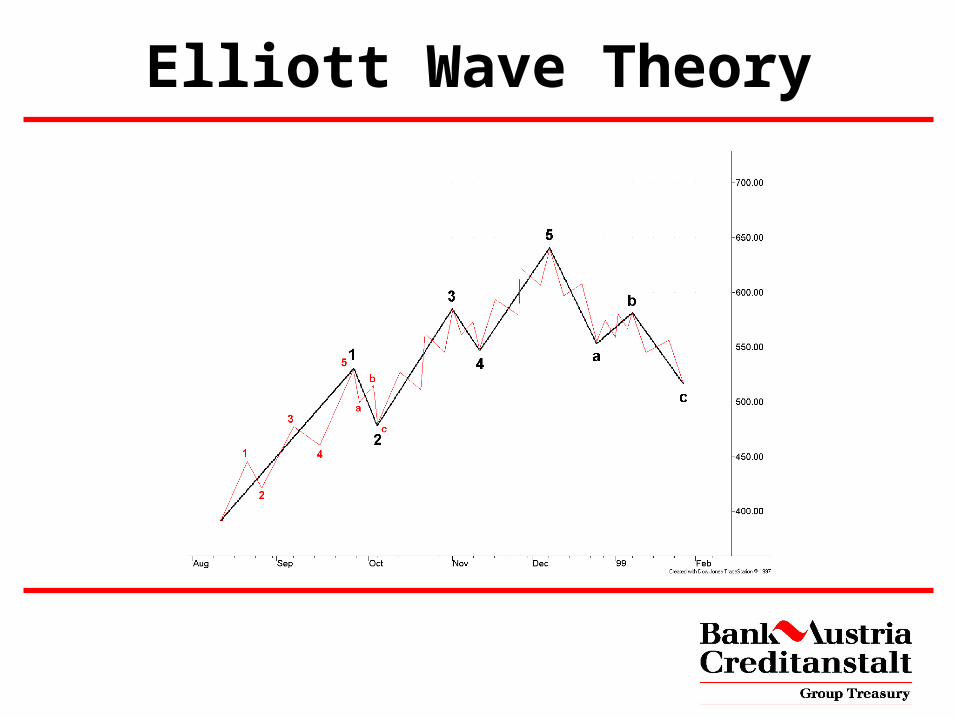
Elliott Wave Theory
• 5 waves in direction of main trend
• 3 corrective waves
• The underlying 5-3 pattern remains constant, though the time span of each may vary.
Elliott Wave Theory
Elliott Wave Theory
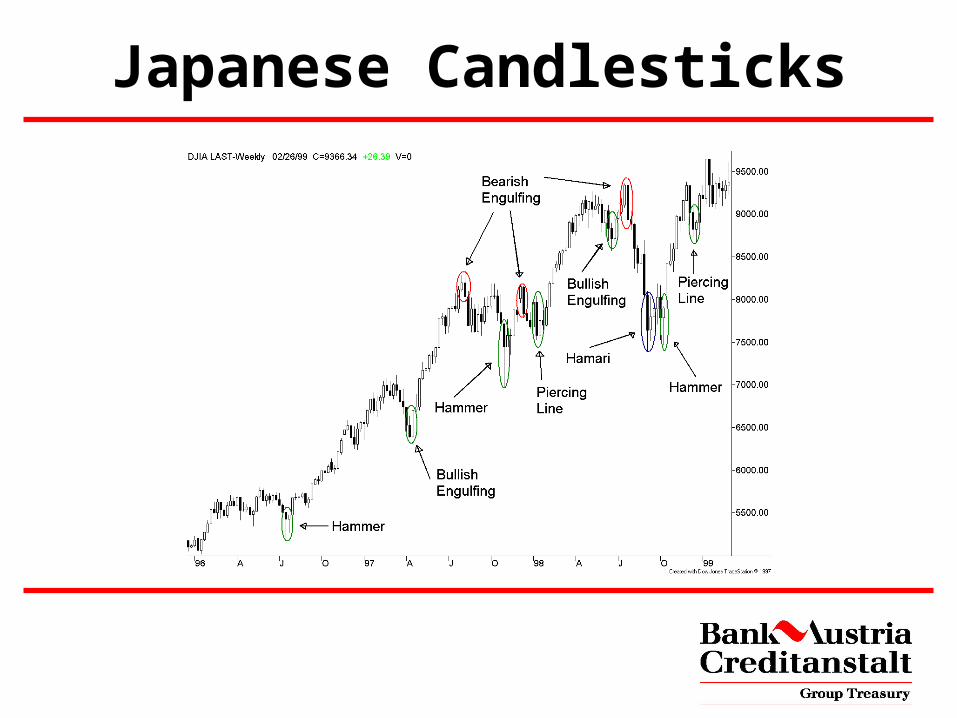
Japanese Candlesticks
Examples


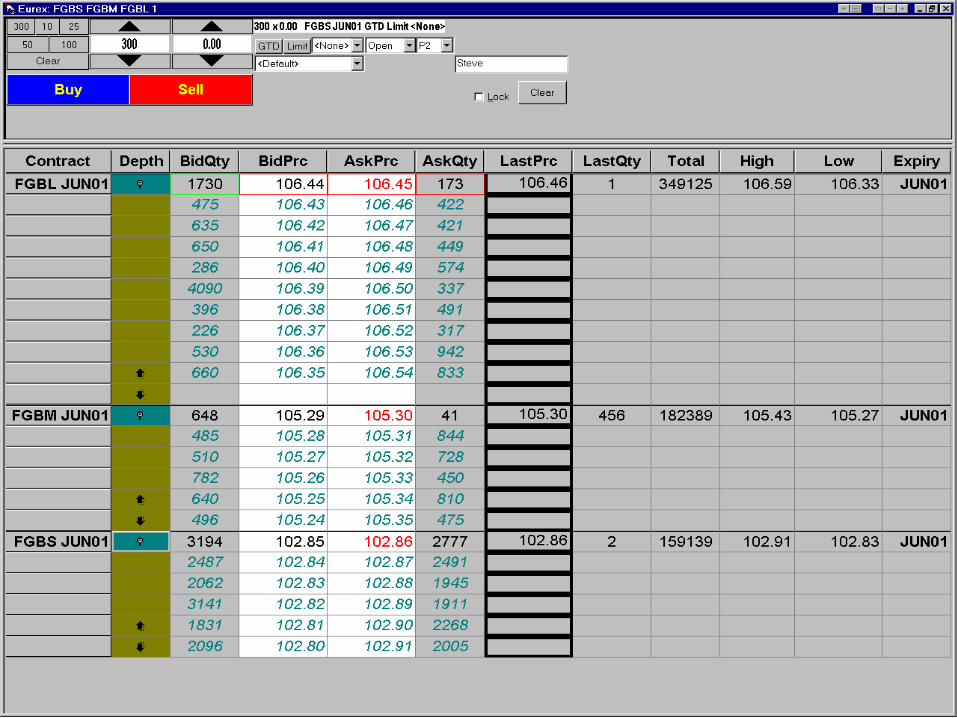
Real-time example

Conclusio
Information is pretty thin stuff, unless
mixed with experience.
Recommended


![Alternative Trading Systems Directory 2010[1]](https://img.pdfslide.net/doc/110x75/55250cdb4a7959f90c8b46fa/alternative-trading-systems-directory-20101.jpg)