Technics of financial assessment
of an infrastructure project
Balázs Felsmann
REKK
14-16. December 2016
Tirana
1

Main focuses of the corporate (TSO)
level financial assessment
• Identify the investment costs of the project
including the material and financial costs of
investment;
• Model the effects of the new infrastructure on the
operational costs and revenues of the TSO;
• Check the TSO’s general financial capabilities to
finance the fixed asset investment;
• Measure the effects of the regulatory regime on
the added value of the project.
2

Benefit categories in
ENTSO Guideline
Effects on
TSO level
Consideration in the corporate level
model
Comments
B1. Improved security
of supply-
Partial Through decreasing O&M costs Newer infrastructure reduces the
cost of maintenance
B2. Socio-economic
welfare (SEW)
Partial Effects of rent change calculated in
corporate model. All other SEW impacts
considered in economic model
Rent change impact depends on
regulatory regime.
B3. RES integration None Considered in economic model No direct impacts on TSO level.
B4. Variation in losses Partial Considered in economic model Better system quality reduces the
cost of network losses- depends
on regulation.
B5. Variation in CO2
emissions
None Considered in economic model No direct impacts on corporate
level
B6. Technical
resilience/system
safety
YES Higher technical capabilities calculated in
investment cost of fixed assets
Direct effects on TSO through
cost of capital
B7. Flexibility Partial Higher technical capabilities calculated in
investment cost of fixed assets
Direct effects on TSO through
cost of capital
Infrastructure project benefit categories
of the ENTSO-E Guideline
3
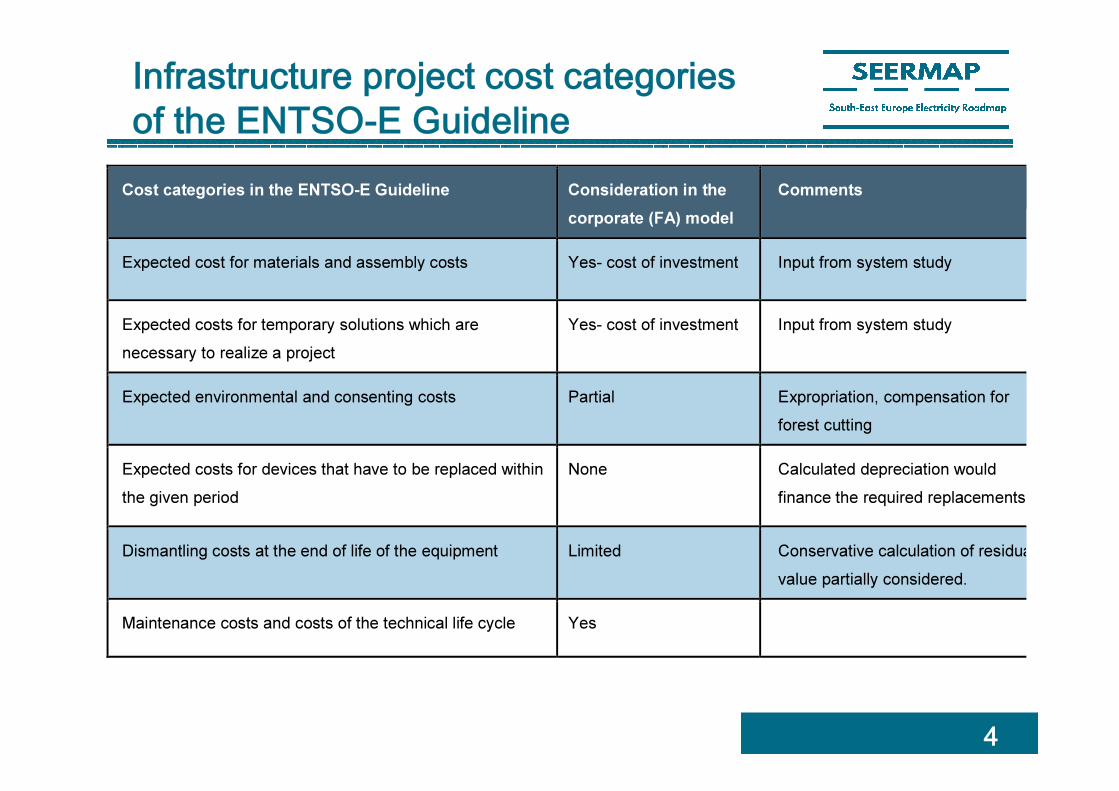
Infrastructure project cost categories
of the ENTSO-E Guideline
4
Cost categories in the ENTSO-E Guideline Consideration in the
corporate (FA) model
Comments
Expected cost for materials and assembly costs Yes- cost of investment Input from system study
Expected costs for temporary solutions which are
necessary to realize a project
Yes- cost of investment Input from system study
Expected environmental and consenting costs Partial Expropriation, compensation for
forest cutting
Expected costs for devices that have to be replaced within
the given period
None Calculated depreciation would
finance the required replacements
Dismantling costs at the end of life of the equipment Limited Conservative calculation of residual
value partially considered.
Maintenance costs and costs of the technical life cycle Yes

Assumptions
• Regulatory model
• Cost of operation
• Cost of financing
• Working capital
Calculation sheets
• Revenues & costs
• Debt service
• CAPEX &
depreciation
Financial statements of version 1
• Profit and loss statement
• Balance sheet
• Cash flow
Summary and
Case Reports
Sensitivity
analysis
Detailed structure of a financial
assessment model
Financial statements of version 2
• Profit and loss statement
• Balance sheet
• Cash flow
Financial statements of version „n”
• Profit and loss statement
• Balance sheet
• Cash flow
5

ENTSO-E Guideline expressions on calculation method: „All costs and
benefits are discounted to the present, and expressed in the price base of
that year.”
Our model’s main methodological characteristics:
• based on a discounted cash flow (DCF) method;
• uses the net present values (NPV) of the project as a main indicator to
demonstrate the key economic impacts;
• all figures are in nominal terms
• Discount rates are in nominal terms. The ENTSO-E Guideline declares:
the discount rate can be calculated as a real or a nominal rate. However,
this choice must be consistent with the valuation of costs and benefits:
real prices imply real rates, nominal prices imply nominal rate.
General methodology of measuring the
costs and revenues
6

7
Discounted cash flow method based on future free cash flows generated by
the planned project.
NPV: difference of cash inflows and cash outflows.
��� = � �����(1 + ���)�
�
���
where FCFE is the free cash flow to equity; ��� is the return expected by the
shareholders in the tth year.
�� = ���� + ��(1 − ��)
��
where E is equity, D is the stock of liabilities subject to interest (loans), V is the
aggregate value of equity and loans, and �� is the corporate tax rate.
Estimation of the attractiveness of an
investment opportunity - DCF method

Regulatory framework
In the financial assessment we simulate the most probable impacts of the regulatory
regime on the costs and income of the TSO. The simulation applies the general
equation of the RoR framework as the following:
RRn=OE
n+D
n+T
n+(RAB*RoR)
n
where: RRn
means the required revenue of the project for period ‘n’; OE means the operating expenses; D
means the depreciation expense; T means the tax expense; RAB means the regulated assets base and RoR
means the rate of return.
We can calculate the project level required revenue on the following way:
1. “Pass-through cost elements”, including:
• O&M costs
• Cost effects of the rent differences comparing the current situation.
• Other project related costs
• Depreciation.
2. Corporate tax
3. WACC*RAB
8
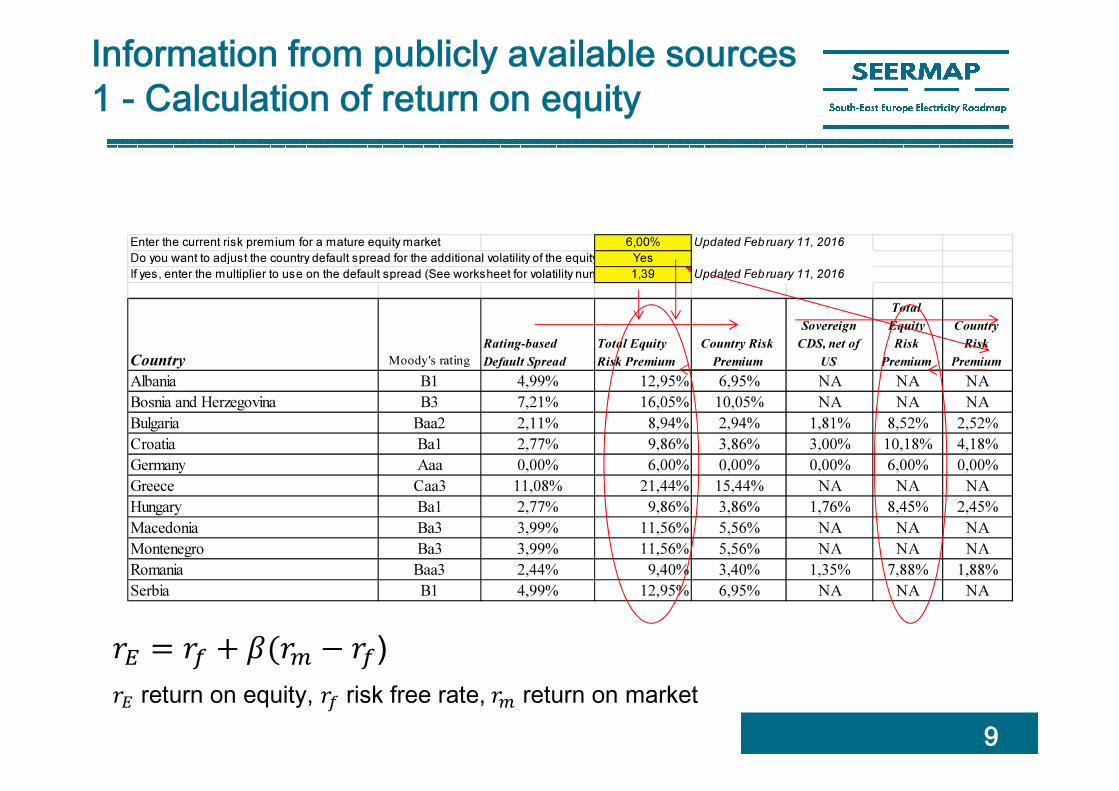
Information from publicly available sources
1 - Calculation of return on equity
9
Enter the current risk premium for a mature equity market 6,00% Updated February 11, 2016
Do you want to adjust the country default spread for the additional volatility of the equity market to get to a country premium?Yes
If yes, enter the multiplier to use on the default spread (See worksheet for volatility numbers for selected emerging markets)1,39 Updated February 11, 2016
Country Moody's rating
Rating-based
Default Spread
Total Equity
Risk Premium
Country Risk
Premium
Sovereign
CDS, net of
US
Total
Equity
Risk
Premium
Country
Risk
Premium
Albania B1 4,99% 12,95% 6,95% NA NA NA
Bosnia and Herzegovina B3 7,21% 16,05% 10,05% NA NA NA
Bulgaria Baa2 2,11% 8,94% 2,94% 1,81% 8,52% 2,52%
Croatia Ba1 2,77% 9,86% 3,86% 3,00% 10,18% 4,18%
Germany Aaa 0,00% 6,00% 0,00% 0,00% 6,00% 0,00%
Greece Caa3 11,08% 21,44% 15,44% NA NA NA
Hungary Ba1 2,77% 9,86% 3,86% 1,76% 8,45% 2,45%
Macedonia Ba3 3,99% 11,56% 5,56% NA NA NA
Montenegro Ba3 3,99% 11,56% 5,56% NA NA NA
Romania Baa3 2,44% 9,40% 3,40% 1,35% 7,88% 1,88%
Serbia B1 4,99% 12,95% 6,95% NA NA NA
�� = �� + �(�� − ��)
�� return on equity, �� risk free rate, �� return on market

10
Information from publicly available
sources 2 – betas and D/E ratios
Industry NameNumber of
firms Beta D/E Ratio Tax rateUnlevered
beta
Coal & Related Energy 21 0,83 50,64% 7,07% 0,57
Green & Renewable Energy 48 1,24 124,34% 12,79% 0,60
Oil/Gas (Integrated) 15 1,89 64,86% 20,56% 1,24
Oil/Gas (Production and Exploration) 133 2,02 179,05% 3,90% 0,74
Oil/Gas Distribution 34 1,72 106,31% 7,04% 0,87
Utility (General) 20 1,13 106,35% 23,58% 0,62
~ 52% debt and 48% equity
Industry Name
Number of
firms Beta D/E Ratio
Tax
rate
Unlevered
beta
Utility (General) 12 0,83 226,13% 12,47% 0,28
Emerging markets
Europe
~ 69% debt and 31% equity

11
How to define the proper beta?
Industry NameNumber of
firms Beta D/E Ratio Tax rateUnlevered
beta
Coal & Related Energy 21 0,83 50,64% 7,07% 0,57
Green & Renewable Energy 48 1,24 124,34% 12,79% 0,60
Oil/Gas (Integrated) 15 1,89 64,86% 20,56% 1,24
Oil/Gas (Production and Exploration) 133 2,02 179,05% 3,90% 0,74
Oil/Gas Distribution 34 1,72 106,31% 7,04% 0,87
Utility (General) 20 1,13 106,35% 23,58% 0,62
What is this data? Beta, Unlevered beta and other risk measures Western Europe
Home Page: http://www.damodaran.com
Data website: http://www.stern.nyu.edu/~adamodar/New_Home_Page/data.html

Description of Electricity Dummy
Project (BG-RO new OHL line)
12
The dummy project: a new 400kV OHL between Romania
and Bulgaria
Capacity: the new OHL increases the NTC by 1000 MW in
both directions
Commissioning year: 2020
Investment costs:
BG: 10 m€ in 2018; 20 m€ in 2019, 20 m € in 2020
RO: 10 m€ in 2018; 20 m€ in 2019, 20 m € in 2020
Operation cost: from 0.7% up to 2.2% based on investment
value of the infrastructure

NPV on TSO level has a limited focus
compared to economic assessment
13
Components of Net Present Value (NPV) calculation:
NPV = CS + PS+ Rent + Value of losses +EENS – OPEX - Investment
cost
� CS: Consumer surplus change in the countries of the area of
analysis
� PS: Producer surplus change in the countries of the area of
analysis
� Rent: Rent change in the countries of the area of analysis
� Value of losses: Value of loss change in the countries of the area
of analysis
� EENS: Value of Expected Energy Not Supplied change
� OPEX: Operation and Maintenance cost change due to the project
� Investment cost: verified investment cost

Reports and sensitivity analysis
14
Typical indicators required by the financial partners (banks)
• IRR
• DSCR (Net operating income / Total debt service)
• EBITDA/net interest
• Net debt/EBITDA
Sensitivity analysis
Potential impacts of several key parameters on the financial
results of the TSO:
1) Overall financial cost environment
2) Cost overrun of investment
3) „Quality of regulation”

15
Teamwork with the demo model…
Recommended