Proceedings of the 5thManufacturing Engineering Society International Conference – Zaragoza – June 2013
Terrestrial Laser Scanner (TLS) Equipment Calibration
T. Fernández Pareja (1), A. García Pablos (2), J. de Vicente y Oliva (3)
(1)Departamento de Ingeniería Topográfica y Cartografía. Universidad Politécnica de Madrid, [email protected] (2)Departamento de Física Aplicada a la Ingeniería Industrial. Universidad Politécnica de Madrid, [email protected] (3)Laboratorio de Metrología y Metrotecnia. Universidad Politécnica de Madrid, [email protected]
ABSTRACT
The aim of this study is to develop the measurement procedures to evaluate the quality of the observations made using Terrestrial Laser Scanner (TLS) equipment. In addition, it seeks to estimate an uncertainty value allowing the users to know the reliability of the instrument measurements. The intention of this study is to describe a working reproducible methodology without the essential need for a very complex infrastructure and on the basis of ISO (International Organization for Standardization) criteria.
To achieve this, several TLS equipment models based on different measurement principles were used. Within this study the results provide a good approach to the repeatability and reproducibility of the measurements. The final objective is to determine how the different measurements of the same measurand match.
Keywords: Laser Terrestrial Scanner (TLS); uncertainty; repeatability; reproducibility
RESUMEN
El objeto principal de este estudio es desarrollar los procedimientos técnicos de medida para evaluar la calidad de las observaciones empleando equipos Terrestrial Laser Scanner (TLS). Además se pretende estimar un valor de incertidumbre que permita a los usuarios conocer la fiabilidad de las medidas ejecutadas con el instrumento. Se persigue describir una metodología de trabajo reproducible, sin que sea imprescindible disponer de una infraestructura compleja, en base a la filosofía de las normas ISO (International Organization for Standardization).
Para ello se cuenta con equipos TLS basados en distintos principios de medida. En el estudio que se presenta, se estiman valores que dan una idea de la repetibilidad y reproducibilidad de las medidas, con el fin de determinar el grado de concordancia de las mediciones de un mismo mensurando.
Palabras clave: Láser escáner terrestre (TLS); incertidumbre; repetibilidad; reproducibilidad
1. Introduction
The studies carried out so far for the quality assurance of measurements performed by geodetic instruments have been aimed primarily to ascertain angle and distance measurements. However, in recent years the use of TLS (Terrestrial Laser Scanner) equipment in the field of Geomatics has been accepted, especially in industrial applications for data capture, without establishing a methodology that would allow obtaining the necessary traceability through an appropriate calibration against reference standards, correction and its uncertainty.
TLS equipment arises from the need to optimise the spatial data capture methods. This type of equipment has some advantages versus Total Stations and GNSS (Global Navigation Satellite Systems), since they allow massive data capture in a continuous mode. In addition, it is possible to generate surface models without the need of a post‐processing, as in the case of photogrammetric techniques.
Proceedings of the 5th Manufacturing Engineering Society International Conference – Zaragoza – June 2013
2
Laser sweepers have a large number of applications in different fields, such as shipbuilding and aerospace industry, automotion, reverse engineering, offshore platforms, etc., most wanted being those where it is necessary to represent physical reality in order to preserve a space in a specific situation. In addition, different studies are being carried out in the area of auscultation of large structures and industrial plants. The existence of these applications create the need for the reliable knowledge of the quality of the observations obtained with TLS equipment models as well as the definition of a specific norm allowing users to determine the state of one particular equipment model.
With this research study we intend to contribute to the design of a calibration procedure that would allow assessing the quality of the observations carried out with TLS equipment. To that effect, on the one hand the factors acting on the results of measurements are analysed in order to estimate an uncertainty value associated to every point captured with a particular model of TLS equipment, with its 3D coordinates; on the other hand we intend to estimate an uncertainty value associated to a surface model. By reproducing different measurement conditions, the previously established methodology is applied to determine the values that would allow knowing the repeatability and reproducibility of the measurements made, all of this following the guidelines and recommendations contained in the Guide to the Expression of Uncertainty in Measurement [1]. In the present study TLS instruments from different manufacturers based on different measurement principles were used.
Data collection was carefully planned in order to find an optimal distribution of targets, reproducing specific measurement conditions without special infrastructure and following an adequate methodology to control as far as possible the parameters that affect the measurement. Observations and measurements have both been performed under field and laboratory conditions using 60 mm diameter spheres as scanned targets [2].
Once the mathematical model being defined, a detailed analysis of the input variables was performed. The combined standard uncertainty was estimated by applying the law of propagation of uncertainty and using the propagation of distributions with the Monte Carlo method [3]. The degree of equivalence between measurements of the same measurand through surface models was studied and measurement repeatability and reproducibility estimated and analysed.
2. TLS Equipment: Fundamentals
TLS equipment is a powerful real‐time measuring geomatic tool providing huge advantages in different project types, both in industrial applications, deformation control, civil engineering and in cultural heritage documentation. Originally, laser scanning was developed for application in the industry, being specially efficient especially in those complex and hazardous industrial environments where there are limitations to perform direct measurement. With laser scanning has been possible to achieve three‐dimensional very high resolution capture of any item and, consequently, to decrease the risk of having to perform additional measurements in unsafe or harmful places.
This real‐time measurement system provides abundant spatial information, the subsequent treatment of which allows geo‐referencing of the captured point clouds, its representation in 3D digital format, digital elevation models, point cloud videos, orthoimages, etc.
In the process of real‐time data capture with TLS equipment, we start by setting a cut‐off point for the coverage of the object as well as the sweeping interval. The instrument, automatically and engine‐assisted, aligns the laser beam and registers the parameters for every point of the object within the fixed limits. The different equipment models stand as “black boxes”, hence in order to make sure that the results are satisfactory, the uncertainty sources coming up during the measurement process must be detected, the contribution of each one of them should be quantified and the appropriate calibration and adjustment processes should be developed [4].
In short, we avail ourselves of a technology that allows the fast real‐time data capture, its appropriate treatment and the acquisition of essential geometric information in a large number of applications.
As regards the systems of quality management, data acquisition through TLS techniques does not differ from the conventional geomatic methods in which a model of quality management is applied to ensure that the required accuracy specifications have been met satisfactorily; those specifications can be quantified if tangible patterns have been clearly defined [5].
Proceedings of the 5th Manufacturing Engineering Society International Conference – Zaragoza – June 2013
3
The first phase of the measurement process consists of scanning. The experience shows that most errors are made during this phase; even after being corrected, they could lead to the rejection of the results. The second phase is the treatment of the data. Data retrieval includes the transfer of captured data and its verification, the realisation of a backup copy and the arrangement of data in a database.
The scanned point cloud is referred to the internal Cartesian system of the browser defined by the origin coinciding with the optical centre of the instrument and by three axes forming a clockwise trihedron (main axis, collimation axis and horizontal axis of rotation).
The final product may be obtained in a local reference cartographic system although in certain geomatic projects it is necessary to get it in a specific geodetic frame; this will require knowledge of the 3D position of the points from which the sweeping will take place in that reference system.
After the explorations have been carried out and the point cloud has been geo‐referenced, it will be necessary to filter the raw data in order to eliminate the noise and the irrelevant information.
3. Planning of observation and data collection
In applications where massive data acquisition is carried out with TLS equipment, some quite specific aspects may be associated not directly having a bearing on the process of data capture although they will indeed influence measurement results. In order to obtain the best outcome and reach the best precision possible, it is necessary to pinpoint the eventual causes of error and avoid them; to this end it is essential for the equipment utilised to be in perfect use conditions ensuring through verification and/or calibration that it is appropriate and fully functional.
In this study the following TLS equipment models of different manufacturers have been employed based on different measurement principles:
- Trimble GX3D Scanner, based on the principle of measurement by pulses or flight time.
- Leica HDS 6200, based on the principle of measurement of phase difference.
- Leica Scan Station C10, based on the principle of measurement by pulses or flight time.
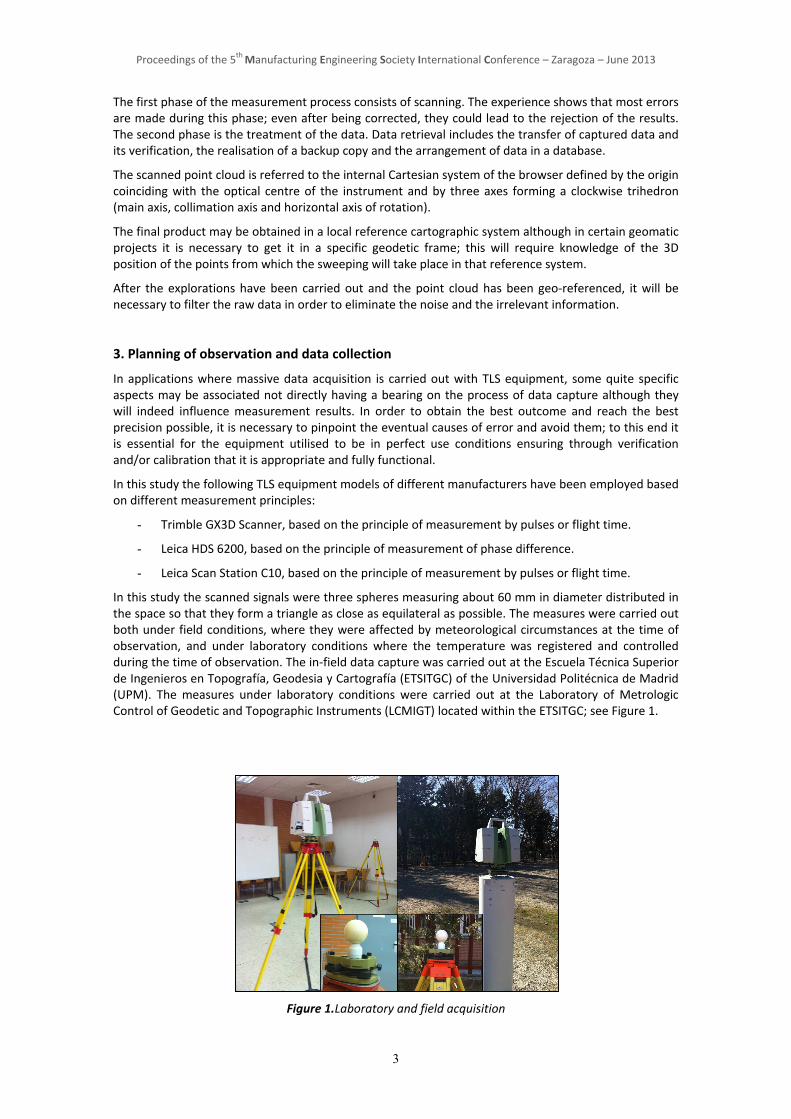
In this study the scanned signals were three spheres measuring about 60 mm in diameter distributed in the space so that they form a triangle as close as equilateral as possible. The measures were carried out both under field conditions, where they were affected by meteorological circumstances at the time of observation, and under laboratory conditions where the temperature was registered and controlled during the time of observation. The in‐field data capture was carried out at the Escuela Técnica Superior de Ingenieros en Topografía, Geodesia y Cartografía (ETSITGC) of the Universidad Politécnica de Madrid (UPM). The measures under laboratory conditions were carried out at the Laboratory of Metrologic Control of Geodetic and Topographic Instruments (LCMIGT) located within the ETSITGC; see Figure 1.
Figure 1.Laboratory and field acquisition
Proceedings of the 5th Manufacturing Engineering Society International Conference – Zaragoza – June 2013
4
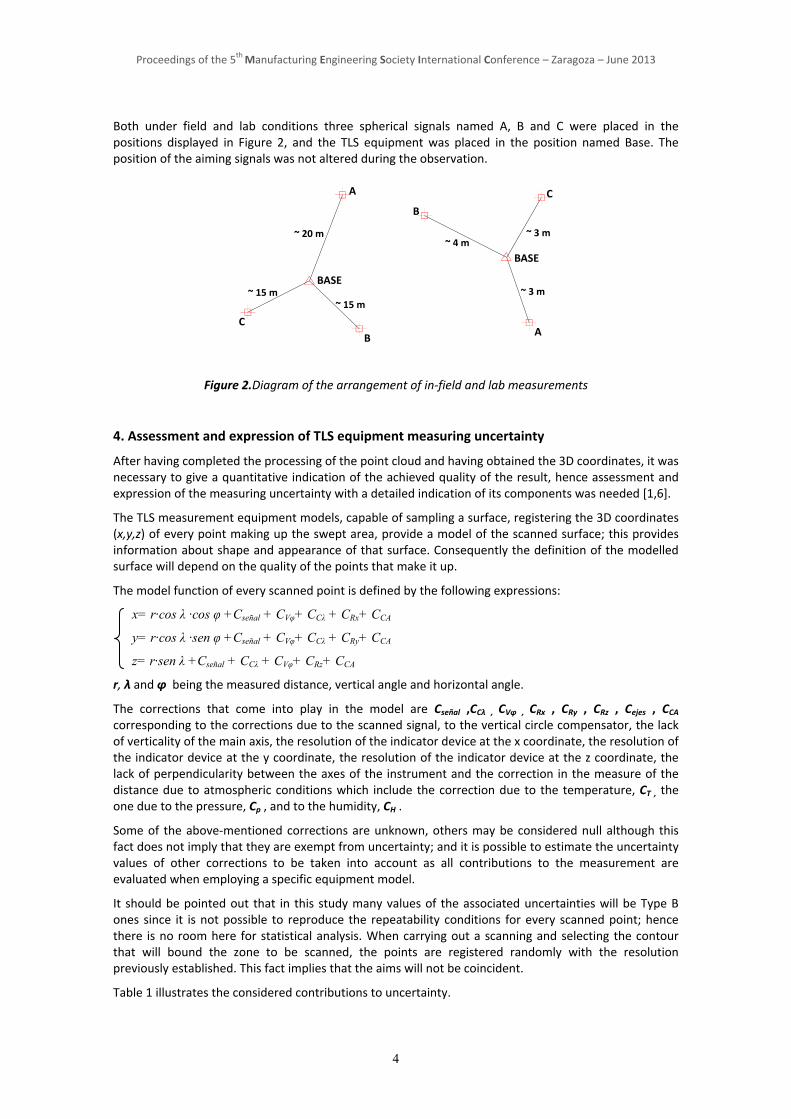
Both under field and lab conditions three spherical signals named A, B and C were placed in the positions displayed in Figure 2, and the TLS equipment was placed in the position named Base. The position of the aiming signals was not altered during the observation.
Figure 2.Diagram of the arrangement of in‐field and lab measurements
4. Assessment and expression of TLS equipment measuring uncertainty
After having completed the processing of the point cloud and having obtained the 3D coordinates, it was necessary to give a quantitative indication of the achieved quality of the result, hence assessment and expression of the measuring uncertainty with a detailed indication of its components was needed [1,6].
The TLS measurement equipment models, capable of sampling a surface, registering the 3D coordinates (x,y,z) of every point making up the swept area, provide a model of the scanned surface; this provides information about shape and appearance of that surface. Consequently the definition of the modelled surface will depend on the quality of the points that make it up.
The model function of every scanned point is defined by the following expressions:
x= r·cos λ ·cos φ +Cseñal + CVφ+ CCλ + CRx+ CCA
y= r·cos λ ·sen φ +Cseñal + CVφ+ CCλ + CRy+ CCA
z= r·sen λ +Cseñal + CCλ + CVφ+ CRz+ CCA
r, λ and φ being the measured distance, vertical angle and horizontal angle.
The corrections that come into play in the model are Cseñal ,CCλ , CVφ , CRx , CRy , CRz , Cejes , CCA corresponding to the corrections due to the scanned signal, to the vertical circle compensator, the lack of verticality of the main axis, the resolution of the indicator device at the x coordinate, the resolution of the indicator device at the y coordinate, the resolution of the indicator device at the z coordinate, the lack of perpendicularity between the axes of the instrument and the correction in the measure of the distance due to atmospheric conditions which include the correction due to the temperature, CT , the one due to the pressure, Cp , and to the humidity, CH .
Some of the above‐mentioned corrections are unknown, others may be considered null although this fact does not imply that they are exempt from uncertainty; and it is possible to estimate the uncertainty values of other corrections to be taken into account as all contributions to the measurement are evaluated when employing a specific equipment model.
It should be pointed out that in this study many values of the associated uncertainties will be Type B ones since it is not possible to reproduce the repeatability conditions for every scanned point; hence there is no room here for statistical analysis. When carrying out a scanning and selecting the contour that will bound the zone to be scanned, the points are registered randomly with the resolution previously established. This fact implies that the aims will not be coincident.
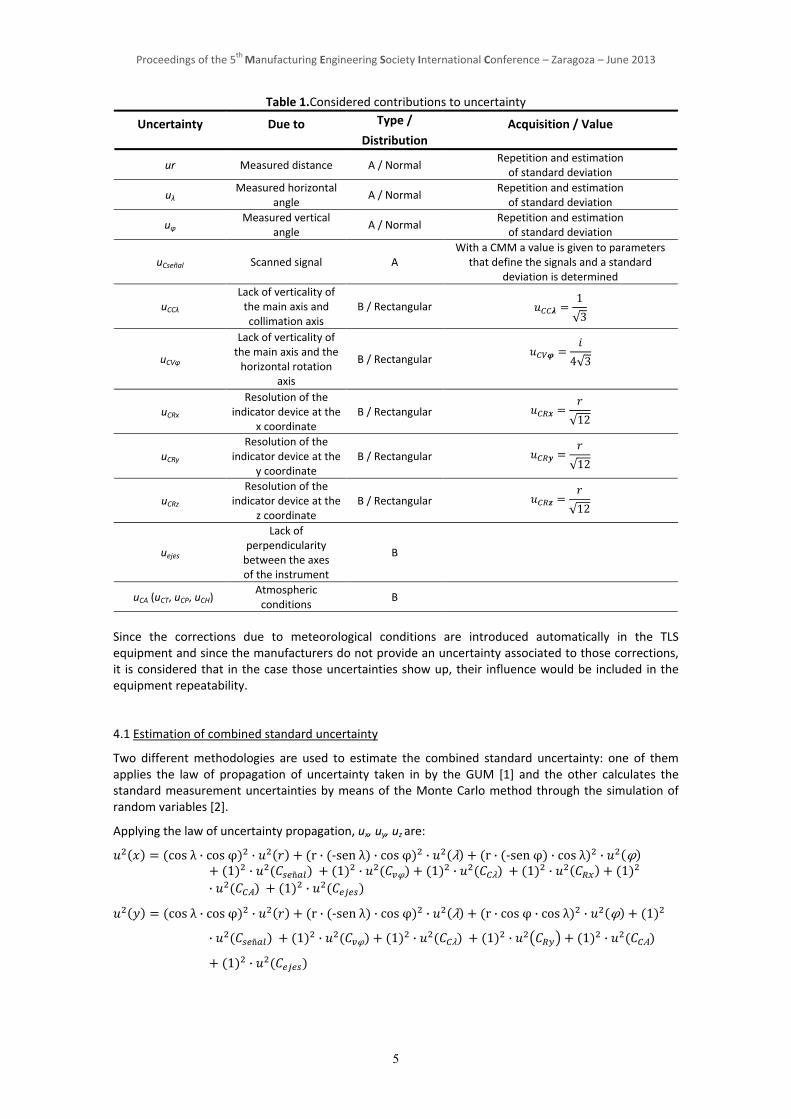
Table 1 illustrates the considered contributions to uncertainty.
C
~ 20 m
A
A
B
C
BASE
B
~ 15 m~ 15 m
~ 4 m~ 3 m
~ 3 mBASE
Proceedings of the 5th Manufacturing Engineering Society International Conference – Zaragoza – June 2013
5
Table 1.Considered contributions to uncertainty
Uncertainty Due to Type /
Distribution Acquisition / Value
ur Measured distance A / Normal Repetition and estimation of standard deviation
uλ Measured horizontal
angle A / Normal
Repetition and estimation of standard deviation
uφ Measured vertical
angle A / Normal
Repetition and estimation of standard deviation
uCseñal Scanned signal A With a CMM a value is given to parameters
that define the signals and a standard deviation is determined
uCCλ Lack of verticality of the main axis and collimation axis
B / Rectangular 1
√3
uCVφ
Lack of verticality of the main axis and the horizontal rotation
axis
B / Rectangular 4√3
uCRx Resolution of the
indicator device at the x coordinate
B / Rectangular √12
uCRy Resolution of the
indicator device at the y coordinate
B / Rectangular √12
uCRz Resolution of the
indicator device at the z coordinate
B / Rectangular √12
uejes
Lack of perpendicularity between the axes of the instrument
B
uCA (uCT, uCP, uCH) Atmospheric conditions
B
Since the corrections due to meteorological conditions are introduced automatically in the TLS equipment and since the manufacturers do not provide an uncertainty associated to those corrections, it is considered that in the case those uncertainties show up, their influence would be included in the equipment repeatability.
4.1 Estimation of combined standard uncertainty
Two different methodologies are used to estimate the combined standard uncertainty: one of them applies the law of propagation of uncertainty taken in by the GUM [1] and the other calculates the standard measurement uncertainties by means of the Monte Carlo method through the simulation of random variables [2].
Applying the law of uncertainty propagation, ux, uy, uz are:
cos λ · cos φ · r · ‐sen λ · cos φ · λ r · ‐sen φ · cos λ · φ1 · ñ 1 · φ 1 · λ 1 · 1
· A 1 ·
cos λ · cos φ · r · ‐sen λ · cos φ · λ r · cos φ · cos λ · φ 1
· ñ 1 · φ 1 · λ 1 · 1 · A
1 ·
Proceedings of the 5th Manufacturing Engineering Society International Conference – Zaragoza – June 2013
6
cos λ · cos φ · r · cos λ · λ 1 · ñ 1 · λ 1
· 1 · A 1 ·
There is no information about the contributions to the uncertainties u(CR), u(CCA), u(Cejes) in the technical specifications of the TLS equipment models considered in this study. These contributions are considered to be included into the experimental standard deviations sx, sy and sz of each scanned point; this would give an idea of the repeatability of the measurement.
The differences between the estimated standard uncertainties of the scanned points in each series for every spherical signal with the same instrument are in the order of micrometers.
For each explored series, n being the number of explored points, we have:
n
uu
n
ipuntos
puntosx
1
n
uu
n
ipuntos
puntosy
1
n
uu
n
ipuntos
puntosz
1
Since the number of series or scans carried out is five, we obtain:
5
5
1 i
puntosx
x
uu
5
5
1 i
puntosy
y
uu
5
5
1 i
puntosz
z
uu
The Monte Carlo method is a practical alternative to the GUM’s approach on uncertainty; its purpose is getting an approximate numerical representation of a function.
In our study the input variables have associated uncertainties of which the probability distribution is known in a rough way; a procedure is developed by using Matlab which carries out 106 iterations for every value of the associated uncertainties coming into play in the function; this provides approximately 95% of coverage interval for the output magnitude, such that the amplitude of the interval is correct with one or two significant decimal figures. It has been possible to verify that the results obtained with the Monte Carlo method are practically coincident with the results obtained by applying the law of propagation of uncertainty.
4.2 Estimation of the expanded uncertainty
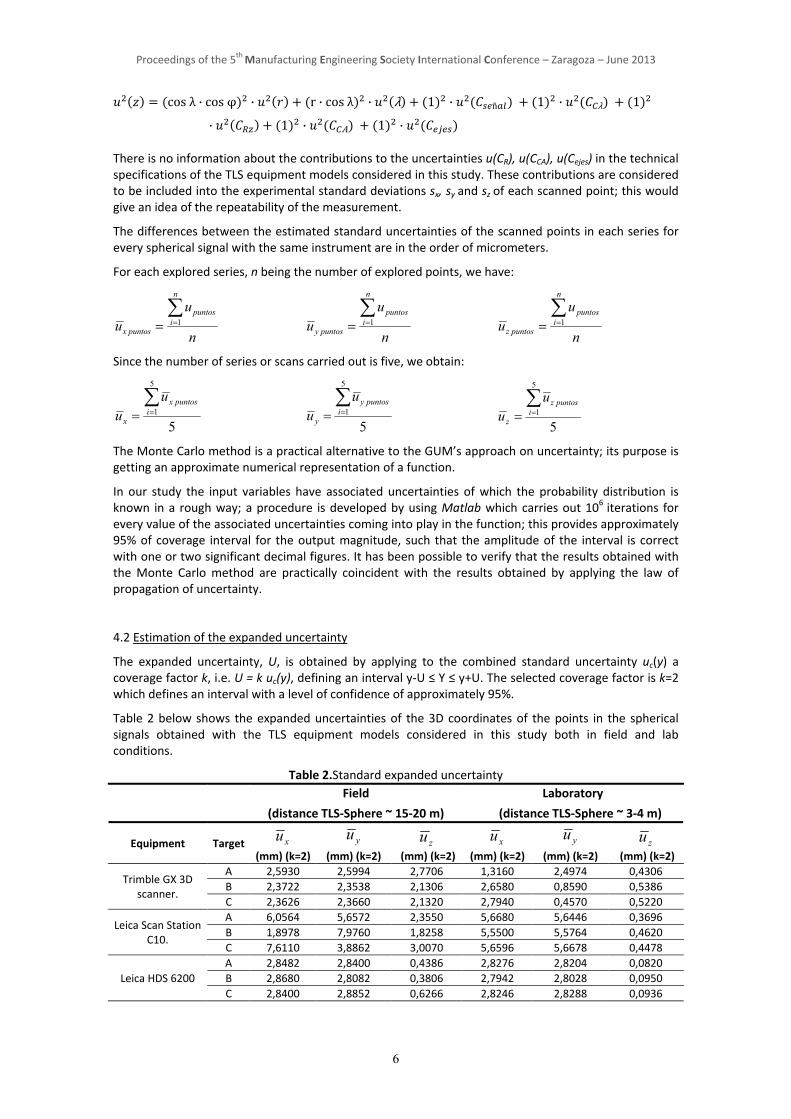
The expanded uncertainty, U, is obtained by applying to the combined standard uncertainty uc(y) a coverage factor k, i.e. U = k uc(y), defining an interval y‐U ≤ Y ≤ y+U. The selected coverage factor is k=2 which defines an interval with a level of confidence of approximately 95%.
Table 2 below shows the expanded uncertainties of the 3D coordinates of the points in the spherical signals obtained with the TLS equipment models considered in this study both in field and lab conditions.
Table 2.Standard expanded uncertainty
Field
(distance TLS‐Sphere ~ 15‐20 m)
Laboratory
(distance TLS‐Sphere ~ 3‐4 m)
Equipment Target xu
(mm) (k=2)
yu
(mm) (k=2) zu
(mm) (k=2)
xu
(mm) (k=2)
yu
(mm) (k=2) zu
(mm) (k=2)
Trimble GX 3D scanner.
A 2,5930 2,5994 2,7706 1,3160 2,4974 0,4306
B 2,3722 2,3538 2,1306 2,6580 0,8590 0,5386
C 2,3626 2,3660 2,1320 2,7940 0,4570 0,5220
Leica Scan Station C10.
A 6,0564 5,6572 2,3550 5,6680 5,6446 0,3696
B 1,8978 7,9760 1,8258 5,5500 5,5764 0,4620
C 7,6110 3,8862 3,0070 5,6596 5,6678 0,4478
Leica HDS 6200
A 2,8482 2,8400 0,4386 2,8276 2,8204 0,0820
B 2,8680 2,8082 0,3806 2,7942 2,8028 0,0950
C 2,8400 2,8852 0,6266 2,8246 2,8288 0,0936
Proceedings of the 5th Manufacturing Engineering Society International Conference – Zaragoza – June 2013
7
5. Degree of concordance between the measurements of a single measurand through surface models
In order to know the behaviour of the equipment types through the repeatability and reproducibility in the measure of a measurand, the corresponding surface models have been generated based on the point clouds created by the different TLS equipment models.
The results show that the repeatability values are submillimetric and the variation between the sphere explorations is minimal, except for the HDS 6200 model in field conditions which could be due to the type of equipment measurement, the lighting of the spherical signals, their position, etc. Regarding reproducibility, the analysis carried out allows detecting whether there are significant differences between the results when performing scans in different measurement conditions. The following points are taken into account in the analysis:
- Definition of the model: a hypothetical model of distribution of probability of the observations is determined. In this case the model includes the basic hypotheses of normalcy, homoscedasticity and independence.
- Estimation: the unknown parameters are estimated, in our case the diameter averages and variances of the normal distributions, always using the sample information.
- Diagnosis: the basic hypotheses defined in the model are compared and contrasted.
- Conclusions.
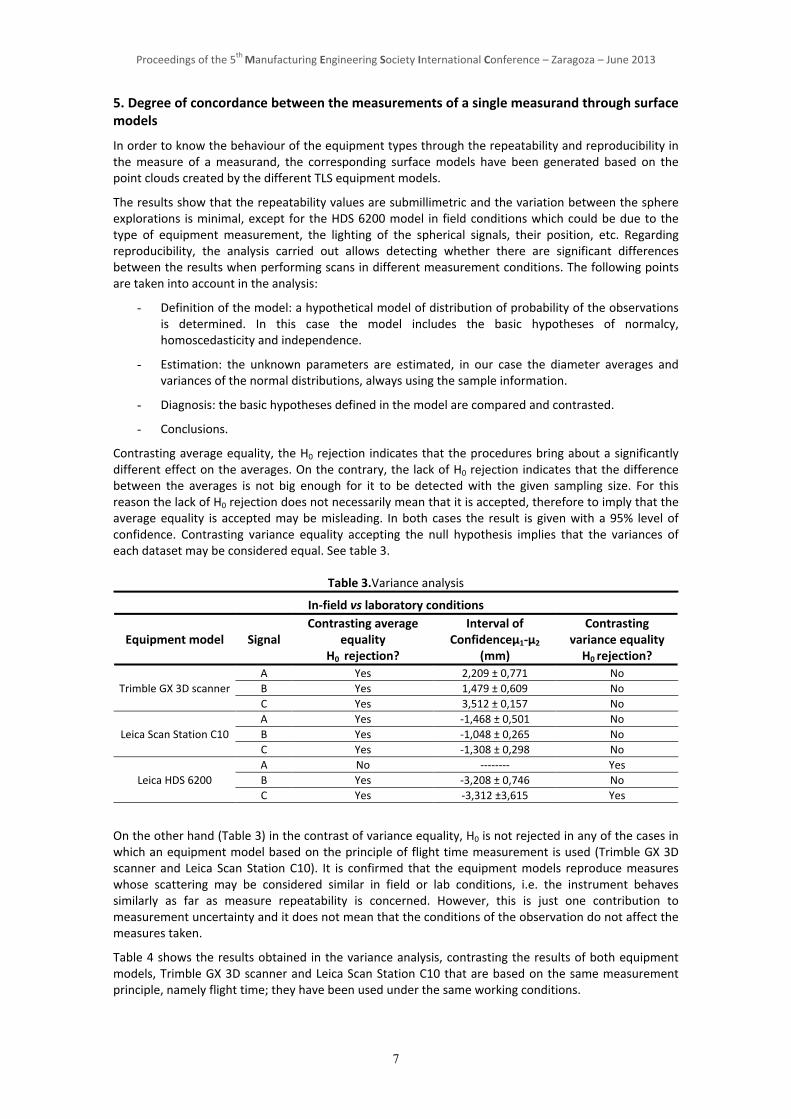
Contrasting average equality, the H0 rejection indicates that the procedures bring about a significantly different effect on the averages. On the contrary, the lack of H0 rejection indicates that the difference between the averages is not big enough for it to be detected with the given sampling size. For this reason the lack of H0 rejection does not necessarily mean that it is accepted, therefore to imply that the average equality is accepted may be misleading. In both cases the result is given with a 95% level of confidence. Contrasting variance equality accepting the null hypothesis implies that the variances of each dataset may be considered equal. See table 3.
Table 3.Variance analysis
In‐field vs laboratory conditions
Equipment model Signal Contrasting average
equality H0 rejection?
Interval of Confidenceμ1‐μ2
(mm)
Contrasting variance equality H0 rejection?
Trimble GX 3D scanner
A Yes 2,209 ± 0,771 No
B Yes 1,479 ± 0,609 No
C Yes 3,512 ± 0,157 No
Leica Scan Station C10
A Yes ‐1,468 ± 0,501 No
B Yes ‐1,048 ± 0,265 No
C Yes ‐1,308 ± 0,298 No
Leica HDS 6200
A No ‐‐‐‐‐‐‐‐ Yes
B Yes ‐3,208 ± 0,746 No
C Yes ‐3,312 ±3,615 Yes
On the other hand (Table 3) in the contrast of variance equality, H0 is not rejected in any of the cases in which an equipment model based on the principle of flight time measurement is used (Trimble GX 3D scanner and Leica Scan Station C10). It is confirmed that the equipment models reproduce measures whose scattering may be considered similar in field or lab conditions, i.e. the instrument behaves similarly as far as measure repeatability is concerned. However, this is just one contribution to measurement uncertainty and it does not mean that the conditions of the observation do not affect the measures taken.
Table 4 shows the results obtained in the variance analysis, contrasting the results of both equipment models, Trimble GX 3D scanner and Leica Scan Station C10 that are based on the same measurement principle, namely flight time; they have been used under the same working conditions.
Proceedings of the 5th Manufacturing Engineering Society International Conference – Zaragoza – June 2013
8
Table 4.Variance analysis with the Trimble GX 3D scanner and Leica Scan Station C10 equipment models
Trimble GX 3D scanner vs Leica Scan Station C10
Conditions of observation
Signal Contrasting average
equality H0 rejection?
Interval of Confidenceμ1‐μ2
(mm)
Contrasting variance equality H0 rejection?
Field
A Yes 1,021± 0,967 mm No
B Yes 2,850 ± 0,442 mm No
C Yes 4,668 ± 0,237 mm No
Laboratory
A Yes 0,330 ± 0,313 mm Yes
B Yes 0,323 ± 0,496 mm No
C Yes ‐0,152 ± 2,69 mm No
6. Conclusions
On the basis of the analysis of the numerical results obtained with real data, the following conclusions may be drawn:
- Lack of standardization was detected in the indication of the uncertainties provided by the manufacturers; this hindered interpretation of the technical specifications of the equipment models since clearly defined values were not available.
- Since the same procedure was developed and applied with the three different TLS equipment models, it is possible to make a relative comparison between the results obtained, hence to facilitate the choice of equipment best fitting the needs of a specific project.
- The variance analysis is essential since it reveals interesting conclusions regarding TLS equipment behaviour.
- Concerning reproducibility analysis, it is advisable to work in different conditions of observation and/or to employ equipment models of different manufacturers based on the same measurement principle.
- The geometric model of the selected signals has allowed treatment of the data with great reliability. A research study of measure reproducibility as a function of texture and colour of the material object of exploration is a remaining issue.
7. References
[1] BIPM, IEC, IFCC, ILAC, ISO, IUPAC, IUPAP and OIML. Evaluation of Measurement Data—Guide to the Expression of Uncertainty in Measurement, JCGM 100:2008 (GUM 1995 with minor corrections).
[2] R. Staiger. Geometrical Quality of Laser Scans. FIG Working Week and GSDI‐8. Cairo, Egypt, 2005.
[3] Joint Committee for Guides in Metrology. Evaluation of measurement data. Supplement 1 to the “Guide to the expression of uncertainty in measurement”. Propagation of distributions using a Monte Carlo method, JCGM 101:2008.
[4] I. Greenway. Standards‐their vital role. XXIII FIG International Congress. Munich, Germany, 2006.
[5] R. Staiger. Push the Button – or Does the Art of Measurement Still Exist? International Federation of Surveyors. Article of the Month (2009).
[6] J.M. Rüeger, R. Gottwald. Field Tests and Checks for Electronic Tacheometers. Trans Tasman Surveyor No. 4 (2001), pp. 18–26.
Recommended


![Monitoring Riverbank Erosion in Mountain Catchments Using ... · The use of terrestrial laser scanning (TLS) [22,23] has become a well-established practice for detecting riverbank](https://img.pdfslide.net/doc/110x75/5f5a82bbd93f9132702ed4b0/monitoring-riverbank-erosion-in-mountain-catchments-using-the-use-of-terrestrial.jpg)