10/16/14
1
Copyright © 2007 by The McGraw-Hill Companies, Inc. All rights reserved. 3-0
INTERNATIONAL FINANCIAL
MANAGEMENT
EUN / RESNICK
Seventh Edition
Copyright © 2014 by The McGraw-Hill Companies, Inc. All rights reserved. Copyright © 2007 by The McGraw-Hill Companies, Inc. All rights reserved. 3-1
INTERNATIONAL FINANCIAL
MANAGEMENT
EUN / RESNICK
Fourth Edition
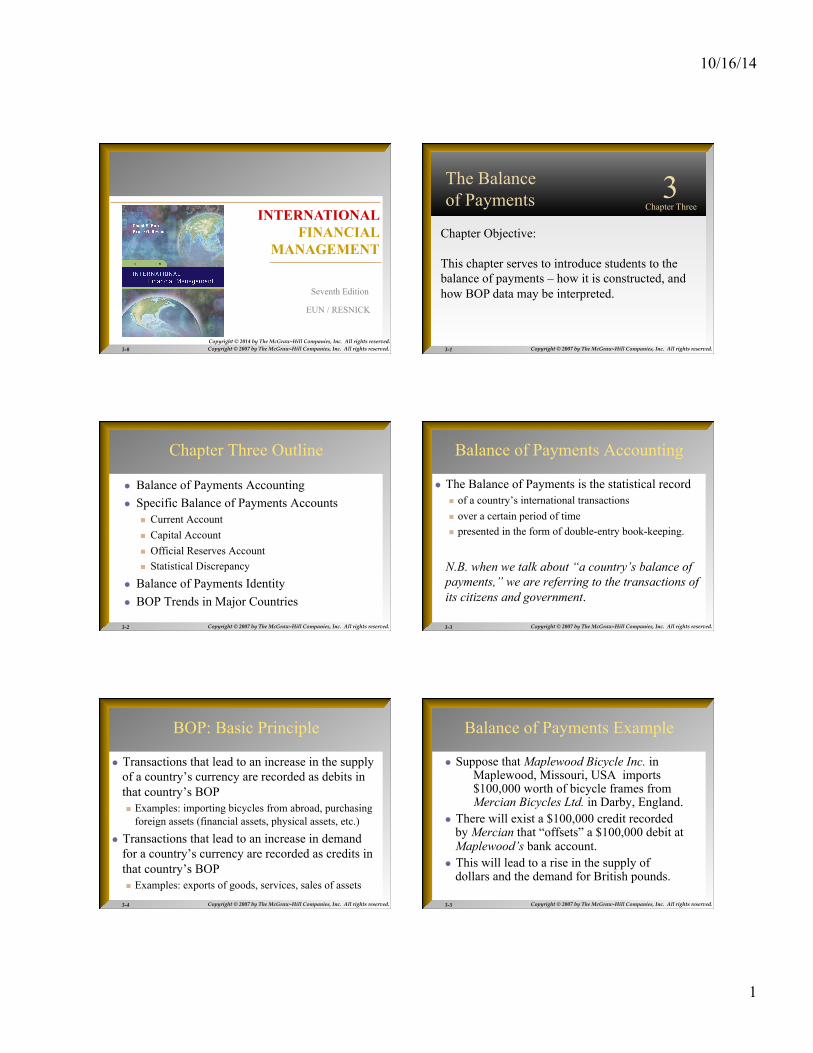
Chapter Objective: This chapter serves to introduce students to the balance of payments – how it is constructed, and how BOP data may be interpreted.
3 Chapter Three
The Balance of Payments
Copyright © 2007 by The McGraw-Hill Companies, Inc. All rights reserved. 3-2
Chapter Three Outline
l Balance of Payments Accounting l Specific Balance of Payments Accounts
n Current Account n Capital Account n Official Reserves Account n Statistical Discrepancy
l Balance of Payments Identity l BOP Trends in Major Countries
Copyright © 2007 by The McGraw-Hill Companies, Inc. All rights reserved. 3-3
Balance of Payments Accounting
l The Balance of Payments is the statistical record n of a country’s international transactions n over a certain period of time n presented in the form of double-entry book-keeping.
N.B. when we talk about “a country’s balance of payments,” we are referring to the transactions of its citizens and government.
Copyright © 2007 by The McGraw-Hill Companies, Inc. All rights reserved. 3-4
BOP: Basic Principle
l Transactions that lead to an increase in the supply of a country’s currency are recorded as debits in that country’s BOP n Examples: importing bicycles from abroad, purchasing
foreign assets (financial assets, physical assets, etc.)
l Transactions that lead to an increase in demand for a country’s currency are recorded as credits in that country’s BOP n Examples: exports of goods, services, sales of assets
Copyright © 2007 by The McGraw-Hill Companies, Inc. All rights reserved. 3-5
Balance of Payments Example
l Suppose that Maplewood Bicycle Inc. in Maplewood, Missouri, USA imports $100,000 worth of bicycle frames from Mercian Bicycles Ltd. in Darby, England.
l There will exist a $100,000 credit recorded by Mercian that “offsets” a $100,000 debit at Maplewood’s bank account.
l This will lead to a rise in the supply of dollars and the demand for British pounds.
10/16/14
2
Copyright © 2007 by The McGraw-Hill Companies, Inc. All rights reserved. 3-6
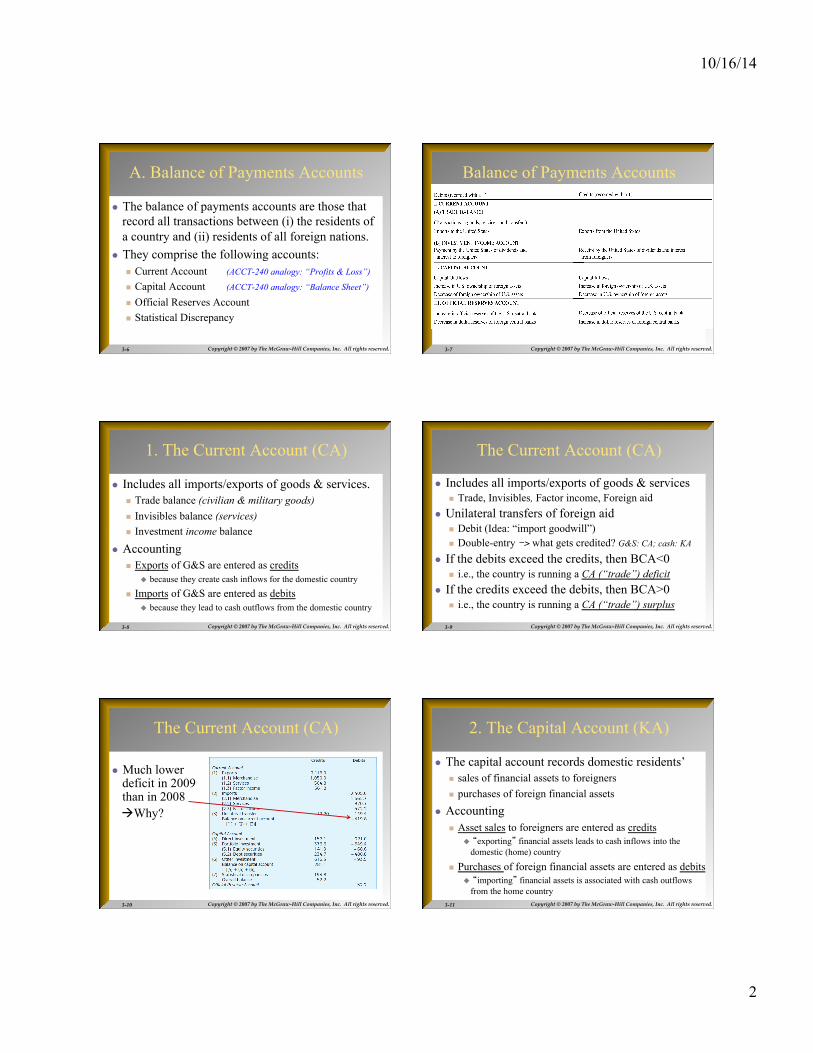
l The balance of payments accounts are those that record all transactions between (i) the residents of a country and (ii) residents of all foreign nations.
l They comprise the following accounts: n Current Account (ACCT-240 analogy: “Profits & Loss”) n Capital Account (ACCT-240 analogy: “Balance Sheet”) n Official Reserves Account n Statistical Discrepancy
A. Balance of Payments Accounts
Copyright © 2007 by The McGraw-Hill Companies, Inc. All rights reserved. 3-7
Balance of Payments Accounts
Copyright © 2007 by The McGraw-Hill Companies, Inc. All rights reserved. 3-8
1. The Current Account (CA)
l Includes all imports/exports of goods & services. n Trade balance (civilian & military goods) n Invisibles balance (services) n Investment income balance
l Accounting n Exports of G&S are entered as credits
u because they create cash inflows for the domestic country
n Imports of G&S are entered as debits u because they lead to cash outflows from the domestic country
Copyright © 2007 by The McGraw-Hill Companies, Inc. All rights reserved. 3-9
The Current Account (CA)
l Includes all imports/exports of goods & services n Trade, Invisibles, Factor income, Foreign aid
l Unilateral transfers of foreign aid n Debit (Idea: “import goodwill”) n Double-entry -> what gets credited? G&S: CA; cash: KA
l If the debits exceed the credits, then BCA<0 n i.e., the country is running a CA (“trade”) deficit
l If the credits exceed the debits, then BCA>0 n i.e., the country is running a CA (“trade”) surplus
Copyright © 2007 by The McGraw-Hill Companies, Inc. All rights reserved. 3-10
The Current Account (CA)
l Much lower deficit in 2009 than in 2008
àWhy?
Copyright © 2007 by The McGraw-Hill Companies, Inc. All rights reserved. 3-11
2. The Capital Account (KA)
l The capital account records domestic residents’ n sales of financial assets to foreigners n purchases of foreign financial assets
l Accounting n Asset sales to foreigners are entered as credits
u “exporting” financial assets leads to cash inflows into the domestic (home) country
n Purchases of foreign financial assets are entered as debits u “importing” financial assets is associated with cash outflows
from the home country
10/16/14
3
Copyright © 2007 by The McGraw-Hill Companies, Inc. All rights reserved. 3-12
The Capital Account (KA)
l The KA balance measures the gap between residents’ assets sales to foreigners and the same residents’ purchases of foreign assets.
l The U.S. enjoys a huge KA surplus (2007: $790bn; 2011: $410.1bn)—absent official U.S. borrowing abroad, this surplus “finances” the U.S. trade deficit
l Details for 2011 (from Economic Report to the President) n Increase in foreign-owned assets in USA: $1,001bn n Increase in US privately-owned assets abroad: $ 484bn n See handout: 05b_US_BoP erp_B103&B107 2013
Copyright © 2007 by The McGraw-Hill Companies, Inc. All rights reserved. 3-13
The Capital Account (KA)
l The capital account is composed of
n Foreign Direct Investment u FDI; control 10% or more;
n Portfolio investments u stocks & bonds without control;
n Other investments u trade credits, bank deposits,…
Copyright © 2007 by The McGraw-Hill Companies, Inc. All rights reserved. 3-14
The Capital Account (KA)
l Much lower net flows in 2009 than in 2008
l Why?
Copyright © 2007 by The McGraw-Hill Companies, Inc. All rights reserved. 3-15
Flows vs. Stocks: KA vs. NIIP
l Capital account (KA) n Is a flow measure
u measures capital flows between a country and the rest of the world (ROW)
l Net international investment position (NIIP) n Is a stock measure
u measures whether a country is a net creditor (e.g., China) or debtor (e.g., US) with respect to the ROW.
Copyright © 2007 by The McGraw-Hill Companies, Inc. All rights reserved. 3-16
Flows vs. Stocks: KA vs. NIIP
Copyright © 2007 by The McGraw-Hill Companies, Inc. All rights reserved. 3-17
3. Statistical Discrepancy
l There are going to be some omissions and mis-recorded transactions—so we use a “plug” figure to get things to balance
l Exhibit 3.1 (three slides down) shows discrepancy of +$200bn in 2008, later adjusted to -$59bn n Discrepancy sometimes even larger
u biggest « initial » discrepancies observed in ’91, ’98 & 2008-10 n why? sign? (2008: initial=+$200bn; 2010: initial=+$216.7bn)
u initial discrepancies are often revised in later years n 2000: initial estimate = plus $0.73bn, revised = minus $74bn
10/16/14
4
Copyright © 2007 by The McGraw-Hill Companies, Inc. All rights reserved. 3-18
Statistical Discrepancy
Credits
Debits Current Account
1
Exports
$2,843.7
2
Imports
($3,182.8)
3
Unilateral Transfers
$19.5
($154.0)
Balance on Current Account
($473.6) Capital Account
4
Direct Investment
$227.9
($406.2) 5
Portfolio Investment
$166.9
($14.7) 6
Other Investments
$395.8
$40.4
Balance on Capital Account
$410.1 7
Statistical Discrepancies
Overall Balance
$15.9
Official Reserve Account
$79.4
($15.9)
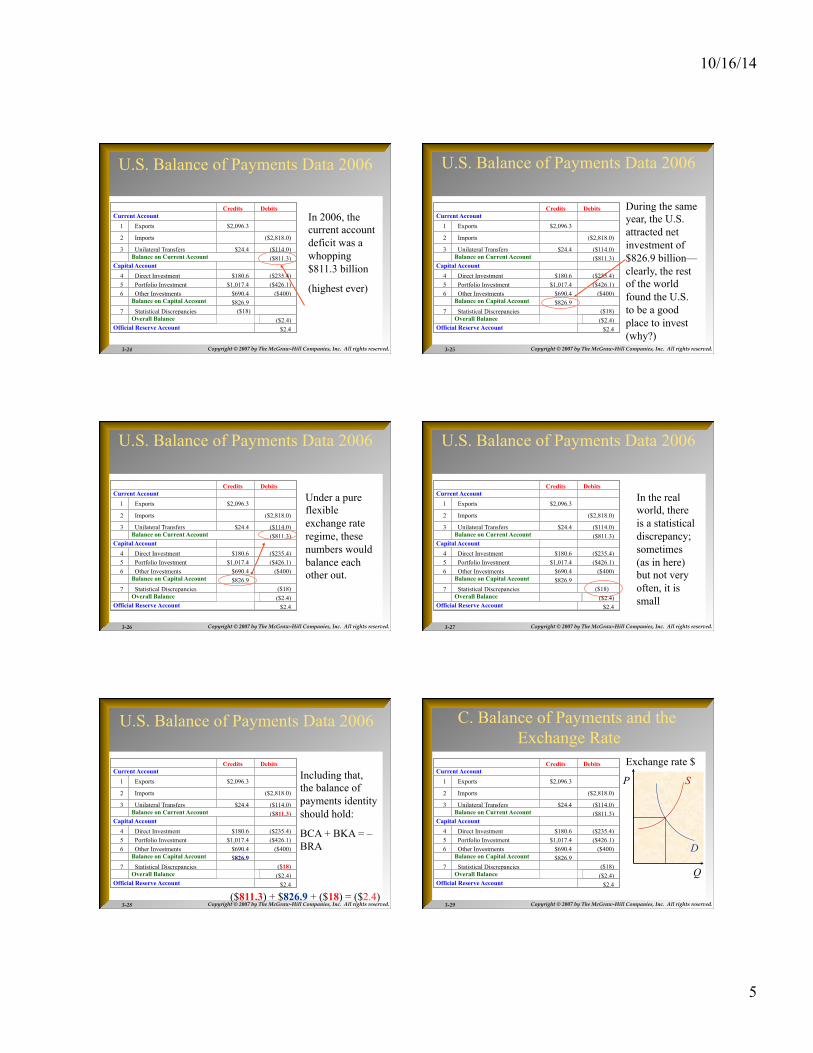
• There are going to be some omissions and misrecorded transactions—so we use a “plug” figure to get things to balance.
• Exhibit 3.1 shows a
discrepancy of $79.40 billion in 2011.
3-18
Copyright © 2007 by The McGraw-Hill Companies, Inc. All rights reserved. 3-19
4. The Official Reserves Account
l Official-reserves assets include n Gold
u used to make up most of a country’s reserves l as recently as the early 1980’s, still half of all reserves
u now less than 1% of the total @ $35/1oz (9.8% @ mkt prices) l 12-08: 83% held by OECD countries (≡19.6% @ market value)
n Foreign currencies ($11.4trn held as of Q3-2013) u at end of 2013, made up 99% of non-gold official reserves u USD accounts for 61.4% of FX reserves; EUR: 24.1% (Q3 2013)
n SDRs + Reserve Positions in the IMF l OECD countries hold over a third of world reserves
Copyright © 2007 by The McGraw-Hill Companies, Inc. All rights reserved. 3-20
ORA’s Flip Side
l Foreign Holdings of U.S. Treasury Securities (Dec. 2013, USD billion)
Copyright © 2007 by The McGraw-Hill Companies, Inc. All rights reserved. 3-21
B. The Balance of Payments Identity
BCA + BKA + BRA = 0 where BCA = balance on current account BKA = balance on capital account BRA = balance on the reserves account
Under a pure flexible exchange rate regime, BCA + BKA = 0
Copyright © 2007 by The McGraw-Hill Companies, Inc. All rights reserved. 3-22
U.S. Balance of Payments Data 2011
Credits
Debits Current Account
1
Exports
$2,843.7
2
Imports
($3,182.8)
3
Unilateral Transfers
$19.5
($154.0)
Balance on Current Account
($473.6) Capital Account
4
Direct Investment
$227.9
($406.2) 5
Portfolio Investment
$166.9
($14.7) 6
Other Investments
$395.8
($40.4)
Balance on Capital Account
$410.1 7
Statistical Discrepancies
Overall Balance
$15.9
Official Reserve Account
$79.4
($15.9) Copyright © 2014 by the McGraw-Hill Companies, Inc.
All rights reserved.
3-22 Copyright © 2007 by The McGraw-Hill Companies, Inc. All rights reserved. 3-23
In 2011, the U.S. imported more than it exported, thus running a current account deficit of $473.6 billion.
U.S. Balance of Payments Data 2011
Credits
Debits Current Account
1
Exports
$2,843.7
2
Imports
($3,182.8)
3
Unilateral Transfers
$19.5
($154.0)
Balance on Current Account
($473.6) Capital Account
4
Direct Investment
$227.9
($406.2) 5
Portfolio Investment
$166.9
($14.7) 6
Other Investments
$395.8
($40.4)
Balance on Capital Account
$410.1 7
Statistical Discrepancies
Overall Balance
$15.9
Official Reserve Account
$79.4
($15.9) Copyright © 2014 by the McGraw-Hill Companies, Inc.
All rights reserved.
3-23
10/16/14
5
Copyright © 2007 by The McGraw-Hill Companies, Inc. All rights reserved. 3-24
U.S. Balance of Payments Data 2006
In 2006, the current account deficit was a whopping$811.3 billion
(highest ever)
Credits
Debits Current Account
1
Exports
$2,096.3
2
Imports
($2,818.0)
3
Unilateral Transfers
$24.4
($114.0)
Balance on Current Account
($811.3) Capital Account
4
Direct Investment
$180.6
($235.4) 5
Portfolio Investment
$1,017.4
($426.1) 6
Other Investments
$690.4
($400)
Balance on Capital Account
$826.9 7
Statistical Discrepancies
Overall Balance
($2.4)
Official Reserve Account
$2.4
($18)
Copyright © 2007 by The McGraw-Hill Companies, Inc. All rights reserved. 3-25
U.S. Balance of Payments Data 2006
During the same year, the U.S. attracted net investment of $826.9 billion—clearly, the rest of the world found the U.S. to be a good place to invest (why?)
Credits
Debits Current Account
1
Exports
$2,096.3
2
Imports
($2,818.0)
3
Unilateral Transfers
$24.4
($114.0)
Balance on Current Account
($811.3) Capital Account
4
Direct Investment
$180.6
($235.4) 5
Portfolio Investment
$1,017.4
($426.1) 6
Other Investments
$690.4
($400)
Balance on Capital Account
$826.9 7
Statistical Discrepancies
Overall Balance
($2.4)
Official Reserve Account
$2.4
($18)
Copyright © 2007 by The McGraw-Hill Companies, Inc. All rights reserved. 3-26
U.S. Balance of Payments Data 2006
Under a pure flexible exchange rate regime, these numbers would balance each other out.
Credits
Debits Current Account
1
Exports
$2,096.3
2
Imports
($2,818.0)
3
Unilateral Transfers
$24.4
($114.0)
Balance on Current Account
($811.3) Capital Account
4
Direct Investment
$180.6
($235.4) 5
Portfolio Investment
$1,017.4
($426.1) 6
Other Investments
$690.4
($400)
Balance on Capital Account
$826.9 7
Statistical Discrepancies
Overall Balance
($2.4)
Official Reserve Account
$2.4
($18)
Copyright © 2007 by The McGraw-Hill Companies, Inc. All rights reserved. 3-27
U.S. Balance of Payments Data 2006
In the real world, there is a statistical discrepancy; sometimes (as in here) but not very often, it is small
Credits
Debits Current Account
1
Exports
$2,096.3
2
Imports
($2,818.0)
3
Unilateral Transfers
$24.4
($114.0)
Balance on Current Account
($811.3) Capital Account
4
Direct Investment
$180.6
($235.4) 5
Portfolio Investment
$1,017.4
($426.1) 6
Other Investments
$690.4
($400)
Balance on Capital Account
$826.9 7
Statistical Discrepancies
Overall Balance
($2.4)
Official Reserve Account
$2.4
($18)
Copyright © 2007 by The McGraw-Hill Companies, Inc. All rights reserved. 3-28
U.S. Balance of Payments Data 2006
Including that, the balance of payments identity should hold:
BCA + BKA = – BRA
($811.3) + $826.9 + ($18) = ($2.4)
Credits
Debits Current Account
1
Exports
$2,096.3
2
Imports
($2,818.0)
3
Unilateral Transfers
$24.4
($114.0)
Balance on Current Account
($811.3) Capital Account
4
Direct Investment
$180.6
($235.4) 5
Portfolio Investment
$1,017.4
($426.1) 6
Other Investments
$690.4
($400)
Balance on Capital Account
$826.9 7
Statistical Discrepancies
Overall Balance
($2.4)
Official Reserve Account
$2.4
($18)
Copyright © 2007 by The McGraw-Hill Companies, Inc. All rights reserved. 3-29
C. Balance of Payments and the Exchange Rate
Q
P
Exchange rate $
S
D
Credits
Debits Current Account
1
Exports
$2,096.3
2
Imports
($2,818.0)
3
Unilateral Transfers
$24.4
($114.0)
Balance on Current Account
($811.3) Capital Account
4
Direct Investment
$180.6
($235.4) 5
Portfolio Investment
$1,017.4
($426.1) 6
Other Investments
$690.4
($400)
Balance on Capital Account
$826.9 7
Statistical Discrepancies
Overall Balance
($2.4)
Official Reserve Account
$2.4
($18)

10/16/14
6
Copyright © 2007 by The McGraw-Hill Companies, Inc. All rights reserved. 3-30
Balance of Payments and the Exchange Rate
Q
P
As U.S. citizens import, they are supply dollars to the FOREX market.
Exchange rate $
S
D
Credits
Debits Current Account
1
Exports
$2,096.3
2
Imports
($2,818.0)
3
Unilateral Transfers
$24.4
($114.0)
Balance on Current Account
($811.3) Capital Account
4
Direct Investment
$180.6
($235.4) 5
Portfolio Investment
$1,017.4
($426.1) 6
Other Investments
$690.4
($400)
Balance on Capital Account
$826.9 7
Statistical Discrepancies
Overall Balance
($2.4)
Official Reserve Account
$2.4
($18)
Copyright © 2007 by The McGraw-Hill Companies, Inc. All rights reserved. 3-31
Balance of Payments and the Exchange Rate
Q
P
As U.S. citizens export, others demand dollars at the FOREX market.
Exchange rate $
S
D
Credits
Debits Current Account
1
Exports
$2,096.3
2
Imports
($2,818.0)
3
Unilateral Transfers
$24.4
($114.0)
Balance on Current Account
($811.3) Capital Account
4
Direct Investment
$180.6
($235.4) 5
Portfolio Investment
$1,017.4
($426.1) 6
Other Investments
$690.4
($400)
Balance on Capital Account
$826.9 7
Statistical Discrepancies
Overall Balance
($2.4)
Official Reserve Account
$2.4
($18)
Copyright © 2007 by The McGraw-Hill Companies, Inc. All rights reserved. 3-32
Balance of Payments and the Exchange Rate
Q
P S
D
As the U.S. gov’t buys dollars with FX, the supply of dollars decreases.
S1
Exchange rate $
Credits
Debits Current Account
1
Exports
$2,096.3
2
Imports
($2,818.0)
3
Unilateral Transfers
$24.4
($114.0)
Balance on Current Account
($811.3) Capital Account
4
Direct Investment
$180.6
($235.4) 5
Portfolio Investment
$1,017.4
($426.1) 6
Other Investments
$690.4
($400)
Balance on Capital Account
$826.9 7
Statistical Discrepancies
Overall Balance
($2.4)
Official Reserve Account
$2.4
($18)
Copyright © 2007 by The McGraw-Hill Companies, Inc. All rights reserved. 3-33
Balance of Payments and the Exchange Rate
Q
P S
D
Consequently, the $ appreciates (its foreign-currency price rises)
.
S1
Exchange rate $
Credits
Debits Current Account
1
Exports
$2,096.3
2
Imports
($2,818.0)
3
Unilateral Transfers
$24.4
($114.0)
Balance on Current Account
($811.3) Capital Account
4
Direct Investment
$180.6
($235.4) 5
Portfolio Investment
$1,017.4
($426.1) 6
Other Investments
$690.4
($400)
Balance on Capital Account
$826.9 7
Statistical Discrepancies
Overall Balance
($2.4)
Official Reserve Account
$2.4
($18)
Copyright © 2007 by The McGraw-Hill Companies, Inc. All rights reserved. 3-34
Sovereign Wealth Funds
l Government-controlled investment funds are playing an increasingly visible role in international investments.
l SWFs (Sovereign Wealth Funds) n Mostly domiciled in Asia and Middle-East
n though Norway/Botswana/Russia all have large SWFs u Transparency? Motives?
n Usually responsible for recycling these countries’ foreign exchange reserves (swelled by trade surpluses and commodity revenues)
Copyright © 2007 by The McGraw-Hill Companies, Inc. All rights reserved. 3-35
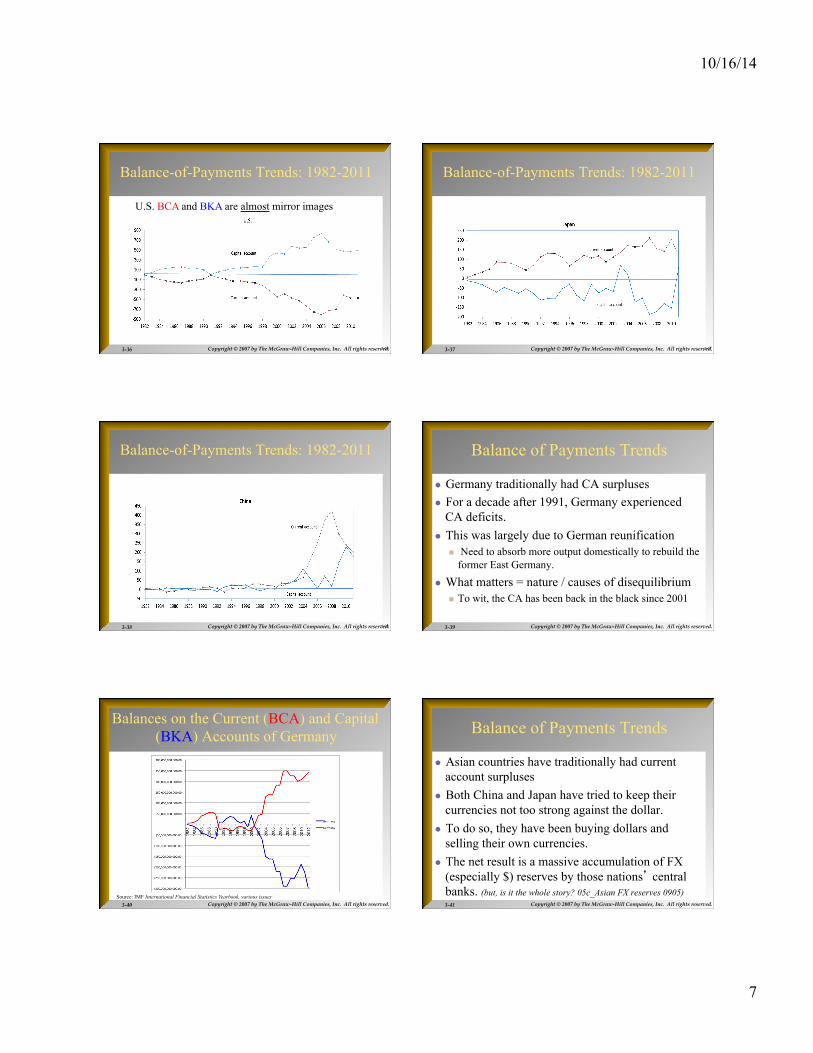
D. Balance of Payments Trends
l Since 1982, the U.S. has had continuous current account deficits and surpluses on capital account. n Sole exception: small CA surplus in 1991 ($2.9bn). n Just how big did deficits grow?
u 2000: $ 444.7bn (E&R5; latest revised figures: $ 416.3 bn) u 2004: $ 628bn (latest Economic Report to the President) u 2006: $ 800bn (based on 2013 ERP; highest ever) u 2012: $ 477bn (estimate based on 1st 3 quarters, 2013 ERP)
l During that period, Japan experienced reverse u 2011-3: US deficit stable (why?), Japan now has a CA deficit
10/16/14
7
Copyright © 2007 by The McGraw-Hill Companies, Inc. All rights reserved. 3-36
Balance-of-Payments Trends: 1982-2011
3-36
U.S. BCA and BKA are almost mirror images
Copyright © 2007 by The McGraw-Hill Companies, Inc. All rights reserved. 3-37
Balance-of-Payments Trends: 1982-2011
3-37
Copyright © 2007 by The McGraw-Hill Companies, Inc. All rights reserved. 3-38
Balance-of-Payments Trends: 1982-2011
3-38 Copyright © 2007 by The McGraw-Hill Companies, Inc. All rights reserved. 3-39
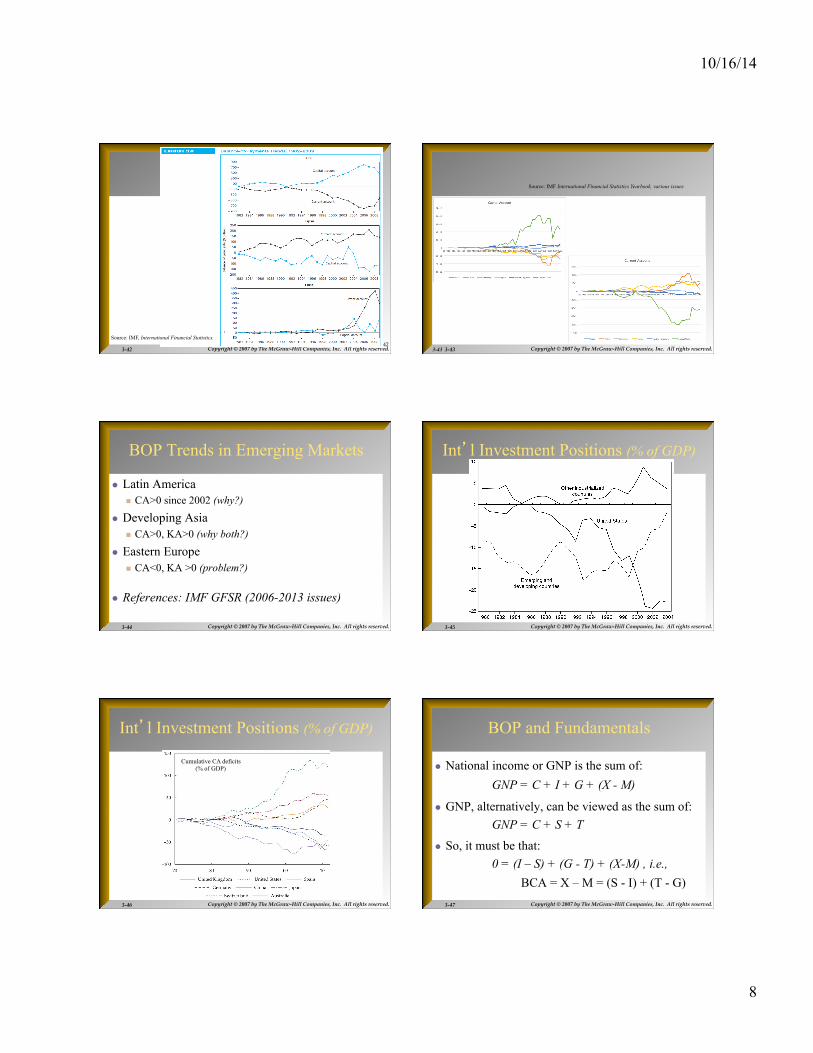
Balance of Payments Trends
l Germany traditionally had CA surpluses l For a decade after 1991, Germany experienced
CA deficits. l This was largely due to German reunification
n Need to absorb more output domestically to rebuild the former East Germany.
l What matters = nature / causes of disequilibrium n To wit, the CA has been back in the black since 2001
Copyright © 2007 by The McGraw-Hill Companies, Inc. All rights reserved. 3-40
Balances on the Current (BCA) and Capital (BKA) Accounts of Germany
Source: IMF International Financial Statistics Yearbook, various issues Copyright © 2007 by The McGraw-Hill Companies, Inc. All rights reserved. 3-41
Balance of Payments Trends
l Asian countries have traditionally had current account surpluses
l Both China and Japan have tried to keep their currencies not too strong against the dollar.
l To do so, they have been buying dollars and selling their own currencies.
l The net result is a massive accumulation of FX (especially $) reserves by those nations’ central banks. (but, is it the whole story? 05c_Asian FX reserves 0905)
10/16/14
8
Copyright © 2007 by The McGraw-Hill Companies, Inc. All rights reserved. 3-42 3-‐‑42 Source: IMF, International Financial Statistics.
Copyright © 2007 by The McGraw-Hill Companies, Inc. All rights reserved. 3-43
Source: IMF International Financial Statistics Yearbook, various issues
3-43
Copyright © 2007 by The McGraw-Hill Companies, Inc. All rights reserved. 3-44
BOP Trends in Emerging Markets
l Latin America n CA>0 since 2002 (why?)
l Developing Asia n CA>0, KA>0 (why both?)
l Eastern Europe n CA<0, KA >0 (problem?)
l References: IMF GFSR (2006-2013 issues)
Copyright © 2007 by The McGraw-Hill Companies, Inc. All rights reserved. 3-45
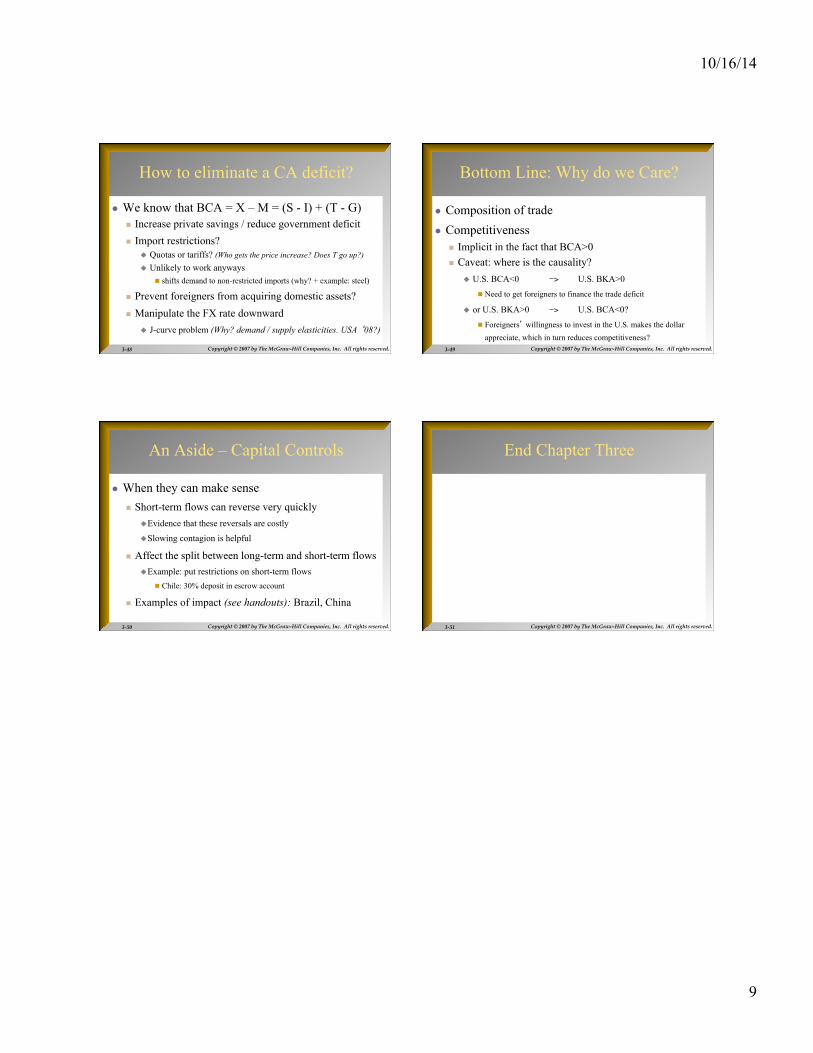
Int’l Investment Positions (% of GDP)
Copyright © 2007 by The McGraw-Hill Companies, Inc. All rights reserved. 3-46
Int’l Investment Positions (% of GDP)
Cumulative CA deficits (% of GDP)
Copyright © 2007 by The McGraw-Hill Companies, Inc. All rights reserved. 3-47
BOP and Fundamentals
l National income or GNP is the sum of: GNP = C + I + G + (X - M)
l GNP, alternatively, can be viewed as the sum of: GNP = C + S + T
l So, it must be that: 0 = (I – S) + (G - T) + (X-M) , i.e.,
BCA = X – M = (S - I) + (T - G)
10/16/14
9
Copyright © 2007 by The McGraw-Hill Companies, Inc. All rights reserved. 3-48
How to eliminate a CA deficit?
l We know that BCA = X – M = (S - I) + (T - G) n Increase private savings / reduce government deficit n Import restrictions?
u Quotas or tariffs? (Who gets the price increase? Does T go up?) u Unlikely to work anyways
n shifts demand to non-restricted imports (why? + example: steel)
n Prevent foreigners from acquiring domestic assets? n Manipulate the FX rate downward
u J-curve problem (Why? demand / supply elasticities. USA ‘08?)
Copyright © 2007 by The McGraw-Hill Companies, Inc. All rights reserved. 3-49
Bottom Line: Why do we Care?
l Composition of trade l Competitiveness
n Implicit in the fact that BCA>0 n Caveat: where is the causality?
u U.S. BCA<0 -> U.S. BKA>0
n Need to get foreigners to finance the trade deficit
u or U.S. BKA>0 -> U.S. BCA<0?
n Foreigners’ willingness to invest in the U.S. makes the dollar appreciate, which in turn reduces competitiveness?
Copyright © 2007 by The McGraw-Hill Companies, Inc. All rights reserved. 3-50
An Aside – Capital Controls
l When they can make sense n Short-term flows can reverse very quickly
u Evidence that these reversals are costly
u Slowing contagion is helpful
n Affect the split between long-term and short-term flows u Example: put restrictions on short-term flows
n Chile: 30% deposit in escrow account
n Examples of impact (see handouts): Brazil, China
Copyright © 2007 by The McGraw-Hill Companies, Inc. All rights reserved. 3-51
End Chapter Three
Recommended