This article was downloaded by: [University of Arizona]On: 02 July 2014, At: 18:00Publisher: RoutledgeInforma Ltd Registered in England and Wales Registered Number: 1072954 Registered office: MortimerHouse, 37-41 Mortimer Street, London W1T 3JH, UK
Regional StudiesPublication details, including instructions for authors and subscription information:http://www.tandfonline.com/loi/cres20
The changing urban hierarchy in ScotlandR.D.P. Smith aa Department of Town and Country Planning , Edinburgh College of Art, Heriot-WattUniversityPublished online: 04 Feb 2007.
To cite this article: R.D.P. Smith (1978) The changing urban hierarchy in Scotland, Regional Studies, 12:3, 331-351, DOI:10.1080/09595237800185281
To link to this article: http://dx.doi.org/10.1080/09595237800185281
PLEASE SCROLL DOWN FOR ARTICLE
Taylor & Francis makes every effort to ensure the accuracy of all the information (the “Content”) containedin the publications on our platform. However, Taylor & Francis, our agents, and our licensors make norepresentations or warranties whatsoever as to the accuracy, completeness, or suitability for any purpose ofthe Content. Any opinions and views expressed in this publication are the opinions and views of the authors,and are not the views of or endorsed by Taylor & Francis. The accuracy of the Content should not be reliedupon and should be independently verified with primary sources of information. Taylor and Francis shallnot be liable for any losses, actions, claims, proceedings, demands, costs, expenses, damages, and otherliabilities whatsoever or howsoever caused arising directly or indirectly in connection with, in relation to orarising out of the use of the Content.
This article may be used for research, teaching, and private study purposes. Any substantial or systematicreproduction, redistribution, reselling, loan, sub-licensing, systematic supply, or distribution in anyform to anyone is expressly forbidden. Terms & Conditions of access and use can be found at http://www.tandfonline.com/page/terms-and-conditions
Regional Studies, Vol. 12, pp. 331-351. Pergamon Press, Ltd. t978. Printed in Great Britain. © Regional Studies Association. 0034-3404/78/0601-0331 $02.00/0
SfB Aa3 U D C 711.43:453
(411)
The Changing Urban Hierarchy in Scotland R. D. P. SMITH
Department of Town and Country Planning, Edinburgh College of Art, Heriot- Watt University
(Received August 1977: in revised form October 1977)
SMrrH R. D. P. (1978) The changing urban hierarchy in Scotland, Reg. Studies 12, 331-351. An extension o f earlier studies relating to England and Wales with which it is as uniform as the different conditions in Scotland permit. All significant centres are identified as at 1951 and 1971 and changes recorded. Results indicate a slow fall in the number o f significant centres and in the role o f three o f the four city centres. The growth o f a number o f regional centres is identified, not only in the central belt where other growth is concentrated, but in the rural periphery. Associations are demonstrated between changes in population, facilities and retail trade; the locality population is the most closely linked but local newspapers are the most sensitive indicator o f change.
Central places Urban hierarchy Scotland 1951-1971
Spatial association o f change
Tins Is THE third in a series of articles in Regional Studies discussing changes in the status of central places in Great Britain over the past forty years. The two earlier articles (SMrrH, 1968 and 1970) dealt respectively with England outside Greater London, and with Wales. The present article covers Scotland in the period 1951-1971. Although long delayed, it is on a similar basis to its predecessors so far as conditions permit, but the techniques of analysis are not quite so crude as those previously used.
C O N T R A S T S B E T W E E N S C O T L A N D ,
E N G L A N D A N D W A L E S
The initial basis for the previous studies was the work of Professor A. E. Smailes (SMAILES, 1944). It was in order to be able to draw some comparisons with Smailes' conclusions and those of subsequent authors such as CARRUTHERS (1957 and 1967), CARTER (1965) and GREEN (1950) that the hierarchical form of analysis and presentation was adopted. The writer accepts, and acknowledged in the article on Wales (SMITH, 1970) that the reality is a continuum within which centres are constantly adjusting their roles. The present article attempts to go into some of the relationships which may be observed as this happens, in particular those between facilities and population changes.
However, for ease of analysis, presentation and grasp of the infinite complexities of
reality it 'is convenient to postulate a hier- archy, particularly so since the basis of the studies is the presence, absence or duplication of particular facilities, many of which hold a clear position in the special hierarchy of one service, such as the Postal and Tele- communications centres. If for no 'other reason it would be desirable to retain comparability with the studies of England and Wales. All the same, adoption of a hierarchical concept need not blind the reader and it is hoped has not blinded the author of this paper, who is chiefly interested in the actual functioning of the system as it affects forward planning of the physical environ- ment.
In attempting to secure comparability, however, several problems arise. The first is fundamental--Smailes ' study of the con- ditions in the late 1930's did not extend to Scotland, and so far as the writer is aware there is no comparable past essay which does. It was therefore necessary to undertake this work for a more recent base date before the main study could begin, and in fact the collection of data was begun about 1951, on the spare-time basis which has been followed throughout. The subsequent ready avail- ability of only certain data sets for 1951 has affected the basis for the 1971 classifications to some extent.
A second problem arises from the physical nature of Scotland. With a much lower overall population density than England; the
331
Dow
nloa
ded
by [
Uni
vers
ity o
f A
rizo
na]
at 1
8:00
02
July
201
4
332 R. D. P. Smith
role of the smaller central places which serve rural areas becomes of more general concern in Scotland. Any study of the hierarchy should ideally extend to the whole system, rather than taking as the cut-off point a level selected somewhat arbitrarily many years ago on the basis of English conditions. Conversely, lowland areas are limited in extent, and this inhibits the development of any Christatlerian pattern of regularly-spaced centres while ensuring that there is in certain areas a highly-developed urban system. What regularity, if any, could be expected of a hierarchy in such conditions? With large areas of mountainous moorland, thinly-stretched communicat ions, lengthy peninsulas and numerous islands and groups of islands, and the slow mingling of three main cultures over ten or more centuries, there is ample scope for regional peculiarities to persist even in a country which by world standards is very small. As will appear below, there are indeed substantial differences within Scotland.
Another, though for the purposes of this study less significant difference f rom England is the recent foundation of many places which, though not perhaps very far up the hierarchy, have some importance within it. Glenrothes is perhaps the most recent example, but Grantown on Spey is only one of the more important of many small towns founded during the late 18th and early 19th century. The fundamental redistribution of population from west to east during the Highland clearances of that period, followed by intense concentration into urban centres in the Lowlands during the rest o f the 19th and early 20th centuries, changed the whole pattern of central places; since then while the overall total population has remained fairly constant due to persistent net emigration, there has been a continuing fall in the population of most rural areas and increased urbanisation, the latter culminating in a virtual explosion of population from the congested inner-.cities into small towns and new satellite communities. Could stability of functions be expected in such conditions?
It was therefore thought desirable to include some population parameters in the study, even though this would reduce com- parability with the England and Wales research. But much more crucial from this angle were the numerous ways in which a different social, economic and legal system in Scotland affects the definition of the various facilities and activities which together com- prise a central place.
Whatever the reader's view about the
significance of the Scottish Nationalist pheno- menon as a political force, there can be no doubt that it reflects the fact that Scotland is a comparatively isolated, and very different, sub-system within the United Kingdom. This shows clearly in the broad pattern of metro- politan labour areas (WESTAWAY, 1974, p.61). While all the English and Welsh areas are contiguous, indeed in many places over- lapping, none of the Scottish areas as there defined shares a common boundary with any English area. Although one must observe that Dumfries has been omitted, though only just below the threshold, and that Aberdeen's contiguity is apparent rather than real, the overall pattern is clear--that of a cluster of areas in the central belt of Scotland, well separated from the much larger English cluster which also embraces parts o f Wales - - the only populous parts.
Under a separate legal and religious system this isolation has led to the persistence of differences which under many circumstances might not have remained. Unti l compara- tively recently wages were lower, in some cases much lower than the Great Britain average, and there was consequently low car ownership, a different diet, and smaller homes. A tradition of small houses, and in the urban areas of tenement flats has led to a higher density of urban population. Steep slopes have led to a stretching of the apparent distances between functionally distinct places, which consequently adjoin more closely than in England, and as a result it has been necessary to define more carefully what in spatial terms is meant by a central place as an entity distinct f rom other such places which adjoin. At the same time it must be recognised that in the early 20th century in the Lowlands at least there was an enormous increase in accessibility along certain axes within and between these closely-spaced towns due to the extensive growth of extremely cheap t ramway systems; though these have all now vanished their replacement bus services remained, at least up to 1971, a potent factor in facilitating the interdependence of centres. In the rural areas, by contrast, where even for the car owner accessibility is not high due to the limitations of the road system, there is a very high telephone penetrat ion--telephone connections doubled in ten years from 1963, and nearly one household in two throughout Scotland had a telephone by the early 1970's: a penetration second only to that o f London and the South East of England within the U.K. (SCOTTISH TELECOMMUNICATIONS BOARD, 1976).
Dow
nloa
ded
by [
Uni
vers
ity o
f A
rizo
na]
at 1
8:00
02
July
201
4
The Changing Urban Hierarchy in Scotland 333
The actual differences in terms of some significant central place activities may be wor th setting out in some detail, if in a rather random order. To take the Scottish financial system first, there are no branches of the Bank of England in Scotland, and the joint stock banks are operated separately from their English associates. But in 1950 there were eight different banks, each with its own branch siting policy; by a rapid series of mergers this has been reduced to only three; at least one of which is wholly owned by an English bank. Much rationalisation of branch offices is under way in certain areas as a result of this and other changes such as com- puterisation.
The Scottish legal system is entirely separate from the English system, and in Scotland solicitors carry out many functions which are the task of estate agents in England. Land tenure is on a different basis and the domestic property market is a much smaller, though fast-growing, part of the whole. This must affect the distribution of the legal profession, as must the local government system, which during the period of this study remained unchanged, but with a much greater decentralisation of decision-making to smaller counties and even smaller burghs than in England. The county districts or landward areas were also not administered independently of counties as in England.
In retailing there remain many differences. The less varied diet is one cause; the almost total lack until very recently of a system of retail markets is another, such that the English 'market town' is not precisely to be matched in Scotland. Woolwor th stores, so wide- spread in England even in the 1930's that Smailes made them a cornerstone of his studies, were still colonising places of a similar importance in Scotland during the study period. O f the groups which now dominate much o f the department and variety store trade in England, only Marks and Spencer extensively colonised Scotland before the 1950's and some other English household names, such as Sainsbury's and Debenhams', did not trade in Scotland at all, or at least to any recognisable extent, at this time.
As will emerge later in this article, the newspaper press seems to play a fairly critical role in the smaller central places; that is to say the weekly press. The Scottish daily press is quite distinct f rom the English or 'national' press, the principal exception during the study period being the Scottish Daily Express which was, however, edited and printed in
Scotland entirely separately. Each of the four cities of Scotland retains its own morning and evening papers and there are distinctively different Sunday papers. An unusual rote was played until recently by the weekly Oban Times, which had a wide overseas readership as a result of past emigration from the western Highlands and islands.
The educational system too is different, having had an independent development and at one time having been far in advance of England. Schooling was widespread much earlier in the 18th and 19th centuries, but the pattern has been slower to respond to modern changes. The move from primary to secon- dary schools tends to occur later, and that from school to university a year earlier; this shorter secondary course is split in many areas even to this day into junior and senior halves, so that with boarding of pupils from remote areas there is little comparability with the English system which would enable a straight adoption of central place status criteria from previous studies. There is also a longer university course, four years not three, and no polytechnics on the present English system. It was decided for the purposes of this study therefore to omit schooling from status indicators at this stage, though a later study will it is hoped include it.
Finally in this catalogue of contrasts may be mentioned sport. The English Football League (which includes Wales) does not include any Scottish teams, though it abstracts many of the best Scottish players. The Scottish league, which includes Berwick Rangers from England, does not operate north-west o f a line f rom Aberdeen to Greenock. In this northern area football competes with shinty, a game much played by small communities in the Highlands, though there is a locally important Highland League for conventional football. R u g b y is passionately played in the Borders and Edinburgh, in particular. A much more widespread and in some places seemingly almost total preoccupation with golf means that almost every village in Scotland has at least a 9-hole course, many an excellent 18- hole or championship standard course. Finally there are numerous ice rinks, due more to a strong interest in the peculiarly Scottish game of curling than to a liking of skating, though ice hockey thrives in a few places such as Fife. All these factors operate to create differences not only between Scotland and the English system of central place activities, but within Scotland itself.
Dow
nloa
ded
by [
Uni
vers
ity o
f A
rizo
na]
at 1
8:00
02
July
201
4
334 R. D. P. Smith
Progress and methodology Taking into account the three main
problems mentioned above (the lack of a previous study, a contrasting physical basis and a different socioeconomic system from England), the writer found progress slow and difficult. A direct comparison with the English gradings of central places proved impossible in the absence of a base-date study; so at first attention was focused on making good this deficiency. As the work progressed a much less clear-cut distinction emerged between ' towns' and 'villages' than had been expected; places such as New Galloway (population under 350) had burghal status and a complex facilities structure. This led to the enlargement in scope of the study until some 1600 places had been identified, without coming to the end of those which play some locally appreciable r~le; in fact a Pandora's box of work opened up, which in a spare- time study seemed unending.
A further concern emerged in that central place studies are essentially descriptive, and in scientific terms have been insufficiently rigorous in most cases, dominated by rather unworldly theories and of little practical application, whereas the desirability of being able to be validly presciptive is ever in the mind of the planner. Ideally therefore a deeper level of investigation is necessary; merely to postulate and then having in- vestigated, to describe an actual hierarchy even in quasi-dynamic terms, is only a step on the road. We need to be able to reveal sufficient of the inter-relationships between population, economic base, settlement pat- tern and central places to be able to determine critical values, for instance thresholds above which in given circumstances it might be found that a system of central places became stable and viable but below which the spiral of rural depopulation and settlement decline set in.
So a more detailed study seemed unavoid- able. In order ~'0 handle the mass of data involved, while retaining control of the subject as a purely intermittent spare-time activity, a computer was not seen as a practical answer but a manual punched card system might be. With the co-operation of Copeland and Chatterson Ltd. a fairly high-capacity hand-sortable edge-punched card was de- signed, which enabled data already collected in the early 1950's to be compared with the same range of facilities data for the early 1970's (in each case for the census year 1951 or 1971 wherever possible), and with locational and crude population data. So far it has not
been practicable to cover data on economic base but this is evidently desirable if a micro study is to be of similar significance to a macro study such as ARMEN (1972). The actual data sources included mainly subject and tel- ephone directories and O.S. maps, as well as timetables and census volumes, supplemented by site visits, other documentary sources, the media, and discussion. Not all the desired data could be accommodated on the cards, but by concentrating their use on the more widely- distributed facilities it was found possible to manage the remaining data more simply.
The definition of what constitutes a central place had to be given closer thought than in previous studies which were essentially based solely on alphabetical tabulations and spot checks on maps and street directories. After studying the spacing of all the second and third order centres in England, together with a sample of the fourth order, the distances between administratively distinct burghs in Scotland, between a sample of railway stations, and between distinct significant central places both urban and rural which were well known to the writer when a planning officer, a standard of 1-78km was adopted as the min imum centre to centre spacing to qualify for separate treatment. Below this distance centres tend to merge into linear agglomerations, above it to separate out into distinct units. It is o f course an arbitrary distance, being chosen to fit specific cases, and also to give a settlement area of 10km 2 where centres do not closely adjoin. This would give consistency with the writer's work in East Anglia (SMITH et al., 1971) summarised in an unpublished report in which the 16km 2 area of a 4 x 4km grid cell was found too coarse for regional planning and the 4km 2 ofa 2 x 2km cell needlessly fine. More thorough research might well lead to the adoption of a different standard. However , since this distance gives about a mile radius circle, convenient 20 minute walking distance or a few minutes by vehicle, and seems to correspond to the sort of areas which are to be covered by the new communi ty councils defined by typical District councils in Scotland, it seems a useful basis even if its seeming precision is more apparent than real, since most centres do not adjoin so closely.
Where there was clear evidence that a facility attributed by name to one place was actually not within 1"78km, a separate card was established or the facility was allocated to the actual settlement with which it was most physically proximate. An example is
Dow
nloa
ded
by [
Uni
vers
ity o
f A
rizo
na]
at 1
8:00
02
July
201
4
The Changing Urban Hierarchy in Scotland 335
Kirkcaldy Ice Rink, 3km from the intense concentrat ion of shopping and business facilities in Kirkcaldy High Street but as- sociated with a linear centre variously known as Pathhead, Sinclairtown and Gallatown as the town centre is left farther behind, and which also contains Dysart telephone ex- change. The once distinct but n o w much eroded centre of Dysart is well within a 1"78km radius of the Sinclairtown centre proper, as is Kirkcaldy Ice Rink; so with two cards, one for Kirkcaldy proper and another for the complex in the east of the town around Sinclairtown, the situation was re- solved to a level suited to analysis and incidentally conforming to the area of an informal local plan already adopted.
The definition adopted successfully se- parates the small coastal towns of the East Neuk of Fife; distinguishes the Glasgow, Edinburgh and Dundee city centres f rom their main suburban centres and the latter from each other; but enables really small local subcentres within cities and towns to be ignored as being of interest only to local planning mainly at the development control level. Their facilities were in all cases aggregated with any larger place within 1"78km, or if more remote they were treated as a separate centre even if having only a single facility of those identified.
After proceeding successt~ully on this basis for some time it became apparent that the time required was excessive if one paper was to be prepared to cover the entire study. It was therefore decided to prepare and submit for publication only a paper which would correspond as nearly as possible with those previously published in Regional Studies for England and Wales (SMITH, 1968 and 1970). Subsequently a more detailed investigation of the smaller places and some additional data could be tackled.
Although by this time the 1971 data were becoming historical, it was felt that this date was something of a turning point. Before it there was natural increase, relative prosperity, and no Nor th Sea oil in immediate prospect. N o w the birth rate has fallen, the economy has reacted to oil repricing and local oil exploitation has changed many small com- munities in Scotland; and incidentally the impact of out of town centres has begun to be felt. So the 195t-71 period assumes a usefulness as a period of steady adaptation rather than of crisis, and its trends may be seen in retrospect.
Principal findings for the period 1951-71 In total, 162 central places were found
which were considered to be significant at the level adopted for the English and Welsh studies. This compares with 770 places in England and 110 in Wales, making a total o f 1042. However , the actual number effective at one time fell from 157 in 1951 to 155 in 1971, and of these a higher proportion were of the lowest grade recognised as an urban centre. This is further discussed in the following section. Meant ime to see the pattern as a whole it is important to note the extremely high degree of concentration of central places into a very small part of the land mass of Scotland. O f the 162 centres, 71 or 44% lie within the 100kin national grid square NS which is dominated by Glasgow, and a "further 28 or 17°/o in square N T which adjoins and is dominated by Edinburgh. Even though neither square contains qs much sea as most o f those covering Scotland, together they contain 61% of all significant central places while the other fifteen 100km squares in which central places are found contain only 390/0 of the total, and six of them contain only one such place in each. This distribution reflects the broad pattern of population distribution, which itself arises from the exploitation of a locationally concentrated resource base.
The actual concentration within central Clydeside is even greater than these broad figures suggest: 18-5°/o of all central places found to be significant were concentrated into only two 20km square grid cells together comprising on ly 0"620//0 of the land area of Scotland. Apart from sheer concentration this serves to emphasise the dominance of Glasgow. In 1971 the area which has now become the Strathclyde Region contained 2"58 million people, 490/0 of the total population of Scotland, and 68 of the 162 most significant central places, or 420/0 . During the period 1951-71 the population of the same area rose by 2 % (as against 2½% in Scotland as a whole) but the number of those central places rose from 64 to 66 in Strathclyde as against a fall f rom 93 to 89 in the rest of Scotland, raising its percentage share by about 20/0 and indicating a trend seemingly at variance with the prevailing concept that the West of Scotland is in decline. O f course it may be argued that such changes merely show a belated catching-up following the calamitous 1920's and 1930's and that they could not have occurred without Governmental support of the econ- omic base. It is also true that m u c h re-
Dow
nloa
ded
by [
Uni
vers
ity o
f A
rizo
na]
at 1
8:00
02
July
201
4
336 R. D. P. Smith
distribution of population has occurred within the region, giving rise directly to such new centres as Cumbernauld.
While Edinburgh is the capital o f Scotland and exceeds Glasgow in several associated respects, such as postal and telecommuni- cations headquarters and bank head oflqces, Glasgow remains in a majority of respects a higher order centre, apart from the sheer weight of its dependent population. It is in many ways comparable with the three leading centres of provincial England, Birmingham, Liverpool and Manchester. Like them it has for example a Director telephone system; although Edinburgh has subsequently also acquired such a system the latter remains the only British centre not graded 2A to have one, reflecting its unique combination of governmental, cultural and business activities. But Glasgow airport is busier than Edinburgh's; it was to Glasgow not Edinburgh that rail electrification was extended from London, so that all four of the highest order provincial cities are now connected to London by electrified rail services; and Glasgow possesses that hallmark of the truly big city, the electrified metro- politan railway or 'metro' system. Glasgow created an Opera House while Edinburgh argued about having one. The B.B.C. Scotland H.Q. is in Glasgow, or rather in one of its leading suburban centres. However , there is evidence to suggest that Edinburgh is gaining on the lead which Glasgow established in the 19th century while Glasgow struggles to maintain its position. The international prominence of the Edinburgh Festival could well be a potent factor in this trend.
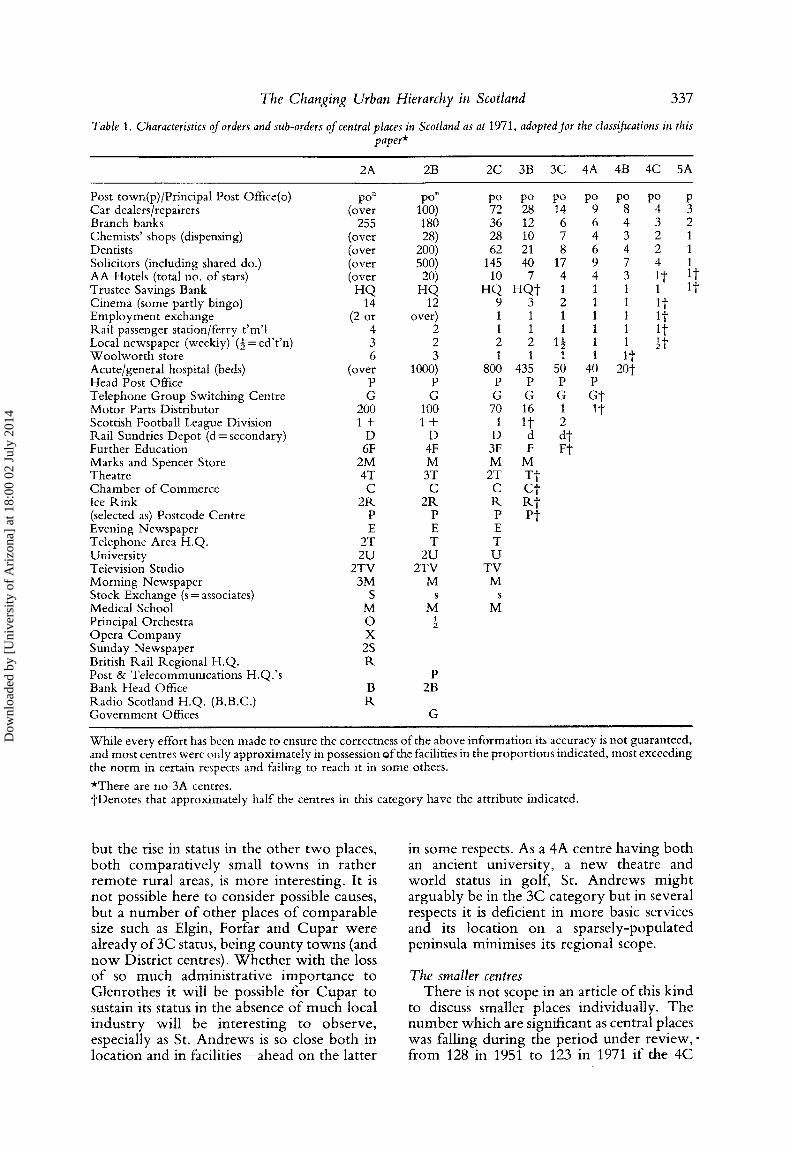
Table 1 shows the facilities on which the gradings are based. It is comparable with that for England (SMrrn, 1968, p. 3) but for the reasons outlined above there are important differences, even though the principles of classification were essentially the same. Moving down the hierarchy, for instance, in Scotland there ate no 3A centres comparable to the English cathedral cities, major resorts and Oxbridge. Therefore Aberdeen and Dundee, third and fourth in the Scottish ranking respectively but in most respects closely comparable in facilities in 1971, have a more prominent role to play than 2C centres of similar facilities such as Hull or Plymouth play in England where they are in com- petition with the more accessible York, Doncaster and Exeter. In fact the Dundee morning newspaper crowds the Edinburgh paper out of the lion's share of the circulation in Fife, which lies between the two cities.
Aberdeen is however not only a little ahead of Dundee in its general facilities, but plays a more prominent role in regional terms and has at Dyce a much more important airport, now further stimulated as a result of oil development. Can Dundee, which has been in something of a decline, remain in the same class indefinitely?
Again because of the lack of3A centres, the twelve main regional centres in Scotland outside the four cities are classified 3B. While perhaps none of them has the lustre of an English cathedral city, most of them show flair in certain respects. Ayr, fifth in impor- tance of all Scottish centres, is important as a shopping, resort and conference centre, having also the advantage of proximity to Prestwick International Airport, and in 1971 was still a major County centre. Inverness is important for communications, medical and administrative services, and Kirkcaldy for shopping and ice hockey, for instance.
Each of the 3B regional centres is also weak in some important respect, suggesting that there would be greater advantages in 3A status were the dependent population ac- cessible to support the necessary services. But nonetheless they are playing an increasing role in Scotland, two places having in the author's view-justified promotion since 1951 into this category: Kirkcaldy and Shawlands. Reasons for this are not hard to seek, but might be harder to prove: there was little development of central place functions in Glenrothes new town until after the period under review, and a transfer o f population f rom the suburban Sinclairtown area of Kirkcaldy to a new suburb, Templehall, which lacked the facilities of Sinclairtown; hence the latter declined somewhat, while the town centre gained. There was also the cessation of the ferry service to Edinburgh via Burntisland and Granton so effectively mak- ing Edinburgh's facilities more distant, and putting a premium on those in Kircaldy. Free parking was also plentiful. For Shawlands, a composite centre on the south side of Glasgow, a big movement of populat ion from inner suburbs to areas near Shawlands wilt have supplied a boost; there are no doubt many other factors at work.
There has also been an increase in the number of minor regional centres (3C) despite these two promotions to 3B. The three places which grew from 4A to 3C were Hawick, Motherwel l and Stranraer. Motherwell with its new theatre, inter-city rail service and postcode centre for a highly- populated area is the most striking of these,
Dow
nloa
ded
by [
Uni
vers
ity o
f A
rizo
na]
at 1
8:00
02
July
201
4
The Changing Urban Hierarchy in Scotland 337
Table 1. Characteristics of orders and sub-orders of central places in Scotland as at 1971, adopted for the classifications in this paper*
2A 2B 2C 3B 3C 4A 4B 4C 5A
Post town(p)/Principal Post Office(o) po n po ° po po Car dealers/repairers (over 100) 72 28 Branch banks 255 180 36 12 Chemists' shops (dispensing) (over 28) 28 10 Dentists (over 200) 62 21 Solicitors (including shared do.) (over 500) 145 40 AA Hotels (total no. of stars) (over 20) 10 7 Trustee Savings Bank HQ HQ HQ H Q t Cinema (some partly bingo) 14 12 9 3 Employment exchange (2 or over) 1 1 Rail passenger station/ferry t'm'l 4 2 1 1 Local newspaper (weekly) (½ = ed't'n) 3 2 2 2 Woolworth store 6 3 1 1 Acute/general hospital (beds) (over 1000) 800 435 Head Post Office P P P P Telephone Group Switching Centre G G G G Motor Parts Distributor 200 100 70 16 Scottish Football League Division 1 + 1 + 1 1 t Rail Sundries Depot (d= secondary) D D D d Further Education 6F 4F 3F F Marks and Spencer Store 2M M M M Theatre 4T 3T 2T T t Chamber of Commerce C C C C t Ice Rink 2R 2R R R t (selected as) Postcode Centre P P P P t Evening Newspaper E E E Telephone Area H.Q. 2T T T University 2U 2U U Television Studio 2TV 2TV TV Morning Newspaper 3M M M Stock Exchange (s = associates) S s s Medical School M M M Principal Orchestra O ½ Opera Company X Sunday Newspaper 2S British Rail Regional H.Q. R Post & Telecommunications H.Q.'s P Bank Head Office B 2B Radio Scotland H.Q. (B.B.C.) R Government Offices G
po po po po 14 9 8 4 6 6 4 3 7 4 3 2 8 6 4 2
17 9 7 4 4 4 3 1 t 1 1 1 1 2 1 1 I t 1 1 1 i t 1 1 1 i t
1½ 1 1 ½t 1 1 i t
50 40 20t P P g G~ 1 I t 2 at Ft
P 3 2 1 1 1 I t i t
While every effort has been made to ensure the correctness of the above information its accuracy is not guaranteed, and most centres were only approximately in possession ~fthe facilities in the proportions indicated, most exceeding the norm in certain respects and failing to reach it in some others.
*There are no 3A centres. tDenotes that approximately half the centres in this category have the attribute indicated.
bu t the rise in status in the o t h e r t w o places, b o t h c o m p a r a t i v e l y small t o w n s in r a the r r e m o t e rura l areas, is m o r e in teres t ing . It is n o t possible he re to cons ider possible causes, bu t a n u m b e r o f o the r places o f c o m p a r a b l e size such as Elgin, Fo r f a r and C u p a r w e r e a l ready o f 3C status, be ing c o u n t y t o w n s (and n o w Dis t r ic t centres). W h e t h e r w i t h the loss o f so m u c h admin i s t r a t ive i m p o r t a n c e to G l e n r o t h e s it will be possible fo r C u p a r to sustain its s tatus in the absence o f m u c h local i n d u s t r y wi l l be i n t e r e s t i ng to o b s e r v e , especial ly as St. A n d r e w s is so close b o t h in loca t ion and in f ac i l i t i e s - -ahead o n the la t ter
in some respects. As a 4A cen t re h a v i n g b o t h an ancient un ivers i ty , a n e w theatre and w o r l d status in golf , St. A n d r e w s m i g h t a rg u a b l y be in the 3C c a t e g o r y b u t in several respects it is def ic ient in m o r e basic services and its l oca t ion o n a sp a r s e l y -p o p u l a t ed peninsula min imises its r eg iona l scope.
The smaller centres T h e r e is n o t scope in an ar t icle o f this k i n d
to discuss smal ler places ind iv idua l ly . T h e n u m b e r w h i c h are s ignif icant as cent ra l places was fal l ing d u r i n g the p e r i o d u n d e r r e v i e w , - f r o m 128 in 1951 to 123 in 1971 i f t he 4C
Dow
nloa
ded
by [
Uni
vers
ity o
f A
rizo
na]
at 1
8:00
02
July
201
4
338 R. D. P. Smith
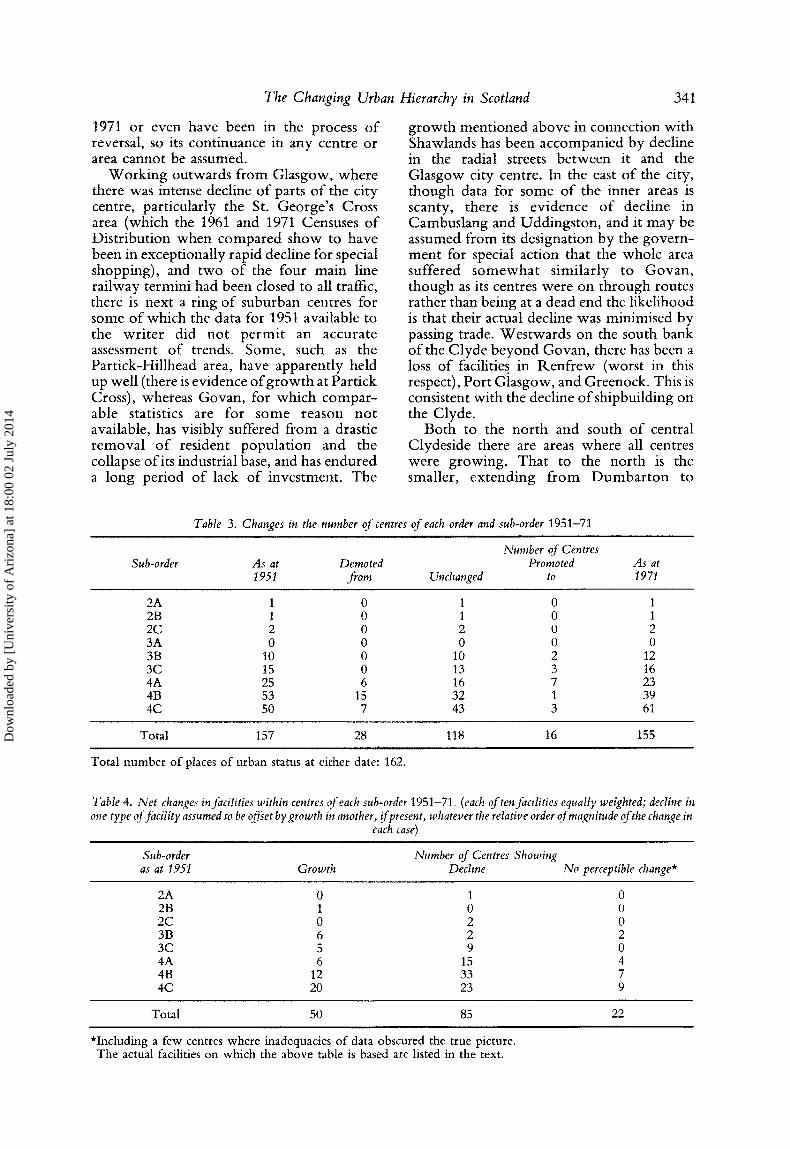
threshold based on Smailes is accepted. The reduction in net terms also affected the intermediate categories of 4A, and parti- cularly 4B status, very significantly. This resulted not only from the promotions mentioned above, but from the very large proportional loss of status of 15 places formerly classifiable as 4B, the equivalent of Smailes' classic 'fully-fledged towns'. So the proportion of centres in the lowest category (4C) actually rose from under 32% to over 390/0 of all the centres. There were in total 16 promotions and 28 demotions, indicative of a falling number of effective centres providing the lion's share of the facilities in Scotland, and probably reflecting a similar concentration of basic economic activities.
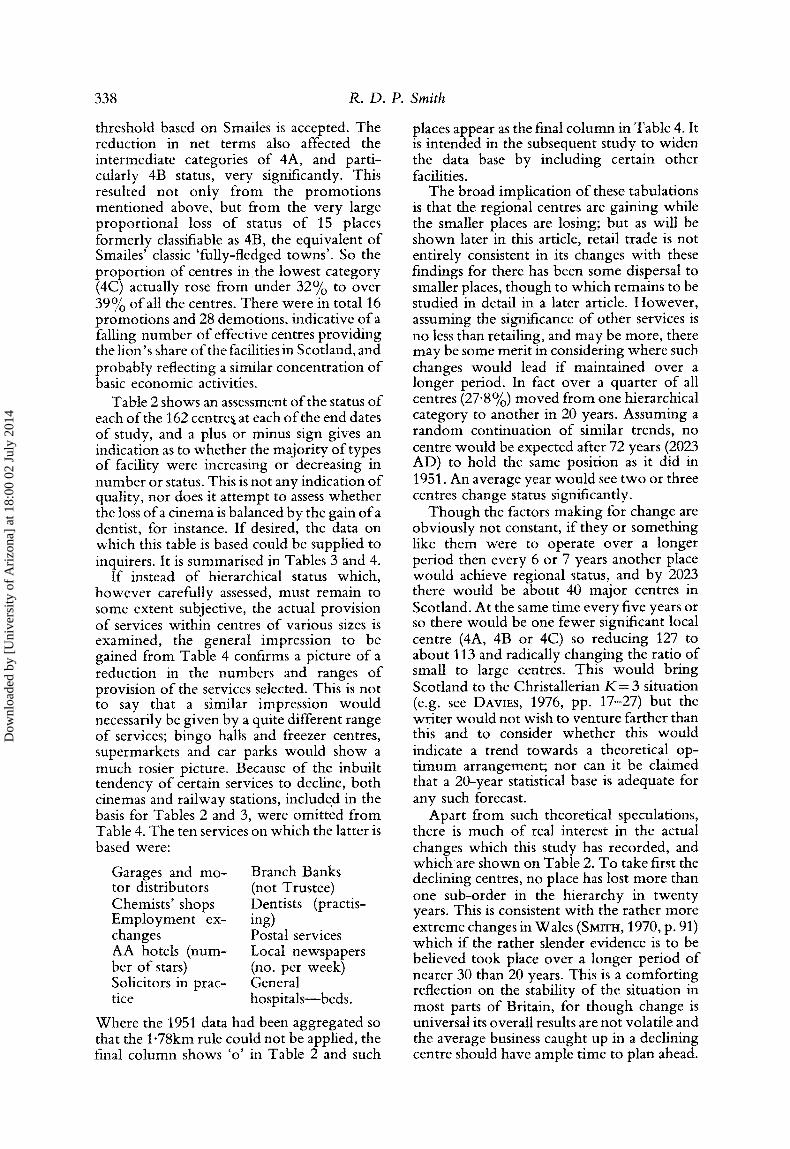
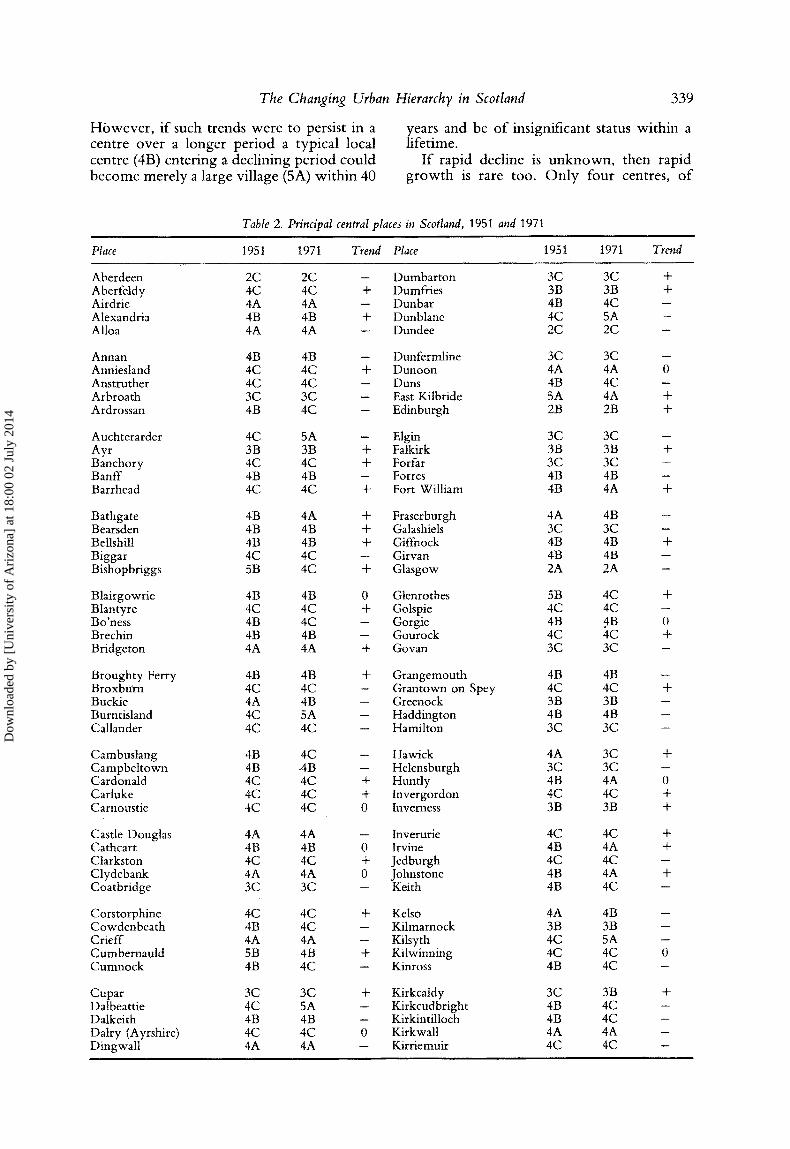
Table 2 shows an assessment of the status of each of the 162 centre~ at each of the end dates of study, and a plus or minus sign gives an indication as to whether the majority of types of facility were increasing or decreasing in number or status. This is not any indication of quality, nor does it attempt to assess whether the loss of a cinema is balanced by the gain of a dentist, for instance. If desired, the data on which this table is based could be supplied to inquirers. It is summarised in Tables 3 and 4.
If instead of hierarchical status which, however carefully assessed, must remain to some extent subjective, the actual provision of services within centres of various sizes is examined, the general impression to be gained from Table 4 confirms a picture of a reduction in the numbers and ranges of provision of the services selected. This is not to say that a similar impression would necessarily be given by a quite different range of services; bingo halls and freezer centres, supermarkets and car parks would show a much rosier picture. Because of the inbuilt tendency of certain services to decline, both cinemas and railway stations, included in the basis for Tables 2 and 3, were omitted from Table 4. The ten services on which the latter is based were:
Garages and mo- tor distributors Chemists' shops Employment ex- changes AA hotels (num- ber of stars) Solicitors in prac- tice
Branch Banks (not Trustee) Dentists (practis- ing) Postal services Local newspapers (no. per week) General hospitals--beds.
Where the 1951 data had been aggregated so that the 1"78km rule could not be applied, the final column shows 'o' in Table 2 and such
places appear as the final column in Table 4. It is intended in the subsequent study to widen the data base by including certain other facilities.
The broad implication of these tabulations is that the regional centres are gaining while the smaller places are losing; but as will be shown later in this article, retail trade is not entirely consistent in its changes with these findings for there has been some dispersal to smaller places, though to which remains to be studied in detail in a later article. However , assuming the significance of other services is no less than retailing, and may be more, there may be some merit in considering where such changes would lead if maintained over a longer period. In fact over a quarter of all centres (27"8%) moved from one hierarchical category to another in 20 years. Assuming a random continuation of similar trends, no centre would be expected after 72 years (2023 AD) to hold the same position as it did in 1951. An average year would see two or three centres change status significantly.
Though the factors making for change are obviously not constant, if they or something like them were to operate over a longer period then every 6 or 7 years another place would achieve regional status, and by 2023 there would be about 40 major centres in Scotland. At the same time every five years or so there would be one fewer significant local centre (4A, 4B or 4C) so reducing 127 to about 113 and radically changing the ratio of small to large centres. This would bring Scotland to the Christallerian K = 3 situation (e.g. see DAVIV.s, 1976, pp. 17-27) but the writer would not wish to venture farther than this and to consider whether this would indicate a trend towards a theoretical op- t imum arrangement; nor can it be claimed that a 20-year statistical base is adequate for any such forecast.
Apart from such theoretical speculations, there is much of real interest in the actual changes which this study has recorded, and which are shown on Table 2. To take first the declining centres, no place has lost more than one sub-order in the hierarchy in twenty years. This is consistent with the rather more extreme changes in Wales (SMrrH, 1970, p. 91) which if the rather slender evidence is to be believed took place over a longer period of nearer 30 than 20 years. This is a comforting reflection on the stability of the situation in most parts of Britain, for though change is universal its overall results are not volatile and the average business caught up in a declining centre should have ample time to plan ahead.
Dow
nloa
ded
by [
Uni
vers
ity o
f A
rizo
na]
at 1
8:00
02
July
201
4
The Changing Urban Hierarchy in Scotland 339
However , if such trends were to persist in a centre over a longer period a typical local centre (4B) entering a declining period could become merely a large village (5A) within 40
years and be of insignificant status within a lifetime.
If rapid decline is unknown, then rapid growth is rare too. Only four centres, of
Table 2. Principal central places in Scotland, 1951 and 1971
Place 1951 1971 7¥end Place 1951 1971 Trend
A b e r d e e n 2C 2C - D u m b a r t o n 3C 3C + A b e r f e l d y 4C 4C + Dumfr i e s 3B 3B + Ai rd r i e 4A 4A - - D u n b a r 4B 4C - - A lexandr i a 4B 4B + D u n b l a n e 4 C 5A - - Al loa 4A 4A - D u n d e e 2C 2C -
A n n a n 4B 4B - - D u n f e r m l i n e 3C 3C -- Ann ie s l and 4C 4 C + D u n o o n 4A 4A 0 A n s t r u t h e r 4C 4 C -- Duns 4B 4C -- A r b r o a t h 3C 3 C -- East Ki lb r ide 5A 4A + Ard ros san 4B 4 C -- E d i n b u r g h 2B 2B +
A u c h t e r a r d e r 4C 5A -- Elg in 3C 3C -- A y r 3B 3B + Falkirk 3B 3B + B a n c h o r y 4C 4 C + Forfar 3 C 3C -- B a n f f 4B 4B - Forres 4B 4B -- B a r r h e a d 4C 4 C + For t W i l l i a m 4B 4A +
B a t h g a t e 4B 4A + F rase rburgh 4A 4B -- Bea r sden 4B 4B + Galashiels 3C 3C - Bellshil l 4B 4B + Gi f fnock 4B 4B + B i g g a r 4C 4 C - - G i r v a n 4B 4B - - B i s h o p b r i g g s 5B 4 C + Glasgow 2A 2A --
B l a i r g o w r i e 4B 4B 0 Gten ro thes 5B 4C + B l a n t y r e 4C 4 C + Golspie 4 C 4C -- Bo 'ness 4B 4 C -- Gorg ie 4B .4B 0 B r e c h i n 4B 4B -- G o u r o c k 4C 4C + B r i d g e t o n 4A 4A + G o v a n 3 C 3 C --
B r o u g h t y Fer ry 4B 4B + G r a n g e m o u t h 4B 4B -- B r o x b t r r n 4C 4 C -- G r a n t o w n o n Spey 4C 4C + Buck ie 4A 4B - - G r e e n o c k 3B 3B -- Bu rn t i s l and 4C 5A -- H a d d i n g t o n 4B 4B -- Ca l l ande r 4C 4C - H a m i l t o n 3C 3C --
C a m b u s l a n g 4B 4 C - - H a w i c k 4A 3C + C a m p b e l t o w n 4B 4 B -- H e l e n s b u r g h 3C 3C -- C a r d o n a l d 4C 4C + H u n t l y 4B 4A 0 C a r l u k e 4C 4 C + I n v e r g o r d o n 4C 4 C + C a r n o u s t i e 4C 4 C 0 Inverness 3B 3B +
Cast le Doug la s 4A 4A -- Inverur ie 4C 4C + C a t h c a r t 4B 4B 0 I rv ine 4B 4A + C l a r k s t o n 4 C 4C + J e d b u r g h 4C 4 C -- C l y d e b a n k 4A 4A 0 J o h n s t o n e 4B 4A + C o a t b r i d g e 3C 3C - - Ke i th 4B 4C -
C o r s t o r p h i n e 4 C 4 C + Kelso 4A 4B -- C o w d e n b e a t h 4B 4C -- K i l m a r n o c k 3B 3B - C r i e f f 4A 4A -- Ki lsy th 4 C 5A -- C u m b e r n a u l d 5B 4B + K i l w i n n i n g 4C 4C 0 C u m n o c k 4B 4C - - Kinross 4B 4C --
C u p a r 3C 3 C + Ki rkca ldy 3C 3B + Da lbea t t i e 4C 5A -- K i r k c u d b r i g h t 4B 4C -- D a l k e i t h 4B 4B -- Ki rk in t i l loch 4B 4C -- D a l r y (Ayrshire) 4C 4C 0 Ki rkwal l 4A 4A -- D i n g w a l l 4A 4A - - K i r r i e m u i r 4C 4C
Dow
nloa
ded
by [
Uni
vers
ity o
f A
rizo
na]
at 1
8:00
02
July
201
4
340 R. D. P. Smith
Table 2 (contd.)
Place 1951 1971 Trend Place 1951 1971 Trend
Lanark 4A 4A + Portobello 4B 4B Langholm 4C 4C 0 Portree 4C 4C Larbert/Stenhousemuir 4C 4C -- Prestwick 4B 4B Largs 4B 4B -- Renfrew 4B 4C Larkhall 4C 4C -- Rothesay 4A 4B
Leith 3C 3C + Rutherglen 4A 4A Lerwick 4B 4B + St. Andrews 4A 4A Leven 4A 4A -- Saltcoats 4B 4B Linlithgow 4C 4C + Selkirk 4C 4C Lochgelly 4C 4C -- Shawlands 3C 3B
Lochgilphead 4C 4C 0 Shettleston 4B 4B Lockerbie 4B 4B -- Shotts 5A 4C Lossiemouth 4C 4C -- Sinclairtown 4B 4C Maryhill 4C 4C 0 Springburn 4A 4A Maybole 4C 4C -- Stevenston 4C 4C
Methil 4C 4C -- Stirling 3B 3B Milngavie 4C 4C + Stonehaven 4B 4B Moffat 4C 5A -- Stornoway 4B 4B Montrose 4A 4A -- Stranraer 4A 3C Morningside 4C 4C -- Strathaven 4C 4C
Motherwelt 4A 3C + Tain 4C 4C Musselburgh 4B 4B + Thurso 4B 4B Nairn 4B 4B -- Troon 4A 4B Newton Stewart 4B 4B 0 Turriff 4C 4C North Berwick 4B 4B -- Uddingston 4C 5A
Oban 3C 3C - Whiteinch 4C 4C Paisley 3B 3B 0 Wick 4B 4A Parkhead 4C 4C 0 Wishaw 4A 4A Partick 3B 3B 0 Peebles 4A 4B --
Perth 3B 3B + Peterhead 4B 4B -- Pitlochry 4C 4C + Port Glasgow 4B 4C --
+
+
0 0 +
0 +
0
+
+ +
0
0 +
Note: Column headed 'trend' shows the net trend in ten facilities so far as can be ascertained. Rail passenger stations and cinemas are not included in the assessment of trends, but showed general decline. Where '0' appears in the trend column there is either no ascertainable trend, or in the case of certain centres within Glasgow and Edinburgh, insufficient data.
w h i c h th ree w e r e n e w towns , w e r e ident i f ied as h a v i n g i m p r o v e d the i r status b y m o r e t h a n on e sub-order : Eas~t'Kilbride b y th ree (5A to 4A), C u m b e r n a u l d b y th ree (5B to 4B), and B i s h o p b r i g g s and G l e n r o t h e s b y t w o (b o t h 5B to 4C) . O f these o n l y the l a s t -named is n o t in S t ra thc lyde , and all lie w i th in the cent ra l bel t o f Scot land . It m a y be assumed that , wh i l e local factors can be ident i f ied w h i c h wil l be the ma in cause o f such g r o w t h , it wi l l have been a ided b y the genera l p o p u l a t i o n accessibil i ty o f the i r loca l i ty w i t h i n Sco t l and (ROBERTSON, 1974, p. 117). M a j o r d e v e l o p - men t s in facilities have c o n t i n u e d in at least th ree o f these places since 1971, and t h e y have also taken place in L iv ings ton and I rv ine n e w
towns . T h e f o r m e r was too small to s h o w up in the 1971 s tudy , b u t I rv ine h a d a l ready m o v e d up f r o m 4B to 4A u n d e r the s t imulus o f t o w n d e v e l o p m e n t and m a y so o n be o f 3C status e v e n i f its d e v e l o p m e n t as a n e w t o w n has b e e n s o m e w h a t d i sappo in t ing .
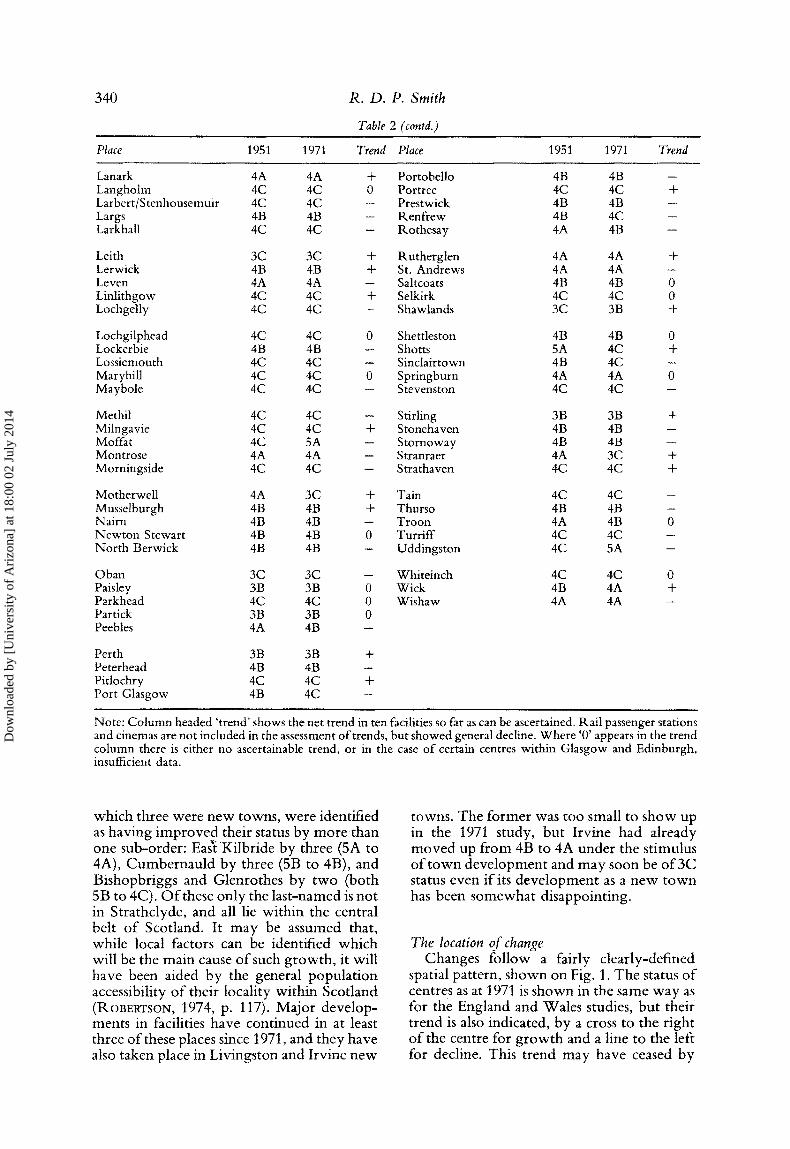
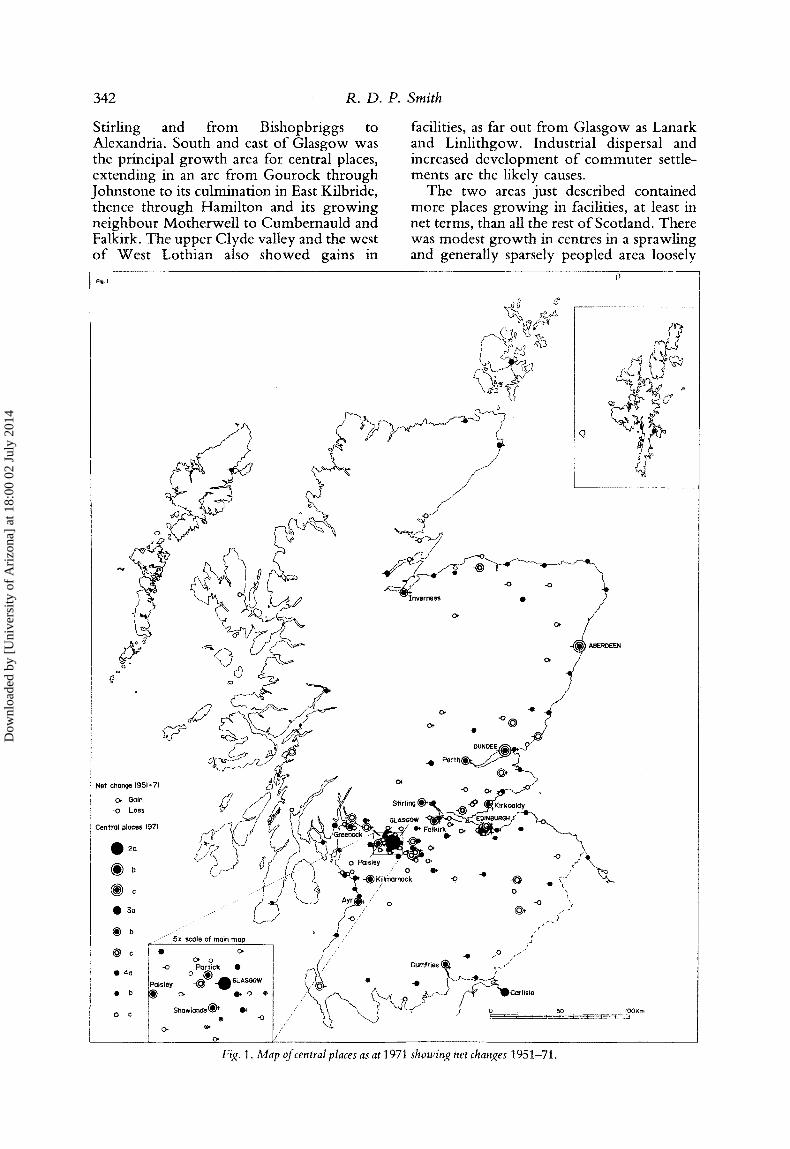
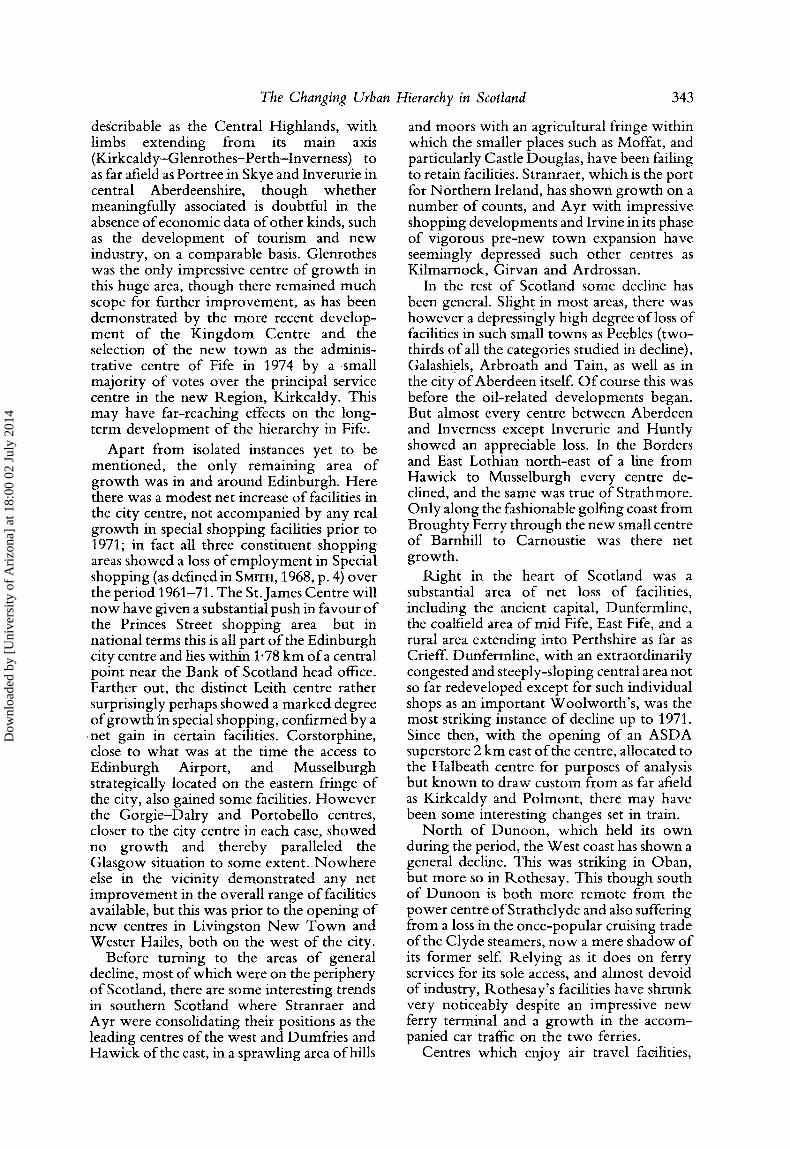
The location of change Ch a n g e s f o l l o w a fair ly c l ea r ly -de f ined
spatial pa t te rn , s h o w n o n Fig. 1. T h e status o f cent res as at 1971 is s h o w n in the same w a y as fo r the En g l a n d and Wales studies, b u t the i r t r e n d is also indica ted , b y a cross to the r igh t o f the cen t re f o r g r o w t h and a l ine to the left fo r decl ine. This t r e n d m a y h a v e ceased b y
Dow
nloa
ded
by [
Uni
vers
ity o
f A
rizo
na]
at 1
8:00
02
July
201
4
The Changing Urban Hierarchy in Scotland 341
t971 or even have been in the process of reversal, so its continuance in any centre or area cannot be assumed.
Working outwards from Glasgow, where there was intense decline of parts o f the city centre, particularly the St. George's Cross area (which the 1961 and 1971 Censuses of Distribution when compared show to have been in exceptionally rapid decline for special shopping), and two of the four main line railway termini had been closed to all traffic, there is next a ring of suburban centres for some of which the data for 1951 available to the wri ter did not permit an accurate assessment of trends. Some, such as the Partick-Hillhead area, have apparently held up well (there is evidence of growth at Partick Cross), whereas Govan, for which compar- able statistics are for some reason not available, has visibly suffered from a drastic removal of resident population and the collapse of its industrial base, and has endured a long period of lack of investment. The
growth mentioned above in connection with Shawlands has been accompanied by decline in the radial streets between it and the Glasgow city centre. In the east of the city, though data for some of the inner areas is scanty, there is evidence of decline in Cambuslang and Uddingston, and it may be assumed from its designation by the govern- ment for special action that the whole area suffered somewhat similarly to Govan, though as its centres were on through routes rather than being at a dead end the likelihood is that their actual decline was minimised by passing trade. Westwards on the south bank of the Clyde beyond Govan, there has been a loss of facilities in Renf rew (worst in this respect), Port Giasgow, and Greenock. This is consistent with the decline of shipbuilding on the Clyde.
Both to the north and south of central Clydeside there are areas where all centres were growing. That to the north is the smaller, extending from Dumbar ton to
Table 3. Changes in the number of centres of each order and sub-order 1951-71
Number of Centres Sub-order As at Demoted Promoted As at
1951 from Unchanged to 1971
2A 1 0 1 0 1 2B 1 0 1 0 1 2C 2 0 2 0 2 3A 0 0 0 0 0 3B 10 0 10 2 12 3C 15 0 13 3 16 4A 25 6 16 7 23 4B 53 15 32 1 39 4C 50 7 43 3 61
Total 157 28 118 16 155
Total number of places of urban status at either date: 162.
Table 4. Net changes in facilities within centres of each sub-order 1951-71. (each of ten facilities equally weighted; decline in one type of facility assumed to be offset by growth in another, if present, whatever the relative order of magnitude of the change in
each case)
Sub-order Number of Centres Showing as at 1951 Growth Decline No perceptible change*
2A 0 1 0 2B 1 0 0 2C 0 2 0 3B 6 2 2 3C 5 9 0 4A 6 15 4 4B 12 33 7 4C 20 23 9
Total 50 85 22
*Including a few centres where inadequacies of data obscured the true picture. The actual facilities on which the above table is based are listed in the text.
Dow
nloa
ded
by [
Uni
vers
ity o
f A
rizo
na]
at 1
8:00
02
July
201
4
342 R. D. P. Smith
Stifling and from Bishopbriggs to Alexandria. South and east o f Glasgow was the principal growth area for central places, extending in an arc from Gourock through Johnstone to its culmination in East Kilbride, thence through Hamilton and its growing neighbour Motherwell to Cumbernauld and Falkirk. The upper Clyde valley and the west o f West Lothian also showed gains in
facilities, as far out from Glasgow as Lanark and Linlithgow. Industrial dispersal and increased development o f commuter settle- ments are the likely causes.
The two areas just described contained more places growing in facilities, at least in net terms, than all the rest o f Scotland. There was modest growth in centres in a sprawling and generally sparsely peopled area loosely
Fi t, |
q
-0
O* O*
ABERDEEN
Net change 1951-71
C~ Gain *0 Loss
Central ptaces 1971
®o 0 3a
0 4a
@ b
0 c
U
s ' J S x scale of main map
• O* C~ 0
• 0 Patrick •
Paisley ° ~ - ~ GLASG°w
C* e + o 0
S h a w l a n d s ~ @ -o
C*
C~ -o@ C~
0
DUNDEE
-Q
GLASGOW
-o -o ~ -o ~'''
A~ /" o ', • -o ~ 2""
f / , " i~
~/ r "/ "0 f ° r ~ ,- / Dumfries ( ~ ~ - ' S
" ® 4
////"/ 50 IOOKm
Fig. 1. Map of central places as at 1971 showing net changes 1951-71.
Dow
nloa
ded
by [
Uni
vers
ity o
f A
rizo
na]
at 1
8:00
02
July
201
4
The Changing Urban Hierarchy in Scotland 343
describable as the Central Highlands, with limbs extending from its main axis (Kirkcaldy-Glenrothes-Perth-Inverness) to as far afield as Portree in Skye and Inverurie in central Aberdeenshire, though whether meaningfully associated is doubtful in the absence of economic data of other kinds, such as the development of tourism and new industry, on a comparable basis. Glenrothes was the only impressive centre of growth in this huge area, though there remained much scope for further improvement, as has been demonstrated by the more recent develop- ment of the K ingdom Centre and the selection of the new town as the adminis- trative centre of Fife in 1974 by a small majority of votes over the principal service centre in the new Region, Kirkcaldy. This may have far-reaching effects on the long- term development of the hierarchy in Fife.
Apart from isolated instances yet to be mentioned, the only remaining area of growth was in and around Edinburgh. Here there was a modest net increase of facilities in the city centre, not accompanied by any real growth in special shopping facilities prior to 1971; in fact all three constituent shopping areas showed a loss of employment in Special shopping (as defined in SMITH, 1968, p. 4) over the period 1961-71. The St.James Centre will now have given a substantial push in favour of the Princes Street shopping area--but in national terms this is all part o f the Edinburgh city centre and lies within 1"78 km of a central point near the Bank of Scotland head office. Farther out, the distinct Leith centre rather surprisingly perhaps showed a marked degree of growth in special shopping, confirmed by a
n e t gain in certain facilities. Corstorphine, close to what was at the time the access to Edinburgh Airport, and Musselburgh strategically located on the eastern fringe of the city, also gained some facilities. However the Gorgie-Dalry and Portobello centres, closer to the city centre in each case, showed no growth and thereby paralleled the Glasgow situation to some extent. Nowhere else in the vicinity demonstrated any net improvement in the overall range of facilities available, but this was prior to the opening of new centres in Livingston N e w T o w n and Wester Hailes, both on the west of the city.
Before turning to the areas of general decline, most of which were on the periphery of Scotland, there are some interesting trends in southern Scotland where Stranraer and Ayr were consolidating their positions as the leading centres of the west and Dumfries and Hawick of the east, in a sprawling area of hills
and moors with an agricultural fringe within which the smaller places such as Moffat, and particularly Castle Douglas, have been failing to retain facilities. Stranraer, which is the port for Northern Ireland, has shown growth on a number of counts, and Ayr with impressive shopping developments and Irvine in its phase of vigorous pre-new town expansion have seemingly depressed such other centres as Kilmarnock, Girvan and Ardrossan.
In the rest o f Scotland some decline has been general. Slight in most areas, there was however a depressingly high degree o f loss of facilities in such small towns as Peebles (two- thirds of all the categories studied in decline), Galashiels, Arbroath and Tain, as well as in the city of Aberdeen itself. O f course this was before the oil-related developments began. But almost every centre between Aberdeen and Inverness except Inverurie and Huntly showed an appreciable loss. In the Borders and East Lothian north-east of a line from Hawick to Musselburgh every centre de- clined, and the same was true of Strathmore. Only along the fashionable golfing coast from Broughty Ferry through the new small centre of Barnhill to Carnoustie was there net growth.
Right in the heart of Scotland was a substantial area of net loss of facilities, including the ancient capital, Dunfermline, the coalfield area of mid Fife, East Fife, and a rural area extending into Perthshire as far as Crieff. Dunfermline, with an extraordinarily congested and steeply-sloping central area not so far redeveloped except for such individual shops as an important Woolworth 's , was the most striking instance of decline up to 1971. Since then, with the opening of an ASDA superstore 2 km east o f the centre, allocated to the Halbeath centre for purposes of analysis but known to draw custom from as far afield as Kirkcaldy and Polmont, there may have been some interesting changes set in train.
North of Dunoon, which held its own during the period, the West coast has shown a general decline. This was striking in Oban, but more so in Rothesay. This though south of Dunoon is both more remote from the power centre of Strathclyde and also suffering from a loss in the once-popular cruising trade of the Clyde steamers, now a mere shadow of its former self. Relying as it does on ferry services for its sole access, and almost devoid of industry, Rothesay's facilities have shrunk very noticeably despite an impressive new ferry terminal and a growth in the accom- panied car traffic on the two ferries.
Centres which enjoy air travel facilities,
Dow
nloa
ded
by [
Uni
vers
ity o
f A
rizo
na]
at 1
8:00
02
July
201
4
344 R. D. P. Smith
particularly C a m p b e l t o w n and S to rnoway , have suffered less and in the far f iorth bo th Lerwick and Wick showed slight gains, even though the main popula t ion g r o w t h was at Thurso . Hav ing no airport , and wi th expan- sion based on the D o u n r e a y nuclear station alone, Thur so gained a little retail t rade but its o ther facilities showed no net g r o w t h in numbers or status so far as the survey could indicate. In O r k n e y , where popula t ion de- cline was severe at 1 % per year dur ing the period, Kirkwal l lost g round in spite o f its nearby airport .
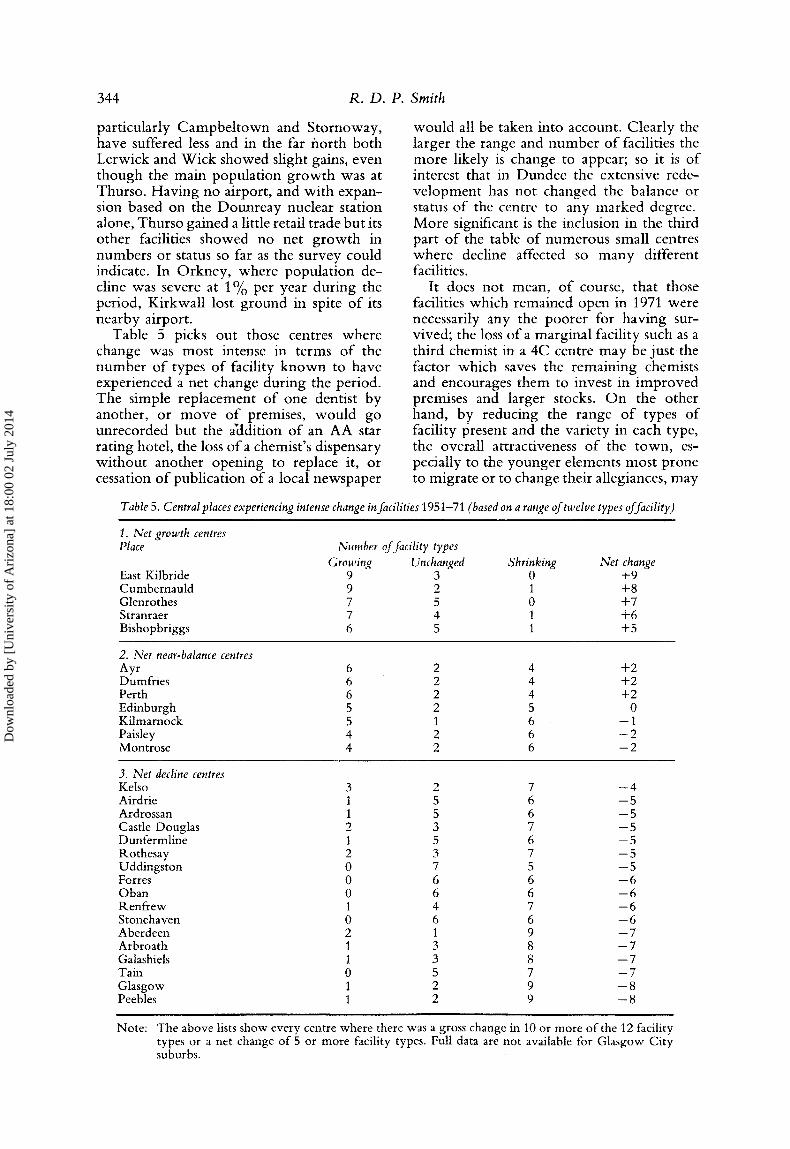
Table 5 picks out those centres where change was most intense in terms o f the n u m b e r o f types o f facility k n o w n to have exper ienced a net change dur ing the period. The simple replacement o f one dentist by another , or m o v e o f premises, wou ld go unrecorded but the addit ion o f an AA star rat ing hotel , the loss o f a chemist 's dispensary w i thou t ano ther opening to replace it, o r cessation o f publicat ion o f a local newspaper
wou ld all be taken into account . Clear ly the larger the range and n u m b e r o f facilities the m o r e likely is change to appear; so it is o f interest that in Dundee the extensive rede- ve lopmen t has no t changed the balance or status o f the centre to any marked degree. M o r e significant is the inclusion in the third part o f the table o f numerous small centres where decline affected so m a n y different facilities.
It does no t mean, o f course, that those facilities which remained open in 1971 were necessarily any the poore r for having sur- vived; the loss o f a marginal facility such as a third chemist in a 4C centre may be just the factor which saves the remain ing chemists and encourages t hem to invest in i m p r o v e d premises and larger stocks. O n the other hand, by reducing the range o f types o f facility present and the var ie ty in each type, the overall attractiveness o f the town , es- pecially to the y o u n g e r elements mos t p rone to migrate or to change their allegiances, may
Table 5. Central places experiencing intense change in facilities 1951-71 (based on a range of twelve types o f facility)
I. Net growth centres Place Number of facility types
Growing U n c h a n g e d Shrinking Net change East Kilbride 9 3 0 +9 Cumbernauld 9 2 1 +8 Glenrothes 7 5 0 +7 Stranraer 7 4 1 +6 Bishopbriggs 6 5 1 +5
2. Net near-balance centres Ayr 6 2 4 +2 Dumfries 6 2 4 +2 Perth 6 2 4 +2 Edinburgh 5 2 5 0 Kitmarnock 5 t 6 -- 1 Paisley 4 2 6 -- 2 Montrose 4 2 6 -- 2
3. Net decline centres Kelso 3 2 7 -- 4 Airdrie 1 5 6 -- 5 Ardrossan 1 5 6 -- 5 Castle Douglas 2 3 7 -- 5 Dunfermline I 5 6 -- 5 Rothesay 2 3 7 -- 5 Uddingston 0 7 5 -- 5 Fortes 0 6 6 -- 6 Oban 0 6 6 - 6 Renfrew 1 4 7 -- 6 Stonehaven 0 6 6 -- 6 Aberdeen 2 1 9 --7 Arbroath 1 3 8 -- 7 Galashiels 1 3 8 -- 7 Tain 0 5 7 -- 7 Glasgow 1 2 9 -- 8 Peebles t 2 9 -- 8
Note: The above lists show every centre where there was types or a net change of 5 or more facility types. suburbs.
a gross change in 10 or more of the 12 facility Full data are not available for Glasgow City
Dow
nloa
ded
by [
Uni
vers
ity o
f A
rizo
na]
at 1
8:00
02
July
201
4
The Changing Urban Hierarchy in Scotland 345
eventually be very much reduced. Whether this sort of change is caused by already falling patronage such as resuks from the secular decrease in the farm labour force, or f rom failure in a particular town to stock m o d e m goods, show popular films, report local events attractively, or fill teeth sensitively, must be hard if not impossible to determine. Certainly over the years, falling patronage has been usually blamed by cinema managements when closing down; and there is clearly little that a local cinema could do to combat colour T.V. on a snell night in February.
Correlations between changes in population and facilities
In an attempt to test the relationships between population changes and gain or loss in facilities, the former were divided into three spatial categories--within the centre itself; within an area having an average radius of some 21km and comprising as far as possible a compact and reasonably well-defined unit; and within the appropriate new local govern- ment region. Changes during the 1951-71 period were divided into percentage bands, seven for the settlement, five for the area and three for the region. Thus for settlements rapid, appreciable or slight growth or decline in total population, or near-stability, could be correlated with growth or decline in any or all facilities; while the area and region codes would enable hinterland population changes to be monitored for each settlement. The larger the areal unit, of course, the lower the range of percentage changes. Changes in relative prosperity of a local population could not, unforttmately, be measured.
A first attempt using the coefficient o f association (Q) was made for all centres in each population category. Where settlement population had increased tenfold or more (the three new towns of East Kilbride, Cumbernauld and Glenrothes), there was complete association (Q=I-00) with net overall growth in facilities; but for all centres where the population rose by 30% or more the association was only 0-50. In the case of areas of population growth in excess of 7"5 % the growth of facilities in contained centres associated at only 0"17; this figure was however greater than other associations measured, so from this first crude attempt no great significance could, it seemed, be at- tached to population increases as instruments in facilities growth or vice versa, unless growth was very localised and intense. This very probably reflects the take-up of spare capacity in existing facilities.
When ten tests were made of associations between decreased population and reduced facilities, six actually showed a negative result, as much in one case as minus 0-29. Only the eight centres wbdch lay in declining areas of regions declining in population showed association as high as 0-50, with area decline at 0-41 and regional decline at 0-40. The rate of decline seemed to have a quite irregular association to which little or no significance could be attached in view of the low coefficients which resulted. The con- clusion which may be drawn is that to group all facilities together is perhaps too crude a notion, and that this may be masking closely- l inked and comple te ly popula t ion- independent facilities (serving for example only tourism) under a single cloak. Before attempting this however it was felt that retailing, being similarly aggregated for all but the largest centres by the Census of Distribution, might exhibit similarly arm's- length relationships to population changes, and should therefore be examined also.
The changing importance of retail centres Earlier in this article, mention has been
made of certain of the central shopping areas as defined originally by the Board of Trade for the 1961 Census of Distribution, and of changes in persons engaged in the categories of retailing described as 'special' (SMrrH, 1968, p.4). Before studying the associations be- tween population changes and retailing changes, which covered all areas adequately only for 1961 and 1971, some mention of the changing performance of towns as a whole may be of interest, since these are independent of the definitions used in describing the centres. The latter suffer f rom the disadvan- tage that in some cases they reveal more of the layout of the town than o f its true perfor- mance as a centre when the shops in subcentres or on radial routes are also measured.
Again using persons engaged as the mea- sure, being unaffected by inflation which makes for grave difficulties in using the sales data, the whole of Scotland showed neglig- ible change from 1950 to 1961, after which a fairly rapid decline set in. Including estimates for non-response the figures for full-time employment in 'special' shopping were : - -
1950 73642 1961 74113 1971 62062
Three of the four cities followed a con- sistent pattern: Glasgow, Aberdeen and Dundee decreased slightly t o 1961 and then
) E
Dow
nloa
ded
by [
Uni
vers
ity o
f A
rizo
na]
at 1
8:00
02
July
201
4
346 R. D. P. Smith
more steeply. In Dundee the decrease was more rapid than in Scotland as a whole. For Edinburgh the trends were reversed: decline both real and relative to Scotland up to 1961, then decline but slower than the national rate. These trends are for the entire administrative areas including sub-centres. Overall they doubtless reflect the considerable changes in retailing towards self-selection and greater efficiency in the use of staff; possibly also S.E.T.
The Regional or third order centres made a much better showing, with Ayr, Kirkcaldy, Motherwell (including Wishaw) and Falkirk all improving their position both in ranking and relative to Scottish trends as a whole. Perth and to a slighter degree Paisley, showed gain followed by decline. Greenock, ranked 8th in 1950, had fallen to 15th place by 1971 though the actual amount of decline was not so alarming. Other centres relatively losing rank were Kilmarnock, Stirling, and until 1961 also Inverness and Hamilton. After 1961 these two places changed their performance completely and become the most rapidly- growing special shopping centres in Scotland, replacing Kirkcaldy which had held this distinction in the period up to 1961, before the collapse of the l inoleum industry which was its economic base at the time.
Such economic disasters obviously play a part in generating the sort of figures which concern this study, but other factors should not be ignored which have rather chancy effects; a single major shopping development, or a fire, or a change in the classification of a single large shop, can affect the data for a medium-sized town quite drastically. The effect on old labour-intensive shops of the advent o f more sophisticated forms of retailing has been clearly evident in such a centre as Stirling.
Although the format of the Census of Distribution does not facilitate such a study, it is possible by aggregating data for the larger towns and subtracting these from the total for Scotland to arrive at figures for the balance, in this case comprising the smaller towns and dispersed outlets such as gift shops in tourist centres like Falkland. The overall picture is that the twenty centres for which full data sets are available provided about ¼ of Scotland's special shopping employment. But the proportion declined from over 78°/0 in 1950 to under 740/0 by 1971. Whether these are real changes or not would depend on assessments of the reclassifications made between censuses, and of their relevance to the study in hand. It is perhaps clearer that the
share of the four cities fell f rom over 590/0 of the Scottish total in 1950 to under 530/0 by 1961 and only just over 500/0 by 1971, while the other 16 major centres for which data are available were taking a growing share: over 19°/o in 1950, nearly 21°/o in 1961 and over 230/0 in 1971. This confirms the facility-based assessment of the growth of the 3B or regional centres. In order of importance, 1971 leaders were Ayr, Paisley, Kirkcaldy, Perth, Kilmarnock and Falkirk.
Although the published data are silent on the location of growth in smaller centres and landward areas, the increase from under 220/0 to over 260/0 of the total which they achieved from 1950 to 1961 is of real interest in relation to the decline in so many other facilities in so many of the smaller towns. The only measure available for these places is for retail trade as a whole, and this cannot be used for the 1950-61 period so conveniently as for later censuses because there were no separate data for the districts and very small towns of under 2500 persons in each county area. But there are both emplgyment and shop counts, and it was decided that because of changes in shop sizes both would be used as a basis, taking the average performance as showing the trend in each part o f the country. For non-burgh centres the data for the district in which they lay were used as a proxy. Because only 1961-71 trends were used they were not strictly comparable with the longer period of 20 years of the population data, but this was unavoidable in the t ime and wi th the resources available.
Again the coefficient o f association was used to test for statistical relationships. To take only those which showed a significant association, there was full association ( Q = 1"00) between retail growth and pro- motion to the fourth order in terms of facilities; there was also association between the second-order centres and retail decline (0"67); but there was little else. There was virtually nil correlation between retail decline and general decrease in facilities (0"10). This particular conclusion commands attention, for if it is true it suggests that shopping is moving away from its close association with other urban facilities, or vice versa, and that this was happening before ou t -of - town shopping centres appeared in Scotland. A preliminary analysis of all the punched cards suggested that retail g rowth associated w i t h hotels, implying that it was tourism-related; but the data for all rural areas are not yet complete, so this should be treated with caution. It is also desirable to find a way of
Dow
nloa
ded
by [
Uni
vers
ity o
f A
rizo
na]
at 1
8:00
02
July
201
4
The Changing Urban Hierarchy in Scotland 347
utflising the sales data, and it has been suggested that changing shares of total Scotland turnover might be used. This will be done in the follow-up study. Changes in retailing relative to population changes
The relationship between retailing trends and population changes was tested in the same way as for facilities changes, i.e. against three regional population trends, five area trends and seven trend rates in localities. In no case did a regional or area population trend associate as much as 0-5 with retail growth or decline in the centres comprised in such regions or areas; but the centres were significantly responsive to extremes of loca- lised change. Where locality population grew by over 30O/o in the twenty years 1951-71, retailing increase 1961-71 showed remar- kably high association at 0.69; similarly, for decline in excess of 30O/o there was a very strong association of 0-89. The population trends, if similar throughout the period, would of course have a greater quantitative effect in the second decade, to which the retail data applied; but this was by no means guaranteed. However, between these ex- tremes the relationships were weak and in the case of slow population increase in a locality, actually inverse.
Since it was not possible to distinguish convenience goods trade for local residents from special shopping such as clothing and furniture for a wider market area, still less from tourist-generated trade in such items as tweeds or hand-carved horn goods, these results are not really either very significant or very surprising. It seems evident that a complex rather than a straightforward in- terrelationship of factors must exist. H ow else could one account for the apparent direct response of retailing to major changes in locality population while changes in a wider area have only a slight effect, whereas the opposite was true of some other facilities, which responded appreciably to regional and area changes but only slightly to even drastic changes in the population immediate ly surrounding the centre. This also raised the question as to whether a representative range of facilities has been studied, having relevant threshold populations--the inference being that the higher threshold facilities pre- dominated in those selected to measure urban status and changes in performance. Having already decided to add sub-post offices, telephone exchanges and doctors to the facilities in the subsequent study of the rural areas this fault, if it is a fault, may be partially remedied.
Foe the present article, however, it was decided that for the 162 centres identified as of at least 4C status, the relationships between each type of facility change and population change would be measured. Thirteen facility types, including Woolwor th stores, were related to the same set of population change indicators.
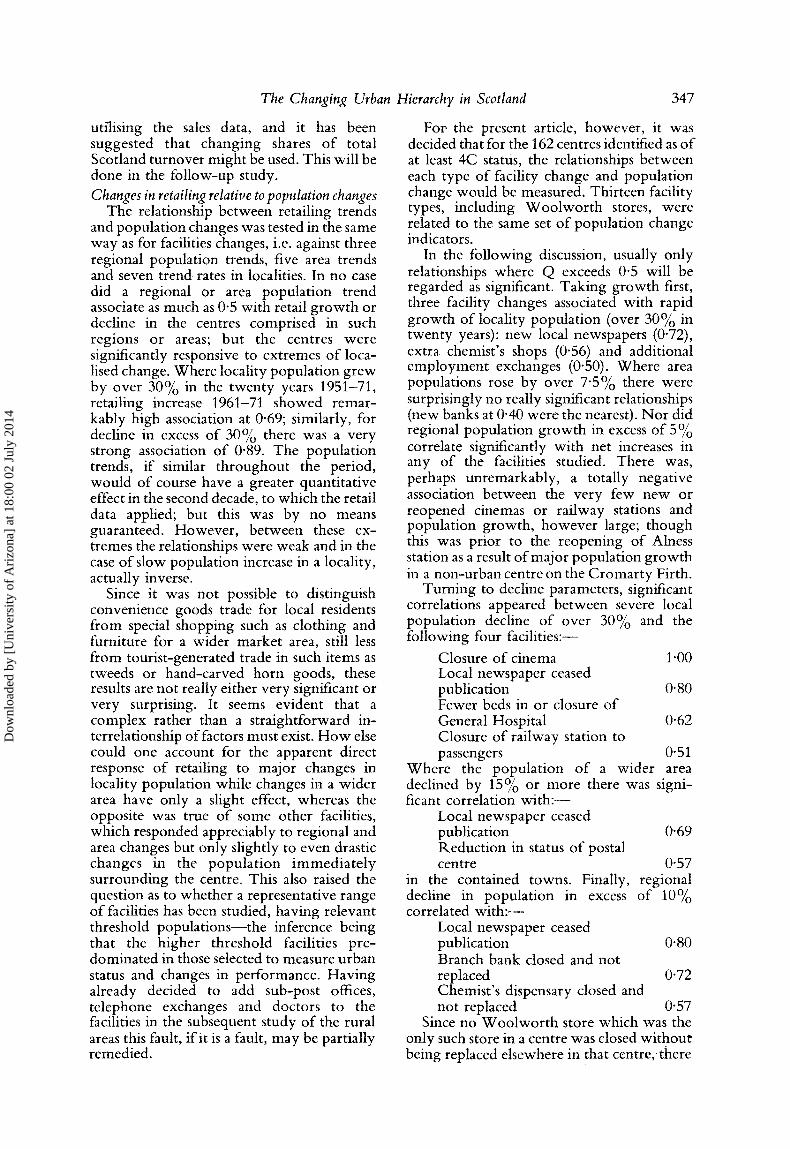
In the following discussion, usually only relationships vchere Q exceeds 0-5 will be regarded as significant. Taking growth first, three facility changes associated with rapid growth of locality population (over 30% in twenty years): new local newspapers (0"72), extra chemist's shops (0"56) and additional employment exchanges (0-50). Where area populations rose by over 7"5O/o there were surprisingly no really significant relationships (new banks at 0"40 were the nearest). Nor did regional population growth in excess of 5O/o correlate significantly with net increases in any of the facilities studied. There was, perhaps unremarkably, a totally negative association between the very few new or reopened cinemas or railway stations and population growth, however large; though this was prior to the reopening of Alness station as a result of major population growth in a non-urban centre on the Cromarty Firth.
Turning to decline parameters, significant correlations appeared between severe local population decline of over 30% and the following four facil i t ies:-
Closure of cinema 1"00 Local newspaper ceased publication 0-80 Fewer beds in or closure of General Hospital 0-62 Closure of railway station to passengers 0-51
Where the population o f a wider area declined by 15% or more there was signi- ficant correlation w i t h : -
Local newspaper ceased publication 0-69 Reduction in status of postal centre 0-57
in the contained towns. Finally, regional decline in population in excess of 10% correlated w i t h : -
Local newspaper ceased publication 0-80 Branch bank closed and not replaced 0"72 Chemist's dispensary closed and not replaced 0-57
Since no Woolwor th store which was the only such store in a centre was closed withoue being replaced elsewhere in that centre;there
Dow
nloa
ded
by [
Uni
vers
ity o
f A
rizo
na]
at 1
8:00
02
July
201
4
348 R. D. P. Smith
was no possibility of showing a correlation with population decreases. But there was no significant relationship on the growth side either.
No significant relation was found between population changes and the changes recorded m garages, hotels, dentists or solicitors. However , the greater clarity of the results from the more detailed breakdown led to the decision to study the degree of association between all changes recorded, so as to determine whether and to what extent linked growth or decline had been taking place linked spatially, that is to say, not necessarily causatively, though the latter might be inferred.
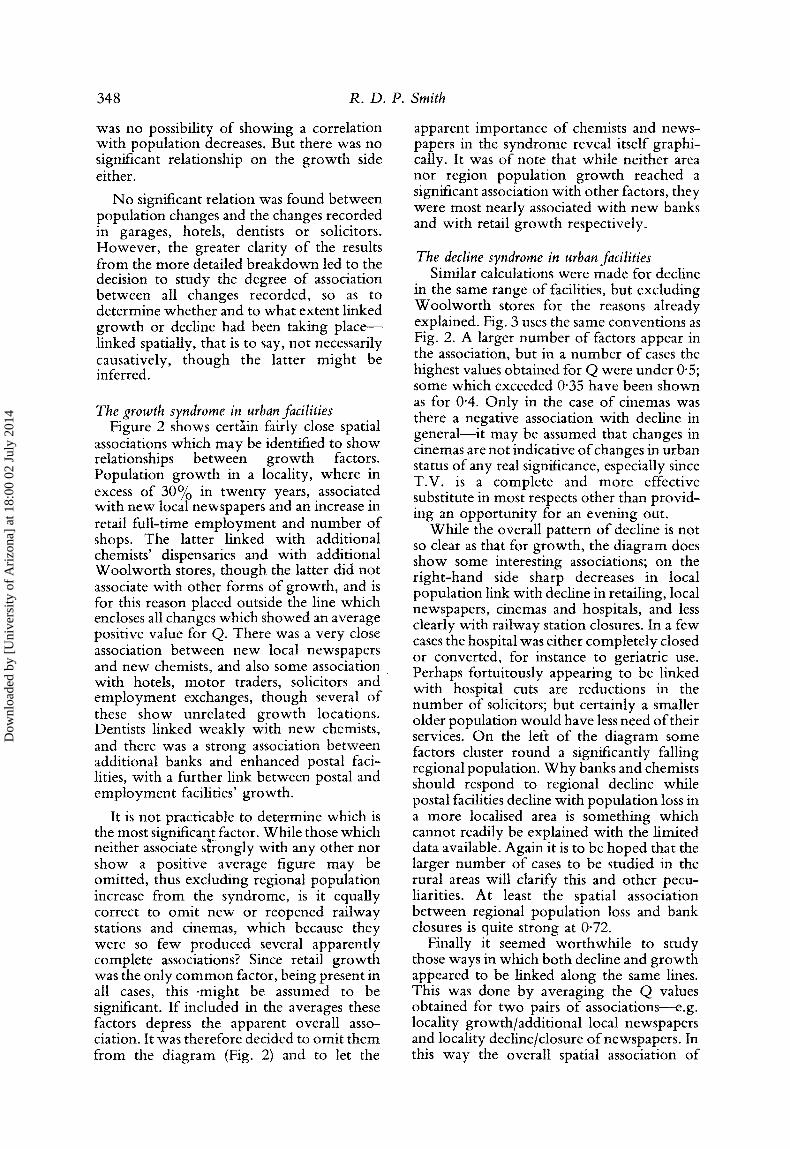
The growth syndrome in urban facilities Figure 2 shows certain fairly close spatial
associations which may be identified to show relationships between growth factors. Population growth in a locality, where in excess of 300/0 in twenty years, associated with new local newspapers and an increase in retail full-time employment and number of shops. The latter linked with additional chemists' dispensaries and with additional Woolwor th stores, though the latter did not associate with other forms of growth, and is for this reason placed outside the line which encloses all changes which showed an average positive value for Q. There was a very close association between new local newspapers and new chemists, and also some association with hotels, motor traders, solicitors and employment exchanges, though several of these show unrelated g rowth locations. Dentists linked weakly with new chemists, and there was a strong association between additional banks and enhanced postal faci- lities, with a further link between postal and employment facilities' growth.
It is not practicable to determine which is the most significantfactor. While those which neither associate strongly with any other nor show a positive average figure may be omitted, thus excluding regional population increase from the syndrome, is it equally correct to omit new or reopened railway stations and cinemas, which because they were so few produced several apparently complete associations? Since retail growth was the only common factor, being present in all cases, t h i s -migh t be assumed to be significant. If included in the averages these factors depress the apparent overall asso- ciation. It was therefore decided to omit them from the diagram (Fig. 2) and to let the
apparent importance of chemists and news- papers in the syndrome reveal itself graphi- cally. It was of note that while neither area nor region population growth reached a significant association with other factors, they were most nearly associated with new banks and with retail growth respectively.
The decline syndrome in urban facilities Similar calculations were made for decline
in the same range of facilities, but excluding Woolwor th stores for the reasons already explained. Fig. 3 uses the same conventions as Fig. 2. A larger number of factors appear in the association, but in a number of cases the highest values obtained for Q were under 0"5; some which exceeded 0-35 have been shown as for 0"4. Only in the case of cinemas was there a negative association with decline in general-- i t may be assumed that changes in cinemas are not indicative of changes in urban status of any real significance, especially since T.V. is a complete and more effective substitute in most respects other than provid- ing an opportunity for an evening out.
While the overall pattern of decline is not so clear as that for growth, the diagram does show some interesting associations; on the r ight-hand side sharp decreases in local population link with decline in retailing, local newspapers, cinemas and hospitals, and less clearly with railway station closures. In a few cases the hospital was either completely closed or converted, for instance to geriatric use. Perhaps fortuitously appearing to be linked with hospital cuts are reductions in the number of solicitors; but certainly a smaller older population would have less need of their services. On the left o f the diagram some factors cluster round a significantly falling regional population. W h y banks and chemists should respond to regional decline while postal facilities decline with population loss in a more localised area is something which cannot readily be explained with the limited data available. Again it is to be hoped that the larger number of cases to be studied in the rural areas will clarify this and other pecu- liarities. At least the spatial association between regional population loss and bank closures is quite strong at 0-72.
Finally it seemed worthwhile to study those ways in which both decline and growth appeared to be linked along the same lines. This was done by averaging the Q values obtained for two pairs of associations--e.g. locality growth/additional local newspapers and locality decline/closure of newspapers. In this way the overall spatial association of
Dow
nloa
ded
by [
Uni
vers
ity o
f A
rizo
na]
at 1
8:00
02
July
201
4
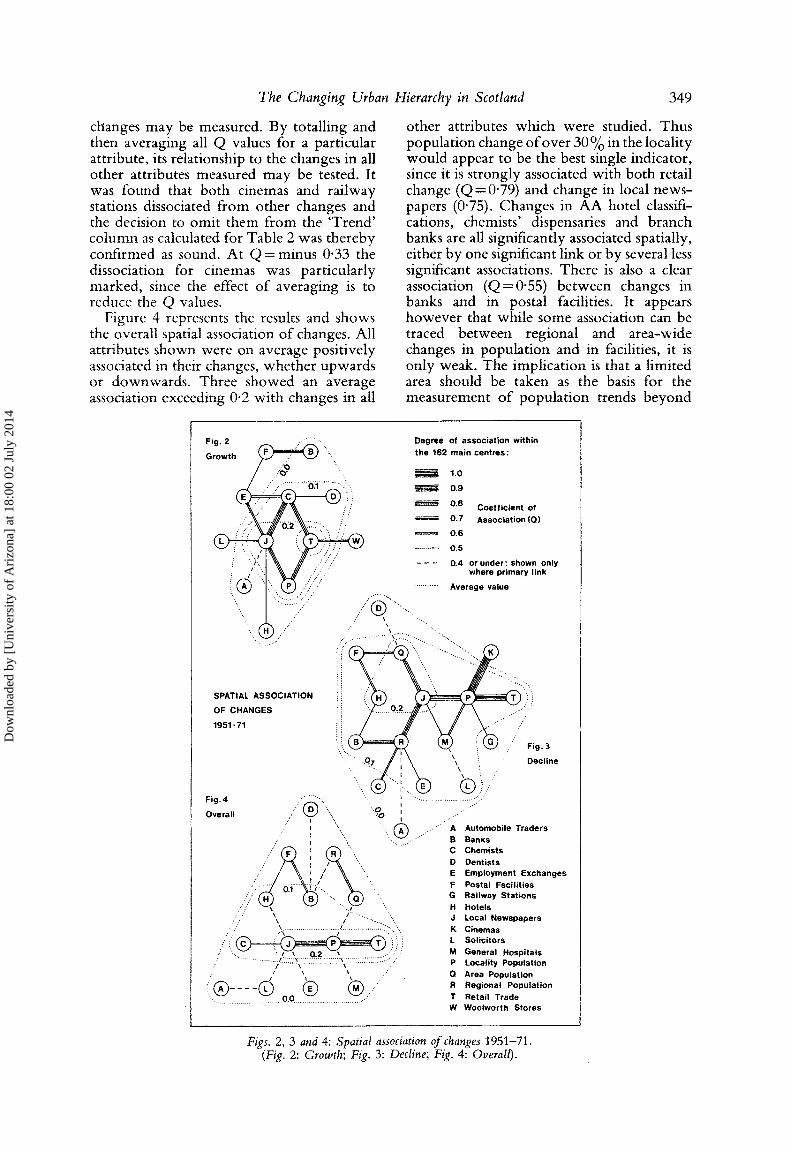
The Changing Urban Hierarchy in Scotland 349
changes may be measured. By totalling and then averaging all Q values for a particular attribute, its relationship to the changes in all other attributes measured may be tested. It was found that both cinemas and railway stations dissociated from other changes and the decision to omit them from the 'Trend' co lumn as calculated for Table 2 was thereby confirmed as sound. At Q = minus 0"33 the dissociation for cinemas was particularly marked, since the effect o f averaging is to reduce the Q values.
Figure 4 represents the results and shows the overall spatial association o f changes. All attributes shown were on average positively associated in their changes, whether upwards or downwards. Three showed an average association exceeding 0"2 with changes in all
other attributes which were studied. Thus population change o f over 30% in the locality would appear to be the best single indicator, since it is strongly associated with both retail change (Q=0"79) and change in local news- papers (0"75). Changes in AA hotel classifi- cations, chemists' dispensaries and branch banks are all significantly associated spatially, either by one significant link or by several less significant associations. There is also a clear association (Q=0-55) between changes in banks and in postal facilities. It appears however that while some association can be traced between regional and area-wide changes in population and in facilities, it is only weak. The implication is that a limited area should be taken as the basis for the measurement o f population trends beyond
Fr-_
G
• ....,,.,,
SPATIAL ASSOCIATION
OF CHANGES
1951o71
Overall / / " ' @ ""X'X ' I
,,.,.'"",4,
,..,.
Degree of association within the 162 main centres:
.. I , . . . . . . . . ." I ;,
' I 'x " I / ".
/( !i9 ,: / ...... i . . . . . . . "~ . . . . . . /
l \
1 . 0
o.g
"- 0.8 Coefficient of '- 0.7 Association (Q)
" 0.6
....... 0.5
- - - 0.4 orunder: shown only where primary link
. . . . . . . . . . . . . Average value
I , ,O ,Q i . , " "
A
c D E F G H J K L M P
. / O
R
T
W
i g . 3
ecline
i .,,,,-
Automobile Traders Banks Chemists Dentists Employment Exchanges Postal Facilities Railway Stations Hotels Local Newspapers Cinemas Solicitors General Hospitals Locality Population Area Population Regional Population Retail Trade Woolworth Stores
Figs. 2, 3 and 4: Spat ial association o f changes 1951-71, (Fig. 2: Growth; Fig. 3: Decline; Fig. 4: Overal l ) .
Dow
nloa
ded
by [
Uni
vers
ity o
f A
rizo
na]
at 1
8:00
02
July
201
4
350 R. D. P. Smith
the settlement concerned; as only 59 areas were used yet 162 centres were identified for this study, the subdivision of each area into two or more seems desirable for the next stage of the research, if more significant re- lationships are to be unearthed•
Bus service centres and central places In an article on bus centres and hinterlands
in Scotland (FLrMINC ANt) GREEN,1952) 235 centres were identified which had at least one bus or ferry service which served no larger place. The areas served were defined on a map which was later published at the scale of 1:625,000 as the 'Local Accessibility' map by the Ordnance Survey. Population data for these areas appeared in the 'Marketing Areas Handbook' (GEOGRAPHIA, 1955). The mean hinterland area was 329 km 2, giving a mean radius of 10"2km from a centre to the line of balance with adjoining centres. However , there was a less than perfect correspondence between these places and those which pos- sessed at least 4C urban facilities in 1951: of the 157 centres in the latter category only 108 were bus centres (69%) while of the 235 bus centres the majority (127 or 54%) were not the possessors of urban facilities at 4C level or better. Some were recognised by Fleming and Green as having 'virtually no facilities at a l l . . • . transhipment points rather than service centres'. At the other extreme were three very large suburban centres in Glasgow (Shawlands, Govan and Partick-Hillhead) and the important Leith centre in Edinburgh, which were not recognised as bus centres. A check on the latter showed eight corporation bus and tram routes serving Leith, all o f which in 1949 passed through the Edinburgh city centre also.
N o r were those centres which were common to both lists (bus centres which had urban facilities of 4C or better in 1951) typical of all the important urban centres. They were positively associated with slowly-growing places in a reas~of population decline. Therefore it is hardly surprising that they demonstrate an association (Q=0"41) with subsequent decline in facilities, nor that they are also slightly associated with subsequent retail growth (0"21). The latter would reflect their own modest population growth, the general fall in facilities coinciding with a reduction in their regional role. While it would not be correct therefore to interpret the data as showing that bus centres were inimical to the retention of urban facilities, it is certainly not a similar conclusion to that for Wales at which the writer arrived on still
more slender evidence (SMITH, 1970, p.95). There it was felt from the available data that those places which though small were bus centres, had fared better than those which were not. Again it is to be hoped that the future study, to cover all bus centres rather than merely those which reached a particular threshold of facilities, will clarify the issue.
S U M M A R Y
Attempting now to assess the overall pattern revealed by this study, firstly there is a strong contrast in many respects with England. So although Glasgow can in many respects be rated similar to Birmingham, Liverpool and Manchester, as the strongest central place in Scotland and the commercial heart of a compact group of central places comprising nearly half of the activity in Scotland, there is in England no centre comparable to Edinburgh, though in terms of everyday urban facilities the latter is com- parable to such English cities as Bristol and Newcastle, or to Cardiff as capital o f Wales. While Glasgow itself was tending to decline, Edinburgh was increasing its importance: but like most changes in the hierarchy in Scotland, there was little really rapid change in status, despite some fairly extreme examples of population changes.
Generally, around the declining inner areas of the Glasgow conurbation there was a doughnut-shaped area of growth in facilities; outside this and the Edinburgh area, onty a few places, mostly important regional centres such as Ayr and Inverness, showed real growth in facilities while the number of significant places was declining and the facilities of those remaining were tending to reduce.
Linkages with increase and decrease of population were demonstrated, and both growth and decline syndromes described. More work on the service pattern in the wide rural areas was shown to be necessary to a full description of the system of central places, and to ascertain for instance the location of those places which absorbed retail g rowth in the clothing, furniture and other 'special' trades which was not accountable from published figures for the twenty principal centres.
It is also hoped in future research to examine relationships between facilities and population levels with a view to establishing viability thresholds, and to describe the system of interrelationships between centres which is implicit in the concept of a hierarchy.
Dow
nloa
ded
by [
Uni
vers
ity o
f A
rizo
na]
at 1
8:00
02
July
201
4
The Changing Urban Hierarchy in Scotland 351
Acknowledgemen t s - -The writer wishes to ac- knowledge the assistance of Copeland and Chatterson Ltd. in the design of a system of analysis, of his wife Dorothy and his family for their forbearance during the long gestation of this study, and of many
individuals who have offered helpful answers to his questioning about tocal changes over the years. He is also grateful to Dr. Mark Brownrigg for comments on the draft, some of which have been incorporated in the final version of the article.
R E F E R E N C E S
ARMEN G. (1972) A classification of cities and city regions in England and Wales, 1966, Reg. Studies 6, 149-182. CARRtrrHERS W. I. (1957) A classification of service centres in England and Wales, GeographicalJ. 123, 371-389. CARatrrHERS W. I. (1967) Major shopping centres in England and Wales, 1961, Reg. Studies 1, 65-81. CARTER H. (1965) The Towns of Wales. University of Wales Press, Cardiff. DAVIES R. L. (1976) Marketing Geography with Special Reference to Retailing. R.P.A. (Books), Corbridge,
Northumberland. FrEMINGJ. B. and GREEN F. H. W. (1952) Some relations between country and town in Scotland, Scott. Geogr. Mag.
68, 2-12. GEOGRAVHIA LTD. (1955) in P. H. THORPE (Ed.) Marketing Areas Handbook. London. G~EEN F. H. W. (1950) Urban hinterlands in England and Wales: an analysis of bus services, GeographicatJ. 116,
64-88. R.OBERTSON I. M. L. (1974) Scottish population distribution: implications for locational decisions, Trans. Inst. Br.
Geogr. 49, 111-123. SCOTtiSH TELECOMMUNICATIONS BOARD (1976) Scottish Telecomn;unications, information sheet, S.T.B. Edinburgh. SMAILES A. E. (1944) The urban hierarchy in England and Wales, Geography 29, 41-51. SMrrH R. D. P. (1968) The changing urban hierarchy, Reg. Studies 2, 1-19. SMITH R. D. P. (1970) The changing urban hierarchy in Wales, Reg. Studies 4, 85-96. SMITH 1L. D. P. et al. (1971) East Anglia Regional Strategy: Preparatory Report, East Anglia Consultative Committee,
Bury St. Edmunds (unpublished). WESTAWAY J. (1974) Contact potential and the occupational structure of the British urban system 1961-1966: an
empirical study, Reg. Studies 8, 57-73.
Dow
nloa
ded
by [
Uni
vers
ity o
f A
rizo
na]
at 1
8:00
02
July
201
4
Recommended