CCEESS WWoorrkkiinngg PPaappeerrss,, IIIIII,, ((22)),, 22001111 336
THE DYNAMIC OF REGIONAL TRADE SPECIALISATION
PATTERN IN ROMANIA
Oana Ancuţa Stângaciu “Vasile Alecsandri” University of Bacău, Romania
Abstract: The paper analyses the evolution of the regional trade specialization pattern in Romanian
regions, by studying the dynamic of their comparative advantages over the period 2000 - 2009. The study finds
that, in almost all regions (exceptions are North-East and South-East Region) the international specialization
has increased for products in which regions were initially relatively less specialized and has decreased for those
in which they were initially highly specialized. Finally, most regions recorded large respectively small
specialization improvements in products for which the internal respectively external demand expanded at the
fastest rate over the time.
Keywords: FOB exports, CIF imports, Lafay index, comparative advantage, sections of the Combined
Nomenclature (CN)
JEL Classification: C10, F10, F49, O11
1. INTRODUCTION
The analysis of the regional trade specialization patterns and their adaptation to internal and
external demand primarily implied to use the econometric tools (regression and correlation) to
highlight the structural stability of specialization models, and secondly to evaluate this structural
change in terms of economic efficiency.
1.1. Database
The database, for my analysis, was provided by the National Institute of Statistics. The regional
import and export trade flows, in the period 2000-2009, are presented by sections of the
Combined Nomenclature (CN). Data are presented on sections of CN because Romania's foreign
trade statistics is made in accordance with the methodology used internationally. The imported and
exported goods have been classified, since 1994, by Combined Nomenclature (CN), which is also the
basis of the tariff customs. National Institute of Statistics is the official source for such data. Before 1

CCEESS WWoorrkkiinngg PPaappeerrss,, IIIIII,, ((22)),, 22001111 337
January 2007, when Romania joined EU, the statistical information on external good’s trade have been
collected by the National Customs Authority, the institution which collect customs declarations. Based
on their dates on establish the level of exports and imports – the Extrastat statistical system. Starting
with January 1, 2007 Intrastat system became operational, so that international trade statistics are
obtained by summing data from systems Intrastat (Intra-EU trade - data collected by INS) and Extrastat
(Extra-EU trade - data collected by the NCA).
To provide a pertinent analysis of the regional specialization, the interpretation was made first in
terms of level of technology into products of manufacturing industry and secondly in terms of factor
intensity use. To do such an analysis I built a table of correspondence between the National
Classification of Economic Activities in Romania (NACE - at division level), Classification of
products and services Activities (CPSA - at group level), CN (CN - at the chapter) - aggregation of
correspondence, between the three classifications at the division level, was made according to official
correspondence in the much higher level of detail - and the classification of industries according to
technological intensity (according to a classification UNIDO 2005) and by the factor intensity use
(as classified Neven D.J. in the study "Gain and losses from 1992" 1990).
From these data I determined the Lafay index which quantifies the degree of regional
specialization. This index represents the comparative advantage of intra-industry specialization for a
product and it is determined by multiplying the difference of normalized trade balance of the product
and the total normalized trade balance area with the proportion o f trade (export + import) of the total
regional flows. At regional level the amount of index by CN sections must be equal to zero. Positive
values for this index imply comparative advantage for a product, so there is intra- industry
specialization, and negative values indicate import dependence. A high value/low level of this index is
associated with intra-industry high/low specialization.
Where: x i = the value of exports by CN section, mi = the value of imports by CN section,
reg
= sum of index by region
)(
)(
)(
)(
)(
)(100
ii
reg
ii
ii
reg
ii
reg
ii
iii
mx
mx
mx
mx
mx
mxLF

CCEESS WWoorrkkiinngg PPaappeerrss,, IIIIII,, ((22)),, 22001111 338
1.2. Methodology
Econometric instruments used to assess the temporal stability of the comparative advantages of
specialization processes (Zaghini, 2003) implies building a regression equation where the independent
variable represents the value of the Lafay index at the beginning of the period (in 2000) and the
dependent variable represents the value of the index at the end of period (in 2009). Regression equation
is as follows:
LF2009= α + β LF2000+ ε
Where: LF2009 and LF2000 = Lafay index for 2009 and 2000
α și β = parameters of linear regression equation
ε = residual error
Interpretation of the regression analysis based on the regression parameter (β) can be made as
follows:
if β is equal to 1 the process of specialization did not change during
the analyzed period
if β is greater than 1 then in that region the degree of specialization
increased or fallen to those products where there is the advantage or disadvantage already
if β is between 0 and 1 then average specialization index remained
unchanged but increased to products where values were small and declined to products
where there were high levels
dacă β is less than zero - the processes of specialization have
changed
However, only parameter regression analysis is not sufficient to accurately determine whether
changes in the structure of the advantages / disadvantages comparison determines the modifications of
the degree of specialization. In fact, the regression parameter tells us what happens on average and does
not give us clear information about changes in the dispersion of the d istribution of comparative
advantages. To obtain such evidence I consider the following equation:
Where: VAR(LF2009) și VAR(LF2000) = variances of the independent and dependent variable
2
2
2000
2009
)(
)(
RLFVAR
LFVAR

CCEESS WWoorrkkiinngg PPaappeerrss,, IIIIII,, ((22)),, 22001111 339
R2 = coefficient of determination of the regression equation
Interpretation of results can be made from two perspectives, as follows:
In terms of the correlation coefficient (R) of the regression equation:
If the values are large and tend to 1 – there are not changed the
relative positions of the products
If the values are small and tend to 0 – there are significant changes in
distribution structure such that the structure has high mobility
In terms of the relationship between the regression parameter (β) and correlation coefficient
(R):
If they are equal (β = R) - dispersion of the distribution remains
unchanged
If the regression parameter is greater than the coefficient of
correlation (β> R) - which means that the dispersion increases the degree of
specialization has increased
If the regression parameter is smaller than the coefficient of
correlation (β <R) - dispersion decreases as a result decreases the degree of
specialization.
"Regression effect" (given by β) and "mobility effect" (given by 1-R) provides information on
changes in the distribution of comparative advantage over a period. It may be that the regression
parameter to suggest a decrease in the degree of specialization due to proportional changes toward the
average, but the overall effect should be the other way because of changes occurring in distribution
structure.
2. DYNAMIC OF REGIONAL TRADE SPECIALISATION PATTERNS
Applying to the database the previously econometric instruments I obtained the next graphical
representations (Figure 1 and 2). Thus, at the national level, as shown in Figure 1, the degree of
specialization has remained on average the same during 2000-2009, whereas the regression parameter
is between 0 and 1 (β = 0,31). Also, the regression parameter value close to zero and the mean value at
the correlation coefficient (R = 0,45), however indicates that there were significant changes in
distribution structure of comparative advantages.

CCEESS WWoorrkkiinngg PPaappeerrss,, IIIIII,, ((22)),, 22001111 340
Figure 1 - Dynamic of intra-industry specialization processes in Romania
(Corelograma of Lafay index in 2000 and 2009)
Source: own processing based on informat ion provided by NIS
Figure 2 - Corelograma of regional Lafay index by CN sections in 2000 and 2009
North - West Region
Center Region
North – East Region
South – East Region
y = 0,3092x - 0,04
R2 = 0,2
-8,0
-6,0
-4,0
-2,0
0,0
2,0
4,0
6,0
-6,0
-5,0
-4,0
-3,0
-2,0
-1,0
0,0
1,0
2,0
3,0
4,0
5,0
6,0
y = 0,1834x - 0,196
R2 = 0,1319
-8,0
-6,0
-4,0
-2,0
0,0
2,0
4,0
6,0
-7,0
-6,0
-5,0
-4,0
-3,0
-2,0
-1,0
0,0
1,0
2,0
3,0
4,0
5,0
6,0
7,0
8,0
9,0
y = 0,2871x - 0,0883
R2 = 0,3209
-8,0
-6,0
-4,0
-2,0
0,0
2,0
4,0
6,0
-15,0
-14,0
-13,0
-12,0
-11,0
-10,0
-9,0
-8,0
-7,0
-6,0
-5,0
-4,0
-3,0
-2,0
-1,0
0,0
1,0
2,0
3,0
4,0
5,0
6,0
y = 0,8748x + 0,0345
R2 = 0,7431
-8,0
-6,0
-4,0
-2,0
0,0
2,0
4,0
6,0
-6,0
-5,0
-4,0
-3,0
-2,0
-1,0
0,0
1,0
2,0
3,0
4,0
5,0
y = 0,9585x + 0,0096
R2 = 0,7851
-8,0
-6,0
-4,0
-2,0
0,0
2,0
4,0
6,0
-12
,0-1
1,0
-10
,0-9
,0-8
,0-7
,0-6
,0-5
,0-4
,0-3
,0-2
,0-1
,00
,01
,02
,03
,04
,05
,06
,07
,08
,09
,01
0,0
11
,01
2,0
13
,0

CCEESS WWoorrkkiinngg PPaappeerrss,, IIIIII,, ((22)),, 22001111 341
South Muntenia Region
Bucharest - Ilfov Region
South – West Oltenia Region
West Region
Source: own processing based on informat ion provided by NIS
Because the value of the regression parameter is less than the coefficient of correlation, I
conclude that in Romania, even if there is a slight decrease in degree of specialisation, there are
significant changes in distribution structure of comparative advantages whereas the effect of mobility
outweigh the effect of regression. This means that Romania has specialised in sectors where the initial
phase was less specialised and despecialised in sectors where the initially was highly specialised.
Since by regions the dynamic of degree of specialisation is different, further, I analyze this
phenomenon in each region, based on information provided by Figure 2.
North-West Region
In this region the degree of specialization has remained on average the same during 2000-2009,
whereas the regression parameter is between 0 and 1 (β = 0,18). Also, the small value of parameter
regression (close to zero) and the small value of the coefficient of correlation (R = 0,36), indicate that
there were significant changes in the structure of comparative advantages.
Because of the regression parameter is less than the coefficient of correlation, I conclude that in
this region even if there is a slight decrease of specialization are, however, significant changes in
y = -0,2584x - 0,0511
R2 = 0,0113
-8,0
-6,0
-4,0
-2,0
0,0
2,0
4,0
6,0
-5,0
-4,0
-3,0
-2,0
-1,0
0,0
1,0
2,0
3,0
4,0
y = 0,0617x + 0,0236
R2 = 0,0131-8,0
-6,0
-4,0
-2,0
0,0
2,0
4,0
6,0
-8,0
-7,0
-6,0
-5,0
-4,0
-3,0
-2,0
-1,0
0,0
1,0
2,0
3,0
4,0
5,0
6,0
7,0
y = 0,5112x + 0,007
R2 = 0,5056
-8,0
-6,0
-4,0
-2,0
0,0
2,0
4,0
6,0
-10
,0-9
,0-8
,0-7
,0-6
,0-5
,0-4
,0-3
,0-2
,0-1
,00
,01
,02
,03
,04
,05
,06
,07
,08
,09
,01
0,0
11
,01
2,0
13
,01
4,0
15
,0
y = 0,3875x - 0,1245
R2 = 0,157
-8,0
-6,0
-4,0
-2,0
0,0
2,0
4,0
6,0
-3,0
-2,0
-1,0
0,0
1,0
2,0
3,0
4,0
5,0
6,0
7,0

CCEESS WWoorrkkiinngg PPaappeerrss,, IIIIII,, ((22)),, 22001111 342
distribution structure of comparative advantages whereas the effect of mobility outweigh the effect of
regression. This means, that the region has specialized in sectors where it was less specialized and
despecialized in the sectors where it was highly specialized.
Center Region
In this region the degree of specialization has remained on average the same during 2000-2009,
whereas the regression parameter is between 0 and 1 (β = 0,29). Also, the small value of parameter
regression (close to zero) and the small value of the coefficient of correlation (R = 0,57), indicate that
there were significant changes in the structure of comparative advantages.
Because of the regression parameter is less than the coefficient of correlation, I conclude that in
this region even if there is a slight decrease of specialization are, however, significant changes in
distribution structure of comparative advantages whereas the effect of mobility outweigh the effect of
regression. This means, that the region has specialized in sectors where it was less specialized and
despecialized in the sectors where it was highly specialized.
North-East Region
In this region the degree of specialization has remained the same during 2000-2009, whereas the
regression parameter is between 0 and 1 (β = 0,87). Also, the high values of parameter regression
(close to 1) and the coefficient of correlation (R = 0,86), indicate that there were no significant changes
in the structure of comparative advantages.
Because of the regression parameter is greater than the coefficient of correlation, I conclude that
in this region there is a slight increase of specialization and no, significant changes in distribution
structure of comparative advantages. This means, that the region has specialized in sectors where it
was highly specialized and despecialized in the sectors where it was less specialized.
South-East Region
In this region the degree of specialization has remained the same during 2000-2009, whereas the
regression parameter is between 0 and 1 (β = 0,96). Also, the high values of parameter regression
(close to 1) and the coefficient of correlation (R = 0,89), indicate that there were no significant changes
in the structure of comparative advantages.
Because of the regression parameter is greater than the coefficient of correlation, I conclude that
in this region there is a slight increase of specialization and no, significant changes in distribution
structure of comparative advantages. This means, that the region has specialized in sectors where it
was highly specialized and despecialized in the sectors where it was less specialized..
CCEESS WWoorrkkiinngg PPaappeerrss,, IIIIII,, ((22)),, 22001111 343
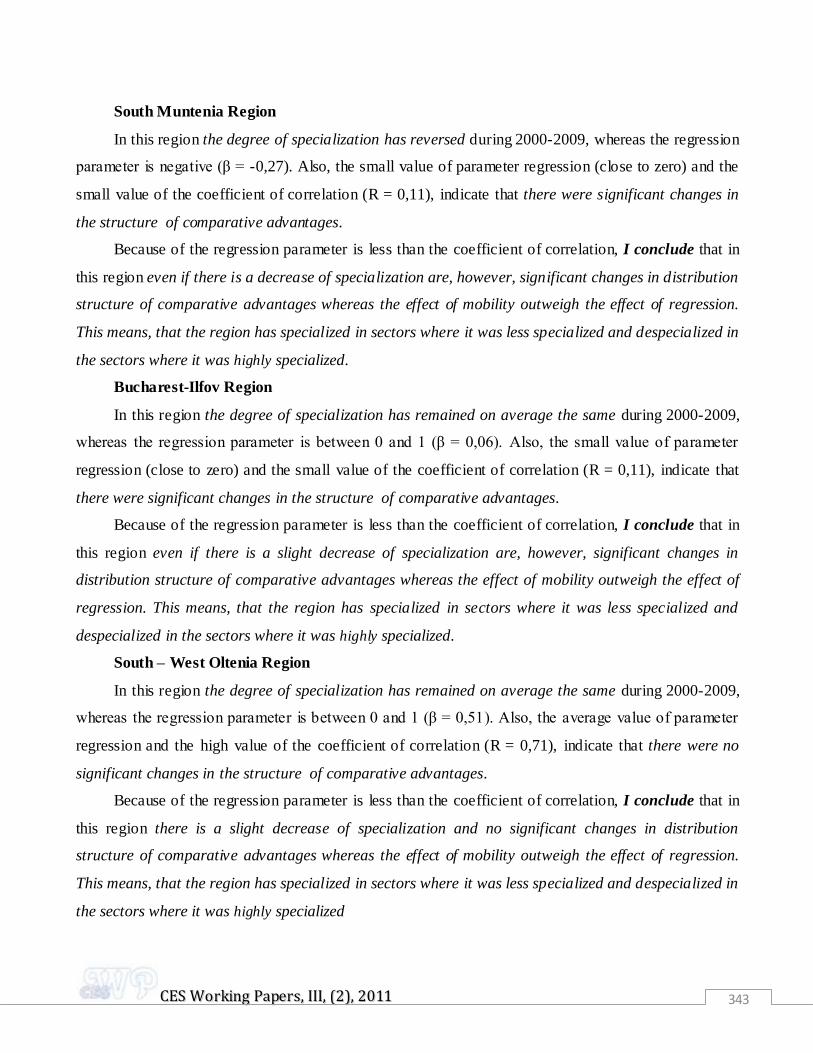
South Muntenia Region
In this region the degree of specialization has reversed during 2000-2009, whereas the regression
parameter is negative (β = -0,27). Also, the small value of parameter regression (close to zero) and the
small value of the coefficient of correlation (R = 0,11), indicate that there were significant changes in
the structure of comparative advantages.
Because of the regression parameter is less than the coefficient of correlation, I conclude that in
this region even if there is a decrease of specialization are, however, significant changes in distribution
structure of comparative advantages whereas the effect of mobility outweigh the effect of regression.
This means, that the region has specialized in sectors where it was less specialized and despecialized in
the sectors where it was highly specialized.
Bucharest-Ilfov Region
In this region the degree of specialization has remained on average the same during 2000-2009,
whereas the regression parameter is between 0 and 1 (β = 0,06). Also, the small value of parameter
regression (close to zero) and the small value of the coefficient of correlation (R = 0,11), indicate that
there were significant changes in the structure of comparative advantages.
Because of the regression parameter is less than the coefficient of correlation, I conclude that in
this region even if there is a slight decrease of specialization are, however, significant changes in
distribution structure of comparative advantages whereas the effect of mobility outweigh the effect of
regression. This means, that the region has specialized in sectors where it was less specialized and
despecialized in the sectors where it was highly specialized.
South – West Oltenia Region
In this region the degree of specialization has remained on average the same during 2000-2009,
whereas the regression parameter is between 0 and 1 (β = 0,51). Also, the average value of parameter
regression and the high value of the coefficient of correlation (R = 0,71), indicate that there were no
significant changes in the structure of comparative advantages.
Because of the regression parameter is less than the coefficient of correlation, I conclude that in
this region there is a slight decrease of specialization and no significant changes in distribution
structure of comparative advantages whereas the effect of mobility outweigh the effect of regression.
This means, that the region has specialized in sectors where it was less specialized and despecialized in
the sectors where it was highly specialized
CCEESS WWoorrkkiinngg PPaappeerrss,, IIIIII,, ((22)),, 22001111 344
West Region
In this region the degree of specialization has remained on average the same during 2000-2009,
whereas the regression parameter is between 0 and 1 (β = 0,39). Also, the small value of parameter
regression and the average value of the coefficient of correlation (R = 0,40), indicate that there were
significant changes in the structure of comparative advantages.
Because of the regression parameter is less than the coefficient of correlation, I conclude that in
this region even if there is a slight decrease of specialization are, however, significant changes in
distribution structure of comparative advantages whereas the effect of mobility outweigh the effect of
regression. This means, that the region has specialized in sectors where it was less specialized and
despecialized in the sectors where it was highly specialized.
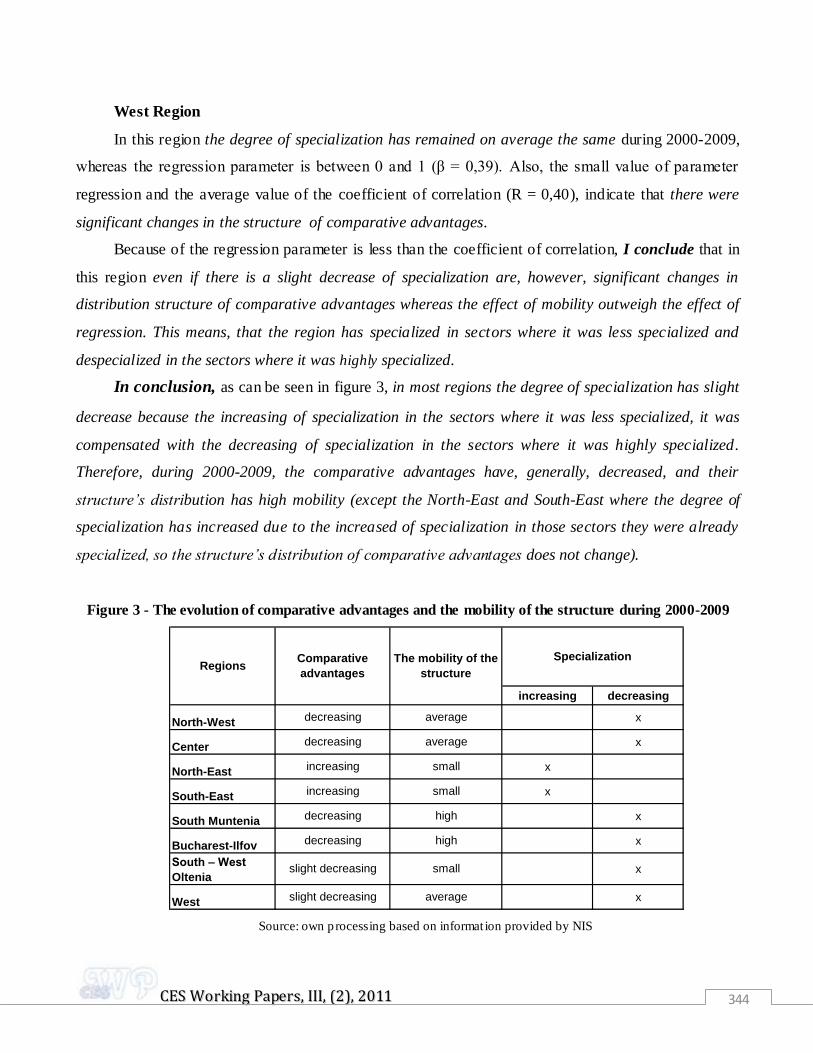
In conclusion, as can be seen in figure 3, in most regions the degree of specialization has slight
decrease because the increasing of specialization in the sectors where it was less specialized, it was
compensated with the decreasing of specialization in the sectors where it was highly specialized.
Therefore, during 2000-2009, the comparative advantages have, generally, decreased, and their
structure’s distribution has high mobility (except the North-East and South-East where the degree of
specialization has increased due to the increased of specialization in those sectors they were already
specialized, so the structure’s distribution of comparative advantages does not change).
Figure 3 - The evolution of comparative advantages and the mobility of the structure during 2000-2009
increasing decreasing
North-West x
Center x
North-East x
South-East x
South Muntenia x
Bucharest-Ilfov x
South – West
Oltenia x
West x
high
high
Specialization Regions
decreasing
decreasing
Comparative
advantages
The mobility of the
structure
average
average
small
average
slight decreasing
slight decreasing
small
small
increasing
increasing
decreasing
decreasing
Source: own processing based on informat ion provided by NIS

CCEESS WWoorrkkiinngg PPaappeerrss,, IIIIII,, ((22)),, 22001111 345
3. ADAPTING REGIONAL SPECIALIZATION TO THE DEMAND
The results of previous analysis - the temporal stability of the comparative advantage’s structure -
has revealed that the regional specialization processes have changed over the period 2000-2009,
whereas the degree of mobility is relatively high.
To assess if these changes represent the adjustment of productive structures to the dynamic of
demand, I propose, further, to build a model of specialization in which the cumulative curves of Lafay
indexes, depending on demand, from 2000 and 2009 are compared (Zaghini A., 2003).
Since, by definition the sum of the Lafay index by sections is zero, the cumulative curve will
begin at the positive or negative value corresponding to the first section with the lowest dynamic and
finish at zero by adding a positive or negative value associated to the section with the highest dynamic
of the demand.
To build the plot, I put on OX axis the CN sections ordered ascending by the demand dynamics
and on the OY axis the cumulative value Lafay index.
The cumulative curves of Lafay indexes will increase at the sections where comparative
advantages exist and decrease where there are disadvantages.
A regional specialization model can be considered efficient if that region gain comparative
advantages of the products whose market demand is growing since it involves strengthening the
position of the regional economy on the international market.
In conclusion, a reduction of comparative advantages (or an increase of comparative
disadvantage) to the products with low dynamic of the demand can be interpreted as a positive trend of
development of regional economy, and vice versa, a reduction of the comparative advantages (or an
increase of comparative disadvantage) to the products with high dynamics demand can be considered a
negative development of regional economy. Every economy should have flexible and competitive
production structures that would increase the comparative advantages of those products where demand
is growing faster.
3.1. The specialisation models in terms of internal demand
To build this model I ranked first in ascending order all CN sections according to the dynamic of
the internal demand expressed by regional imports (2009 compared to 2000). Then, I determined the

CCEESS WWoorrkkiinngg PPaappeerrss,, IIIIII,, ((22)),, 22001111 346
values of the Lafay cumulative curve by summing, adding position with position indices calculated at
the section.
Figure 4 - The specialisation model in Romania betwen 2000-2009
(in terms of internal demand)
Source: own processing based on informat ion provided by NIS
As can be seen in Figure 4, the dynamic of specialization patterns in Romania in terms of internal
demand (imports) has the following trends:
for products with relatively constant or changed slightly demand (small
dynamic) the comparative advantages has decrease in 2009 compared to 2000
for products with avarage demand dynamics the comparative disadvantages has
recorded a fall in 2009 compared to 2000
for products with growing demand the comparative disadvantage has decrease
in 2009 compared to 2000 (except for means of transport where disadvantages turns to the
comparative advantages)
In conclusion, in Romania the changes in the specialization model for products with small
and average internal demand dynamics (the decreasing/increasing of comparative advantages/
disadvantages at the products where it is a small or avarage demand dynamics) are "efficient" for the
national economy. I can not say the same thing about changes in the specialisation model, for goods
where there was a high dynamic. Thus, rather to decreas the small comparative disadvantages from
2000, those have increasing further in 2009. This is a sign that Romania's productive structures were
-6,0
-4,0
-2,0
0,0
2,0
4,0
Good
s n
on
-inc
luded
Tex
tile
s
Raw
hid
es
and
skin
s
Opti
cal i
ns
tru
ments
Footw
ear
Min
era
l pro
du
cts
Pap
er
ans
pap
erb
oa
rd
Pre
pare
d f
ood
stu
ffs
Ele
ctr
ical a
pp
lianc
es
Mis
cella
ne
ous
art
icle
s
Art
icle
s o
f sto
ne
Veg
eta
ble
pro
du
cts
Chem
ical p
rodu
cts
Bas
e m
eta
ls
Pla
stics a
rtic
les
Art
icle
s o
f w
ood
Fats
and
oils
Veh
icle
s
Liv
e a
nim
als
2000
2009
CCEESS WWoorrkkiinngg PPaappeerrss,, IIIIII,, ((22)),, 22001111 347
not competitive and flexible enough, compared to those from abroad, to satisfy an increasingly higher
internal demand and „other countries" have satisfied the excess demand.
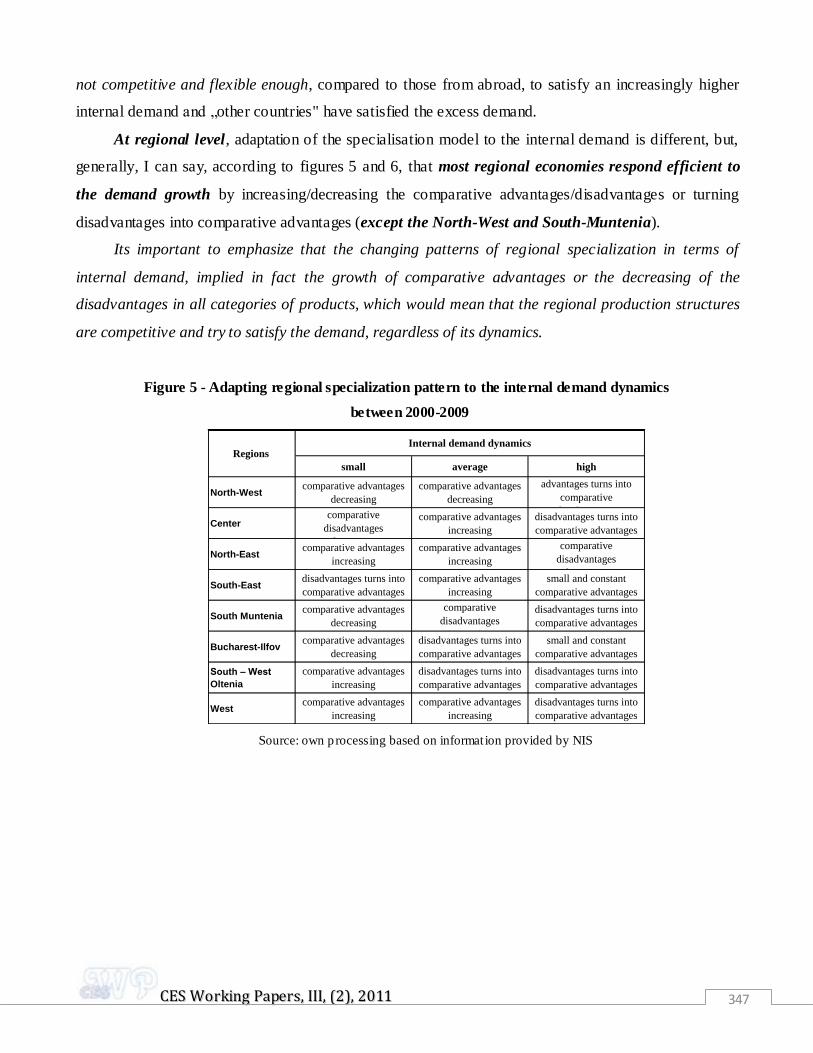
At regional level, adaptation of the specialisation model to the internal demand is different, but,
generally, I can say, according to figures 5 and 6, that most regional economies respond efficient to
the demand growth by increasing/decreasing the comparative advantages/disadvantages or turning
disadvantages into comparative advantages (except the North-West and South-Muntenia).
Its important to emphasize that the changing patterns of regional specialization in terms of
internal demand, implied in fact the growth of comparative advantages or the decreasing of the
disadvantages in all categories of products, which would mean that the regional production structures
are competitive and try to satisfy the demand, regardless of its dynamics.
Figure 5 - Adapting regional specialization pattern to the internal demand dynamics
between 2000-2009
small average high
North-West comparative advantages
decreasing
comparative advantages
decreasing
advantages turns into
comparative
disadvantages
Center comparative
disadvantages
decreasing
comparative advantages
increasing
disadvantages turns into
comparative advantages
North-East comparative advantages
increasing
comparative advantages
increasing
comparative
disadvantages
decreasing
South-East disadvantages turns into
comparative advantages
comparative advantages
increasing
small and constant
comparative advantages
South Muntenia comparative advantages
decreasing
comparative
disadvantages
increasing
disadvantages turns into
comparative advantages
Bucharest-Ilfov comparative advantages
decreasing
disadvantages turns into
comparative advantages
small and constant
comparative advantages
South – West
Oltenia
comparative advantages
increasing
disadvantages turns into
comparative advantages
disadvantages turns into
comparative advantages
Westcomparative advantages
increasing
comparative advantages
increasing
disadvantages turns into
comparative advantages
Regions Internal demand dynamics
Source: own processing based on informat ion provided by NIS

CCEESS WWoorrkkiinngg PPaappeerrss,, IIIIII,, ((22)),, 22001111 348
Figure 6 - The regional specialization model in terms of internal demand, between 2000-2009
North - West Region
Center Region
North – East Region
South – East Region
South Muntenia Region
Bucharest - Ilfov Region
-4,0
-2,0
0,0
2,0
4,0
6,0
8,0
10,0
12,0
Goo
ds n
on-in
clud
ed
Tex
tiles
Raw
hid
es a
nd s
kins
Foo
twea
r
Pre
pare
d fo
odst
uffs
Mis
cella
neou
s ar
ticle
s
Pap
er a
ns p
aper
boar
d
Veg
etab
le p
rodu
cts
Opt
ical
inst
rum
ents
Pla
stic
s ar
ticle
s
Che
mic
al p
rodu
cts
Bas
e m
etal
s
Art
icle
s of
sto
ne
Art
icle
s of
woo
d
Min
eral
pro
duct
s
Fat
s an
d oi
ls
Veh
icle
s
Live
ani
mal
s
Ele
ctric
al a
pplia
nces
-13,0-11,0-9,0-7,0-5,0-3,0-1,01,03,05,07,0
Goo
ds n
on-in
clud
ed
Min
eral
pro
duct
s
Foo
twea
r
Fat
s an
d oi
ls
Raw
hid
es an
d sk
ins
Tex
tiles
Mis
cel
lane
ous
artic
les
Art
icle
s of
sto
ne
Art
icle
s of
woo
d
Opt
ical
inst
rum
ents
Veg
etab
le p
rodu
cts
Pape
r an
s pa
perb
oard
Che
mic
al
prod
ucts
Pla
stic
s a
rtic
les
Ele
ctrica
l ap
plia
nces
Veh
icle
s
Base
meta
ls
Pre
pare
d fo
odst
uffs
Live
ani
mals
-8,0
-6,0
-4,0
-2,0
0,0
2,0
4,0
6,0
8,0
Goods n
on-inclu
ded
Raw
hid
es and s
kin
s
Footw
ear
Fats
and o
ils
Pre
pare
d f
oodstu
ffs
Textile
s
Chem
ical
pro
ducts
Vegeta
ble
pro
ducts
Min
era
l pro
ducts
Paper
ans p
aperb
oard
Mis
cella
neous
art
icle
s
Pla
stics a
rtic
les
Ele
ctr
ical applia
nces
Base m
eta
ls
Optical in
str
um
ents
Art
icle
s o
f sto
ne
Vehic
les
Art
icle
s o
f w
ood
Liv
e a
nim
als
-3,0-1,01,03,05,07,09,0
11,013,015,017,019,021,023,0
Goo
ds n
on-in
clud
ed
Tex
tiles
Pap
er a
ns p
aper
boar
d
Opt
ical
inst
rum
ents
Veh
icle
s
Mis
cella
neou
s ar
ticle
s
Live
ani
mal
s
Raw
hid
es a
nd s
kins
Bas
e m
etal
s
Pla
stic
s ar
ticle
s
Foo
twea
r
Pre
pare
d fo
odst
uffs
Ele
ctric
al a
pplia
nces
Art
icle
s of
woo
d
Art
icle
s of
sto
ne
Min
eral
pro
duct
s
Che
mic
al p
rodu
cts
Veg
etab
le p
rodu
cts
Fat
s an
d oi
ls
-9,0
-7,0
-5,0
-3,0
-1,0
1,0
3,0
5,0
7,0
Goods n
on-inclu
ded
Footw
ear
Textile
s
Pre
pare
d f
oodstu
ffs
Fats
and o
ils
Chem
ical
pro
ducts
Base m
eta
ls
Raw
hid
es and s
kin
s
Paper
ans p
aperb
oard
Optical in
str
um
ents
Art
icle
s o
f sto
ne
Vegeta
ble
pro
ducts
Pla
stics a
rtic
les
Ele
ctr
ical applia
nces
Mis
cella
neous
art
icle
s
Art
icle
s o
f w
ood
Vehic
les
Liv
e a
nim
als
Min
era
l pro
ducts
-7,0
-5,0
-3,0
-1,0
1,0
3,0
5,0
7,0
Goo
ds n
on-in
clud
ed
Min
eral
pro
duct
s
Tex
tiles
Raw
hid
es a
nd s
kins
Opt
ical
inst
rum
ents
Foo
twea
r
Ele
ctric
al a
pplia
nces
Pap
er a
ns p
aper
boar
d
Pre
pare
d fo
odst
uffs
Art
icle
s of
sto
ne
Veg
etab
le p
rodu
cts
Mis
cella
neou
s ar
ticle
s
Bas
e m
etal
s
Che
mic
al p
rodu
cts
Pla
stic
s ar
ticle
s
Art
icle
s of
woo
d
Fat
s an
d oi
ls
Veh
icle
s
Live
ani
mal
s

CCEESS WWoorrkkiinngg PPaappeerrss,, IIIIII,, ((22)),, 22001111 349
South – West Oltenia Region
West Region
Source: own processing based on informat ion provided by NIS
3.2. The specialisation models in terms of external demand
To build this model I ranked first in ascending order all CN sections according to the dynamic of
the external demand expressed by regional exports (2009 compared to 2000). Then, I determined the
values of the Lafay cumulative curve by summing, adding position with position indices calculated at
the section.
Figura 7 - The specialisation model in Romania betwen 2000-2009
(in terms of external demand)
Source: own processing based on informat ion provided by NIS
-16,0-14,0-12,0-10,0-8,0-6,0-4,0-2,00,02,04,06,08,0
Goods n
on-inclu
ded
Footw
ear
Vehic
les
Paper
ans p
aperb
oard
Optical in
str
um
ents
Fats
and o
ils
Ele
ctr
ical applia
nces
Raw
hid
es and s
kin
s
Art
icle
s o
f sto
ne
Textile
s
Mis
cella
neous
art
icle
s
Chem
ical
pro
ducts
Base m
eta
ls
Min
era
l pro
ducts
Pla
stics a
rtic
les
Pre
pare
d f
oodstu
ffs
Vegeta
ble
pro
ducts
Liv
e a
nim
als
Art
icle
s o
f w
ood
-3,0
-1,0
1,0
3,0
5,0
7,0
Goo
ds n
on-in
clud
ed
Opt
ical
inst
rum
ents
Tex
tiles
Ele
ctric
al a
pplia
nces
Foo
twea
r
Raw
hid
es a
nd s
kins
Veg
etab
le p
rodu
cts
Pre
pare
d fo
odst
uffs
Fat
s an
d oi
ls
Mis
cella
neou
s ar
ticle
s
Art
icle
s of
sto
ne
Che
mic
al p
rodu
cts
Veh
icle
s
Live
ani
mal
s
Min
eral
pro
duct
s
Pla
stic
s ar
ticle
s
Pap
er a
ns p
aper
boar
d
Art
icle
s of
woo
d
Bas
e m
etal
s
-5,0
-3,0
-1,0
1,0
3,0
5,0
7,0
9,0
11,0
13,0
Good
s n
on
-inc
luded
Art
icle
s o
f sto
ne
Tex
tile
s
Footw
ear
Art
icle
s o
f w
ood
Bas
e m
eta
ls
Chem
ical p
rodu
cts
Raw
hid
es
and
skin
s
Pap
er
ans
pap
erb
oa
rd
Min
era
l pro
du
cts
Mis
cella
ne
ous
art
icle
s
Liv
e a
nim
als
Fats
and
oils
Ele
ctr
ical a
pp
lianc
es
Pla
sti
cs a
rtic
les
Opti
cal i
ns
tru
ments
Veg
eta
ble
pro
du
cts
Vehic
les
Pre
pa
red
fo
od
stu
ffs
2000
2009

CCEESS WWoorrkkiinngg PPaappeerrss,, IIIIII,, ((22)),, 22001111 350
As can be seen in Figure 7, the dynamic of specialization patterns in Romania in terms of
external demand (exports) has the following trends:
for products with relatively constant or changed slightly demand (small
dynamic) the comparative advantages has decrease in 2009 compared to 2000
for products with avarage demand dynamics the comparative disadvantages has
recorded a fall in 2009 compared to 2000
for products with growing demand the small comparative advantage has
decrease and turns in disadvantages in 2009 compared to 2000 (except for means of
transport where the comparative advantages remain)
In conclusion, in Romania the changes in the specialization model for products with small
external demand dynamics (the decreasing of comparative advantages at the products where it is a
small demand dynamics) are "efficient" for the national economy. I can not say the same thing about
changes in the specialisation model, for goods where there was a average and high dynamic. Thus,
rather to increas the comparative advantages from 2000, those have decreasing turns in turns in
disadvantages in 2009. This is a sign that Romania's productive structures were not competitive and
flexible enough, compared to those from abroad, to satisfy an increasingly higher external demand.
Exceptions are the means of transport, whose high comparative advantages, strengthens Romania's
position on the international market with such products.
At regional level, adaptation of the specialisation model to the external demand is different, but,
generally, I can say, according to figures 8 and 9, that most regional economies not respond efficient
to the demand growth by increasing the comparative advantages or turning disadvantages into
comparative advantages (except are North-East and South-East who have preserved the advantages
especially in products with a high dynamic of the external demand).
Its important to emphasize that the changing patterns of regional specialization in terms of
external demand, implied in fact the decreasing of comparative advantages and turns in disadvantages
in all categories of products, which would mean that the regional production structures are not
competitive and flexible enough to satisfy the demand, regardless of its dynamics.

CCEESS WWoorrkkiinngg PPaappeerrss,, IIIIII,, ((22)),, 22001111 351
Figura 8. Adapting regional specialization pattern to the external demand dynamics
between 2000-2009
small average high
North-West
comparative advantages
decreasing
advantages turns into
comparative disadvantages
advantages turns into
comparative disadvantages
Center
comparative advantages
decreasing
advantages turns into
comparative disadvantages
advantages turns into
comparative disadvantages
North-East
advantages turns into
comparative disadvantages
comparative advantages
decreasing
comparative advantages
decreasing
South-East
advantages turns into
comparative disadvantages
comparative advantages
decreasing
comparative advantages
decreasing
South Muntenia
advantages turns into
comparative disadvantages
advantages turns into
comparative disadvantages
advantages turns into
comparative disadvantages
Bucharest-Ilfov
advantages turns into
comparative disadvantages
comparative advantages
decreasing
advantages turns into
comparative disadvantages
South – West
Oltenia
constant comparative
disadvantages
disadvantages increasing
advantages decreasing
advantages turns into
comparative disadvantages
West
constant comparative
advantages
advantages turns into
comparative disadvantages
comparative advantages
decreasing
Regions External demand dynamics
Source: own processing based on informat ion provided by NIS
Figure 9 . The regional specialization model in terms of external demand, between 2000-2009
North - West Region
Center Region
North – East Region
South – East Region
-4,0
-2,0
0,0
2,0
4,0
6,0
8,0
10,0
12,0
14,0
Goo
ds n
on-in
clud
ed
Art
icle
s of
sto
ne
Tex
tiles
Min
eral
pro
duct
s
Art
icle
s of
woo
d
Foo
twea
r
Pap
er a
ns p
aper
boar
d
Bas
e m
etal
s
Che
mic
al p
rodu
cts
Raw
hid
es a
nd s
kins
Live
ani
mal
s
Veg
etab
le p
rodu
cts
Mis
cella
neou
s ar
ticle
s
Opt
ical
inst
rum
ents
Veh
icle
s
Pre
pare
d fo
odst
uffs
Fat
s an
d oi
ls
Ele
ctric
al a
pplia
nces
Pla
stic
s ar
ticle
s
-4,0-2,00,02,04,06,08,0
10,012,014,016,018,0
Goo
ds n
on-in
clud
ed
Fat
s an
d oi
ls
Art
icle
s of
sto
ne
Foo
twea
r
Raw
hid
es a
nd s
kins
Veg
etab
le p
rodu
cts
Tex
tile
s
Bas
e m
etal
s
Mis
cella
neou
s ar
ticle
s
Che
mic
al p
rodu
cts
Pla
stic
s ar
ticl
es
Pre
pare
d fo
odst
uffs
Live
ani
mal
s
Art
icle
s of
woo
d
Opt
ical
ins
trum
ents
Veh
icle
s
Min
eral
pro
duct
s
Pap
er a
ns p
aper
boar
d
Ele
ctric
al a
pplia
nces
-3,0
-1,0
1,0
3,0
5,0
7,0
9,0
11,0
Goods n
on-inclu
ded
Min
era
l pro
ducts
Paper
ans p
aperb
oard
Footw
ear
Art
icle
s o
f sto
ne
Chem
ical
pro
ducts
Textile
s
Mis
cella
neous
art
icle
s
Raw
hid
es and s
kin
s
Vegeta
ble
pro
ducts
Art
icle
s o
f w
ood
Pre
pare
d f
oodstu
ffs
Base m
eta
ls
Liv
e a
nim
als
Pla
stics a
rtic
les
Ele
ctr
ical applia
nces
Optical in
str
um
ents
Vehic
les
Fats
and o
ils
-4,0-2,00,02,04,06,08,0
10,012,014,016,018,0
Goo
ds n
on-in
clud
ed
Che
mic
al p
rodu
cts
Raw
hid
es a
nd s
kins
Pap
er a
ns p
aper
boar
d
Tex
tiles
Mis
cella
neou
s ar
ticle
s
Live
ani
mal
s
Art
icle
s of
woo
d
Bas
e m
etal
s
Foo
twea
r
Fat
s an
d oi
ls
Opt
ical
inst
rum
ents
Pre
pare
d fo
odst
uffs
Veh
icle
s
Ele
ctric
al a
pplia
nces
Art
icle
s of
sto
ne
Veg
etab
le p
rodu
cts
Pla
stic
s ar
ticle
s
Min
eral
pro
duct
s
CCEESS WWoorrkkiinngg PPaappeerrss,, IIIIII,, ((22)),, 22001111 352
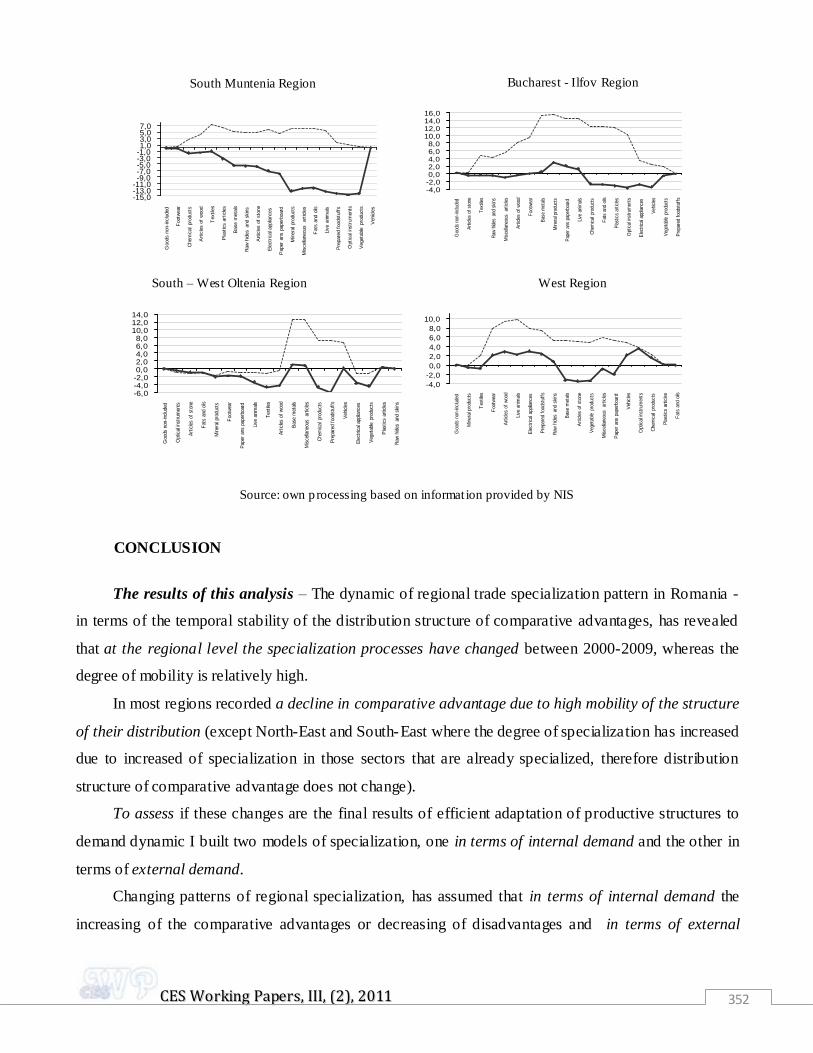
South Muntenia Region
Bucharest - Ilfov Region
South – West Oltenia Region
West Region
Source: own processing based on informat ion provided by NIS
CONCLUSION
The results of this analysis – The dynamic of regional trade specialization pattern in Romania -
in terms of the temporal stability of the distribution structure of comparative advantages, has revealed
that at the regional level the specialization processes have changed between 2000-2009, whereas the
degree of mobility is relatively high.
In most regions recorded a decline in comparative advantage due to high mobility of the structure
of their distribution (except North-East and South-East where the degree of specialization has increased
due to increased of specialization in those sectors that are already specialized, therefore distribution
structure of comparative advantage does not change).
To assess if these changes are the final results of efficient adaptation of productive structures to
demand dynamic I built two models of specialization, one in terms of internal demand and the other in
terms of external demand.
Changing patterns of regional specialization, has assumed that in terms of internal demand the
increasing of the comparative advantages or decreasing of disadvantages and in terms of external
-15,0-13,0-11,0-9,0-7,0-5,0-3,0-1,01,03,05,07,0
Goods n
on-inclu
ded
Footw
ear
Chem
ical
pro
ducts
Art
icle
s o
f w
ood
Textile
s
Pla
stics a
rtic
les
Base m
eta
ls
Raw
hid
es and s
kin
s
Art
icle
s o
f sto
ne
Ele
ctr
ical applia
nces
Paper
ans p
aperb
oard
Min
era
l pro
ducts
Mis
cella
neous
art
icle
s
Fats
and o
ils
Liv
e a
nim
als
Pre
pare
d f
oodstu
ffs
Optical in
str
um
ents
Vegeta
ble
pro
ducts
Vehic
les
-4,0-2,00,02,04,06,08,0
10,012,014,016,0
Goo
ds n
on-in
clud
ed
Art
icle
s of
sto
ne
Tex
tiles
Raw
hid
es a
nd s
kins
Mis
cella
neou
s ar
ticle
s
Art
icle
s of
woo
d
Foo
twea
r
Bas
e m
etal
s
Min
eral
pro
duct
s
Pap
er a
ns p
aper
boar
d
Live
ani
mal
s
Che
mic
al p
rodu
cts
Fat
s an
d oi
ls
Pla
stic
s ar
ticle
s
Opt
ical
inst
rum
ents
Ele
ctric
al a
pplia
nces
Veh
icle
s
Veg
etab
le p
rodu
cts
Pre
pare
d fo
odst
uffs
-6,0-4,0-2,00,02,04,06,08,0
10,012,014,0
Goo
ds n
on-in
clud
ed
Opt
ical
inst
rum
ents
Art
icle
s of
sto
ne
Fat
s an
d oi
ls
Min
eral
pro
duct
s
Foo
twea
r
Pap
er a
ns p
aper
boar
d
Live
ani
mal
s
Tex
tiles
Art
icle
s of
woo
d
Bas
e m
etal
s
Mis
cella
neou
s ar
ticle
s
Che
mic
al p
rodu
cts
Pre
pare
d fo
odst
uffs
Veh
icle
s
Ele
ctric
al a
pplia
nces
Veg
etab
le p
rodu
cts
Pla
stic
s ar
ticle
s
Raw
hid
es a
nd s
kins
-4,0
-2,0
0,0
2,0
4,0
6,0
8,0
10,0
Goo
ds n
on-in
clud
ed
Min
eral
pro
duct
s
Tex
tiles
Foo
twea
r
Art
icle
s of
woo
d
Live
ani
mal
s
Ele
ctric
al a
pplia
nces
Pre
pare
d fo
odst
uffs
Raw
hid
es a
nd s
kins
Bas
e m
etal
s
Art
icle
s of
sto
ne
Veg
etab
le p
rodu
cts
Mis
cella
neou
s ar
ticle
s
Pap
er a
ns p
aper
boar
d
Veh
icle
s
Opt
ical
inst
rum
ents
Che
mic
al p
rodu
cts
Pla
stic
s ar
ticle
s
Fat
s an
d oi
ls

CCEESS WWoorrkkiinngg PPaappeerrss,, IIIIII,, ((22)),, 22001111 353
demand the decreasing of their advantages and turns in disadvantages for all products. Which would
mean that regional production structures are competitive for internal market - they try to satisfy
demand- while for the foreign markets are not sufficiently flexible and competitive in order to satisfy a
growing demand.
REFERENCES
Aiginger K. (2000) Specialisation of European Manufacturing, Austrian Economic Quarterly,
2/2000, pp. 81-92.
Amiti M. (1999) Specialisation patterns in Europe, Weltwirtschaftliches Archiv, vol 135, No. 4,
pp. 573-593.
Ceapraz, I. L. (2008) The concepts of specialisation and spatial concentration and the process of
economic integration: theoretical relevance and statistical measurea. The case of
Romania's regions, Romanian Journal of Regional Science, Vol. 2, Nr. 1.
Constantin D.L. (1998) Economie regional, Bucharest: Oscar Print Publishing House.
Drăgan G. (2004) Fundamentele comerţului internaţional, Bucharest: ASE Publishing House.
Ezcurra R., Pascual P., Rapun M. (2006) Regional specialization in European Union, Regional
Studies, Vol. 40, No. 6, pp. 601-616.
Frias I., Iglesias A., Neira I. Regional specialization and trade patterns in Europe, Working Paper
Series Economic Development, Nr. 46.
Goschin Z., Constantin D.L., Roman M., Ileanu B.V. (2009) Specialization and concentration
patterns in the Romanian economy, Journal of Appliedd Quantitative Methods, Vol.4,
Nr.1, pp. 95-111.
Hallet M. (2000) Regional specialization and concentration in EU, Economic papers -European
Commision, Nr.141, pp. 1-30.
Harrigan J. (1996) Technology, factor supplies and international specialization: estimating
neoclassic model, NBER Working Paper Series 5722, August 1996.
Iapadre P.L. (2001) Measuring international specialization, International Advances in Economic
Research, Springer Netherlands, Volume 7, Number 2 / May, 2001.
Ignat I., Pralea S. (2006) Economie mondială, Iaşi: Sedcom Libris Publishing House.

CCEESS WWoorrkkiinngg PPaappeerrss,, IIIIII,, ((22)),, 22001111 354
Krugman, P. (1991) Geography and Trade, MIT Press.
Marelli E. (2006) Specialization and convergence of European Regions, The European Journal of
Comparative Economics, Nr. 2, pp. 149-178.
Olteanu D., (2008) Specializarea tehnologică a producției și exportului la nivel European, din
perspectiva convergenței reale, Academia Română, Institutul Național de Cercetări
economice, Seria Working Paper, no. 6.
Rujan O. (2001) Teorii şi modele privind relaţiile economice internaţionale, Bucharest: ASE
Publishing House.
Vass A. (2005) Romania and the trade and the development approaches to CEE convergence
with the EU, under the competitive pressures of integration, Institute for World
Economics - Working Papers, Nr.151, February 2005.
Zaghini A. (2003) Trade advantages and spacialisation dynamics in acceding countries,
European Central Bank Workink Paper Series no. 249, August 2003.
Recommended