THE EFFECT OF HOTEL REVENUE MANAGEMENT PRACTICES ON PERCEIVED FAIRNESS, TRUST,
SATISFACTION AND CUSTOMER LOYALTY: A STUDY ON DOMESTIC TOURISTS STAYING AT 3 - 5 STAR HOTELS IN
THAILAND
CHATARIN SUBYING
A THEMATIC PAPER SUBMITTED IN PARTIAL FULFILLMENT OF THE REQUIREMENTS FOR THE DEGREE OF MASTER OF MANAGEMENT
COLLEGE OF MANAGEMENT MAHIDOL UNIVERSITY
2021
COPYRIGHT OF MAHIDOL UNIVERSITY

Thematic paper entitled
THE EFFECT OF HOTEL REVENUE MANAGEMENT PRACTICES ON PERCEIVED FAIRNESS, TRUST,
SATISFACTION AND CUSTOMER LOYALTY: A STUDY ON DOMESTIC TOURISTS STAYING AT 3 - 5 STAR HOTELS IN
THAILAND
was submitted to the College of Management, Mahidol University for the degree of Master of Management
on August 31, 2021
.............................................................. Mr. Chatarin Subying Candidate
.............................................................. .............................................................. Assoc. Prof. Chanin Yoopetch, Asst. Prof. Boonying Kongarchapatara, Ph.D. Ph.D. Advisor Chairperson
.............................................................. .............................................................. Assoc. Prof. Vichita Ractham, Suthawan Chirapanda Sato, Ph.D. Ph.D. Dean Committee member College of Management Mahidol University

ii
ACKNOWLEDGEMENTS
Without the support and assistance from various people, this study would
not be successful. Hence, I would dedicate this part of the study to express my gratitude
towards all of the support that I have received.
Firstly, I would like to say thank you to my advisor, Assoc. Prof. Dr. Chanin
Yoopetch for the kind support and assistance on this paper and on my academic life. I
would like to also express my gratitude towards the Independent Study Committee,
including Asst. Prof. Dr. Boonying Kongarchapatara and Dr. Suthawan Chirapanda Sato
for the valuable feedback and comments. Also, I would like to thank you Khun Prasit
Chuensirikulchai and Khun Chanoksuda Soatthiyanon for assisting me on all
administrative processes for my independent study.
Apart from my advisor, the Independent Study Committee, and CMMU
staffs, I would like to thank you Dr. Suwadee Talawanich who always encourage and
advise me on both my work life and my academic journey since my undergraduate
studies. Also, I would like to express my gratitude towards Khun Attaya
Vechasedtanond, Corporate Revenue Manager of TCC Hotel Group, my team leader
who always support my graduate studies.
Also, I would like to thank you all of my family members who are always
supportive of my decision to pursue this degree. I would also like to thank you Khun
Papichaya Khwanmuang for all the support and encouragement, and also Khun Chi
Hsian Lee and Khun Chayapol Yenpaisarn who have been in the same gang with me
throughout my time at CMMU. Lastly, I would like to express my thankfulness towards
Mamamoo, ITZY and aespa, the three musical bands that have emotionally supported
me throughout the writing of this paper.
Chatarin Subying

iii
THE EFFECT OF HOTEL REVENUE MANAGEMENT PRACTICES ON PERCEIVED FAIRNESS, TRUST, SATISFACTION AND CUSTOMER LOYALTY: A STUDY ON DOMESTIC TOURISTS STAYING AT 3 - 5 STAR HOTELS IN THAILAND
CHATARIN SUBYING 6249180
M.M. (MARKETING AND MANAGEMENT)
THEMATIC PAPER ADVISORY COMMITTEE: ASSOC. PROF. CHANIN
YOOPETCH, Ph.D., ASST. PROF. BOONYING KONGARCHAPATARA, Ph.D.,
SUTHAWAN CHIRAPANDA SATO, Ph.D.
ABSTRACT
Revenue management allows hotels to fully maximise their revenue from
their relatively fixed perishable inventory. However, from the customers viewpoint,
such price discrimination can lead to negative perceptions toward hotels. Hence, it is
crucial for hotels to maximise revenue, while at the same time being perceived as fair
from the viewpoint of customers. With this idea, this study was conducted to understand
the relationship among hotel revenue management practices, perceived fairness, trust,
satisfaction, and customer loyalty. This study focused on domestic tourists in Thailand
that have stayed at 3 - 5 Star hotels. A quantitative method is used for this study; 417
samples were collected from online questionnaire surveys. The finding of this study
emphasised the effect of familiarity with revenue management practices on perceived
fairness and trust, while perceived fairness and trust have an impact on satisfaction.
Attitudinal loyalty is influenced by perceived fairness and satisfaction. The study also
found out that attitudinal loyalty leads to behavioural loyalty. Another highlighted
finding is the importance of information adequacy toward all variables of this study.
KEY WORDS: Revenue Management/ Perceived Fairness/ Trust/ Satisfaction/
Customer Loyalty
147 pages

iv
CONTENTS
Page
ACKNOWLEDGEMENTS ii
ABSTRACT iii
LIST OF TABLES xii
LIST OF FIGURES xvii
CHAPTER I INTRODUCTION 1
1.1 From Airline Yield Management to Hotel Revenue Management 1
1.1.1 Yield Management 1
1.1.2 Similar Characteristic Between Airlines and Hotels 1
1.2 Revenue Management in Hotel Industry 3
1.2.1 Definition of Revenue Management 3
1.2.2 Evolution of Revenue Management Practice in the Hotel
Industry 3
1.3 The Scope of This Study 4
1.4 Research Questions 6
1.5 Research Objectives 6
CHAPTER II LITERATURE REVIEW 7
2.1 Rate Fences 7
2.2 Price Framing 8
2.3 Rate Parity 9
2.4 Familiarity with Revenue Management Practices 10
2.5 Information Adequacy 12
2.6 Perceived Fairness 13
2.7 Trust 14
2.8 Satisfaction 15
2.9 Customer Loyalty 16
CHAPTER III METHODOLOGY 18
3.1 Research Methodology 18

v
CONTENTS (cont.)
Page
3.3.1 Sampling 18
3.3.2 Research Instrument 19
3.2 Data Collection 20
CHAPTER IV FINDINGS 21
4.1 Demographics Features of Respondents 21
4.1.1 Gender 21
4.1.2 Current Resident 21
4.1.3 Age Range 22
4.1.4 Marital Status 22
4.1.5 Education Level 23
4.1.6 Monthly Income 23
4.1.7 Occupation 24
4.2 Respondents’ Behaviour on Hotel Reservation & Factors Related to
Revenue Management 24
4.2.1 Purpose of Stay 24
4.2.2 Hotel Location 25
4.2.3 Companion 25
4.2.4 Number of Times Stayed at the Hotel 26
4.2.5 Hotel Rating 26
4.2.6 Hotel Type 27
4.2.7 Cancellation Policy 27
4.2.8 Booking Channel 28
4.2.9 Length of Stay 28
4.2.10 Loyalty Programme 29
4.2.11 Price Framing 29
4.2.12 Rate Parity 29
4.2.13 Information Adequacy 30
4.2.14 ‘We Travel Together’ Campaign 30

vi
CONTENTS (cont.)
Page
4.3 Familiarity with Revenue Management Practices 31
4.3.1 Descriptive Statistic & Reliability Test 31
4.3.2 Differences Among Factors 31
4.3.2.1 Current Resident 32
4.3.2.2 Education Level 32
4.3.2.3 Cancellation Policy 33
4.3.2.4 Loyalty Programme 33
4.3.2.5 Rate Parity 34
4.3.2.6 Information Adequacy 35
4.3.2.7 Hotel Rating 36
4.3.2.8 Hotel Type 37
4.4 Perceived Fairness 38
4.4.1 Descriptive Statistic & Reliability Test 38
4.4.2 Differences Among Factors 39
4.4.2.1 Current Resident 39
4.4.2.2 Loyalty Programme 39
4.4.2.3 Price Framing 39
4.4.2.4 Information Adequacy 40
4.4.2.5 Hotel Rating 42
4.4.2.6 Hotel Type 43
4.5 Trust 43
4.5.1 Descriptive Statistic & Reliability Test 43
4.5.2 Differences Among Factors 44
4.5.2.1 Current Resident 44
4.5.2.2 Monthly Income 44
4.5.2.3 Cancellation Policy 45
4.5.2.4 Booking Channel 46
4.5.2.5 Loyalty Programme 47

vii
CONTENTS (cont.)
Page
4.5.2.6 Price Framing 47
4.5.2.7 Rate Parity 48
4.5.2.8 Information Adequacy 49
4.5.2.9 Hotel Rating 50
4.5.2.10 Hotel Type 52
4.5.2.11 Number of Times Stayed at the Hotel 53
4.6 Satisfaction 54
4.6.1 Descriptive Statistic & Reliability Test 54
4.6.2 Differences Among Factors 54
4.6.2.1 Booking Channel 55
4.6.2.2 Loyalty Programme 56
4.6.2.3 Information Adequacy 57
4.6.2.4 Hotel Rating 59
4.6.2.5 Hotel Type 60
4.6.2.6 ‘We Travel Together’ Campaign 61
4.6.2.7 Purpose of Stay 61
4.7 Cognitive Loyalty 62
4.7.1 Descriptive Statistic & Reliability Test 62
4.7.2 Differences Among Factors 62
4.7.2.1 Age Range 63
4.7.2.2 Booking Channel 63
4.7.2.3 Loyalty Programme 64
4.7.2.4 Rate Parity 65
4.7.2.5 Information Adequacy 65
4.7.2.6 Hotel Rating 67
4.7.2.7 Hotel Type 68
4.7.2.8 Number of Times Stayed at the Hotel 68
4.8 Affective Loyalty 69

viii
CONTENTS (cont.)
Page
4.8.1 Descriptive Statistic & Reliability Test 69
4.8.2 Differences Among Factors 69
4.8.2.1 Occupation 70
4.8.2.2 Booking Channel 71
4.8.2.3 Loyalty Programme 72
4.8.2.4 Information Adequacy 73
4.8.2.5 Hotel Rating 74
4.8.2.6 Hotel Type 76
4.8.2.7 Number of Times Stayed at this Hotel 77
4.8.2.8 ‘We Travel Together’ Campaign 78
4.9 Conative Loyalty 79
4.9.1 Descriptive Statistic & Reliability Test 79
4.9.2 Differences Among Factors 79
4.9.2.1 Current Resident 80
4.9.2.2 Occupation 80
4.9.2.3 Cancellation Policy 81
4.9.2.4 Booking Channel 82
4.9.2.5 Length of Stay 83
4.9.2.6 Loyalty Programme 83
4.9.2.7 Rate Parity 84
4.9.2.8 Information Adequacy 85
4.9.2.9 Hotel Rating 86
4.9.2.10 Hotel Type 87
4.9.2.11 Number of Times Stayed at the Hotel 88
4.10 Attitudinal Loyalty 90
4.10.1 Descriptive Statistic 90
4.10.2 Differences Among Factors 90
4.10.2.1 Occupation 90

ix
CONTENTS (cont.)
Page
4.10.2.2 Booking Channel 91
4.10.2.3 Loyalty Programme 91
4.10.2.4 Information Adequacy 91
4.10.2.5 Hotel Rating 92
4.10.2.6 Number of Times Stayed at the Hotel 92
4.11 Behavioural Loyalty 93
4.11.1 Descriptive Statistic & Reliability Test 93
4.11.2 Differences Among Factors 93
4.11.2.1 Age Range 94
4.11.2.2 Occupation 94
4.11.2.3 Booking Channel 95
4.11.2.4 Length of Stay 96
4.11.2.5 Loyalty Programme 97
4.11.2.6 Information Adequacy 98
4.11.2.7 Hotel Rating 99
4.11.2.8 Hotel Type 100
4.11.2.9 Number of Times Stayed at the Hotel 101
4.11.2.10 ‘We Travel Together’ Campaign 103
4.11.2.11 Purpose of Stay 104
4.12 Regression Analysis 104
4.12.1 Model 1: Influence on Perceived Fairness 105
4.12.2 Model 2: Influence on Trust 105
4.12.3 Model 3: Influence on Satisfaction 106
4.12.4 Model 4: Influence on Attitudinal Loyalty 107
4.12.5 Model 5: Influence on Elements of Attitudinal Loyalty -
Cognitive Loyalty 108
4.12.6 Model 6: Influence on Elements of Attitudinal Loyalty -
Affective Loyalty 109

x
CONTENTS (cont.)
Page
4.12.7 Model 7: Influence on Elements of Attitudinal Loyalty -
Conative Loyalty 110
4.12.8 Model 8: Influence on Behavioural Loyalty 111
4.12.9 Model 9: Influence on Behavioural Loyalty - Attitudinal
Loyalty Breakdown 112
CHAPTER V DISCUSSION 114
5.1 Relationship 114
5.1.1 Perceived Fairness (Model 1) 114
5.1.2 Trust (Model 2) 114
5.1.3 Satisfaction (Model 3) 115
5.1.4 Attitudinal Loyalty (Model 4) 115
5.1.5 Breakdown of Attitudinal Loyalty (Model 5 - 7) 116
5.1.6 Behavioural Loyalty (Model 8 - 9) 116
5.2 Differences among Respondent Demographics Group 117
5.2.1 Current Resident 117
5.3.2 Monthly Income 117
5.3.3 Occupation 118
5.3 Findings on Differences among Respondents’ Behaviour on Hotel
Reservation & Factors Related to Revenue Management 118
5.3.1 Rate Fences 118
5.3.2 Price Framing & Rate Parity 120
5.3.3 Information Adequacy 121
5.3.4 Hotel Rating and Hotel Type 121
5.3.5 Number of Times Stayed at the Hotel 122
5.3.5 ‘We Travel Together’ Campaign 123
5.3.6 Purpose of Stay 123
5.4 Conclusion 124
5.5 Recommendations 125

xi
CONTENTS (cont.)
Page
5.6 Limitations 128
5.7 Future Research Directions 128
REFERENCES 129
APPENDICES 138
Appendix A: Questionnaire Survey 139
BIOGRAPHY 147
xii
LIST OF TABLES
Table Page
4.1 Frequency – Gender 21
4.2 Frequency – Current Resident 21
4.3 Frequency – Age Range 22
4.4 Frequency – Marital Status 22
4.5 Frequency – Education Level 23
4.6 Frequency – Monthly Income 23
4.7 Frequency – Occupation 24
4.8 Frequency – Purpose of Stay 24
4.9 Frequency – Hotel Location 25
4.10 Frequency – Companion 25
4.11 Frequency – Times Stayed at the Hotel 26
4.12 Frequency – Hotel Rating 26
4.13 Frequency – Hotel Type 27
4.14 Frequency – Cancellation Policy 27
4.15 Frequency – Booking Channel 28
4.16 Frequency – Length of Stay 28
4.17 Frequency – Loyalty Programme 29
4.18 Frequency – Price Framing 29
4.19 Frequency – Rate Parity 29
4.20 Frequency – Information Adequacy 30
4.21 Frequency – ‘We Travel Together’ Campaign 30
4.22 Familiarity with Revenue Management Practices 31
4.23 Familiarity with RM – Current Resident 32
4.24 Familiarity with RM – Education Level 32
4.25 Familiarity with RM – Cancellation Policy 33
4.26 Familiarity with RM – Loyalty Programme 33
4.27 Familiarity with RM – Rate Parity 34

xiii
LIST OF TABLES (cont.)
Table Page
4.28 Familiarity with RM – Information Adequacy 35
4.29 Familiarity with RM – Hotel Rating 36
4.30 Familiarity with RM – Hotel Type 37
4.31 Perceived Fairness 38
4.32 Perceived Fairness – Current Resident 39
4.33 Perceived Fairness – Loyalty Programme 39
4.34 Perceived Fairness – Price Framing 39
4.35 Perceived Fairness – Information Adequacy 40
4.36 Perceived Fairness – Hotel Rating 42
4.37 Perceived Fairness – Hotel Type 43
4.38 Trust 43
4.39 Trust – Current Resident 44
4.40 Trust – Monthly Income 44
4.41 Trust – Cancellation Policy 45
4.42 Trust – Booking Channel 46
4.43 Trust – Loyalty Programme 47
4.44 Trust – Price Framing 47
4.45 Trust – Rate Parity 48
4.46 Trust – Information Adequacy 49
4.47 Trust – Hotel Rating 50
4.48 Trust – Hotel Type 52
4.49 Trust – Number of Times Stayed at the Hotel 53
4.50 Satisfaction 54
4.51 Satisfaction – Booking Channel 55
4.52 Satisfaction – Loyalty Programme 56
4.53 Satisfaction – Information Adequacy 57
4.54 Satisfaction – Hotel Rating 59
4.55 Satisfaction – Hotel Type 60

xiv
LIST OF TABLES (cont.)
Table Page
4.56 Satisfaction – ‘We Travel Together’ Campaign 61
4.57 Satisfaction – Purpose of Stay 61
4.58 Cognitive Loyalty 62
4.59 Cognitive Loyalty – Age Range 63
4.60 Cognitive Loyalty – Booking Channel 63
4.61 Cognitive Loyalty – Loyalty Programme 64
4.62 Cognitive Loyalty – Rate Parity 65
4.63 Cognitive Loyalty – Information Adequacy 65
4.64 Cognitive Loyalty – Hotel Rating 67
4.65 Cognitive Loyalty – Hotel Type 68
4.66 Cognitive Loyalty – Number of Times Stayed at the Hotel 68
4.67 Affective Loyalty 69
4.68 Affective Loyalty – Occupation 70
4.69 Affective Loyalty – Booking Channel 71
4.70 Affective Loyalty – Loyalty Programme 72
4.71 Affective Loyalty – Information Adequacy 73
4.72 Affective Loyalty – Hotel Rating 74
4.73 Affective Loyalty – Hotel Type 76
4.74 Affective Loyalty – Number of Times Stayed at this Hotel 77
4.75 Affective Loyalty – ‘We Travel Together’ Campaign 78
4.76 Conative Loyalty 79
4.77 Conative Loyalty – Current Resident 80
4.78 Conative Loyalty – Occupation 80
4.79 Conative Loyalty – Cancellation Policy 81
4.80 Conative Loyalty – Booking Channel 82
4.81 Conative Loyalty – Length of Stay 83
4.82 Conative Loyalty – Loyalty Programme 83
4.83 Conative Loyalty – Rate Parity 84

xv
LIST OF TABLES (cont.)
Table Page
4.84 Conative Loyalty – Information Adequacy 85
4.85 Conative Loyalty – Hotel Rating 86
4.86 Conative Loyalty – Hotel Type 87
4.87 Conative Loyalty – Number of Times Stayed at the Hotel 88
4.88 Attitudinal Loyalty – Occupation 90
4.89 Attitudinal Loyalty – Booking Channel 91
4.90 Attitudinal Loyalty – Loyalty Programme 91
4.91 Attitudinal Loyalty – Information Adequacy 91
4.92 Attitudinal Loyalty – Hotel Rating 92
4.93 Attitudinal Loyalty – Number of Times Stayed at the Hotel 92
4.94 Behavioural Loyalty 93
4.95 Behavioural Loyalty – Age Range 94
4.96 Behavioural Loyalty – Occupation 94
4.97 Behavioural Loyalty – Booking Channel 95
4.98 Behavioural Loyalty – Length of Stay 96
4.99 Behavioural Loyalty – Loyalty Programme 97
4.100 Behavioural Loyalty – Information Adequacy 98
4.101 Behavioural Loyalty – Hotel Rating 99
4.102 Behavioural Loyalty – Hotel Type 100
4.103 Behavioural Loyalty – Number of Times Stayed at the Hotel 101
4.104 Behavioural Loyalty – ‘We Travel Together’ Campaign 103
4.105 Behavioural Loyalty – Purpose of Stay 104
4.106 Regression Analysis – Perceived Fairness 105
4.107 Regression Analysis – Trust 105
4.108 Regression Analysis – Satisfaction 106
4.109 Regression Analysis – Attitudinal Loyalty 107
4.110 Regression Analysis – Cognitive Loyalty 108
4.111 Regression Analysis – Affective Loyalty 109

xvi
LIST OF TABLES (cont.)
Table Page
4.112 Regression Analysis – Conative Loyalty 110
4.113 Regression Analysis – Behavioural Loyalty 111
4.114 Regression Analysis – Behavioural Loyalty II 112

xvii
LIST OF FIGURES
Figure Page
Figure 4.1 Regression Analysis – Perceived Fairness 105
Figure 4.2 Regression Analysis – Trust 105
Figure 4.3 Regression Analysis – Satisfaction 106
Figure 4.4 Regression Analysis – Attitudinal Loyalty 107
Figure 4.5 Regression Analysis – Cognitive Loyalty 108
Figure 4.6 Regression Analysis – Affective Loyalty 109
Figure 4.7 Regression Analysis – Conative Loyalty 110
Figure 4.8 Regression Analysis – Behavioural Loyalty 111
Figure 4.9 Regression Analysis – Behavioural Loyalty II 112

1
CHAPTER I
INTRODUCTION
1.1 From Airline Yield Management to Hotel Revenue Management 1.1.1 Yield Management
The application of yield management was introduced by the airline industry
before other hospitality businesses adopted the concept into their industry (Cross et al.,
2008; Kimes, 1994). Kimes defined yield management as the method of selling the right
inventory to the right customer segment, for the right price (1989a); and at the right time
(1989b). Yield management was implemented to maximise revenue per available seat
in the airline industry (Denizci Guillet & Mohammed, 2015), as many airlines flew with
millions of empty seats each year (Cross et al., 2010). Because airlines are likely to fill
all their seats with full-fare tickets in every flight, they tend to fill the empty seat by
offering a lower fare; after applying yield management, many airlines have reported a
5% increase in revenue (Kimes, 1989b).
1.1.2 Similar Characteristic Between Airlines and Hotels
Kimes (1989a) pointed out that the similar characteristics between the
airline industry and the hotel industry make it possible for the hotel industry to adopt
the concept of yield management. The study pointed out 6 main characteristics of a
business that are appropriate to the uses of yield management which are: having a
relatively fixed capacity, having segmented markets, possessing perishable inventory,
selling products in advance, facing fluctuated demand, and having low marginal sales
costs but high marginal production costs.
First, having a relatively fixed capacity means that it is costly for hotels to
increase its capacity. When hotels were built, it might not be possible for them to add
one more room to their inventory without needing to add another building. Therefore,
hotels need to utilise the existing capacity, this is where the concept of yield
management can be applied to maximise the revenue from relatively fixed capacity.

2
Second, having segmented markets means that hotels can group their
customers into different types, depending on their needs and level of price sensitivity.
For example, leisure and business travellers would have different needs and different
levels of price sensitivity. With segmented markets that divide customers into groups,
yield management can be applied.
Third, possessing perishable inventory means that hotels will not be able to
carry over the inventory to the next day if it is not sold on that day. For instance, if a
hotel has 100 rooms, and they have sold 90 rooms today, it is not possible for the hotel
to save the 10 unoccupied rooms and sell 110 rooms tomorrow; they will have 100
rooms each day no matter how much room has been sold in the previous days. As the
inventory is perishable, the concept of yield management can be applied to help hotels
deal with unoccupied rooms by adjusting the price like how the airlines industry deals
with the empty seat problem.
Fourth, selling products in advance means that guests have a choice either
to reserve a hotel room in advance or to walk in at the last minute at the hotel to get a
room. With these choices, it leaves hotels options whether to accept early bookings from
group reservations which might come in with a lower rate or to wait for customers that
are willing to pay for a higher rate; yield management concept can help the hotel make
the decision.
Fifth, facing fluctuated demand means that the demand levels are not the
same between each day of the week, month, season, or year. For instance, some hotels
may have higher demand level during weekends than weekdays, and higher demand
level on specific seasons of each year. With the knowledge of fluctuating demand, the
concept of yield management can be applied to help hotels to increase their occupancy
rate during low demand periods by reducing the price and maximising the revenue
during high demand periods by increasing the price.
Sixth, having low marginal sales costs but high marginal production costs
means that the additional cost of selling one more room is considerably low. However,
to increase another room is very costly because of the relatively fixed capacity. As the
overall cost would not differ much by selling another room, hotels will try to sell as
many rooms as possible to reach full capacity, this provides an opportunity for yield
management concepts to be applied to maximise the revenue from the existing capacity.
3
With these six similar characteristics that are appropriate for the application
of yield management (Kimes, 1989a), the hotel industry has adopted the concept, which
later evolved into revenue management, where not only yield per inventory unit is
considered but ancillary revenue and sale costs are also considered (Denizci Guillet,
2020).
1.2 Revenue Management in Hotel Industry 1.2.1 Definition of Revenue Management
Revenue management is popularly defined as the process of selling the right
capacity to the right customer for the right price, at the right time, through the right
channel (Guillet, 2020). Kimes and Wirtz (2003) mentioned that revenue management
combined the application of pricing strategies and information systems that would lead
to achieving each ‘right’. The study also explains that in practice, revenue management
is to set the rates according to the forecasted demand quantity, to allow low-purchasing-
power-customers to be able to book in a slow period while at the same time, allowing
high-purchasing-power-customers to book during peak periods.
Another definition of revenue management is the combination of art and
science of demand forecasting, while at the same time configuring the rate and
availability of the inventory in regard to certain demand groups (Erdem & Jiang, 2016).
To be more specific, similar to the airline industry, hotels look at the historical data and
booking patterns to adjust the rates and availability according to the level of the demand
forecast.
1.2.2 Evolution of Revenue Management Practice in the Hotel Industry
Traditionally, revenue management was considered as a standalone tactical
approach that only dealt with room management; however, the trend of revenue
management shifted from a tactical approach to a strategic approach and integrated with
other functions such as marketing and operations (Wang et al., 2015). Furthermore, in
the early stage of revenue management in the hotel industry, the role of revenue manager
was only to manage the predefined room rates to balance rates and occupancy, however,
the scope of revenue management expanded, which made the tasks of pricing and

4
managing all sources of revenue - not only room revenue - become the responsibility of
the revenue management department (Noone et al., 2011).
The term for managing all revenue streams of the hotel is defined as ‘Total
Hotel Revenue Management’, where the application of revenue management goes
beyond room division (Noone et al., 2017). The given examples of the Total Hotel
Revenue Management are the application of revenue management in restaurants,
function spaces, and the shift in the focus of room revenue on the top line, to the bottom-
line profit.
In addition, the trend of revenue management practice has shifted from
inventory-centric revenue management, to become customer-centric revenue
management (Wang et al., 2015). The study explained that the integration between
revenue management and customer relationship management is a major advancement
of the field. Erdem and Jiang (2016) also explained that customer-centric revenue
management makes use of customer data to target the most valuable customers. In
practice, revenue management methods integrate the information of customer
preference from the loyalty programme to execute new strategies (Mainzer, 2004).
However, as revenue management moved toward the customer-centric
approach, the question of price fairness in the perception of customers arose. Denizci
Guillet (2020) examined the evolution of revenue management literature in the
hospitality industry from 1983 - 2018 and found out that the domain of customer
perceptions on pricing was introduced in the period of 1999 - 2003 which is the same
period that consumer behaviour and behavioural economic domain was introduced.
Then, during 2004 - 2008, the domain of customer perceptions on pricing evolved into
the domain of price fairness perceptions, which its appearance can be seen in all periods
proposed in the study, up until 2018. Studies about price fairness in revenue
management are still evidenced in recent years (Lee et al., 2020; Méatchi & Camus,
2020; Vu et al., 2020).
1.3 The Scope of This Study The perceived fairness in price becomes a concern in revenue management
field as the pricing strategy leads to price discrimination. In the hotel industry, price

5
discrimination means that different customers are charged with different prices for the
same rooms (Ivanov & Zhechev, 2012). Vu et al (2020) found out that price
discrimination has an impact on perceived fairness, price acceptance and behavioural
loyalty. Other negative outcomes of unfair perception are firm profitability,
dissatisfaction, purchase intention, complaining, and spreading negative words (Wirtz
& Kimes, 2007). So, it is crucial to understand what customers feel about revenue
management practices because revenue management practices have an impact on
perceived fairness, which further lead to other consequences. Therefore, this study will
examine the effect of hotel revenue management practices on perceived fairness,
together with trust, satisfaction, and customer loyalty.
As this study is conducted during the outbreak of COVID-19 pandemics,
where restrictions for international travel are posed, this study will focus on domestic
tourists in Thailand. In addition, the scope of this study is limited to 3-5 Star hotels,
where revenue management practices are commonly applied. Since revenue
management tasks became more complex, the placement of revenue management
shifted from room division to sales and marketing division, and finally, revenue
management became a standalone division (Kimes, 2016); hotels that can fully apply
revenue management need to have a person who oversees revenue management tasks.
Smaller hotels that do not have revenue management departments will not be able to
fully perform revenue management practices, as they will only be able to perform simple
revenue management tasks such as opening and closing room rates, but not complex
ones such as pricing, forecasting, and marketing analytics. Ferguson and Smith (2014)
mentioned that larger hotels tend to gain more benefits from revenue management
practices as they can hire a full-time revenue manager, while smaller hotels face cost
constraints. Therefore, as smaller hotels might not have the capacity to perform complex
revenue management practices, they are filtered out for this study.
With this context, it makes this study a novelty as there are no past studies
on the effect of hotel revenue management practices on the perception of fairness, trust,
satisfaction, and customer loyalty on domestic tourists in Thailand; a past study
(Charuvatana, 2019) on dynamic pricing and price fairness perception in Thailand was
conducted in the context of international tourists in five-star hotels in Bangkok. In
addition, this study would explore the effect of the “We Travel Together” campaign on

6
each variable of this study. This campaign was the government subsidiary campaign to
encourage people to travel domestically to boost tourism revenue during the
international flight ban by subsidising 40% of the hotel room rate.
Therefore, this study will examine the effect of hotel revenue management
practices on perceived fairness, trust, satisfaction, and customer loyalty. Factors that are
related to hotels revenue management such as familiarity with hotel revenue
management practices and information adequacy would also be taken into account. In
addition, differences among demographic factors and customers’ behaviour on hotel
reservations would also be examined as well. Hence, there are three main questions that
this study will answer:
1.4 Research Questions 1) Do revenue management practices and relating factors have an impact on
perceived fairness, trust, satisfaction, and customer loyalty?
2) Do perceived fairness, trust and satisfaction have an impact on customer
loyalty in the context of hotel revenue management?
3) Do customers with different demographic backgrounds and hotel
reservation behaviours have different levels of familiarity with revenue management
practices, perceived fairness, trust, satisfaction, and customer loyalty?
1.5 Research Objectives 1) To examine the influences of revenue management practices and relating
factors on perceived fairness, trust, satisfaction, and customer loyalty.
2) To examine the influences of perceived fairness, trust, and satisfaction on
customer loyalty in the context of hotel revenue management.
3) To examine the differences in the level of familiarity with revenue
management practices, perceived fairness, trust, satisfaction, and customer loyalty
between customers with different demographic backgrounds and hotel reservation
behaviours.

7
CHAPTER II
LITERATURE REVIEW
2.1 Rate Fences Rate fences are the common technique of revenue management practice,
which are associated with price discrimination (Biełuszko & Marciszewska, 2018).
Price discrimination is defined as selling the same product or service, for different prices
to different customers (Yadin, 2002). Similarly, rate fences are sets of rules posed by
hotels to let customers self-segment according to their behaviours, needs, and
willingness to pay (Denizci Guillet et al., 2015); for instance, customers with lower
purchasing power will have to accept certain restrictions to get the lower rate (Kimes &
Wirtz, 2003).
Wirtz and Kimes (2007) categorised rate fences into two main categories
which are physical rate fences, and non-physical rate fences. Physical rate fences refer
to product-related attributes, in the context of the hotel industry, examples of common
physical fences are the size of the hotel room, free breakfast, airport transfer and separate
check-in counter. On the other hand, non-physical fences include the characteristics of
transaction, consumption, and buyer. In terms of transaction characteristics, common
rate fences are advance purchase rates, rate disparity in selling channels, and non-
refundable cancellation policy. While restrictions such as required minimum night stay
and stay through on a specific day of the week are examples of rate fences by
consumption characteristics. For buyer characteristics, loyalty programme discount &
benefits, student discount, senior discount, negotiated rates, corporate rates and
domestic rates are the common examples.
Wirtz and Kimes (2007) pointed out that the rate fences can be seen on two
sides, which are advantaged inequality and disadvantaged inequality. Advantages
inequality is when a customer pays less than others, while disadvantages inequality is
when a customer pays more than others. Hence, the difference between the two
perspectives would have an impact on perceived fairness.
8
As rate fences are associated with price discrimination (Bieluszko &
Marciszewska, 2018), the practices can be seen as unfair. Wirtz and Kimes (2007)
observed that advantages inequality and disadvantage inequality affect the level of
perceived fairness. Vu et al. (2020) also confirmed the linkage between price
discrimination, perceived fairness and switching intention. Lee et al. (2020) found out
that length of stay control - which is a non-physical rate fence - could impact perceived
fairness and customer loyalty.
Hence, this study will examine the differences in the level of familiarity with
revenue management, perceived fairness, trust, satisfaction, and customer loyalty
among respondents that received different rate fences. Four non-physical rate fences
will be examined including two fences by transaction characteristics which are
cancellation policy and booking channel; one fence by consumption characteristics
which is the required minimum length of stay; and one fence by buyer characteristics
which is loyalty programmes. The reason that only non-physical fences are taken into
account is that non-physical rate fences could be applied in different kinds of hotels
regardless of their products and service levels.
2.2 Price Framing Framing could be defined in a strict sense and loose sense (Frisch, 1993);
for the strict sense, it is defined as a pair of problems that are rephrased in different
wordings but resulted in an equivalent in meaning and situation. On the other hand, the
definition in the loose sense is more popular for marketing scholars (Tripathi & Pandey,
2017); it is defined as a pair of problems that are economically equivalent but have
different meanings and situations (Frisch, 1993).
Price framing was a concept that is derived from the term framing, Tripathi
and Pandey (2017) defined price framing as communicating or re-describing price
information in several ways, common examples for price framing are drip pricing, price
partitioning and reference pricing. With the effect of price framing, customers are
expected to favour a particular format of framing than others even if all offers are
economically equivalent (Jin Yoon et al., 2010).

9
For hotel revenue management, price framing is applied with rate fences, as
the price differences can be framed as a discount or surcharge to the regular price (Kimes
& Wirtz, 2003; Wirtz & Kimes, 2007). The studies explained in terms of prospect theory
(Kahneman & Tversky, 1979) that customers see discounts as their gain, and see
surcharges as their loss; customer gain is perceived as fairer than customer loss even if
both circumstances are economically equivalent.
Kimes and Wirtz (2003) confirmed the prospect theory, as they found out
that price framing as a discount is perceived fairer than surcharges which lead to less
negative perception and responses of customers. Wirtz and Kimes (2007) also
confirmed that price framing has a significant impact on respondents who are unfamiliar
with revenue management practices. Priester et al. (2020) that price framing makes it
harder for the customers to compare prices between each transaction, as it makes the
differences in prices less noticeable, which lead to more positive perceived fairness.
In this study, customers will be divided into three groups which are
customers that received a normal room rate (unframed price), customers that received a
discounted rate (price framed as customer gain), and customers that received a rate with
additional surcharges (price framed as customer loss). The differences in the levels of
familiarity with revenue management practices, perceived fairness, trust, satisfaction,
and customer loyalty will be examined among the three groups.
2.3 Rate Parity Rate parity can be defined as offering the same rate structure on all
distribution channels (Gazzoli et al, 2008). At the present, hotels offer rooms in various
places through both direct and indirect channels, and rate parity has become a conflict
between hotels and other indirect channels, especially online travel agencies (Nicolau
& Sharma, 2019). Rate parity policies are usually a clause in the contract between hotels
and online travel agencies (Sharma & Nicolau, 2019), which ensures that hotels will
offer the same rates on their platforms. The study also concluded that rate parity
agreement enhances the performance of the online travel agency but diminishes hotel
performance. Researchers still argue on the standpoint of rate parity, some researchers

10
believe that rate parity limits the freedom of hotels to manage pricing strategy, while
others believe that rate parity should be maintained (Biełuszko & Marciszewska, 2018).
Maintaining rate parity would increase price transparency, but hotel direct
channels might not be attractive, as they could not offer lower rates (Biełuszko &
Marciszewska, 2018). When more bookings come from indirect channels, hotels would
receive less profit because of the commission fees, especially for smaller hotels; Toh et
al. (2011) mentioned that chain hotels managed to negotiate 15-percent commission
rates with online travel agencies, while smaller hotels need to pay up to 30-percent.
However, the study also pointed out that smaller hotels still need to rely on these online
travel agencies to gain exposure as customers would look for hotels on online travel
agencies first. For these reasons, rate parity is not a desirable practice on the hotel side
(Biełuszko & Marciszewska, 2018; Sharma & Nicolau, 2019).
However, studies suggested that rate parity would lead to higher levels of
perceived fairness. Choi and Mattila (2009) identified that the multi-channel pricing
strategy has an impact on the level of perceived fairness of customers, especially the
ones with lower familiarity. Gazzoli et al. (2008) concluded that customers can get
confused by rate disparity which might make customers perceive the practices as unfair
which would further lead to negative effects on satisfaction, trust, and customer loyalty.
Biełuszko and Marciszewska (2018) mentioned that when rate parity is not achieved
across different selling channels, the trust might be lost. Demirciftci et al. (2010) believe
that having similar prices in all channels would make customers have less motivation to
search for more information which would result in trust toward the hotel.
Therefore, this study would explore the differences in the level of familiarity
with revenue management practices, perceived fairness, trust, satisfaction and customer
loyalty among customers who found rate parity, rate disparity and customers who did
not compare rates.
2.4 Familiarity with Revenue Management Practices The longer revenue management practices are being used, the more
customers are being familiar with the practices (Kimes, 1994). In other words,
familiarity is created when customers undergo similar transactions many times (Mcguire

11
& Kimes, 2006). The study also mentioned that in 1994, customers saw that revenue
management practices of the airline industry are fairer than the practices in the hotel
industry, however in 2002, when the revenue management practices in the hotel industry
are more common, the same survey was distributed, and the result showed that there are
no differences in perceived fairness between the two industries.
Wirtz and Kimes (2007) explained that customers with higher familiarity
with revenue management understand both sides of rate fences on different transactions
and perceive that they are dissimilar, therefore, they tend to not compare the price of
their transaction with other transactions that are in different fencing conditions. On the
other hand, customers that are unfamiliar with revenue management practices cannot
see the differences between transactions with different fencing conditions and would
compare their transactions across different fences, which would make them see revenue
management practices as unfair.
Many studies point out that familiarity with revenue management practices
has a positive influence on perceived fairness. Mcguire and Kimes (2006) tested four
waitlist-management policies in the context of restaurants and found out that familiarity
with the policies has an impact on perceived fairness for three out of four policies. Wirtz
and Kimes (2007) confirmed that familiarity moderated the relationship between price
framing and both sides of rate fences on perceived fairness. Suklabaidya and Singh
(2017); and Tang et al. (2019) also confirmed the positive relationship between
familiarity and perceived fairness in revenue management practices. In addition, not
only perceived fairness is being impacted by familiarity, but familiarity also impacts
trust. Gefen (2000) also identified in the e-commerce context that familiarity has an
effect on trust.
Therefore, as previous literature emphasised the importance of familiarity
with revenue management practices, this study will examine the effect of familiarity
with hotel revenue management practices on perceived fairness, trust, satisfaction and
customer loyalty.

12
2.5 Information Adequacy Because rate fences with different conditions and restrictions are being
implemented in revenue management practices, information communicated to the
customers about the prices and restrictions are crucial. This information makes
customers understand the reason behind the price differences and makes them feel that
revenue management practices are more acceptable (Ivanov & Zhechev, 2012). Kimes
(1994) also mentioned that information has an important role for the customer to
evaluate a transaction, and hotels can manage the amount and type of information that
customer received which would have an impact on customers’ acceptability. Even for
customers with a low level of familiarity with revenue management practices, their
perception of fairness could be increased if the information is provided to them
beforehand (Mcguire & Kimes, 2006).
Previous studies examined the amount and types of information that are
communicated to the customers and their effect on acceptability and perceived fairness.
Kimes (1994) found out the relationship between different amount and types of
information in four scenarios and perceived fairness. When all pricing information is
available for the customers, customers tend to accept the price differences more than the
ones that not all pricing information is available. In addition, the scenario where
discounts are available but are not communicated to the customers, it was rated as
unacceptable. This shows the relationship between information adequacy and perceived
fairness.
Choi & Mattila (2005; 2006) also confirmed that different amount of
information influences the level of perceived fairness. Three scenarios are given,
namely, no information, limited information and full information, and the result shows
that there is a significant difference in the level of fairness for no information scenario
and full information scenario. In addition, even when customers get the higher rates, but
full information is given to them, they tend to see the revenue management practices as
almost fair. Méatchi and Camus (2020), mentioned that when clear and accurate
information is provided, the perceived fairness and price acceptance of the customers
are higher. Ivanov and Zhechev (2012), mentioned that if the information is hidden, trust
could be destroyed.

13
Hence, this study will examine the differences in the level of familiarity with
revenue management, perceived fairness, trust, satisfaction, and customer loyalty
among customers that received no information about pricing, partial information about
pricing and full information about pricing.
2.6 Perceived Fairness Perceived fairness is related to the term ‘reference transaction’ and
‘reference price’. Kimes (1994) explained that reference transactions are the customer's
perception of how a transaction should be carried out and how much does the service
cost, while reference price could be inferred from the customer’s past transactions or
the market price. As reference transactions and reference price are in the mind of the
customers, if the value to the company is more than or not equal to the value to the
customer, they would feel that the transaction is unfair (Kimes, 1994). Customers may
also perceive that a transaction is unfair when they pay more for a similar service but do
not receive a better service (Erdem & Jiang, 2016).
The dual entitlement principle is the ground rule for fairness, the principal
mentioned that the customers believed that they are entitled to their reference transaction
and companies are entitled to their reference profit (Kahneman et al., 1986). The dual
entitlement comes from two rules; if the firm’s cost increased the firm may increase its
price, but if the firm’s cost did not increase, the firm may not increase its price. So, if
the rules are violated, customers would perceive the pricing as unfair. Hence, revenue
management practices are violating the principle of dual entitlement as the increase in
price is not in accordance with the increased cost, it makes such practices perceived as
unfair (Wirtz & Kimes, 2007).
Marielza and Monroe (1994) suggested that equity theory could also be
applied in the pricing context. Equity theory (Adams, 1965) proposed that for a
transaction to be fair, there must be equality in terms of outcomes and inputs of both
parties in the transaction. Marielza and Monroe (1994) explained that in the pricing
context, outcome or gain could be defined as a product or service to be received, input
or loss could be seen as the price to be paid. In addition, transactions could be compared
in three perspectives, comparing with self in the past, comparing with other customers

14
(Kimes & Wirtz, 2003), and comparing with different organisations (Xia et al., 2004).
Hence, if customers compare the ratio between the outcomes and inputs to other parties
and see that it is inequality, they may perceive the price as unfair (Priester et al., 2020).
Perceived fairness and satisfaction are difference from one another, many
marketing literature have proven that perceived fairness in the pricing context is an
important predictor of customer satisfaction (Dai, 2010). In addition, many studies show
that if the price is perceived as unfair, it would influence satisfaction, purchasing
intentions and negative responses from the customers (Xia et al.,2004). Yeoman (2016)
also mentioned that lack of perceived fairness would create an adverse effect on the
level of satisfaction of customers, intention to recommend and customer loyalty. Choi
and Mattila (2009) mentioned previous studies regarding fairness concerns in the pricing
context that it could result in customer satisfaction, goodwill, and loss in business. In
addition to the effect of perceived fairness on satisfaction and customer loyalty, previous
literature (Chen & Chou, 2012; Setiawan et al., 2020) also emphasises the influence of
perceived fairness on trust.
Hence, as many studies have highlighted the importance of perceived
fairness, this study will examine the influences of perceived fairness on trust,
satisfaction, and customer loyalty in the context of hotel revenue management.
2.7 Trust Trust is an important concept in many fields including economics, social
psychology, sociology, and marketing; in marketing, trust is the important variable
associated with the long-term exchange relationship which is crucial for a business to
be successful (Garbarino & Lee, 2003). Trust is the most universal foundation for every
human interaction or exchange, with trust, it means that the tendency of another party
not performing their obligations is reduced (Gundlach & Murphy, 1993). Consumer
trust is defined as the consumer's expectation on the service provider that the service
provider is reliable and could deliver its promise (Sirdeshmukh et al., 2002).
In a dynamic pricing context, trust and perceived fairness are associated
with each other as customers who received a fence disadvantage would perceive lower
fairness, lower trust and also lower repurchase intention (Weisstein et al., 2013). Many
15
studies have confirmed that trust has a positive relationship with customer loyalty,
namely, intention to purchase (Chiang & Jang, 2007; Sparks & Browning, 2011). Lie et
al. (2019) found out that there is a significant relationship between trust and satisfaction,
and a significant relationship between trust and loyalty.
Therefore, this study would examine the influence of trust toward hotels on
satisfaction and customer loyalty in the context of hotel revenue management.
2.8 Satisfaction In general, satisfaction could be defined as the evaluation of how well a
product could solve a need (Nguyen et al., 2020). Jimenez Mori (2021) defined
satisfaction as the result of a comparison between expectation and post-consumption of
service performance.
Similarly, in terms of customer satisfaction, Hallowell (1996) mentioned
that many service management studies stated that customer satisfaction is the result of
value received comparative to value expected perceived by customers in a transaction;
the components of the values include perceived service quality, price, and acquisition
costs. Yoon and Uysal (2005) also mentioned that customer satisfaction is the
relationship between the cost of the product or service and the benefits that customers
expected.
Price is associated with customer satisfaction because the price that
customers paid has a direct effect on consumer surplus (Charuvatana, 2019). The author
explained that as revenue management practices created dynamic pricing, its view of
fairness in the perception of customers could affect the level of satisfaction.
Many studies mentioned the relationship between perceived fairness and
satisfaction (Xia et al., 2004; Yeoman, 2016; Choi & Mattila, 2009; Dai, 2010), also
these two factors are the antecedent of customer loyalty. Choi and Mattila (2005)
mentioned that satisfaction and perceived fairness have an effect on repurchase
intention, and also these two factors are good predictors for booking intention.
McDougall and Levesque (2000) found out that satisfaction and the likelihood of
repurchasing are directly related to each other. He and Jun (2010) confirmed the positive
16
relationship between customer satisfaction and behaviour intention, including word of
mouth and recommendations.
Hence, many evidence have confirmed the relationship between satisfaction
and customer loyalty, this study would examine the effect of satisfaction on customer
loyalty in the context of hotel revenue management.
2.9 Customer Loyalty Customer Loyalty is defined as the intention of a customer to patronage a
specific product or service over a period of time, and loyalty consists of two main
components, attitudinal and behavioural (Senić & Marinković, 2014). The paper
explained that the attitudinal component can be seen as customers' tendency to favour
some value of the brand over time, and a behavioural component is when customers
repeatedly purchase the same brand.
Oliver (1999) proposed that there are four phases of customer loyalty,
cognitive, affective, conative and action; the first three phases are considered as
attitudinal loyalty. The first phase, cognitive loyalty is based on customers’ belief about
a brand which could come from past experiences or other people’s experiences. The
second phase, affective loyalty is based on customer’s attitudes, whether they like the
product or service or not. The third phase, conative loyalty is the behavioural intention
which implies a commitment to repurchase the same product or service provider. The
last phase, action loyalty or behavioural loyalty is when intentions are converted into
action, it is when customers have overcome obstacles that prevent them from
repurchasing. Han and Wood (2014) mentioned that behavioural loyalty is established
by multi-components of the three levels of attitudinal loyalty.
Attitudinal loyalty phases use the psychological and perceptual process of a
customer as a loyalty indicator, while frequency and volume of purchase are the
indicators for behavioural loyalty (Han & Wood, 2014). Cheng (2011) also mentioned
that attitudinal loyalty is a psychological construct, but behavioural loyalty is a
substantial element.
An example of customer loyalty that is influenced by revenue management
practices, perceived fairness, trust and satisfaction are purchase intentions and negative

17
emotions (Xia et al., 2004), repurchase intention (McDougall & Levesque, 2000; Choi
& Mattila, 2005; Lee et al., 2020), intention to recommend (He & Jun, 2010; Yeoman,
2016; Lee et al., 2020), customers’ goodwill (Choi & Mattila, 2009), and switching
intention (Vu et al., 2020), positive and negative word of mouth (Xia et al., 2004; He &
Jun 2010; Lii & Sy, 2009; Chen et al., 2010; Lee et al., 2020), future purchase behaviour
(McDougall & Levesque, 2000), switching behaviour (Li & Sy, 2009), complaint (Xia
et al., 2004; Li & Sy, 2009).
This study would explore the four levels of customer loyalty separately.
However, in the overall level, this study will divide customer loyalty into two main
variables: attitudinal loyalty and behavioural loyalty. Attitudinal loyalty will consist of
three elements including cognitive loyalty, affective loyalty, and conative loyalty.

18
CHAPTER III
METHODOLOGY
3.1 Research Methodology The aim of this study is to examine the effect of revenue management
practices on perceived fairness, trust, satisfaction, and customer loyalty. This study will
use the quantitative approach and will use the benefits of the convenience sampling
purpose. In addition, differences in terms of the level of familiarity with revenue
management practices, perceived fairness, trust, satisfaction and customer loyalty
among demographic factors, customer’s behaviour on hotel reservation and factors
relating to hotel revenue management would also be examined.
3.3.1 Sampling
Cochran (1977) proposed Cochran’s sample size formula which is used to
calculate the sample size in regard to the desired level of confidence when population
size is infinite. The formula is n0 = (z2 pq / e2); where “n0 is the sample size, z is the
selected critical value of the desired confidence level, p is the estimated proportion of
an attribute that is present in the population, q = 1 - p and e is the desired level of
precision” (Sarmah & Hazarika, 2012). The confidence level (e) is normally 5 percent
(0.05) which resulted in z of 1.96. Assuming maximum variability of 50% (p = 0.5)
would make n0 = 385 (n0 = (1.96)2 (0.5) (1 - 0.5) / (0.05)2).
Respondents with the ability and willingness to participate are approached
online for an online questionnaire survey. Online questionnaire surveys are being used
for this study because of the COVID-19 pandemic situation. Respondents must be
domestic tourists who are older than 18 years old and must have booked and stayed at a
3-5 Star hotel, within the past 12 months. In addition, in the past 5 years, respondents
must have visited or stayed in the same area as the hotel that they have booked in the
past 12 months; screening questions will be used to filter out irrelevant samples.

19
3.3.2 Research Instrument
The online questionnaire survey is divided into five main parts. The first
part consisted of three screening questions where irrelevant samples will be filtered out
to ensure that respondents of the survey are suitable for this study.
In the second part, respondents would respond to questions regarding hotel
revenue management practices. The first factor is familiarity with revenue management;
respondents would need to rate, based on their hotel reservation, a 5-items scale adapted
from Mcguire and Kimes (2006); Wirtz & Kimes (2007); Tang et al. (2019). For rate
fences, price framing, rate parity, and information adequacy, data will be collected
categorically.
In the third part, respondents will be asked to rate their perception toward
the hotel of their stay. For perceived fairness, the scales from Vu et al., (2020) are
adapted to match the context of this study. For trust, the scales from Kim et al., (2017)
are adapted. For satisfaction, the 4-items scale from Suhartanto (2011) is being used.
The fourth part consisted of scales related to customer loyalty in four
different aspects, cognitive loyalty, affective loyalty, conative loyalty, and behavioural
loyalty. For the first three factors which are attitudinal loyalty, respondents would need
to rate a scale adapted from Suhartanto (2011). For behavioural loyalty, the scales are
adapted from Suhartanto (2011) and Candan et al., (2013).
In the last part, demographic features and hotel booking behaviour of
respondents are being asked. Demographic features and hotel booking behaviour
questions are listed in the end to make respondents feel more comfortable after
completing other parts of the survey first.
All scales in this study are 7-points Likert scales (1 = Strongly Disagree, 2
= Disagree, 3 = Somewhat Disagree, 4 = Neutral, 5 = Somewhat Agree, 6 = Agree, 7 =
Strongly Agree), as many literature on revenue management and perceived fairness used
the 7-points Likert scales in their studies (e.g. Kimes & Wirtz, 2003; Wirtz & Kimes,
2007; Suhartanto, 2011; Lee et al., 2020; Priester et al., 2020).
As this study focuses on domestic tourists in Thailand, the online
questionnaire survey would be translated into Thai language for the benefit of clear
understanding for the respondents. To ensure the quality and correctness of the

20
translation, the translated version of the survey is cross-checked with the original
version for all instructions and questions.
3.2 Data Collection Primary data will be collected for further analysis, with the target of at least
400 responses for the online questionnaire survey. Even though the questionnaires are
distributed online, contact details of the author would be included to ensure that
respondents would be able to reach out for any clarification of the instructions and
questions. Distribution online questionnaire surveys would make respondents feel more
comfortable during the COVID-19 pandemic as this method is non-physical contact and
respondents would be more convenient to respond to the survey. Respondents are
assumed to fully understand the survey if no questions are raised. For the data analysis,
Statistical Package Social Science (SPSS) would be used. Reliability analysis, t-test,
ANOVA test and regression analysis will be used for this study.

21
CHAPTER IV
FINDINGS
A total of 417 samples were collected in this study. Respondents are
categorised into different groups according to their demographic factors, behaviour on
hotel reservation and factors related to revenue management practices as follows:
4.1 Demographics Features of Respondents 4.1.1 Gender
Table 4.1 Frequency - Gender
Gender Frequency Percentage
Female 271 65.0%
Male 101 24.2%
LGBTQ+ 45 10.8%
For gender, 271 respondents are female (65.0%), 101 are male (24.2%), and
45 are LGBTQ+ (10.8%).
4.1.2 Current Resident
Table 4.2 Frequency – Current Resident
Current Resident Frequency Percentage
Bangkok 268 64.3%
Bangkok’s Surrounding 74 17.7%
Others 75 18.0%
In terms of current residents, 268 respondents live in Bangkok (64.3%), 74
respondents live in Bangkok’s surrounding provinces (17.7%) - including Nonthaburi,
Pathum Thani, Nakhon Pathom, Samut Sakhon and Samut Prakan - and 75 respondents
live outside of the Bangkok Metropolitan Region (18.0%).

22
4.1.3 Age Range
Table 4.3 Frequency – Age Range
Age Range Frequency Percentage
18 - 24 Years Old 54 12.9%
25 - 40 Years Old 287 68.8%
41 Years Old or Older 76 18.2%
In terms of age range, 54 respondents are 18 - 24 years old (12.9%), 287
respondents are 25 - 40 years old (68.8%), and 76 respondents are 41 years old or older
(18.2%).
4.1.4 Marital Status
Table 4.4 Frequency – Marital Status
Marital Status Frequency Percentage
Single 287 68.8%
Married 112 26.9%
Others 18 4.3%
For marital status, 287 respondents are single (68.8%), 112 respondents are
married (26.9%), and 18 responses are mixtures from other groups (4.3%) including
divorced, widowed, and preferred not to answer.

23
4.1.5 Education Level
Table 4.5 Frequency – Education Level
Education Level Frequency Percentage
Lower than bachelor’s degree 9 2.2%
Bachelor's Degree 271 65.0%
Master's Degree 126 30.2%
PhD / Doctoral Degree 11 2.6%
Regarding education level, 9 respondents have a degree that is lower than
bachelor’s degree (2.2%), 271 respondents hold a bachelor’s degree (65.0%), 126
respondents hold a Master’s Degree (30.2%), and 11 respondents hold a PhD or a
Doctoral Degree (2.6%).
4.1.6 Monthly Income
Table 4.6 Frequency – Monthly Income
Monthly Income Frequency Percentage
Less than 15,000 Baht 42 10.1%
15,001 - 25,000 Baht 67 16.1%
25,001 - 50,000 Baht 178 42.7%
50,001 - 100,000 Baht 83 19.9%
More than 100,000 Baht 47 11.3%
For monthly income, 42 respondents have a monthly income of 15,000 Baht
or lower (10.1%), 67 respondents have a monthly income of 15,001 - 25,000 Baht
(16.1%), 178 respondents have a monthly income of 25,001 - 50,000 Baht (42.7%), 83
respondents have a monthly income of 50,001 - 100,000 Baht (19.9%), and 47
respondents have a monthly income more than 100,000 Baht (11.3%).

24
4.1.7 Occupation
Table 4.7 Frequency – Occupation
Occupation Frequency Percentage
Private Employee 225 54.0%
Business Owner 80 19.2%
Government Employee 46 11.0%
Student 42 10.1%
Others 24 5.8%
In terms of occupation, 255 responses are from private employees (54.0%),
80 responses are from business owners (19.2%), 46 responses are from government
employees (11.0%), 42 responses are from students (10.1%), and 24 responses are from
other groups (5.8%) including freelancers, state enterprise employees, NGOs
employees, investors, stay-at-home parents and unemployed.
4.2 Respondents’ Behaviour on Hotel Reservation & Factors Related
to Revenue Management 4.2.1 Purpose of Stay
Table 4.8 Frequency – Purpose of Stay
Purpose of Stay Frequency Percentage
Leisure 382 91.6%
Business 35 8.4%
Out of 417 respondents, 382 respondents travel for leisure purposes
(91.6%), while 35 respondents travel for business purposes (8.4%).

25
4.2.2 Hotel Location
Table 4.9 Frequency – Hotel Location
Hotel Location Frequency Percentage
Bangkok 103 24.7%
Chonburi 82 19.7%
Phuket 46 11.0%
Prachuap Khiri Khan 36 8.6%
Chiang Mai 25 6.0%
Others 125 30.0%
In terms of hotel location, 103 respondents stayed at hotels in Bangkok
(24.7%), followed by 82 in Chonburi (19.7%), 46 in Phuket (11.0%), 36 in Prachuap
Khiri Khan (8.6%), 25 in Chiang Mai (6.0%), and 125 in other provinces (30.0%).
4.2.3 Companion
Table 4.10 Frequency – Companion
Companion (Multiple Answers) Frequency
Boyfriend/ Girlfriend 138
Family Member 132
Friend 126
Spouse 58
Travel Alone 41
Colleague 23
For the companion (multiple answers allowed), 138 respondents travelled
with their boyfriend or girlfriend, 132 travelled with family members, 126 travelled with
friends, 58 travelled with their spouse, 41 travelled alone, and 23 travelled with
colleagues.

26
4.2.4 Number of Times Stayed at the Hotel
Table 4.11 Frequency – Times Stayed at the Hotel
Times Stayed at the Hotel Frequency Percentage
1st times 212 50.8%
2 - 3 Times 138 33.1%
More than 3 Times 67 16.1%
In terms of the number of times stayed at the hotel, 212 responses are from
people who stayed at the hotel for the first time (50.8%), 138 responses are from people
who have stayed at the same hotel for 2 - 3 times (33.1%), and 67 responses are from
people who stayed at the same hotel for more than 3 times (16.1%).
4.2.5 Hotel Rating
Table 4.12 Frequency – Hotel Rating
Hotel Rating Frequency Percentage
3-Star Hotel 64 15.3%
4-Star Hotel 148 35.5%
5-Star Hotel 205 49.2%
In terms of hotel ratings, 64 respondents stayed at 3-Star hotels (15.3%),
148 respondents stayed at 4-Star hotels (35.5%) and 205 respondents stayed at 5-Star
hotels (49.2%).

27
4.2.6 Hotel Type
Table 4.13 Frequency – Hotel Type
Hotel Type Frequency Percentage
Independent Hotel 118 28.3%
Domestic Chain Hotel 115 27.6%
International Chain Hotel 184 44.1%
For hotel type, 118 respondents stayed at non-chain or independent hotels
(28.3%), 115 respondents stayed at domestic chain hotels (27.6%), and 184 respondents
stayed at international chain hotels (44.1%).
4.2.7 Cancellation Policy
Table 4.14 Frequency – Cancellation Policy
Cancellation Policy Frequency Percentage
Fully Refundable 256 61.4%
Partially Refundable 50 12.0%
Non-Refundable 111 26.6%
In terms of non-physical rate fences by transaction characteristic, which is
the cancellation policy, 256 respondents reserved the hotel room under fully refundable
condition (61.4%), 50 respondents reserved the hotel room under partially refundable
condition (12.0%), and 111 respondents reserved the hotel room under non-refundable
condition (26.6%).

28
4.2.8 Booking Channel
Table 4.15 Frequency – Booking Channel
Booking Channel Frequency Percentage
Hotel Direct Channels 237 56.8%
Online Travel Agencies 175 42.0%
Traditional Travel Agencies 5 1.2%
For booking channel, out of 417 respondents, 237 respondents reserved the
hotel room through hotel direct channels (56.8%), including, hotel’s own website, phone
calls, emails, social media platforms and walk-ins, 175 respondents reserved the hotel
room via online travel agencies (42.0%), and only 5 respondents reserved the hotel room
via traditional travel agencies (1.2%).
4.2.9 Length of Stay
Table 4.16 Frequency – Length of Stay
Length of Stay Frequency Percentage
1 - 2 Nights 354 84.9%
3 - 5 Nights 57 13.7%
More than 5 Nights 6 1.4%
In terms of non-physical fences by consumption characteristic, which is the
length of stay, 354 respondents only stayed at the hotel for 1 - 2 nights (84.9%), 57
respondents stayed for 3 - 5 nights (13.7%), and only 6 respondents stayed for more than
5 nights (1.4%).
29
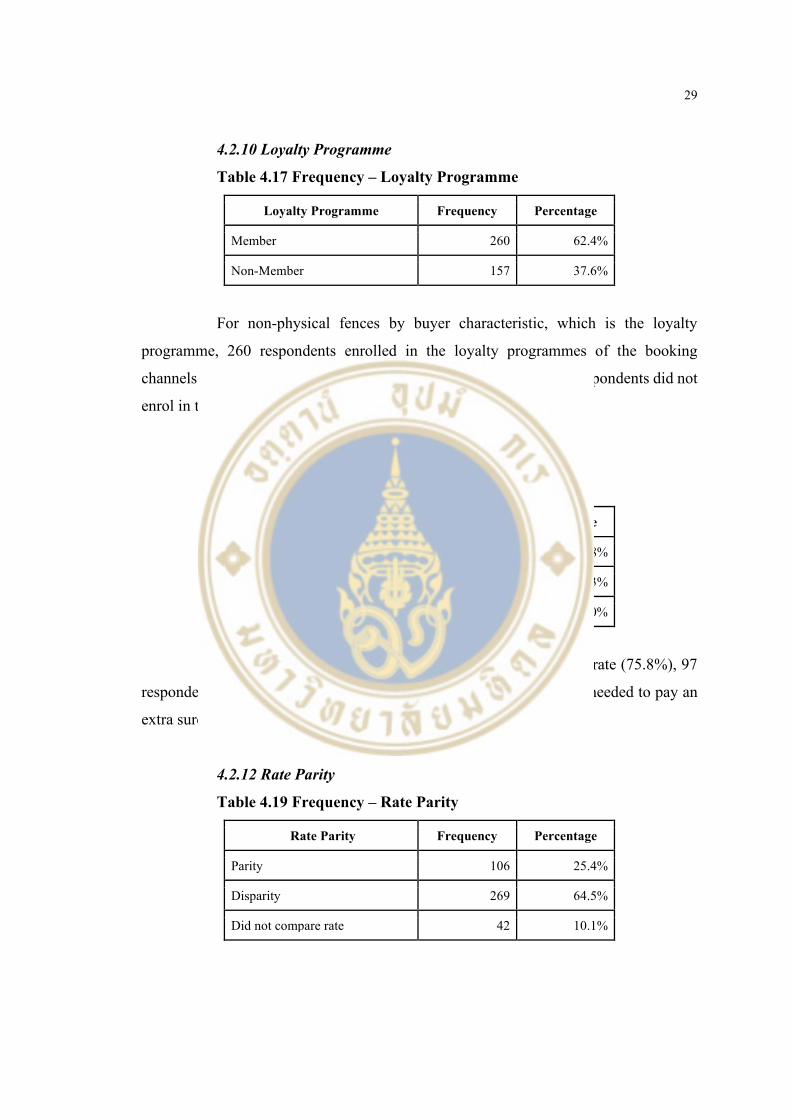
4.2.10 Loyalty Programme
Table 4.17 Frequency – Loyalty Programme
Loyalty Programme Frequency Percentage
Member 260 62.4%
Non-Member 157 37.6%
For non-physical fences by buyer characteristic, which is the loyalty
programme, 260 respondents enrolled in the loyalty programmes of the booking
channels that they have reserved the hotel room (62.4%), while 157 respondents did not
enrol in the loyalty programmes (37.6%).
4.2.11 Price Framing
Table 4.18 Frequency – Price Framing
Price Framing Frequency Percentage
Discount 316 75.8%
Normal Rate 97 23.3%
Surcharge 4 1.0%
For price framing, 316 respondents received a discounted rate (75.8%), 97
respondents received a normal room rate (23.3%), and 4 respondents needed to pay an
extra surcharge from the normal rate (1.0%).
4.2.12 Rate Parity
Table 4.19 Frequency – Rate Parity
Rate Parity Frequency Percentage
Parity 106 25.4%
Disparity 269 64.5%
Did not compare rate 42 10.1%

30
Regarding rate parity, 106 respondents have found rate parity among selling
channels (25.4%), 269 respondents experienced rate disparity (64.5%), and 42
respondents did not compare rates among each selling channel (10.1%).
4.2.13 Information Adequacy
Table 4.20 Frequency – Information Adequacy
Information Adequacy Frequency Percentage
Full Information 170 40.8%
Partial Information 129 30.9%
No Information 118 28.3%
In terms of information adequacy, 170 respondents received full detail of
information about how prices differ between each staying period (40.8%), 129
respondents received partial information that prices differ between each staying period
(30.9%), and 118 respondents did not receive any information about pricing at all
(28.3%).
4.2.14 ‘We Travel Together’ Campaign
Table 4.21 Frequency – ‘We Travel Together’ Campaign
‘We Travel Together’ Campaign Frequency Percentage
Yes 189 45.3%
No 228 54.7%
In terms of the ‘We Travel Together’ Campaign, which is the campaign
from the government that subsided a portion of room rates to promote domestic travel,
189 respondents have reserved the room under the ‘We Travel Together’ Campaign
(45.3%), and 228 respondents did not reserve the room under the campaign (54.7%).
31
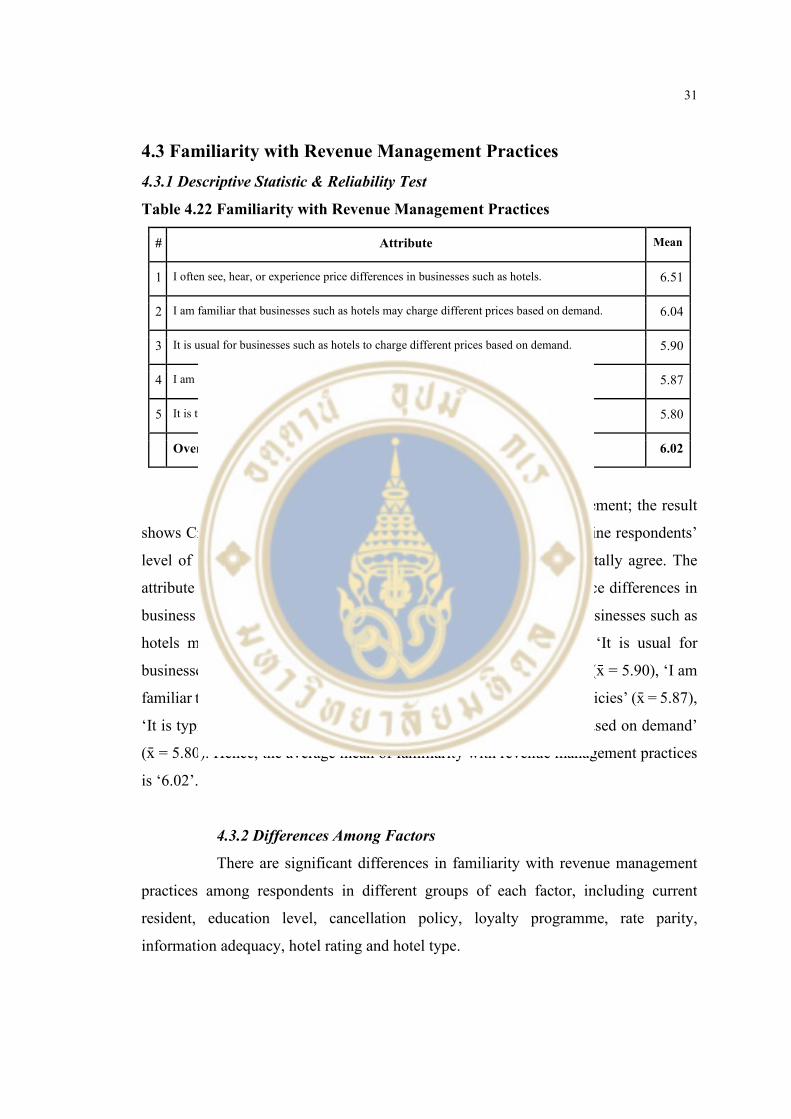
4.3 Familiarity with Revenue Management Practices 4.3.1 Descriptive Statistic & Reliability Test
Table 4.22 Familiarity with Revenue Management Practices
# Attribute Mean
1 I often see, hear, or experience price differences in businesses such as hotels. 6.51
2 I am familiar that businesses such as hotels may charge different prices based on demand. 6.04
3 It is usual for businesses such as hotels to charge different prices based on demand. 5.90
4 I am familiar that businesses such as hotels may offer different cancellation policies 5.87
5 It is typical for businesses such as hotels to charge different prices based on demand. 5.80
Overall Familiarity with Revenue Management Practices 6.02
There are 5 attributes for familiarity with revenue management; the result
shows Cronbach’s alpha of ‘.73’. Scales of 1 - 7 were used to determine respondents’
level of agreement; 1 represents totally disagree, and 7 represents totally agree. The
attribute with the highest mean is ‘I often see, hear, or experience price differences in
business such as hotels’ (x = 6.51), followed by ‘I am familiar that businesses such as
hotels may charge different prices based on demand’ (x = 6.04), ‘It is usual for
businesses such as hotels to charge different prices based on demand’ (x = 5.90), ‘I am
familiar that business such as hotels may offer different cancellation policies’ (x = 5.87),
‘It is typical for businesses such as hotels to charge different prices based on demand’
(x = 5.80). Hence, the average mean of familiarity with revenue management practices
is ‘6.02’.
4.3.2 Differences Among Factors
There are significant differences in familiarity with revenue management
practices among respondents in different groups of each factor, including current
resident, education level, cancellation policy, loyalty programme, rate parity,
information adequacy, hotel rating and hotel type.

32
4.3.2.1 Current Resident
Table 4.23 Familiarity with RM – Current Resident
For current residents, significant differences are found on overall familiarity
with revenue management practices (F = 3.649; ANOVA Sig. = .027), and on the
attribute: familiar that hotels may charge different prices (F = 6.655; ANOVA Sig. =
.001). Respondents in Bangkok (x = 6.08) have a higher mean of familiarity with
revenue management practices (Post Hoc Sig. = .022) than respondents that live outside
of the Bangkok Metropolitan Region (x = 5.79). In addition, residents in Bangkok (x =
6.16; Post Hoc Sig. = .001) and Bangkok’s surroundings (x = 6.08; Post Hoc Sig. =
.038) have a higher mean than residents outside of Bangkok Metropolitan Region (x =
5.60) on the attribute: familiar that hotels may charge different prices.
4.3.2.2 Education Level
Table 4.24 Familiarity with RM – Education Level
In terms of education level, there is a significant difference on the attribute:
familiar that hotels may offer different cancellation policies (F = 3.436; ANOVA Sig. =
.017). Respondents with a master’s degree (x = 6.02) have a higher mean than
respondents with a PhD or Doctoral Degree (x = 4.82) on this attribute (Post Hoc Sig. =
.040).

33
4.3.2.3 Cancellation Policy
Table 4.25 Familiarity with RM – Cancellation Policy
For cancellation policy, the result shows a significant difference on the
attribute: familiar that hotels may charge different prices (F = 3.903; ANOVA Sig. =
.021). Respondents that reserved the room under a fully refundable cancellation policy
(x = 6.16) have a higher mean than respondents that reserved the room under a partially
refundable cancellation policy (x = 5.70) on this attribute (Post Hoc Sig. = .036).
4.3.2.4 Loyalty Programme
Table 4.26 Familiarity with RM – Loyalty Programme
The result also points out the significant differences on overall familiarity
with revenue management and on all five attributes between respondents who are the
member and non-member of loyalty programmes. Members of loyalty programmes (x

34
= 6.13) have a higher mean of overall familiarity with revenue management practices (t
= 3.430; Sig. = .001) than non-members (x = 5.84). In addition, members (x = 6.16;
6.02; 5.92; 5.99; 6.57) also have higher means than non-members (x = 5.85; 5.69; 5.59;
5.68; 6.40) respectively on all five attributes: familiar that hotels may charge different
prices (t = 2.550 ; Sig. = .011); it is usual for hotels to charge different prices (t = 2.478
; Sig. = .014); it is typical for hotels to charge different prices (t = 2.483; Sig. = .013);
familiar that hotels may offer different cancellation policies (t = 2.198; Sig. = .029);
often see, hear, or experience price differences (t = 2.297; Sig. = .022).
4.3.2.5 Rate Parity
Table 4.27 Familiarity with RM – Rate Parity
For rate parity, there are significant differences on the attribute: often see,
hear, or experience price differences (F =7.454; ANOVA Sig. = .001). Respondents who
found rate disparity (x = 6.61) have a higher mean than respondents who found rate
parity (x = 6.35; Post Hoc Sig. = .006) and respondents that did not compare rates (x =
6.26; Post Hoc Sig. = .013) on this attribute.

35
4.3.2.6 Information Adequacy
Table 4.28 Familiarity with RM – Information Adequacy
In terms of information adequacy, significant differences are identified on
overall familiarity with revenue management practices (F = 4.510; ANOVA Sig. =
.012), and on the attributes: it is usual for hotels to charge different prices (F = 4.443;
ANOVA Sig. = .012), often see, hear, or experience price differences (F = 5.470;
ANOVA Sig. = .005). Respondents who received full information about pricing (x =
6.17) have a higher mean of overall familiarity with revenue management practices
(Post Hoc Sig. = .013) than respondents who received partial information (x = 5.89).
Furthermore, respondents with full information (x = 6.12; 6.56) also have higher means
than respondents with partial information (x = 5.69; 6.33) respectively on the attributes:
it is usual for hotels to charge different prices (Post Hoc Sig. = .014); often see, hear, or
experience price differences (Post Hoc Sig. = .022). In addition, respondents with no
information (x = 6.62) have a higher mean than respondents with partial information (x
= 6.33) on the attribute: often see, hear, or experience price differences (Post Hoc Sig.
= .007).

36
4.3.2.7 Hotel Rating
Table 4.29 Familiarity with RM – Hotel Rating
There are also significant differences among respondents staying in hotels
with different ratings on overall familiarity with revenue management practices (F =
3.683; ANOVA Sig. = .026), and the attribute: familiar that hotels may charge different
prices (F = 3.392; ANOVA Sig. = .035). Respondents who stayed at 5-Star hotels (x =
6.14) have a higher mean of overall familiarity with revenue management practices
(Post Hoc Sig. = .037) than respondents who stayed at 4-Star hotels (x = 5.91). In
addition, respondents in 5-Star hotels (x = 6.20) also have a higher mean than
respondents in 4-Star hotels (x = 5.88) on the attribute: familiar that hotels may charge
different prices (Post Hoc Sig. = .040).

37
4.3.2.8 Hotel Type
Table 4.30 Familiarity with RM – Hotel Type
In term of hotel type, significant differences are found on overall familiarity
with revenue management practices (F = 5.990; ANOVA Sig. = .003), and the attributes:
familiar that hotels may charge different prices (F = 4.302; ANOVA Sig. = .014), it is
typical for hotels to charge different prices (F = 3.572; ANOVA Sig. = .029), often see,
hear, or experience price differences (F = 4.548; ANOVA Sig. = .011). Respondents
who stayed at international chain hotels (x = 6.18) have a higher mean of overall
familiarity with revenue management practices than respondents who stayed at domestic
chain hotels (x = 5.89; Post Hoc Sig. = .011) and independent hotels (x = 5.90; Post Hoc
Sig. = .015). In addition, respondents in international chain hotels (x = 6.23; 5.99) also
have higher means than respondents in domestic chain hotels (x = 5.90; 5.59)
respectively on the attributes: familiar that hotels may charge different prices (Post Hoc
Sig. = .049); it is typical for hotels to charge different prices (Post Hoc Sig. = .039).
Furthermore, respondents in international chain hotels (x = 6.23; 6.63) also have higher

38
means than respondents in independent hotels (x = 5.89; 6.40) respectively on the
attributes: familiar that hotels may charge different prices (Post Hoc Sig. = .041); often
see, hear, or experience price differences (Post Hoc Sig. = .024). However, there are no
significant differences between respondents in domestic chain hotels and independent
hotels.
4.4 Perceived Fairness 4.4.1 Descriptive Statistic & Reliability Test
Table 4.31 Perceived Fairness
# Attribute Mean
1 Considering all things, the room rate that you received is reasonable. 5.95
2 Considering all things, the room rate that you received is appropriate. 5.94
3 Considering all things, the room rate that you experienced is right. 5.92
4 Considering all things, the room rate that you received is fair to both sides: yourself and the hotel 5.82
5 Considering all things, the room rate that you received is fair to other customers. 5.77
Overall Perceived Fairness 5.88
There are 5 attributes for perceived fairness; the result shows Cronbach’s
alpha of ‘.90’. Scales of 1 - 7 were used to determine respondents’ level of agreement;
1 represents totally disagree, and 7 represents totally agree. The attribute with the
highest mean is ‘Considering all things, the room rate that you received is reasonable’
(x = 5.95), followed by ‘Considering all things, the room rate that you received is
appropriate’ (x = 5.94), ‘Considering all things, the room rate that you experienced is
right’ (x = 5.92), ‘Considering all things, the room rate that you received is fair to both
sides: yourself and the hotel’ (x = 5.82), ‘Considering all things, the room rate that you
received is fair to other customers’ (x = 5.77). Hence, the average mean of perceived
fairness is ‘5.88’.

39
4.4.2 Differences Among Factors
There are significant differences in perceived fairness among respondents
in different groups of each factor, including current resident, loyalty programme, price
framing, information adequacy, hotel rating and hotel type.
4.4.2.1 Current Resident
Table 4.32 Perceived Fairness – Current Resident
For current residents, there is a significant difference in the attribute: the
rate that you received is right (F = 4.058; ANOVA Sig. = .018). Respondents who live
in Bangkok’s surrounding provinces (x = 6.16) have a higher mean than respondents
who live in Bangkok (x = 5.83) on the attribute: the rate that you received is right (Post
Hoc Sig. = .020).
4.4.2.2 Loyalty Programme
Table 4.33 Perceived Fairness – Loyalty Programme
In terms of loyalty programmes, members (x = 6.03) have a higher mean
than non-member (x = 5.83) on the attribute: the rate that you received is reasonable (t
= 2.216; Sig. = .027).
4.4.2.3 Price Framing
Table 4.34 Perceived Fairness – Price Framing
For price framing, a significant difference is found on the attribute: the rate
that you received is reasonable (F = 3.545; ANOVA Sig. = .030). Respondents that
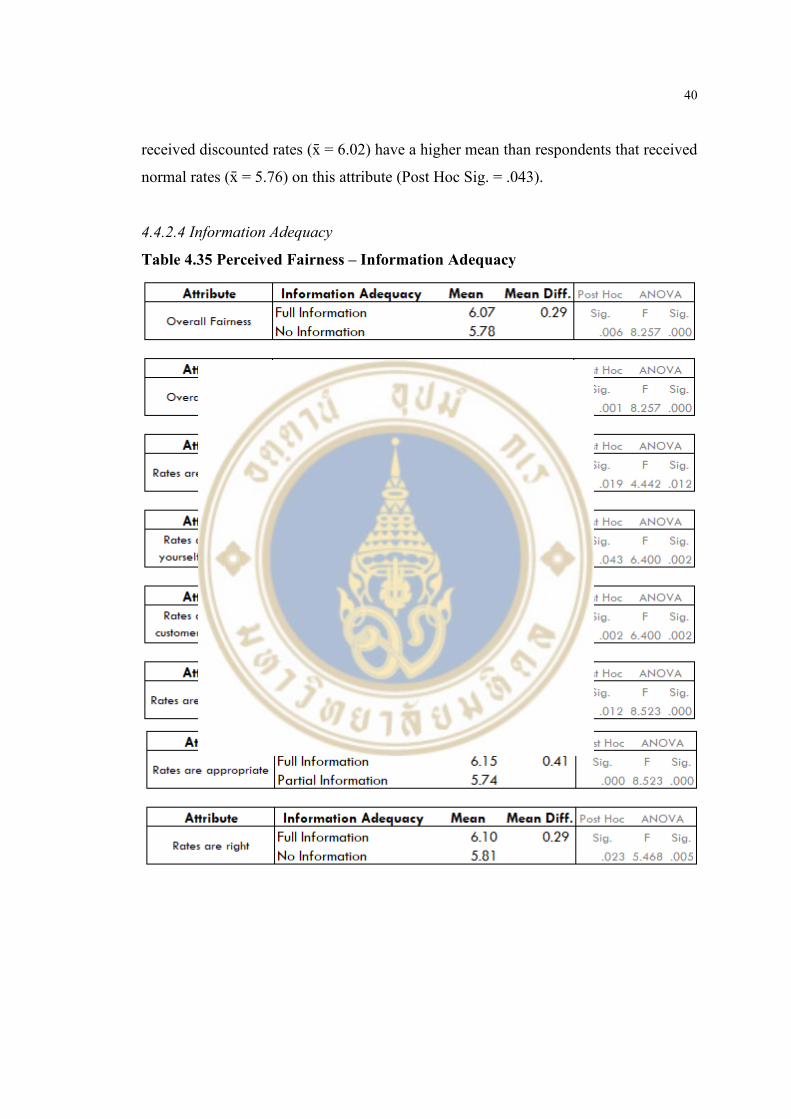
40
received discounted rates (x = 6.02) have a higher mean than respondents that received
normal rates (x = 5.76) on this attribute (Post Hoc Sig. = .043).
4.4.2.4 Information Adequacy
Table 4.35 Perceived Fairness – Information Adequacy

41
In terms of information adequacy significant differences are found on
overall perceived fairness (F = 8.257; ANOVA Sig. = .000) and on all 5 attributes: the
rate that you received is reasonable (F = 4.442; ANOVA Sig. = .012), the rate that you
received is fair for yourself and the hotel (F = 6.400; ANOVA Sig. = .002), the rate that
you received is appropriate (F = 8.523; ANOVA Sig. = .000), the rate that you received
is right (F = 5.468; ANOVA Sig. = .005), the rate that you received is fair for other
customers (F = 5.242; ANOVA Sig. = .006). Respondents that received full information
about pricing (x = 6.07) have a higher mean of overall perceived fairness than
respondents that received partial information (x = 5.73; Post Hoc Sig. = .001), and
respondents that received no information (x = 5.78; Post Hoc Sig. = .006). Respondents
with full information (x = 6.11; 6.01; 6.15; 6.10; 5.96) also have higher means than
respondents with partial information (x = 5.82; 5.64; 5.74; 5.79; 5.66) respectively on
all attributes: the rate that you received is reasonable (Post Hoc Sig. = .019); the rate
that you received is fair for yourself and the hotel (Post Hoc Sig. = .002); the rate that
you received is appropriate (Post Hoc Sig. = .000); the rate that you received is right
(Post Hoc Sig. = .012); the rate that you received is fair for other customers (Post Hoc
Sig. = .027). Moreover, Respondents with full information (x = 6.01; 6.15; 6.10; 5.96)
also have higher means than respondents with no information (x = 5.74; 5.84; 5.81;
5.63) respectively on four attributes: the rate that you received is fair for yourself and
the hotel (Post Hoc Sig. = .043); the rate that you received is appropriate (Post Hoc Sig.
= .012); the rate that you received is right (Post Hoc Sig. = .023); the rate that you
received is fair for other customers (Post Hoc Sig. = .015). However, there are no
significant differences between respondents with partial information and respondents
with no information.
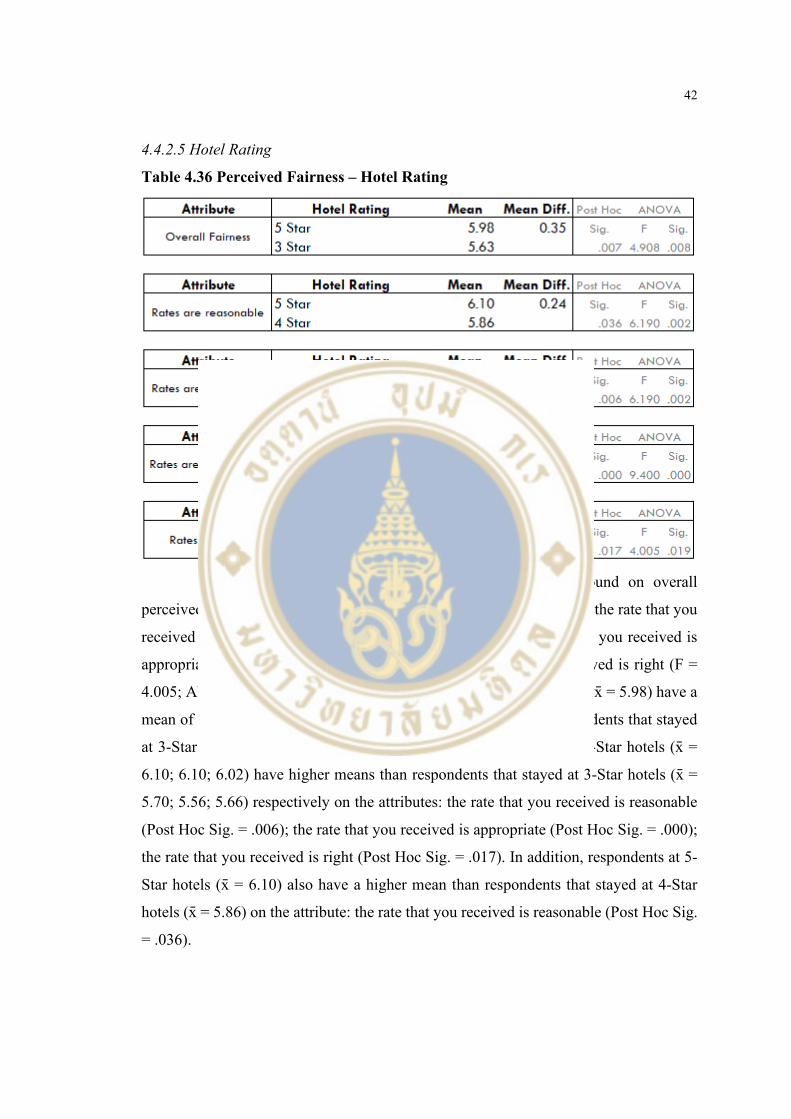
42
4.4.2.5 Hotel Rating
Table 4.36 Perceived Fairness – Hotel Rating
In terms of hotel rating, significant differences are found on overall
perceived fairness (F = 4.908; ANOVA Sig. = .008) and the attributes: the rate that you
received is reasonable (F = 6.190; ANOVA Sig. = .002), the rate that you received is
appropriate (F = 9.400; ANOVA Sig. = .000), the rate that you received is right (F =
4.005; ANOVA Sig. = .019). Respondents that stayed at 5-Star hotels (x = 5.98) have a
mean of overall perceived fairness (Post Hoc Sig. = .007) than respondents that stayed
at 3-Star hotels (x = 5.63). Furthermore, respondents that stayed at 5-Star hotels (x =
6.10; 6.10; 6.02) have higher means than respondents that stayed at 3-Star hotels (x =
5.70; 5.56; 5.66) respectively on the attributes: the rate that you received is reasonable
(Post Hoc Sig. = .006); the rate that you received is appropriate (Post Hoc Sig. = .000);
the rate that you received is right (Post Hoc Sig. = .017). In addition, respondents at 5-
Star hotels (x = 6.10) also have a higher mean than respondents that stayed at 4-Star
hotels (x = 5.86) on the attribute: the rate that you received is reasonable (Post Hoc Sig.
= .036).

43
4.4.2.6 Hotel Type
Table 4.37 Perceived Fairness – Hotel Type
For hotel type, significant differences also occur on overall perceived
fairness (F = 4.123; ANOVA Sig. = .017) and on the attribute: the rate that you received
is reasonable (F = 6.393; ANOVA Sig. = .002). Respondents that stayed at international
chain hotels (x = 6.00) have a higher mean of perceived fairness (Post Hoc Sig. = .038)
than respondents that stayed at domestic chain hotels (x = 5.77). In addition, respondents
in international chain hotels (x = 6.12) also have a higher mean than respondents in
domestic chain hotels (x = 5.77) on the attribute: the rate that you received is reasonable
(Post Hoc Sig. = .002).
4.5 Trust 4.5.1 Descriptive Statistic & Reliability Test
Table 4.38 Trust
# Attribute Mean
1 This seems like a good quality hotel. 6.50
2 I believe this hotel would be trustworthy. 6.49
3 I would have confidence in this hotel. 6.41
4 I believe this hotel would be responsible. 6.36
Overall Trust 6.44
There are 4 attributes for trust; the result shows the Cronbach’s Alpha of
‘.87’. Scales of 1 - 7 were used to determine respondents’ level of agreement; 1
represents totally disagree, and 7 represents totally agree. The attribute with the highest
mean is ‘This seems like a good quality hotel’ (x = 6.50), followed by ‘I believe this
hotel would be trustworthy’ (x = 6.49), ‘I would have confidence in this hotel’ (x =

44
6.41), ‘I believe this hotel would be responsible’ (x = 6.36). Hence, the average mean
of trust is ‘6.44’.
4.5.2 Differences Among Factors
There are significant differences in trust among respondents in different
groups of each factor, including current resident, monthly income, cancellation policies,
booking channel, loyalty programme, price framing, rate parity, information adequacy,
hotel rating, hotel type and the number of times stayed at the hotels.
4.5.2.1 Current Resident
Table 4.39 Trust – Current Resident
Significant differences are found among respondents with different current
residents on the attribute: this hotel would be responsible (F = 3.960; ANOVA Sig. =
.020). Respondents who currently live in Bangkok’s surrounding area (x = 6.57) have a
higher mean than respondents who currently live outside of the Bangkok Metropolitan
Region (x = 6.21) on this attribute (Post Hoc Sig. = .017).
4.5.2.2 Monthly Income
Table 4.40 Trust – Monthly Income
For monthly income, significant differences on overall trust (F = 3.671;
ANOVA Sig. = .006), and the attributes: this hotel would be trustworthy (F = 3.108;

45
ANOVA Sig. = .015), this hotel would be responsible (F = 2.907; ANOVA Sig. = .022).
Respondents with monthly income of 50,001 - 100,000 Baht (x = 6.58) have a higher
mean of overall trust (Post Hoc Sig. = .013) than respondents with monthly income less
than 15,000 Baht (x = 6.21). Furthermore, respondents with monthly income of 50,001
- 100,000 Baht (x = 6.66; 6.53) also have higher means than respondents with monthly
income less than 15,000 Baht (x = 6.26; 6.10) respectively on the attributes: this hotel
would be trustworthy (Post Hoc Sig. = .023); this hotel would be responsible (Post Hoc
Sig. = .033).
4.5.2.3 Cancellation Policy
Table 4.41 Trust – Cancellation Policy
For cancellation policy, significant differences on overall trust (F = 3.030;
ANOVA Sig. = .049) and the attribute: this hotel would be responsible (F = 4.678;
ANOVA Sig. = .010) are identified. Respondents that reserved the hotel under a fully
refundable cancellation policy (x = 6.49) have a higher mean for overall trust (Post Hoc
Sig. = .048) than respondents that reserved the hotel under a partially refundable
cancellation policy (x = 6.26). Furthermore, respondents with a fully refundable
cancellation policy (x = 6.45) also have a higher mean than respondents with a partially
refundable cancellation policy (x = 6.10) on the attribute: this hotel would be responsible
(Post Hoc Sig. = .013).

46
4.5.2.4 Booking Channel
Table 4.42 Trust – Booking Channel
In terms of booking channel, significant differences are found on overall
trust (F = 5.271; ANOVA Sig. = .005), and the attributes: this hotel would be trustworthy
(F = 4.806; ANOVA Sig. = .009), this seems like a good quality hotel (F = 4.323;
ANOVA Sig. = .014). Respondents that reserved the room through hotel direct channels
(x = 6.50) have a higher mean for overall trust (Post Hoc Sig. = .036) than respondents
that reserved the room via online travel agencies (x = 6.34). In addition, respondents
that reserved the room through hotel direct channels (x = 6.56; 6.57) have higher means
than respondents that reserved the room via online travel agencies (x = 6.38; 6.39)
respectively on the attributes: this hotel would be trustworthy (Post Hoc Sig. = .028);
this seems like a good quality hotel (Post Hoc Sig. = .043).

47
4.5.2.5 Loyalty Programme
Table 4.43 Trust – Loyalty Programme
For loyalty programmes, members (x = 6.58) have a higher mean for overall
trust (t = 3.473; Sig. = .001) than non-members (x = 6.37). In addition, members of
loyalty programmes (x = 6.57; 6.45; 6.48; 6.58) have higher means than non-members
(x = 6.34; 6.22; 6.29; 6.37) respectively on all four attributes: this hotel would be
trustworthy (t = 3.178; Sig. = .002); this hotel would be responsible (t = 2.886; Sig. =
.004); I would have confidence in this hotel (t = 2.672; Sig. = .008); this seems like a
good quality hotel (t = 2.878; Sig. = .004).
4.5.2.6 Price Framing
Table 4.44 Trust – Price Framing
For price framing, a significant difference is found on the attribute: this hotel
would be trustworthy (F = 3.689; ANOVA Sig. = .026). Respondents who received a
discounted rate (x = 6.54) have a higher mean than respondents who received a normal
rate (x = 6.32) on the attribute: this attribute (Post Hoc Sig. = .021).

48
4.5.2.7 Rate Parity
Table 4.45 Trust – Rate Parity
In terms of rate parity, significant differences are found on overall trust (F
= 7.720; ANOVA Sig. = .001), and the attributes: this hotel would be trustworthy (F =
5.887; ANOVA Sig. = .003), I would have confidence in this hotel (F = 6.506; ANOVA
Sig. = .002), this seems like a good quality hotel (F = 8.047; ANOVA Sig. = .000).
Respondents that found rate disparity (x = 6.53) have a higher mean for overall trust
than respondents that found rate parity (x = 6.29; Post Hoc Sig. = .003) and respondents
that did not compare rates (x = 6.25; Post Hoc Sig. = .020). Furthermore, respondents
with disparity (x = 6.57; 6.51; 6.60) have higher means than respondents with rate parity
(x = 6.34; 6.24; 6.34) respectively on the attributes: this hotel would be trustworthy (Post
Hoc Sig. = .010); I would have confidence in this hotel (Post Hoc Sig. = .004); this
seems like a good quality hotel (Post Hoc Sig. = .004). In addition, respondents with
rate disparity (x = 6.60) also have a higher mean than respondents that did not compare

49
rates (x = 6.26) on the attribute: this seems like a good quality hotel (Post Hoc Sig. =
.011).
4.5.2.8 Information Adequacy
Table 4.46 Trust – Information Adequacy
For information adequacy significant differences are found on overall trust
(F = 4.760; ANOVA Sig. = .009), and the attributes: this hotel would be responsible (F
= 4.241; ANOVA Sig. = .015), this seems like a good quality hotel (F = 4.394; ANOVA
Sig. = .013). Respondents who received full information about pricing (x = 6.55) have
a higher mean for overall trust (Post Hoc Sig. = .012) than respondents that received
partial information about pricing (x = 6.34). In addition, respondents with full
information (x = 6.49; 6.62) also have higher means than respondents with partial
information (x = 6.24; 6.39) respectively on the attributes: this hotel would be
responsible (Post Hoc Sig. = .017); this seems like a good quality hotel (Post Hoc Sig.
= .015).
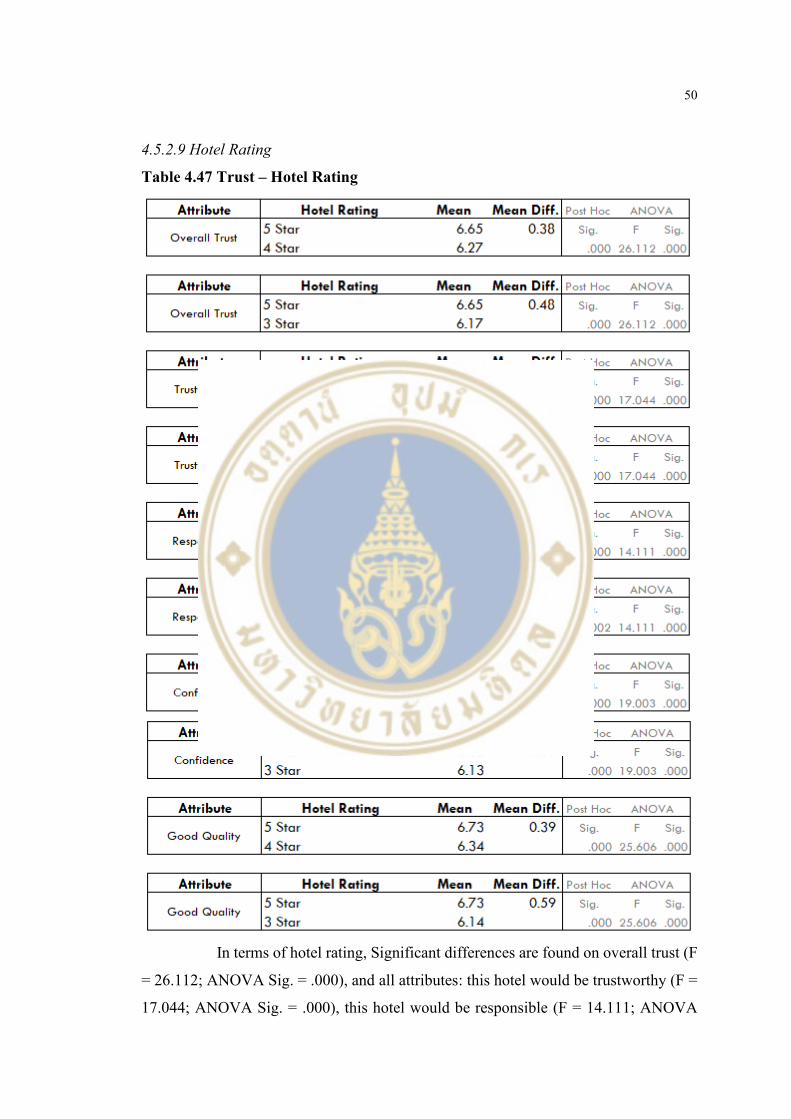
50
4.5.2.9 Hotel Rating
Table 4.47 Trust – Hotel Rating
In terms of hotel rating, Significant differences are found on overall trust (F
= 26.112; ANOVA Sig. = .000), and all attributes: this hotel would be trustworthy (F =
17.044; ANOVA Sig. = .000), this hotel would be responsible (F = 14.111; ANOVA

51
Sig. = .000), I would have confidence in this hotel (F = 19.003; ANOVA Sig. = .000),
this seems like a good quality hotel (F = 25.606; ANOVA Sig. = .000). Respondents
that stayed at 5-Star hotels (x = 6.65) have a higher mean for overall trust than
respondents who stayed at 4-Star hotels (x = 6.27; Post Hoc Sig. = .000) and 3-Star
hotels (x = 6.17; Post Hoc Sig. = .000). Furthermore, respondents staying at 5-Star hotels
(x = 6.68; 6.57; 6.62; 6.73) have higher means than respondents staying at 4-Star hotels
(x = 6.34; 6.16; 6.24; 6.34) and 3-Star hotels (x = 6.22; 6.19; 6.13; 6.14) respectively
for all attributes: this hotel would be trustworthy (Post Hoc Sig. = .000; .000); this hotel
would be responsible (Post Hoc Sig. = .000, .002); I would have confidence in this hotel
(Post Hoc Sig. = .000; .000); this seems like a good quality hotel (Post Hoc Sig. = .000;
.000). However, there are no significant differences between respondents staying at 4-
Star hotels and 3-Star hotels.

52
4.5.2.10 Hotel Type
Table 4.48 Trust – Hotel Type
Similar patterns are also found in the differences among hotel types as
significant differences are found on overall trust (F = 13.526; ANOVA Sig. = .000), and
all attributes: this hotel would be trustworthy (F = 11.050; ANOVA Sig. = .000), this

53
hotel would be responsible (F = 8.342; ANOVA Sig. = .000), I would have confidence
in this hotel (F = 7.494; ANOVA Sig. = .000), this seems like a good quality hotel (F =
12.926; ANOVA Sig. = .000). Respondents who stayed at international chain hotels (x
= 6.61) have a higher mean on overall trust than respondents who stayed at domestic
chain hotels (x = 6.32; Post Hoc Sig. = .000) or independent hotels (x = 6.29; Post Hoc
Sig. = .000). In addition, respondents that stayed at international chain hotels (x = 6.66;
6.54; 6.57; 6.68) have higher means than respondents staying at domestic chain hotels
(x = 6.36; 6.22; 6.29; 6.41) and independent hotels (x = 6.34; 6.24; 6.29; 6.30)
respectively on all attributes: this hotel would be trustworthy (Post Hoc Sig. = .001;
.000); this hotel would be responsible (Post Hoc Sig. = .002; .003); I would have
confidence in this hotel (Post Hoc Sig. = .004; .004); this seems like a good quality hotel
(Post Hoc Sig. = .002; .000). However, there are no significant differences between
respondents staying at domestic chain hotels and independent hotels.
4.5.2.11 Number of Times Stayed at the Hotel
Table 4.49 Trust – Number of Times Stayed at the Hotel
For the number of times stayed at the hotel, significant differences are found
on overall trust (F = 3.704; ANOVA Sig. = .025) and the attribute: this hotel would be
trustworthy (F = 4.146; ANOVA Sig. = .016). Respondents that stayed with the hotels
more than 3 times (x = 6.58) have a higher mean for overall trust (Post Hoc Sig. = .042)
than respondents who stayed with the hotel for the first time (x = 6.36). In addition, the
respondents that stayed with the hotels more than 3 times (x = 6.69) have a higher mean
than respondents who stayed for the first time (x = 6.41) on the attribute: this hotel
would be trustworthy (Post Hoc Sig. = .014).

54
4.6 Satisfaction 4.6.1 Descriptive Statistic & Reliability Test
Table 4.50 Satisfaction
# Attribute Mean
1 I did the right thing when I chose to stay at the hotel. 6.38
2 I had a pleasurable stay at the hotel. 6.37
3 Overall, I am satisfied with my decision to stay at the hotel. 6.32
4 I feel that the hotel service is better than my expectation. 5.89
Overall Satisfaction 6.24
There are 4 attributes for satisfaction; the result shows Cronbach’s alpha of
‘.86’. Scales of 1 - 7 were used to determine respondents’ level of agreement; 1
represents totally disagree, and 7 represents totally agree. The attribute with the highest
mean is ‘I did the right thing when I choose to stay at the hotel’ (x = 6.38), followed by
‘I had a pleasurable stay at the hotel’ (x = 6.37), ‘Overall, I am satisfied with my
decision to stay at the hotel’ (x = 6.32), ‘I feel that the hotel service is better than my
expectation’ (x = 5.89). Hence, the average mean for satisfaction is ‘6.24’.
4.6.2 Differences Among Factors
There are significant differences in satisfaction among respondents in
different groups of each factor, including booking channel, loyalty programme,
information inadequacy, hotel rating, hotel type, ‘We Travel Together’ campaign and
purpose of stay.

55
4.6.2.1 Booking Channel
Table 4.51 Satisfaction – Booking Channel
For booking channel, significant differences are found on overall
satisfaction (F = 7.229; ANOVA Sig. = .001), and the attributes: service is better than
expected (F = 5.509; ANOVA Sig. = .004), satisfied with the decision to stay at the hotel
(F = 5.819; ANOVA Sig. = .003). Respondents that reserved the room through hotel
direct channels (x = 6.32; Post Hoc Sig. = .008) and via traditional travel agencies (x =
6.95; Post Hoc Sig. = .023) have a higher mean for overall satisfaction than respondents
that reserved the room via online travel agencies (x = 6.11). In addition, respondents
that reserved the room through hotel direct channels (x = 6.00; 6.40) also have higher
means than respondents who reserved the room via online travel agencies (x = 5.73;
6.19) respectively on the attributes: service is better than expected (Post Hoc Sig. =
.025); satisfied with the decision to stay at the hotel (Post Hoc Sig. = .020).

56
4.6.2.2 Loyalty Programme
Table 4.52 Satisfaction – Loyalty Programme
In terms of loyalty programme, members of loyalty programme (x = 6.34)
have a higher mean on overall satisfaction (t = 3.591; Sig. = .000) than respondents that
are non-members (x = 6.09). In addition, members of loyalty programmes (x = 6.45;
6.47; 6.04; 6.38) have higher means than non-member (x = 6.24; 6.24; 5.64; 6.22)
respectively on all four attributes: pleasurable stay at the hotel (t = 2.703; Sig. = .007);
right choice to stay at the hotel (t = 3.009; Sig. = .003); service is better than expected
(t = 3.771; Sig. = .000); satisfied with the decision to stay at the hotel (t = 2.028; Sig. =
.043).
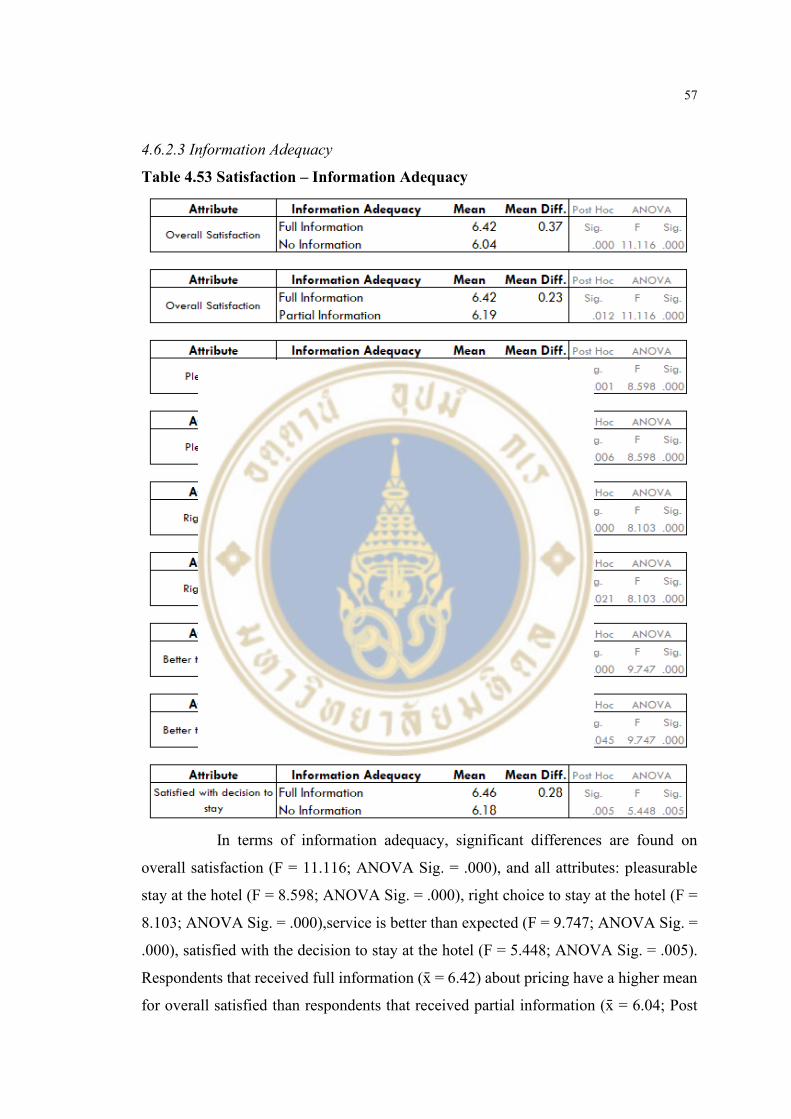
57
4.6.2.3 Information Adequacy
Table 4.53 Satisfaction – Information Adequacy
In terms of information adequacy, significant differences are found on
overall satisfaction (F = 11.116; ANOVA Sig. = .000), and all attributes: pleasurable
stay at the hotel (F = 8.598; ANOVA Sig. = .000), right choice to stay at the hotel (F =
8.103; ANOVA Sig. = .000),service is better than expected (F = 9.747; ANOVA Sig. =
.000), satisfied with the decision to stay at the hotel (F = 5.448; ANOVA Sig. = .005).
Respondents that received full information (x = 6.42) about pricing have a higher mean
for overall satisfied than respondents that received partial information (x = 6.04; Post

58
Hoc Sig. = .000) and respondents that did not receive information at all (x = 6.19; Post
Hoc Sig. = .012). In addition, respondents with full information (x = 6.55; 6.55; 6.11;
6.46) also have higher means than respondents that received no information (x = 6.21;
6.21; 5.58; 6.18) respectively on all four attributes: pleasurable stay at the hotel (Post
Hoc Sig. = .001); right choice to stay at the hotel (Post Hoc Sig. = .000); service is better
than expected (Post Hoc Sig. = .000); satisfied with the decision to stay at the hotel (Post
Hoc Sig. = .005). Moreover, respondents with full information (x = 6.55; 6.55) also have
higher means than respondents with partial information (x = 6.28; 6.32) respectively on
two attributes: pleasurable stay at the hotel (Post Hoc Sig. = .006); right choice to stay
at the hotel (Post Hoc Sig. = .021). Also, respondents with partial information (x = 5.89)
have a higher mean than respondents with no information (x = 5.58) on the attribute:
service is better than expected (Post Hoc Sig. = .045).

59
4.6.2.4 Hotel Rating
Table 4.54 Satisfaction – Hotel Rating
For hotel rating, there are also significant differences on overall satisfaction
(F = 17.680; ANOVA Sig. = .000) and on all four attributes: pleasurable stay at the hotel
(F = 19.958; ANOVA Sig. = .000), right choice to stay at the hotel (F = 9.662; ANOVA
Sig. = .000), service is better than expected (F = 12.295; ANOVA Sig. = .000), satisfied

60
with the decision to stay at the hotel (F = 10.008; ANOVA Sig. = .005). Respondents
that stayed at 5-Star hotels (x = 6.44) have a higher mean for overall satisfaction than
respondents that stayed at 4-Star hotels (x = 6.09; Post Hoc Sig. = .000) and 3-Star hotels
(x = 5.97; Post Hoc Sig. = .000). In addition, respondents staying at 5-Star hotels (x =
6.59; 6.54; 6.14; 6.48) have higher means than respondents stayed at 4-Star hotels (x =
6.24; 6.26; 5.70; 6.15) and 3-Star hotels (x = 5.98; 6.16; 5.56; 6.19) respectively on all
four attributes: pleasurable stay at the hotel (Post Hoc Sig. = .000; .000); right choice to
stay at the hotel (Post Hoc Sig. = .002; .001); service is better than expected (Post Hoc
Sig. = .000; .000); satisfied with the decision to stay at the hotel (Post Hoc Sig. = .000;
.016). However, there are no significant differences between respondents in 4-Star
hotels and 3-Star hotels.
4.6.2.5 Hotel Type
Table 4.55 Satisfaction – Hotel Type
In terms of hotel type significant differences are found on overall
satisfaction (F = 4.612; ANOVA Sig. = .010) and on the attributes: pleasurable stay at
the hotel (F = 3.079; ANOVA Sig. = .19), service is better than expected (F = 4.982;
ANOVA Sig. = .007). Respondents that stayed at international chain hotels (x = 6.35)
have a higher mean on overall satisfaction (Post Hoc Sig. = .009) than respondents that
stayed at independent hotels (x = 6.10). Furthermore, respondents in international chain
hotels (x = 6.47; 6.05) also have higher means than respondents in independent hotels
(x = 6.22; 5.68) respectively on the attributes: pleasurable stay at the hotel (Post Hoc
Sig. = .015); service is better than expected (Post Hoc Sig. = 006).

61
4.6.2.6 ‘We Travel Together’ Campaign
Table 4.56 Satisfaction – ‘We Travel Together’ Campaign
Respondents that reserved the room under the ‘We Travel Together
campaign (x = 6.01) have a higher mean than respondents that did not join the campaign
(x = 5.80) on the attribute: service is better than expected (t = 2.072; Sig. = .039).
4.6.2.7 Purpose of Stay
Table 4.57 Satisfaction – Purpose of Stay
In terms of purpose of stay, respondents that stayed with business purposes
(x = 6.27) have a higher mean for overall satisfaction (t = 2.344; Sig. = .020) than
respondents with leisure purposes (x = 5.98). Furthermore, business travellers (x = 6.40;
5.93) also have higher means than leisure travellers (x = 6.03; 5.49) respectively on the
attributes: pleasurable stay at the hotel (t = 2.135; Sig. = .039); service is better than
expected (t = 2.445; Sig. = .015).

62
4.7 Cognitive Loyalty 4.7.1 Descriptive Statistic & Reliability Test
Table 4.58 Cognitive Loyalty
# Attribute Mean
1 I consider this hotel as my first choice when I need lodging services in the same area. 5.28
2 This hotel provides superior service compared to other hotels. 5.11
3 This hotel has more benefits than the other hotels in its category. 5.09
4 No other hotels perform services better than this hotel. 4.18
Overall Cognitive Loyalty 4.91
There are 4 attributes for cognitive loyalty; the result shows Cronbach’s
alpha of ‘.82’. Scales of 1 - 7 were used to determine respondents’ level of agreement;
1 represents totally disagree, and 7 represents totally agree. The attribute with the
highest mean is ‘I consider this hotel as my first choice when I need lodging services in
the same area’ (x = 5.28), followed by ‘This hotel provides superior service compared
to other hotels’ (x = 5.11), ‘This hotel has more benefits than the other hotels in its
category (x = 5.09), ‘No other hotels perform services better than this hotel’ (x = 4.18).
Hence, the average mean of cognitive loyalty is ‘4.91’.
4.7.2 Differences Among Factors
There are significant differences in cognitive loyalty among respondents in
different groups of each factor, including age range, booking channel, loyalty
programme, rate parity, information adequacy, hotel rating, hotel type and the number
of times stayed at the hotel.

63
4.7.2.1 Age Range
Table 4.59 Cognitive Loyalty – Age Range
For the age range, significant differences are found on the attributes: this
hotel is my first choice (F = 7.118; ANOVA Sig. = .001), more benefits than the other
hotels (F = 3.758; ANOVA Sig. = .024). Respondents with age range between 18 - 24
years old (x = 5.70; Post Hoc Sig. = .010) and respondents that are 41 years old or older
(x = 5.61; Post Hoc Sig. = .014) have higher means than respondents with age range
between 25 - 40 years old (x = 5.12) on the attribute: this hotel is my first choice. In
addition, respondents who are 41 years old or older (x = 5.41) also have a higher mean
than respondents with age range between 25 - 40 years old (x = 4.97) on the attribute:
more benefits than the other hotels (Post Hoc Sig. = .045).
4.7.2.2 Booking Channel
Table 4.60 Cognitive Loyalty – Booking Channel
In terms of booking channel, significant differences are identified on overall
cognitive loyalty (F = 4.246; ANOVA Sig. = .015) and the attributes: superior service

64
than other hotels (F = 4.304; ANOVA Sig. = .014), more benefits than the other hotels
(F = 7.244; ANOVA Sig. = .001). Respondents that reserved the room through hotel
direct channels (x = 5.05) have a higher mean of overall cognitive loyalty (Post Hoc Sig.
= .025) than respondents who reserved the room from online travel agencies (x = 4.75).
Furthermore, respondents that reserved the room through hotel direct channels (x = 5.26;
5.30) also have higher means than respondents that reserved the room from online travel
agencies (x = 4.93; 4.83) respectively on the attributes: superior service than other hotels
(Post Hoc Sig. = .025); more benefits than the other hotels (Post Hoc Sig. = .002).
4.7.2.3 Loyalty Programme
Table 4.61 Cognitive Loyalty – Loyalty Programme
For loyalty programmes, members of loyalty programmes (x = 5.01) have a
higher mean of overall cognitive loyalty (t = 2.193; Sig. = .029) than non-member (x =
4.76). In addition, members (x = 5.39; 5.23; 5.25) have higher means than non-members
(x = 5.11; 4.92; 4.83) respectively on the attributes: this hotel is my first choice (t =
2.061; Sig. = .040); superior service than other hotels (t = 2.405; Sig. = .017); more
benefits than the other hotels (t = 2.975; Sig. = .003).

65
4.7.2.4 Rate Parity
Table 4.62 Cognitive Loyalty – Rate Parity
For rate parity, a significant difference occurred on the attribute: no other
hotels perform services better (F = 4.576; ANOVA Sig. = .011). Respondents with rate
parity (x = 4.52) have a higher mean than respondents with rate disparity (x = 4.00) on
this attribute (Post Hoc Sig. = .016).
4.7.2.5 Information Adequacy
Table 4.63 Cognitive Loyalty – Information Adequacy

66
In term of information adequacy, significant differences are found on overall
cognitive loyalty (F = 15.740; ANOVA Sig. = .000), and on all four attributes: no other
hotels perform services better (F = 11.258; ANOVA Sig. = .000), this hotel is my first
choice (F = 5.863; ANOVA Sig. = .003), superior service than other hotels (F = 13.156;
ANOVA Sig. = .000), more benefits than the other hotels (F = 12.439; ANOVA Sig. =
.000). Respondents with full information (x = 5.23) have a higher mean of overall
cognitive loyalty than respondents with no information (x = 4.48; Post Hoc Sig. = .000)
and respondents with partial information (x = 4.91; Post Hoc Sig. = .045); in addition,
the differences between the means for overall cognitive loyalty of respondents with
partial information (x = 4.91) and no information (x = 4.48) are also significant (Post
Hoc Sig. = .008). Furthermore, respondents with full information (x = 4.48; 5.54; 5.42;
5.46) have higher means than respondents with no information (x = 3.59; 5.02; 4.65;
4.64) respectively on all four attributes: no other hotels perform services better (Post
Hoc Sig. = .000); this hotel is my first choice (Post Hoc Sig. = .003), superior service
than other hotels (Post Hoc Sig. = .000); more benefits than the other hotels (Post Hoc
Sig. = .000). Moreover, respondents with full information (x = 5.46) also have a higher
mean than respondents with partial information (x = 5.02) on the attribute: more benefits
than the other hotels (Post Hoc Sig. = .018). While respondents with partial information
(x = 4.30; 5.12) have higher means than respondents with no information (x = 3.59;
4.65) respectively on the attributes: no other hotels perform services better (Post Hoc
Sig. = .002); superior service than other hotels (Post Hoc Sig. = .009).

67
4.7.2.6 Hotel Rating
Table 4.64 Cognitive Loyalty – Hotel Rating
Significant differences among respondents in different hotel ratings are
found for overall cognitive loyalty (F = 8.366; ANOVA Sig. = .000) and the attributes:
superior service than other hotels (F = 15.249; ANOVA Sig. = .000), more benefits than
the other hotels (F = 12.825; ANOVA Sig. = .000). Respondents that stayed at 5-Star
hotels (x = 5.14) have a higher mean of overall cognitive loyalty than respondents that
stayed at 4-Star hotels (x = 4.72; Post Hoc Sig. = .000) and 3-Star hotels (x = 4.64; Post
Hoc Sig. = .000). Furthermore, respondents in 5-Star hotels (x = 5.44; 5.42) have higher
means than respondents in 4-Star hotels (x = 4.85, 4.86) and 3-Star hotels (x = 4.64;
4.56) respectively on both attributes: superior service than other hotels (Post Hoc Sig. =
.000, .000); more benefits than the other hotels (Post Hoc Sig. = .000, .000). However,
no significant differences are found between respondents in 4-Star hotels and 3-Star
hotels.

68
4.7.2.7 Hotel Type
Table 4.65 Cognitive Loyalty – Hotel Type
For hotel type, significant differences are found for the attribute: more
benefits than the other hotels (F = 5.407; ANOVA Sig. = .005). Respondents that stayed
in international chain hotels (x = 5.34) have a higher mean than respondents that stayed
in independent hotels (x = 4.82) on this attribute (Post Hoc Sig. = .006).
4.7.2.8 Number of Times Stayed at the Hotel
Table 4.66 Cognitive Loyalty – Number of Times Stayed at the Hotel
For the number of times stayed at the hotel, significant differences occur for
the attribute: this hotel is my first choice (F = 3.933; ANOVA Sig. = .020). Respondents
who have stayed with the hotel more than 3 times (x = 5.66) have a higher mean than
respondents who stayed at the hotel for the first time (x = 5.14) on this attribute (Post
Hoc Sig. = .018).

69
4.8 Affective Loyalty 4.8.1 Descriptive Statistic & Reliability Test
Table 4.67 Affective Loyalty
# Attribute Mean
1 I like staying at this hotel very much. 5.80
2 I feel better when I stay at this hotel. 5.72
3 I like this hotel more than other hotels. 5.55
4 This hotel is the one that I appreciate most in the same area. 5.46
Overall Affective Loyalty 5.63
There are 4 attributes for affective loyalty; the result shows Cronbach’s
alpha of ‘.91’. Scales of 1 - 7 were used to determine respondents’ level of agreement;
1 represents totally disagree, and 7 represents totally agree. The attributes that have the
highest mean is ‘I like staying at this hotel very much’ (x = 5.80) followed by, ‘I feel
better when I stay at this hotel’ (x = 5.72), ‘I like this hotel more than other hotels’ (x =
5.55) and ‘This hotel is the one that I appreciate most in the same area’ (x = 5.46).
Hence, the average mean of overall affective loyalty is ‘5.63’.
4.8.2 Differences Among Factors
There are significant differences in affective loyalty among respondents in
different groups of each factor, including occupation, booking channel, loyalty
programme, information adequacy, hotel rating, hotel type, number of times stayed at
the hotel, ‘We Travel Together’ Campaign and purpose of stay.

70
4.8.2.1 Occupation
Table 4.68 Affective Loyalty - Occupation
For occupation, significant differences are found on overall affective loyalty
(F = 3.196; ANOVA Sig. = .013) and the attributes: like this hotel more than other hotels
(F = 2.451; ANOVA Sig. = .046), appreciate this hotel the most in the area (F = 4.410;
ANOVA Sig. = .003). Respondents who are business owners (x = 5.87) have a higher
mean of overall affective loyalty (Post Hoc Sig. = .009) than respondents in the ‘others’
group (x = 5.09). In addition, business owners (x = 5.74; 5.75) also have higher means
than respondents in the ‘others’ group (x = 4.96; 4.75) respectively on the attributes:
like this hotel more than other hotels (Post Hoc Sig. = .034); and appreciate this hotel
the most in the area (Post Hoc Sig. = .006). Furthermore, students (x = 5.76) also have
a higher mean than respondents in the ‘others’ group (x = 4.75) on the attribute:
appreciate this hotel the most in the area (Post Hoc Sig. = .016).

71
4.8.2.2 Booking Channel
Table 4.69 Affective Loyalty – Booking Channel
In terms of booking channel, significant differences are identified for overall
affective loyalty (F = 4.921; ANOVA Sig. = .008), and the attributes: feel better to stay
with this hotel (F = 4.523; ANOVA Sig. = .011), like to stay at this hotel very much (F
= 5.511; ANOVA Sig. = .004), and appreciate this hotel the most in the same area (F =
5.049; ANOVA Sig. = .007). Respondents who reserved the room through hotel direct
channels (x = 5.76) have a higher level of overall affective loyalty (Post Hoc Sig. = .008)
than respondents that reserved the room via online travel agencies (x = 5.46).
Furthermore, respondents that reserved the room through hotel direct channels (x = 5.86;
5.94; 5.60) have higher means than respondents that reserved the room via online travel
agencies (x = 5.54; 5.60; 5.29) respectively on the attributes: feel better to stay with this
hotel (Post Hoc Sig. = .009); like to stay at this hotel very much (Post Hoc Sig. = .003);
appreciate this hotel the most in the area (Post Hoc Sig. = .034).

72
4.8.2.3 Loyalty Programme
Table 4.70 Affective Loyalty – Loyalty Programme
For loyalty programmes, members of loyalty programmes (x = 5.72) have
higher means of overall affective loyalty (t = 2.324; Sig. = .021) than non-members (x
= 5.48). In addition, members of loyalty programmes (x = 5.83; 5.90) have higher means
than non-members (x = 5.54; 5.63) respectively on the attribute: feel better to stay with
this hotel (t = 2.680 Sig. = .008); like to stay at this hotel very much (t = 2.506; Sig. =
.013).

73
4.8.2.4 Information Adequacy
Table 4.71 Affective Loyalty – Information Adequacy
In terms of information adequacy, significant differences are found on
overall affective loyalty (F = 6.195; ANOVA Sig. = .002) and all four attributes: like
this hotel more than other hotels (F = 3.810; ANOVA Sig. = .023), feel better to stay
with this hotel (F = 4.884; ANOVA Sig. = .008), like to stay at this hotel very much (F
= 5.246; ANOVA Sig. = .006), appreciate this hotel the most in the area (F = 5.667;
ANOVA Sig. = .004). Respondents that received full information about pricing (x =
5.81) have a higher mean of overall affective loyalty (Post Hoc Sig. = .002) than
respondents that received no information about pricing (x = 5.40). In addition,
respondents with full information (x = 5.71; 5.91; 5.97; 5.66) also have higher means
than respondents with no information (x = 5.34; 5.52; 5.57; 5.16) respectively on the
attributes: like this hotel more than other hotels (Post Hoc Sig. = .019); feel better to
stay with this hotel (Post Hoc Sig. = .007); like to stay at this hotel very much (Post Hoc
Sig. = .004); appreciate this hotel the most in the area (Post Hoc Sig. = .003).

74
4.8.2.5 Hotel Rating
Table 4.72 Affective Loyalty – Hotel Rating

75
For hotel rating, there are significant differences on overall affective loyalty
(F = 13.807; ANOVA Sig. = .000) and all four attributes: like this hotel more than other
hotels (F = 10.610; ANOVA Sig. = .000), feel better to stay with this hotel (F = 13.837;
ANOVA Sig. = .000), like to stay at this hotel very much (F = 14.987; ANOVA Sig. =
.000), appreciate this hotel the most in the area (F = 6.450; ANOVA Sig. = .002).
Respondents that stayed at 5-Star hotels (x = 5.88) have a higher mean of overall
affective loyalty than respondents that stayed at 4-Star hotels
(x = 5.42; Post Hoc Sig. = .000) and respondents that stayed at 3-Star hotels.
(x = 5.32; Post Hoc Sig. = .000). Furthermore, respondents in 5-Star hotels (x = 5.80;
6.00; 6.07; 5.67) also have higher means than respondents in 4-Star hotels (x = 5.34;
5.45; 5.57; 5.31) and 3-Star hotels (x = 5.22; 5.48; 5.45; 5.11) respectively on the
attributes: like this hotel more than other hotels (Post Hoc Sig. = .000; .001); feel better
to stay with this hotel (Post Hoc Sig. = .000; .002); like to stay at this hotel very much
(Post Hoc Sig. = .000; .000); appreciate this hotel the most in the area (Post Hoc Sig. =
.024; .006). However, no significant differences are found between respondents in 4-
Star hotels and 3-Star hotels.
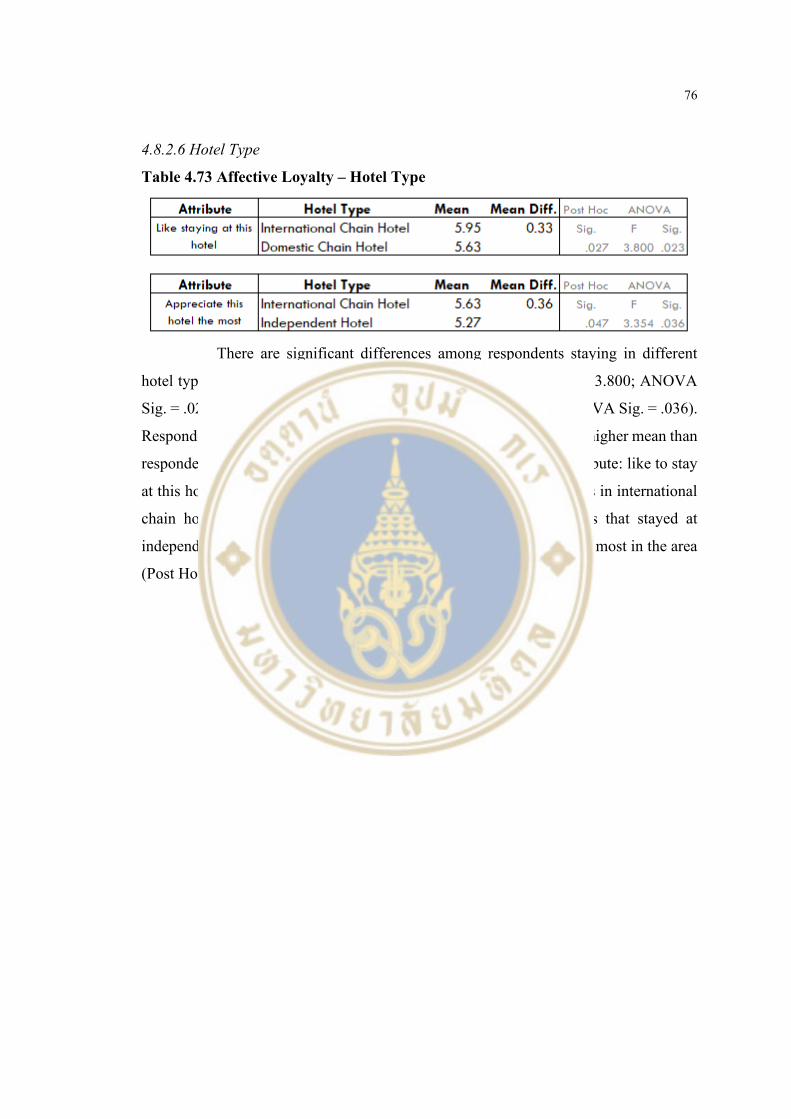
76
4.8.2.6 Hotel Type
Table 4.73 Affective Loyalty – Hotel Type
There are significant differences among respondents staying in different
hotel types for the attributes: like to stay at this hotel very much (F = 3.800; ANOVA
Sig. = .023), appreciate this hotel the most in the area (F = 3.354; ANOVA Sig. = .036).
Respondents that stayed at international chain hotels (x = 5.95) have a higher mean than
respondents that stayed at domestic chain hotels (x = 5.63) on the attribute: like to stay
at this hotel very much (Post Hoc Sig. = .027). Moreover, respondents in international
chain hotels (x = 5.63) also have a higher mean than respondents that stayed at
independent hotels (x = 5.27) on the attribute: appreciate this hotel the most in the area
(Post Hoc Sig. = .047).

77
4.8.2.7 Number of Times Stayed at this Hotel
Table 4.74 Affective Loyalty – Number of Times Stayed at this Hotel
Significant differences among respondents with different numbers of times
stayed at the hotel are found for overall affective loyalty (F = 6.378; ANOVA Sig. =
.002) and all four attributes: like this hotel more than other hotels (F = 3.633; ANOVA
Sig. = .027), feel better to stay with this hotel (F = 9.766; ANOVA Sig. = .000), like to
stay at this hotel very much (F = 4.036; ANOVA Sig. = .018), appreciate this hotel the
most in the area (F = 4.016; ANOVA Sig. = .019). Respondents that stayed with the
hotel more than 3 times (x = 5.97) have a higher mean of overall affective loyalty (Post
Hoc Sig. = .002) than respondents that stayed with the hotel for the first time (x = 5.48).
Furthermore, respondents that stayed with the hotel more than 3 times (x = 5.82; 6.18;
6.06; 5.81) have higher means than respondents that stayed with the hotel for the first
time (x = 5.42; 5.54; 5.67; 5.32) respectively on the attributes: like this hotel more than
other hotels (Post Hoc Sig. = .033); feel better to stay with this hotel (Post Hoc Sig. =
.000); like to stay at this hotel very much (Post Hoc Sig. = .024); appreciate this hotel
the most in the area (Post Hoc Sig. = .017). In addition, respondents that stayed with the

78
hotel more than 3 times (x = 6.18) have a higher mean than respondents that stayed with
the hotel for 2-3 times (x = 5.78) on the attribute: feel better to stay with this hotel (Post
Hoc Sig. = .036).
4.8.2.8 ‘We Travel Together’ Campaign
Table 4.75 Affective Loyalty – ‘We Travel Together’ Campaign
There are also significant differences in overall affective loyalty (t = 2.165;
Sig. = .031) between respondents that joined the ‘We Travel Together’ campaign (x =
5.75), which have a higher mean than respondents that did not join the campaign (x =
5.53). In addition, respondents that joined the campaign (x = 5.84; 5.63) also have higher
means than respondents that did not join the campaign (x = 5.62; 5.31) respectively on
the attributes: feel better to stay with this hotel (t = 2.072; Sig. = .039); appreciate this
hotel the most in the area (t = 2.659; Sig. = .008).

79
4.9 Conative Loyalty 4.9.1 Descriptive Statistic & Reliability Test
Table 4.76 Conative Loyalty
# Attribute Mean
1 In the future, I intend to recommend this hotel to others who seek my advice. 5.93
2 I intend to say positive things about this hotel to other people. 5.87
3 I intend to continue staying at this hotel in the future. 5.24
4 Even if other hotels were offering a lower rate, I would stay at this hotel. 4.70
5 If this hotel were to raise the rate, I would still continue to stay in the hotel. 4.08
Overall Conative Loyalty 5.16
There are 5 attributes for conative loyalty; the result shows Cronbach’s
alpha of ‘.85’. Scales of 1 - 7 were used to determine respondents’ level of agreement;
1 represents totally disagree, and 7 represents totally agree. The attribute with the
highest mean is ‘In the future, I intend to recommend this hotel to others who seek my
advice’ (x = 5.93), followed by ‘I intend to say positive things about this hotel to other
people’ (x = 5.87), ‘I intend to continue staying at this hotel in the future’ (x = 5.24),
‘Even if other hotels were offering a lower rate, I would stay at this hotel’ (x = 4.70), ‘If
this hotel were to raise the rate, I would still continue to stay in the hotel’ (x = 4.08).
Hence, the average mean of conative loyalty is ‘5.16’.
4.9.2 Differences Among Factors
There are significant differences in conative loyalty among respondents in
different groups of each factor, including current resident, occupation, cancellation
policy, booking channel, length of stay, loyalty programme, rate parity, information
inadequacy, hotel rating, hotel type and the number of times stayed at the hotel.

80
4.9.2.1 Current Resident
Table 4.77 Conative Loyalty – Current Resident
For current residents, significant differences are found in the attribute:
intention to say positive things (F = 4.793; ANOVA Sig. = .009). Respondents that
currently live in Bangkok (x = 5.90; Post Hoc Sig. = .039) and respondents that live in
Bangkok’s surrounding area (x = 6.09; Post Hoc Sig. = .009) have higher means on this
attribute than respondents that live outside of Bangkok Metropolitan Region (x = 5.52).
4.9.2.2 Occupation
Table 4.78 Conative Loyalty – Occupation
In terms of occupation, significant differences are found on overall conative
loyalty (F = 3.121; ANOVA Sig. = .015), and the attributes: if other hotels offer a lower
rate, I would still stay at this hotel (F = 3.108; ANOVA Sig. = .015), intention to
continue staying in this hotel (F = 4.087; ANOVA Sig. = .003). Respondents who are
business owners (x = 5.49) have a higher mean of overall conative loyalty than
respondents who are private employees (x = 4.72; Post Hoc Sig. = .023) and respondents

81
in ‘others’ group (x = 5.09; Post Hoc Sig. = .046). In addition, respondents who are
business owners (x = 5.21) have a higher mean than respondents who are private
employees (x = 4.57) on the attribute: if other hotels offer a lower rate, I would still stay
at this hotel (Post Hoc Sig. = .027). Furthermore, business owners (x = 5.61) also have
a higher mean than respondents in the ‘others’ group (x = 4.50) for the attribute:
intention to continue staying in this hotel (Post Hoc Sig. = .005).
4.9.2.3 Cancellation Policy
Table 4.79 Conative Loyalty – Cancellation Policy
Significant differences in the attributes: if other hotels offer a lower rate, I
would still stay at this hotel (F = 4.462; ANOVA Sig. = .012), if the rate rises, I would
still stay at this hotel (F = 4.728; ANOVA Sig. = .009) are also identified among
respondents that received different cancellation policies. Respondents who received a
fully refundable cancellation policy (x = 4.84; 4.22) have higher means than respondents
with a non-refundable cancellation policy (x = 4.30; 3.69) respectively on the attributes:
if other hotels offer a lower rate, I would still stay at this hotel (Post Hoc Sig. = .011);
if the rate rises, I would still stay at this hotel (Post Hoc Sig. = .009).

82
4.9.2.4 Booking Channel
Table 4.80 Conative Loyalty – Booking Channel
For booking channels, significant differences are found on overall conative
loyalty (F = 6.536; ANOVA Sig. = .002), and the attributes: if other hotels offer a lower
rate, I would still stay at this hotel (F = 3.995; ANOVA Sig. = .019), intention to
continue staying in this hotel (F = 3.377; ANOVA Sig. = .035), intention to say positive
things (F = 4.542 ANOVA Sig. = .011), intention to recommend this hotel to others who
seek my advice (F = 8.566; ANOVA Sig. = .000). Respondents who reserved the room
through hotel direct channels (x = 5.33) have a higher mean of overall conative loyalty
(Post Hoc Sig. = .001) than respondents that reserved the room via online travel agencies
(x = 4.95). Furthermore, respondents that reserved the room on hotel direct channels (x
= 4.89; 5.40; 6.02; 6.12) also have higher means than respondents that reserved the room
via online travel agencies (x = 4.43; 5.05; 5.68; 5.70) respectively on the attributes: if
other hotels offer a lower rate, I would still stay at this hotel (Post Hoc Sig. = .015);
intention to continue staying in this hotel (Post Hoc Sig. = .032); intention to say positive
things (Post Hoc Sig. = .013); intention to recommend this hotel to others who seek my
advice (Post Hoc Sig. = .000).

83
4.9.2.5 Length of Stay
Table 4.81 Conative Loyalty – Length of Stay
In terms of length of stay, significant differences are found on the attributes:
if the rate rises, I would still stay at this hotel (F = 3.606; ANOVA Sig. = .028), intention
to continue staying in this hotel (F = 4.242; ANOVA Sig. = .015). Respondents that
stayed at the hotels for 3 - 5 Nights (x = 4.58; 5.67) have higher means than respondents
that stayed at the hotels for 1 - 2 nights (x = 4.00; 5.16) respectively on the attributes: if
the rate rises, I would still stay at this hotel (Post Hoc Sig. = .029); intention to continue
staying in this hotel (Post Hoc Sig. = .031).
4.9.2.6 Loyalty Programme
Table 4.82 Conative Loyalty – Loyalty Programme
Significant differences on overall conative loyalty are identified between
members and non-members of loyalty programmes as respondents who are members of
loyalty programmes (x = 5.27) have a higher mean of overall conative loyalty (t = 2.635;
Sig. = .009) than respondents that are non-member (x = 4.98). Furthermore, respondents
that are members of loyalty programmes (x = 5.38; 5.98; 6.08) also have higher means
than respondents that are non-members (x = 5.02; 5.68; 5.68) respectively on the

84
attributes: intention to continue staying in this hotel (t = 2.613; Sig. = .009); intention to
say positive things (t = 2.603; Sig. = .010); intention to recommend this hotel to others
who seek my advice (t = 3.689; Sig. = .000).
4.9.2.7 Rate Parity
Table 4.83 Conative Loyalty – Rate Parity
For rate parity, significant differences occurred on the attributes: if other
hotels offer a lower rate, I would still stay at this hotel (F = 9.472; ANOVA Sig. = .000),
if the rate rises, I would still stay at this hotel (F = 8.519; ANOVA Sig. = .000).
Respondents with rate parity (x = 5.25; 4.58) have higher means than respondents with
rate disparity (x = 4.45; 3.86) respectively on both attributes: if other hotels offer a lower
rate, I would still stay at this hotel (Post Hoc Sig. = .000); if the rate rises, I would still
stay at this hotel (Post Hoc Sig. = .000).

85
4.9.2.8 Information Adequacy
Table 4.84 Conative Loyalty – Information Adequacy
In term of information adequacy, significant differences are found on overall
conative loyalty (F = 8.459; ANOVA Sig. = .000), and four attributes: if other hotels
offer a lower rate , I would still stay at this hotel (F = 6.905; ANOVA Sig. = .001), if
the rate rises, I would still stay at this hotel (F = 10.677; ANOVA Sig. = .000), intention
to continue staying in this hotel (F = 4.071; ANOVA Sig. = .018), intention to say
positive things (F = 5.178; ANOVA Sig. = .006). Respondents that received full
information about pricing (x = 5.38; Post Hoc Sig. = .000) and respondents that received
partial information about pricing (x = 5.18; Post Hoc Sig. = .045) have higher means of
overall conative loyalty than respondents that received no information (x = 4.84).

86
Furthermore, respondents with full information (x = 4.99; 4.35; 5.38; 6.09) have higher
means than respondents with no information (x = 4.26; 3.53; 4.94; 5.68) respectively on
the attributes: if other hotels offer a lower rate, I would still stay at this hotel (Post Hoc
Sig. = .001); if the rate rises, I would still stay at this hotel (Post Hoc Sig. = .000);
intention to continue staying in this hotel (Post Hoc Sig. = .025); intention to say positive
things (Post Hoc Sig. = .011). Moreover, respondents with full information (x = 6.09)
also have a higher mean than respondents with partial information (x = 5.75) for the
attribute: intention to say positive things (Post Hoc Sig. = .043). In addition, respondents
with partial information (x = 4.24) have a higher mean than respondents with no
information (x = 3.53) on the attribute: if the rate rises, I would still stay at this hotel
(Post Hoc Sig. = .001).
4.9.2.9 Hotel Rating
Table 4.85 Conative Loyalty – Hotel Rating
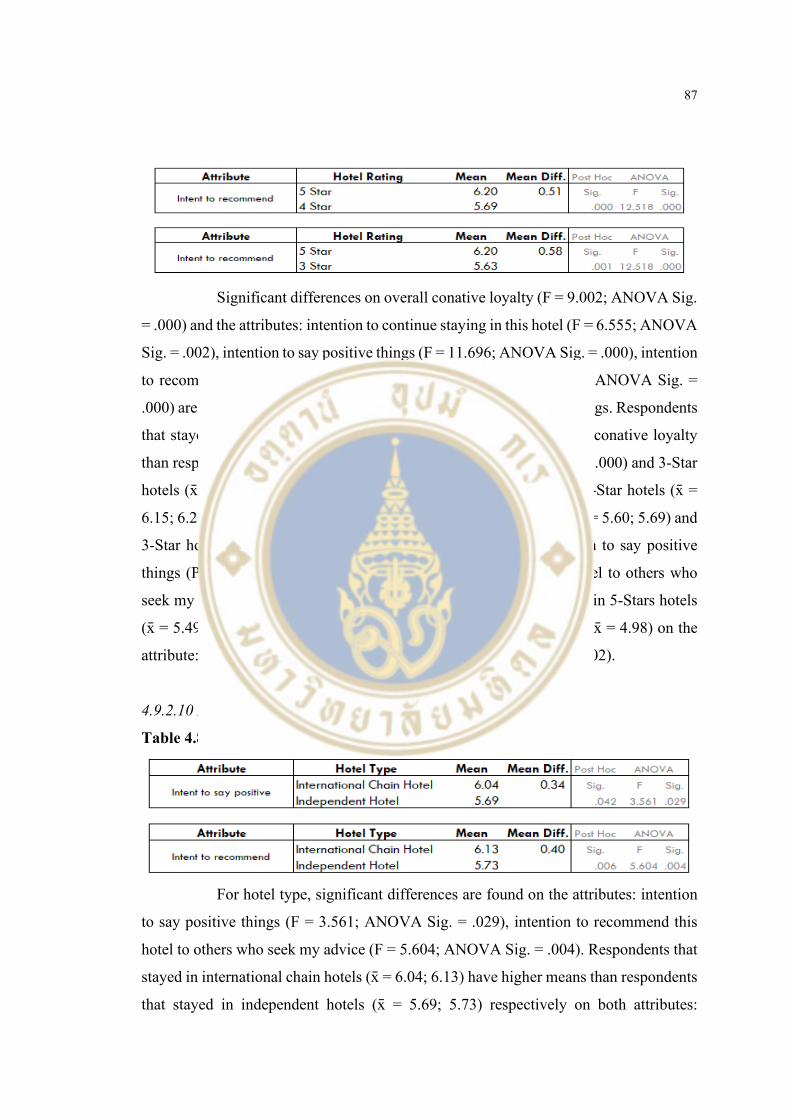
87
Significant differences on overall conative loyalty (F = 9.002; ANOVA Sig.
= .000) and the attributes: intention to continue staying in this hotel (F = 6.555; ANOVA
Sig. = .002), intention to say positive things (F = 11.696; ANOVA Sig. = .000), intention
to recommend this hotel to others who seek my advice (F = 12.518; ANOVA Sig. =
.000) are also found between respondents staying in different hotel ratings. Respondents
that stayed at 5-Star hotels (x = 5.39) have a higher mean on overall conative loyalty
than respondents that stayed at 4-Star hotels (x = 4.95; Post Hoc Sig. = .000) and 3-Star
hotels (x = 4.93; Post Hoc Sig. = .010). In addition, respondents in 5-Star hotels (x =
6.15; 6.20) also have higher means that respondents in 4-Star hotels (x = 5.60; 5.69) and
3-Star hotels (x = 5.59; 5.63) respectively on the attributes: intention to say positive
things (Post Hoc Sig. = .000; .003); intention to recommend this hotel to others who
seek my advice (Post Hoc Sig. = .000; .001). In addition, respondents in 5-Stars hotels
(x = 5.49) also have a higher mean than respondents in 4-Star hotels (x = 4.98) on the
attribute: intention to continue staying in this hotel (Post Hoc Sig. = .002).
4.9.2.10 Hotel Type
Table 4.86 Conative Loyalty – Hotel Type
For hotel type, significant differences are found on the attributes: intention
to say positive things (F = 3.561; ANOVA Sig. = .029), intention to recommend this
hotel to others who seek my advice (F = 5.604; ANOVA Sig. = .004). Respondents that
stayed in international chain hotels (x = 6.04; 6.13) have higher means than respondents
that stayed in independent hotels (x = 5.69; 5.73) respectively on both attributes:

88
intention to say positive things (Post Hoc Sig. = .042); intention to recommend this hotel
to others who seek my advice (Post Hoc Sig. = .006).
4.9.2.11 Number of Times Stayed at the Hotel
Table 4.87 Conative Loyalty – Number of Times Stayed at the Hotel

89
In term of the numbers of times stayed at the hotel, significant differences
are found on overall conative loyalty (F = 10.725; ANOVA Sig. = .000) and the
attributes: if other hotels offer a lower rate, I would still stay at this hotel (F = 10.769;
ANOVA Sig. = .000), if the rate rises, I would still stay at this hotel (F = 4.322; ANOVA
Sig. = .014), intention to continue staying in this hotel (F = 17.222; ANOVA Sig. =
.000), intention to recommend this hotel to others who seek my advice (F = 5.393;
ANOVA Sig. = .005). Respondents who have stayed with the hotels more than 3 times
(x = 5.54; Post Hoc Sig. = .000) and respondents who have stayed with the hotels for 2
- 3 times (x = 5.34; Post Hoc Sig. = .002) have higher means of overall conative loyalty
than respondents that stayed with the hotel for the first time (x = 4.93). Furthermore,
respondents that stayed with the hotel more than 3 times (x = 5.31; 5.85; 6.18) have
higher means than respondents who stayed with the hotel for the first time (x = 4.36;
4.89; 5.76) respectively on the attributes: if other hotels offer a lower rate, I would still
stay at this hotel (Post Hoc Sig. = .000); intention to continue staying in this hotel (Post
Hoc Sig. = .000); intention to recommend this hotel to others who seek my advice (Post
Hoc Sig. = .021). Moreover, respondents that have stayed with the hotel for 2 - 3 times
(x = 4.91; 4.30; 5.50; 6.07) have higher means than respondent that stayed with the hotel
for the first time (x = 4.36; 3.86; 4.89; 5.76) respectively on the attributes: if other hotels
offer a lower rate, I would still stay at this hotel (Post Hoc Sig. = .005); if the rate rises,
I would still stay at this hotel (Post Hoc Sig. = .034); intention to continue staying in
this hotel (Post Hoc Sig. = .000); intention to recommend this hotel to others who seek
my advice (Post Hoc Sig. = .029). However, no significant differences are found
between respondents that stayed with the hotel more than 3 times and respondents that
stayed with the hotel for 2 - 3 times.
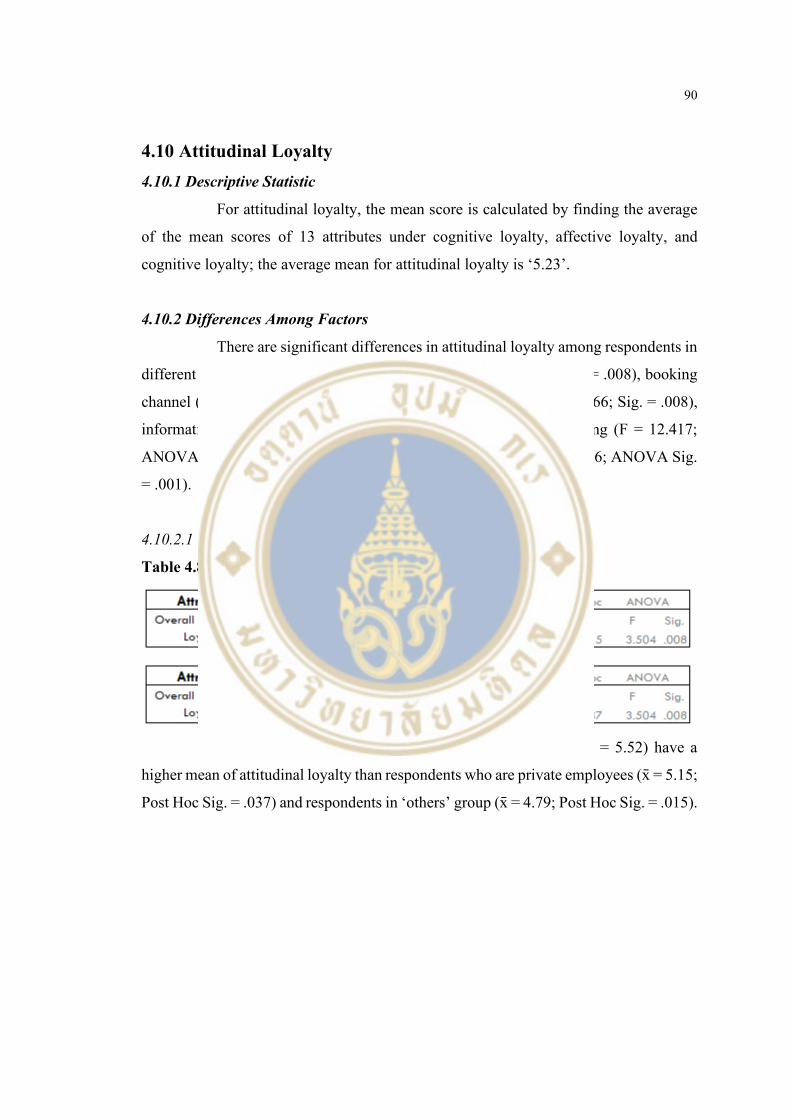
90
4.10 Attitudinal Loyalty 4.10.1 Descriptive Statistic
For attitudinal loyalty, the mean score is calculated by finding the average
of the mean scores of 13 attributes under cognitive loyalty, affective loyalty, and
cognitive loyalty; the average mean for attitudinal loyalty is ‘5.23’.
4.10.2 Differences Among Factors
There are significant differences in attitudinal loyalty among respondents in
different groups of each factor, occupation (F = 3.504; ANOVA Sig. = .008), booking
channel (F = 6.439; ANOVA Sig. = .002), loyalty programme (t = 2.666; Sig. = .008),
information adequacy (F = 12.093; ANOVA Sig. = .000), hotel rating (F = 12.417;
ANOVA Sig. = .000) and number of times stayed at the hotel (F = 7.686; ANOVA Sig.
= .001).
4.10.2.1 Occupation
Table 4.88 Attitudinal Loyalty - Occupation
For occupations, respondents that are business owners (x = 5.52) have a
higher mean of attitudinal loyalty than respondents who are private employees (x = 5.15;
Post Hoc Sig. = .037) and respondents in ‘others’ group (x = 4.79; Post Hoc Sig. = .015).

91
4.10.2.2 Booking Channel
Table 4.89 Attitudinal Loyalty – Booking Channel
In terms of booking channels, respondents who reserved the room through
hotel direct channels (x = 5.38) have a higher mean of attitudinal loyalty (Post Hoc Sig.
= .002) than respondents who reserved the room via online travel agencies (x = 5.04).
4.10.2.3 Loyalty Programme
Table 4.90 Attitudinal Loyalty – Loyalty Programme
Members of loyalty programmes (x = 5.33) also have a higher mean of
attitudinal loyalty than non-members (x = 5.07).
4.10.2.4 Information Adequacy
Table 4.91 Attitudinal Loyalty – Information Adequacy
For information adequacy, respondents who received full information about
pricing (x = 5.46; Post Hoc Sig. = .000) and respondents who received partial
information (x = 5.23; Post Hoc Sig. = .023) have higher means of attitudinal loyalty
than respondents who received no information (x = 4.90).
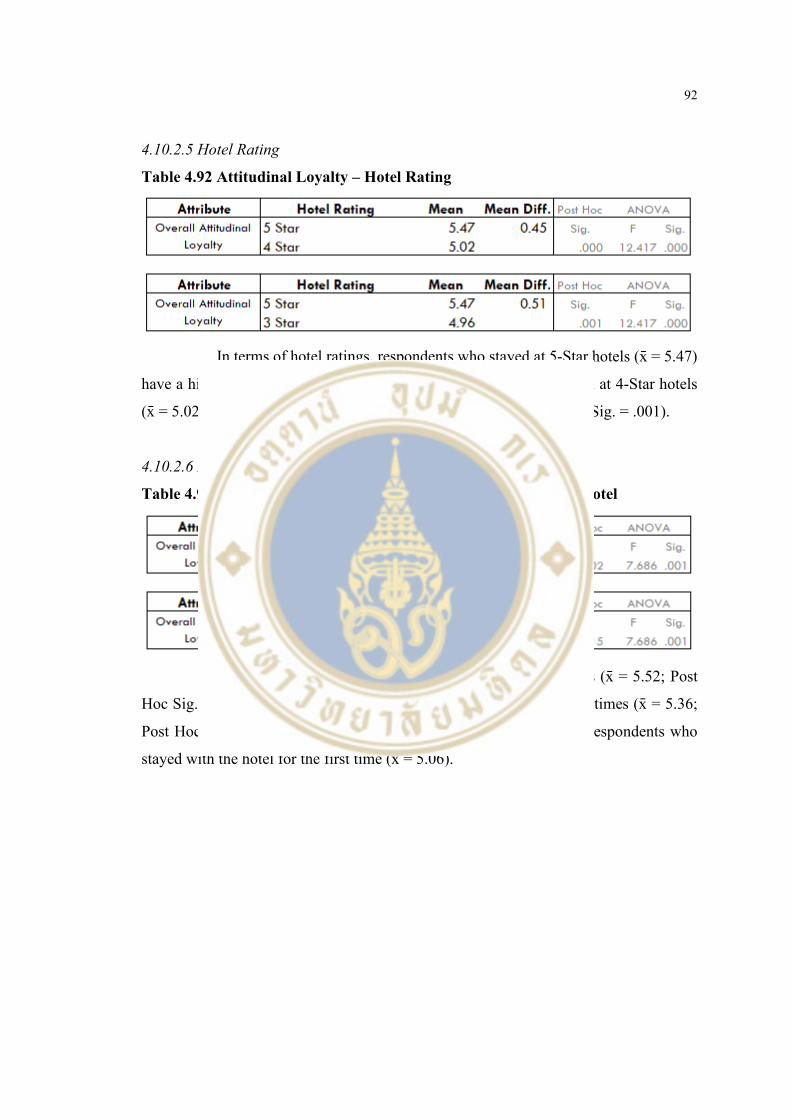
92
4.10.2.5 Hotel Rating
Table 4.92 Attitudinal Loyalty – Hotel Rating
In terms of hotel ratings, respondents who stayed at 5-Star hotels (x = 5.47)
have a higher mean of attitudinal loyalty than respondents who stayed at 4-Star hotels
(x = 5.02; Post Hoc Sig. = .000) and 3-Star hotels (x = 4.96; Post Hoc Sig. = .001).
4.10.2.6 Number of Times Stayed at the Hotel
Table 4.93 Attitudinal Loyalty – Number of Times Stayed at the Hotel
Respondents who stayed with the hotel more than 3 times (x = 5.52; Post
Hoc Sig. = .002) and respondents who stayed with the hotel for 2 - 3 times (x = 5.36;
Post Hoc Sig. = .015) have higher means of attitudinal loyalty than respondents who
stayed with the hotel for the first time (x = 5.06).
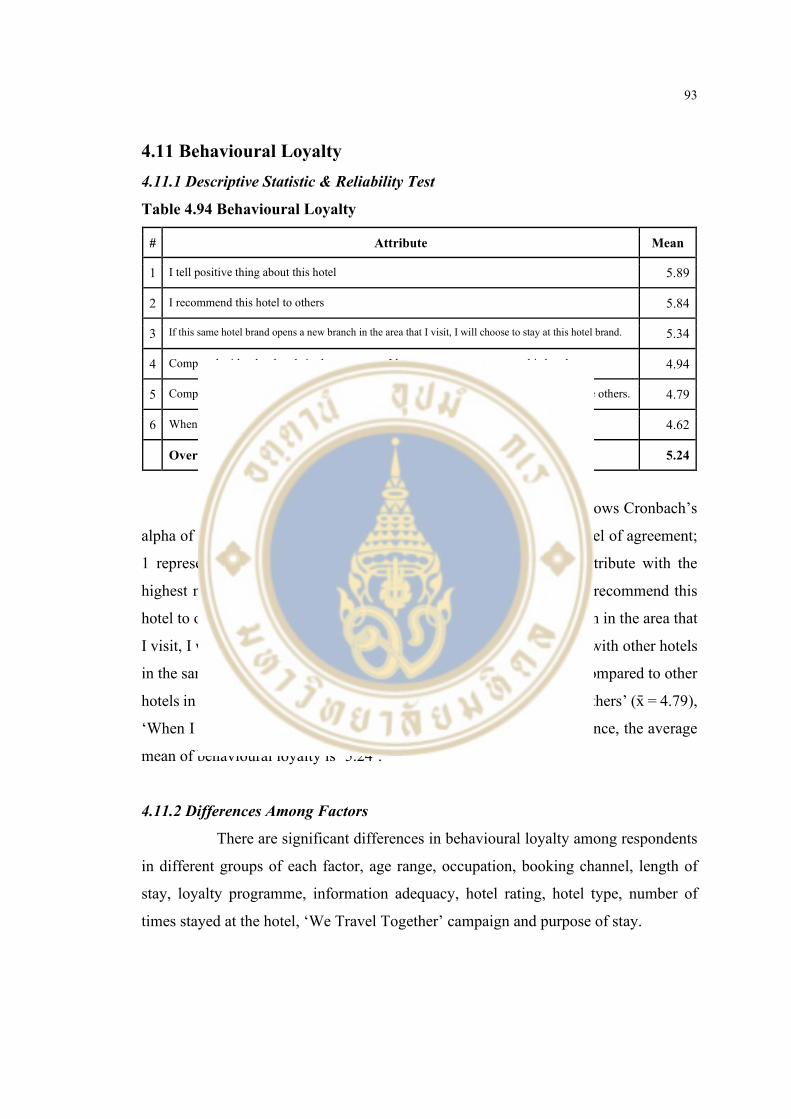
93
4.11 Behavioural Loyalty 4.11.1 Descriptive Statistic & Reliability Test
Table 4.94 Behavioural Loyalty
# Attribute Mean
1 I tell positive thing about this hotel 5.89
2 I recommend this hotel to others 5.84
3 If this same hotel brand opens a new branch in the area that I visit, I will choose to stay at this hotel brand. 5.34
4 Compared with other hotels in the same area, I have spent more money at this hotel. 4.94
5 Compared to other hotels in the same area, I have stayed more often at this hotel than the others. 4.79
6 When I visit the same area, I always stay at this hotel. 4.62
Overall Behavioural Loyalty 5.24
There are 6 attributes for behavioural loyalty; the result shows Cronbach’s
alpha of ‘.87’. Scales of 1 - 7 were used to determine respondents’ level of agreement;
1 represents totally disagree, and 7 represents totally agree. The attribute with the
highest mean is ‘I tell positive things about this hotel’ (x = 5.89), ‘I recommend this
hotel to others’ (x = 5.84), ‘If this same hotel brand opens a new branch in the area that
I visit, I will choose to stay at this hotel brand’ (x = 5.34), ‘Compared with other hotels
in the same area, I have spent more money at this hotel’ (x = 4.94), ‘Compared to other
hotels in the same area, I have stayed more often at this hotel than the others’ (x = 4.79),
‘When I visit the same area, I always stay at this hotel’ (x = 4.62). Hence, the average
mean of behavioural loyalty is ‘5.24’.
4.11.2 Differences Among Factors
There are significant differences in behavioural loyalty among respondents
in different groups of each factor, age range, occupation, booking channel, length of
stay, loyalty programme, information adequacy, hotel rating, hotel type, number of
times stayed at the hotel, ‘We Travel Together’ campaign and purpose of stay.

94
4.11.2.1 Age Range
Table 4.95 Behavioural Loyalty – Age Range
For age range, significant differences are found on two attributes: always
stay at this hotel (F = 7.868; ANOVA Sig. = .000), stay here more often than the other
hotels (F = 7.231; ANOVA Sig. = .001). Respondents who are 18 - 24 years old (x =
5.30; 5.39) have higher means than respondents who are 25 - 40 years old (x = 4.41;
4.58) respectively on both attributes: always stay at this hotel (Post Hoc Sig. = .001);
stay here more often than the other hotels (Post Hoc Sig. = .005). In addition,
respondents who are 41 years old or older (x = 5.16) have a higher mean than
respondents who are 25 - 40 years old (x = 4.58) on the attribute: stay here more often
than the other hotel (Post Hoc Sig. = .028).
4.11.2.2 Occupation
Table 4.96 Behavioural Loyalty – Occupation
In terms of occupations, significant differences are identified on one
attribute: always stay at this hotel (F = 4.167; ANOVA Sig. = .003). Respondents who
are business owners (x = 5.06) have a higher mean than respondents who are private
employees (x = 4.41; Post Hoc Sig. = .036) and respondents in the ‘others’ group (x =
3.92; Post Hoc Sig. = .032) respectively on this attribute.

95
4.11.2.3 Booking Channel
Table 4.97 Behavioural Loyalty – Booking Channel
For booking channel, significant differences are found on overall
behavioural loyalty (F = 5.414; ANOVA Sig. = .005) and the attributes: tell positive
things about this hotel (F = 6.189; ANOVA Sig. = .002), recommend this hotel to others
(F = 4.835; ANOVA Sig. = .008). Respondents who reserved the room through hotel
direct channels (x = 5.38) have a higher mean of overall behavioural loyalty (Post Hoc
Sig. = .026) than respondents who reserved the room via online travel agencies (x =
5.08). In addition, respondents that reserved the room through hotel direct channels (x
= 6.07; 6.00) also have higher means than respondents that reserved the room on online
travel agencies (x = 5.66; 5.63) respectively on the attributes: tell positive things about
this hotel (Post Hoc Sig. = .001); recommend this hotel to others (Post Hoc Sig. = .012).

96
4.11.2.4 Length of Stay
Table 4.98 Behavioural Loyalty – Length of Stay
Significant differences in the attributes: stay here more often than the other
hotels (F = 3.606; ANOVA Sig. = .028), spend more money at this hotel (F = 4.242;
ANOVA Sig. = .015) are identified among respondents with different length of stay.
Respondents who stayed with the hotel for 3 - 5 nights (x = 4.58; 5.67) have higher
means than respondents who stayed with the hotel for 1 -2 nights (x = 4.00; 5.16)
respectively on the attributes: stay here more often than the other hotels (Post Hoc Sig.
= .029); spend more money at this hotel (Post Hoc Sig. = .031).

97
4.11.2.5 Loyalty Programme
Table 4.99 Behavioural Loyalty – Loyalty Programme
Members of loyalty programmes (x = 5.37) have a higher mean of overall
behavioural loyalty (t = 3.036; Sig. = .003) than non-members (x = 5.02). In addition,
members of loyalty programmes (x = 4.93; 6.05; 5.49; 6.01) also have higher means
than non-members (x = 4.56; 5.64; 5.08; 5.56) on the attributes: stay here more often
than the other hotels (t = 2.125; Sig. = .034); tell positive things about this hotel (t =
3.451; Sig. = .001); will stay at this hotel in new branches (t = 3.077; Sig. = .002); and
recommend this hotel to others (t = 3.470; Sig. = .001).

98
4.11.2.6 Information Adequacy
Table 4.100 Behavioural Loyalty – Information Adequacy
For information adequacy, significant differences are found on overall
behavioural loyalty (F = 6.998; ANOVA Sig. = .001) and on the attributes: always stay
at this hotel (F = 3.915; ANOVA Sig. = .021), stay here more often than the other hotels
(F = 3.761; ANOVA Sig. = .024), spend more money at this hotel (F = 5.102; ANOVA
Sig. = .006), tell positive things about this hotel (F = 6.610; ANOVA Sig. = .001), will
stay at this hotel in new branches (F = 7.303; ANOVA Sig. = .001). Respondents who
received full information about pricing (x = 5.44) have a higher mean of overall
behavioural loyalty (Post Hoc Sig. = .001) than respondents who received no
information (x = 4.93). Moreover, respondents with full information (x = 4.78; 4.94;
5.18; 6.13; 5.62) also have higher means than respondents with no information (x =
4.25; 4.42; 4.56; 5.64; 5.03) respectively on the attributes: always stay at this hotel (Post
Hoc Sig. = .031); stay here more often than the other hotels (Post Hoc Sig. = .037);
spend more money at this hotel (Post Hoc Sig. = .005); tell positive things about this
hotel (Post Hoc Sig. = .001); will stay at this hotel in new branches (Post Hoc Sig. =
.001).

99
4.11.2.7 Hotel Rating
Table 4.101 Behavioural Loyalty – Hotel Rating
In terms of hotel rating, significant differences are identified on overall
behavioural loyalty (F = 5.384; ANOVA Sig. = .005) and the attributes: tell positive
things about this hotel (F = 13.209; ANOVA Sig. = .000), will stay at this hotel in new
branches (F = 14.338; ANOVA Sig. = .000), recommend this hotel to others (F = 14.113;
ANOVA Sig. = .000). Respondents who stayed at 5-Star hotels (x = 5.42) have a higher
mean of overall behavioural loyalty (Post Hoc Sig. = .004) than respondents who stayed
at 4-Star hotels (x = 5.01). Furthermore, respondents in 5-Star hotels (x = 6.19; 5.68;
6.16) have higher means than respondents in 4-Star hotels (x = 5.62; 4.97; 5.62)
respectively on the attributes: tell positive things about this hotel (Post Hoc Sig. = .000);
will stay at this hotel in new branches (Post Hoc Sig. = .000); recommend this hotel to
others (Post Hoc Sig. = .000). In addition, respondents in 5-Star hotels (x = 6.19; 5.68;

100
6.16) have higher means than respondents in 3-Star hotels (x =5.59; 5.08; 5.33)
respectively on the attributes: tell positive things about this hotel (Post Hoc Sig. = .001);
will stay at this hotel in new branches (Post Hoc Sig. = .004); recommend this hotel to
others (Post Hoc Sig. = .000). However, there are no significant differences between
respondents in 4-Star hotels and 3-Star hotels.
4.11.2.8 Hotel Type
Table 4.102 Behavioural Loyalty – Hotel Type
Significant differences on three attributes: tell positive things about this
hotel (F = 4.283; ANOVA Sig. = .014), will stay at this hotel in new branches (F =
7.508; ANOVA Sig. = .001), recommend this hotel to others (F = 6.540; ANOVA Sig.
= .002) are found among respondents that stayed in different hotel types. Respondents
who stayed in international chain hotels (x = 6.08; 5.58; 6.06) have higher means than
respondents who stayed in independent hotels (x = 5.74; 4.97; 5.52) respectively on all
of the three attributes: tell positive things about this hotel (Post Hoc Sig. = .037); will
stay at this hotel in new branches (Post Hoc Sig. = .000); recommend this hotel to others
(Post Hoc Sig. = .001).
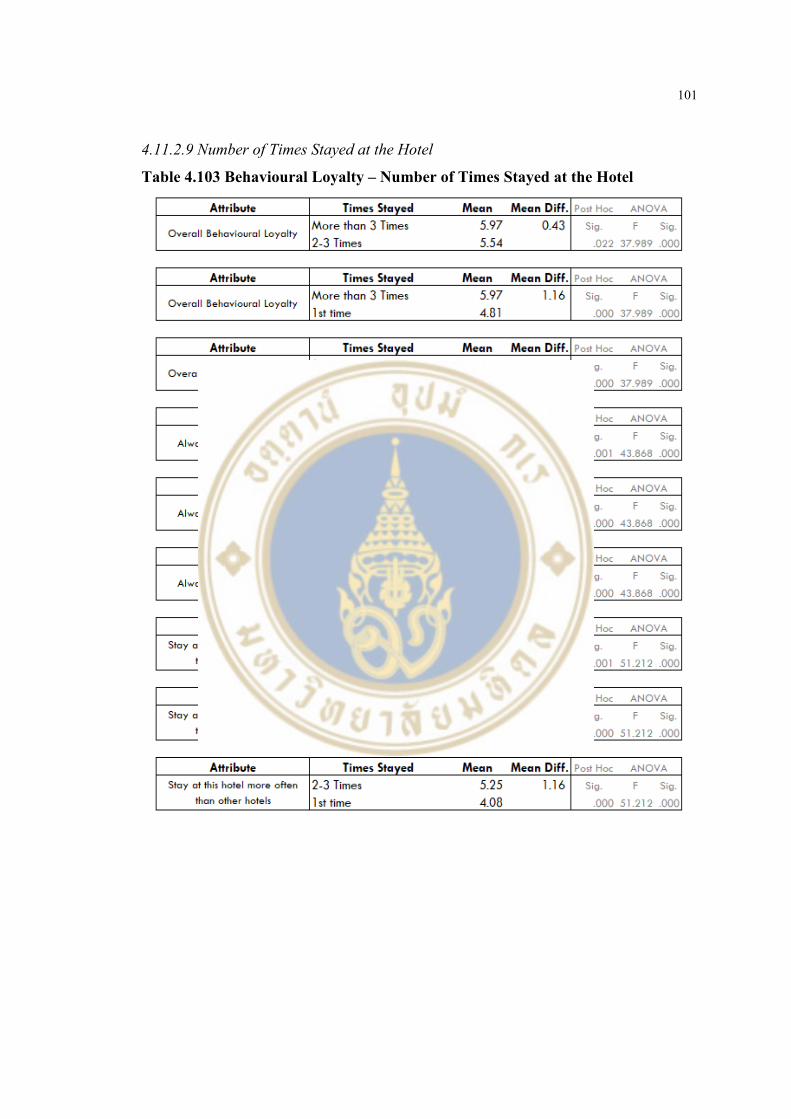
101
4.11.2.9 Number of Times Stayed at the Hotel
Table 4.103 Behavioural Loyalty – Number of Times Stayed at the Hotel

102
For number of times stayed at the hotel, significant differences are found on
overall behavioural loyalty (F = 37.989; ANOVA Sig. = .000) and on all attributes:
always stay at this hotel (F = 43.868; ANOVA Sig. = .000), stay here more often than
the other hotels (F = 51.212; ANOVA Sig. = .000), spend more money at this hotel (F
= 24.768; ANOVA Sig. = .000), tell positive things about this hotel (F = 4.332; ANOVA
Sig. = .014), will stay at this hotel in new branches (F = 11.751; ANOVA Sig. = .000),
recommend this hotel to others (F = 9.502; ANOVA Sig. = .000). Respondents who
stayed with the hotel more than 3 times (x = 5.97) have a higher mean of overall
behavioural loyalty than respondents who stayed with the hotel for 2 - 3 times (x = 5.54;
Post Hoc Sig. = .022) and respondents who stayed with the hotel for the first time (x =
4.81; Post Hoc Sig. = .000). In addition, the difference between the means of
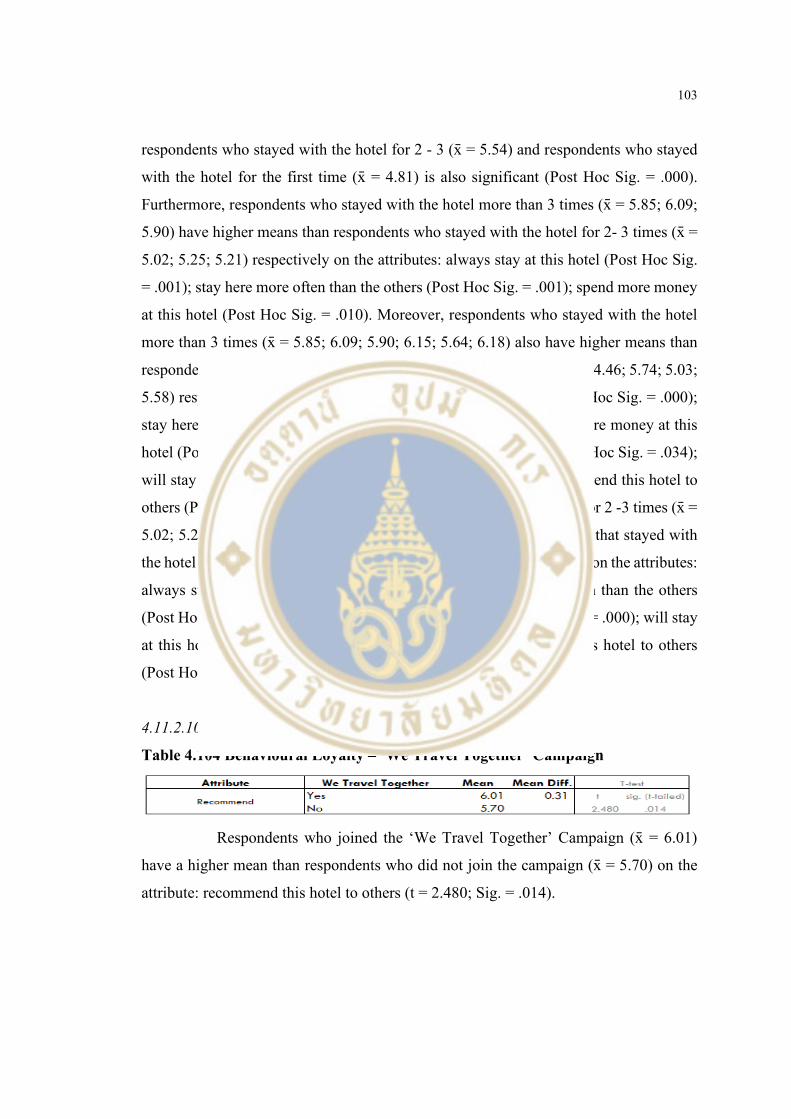
103
respondents who stayed with the hotel for 2 - 3 (x = 5.54) and respondents who stayed
with the hotel for the first time (x = 4.81) is also significant (Post Hoc Sig. = .000).
Furthermore, respondents who stayed with the hotel more than 3 times (x = 5.85; 6.09;
5.90) have higher means than respondents who stayed with the hotel for 2- 3 times (x =
5.02; 5.25; 5.21) respectively on the attributes: always stay at this hotel (Post Hoc Sig.
= .001); stay here more often than the others (Post Hoc Sig. = .001); spend more money
at this hotel (Post Hoc Sig. = .010). Moreover, respondents who stayed with the hotel
more than 3 times (x = 5.85; 6.09; 5.90; 6.15; 5.64; 6.18) also have higher means than
respondents who stayed with the hotel for the first time (x = 3.98; 4.08; 4.46; 5.74; 5.03;
5.58) respectively on all six attributes: always stay at this hotel (Post Hoc Sig. = .000);
stay here more often than the others (Post Hoc Sig. = .000); spend more money at this
hotel (Post Hoc Sig. = .000); tell positive things about this hotel (Post Hoc Sig. = .034);
will stay at this hotel in new branches (Post Hoc Sig. = .003); recommend this hotel to
others (Post Hoc Sig. = .002). Respondents that stayed with the hotel for 2 -3 times (x =
5.02; 5.25; 5.21; 5.66; 6.08) also have higher means than respondents that stayed with
the hotel for the first time (x = 3.98; 4.08; 4.46; 5.03; 5.58) respectively on the attributes:
always stay at this hotel (Post Hoc Sig. = .000); stay here more often than the others
(Post Hoc Sig. = .000); spend more money at this hotel (Post Hoc Sig. = .000); will stay
at this hotel in new branches (Post Hoc Sig. = .000); recommend this hotel to others
(Post Hoc Sig. = .001).
4.11.2.10 ‘We Travel Together’ Campaign
Table 4.104 Behavioural Loyalty – ‘We Travel Together’ Campaign
Respondents who joined the ‘We Travel Together’ Campaign (x = 6.01)
have a higher mean than respondents who did not join the campaign (x = 5.70) on the
attribute: recommend this hotel to others (t = 2.480; Sig. = .014).

104
4.11.2.11 Purpose of Stay
Table 4.105 Behavioural Loyalty – Purpose of Stay
For purpose of stay, respondents who travel for business purposes (x = 5.46)
have a higher mean than respondents who travel for leisure purposes (x = 4.73) on the
attribute: stay here more often than the other hotels (t = 2.390; Sig. = .017).
4.12 Regression Analysis For regression analysis, this study has developed 9 models in total. The first
model is conducted with a simple regression analysis of familiarity with revenue
management practices as an independent variable and perceived fairness as the
dependent variable. The second model included both variables from the first model as
independent variables and took trust as the dependent variable. The same patterns also
occur for the third and fourth models where all variables in each previous model are
taken as independent variables; and for the fourth model, satisfaction is taken as the
dependent variable, while attitudinal loyalty is taken as the dependent variable in the
fifth model. The fifth, sixth and seventh models are different from the fourth model in
terms of the dependent variables. Instead of using the overall attitudinal loyalty, the
fifth, sixth and seventh models use cognitive loyalty, affective loyalty, and conative
loyalty, respectively for the purpose of identifying the effect on attitudinal loyalty on a
deeper level. The eighth and ninth models will examine the effects of all variables of
this study on behavioural loyalty. While the eighth model will use overall attitudinal
loyalty as one of the independent variables but for the ninth model, overall attitudinal
loyalty will be replaced by cognitive loyalty, affective loyalty, and conative loyalty. The
findings of the models are illustrated as follows:

105
4.12.1 Model 1: Influence on Perceived Fairness
Figure 4.1 Regression Analysis – Perceived Fairness
Table 4.106 Regression Analysis – Perceived Fairness
# Independent Variable Beta t Sig.
1 Familiarity with Revenue Management .352 7.667 .000
For the first model, simple regression has been conducted to identify the
relationship between the independent variable: familiarity with revenue management
practices, and the dependent variable: perceived fairness. The result shows that
familiarity with revenue management has a positive relationship with perceived fairness
(Beta = .352; t = 7.667; Sig. = .000).
4.12.2 Model 2: Influence on Trust
Figure 4.2 Regression Analysis – Trust
Table 4.107 Regression Analysis – Trust
# Independent Variables Beta t Sig.
1 Perceived Fairness .484 11.111 .000
2 Familiarity with Revenue Management .158 3.623 .000
For the second model, multiple regression has been conducted to identify
the relationship between the independent variables: familiarity with revenue
management practices; perceived fairness and the dependent variable: trust. The result
shows that both independent variables have a positive relationship with trust. In more
detail, regarding trust, perceived fairness has stronger effect (Beta = .484; t = 11.111;
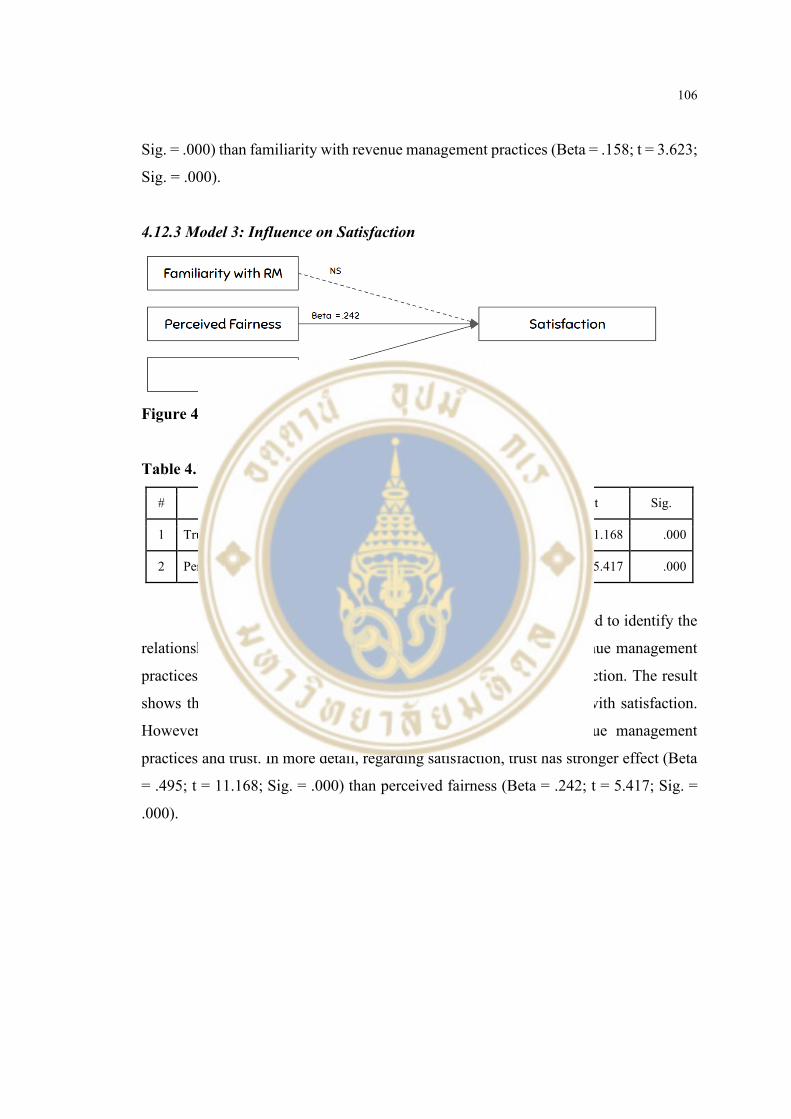
106
Sig. = .000) than familiarity with revenue management practices (Beta = .158; t = 3.623;
Sig. = .000).
4.12.3 Model 3: Influence on Satisfaction
Figure 4.3 Regression Analysis – Satisfaction
Table 4.108 Regression Analysis – Satisfaction
# Independent Variables Beta t Sig.
1 Trust .495 11.168 .000
2 Perceived Fairness .242 5.417 .000
For the third model, multiple regression has been conducted to identify the
relationship between the independent variables: familiarity with revenue management
practices; perceived fairness; trust and the dependent variable: satisfaction. The result
shows that perceived fairness and trust have a positive relationship with satisfaction.
However, there is no relationship between familiarity with revenue management
practices and trust. In more detail, regarding satisfaction, trust has stronger effect (Beta
= .495; t = 11.168; Sig. = .000) than perceived fairness (Beta = .242; t = 5.417; Sig. =
.000).

107
4.12.4 Model 4: Influence on Attitudinal Loyalty
Figure 4.4 Regression Analysis – Attitudinal Loyalty
Table 4.109 Regression Analysis – Attitudinal Loyalty
# Independent Variables Beta t Sig.
1 Satisfaction .591 11.120 .000
2 Perceived Fairness .099 1.975 .049
For the fourth model, multiple regression has been conducted to identify the
relationship between the independent variables: familiarity with revenue management
practices; perceived fairness; trust; satisfaction and the dependent variable: attitudinal
loyalty. The result shows that perceived fairness and satisfaction have a positive
relationship with attitudinal loyalty. However, familiarity with revenue management
and trust are the two independent variables that do not have a relationship with
attitudinal loyalty. In more detail, regarding attitudinal loyalty, satisfaction has a
stronger effect (Beta = .591; t = 11.120; Sig. = .000) than perceived fairness (Beta =
.099; t = 1.975; Sig. = .049).

108
4.12.5 Model 5: Influence on Elements of Attitudinal Loyalty - Cognitive Loyalty
Figure 4.5 Regression Analysis – Cognitive Loyalty
Table 4.110 Regression Analysis – Cognitive Loyalty
# Independent Variable Beta t Sig.
1 Satisfaction .496 8.562 .000
For the fifth model, multiple regression has been conducted to identify the
relationship between the independent variables: familiarity with revenue management
practices; perceived fairness; trust; satisfaction and the dependent variable: cognitive
loyalty. The result shows that only satisfaction has a relationship with cognitive loyalty
(Beta = .496; t = 8.562; Sig. = .000). Other independent variables including familiarity
with revenue management, perceived fairness and trust do not have a relationship with
cognitive loyalty.

109
4.12.6 Model 6: Influence on Elements of Attitudinal Loyalty - Affective Loyalty
Figure 4.6 Regression Analysis – Affective Loyalty
Table 4.111 Regression Analysis – Affective Loyalty
# Independent Variables Beta t Sig.
1 Satisfaction .586 11.056 .000
2 Perceived Fairness .101 2.017 .044
For the sixth model, multiple regression has been conducted to identify the
relationship between the independent variables: familiarity with revenue management
practices; perceived fairness; trust; satisfaction and the dependent variable: affective
loyalty. The result shows that satisfaction and perceived fairness have a relationship
with affective loyalty; satisfaction has stronger effect (Beta = .586; t = 11.056; Sig. =
.000) than perceived fairness (Beta = .101; t = 2.017; Sig. = .044). While for familiarity
with revenue management practices and trust, no significant relationships are found
toward affective loyalty.

110
4.12.7 Model 7: Influence on Elements of Attitudinal Loyalty - Conative Loyalty
Figure 4.7 Regression Analysis – Conative Loyalty
Table 4.112 Regression Analysis – Conative Loyalty
# Independent Variable Beta t Sig.
1 Satisfaction .527 9.471 .000
For the seventh model, multiple regression has been conducted to identify
the relationship between the independent variables: familiarity with revenue
management practices; perceived fairness; trust; satisfaction and the dependent variable:
conative loyalty. The result shows that only satisfaction has a relationship with conative
loyalty (Beta = .527; t = 19.471; Sig. = .000). Other independent variables which are
familiarity with revenue management, perceived fairness and trust do not have any
relationship with conative loyalty.

111
4.12.8 Model 8: Influence on Behavioural Loyalty
Figure 4.8 Regression Analysis – Behavioural Loyalty
Table 4.113 Regression Analysis – Behavioural Loyalty
# Independent Variable Beta t Sig.
1 Attitudinal Loyalty .795 21.178 .000
For the eighth model, multiple regression has been conducted to identify the
relationship between the independent variables: familiarity with revenue management
practices; perceived fairness; trust; satisfaction; attitudinal loyalty and the dependent
variable: behavioural loyalty. The result shows that attitudinal loyalty has a positive
relationship with behavioural loyalty (Beta = .795; t = 21.178; Sig. = .000). However,
the other independent variables including familiarity with revenue management
practices, perceived fairness, trust, and satisfaction do not have a relationship with
behavioural loyalty.

112
4.12.9 Model 9: Influence on Behavioural Loyalty - Attitudinal Loyalty Breakdown
Figure 4.9 Regression Analysis – Behavioural Loyalty II
Table 4.114 Regression Analysis – Behavioural Loyalty II
# Independent Variables Beta t Sig.
1 Conative Loyalty .575 12.375 .000
2 Affective Loyalty .197 3.757 .000
3 Cognitive Loyalty .108 2.377 .018
For the ninth model, further analysis on behavioural loyalty has been
conducted by replacing attitudinal loyalty with each element of attitudinal loyalty,
including cognitive loyalty, affective loyalty, and cognitive loyalty. So, the independent
variables will include familiarity with revenue management practices, perceived
fairness, trust, satisfaction, cognitive loyalty, affective loyalty, and cognitive loyalty.
Behavioural loyalty is the dependent variable of this model. The result shows that all of
the independent variables that are the element of attitudinal loyalty have a relationship
with behavioural loyalty, while other independent variables do not have a relationship
with behavioural loyalty. In more detail, regarding behavioural loyalty, conative loyalty
has the strongest effect (Beta = .575; t = 12.375; Sig. = .000), followed by affective
113
loyalty (Beta = .197; t = 3.757; Sig. = .000), and cognitive loyalty (Beta = 108; t = 2.377;
Sig. = .018).

114
CHAPTER V
DISCUSSION
5.1 Relationship 5.1.1 Perceived Fairness (Model 1)
For the first model, the result shows that familiarity with revenue
management has an impact on perceived fairness. In other words, a higher level of
familiarity with revenue management practices in hotels would lead to a higher level of
perceived fairness in the view of customers. The result has confirmed the previous
findings (Wirtz & Kimes, 2007) that familiarity with revenue management can lead to
a higher level of perceived fairness as customers can see both sides of the rate fence and
are less likely to compare the price that they received with other customers that have
different conditions. In addition, the result of this study is in line with previous findings
(Suklabaidya & Singh, 2017) that familiarity with hotel revenue management practices
and price knowledge also increased the level of fairness. Furthermore, previous studies
(McGuire & Kimes, 2006; Tang et al., 2019) in restaurant revenue management shows
that revenue management in the specific industry has an impact on perceived fairness;
the findings of this study which focus on hotel revenue management also confirmed
their findings as the result shows that familiarity with hotel revenue management has a
positive relationship with perceived fairness.
5.1.2 Trust (Model 2)
For the second model, the result from regression analysis shows that both
perceived fairness and familiarity with revenue management have a positive relationship
with trust; while perceived fairness has more impact than familiarity. In terms of the
relationship between familiarity with revenue management and trust, it is in line with
the previous finding in the context of e-commerce (Gefen, 2000), where familiarity has
a significant impact on trust. In terms of the effect of perceived fairness on trust, the
115
result of the current study also confirmed the previous finding (Chen & Chou, 2012;
Setiawan et al., 2020) that perceived fairness has a significant impact on trust.
5.1.3 Satisfaction (Model 3)
For the third model, the regression analysis with three independent variables
- familiarity with revenue management practices, perceived fairness, and trust - have
identified that trust has the strongest impact on satisfaction, followed by perceived
fairness. However, familiarity with revenue management does not have a direct
relationship with satisfaction. This study has confirmed the previous findings from Lie
et al., (2019); Mandira et al., (2018) which stated that trust has a significant impact on
satisfaction. In terms of perceived fairness, the finding of this study is in line with the
finding from Dai (2010) which found out that in the context of pricing, perceived
fairness is positively associated with satisfaction. In addition, the result is also similar
to previous literature (Xia et al, 2016; Choi & Mattila, 2009) which mentioned that
perceived fairness has an influence on satisfaction.
5.1.4 Attitudinal Loyalty (Model 4)
For the fourth model, the result shows that out of four independent variables
- familiarity with revenue management practices, perceived fairness, trust, and
satisfaction - two variables which are perceived fairness and satisfaction, have a positive
relationship with attitudinal loyalty. Satisfaction has the strongest impact, followed by
perceived fairness, while familiarity with revenue management practices and trust did
not have a significant relationship with attitudinal loyalty. Compared to previous
findings, this study has confirmed the previous findings of Charuvatana (2019), where
a similar relationship occurs under the context of dynamic pricing in the hotel industry.
In addition, the finding of the current study also confirmed the findings of He and Jun
(2010) that customer satisfaction has a positive effect on behavioural intention and
McDougall and Levesque (2000) which stated that customer satisfaction is strongly
related to customer loyalty. Furthermore, the result is also in line with previous literature
(Xia et al, .2004; Yeoman, 2016; Choi & Mattila, 2009) which mentioned that both
perceived fairness and customer satisfaction are the antecedents of customer loyalty.

116
5.1.5 Breakdown of Attitudinal Loyalty (Model 5 - 7)
In the fifth, sixth and seventh models, each element of attitudinal loyalty
namely, cognitive loyalty, affective loyalty and conative loyalty are taken as the
dependent variables. Familiarity with revenue management practices, perceived
fairness, trust, and satisfaction are taken as the independent variables for these models.
For the fifth model, the result shows that satisfaction is the only independent
variable that has an effect on cognitive loyalty. Familiarity with revenue management
practices, perceived fairness and trust does not have a significant relationship toward
cognitive loyalty.
For the sixth model, the result shows that two variables, which are perceived
fairness and satisfaction, have a positive relationship toward affective loyalty;
satisfaction has a stronger effect than perceived fairness. Both familiarities with revenue
management practices and trust do not have a significant relationship toward affective
loyalty.
For the seventh model, a similar pattern with the fifth model is found. The
result shows that satisfaction is the only independent variable that has an effect on
conative loyalty. Familiarity with revenue management practices, perceived fairness
and trust does not have a significant relationship toward conative loyalty.
In conclusion, satisfaction has a relationship in all three elements of
attitudinal loyalty, while perceived fairness only has a significant relationship with
affective loyalty. On the other hand, familiarity with revenue management practices and
trust do not have a significant relationship with any elements of attitudinal loyalty.
5.1.6 Behavioural Loyalty (Model 8 - 9)
In the eighth and ninth models, behavioural loyalty has been taken as the
dependent variable, while other factors in the previous models are taken as dependent
variables. The difference between the eighth and ninth models is that the eighth model
uses overall attitudinal loyalty as a part of independent variables, while the ninth model
takes cognitive loyalty, affective loyalty, and conative loyalty as a part of independent
variables instead of the single overall attitudinal loyalty variable.
The result of the eighth model shows that only attitudinal loyalty has a
significant relationship toward behavioural loyalty. However, familiarity with revenue
117
management practices, perceived fairness, trust, and satisfaction do not have a direct
relationship with behavioural loyalty.
The result of the ninth model also shows similar results as only the three
elements of attitudinal loyalty, which are cognitive loyalty, affective loyalty and
conative loyalty have a significant relationship toward behavioural loyalty. Conative
loyalty has the strongest effect on behavioural loyalty, affective loyalty has the second
strongest effect and cognitive loyalty comes in third. Other independent variables do not
have a direct relationship toward behavioural loyalty.
This study found out that all three elements of attitudinal loyalty have an
effect on behavioural loyalty, it matched with the findings on customer loyalty in the
hotel business (Suhartanto, 2013) where similar attributes of attitudinal loyalty and
behavioural loyalty are adopted. Suhartanto (2013) found out that attitudinal loyalty -
which in his study has included attributes on cognitive loyalty and affective loyalty -
and standalone conative loyalty has an effect on behavioural loyalty.
5.2 Differences among Respondent Demographics Group 5.2.1 Current Resident
Familiarity with revenue management practices is the only variable that
contains differences among respondent groups in this factor. The result shows that
respondents in Bangkok are more familiar with revenue management practices than
respondents who live outside of the Bangkok Metropolitan Region. Even though the
overall mean of familiarity with revenue management practices of respondents that live
in Bangkok’s surroundings are close to the mean of Bangkok residents, no significant
differences are found between Bangkok’s Surrounding group and outside of the
Bangkok Metropolitan Region group.
5.3.2 Monthly Income
The only variable that contains differences between respondents with
different monthly income ranges is trust. Respondents with a monthly income of 50,001
- 100,000 baht have a higher trust toward hotels than respondents with a monthly income
of less than 15,000 Baht. In more detail, the means of overall trust increase in accordance

118
with the level of monthly income, among the range of less than 15,000 Baht up until the
range of 50,001 - 100,000 Baht, but the mean of respondents with a monthly income of
more than 100,000 Baht is the only range that does not follow the trend. Nevertheless,
the differences in the mean of trust are only significant between the income of less than
15,000 Baht per month and 50,001 - 100,000 Baht per month.
5.3.3 Occupation
Significant differences among attitudinal loyalty are found among
respondents with different occupations. The result shows that business owners have a
higher level of attitudinal loyalty than private employees and respondents in the ‘others’
group. By looking into each element of attitudinal loyalty, the same pattern also occurs
for conative loyalty. For affective loyalty, the differences are only found between
business owners and the ‘others’ group. For cognitive loyalty, there are no significant
differences among occupations.
5.3 Findings on Differences among Respondents’ Behaviour on Hotel
Reservation & Factors Related to Revenue Management 5.3.1 Rate Fences
This study has examined the non-physical rate fences in all three
characteristics, including transaction, consumption, and buyer. For transaction
characteristics, cancellation policy and booking channel are examined; for consumption
characteristics, length of stay is examined; for buyer characteristics, the loyalty
programme is examined.
For non-physical rate fences by transaction characteristics, differences in
trust are found among respondents that received different cancellation policies.
Respondents who received a fully refundable cancellation policy have a higher trust
toward the hotel than respondents that received a partially refundable cancellation
policy. In addition, respondents with partially refundable cancellation policies have the
lowest means for all attributes for trust among the three types of cancellation policies.
Hence, the result implies that partially refundable policy could make customers
perceived less trust toward hotels.

119
Another non-physical rate fence by transaction characteristics that this study
examined is the booking channel. Trust, satisfaction, and customer loyalty are the
variables that differences among respondents with different booking channels are found.
The differences of all variables contain a similar pattern; respondents that reserved the
hotel room through hotel direct channels have a higher level of trust, satisfaction, and
customer loyalty than respondents that reserved the room via online travel agencies.
Looking deeper into attitudinal loyalty, for all three elements of attitudinal loyalty,
namely, cognitive loyalty, affective loyalty and conative loyalty, the same pattern also
applied. In addition to satisfaction, another difference also occurs, as respondents who
reserved the room via traditional travel agencies have a higher level of satisfaction than
respondents who reserved the room via online travel agencies.
In terms of non-physical rate fence by consumption characteristics, length
of stay is examined for this study. However, the result shows that there are no significant
differences in any variables among respondents with different lengths of stay. Lee et al.
(2020) mentioned that rate fences on length of stay are a practice that is fairly acceptable,
but the length of stay control in terms of availability is perceived as unfair. As rate fences
in terms of length of stay is an acceptable practice, the level of fairness should not differ
among respondents with different lengths of stay, which matched with our finding.
For non-physical rate fences by buyer characteristic, this study has
examined loyalty programmes. The result points out that between members and non-
members of loyalty programmes, differences are found on all variables, except
perceived fairness. Members of loyalty programmes have a higher level of familiarity
with revenue management, trust, satisfaction, attitudinal loyalty, and behavioural
loyalty. Similar patterns are also found on all three elements of attitudinal loyalty as
well.
The result of this study on rate fences matched with the previous findings;
Kimes and Wirtz (2003) found out that different levels of perceived fairness are
impacted by different kinds of rate fences; Vu et al. (2020) identified the linkages
between price discrimination, perceived fairness and switching intention.

120
5.3.2 Price Framing & Rate Parity
In terms of price framing, this study found out that respondents with
different price frames have no differences in the level of perceived fairness, trust,
satisfaction, and loyalty toward the hotel. In addition, for rate parity, the only variable
that contains differences among respondents with different experiences of rate parity is
trust. The result shows that respondents who found rate disparity have a higher trust
toward the hotel than respondents who found rate parity and respondents who did not
compare rates.
This part of the finding did not seem to match with previous studies where
effects of price framing (Kimes & Wirtz, 2003; Priester et al., 2020) and rate parity
(Choi & Mattila, 2009; Gazzoli et al., 2008; Biełuszko and Marciszewska, 2018;
Demirciftci et al., 2010) are explained. However, this phenomenon could be explained
by understanding the role of familiarity with revenue management practices. Wirtz and
Kimes (2007) found out that if customers are familiar with revenue management
practices, they understand that the prices that they receive are under different conditions
from other customers, which make them less likely to perceive such practices as unfair.
In other words, the effect of revenue management practices would have a stronger effect
on those who are less familiar with revenue management practices than the ones with
high familiarity. Choi and Mattila (2009) also confirmed this explanation as well.
For this study, the mean score of overall familiarity with revenue
management practices is ‘6.02’, on a scale of 1 - 7 (1 represents totally disagree, 7
represents totally agree), meaning that respondents in this study have a certain level of
familiarity with revenue management. As respondents are familiar with revenue
management practices, price framing and rate parity would have a much lower effect on
each variable.
The explanation fits well with price framing in which different respondent
groups do not have any differences, but it should also be the same case for rate parity as
well. However, the result of this study shows that respondents with rate disparity have
higher trust than other groups. So, this study took a further step to analyse this part of
the finding and have found out that out of 269 respondents in the rate disparity group,
in term of hotel rating, 142 of them stayed at 5-Star hotels, while for hotel type, 128
respondents stayed at international chain hotels. Another part of the finding of this study

121
has identified that respondents that stayed at 5-Star hotels and independent hotels have
the highest trust among their groups. Therefore, together with the effect of higher
familiarity with revenue management practices, it makes respondents that found rate
disparity to have higher trust than other groups.
5.3.3 Information Adequacy
The result highlighted information adequacy as the result shows that
respondents that received a different level of information have different means of all
variables, namely, familiarity with revenue management, fairness, trust, satisfaction,
and loyalty. Respondents who received full information about pricing have a higher
level of perceived fairness, satisfaction, attitudinal loyalty, including all three elements
and behavioural loyalty than respondents who received no information. Furthermore,
respondents with full information also have a higher level of familiarity with revenue
management practices, perceived fairness, trust, satisfaction, and cognitive loyalty than
respondents that received partial information. In addition, respondents who received
partial information have a higher level of attitudinal loyalty including two elements
which are cognitive loyalty and conative loyalty than respondents that received no
information. The result also identified that respondents with full information have the
highest means among the three groups in all of the variables. Hence, this emphasises the
importance of the completeness of information in terms of hotel revenue management.
The result in terms of information inadequacy confirmed the previous
findings (Choi & Mattila, 2005; 2006) that the respondents who received full
information have higher means of perceived fairness than respondents who received
limited information or no information. Also, the result of this study is in line with the
finding of Méatchi and Camus (2020) which stated that clear and accurate information
has a positive effect on perceived fairness. In addition, the finding of this stay matched
with Ivanov and Zhechev (2012) explanation that if the information is hidden, the trust
could be destroyed.
5.3.4 Hotel Rating and Hotel Type
Hotel type is another factor that leads to differences among groups in all
variables of this study. Respondents who stayed at 5-Star hotels have a higher level of

122
familiarity with revenue management practices, trust, satisfaction, attitudinal loyalty -
including all three elements - and behavioural loyalty than respondents who stayed at 4-
Star hotels. Furthermore, respondents in 5-Star hotels also have a higher level of
perceived fairness, trust, satisfaction, and attitudinal loyalty including all three elements
than respondents who stayed at 3-Star hotels. The result highlighted that luxury or
higher tier hotels are more competent in terms of gaining familiarity with revenue
management practices, customer perception of fairness, trust, satisfaction, and loyalty.
In terms of hotel type, the respondents that stayed at international chain
hotels have a higher level of familiarity with revenue management practices, perceived
fairness, trust, and satisfaction than respondents staying at domestic chain hotels. In
addition, respondents in international chain hotels also have a higher level of familiarity
with revenue management, and trust than respondents in independent hotels. The result
similarly shows the pattern of hotel rating and hotel type as international chain hotels
are also more competent to build familiarity with revenue management practices,
perceived fairness, trust, and satisfaction, but not customer loyalty.
As 5-Star hotels and international chain hotels hold a more reputable image
and also have a higher capability than locally managed hotels or hotels with a lower
rating, it could have a stronger influence on the perception of customers. The result of
this study is similar to the finding of Heo and Lee (2011) which also found out that
respondents in luxury hotels have a higher level of perception of fairness than the
economy or budget hotels.
5.3.5 Number of Times Stayed at the Hotel
In general, the number of times that respondents stayed with the hotel should
be closely related to customer loyalty. The finding of this study also confirmed this
viewpoint as respondents who stayed with the hotel more than 3 times and respondents
who stayed with the hotel 2 - 3 times have a higher level of both attitudinal loyalty and
behavioural loyalty than respondents who stayed with the hotel for the first time. The
same result is found for conative loyalty, but for affective loyalty, the difference is only
significant between guests that stayed with the hotel more than 3 times and the first-
time guest. In addition, a similar result is identified for trust as guests who stayed at the
hotel more than 3 times have higher trust than first-time visitors.

123
5.3.5 ‘We Travel Together’ Campaign
The difference between respondents who reserved the room under this
campaign and respondents that did not join the campaign are found on one variable,
affective loyalty. Respondents who joined the campaign have a higher level of affective
loyalty than respondents who did not join the campaign; they feel better to stay at this
hotel, and they also have a higher level of appreciation toward the hotel.
5.3.6 Purpose of Stay
The difference between business travellers and leisure travellers is found in
satisfaction. Business travellers have a higher level of satisfaction than leisure travellers.
Respondents who travel for business purposes feel more pleasurable and feel that the
service is better than they have expected if compared to respondents with leisure
purposes.

124
5.4 Conclusion The objective of this study is to examine the influences among revenue
management practices, familiarity with revenue management practices, perceived
fairness, trust, satisfaction, and customer loyalty. In addition, this study also examines
the differences in the level of familiarity with revenue management practices, perceived
fairness, trust, satisfaction, and customer loyalty between customers with different
demographic backgrounds, hotel reservation behaviours and revenue management
related factors.
The finding of this study shows that perceived fairness is positively
influenced by familiarity with revenue management practices. In addition, both
variables have a positive influence on trust. While satisfaction is impacted by perceived
fairness and trust, but not familiarity with revenue management practices. In terms of
overall attitudinal loyalty, it is positively influenced by perceived fairness and
satisfaction, where satisfaction affects all three elements of attitudinal loyalty, namely,
cognitive loyalty, affective loyalty, and conative loyalty; while perceived fairness only
impacts one element, affective loyalty. Finally, attitudinal loyalty and all of its three
elements have a positive influence on behavioural loyalty.
Furthermore, this study emphasises the differences among three
demographic factors. First, different current residents lead to different levels of
familiarity with revenue management practices, where Bangkok residents have higher
familiarity with revenue management practices than residents outside of the Bangkok
Metropolitan Region. Second, different monthly incomes lead to different levels of trust
as respondents with a monthly income of 50,0001 - 100,000 Baht have higher trust
toward hotels than respondents with a monthly income of less than 15,000 Baht. Third,
respondents with different occupations have different levels of attitudinal loyalty;
business owners have a higher level of attitudinal loyalty than private employees and
‘other’ occupations.
In terms of revenue management practices and relating factors, this study
highlighted information adequacy in the hotel revenue management context.
Completeness of information that customers received led to a higher level of all
variables in this study. Another highlighted factor is the loyalty programme which is the
non-physical rate fence by buyer characteristic. This study found out that members of

125
loyalty programmes have more positive tendency toward all variables of this study
except perceived fairness. For other rate fences, the results show that respondents who
booked the hotel rooms on hotel direct channels have a higher level of trust, satisfaction,
and loyalty toward the hotels than respondents who booked the room via online travel
agencies. For cancellation policy, the differences are only found on trust, where fully
refundable guests have higher trust than partially refundable guests. While the length of
stay did not create any differences in any variables of this study. In terms of price
framing and rate parity, as respondents are highly familiar with revenue management
practices, price framing and rate parity did not have much influence on each variable.
No differences are found for price framing while trust is the only variable that a
difference occurs for rate parity.
For factors relating to booking behavioural of respondents, this study
identified that hotel rating and hotel type are also the factors that are highlighted in this
study as guests in 5-Star hotels have a higher positive tendency toward all variables of
this study, and guests in international chain hotel also have a higher positive tendency
toward all variables except loyalty. In terms of the number of times stayed at the hotel,
frequently stayed guests have a higher level of trust and loyalty toward the hotels than
first-time guests. For the ‘We Travel Together’ campaign, respondents that joined the
campaign have a higher level of affective loyalty than respondents that did not join the
campaign. Finally, business travellers have a higher level of satisfaction than leisure
travellers.
5.5 Recommendations In this part, this study will provide suggestions and recommendations for
hotel executives, revenue managers and hoteliers to enhance the utility of revenue
management practices to maximise hotel profitability while at the same time,
maintaining a positive perception for customers.
The first highlighted factor that hotels need to be aware of is the familiarity
with revenue management practices. It is the nature of hotel businesses to apply dynamic
pricing, however, customers who are not familiar with such practices would perceive
such practices as unfair and would lose trust toward the hotel. Therefore, each hotel

126
needs to make sure that their target customers are familiar with revenue management
practices in order to apply the practices without creating the perception of unfairness
and trustlessness.
To elaborate into more detail of familiarity with revenue management
practices, this study has pointed out different groups of customers that are more familiar
with revenue management practices than others. First, residents in Bangkok have a
higher familiarity with revenue management practices than residents outside of the
Bangkok Metropolitan Region. Second, members of loyalty programmes, including
both hotels’ and online travel agencies' loyalty programmes, have higher familiarity
with revenue management than non-members. Third, the completeness of information
on pricing that is given to customers could lead to a higher level of familiarity with
revenue management practices. Last, higher-tier hotels and international chain hotels
tend to have guests that have higher familiarity with revenue management practices.
Hence, revenue managers can look into these factors on their target customers to be
aware of customers’ level of familiarity with revenue management practices.
This study would also suggest hotels to always give complete information
about their pricing. Not only that completeness of information could be linked to a
higher level of familiarity with revenue management practices, but is also associated
with perceived fairness, trust, satisfaction, and customer loyalty in terms of both
intention and behaviour. The study has found out that if customers know how prices
differ among each staying period - not only know that ‘price will differ’ but knowing
‘how price differs’ is important - they will have a higher level of perceived fairness,
trust, satisfaction and loyalty toward the hotel. For instant, rather than give no
information about pricing at all or mention that ‘room rate varies based on the number
of days in advance of arrival day that the reservation is made’ the hotel should instead
mention that ‘room rate is higher, for rooms booked closer to the arrival day than those
booked far in advance’. As completeness of information could lead to a higher level of
perceived fairness, trust, satisfaction and loyalty, this study strongly recommends hotels
always inform the customer with full information on their pricing.
Another important finding for revenue managers to consider is the level of
familiarity with revenue management in regard to price framing and rate parity.
Participants in this study are considered to have a high level of familiarity with hotel

127
revenue management practices in the hotel business, and this factor leads to the lower
effect of price framing and rate parity on their perception of fairness. To be more
specific, previous study Wirtz and Kimes (2007) have explained that customers that are
familiar with revenue management practices are less likely to compare the rate that they
received with other customers that received the rate with a different condition. In the
context of high familiarity with revenue management practices, customers who booked
a room under fully refundable conditions would not compare the room rate with other
customers that booked a room under the non-refundable conditions as they understand
that the rates are not under the same condition. Therefore, with high familiarity with
revenue management practices, such practices are less likely to be perceived as unfair.
However, if customers have a low level of familiarity with revenue management
practices, price framing and rate parity could be seen as unfair practices. Therefore,
revenue managers can make the decision about how to frame price and whether to keep
rate parity or not based on the level of familiarity with revenue management practices
of their customers.
Findings in terms of the relationship among each variable would also help
hoteliers to understand the importance of fairness in the perception of customers for the
context of pricing. The study found out that perceived fairness leads to trust, and both
perceived fairness and trust lead to satisfaction. Furthermore, perceived fairness and
satisfaction influence attitudinal loyalty, which attitudinal loyalty leads to behavioural
loyalty. Taking perceived fairness individually, the result confirmed its positive
relationship with trust, satisfaction, affective loyalty, and attitudinal loyalty. In other
words, a higher level of customer perception of fairness leads to a higher level of trust
toward the hotel, a higher level of satisfaction toward the hotel, higher affection, and
affiliation toward the hotel. Therefore, it is crucial to apply revenue management
practices while maintaining the perception of fairness in the view of customers.
In addition, there are factors that hoteliers should be aware of as this study
found these factors associated with many variables of this study. First, the loyalty
programme is a factor that stands out as members of loyalty programmes have a higher
level of familiarity with revenue management practices, trust, satisfaction, and loyalty
than guests who are a non-member. Second, hotel ratings also play an important role as
customers that stayed at 5-Stars hotels tend to have a higher level of perceived fairness,

128
trust, satisfaction, and loyalty toward the hotel than 4-Stars and 3-Stars hotels. Third,
guests that stayed at international chain hotels have a higher level of perceived fairness,
trust, and satisfaction toward the hotels than guests in locally managed hotels. Hoteliers
can take these differences among each group of customers from this study to be factors
to consider in the further plan of implementing revenue management practices.
5.6 Limitations Similar to other studies, this study is not free from limitations. First, this
study is a cross-sectional study where data are collected only once. It is possible that a
longitudinal study could further interpret the relationship among the variables in other
dimensions. Second, this study is conducted during the COVID-19 pandemics, and the
outbreak may lead to customer experiences that differ from the normal situations.
Customers may experience lower room rates, a lower number of guests in the hotels,
facilities closure and strict enforcement of regulations which are different compared to
the normal circumstance. Third, the number of female respondents accounted for 65.0%,
while male respondents only accounted for 24.0%. In addition, 91.6% of the respondents
travelled for leisure purposes, while only 8.4% travelled for business purposes. Hence,
with more male respondents and more business travellers, it might reflect another
dimension of the study.
5.7 Future Research Directions By improving on the limitation of this study and the extent of its finding
would give a view of the effect of fairness in hotel revenue management context in other
dimensions. First, future researchers could examine similar variables in a longitudinal
study to see the long-term effects among the variables. Second, future studies could be
conducted after the pandemic outbreaks have ended and compare the findings with this
study to see the effect of the COVID-19 pandemic in this context. Third, future research
could be conducted with a sample of more male respondents and more business
travellers. Last, future studies could explore other kinds of rate fences and their impacts
on customers' perception of fairness, trust, satisfaction, and loyalty.

129
REFERENCES
Adams, J. (1965). Inequity In Social Exchange. Advances In Experimental Social
Psychology, 267-299. doi: 10.1016/s0065-2601(08)60108-2
Biełuszko, K., & Marciszewska, B. (2018). Room rate parity vs. Rate fences in the
context of price discrimination theory: the case of the Polish hospitality
market. Argumenta Oeconomica, 2(41), 113-133. doi:
10.15611/aoe.2018.2.05
Candan, B., Ünal, S., & Erciş, A. (2013). Analysing the relationship between
consumption values and brand loyalty of young people: A study on personal
care products. European Journal of Research on Education, 2013, Special
Issue: Human Resource Management, 29-46.
Charuvatana, V. (2019). Impacts of Dynamic Pricing on Customer Satisfaction and
Behavioral Intentions in the Hotel Industry. Dusit Thani College Journal,
13(2), 16-32.
Cheng, S. I. (2011). Comparisons of competing models between attitudinal loyalty and
behavioral loyalty. International Journal of Business and Social Science,
2(10), 149-166.
Chen, W., Tsai, D., & Chuang, H. (2010). Effects of missing a price promotion after
purchasing on perceived price unfairness, negative emotions, and behavioral
responses. Social Behavior And Personality: An International Journal,
38(4), 495-507. doi: 10.2224/sbp.2010.38.4.495
Chen, Y., & Chou, T. (2012). Exploring the continuance intentions of consumers for
B2C online shopping. Online Information Review, 36(1), 104-125. doi:
10.1108/14684521211209572
Chiang, C., & Jang, S. (2007). The Effects of Perceived Price and Brand Image on Value
and Purchase Intention: Leisure Travelers' Attitudes Toward Online Hotel
Booking. Journal Of Hospitality & Leisure Marketing, 15(3), 49-69. doi:
10.1300/j150v15n03_04

130
REFERENCES (cont.)
Choi, S., & Mattila, A. (2005). Impact of Information on Customer Fairness Perceptions
of Hotel Revenue Management. Cornell Hotel And Restaurant
Administration Quarterly, 46(4), 444-451. doi:
10.1177/0010880404270032
Choi, S., & Mattila, A. (2006). The Role of Disclosure in Variable Hotel Pricing.
Cornell Hotel And Restaurant Administration Quarterly, 47(1), 27-35. doi:
10.1177/0010880405281681
Choi, S., & Mattila, A. (2009). Perceived Fairness of Price Differences Across
Channels: The Moderating Role of Price Frame and Norm Perceptions.
Journal Of Marketing Theory And Practice, 17(1), 37-48. doi:
10.2753/mtp1069-6679170103
Cochran, W. G. (1977). Sampling techniques (3rd ed.). New York: John Wiley & Sons.
Cross, R., Higbie, J., & Cross, D. (2008). Revenue Management's Renaissance. Cornell
Hospitality Quarterly, 50(1), 56-81. doi: 10.1177/1938965508328716
Cross, R., Higbie, J., & Cross, Z. (2010). Milestones in the application of analytical
pricing and revenue management. Journal Of Revenue And Pricing
Management, 10(1), 8-18. doi: 10.1057/rpm.2010.39
Dai, B. (2010). The Impact of Perceived Price Fairness of Dynamic Pricing on
Customer Satisfaction and Behavioral Intentions: The Moderating Role of
Customer Loyalty (Doctoral). Auburn University.
Demirciftci, T., Cobanoglu, C., Beldona, S., & Cummings, P. (2010). Room Rate Parity
Analysis Across Different Hotel Distribution Channels in the U.S. Journal
Of Hospitality Marketing & Management, 19(4), 295-308. doi:
10.1080/19368621003667010
Denizci Guillet, B. (2020). An evolutionary analysis of revenue management research
in hospitality and tourism. International Journal Of Contemporary
Hospitality Management, 32(2), 560-587. doi: 10.1108/ijchm-06-2019-
0515

131
REFERENCES (cont.)
Denizci Guillet, B., & Mohammed, I. (2015). Revenue management research in
hospitality and tourism. International Journal Of Contemporary Hospitality
Management, 27(4), 526-560. doi: 10.1108/ijchm-06-2014-0295
Denizci Guillet, B., Guo, Y., & Law, R. (2015). Segmenting Hotel Customers Based on
Rate Fences Through Conjoint and Cluster Analysis. Journal Of Travel &
Tourism Marketing, 32(7), 835-851. doi: 10.1080/10548408.2015.1063825
Erdem, M., & Jiang, L. (2016). An overview of hotel revenue management research and
emerging key patterns in the third millennium. Journal Of Hospitality And
Tourism Technology, 7(3), 300-312. doi: 10.1108/jhtt-10-2014-0058
Ferguson, M., & Smith, S. (2014). The changing landscape of hotel revenue
management and the role of the hotel revenue manager. Journal Of Revenue
And Pricing Management, 13(3), 224-232. doi: 10.1057/rpm.2014.11
Frisch, D. (1993). Reasons for Framing Effects. Organizational Behavior And Human
Decision Processes, 54(3), 399-429. doi: 10.1006/obhd.1993.1017
Garbarino, E., & Lee, O. (2003). Dynamic pricing in internet retail: Effects on consumer
trust. Psychology And Marketing, 20(6), 495-513. doi: 10.1002/mar.10084
Gazzoli, G., Gon Kim, W., & Palakurthi, R. (2008). Online distribution strategies and
competition: are the global hotel companies getting it right?. International
Journal Of Contemporary Hospitality Management, 20(4), 375-387. doi:
10.1108/09596110810873499
Gefen, D. (2000). E-commerce: the role of familiarity and trust. Omega, 28(6), 725-737.
doi: 10.1016/s0305-0483(00)00021-9
Gundlach, G., & Murphy, P. (1993). Ethical and Legal Foundations of Relational
Marketing Exchanges. Journal Of Marketing, 57(4), 35-46. doi:
10.1177/002224299305700403
Han, H., & Woods, D. (2014). Attitudinal and Behavioral Aspects of Loyalty in the
Screen-Golf Industry. Journal Of Quality Assurance In Hospitality &
Tourism, 15(2), 175-189. doi: 10.1080/1528008x.2014.889535

132
REFERENCES (cont.)
Hallowell, R. (1996). The relationships of customer satisfaction, customer loyalty, and
profitability: an empirical study. International Journal Of Service Industry
Management, 7(4), 27-42. doi: 10.1108/09564239610129931
He, G., & Jun, L. (2010). Study of the Relationship between Service Quality, Customer
Satisfaction and Behavior Intention. 2010 International Conference On E-
Product E-Service And E-Entertainment. doi: 10.1109/iceee.2010.5660155
Heo, C., & Lee, S. (2011). Influences of consumer characteristics on fairness
perceptions of revenue management pricing in the hotel industry.
International Journal Of Hospitality Management, 30(2), 243-251. doi:
10.1016/j.ijhm.2010.07.002
Ivanov, S., & Zhechev, V. (2012). Hotel revenue management–a critical literature
review. Tourism: an international interdisciplinary journal, 60(2), 175-197.
Jimenez Mori, R. (2021). It’s not price; It’s quality. Satisfaction and price fairness
perception. World Development, 139, 105302. doi:
10.1016/j.worlddev.2020.105302
Kahneman, D., & Tversky, A. (1979). Prospect Theory: An Analysis of Decision under
Risk. Econometrica, 47(2), 263. doi: 10.2307/1914185
Kahneman, D., Knetsch, J., & Thaler, R. (1986). Fairness as a Constraint on Profit
Seeking: Entitlements in the Market. The American Economic Review,
76(4), 728-741.
Kim, S., Kim, J., & Park, S. (2017). The Effects of Perceived Value, Website Trust and
Hotel Trust on Online Hotel Booking Intention. Sustainability, 9(12), 2262.
doi: 10.3390/su9122262
Kimes, S. (1994). Perceived Fairness of Yield Management. Cornell Hotel And
Restaurant Administration Quarterly, 35(1), 22-29. doi:
10.1177/001088049403500102
Kimes, S. (1989a). The Basics of Yield Management. Cornell Hotel And Restaurant
Administration Quarterly, 30(3), 14-19. doi:
10.1177/001088048903000309

133
REFERENCES (cont.)
Kimes, S. (1989b). Yield management: A tool for capacity-considered service firms.
Journal Of Operations Management, 8(4), 348-363. doi: 10.1016/0272-
6963(89)90035-1
Kimes, S., & Wirtz, J. (2003). Has Revenue Management become Acceptable?. Journal
Of Service Research, 6(2), 125-135. doi: 10.1177/1094670503257038
Kimes, S. (2016). The evolution of hotel revenue management. Journal Of Revenue And
Pricing Management, 15(3-4), 247-251. doi: 10.1057/rpm.2016.27
Lee, M., Jeong, M., & Shea, L. (2020). Length of stay control: Is it a fair inventory
management strategy in hotel market?. Tourism Economics, 27(2), 307-327.
doi: 10.1177/1354816619901207
Lie, D., Sudirman, A., & Butarbutar, M. (2019). Analysis of mediation effect of
consumer satisfaction on the effect of service quality, price and consumer
trust on consumer loyalty. International Journal of Scientific and
Technology Research, 8(8), 412-428.
Lii, Y., & Sy, E. (2009). Internet differential pricing: Effects on consumer price
perception, emotions, and behavioral responses. Computers In Human
Behavior, 25(3), 770-777. doi: 10.1016/j.chb.2009.02.005
Mainzer, B.W. (2004). Future of Revenue Management: Fast forward for hospitality
revenue management. Journal of Revenue and Pricing Management, 3, 285-
289.
Mandira, D., Suliyanto, S., & Nawarini, A. (2018). The Influence Customer Trust,
Service Quality, and Perceived Price on Customer Satisfaction and
Customer Loyalty. JOURNAL OF RESEARCH IN MANAGEMENT, 1(1).
doi: 10.32424/jorim.v1i1.16
Marielza, M. & Monroe, K. B. (1994) ,"Perceived Price Fairness: a New Look At an
Old Construct", in NA - Advances in Consumer Research Volume 21, eds.
Chris T. Allen and Deborah Roedder John, Provo, UT : Association for
Consumer Research, Pages: 75-78.

134
REFERENCES (cont.)
McDougall, G., & Levesque, T. (2000). Customer satisfaction with services: putting
perceived value into the equation. Journal Of Services Marketing, 14(5),
392-410. doi: 10.1108/08876040010340937
Mcguire, K., & Kimes, S. (2006). The Perceived Fairness of Waitlist-management
Techniques for Restaurants. Cornell Hotel And Restaurant Administration
Quarterly, 47(2), 121-134. doi: 10.1177/0010880405284212
Méatchi, S., & Camus, S. (2020). Revenue management pricing in the hotel sector:
Reducing perceived unfairness to encourage willingness to pay. Recherche
Et Applications En Marketing (English Edition), 35(3), 102-123. doi:
10.1177/2051570720954760
Nguyen Viet, B., Dang, H., & Nguyen, H. (2020). Revisit intention and satisfaction:
The role of destination image, perceived risk, and cultural contact. Cogent
Business & Management, 7(1), 1796249. doi:
10.1080/23311975.2020.1796249
Nicolau, J., & Sharma, A. (2019). To Ban or not to ban rate parity, that is the question…
or not?. International Journal Of Hospitality Management, 77, 523-527.
doi: 10.1016/j.ijhm.2018.08.016
Noone, B., McGuire, K., & Rohlfs, K. (2011). Social media meets hotel revenue
management: Opportunities, issues and unanswered questions. Journal Of
Revenue And Pricing Management, 10(4), 293-305. doi:
10.1057/rpm.2011.12
Noone, B. M., Enz, C. A., & Glassmire, J. (2017). Total hotel revenue management: A
strategic profit perspective. Cornell Hospitality Report. 17(8), 3-15.
Oliver, R. (1999). Whence Consumer Loyalty?. Journal Of Marketing, 63(4_suppl1),
33-44. doi: 10.1177/00222429990634s105
Priester, A., Robbert, T., & Roth, S. (2020). A special price just for you: effects of
personalized dynamic pricing on consumer fairness perceptions. Journal Of
Revenue And Pricing Management, 19(2), 99-112. doi: 10.1057/s41272-
019-00224-3

135
REFERENCES (cont.)
Sarmah, H, K,& Hazarika, B. (2012). Importance of the size of Sample and its
determination in the context of data related to the schools of greater
Guwahati. Bulletin of the Gauhati University Mathematics Association,
ISSN 0975-4148. 12. 55-76.
Sharma, A., & Nicolau, J. (2019). Hotels to OTAs: “Hands off my rates!” The economic
consequences of the rate parity legislative actions in Europe and the US.
Tourism Management, 75, 427-434. doi: 10.1016/j.tourman.2019.06.009
Senić, V., & Marinković, V. (2014). Examining the effect of different components of
customer value on attitudinal loyalty and behavioral
intentions. International Journal Of Quality And Service Sciences, 6(2/3),
134-142. https://doi.org/10.1108/ijqss-02-2014-0010
Setiawan, E., Wati, S., Wardana, A., & Ikhsan, R. (2020). Building trust through
customer satisfaction in the airline industry in Indonesia: Service quality and
price fairness contribution. Management Science Letters, 1095-1102. doi:
10.5267/j.msl.2019.10.033
Sirdeshmukh, D., Singh, J., & Sabol, B. (2002). Consumer Trust, Value, and Loyalty in
Relational Exchanges. Journal Of Marketing, 66(1), 15-37. doi:
10.1509/jmkg.66.1.15.18449
Sparks, B. & Browning, V. (2011). The impact of online reviews on hotel booking
intentions and perception of trust. Tourism Management, 32(6), 1310-1323.
doi: 10.1016/j.tourman.2010.12.011
Suhartanto, D. (2011). An Examination of Brand Loyalty in the Indonesian Hotel
Industry. PhD Dissertation, Lincoln University.
Suhartanto, D. (2013). Examining the Formation of Attitudinal, Conative, and
Behavioural Loyalty: An Empirical Analysis in the Hotel Industry. ASEAN
Journal On Hospitality And Tourism, 12(2), 89. doi:
10.5614/ajht.2013.12.2.02

136
REFERENCES (cont.)
Suklabaidya, P., & Singh, A. (2017). Hotel Revenue Management: Impact of Familiarity
and Information on Customers Perceptions of Fairness. International
Journal of Hospitality and Tourism Systems, 10(1), 34.
Tang, J., Repetti, T., & Raab, C. (2019). Perceived fairness of revenue management
practices in casual and fine-dining restaurants. Journal Of Hospitality And
Tourism Insights, 2(1), 92-108. doi: 10.1108/jhti-10-2018-0063
Toh, R., Raven, P., & DeKay, F. (2011). Selling Rooms: Hotels vs. Third-Party
Websites. Cornell Hospitality Quarterly, 52(2), 181-189. doi:
10.1177/1938965511400409
Tripathi, A., & Pandey, N. (2017). Price framing literature: Past, present, and future.
The Marketing Review, 17(3), 307-336. doi:
10.1362/146934717x14909733966245
Vu, T. M. H., Llosa, S., & Nicod, L. (2020). Analyzing the effect of Revenue
Management on customers’ perceived fairness, price acceptance and
switching intention in the service industry. In Colloque Etienne Thil.
Wang, X., Yoonjoung Heo, C., Schwartz, Z., Legohérel, P., & Specklin, F. (2015).
Revenue Management: Progress, Challenges, and Research Prospects.
Journal Of Travel & Tourism Marketing, 32(7), 797-811. doi:
10.1080/10548408.2015.1063798
Weisstein, F., Monroe, K., & Kukar-Kinney, M. (2013). Effects of price framing on
consumers’ perceptions of online dynamic pricing practices. Journal Of The
Academy Of Marketing Science, 41(5), 501-514. doi: 10.1007/s11747-013-
0330-0
Wirtz, J., & Kimes, S. (2007). The Moderating Role of Familiarity in Fairness
Perceptions of Revenue Management Pricing. Journal Of Service Research,
9(3), 229-240. doi: 10.1177/1094670506295848
Xia, L., Monroe, K., & Cox, J. (2004). The Price is Unfair! A Conceptual Framework
of Price Fairness Perceptions. Journal Of Marketing, 68(4), 1-15. doi:
10.1509/jmkg.68.4.1.42733

137
REFERENCES (cont.)
Yadin, D. (2002). The international dictionary of marketing: over 2000 professional
terms and techniques. Kogan Page Publishers.
Yeoman, I. (2016). The history of revenue and pricing management – 15 years and more.
Journal Of Revenue And Pricing Management, 15(3-4), 185-196. doi:
10.1057/rpm.2016.36
Jin Yoon, H., Nusair, K., Parsa, H., & Naipaul, S. (2010). Price Formats, Discounts, and
Consumers' Perceptions: A Comparison Between Hospitality and Non-
Hospitality Industries. Journal Of Foodservice Business Research, 13(1),
51-65. doi: 10.1080/15378021003595970
Yoon, Y., & Uysal, M. (2005). An examination of the effects of motivation and
satisfaction on destination loyalty: a structural model. Tourism
Management, 26(1), 45-56. doi: 10.1016/j.tourman.2003.08.016

138
APPENDICES

139
Appendix A: Questionnaire Survey
สวนท 1: Screening Questions
คาชแจง: โปรดเลอกคาตอบทตรงกบขอเทจจรงทสด
I. ฉนถอสญชาตไทย และมอายมากกวา 18 ป [ ] ใช [ ] ไมใช
II. ฉนไดทาการจองหองพกโรงแรม (ดวยตนเอง) และไดเขาพกในโรงแรมระดบ 3 - 5 ดาวในประเทศไทยในชวงระยะเวลา 1 ปทผานมา [ ] ใช [ ] ไมใช
III. ในชวงระยะเวลา 5 ปทผานมาฉนเคยเขาพก (ในโรงแรมเดมหรอโรงแรมอนๆ) ในพนทเดยวกนกบโรงแรมทฉนไดทาการจองในชวงระยะเวลา 1 ปทผานมา [ ] ใช [ ] ไมใช
สวนท 2: Revenue Management Practices
1. คณเหนดวยกบประโยคในแตละขอมากนอยเพยงใด ( 1 = ไมเหนดวยอยางมากทสด, 7 = เหนดวยอยางมากทสด)
1.1 การทธรกจประเภทโรงแรมอาจตงราคาหองพกแตกตางกนในแตละวน ขนอยกบความตองการหองพกของวนนนๆ เปนสงทฉนคนเคย
1 2 3 4 5 6 7
1.2 การทธรกจประเภทโรงแรมอาจตงราคาหองพกแตกตางกนในแตละวน ขนอยกบความตองการหองพกของวนนนๆ เปนเรองปกต
1 2 3 4 5 6 7
1.3 การทธรกจประเภทโรงแรมอาจตงราคาหองพกแตกตางกนในแตละวน ขนอยกบความตองการหองพกของวนนนๆ เปนเรองทวไป
1 2 3 4 5 6 7
1.4 การทธรกจประเภทโรงแรมมนโยบายการยกเลกการจองหองพกทแตกตา
งกน เปนสงทฉนคนเคย 1 2 3 4 5 6 7
1.5 บอยครงทฉน เหน ไดยน หรอพบเจอราคาหองพกทแตกตางกนในธรกจประเภทโรงแรม
1 2 3 4 5 6 7

140
คาชแจง: โปรดเลอกคาตอบทตรงกบขอเทจจรงทสด, จากการจองหองพกครงลาสดของคณ*
*การจองหองพกในโรงแรมทคณไดเขาพกในระยะเวลา 1 ปทผานมา ซงเปนพนททคณเคยไป และเขาพกในพนทนน ในระยะเวลา 5 ปทผานมา
2. นโยบายการยกเลกการจองหองพกทฉนไดรบเปนนโยบายแบบ... [ ] สามารถขอคนเงนได (การจองหองพกสามารถยกเลกได ในชวงระยะเวลาหนงกอนจะถงเขาวนพก ซงการยกเลกการจองหองพกภายในระยะเวลาทกาหนดจะไมมคาปรบหรอคาใชจายเพมเตม)
[ ] สามารถขอคนเงนไดกงหนง (การจองหองพกสามารถยกเลกได ในชวงระยะเวลาหนงกอนจะถงเขาวนพก ซงการยกเลกการจองหองพกภายในระยะเวลาทกาหนดจะมคาปรบหรอคาใชจายเพมเตม)
[ ] ไมสามารถขอคนเงนได (เมอลกคายกเลกการจองหองพก คาหองพกทงหมดจะไมสามารถขอคนได หองพกทจองผานโครงการ “เราเทยวดวยกน” ถอวาเปนการจองหองพกแบบไมสามารถขอคนเงนได)
3. ราคาหองพกทฉนไดรบ... [ ] ...เปนราคาสวนลดจากราคาปกต
[ ] ...เปนราคาปกต (ไมมสวนลดหรอคาใชจายเพมเตม)
[ ] ...เปนราคาทมคาใชจายเพมเตมจากราคาปกต
4. ราคาหองพกทฉนไดรบ (ในชวงวนเขาพกเดยวกน, การจองเวลาทใกลเคยงกน, เงอนไขเดยวกน) นนเทากนในแตละชองทางการจอง (ตวอยางเชน เวบไซตของโรงแรม, การโทรไปจองกบทางโรมแรมโดยตรง, ราคาผานหนาเวบไซต OTAs เชน
Agoda, Booking.com, Expedia และชองทางอนๆ) [ ] ใช [ ] ไมใช [ ] ฉนไมไดเปรยบเทยบราคาในชองทางการจองอนๆ
5. เมอฉนไดรบราคาหองพก... [ ] …ฉนไมไดรบขอมลเกยวกบนโยบายการกาหนดราคาของโรงแรม
[ ] ...ฉนไดรบขอมลเกยวกบนโยบายการกาหนดราคาของโรงแรม โดยราคาหองพกจะแตกตางกนในแตละวนของสปดาห, ระยะเวลาการเขาพก, และระยะเวลาการจองลวงหนา
[ ] …ฉนไดรบขอมลกยวกบนโยบายการกาหนดราคาของโรงแรม โดยราคาหองพกจะแตกตางกนในแตละวนของสปดาห, ระยะเวลาการเขาพก, และระยะเวลาการจองลวงหนา นอกจากนยงไดรบขอมลวาราคาหองพกมกจะสงกวาในวนธรรมดาเมอเทยบกบวนหยด การเขาพกระยะสนมากกวาระยะยาว และการจองหองพกใกลวนเขาพกจรงมากกวาการจองลวงหนา
สวนท 3: Customer Perception
6. จากการจองหองพกครงลาสดของคณ* คณเหนดวยกบประโยคในแตละขอมากนอยเพยงใด *การจองหองพกในโรงแรมทคณไดเขาพกในระยะเวลา 1 ปทผานมา ซงเปนพนททคณเคยไป และเขาพกในพนทนน ในระยะเวลา 5 ปทผานมา
( 1 = ไมเหนดวยอยางมากทสด, 7 = เหนดวยอยางมากทสด)

141
6.1 เมอพจารณาทกอยางแลวราคาหองพกทคณไดรบนนสมเหตสมผล 1 2 3 4 5 6 7
6.2 เมอพจารณาทกอยางแลวราคาหองพกทคณไดรบนนยตธรรมสาหรบคณแ
ละโรงแรม 1 2 3 4 5 6 7
6.3 เมอพจารณาทกอยางแลวราคาหองพกทคณไดรบนนเหมาะสม 1 2 3 4 5 6 7
6.4 เมอพจารณาทกอยางแลวราคาหองพกทคณไดรบนนเปนราคาทถกตอง 1 2 3 4 5 6 7
6.5 เมอพจารณาทกอยางแลวราคาหองพกทคณไดรบนนยตธรรมสาหรบลกค
าคนอนๆ 1 2 3 4 5 6 7
7. จากการจองหองพกครงลาสดของคณ* คณเหนดวยกบประโยคในแตละขอมากนอยเพยงใด *การจองหองพกในโรงแรมทคณไดเขาพกในระยะเวลา 1 ปทผานมา ซงเปนพนททคณเคยไป และเขาพกในพนทนน ในระยะเวลา 5 ปทผานมา
( 1 = ไมเหนดวยอยางมากทสด, 7 = เหนดวยอยางมากทสด)
7.1 ฉนเชอวาโรงแรมนนาไววางใจ 1 2 3 4 5 6 7
7.2 ฉนเชอวาโรงแรมนนาเชอถอ 1 2 3 4 5 6 7
7.3 ฉนเชอวาโรงแรมนมความรบผดชอบ 1 2 3 4 5 6 7
7.4 ฉนมความมนใจในโรงแรมน 1 2 3 4 5 6 7
7.5 โรงแรมนดเหมอนวาจะเปนโรงแรมคณภาพด 1 2 3 4 5 6 7
8. จากการจองหองพกครงลาสดของคณ* คณเหนดวยกบประโยคในแตละขอมากนอยเพยงใด *การจองหองพกในโรงแรมทคณไดเขาพกในระยะเวลา 1 ปทผานมา ซงเปนพนททคณเคยไป และเขาพกในพนทนน ในระยะเวลา 5 ปทผานมา
( 1 = ไมเหนดวยอยางมากทสด, 7 = เหนดวยอยางมากทสด)
8.1 ฉนมความสาราญในการเขาพกทโรงแรม 1 2 3 4 5 6 7
8.2 การเลอกเขาพกทโรงแรมนเปนการตดสนใจทถกตอง 1 2 3 4 5 6 7
8.3 ฉนรสกวาการบรการของโรงแรมดกวาทฉนคาดหวงไว 1 2 3 4 5 6 7
8.4 โดยรวมแลวฉนพงพอใจกบการตดสนใจเขาพกในโรมแรมน 1 2 3 4 5 6 7

142
สวนท 4: Customer Loyalty
9. จากการจองหองพกครงลาสดของคณ* คณเหนดวยกบประโยคในแตละขอมากนอยเพยงใด *การจองหองพกในโรงแรมทคณไดเขาพกในระยะเวลา 1 ปทผานมา ซงเปนพนททคณเคยไป และเขาพกในพนทนน ในระยะเวลา 5 ปทผานมา
( 1 = ไมเหนดวยอยางมากทสด, 7 = เหนดวยอยางมากทสด)
9.1 ไมมโรงแรมอนในพนทเดยวกนใหบรการดกวาโรงแรมน 1 2 3 4 5 6 7
9.2 ฉนจะพจารณาโรงแรมนเปนตวเลอกแรกของฉนเมอฉนตองการทพกในพน
ทเดยวกน 1 2 3 4 5 6 7
9.3 ฉนยนดทจะจายเงนเพมเพอทจะเขาพกทโรงแรมนมากกวาโรงแรมอน ๆ ในระดบเดยวกน
1 2 3 4 5 6 7
9.4 โรงแรมนใหบรการเหนอกวาเมอเทยบกบโรงแรมอน ๆ 1 2 3 4 5 6 7
9.5 ฉนไดรบสทธประโยชนในโรงแรมนมากกวาการเขาพกในโรงแรมอน ๆ ในระดบเดยวกน
1 2 3 4 5 6 7
10. จากการจองหองพกครงลาสดของคณ* คณเหนดวยกบประโยคในแตละขอมากนอยเพยงใด *การจองหองพกในโรงแรมทคณไดเขาพกในระยะเวลา 1 ปทผานมา ซงเปนพนททคณเคยไป และเขาพกในพนทนน ในระยะเวลา 5 ปทผานมา
( 1 = ไมเหนดวยอยางมากทสด, 7 = เหนดวยอยางมากทสด)
10.1 ฉนชอบโรงแรมนมากกวาโรงแรมอน ๆ 1 2 3 4 5 6 7
10.2 ฉนรสกดกวาเมอไดเขาพกทโรงแรมแหงน 1 2 3 4 5 6 7
10.3 ฉนชอบพกทโรงแรมนมาก 1 2 3 4 5 6 7
10.4 โรงแรมนเปนโรงแรมทฉนประทบใจทสดในพนทเดยวกน 1 2 3 4 5 6 7
11. จากการจองหองพกครงลาสดของคณ* คณเหนดวยกบประโยคในแตละขอมากนอยเพยงใด *การจองหองพกในโรงแรมทคณไดเขาพกในระยะเวลา 1 ปทผานมา ซงเปนพนททคณเคยไป และเขาพกในพนทนน ในระยะเวลา 5 ปทผานมา
( 1 = ไมเหนดวยอยางมากทสด, 7 = เหนดวยอยางมากทสด)
11.1 ถงแมโรงแรมอนจะมราคาหองพกทตากวาฉนกจะเขาพกทโรงแรมนตอไป 1 2 3 4 5 6 7

143
11.2 ถงแมโรงแรมนจะปรบราคาขนฉนกจะเขาพกทโรงแรมนตอไป 1 2 3 4 5 6 7
11.3 ฉนตงใจจะเขาพกทโรงแรมนตอไปในอนาคต 1 2 3 4 5 6 7
11.4 ฉนตงใจจะพดสงดๆ เกยวกบโรงแรมนใหคนอน ๆ ไดรบร 1 2 3 4 5 6 7
11.5 ในอนาคตฉนตงใจจะแนะนาโรงแรมนใหกบคนอน ๆ ทขอคาแนะนาจากฉน 1 2 3 4 5 6 7
12. จากการจองหองพกครงลาสดของคณ* คณเหนดวยกบประโยคในแตละขอมากนอยเพยงใด *การจองหองพกในโรงแรมทคณไดเขาพกในระยะเวลา 1 ปทผานมา ซงเปนพนททคณเคยไป และเขาพกในพนทนน ในระยะเวลา 5 ปทผานมา
( 1 = ไมเหนดวยอยางมากทสด, 7 = เหนดวยอยางมากทสด)
12.1 ฉนมกจะเขาพกทโรงแรมนโดยตลอด เมอฉนไปทพนทนน 1 2 3 4 5 6 7
12.2 ฉนเขาพกทโรงแรมนมากกวาโรงแรมอน ๆในพนทเดยวกน 1 2 3 4 5 6 7
12.3 ฉนใชจายเงนในโรงแรมน มากกวาโรงแรมอน ๆ ในพนทเดยวกน 1 2 3 4 5 6 7
12.4 ฉนบอกสงดๆ เกยวกบโรงแรมนใหกบคนอน ๆ ฟง 1 2 3 4 5 6 7
12.5 ถาโรงแรมนเปดสาขาใหมในพนททฉนจะไป ฉนจะเลอกเขาพกทโรงแรมนในพนทนนๆ
1 2 3 4 5 6 7
12.6 ฉนเคยแนะนาโรงแรมนใหกบคนอน ๆ 1 2 3 4 5 6 7
สวนท 5: Demographic & Booking Behaviour
คาชแจง: โปรดเลอกคาตอบทตรงกบขอเทจจรงทสด
13. คณอาศยอยในจงหวดใด ________________
144
14. เพศ: [ ] ชาย [ ] หญง [ ] LGBTQ+
15. อาย: [ ] 18-24 [ ] 25-40 [ ] 41-60 [ ] 61+
16. สถานภาพ: [ ] โสด [ ] แตงงาน [ ] หยา [ ] ไมตองการตอบ
17. ระดบการศกษา: [ ] ประถมศกษา [ ] มธยมศกษา [ ] ปวช/ปวส
[ ] ปรญญาตร [ ] ปรญญาโท [ ] ปรญญาเอก
18. รายไดตอเดอน: [ ] นอยกวา 9,000 บาท [ ] 9,001 - 15,000 บาท
[ ] 15,001 - 25,000 บาท [ ] 25,001 - 50,000 บาท
[ ] 50,001 - 100,000 บาท [ ] มากกวา 100,000 บาท
19. อาชพ: [ ] ขาราชการ [ ] พนกงานบรษทเอกชน [ ] เจาของธรกจ
[ ] นกเรยน/นกศกษา [ ] เกษยณอาย
[ ] อนๆ (โปรดระบ)_________

145
คาชแจง: จากการจองหองพกครงลาสดของคณ* โปรดเลอกคาตอบทตรงกบขอเทจจรงทสด
*การจองหองพกในโรงแรมทคณไดเขาพกในระยะเวลา 1 ปทผานมา ซงเปนพนททคณเคยไป และเขาพกในพนทนน ในระยะเวลา 5 ปทผานมา
20. ฉนจองหองพกผานโครงการ “เราเทยวเดยวกน” (รฐบาลชวยออกคาหองพก 40%) [ ] ใช [ ] ไมใช
21. โรงแรมทฉนเขาพกตงอยในจงหวดใด? ________________
22. โรงแรมทฉนเชาพกเปยโรงแรมระดบ... [ ] 3 ดาว [ ] 4 ดาว [ ] 5 ดาว
23. โรงแรมทฉนเขาพกเปน... [ ] โรงแรมเครอระดบนานาชาต
[ ] โรงแรมเครอระดบประเทศ
[ ] โรงแรมทไมไดอยในเครอใดๆ
24. ชองทางทฉนจองหองพกคอ… [ ] ทางตรงกบโรงแรม (เชน โทรจอง/ อเมล) [ ] ทโรงแรม ณ วนเขาพก
[ ] เวบไซตทางการของโรงแรม [ ] Agoda
[ ] Booking.com [ ] Expedia
[ ] Traveloka [ ] เอเจนซ (ไมใชออนไลน)
[ ] อนๆ (โปรดระบ)____________________
25. ฉนเปนสมาชกของชองทางทฉนทาการจองหองพก (เชน Marriott Bonvoy, Agoda VIP เปนตน) [ ] ใช [ ] ไมใช
26. ฉนเคยเขาพกทโรงแรมนมาแลวทงหมด... [ ] 1 ครง (ฉนเขาพกทโรงแรมนเปนครงแรก) [ ] 2-3 ครง [ ] มากกวา 3 ครง

146
27. ฉนเขาพกทโรงแรมนเปนจานวน… [ ] 1-2 คน [ ] 3-5 คน [ ] มากกวา 5 คน
28. ฉนจองโรงแรมนลวงหนาเปนระยะเวลา……...กอนวนเขาพกจรง [ ]นอยกวา 1 วน [ ] 1-3 วน [ ] 4-7 วน
[ ] 8-30 วน [ ] 30 - 90 วน [ ] มากกวา 90 วน
29. จดประสงคของการเขาพกโรงแรมนคอ? [ ] การเดนทางพกผอน [ ] การเดนทางเพอธรกจ
[ ] อนๆ (โปรดระบ)____________________
30. ฉนเดนทางไปพกทโรงแรมนกบ…. (เลอกตอบไดมากกวาหนงขอ) [ ] สมาชกในครอบครว [ ] เพอน [ ]เพอนรวมงาน
[ ] แฟน [ ] คสมรส [ ] ฉนเขาพกคนเดยว
------------------------------------------------------------------------------------------------------------------
Recommended