The Impact of Agricultural Trade Facilitation For Agricultural Food Exports in Indonesia and
Southeast Asia
MasyhuriProfessor of Agricultural Economics and Agribusiness,
Center for World Trade Studies. Universitas Gadjah Mada , Yogyakarta. Indonesia
Saktyanu K. DermoredjoResearcher of Center for World Trade Studies and
Center for Agro‐socio Economics and Policy Studies, Bogor, Indonesia

ASEAN Free Trade Agreement (AFTA) is the main economic framework in the ASEAN region as one of the policy towards the ASEAN Economic Community or the ASEAN Economic Community (AEC)
2009 : trade transactions between ASEAN and Others close to 1,536,843.3 US$ million.
Close to 84 per cent of the trade value of ASEAN was accounted by 4 countries : Singapore, Thailand, Malaysia and Indonesia.
The main of Trader in Singapore had 515,617 US$ Million Indonesia only had 213,339 US$ million. And then, the total GDP
of Indonesia close to 36 per cent that is the largest of ASEAN’s GDP.
Introduction
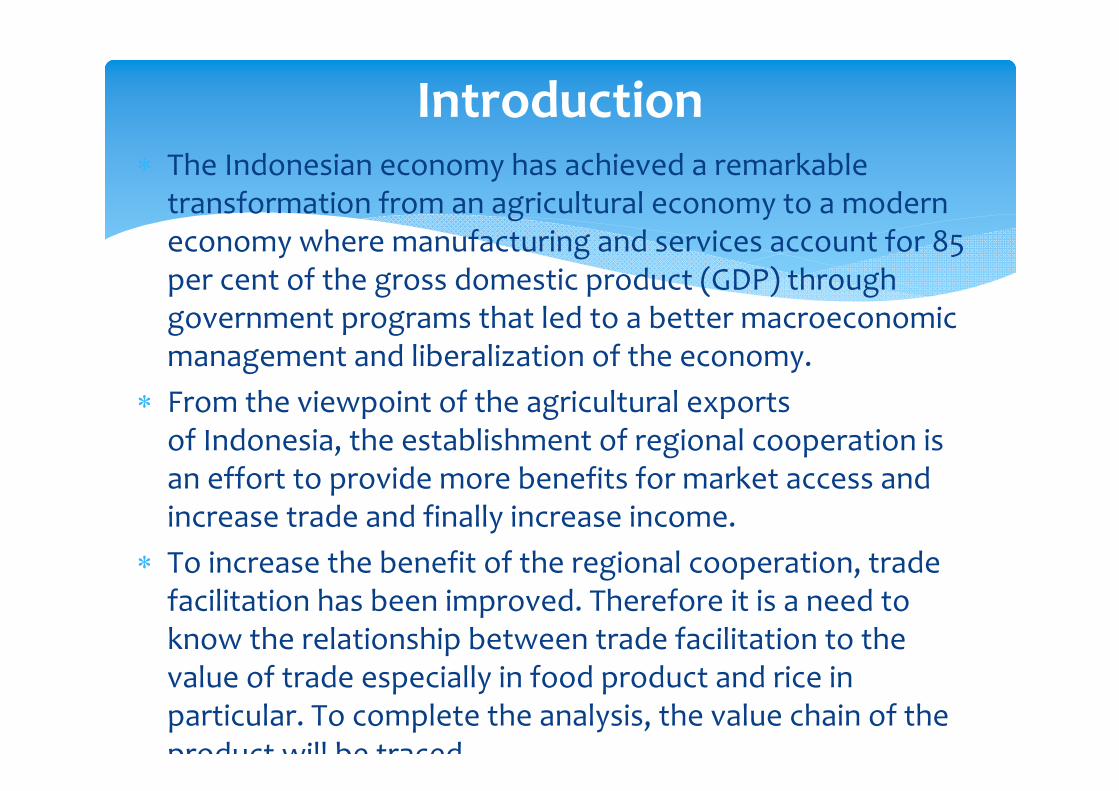
The Indonesian economy has achieved a remarkable transformation from an agricultural economy to a modern economy where manufacturing and services account for 85 per cent of the gross domestic product (GDP) through government programs that led to a better macroeconomic management and liberalization of the economy.
From the viewpoint of the agricultural exports of Indonesia, the establishment of regional cooperation is an effort to provide more benefits for market access and increase trade and finally increase income.
To increase the benefit of the regional cooperation, trade facilitation has been improved. Therefore it is a need to know the relationship between trade facilitation to the value of trade especially in food product and rice in particular. To complete the analysis, the value chain of the product will be traced
Introduction

To know the relationship between trade facilitation factors and the volume of food trade in ASEAN and Indonesia. The increase of trade will increase farmers income and hopefully reaching out to the poor.
In this context, the purpose of this paper was to find out the factors , part of trade facilitation, that affect agricultural (food product) trade in Indonesia and Southeast Asia countries, especially rice. The value chain was done to add the analysis.
Objectives of the study are:
Focusing on the role that center of rice production can play as a source of dynamic gains from trade. The relationship between trade facilitation and the value of trade will be analyzed using regression model.
To obtain a clear and comprehensive view of facilitating trade in Indonesia, this study uses the value chain diagram, we chose the West Java province in Indonesia
Methodology

The general model was specified as follow Ln Exports = β0 + β1 lnX1+.....+ βn lnXn+ ε Exports are the value of bilateral exports of agricultural commodities between two countries. X1,…, Xn are the variables that affect Value of trade, that are GDP, international tax, transport service, and internet
Method (cont.)
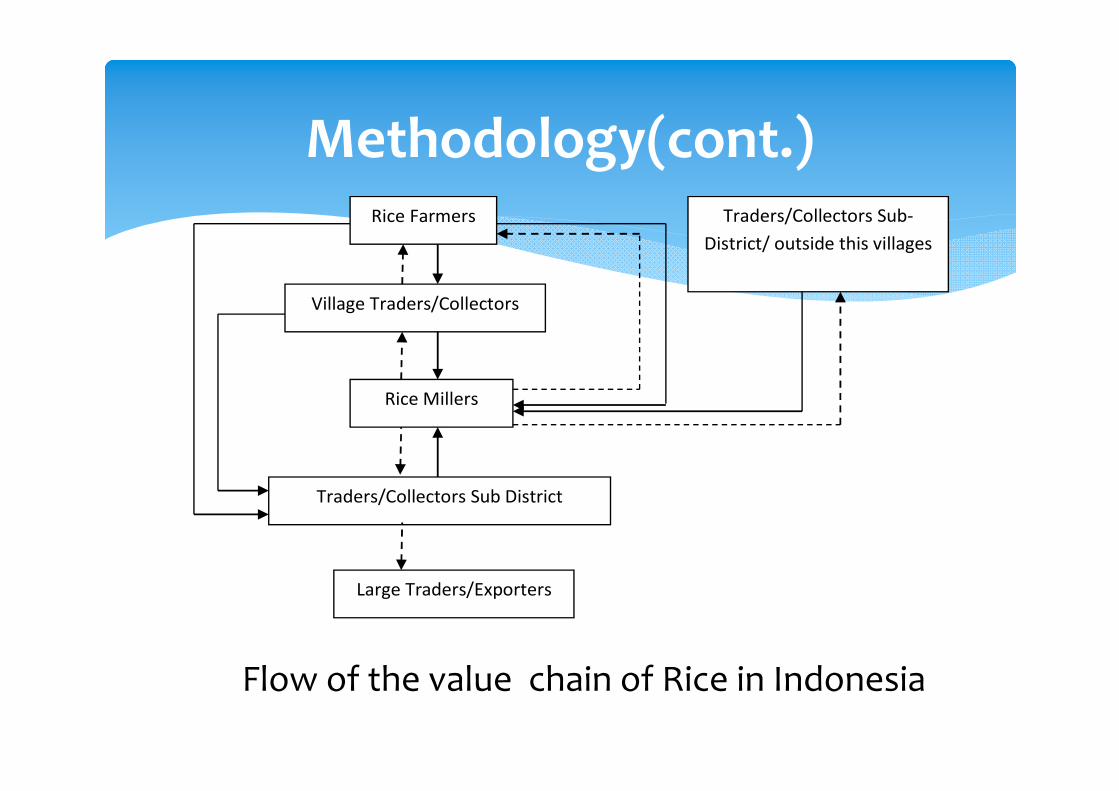
Methodology(cont.)Traders/Collectors Sub‐
District/ outside this villages Rice Farmers
Village Traders/Collectors
Rice Millers
Traders/Collectors Sub District
Large Traders/Exporters
Flow of the value chain of Rice in Indonesia
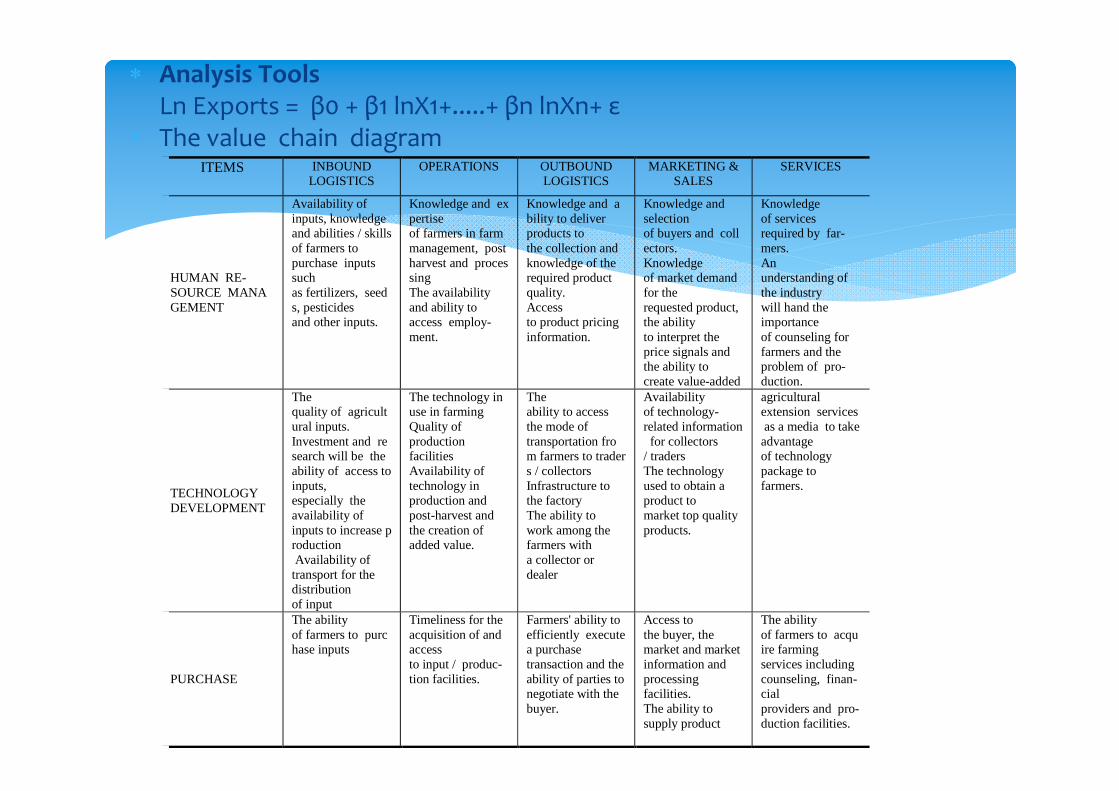
Analysis ToolsLn Exports = β0 + β1 lnX1+.....+ βn lnXn+ ε
The value chain diagramITEMS INBOUND
LOGISTICS OPERATIONS OUTBOUND
LOGISTICS MARKETING &
SALES SERVICES
HUMAN RE-SOURCE MANAGEMENT
Availability of inputs, knowledge and abilities / skills of farmers to purchase inputs such as fertilizers, seeds, pesticides and other inputs.
Knowledge and expertise of farmers in farm management, post harvest and processing The availability and ability to access employ-ment.
Knowledge and ability to deliver products to the collection and knowledge of the required product quality. Access to product pricing information.
Knowledge and selection of buyers and collectors. Knowledge of market demand for the requested product, the ability to interpret the price signals and the ability to create value-added
Knowledge of services required by far-mers. An understanding of the industry will hand the importance of counseling for farmers and the problem of pro-duction.
TECHNOLOGY DEVELOPMENT
The quality of agricultural inputs. Investment and research will be the ability of access to inputs, especially the availability of inputs to increase production Availability of transport for the distribution of input
The technology in use in farming Quality of production facilities Availability of technology in production and post-harvest and the creation of added value.
The ability to access the mode of transportation from farmers to traders / collectors Infrastructure to the factory The ability to work among the farmers with a collector or dealer
Availability of technology-related information for collectors / traders The technology used to obtain a product to market top quality products.
agricultural extension services as a media to take advantage of technology package to farmers.
PURCHASE
The ability of farmers to purchase inputs
Timeliness for the acquisition of and access to input / produc-tion facilities.
Farmers' ability to efficiently executea purchase transaction and the ability of parties to negotiate with the buyer.
Access to the buyer, the market and market information and processing facilities. The ability to supply product
The ability of farmers to acquire farming services including counseling, finan-cial providers and pro-duction facilities.
Data and Data SourcesUsing Variables in the model analysis and descriptive analysis is sourced from WITS : World Integrated Trade Solution, WDI : World Development Indicator, World Bank and FAOSTATTo analyze the value chain, in this study took the sources of information from exporter, farmer groups associated with exporters, government agencies associated with this research
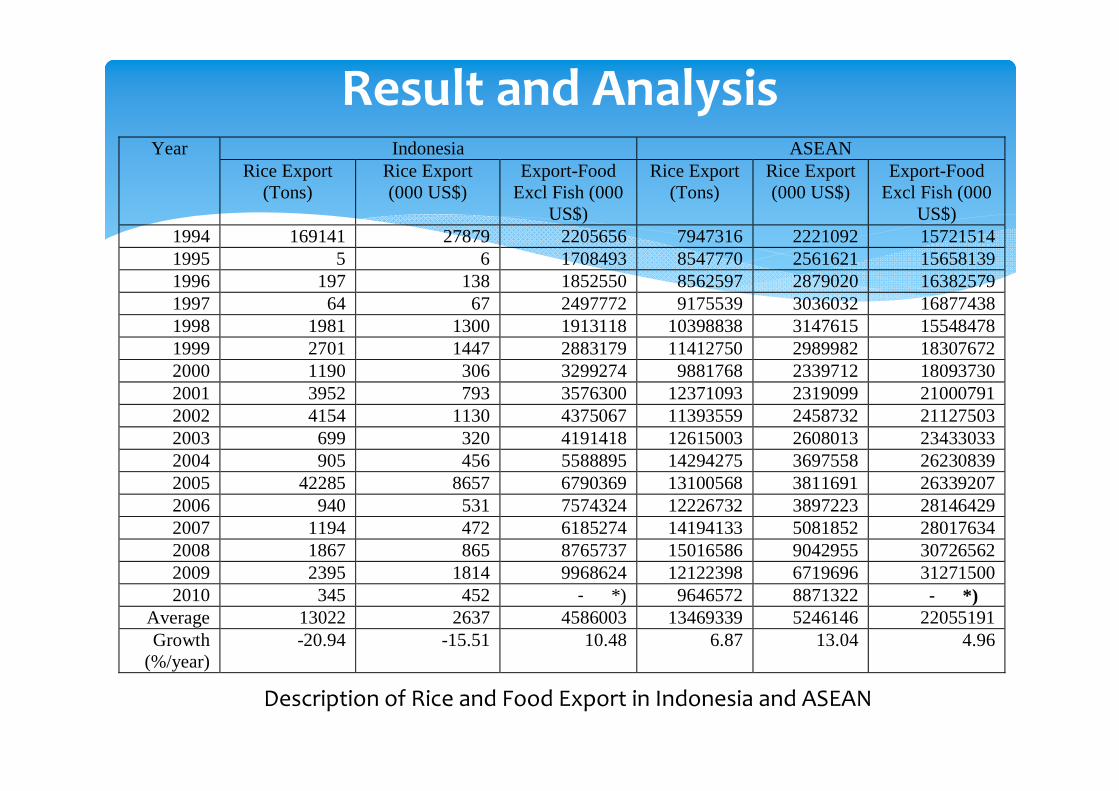
Result and AnalysisYear Indonesia ASEAN
Rice Export (Tons)
Rice Export (000 US$)
Export-Food Excl Fish (000
US$)
Rice Export (Tons)
Rice Export (000 US$)
Export-Food Excl Fish (000
US$) 1994 169141 27879 2205656 7947316 2221092 15721514 1995 5 6 1708493 8547770 2561621 15658139 1996 197 138 1852550 8562597 2879020 16382579 1997 64 67 2497772 9175539 3036032 16877438 1998 1981 1300 1913118 10398838 3147615 15548478 1999 2701 1447 2883179 11412750 2989982 18307672 2000 1190 306 3299274 9881768 2339712 18093730 2001 3952 793 3576300 12371093 2319099 21000791 2002 4154 1130 4375067 11393559 2458732 21127503 2003 699 320 4191418 12615003 2608013 23433033 2004 905 456 5588895 14294275 3697558 26230839 2005 42285 8657 6790369 13100568 3811691 26339207 2006 940 531 7574324 12226732 3897223 28146429 2007 1194 472 6185274 14194133 5081852 28017634 2008 1867 865 8765737 15016586 9042955 30726562 2009 2395 1814 9968624 12122398 6719696 31271500 2010 345 452 - *) 9646572 8871322 - *)
Average 13022 2637 4586003 13469339 5246146 22055191 Growth
(%/year) -20.94 -15.51 10.48 6.87 13.04 4.96
Description of Rice and Food Export in Indonesia and ASEAN
Items
Indonesia ASEAN
Average Growth (%/year
) Average Growth
(%/year)
Taxes on international trade (% of revenue) 3 -5.72 9 -1.70 Cost to export (US$ per container) 594 4.98 719 1.52 Documents to export (number) 4 0.00 6 -1.85 Time to export (days) 19 -4.73 23 -5.90 Average time to clear exports through customs (days) 3 -6.56 3 -7.58 Internet users 6932731 20.05 32715371 18.23 Lead time to export, median case (days) 2 -2.53 3 -5.40 Logistics performance index: Efficiency of customs clearance process (1=low to 5=high) 3 -1.83 3 -0.38 Logistics performance index: Quality of trade and transport-related infrastructure (1=low to 5=high) 3 -1.71 3 0.14 Logistics performance index: Ease of arranging competitively priced shipments (1=low to 5=high) 3 -1.26 3 0.70 Logistics performance index: Competence and quality of logistics services (1=low to 5=high) 3 -2.47 3 -0.42 Logistics performance index: Overall (1=low to 5=high) 3 -1.38 3 0.42 Logistics performance index: Frequency with which shipments reach consignee within scheduled or expected time (1=low to 5=high) 3 0.91 3 1.07 Logistics performance index: Ability to track and trace consignments (1=low to 5=high) 3 -2.68 3 0.97 Agriculture, value added (constant 2000 US$) 28433260356 2.77 72241801313 2.44
GDP (current US$) 288773039611 9.46 88187957250
4 4.87
GDP (constant 2000 US$) 194728311276 3.68 69258188110
8 3.73 ICT service exports (BoP, current US$) 1213261394 2.58 5593316148 12.70 ICT service exports (% of service exports, BoP) 9 -1.73 7 3.03 Communications, computer, etc. (% of service exports, BoP) 19 15.14 31 -1.72 Insurance and financial services (% of service exports, BoP) 2 10.92 2 3.41 Transport services (% of service exports, BoP) 18 0.16 22 2.70
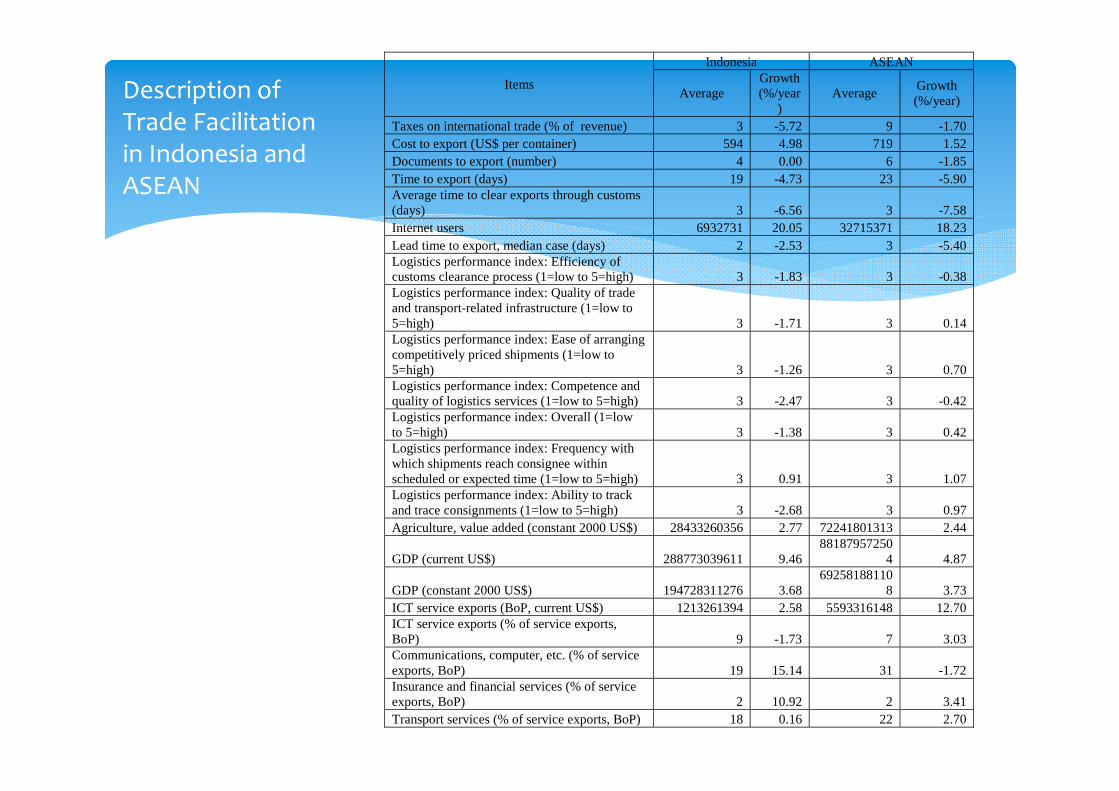
Description of Trade Facilitation in Indonesia and ASEAN

Items
Indonesia ASEAN
Average Growth(%/year) Average
Growth(%/yea
r)
Taxes on international trade (% of revenue) 3 -5.72 9 -1.70
Internet users 6932731 20.05 32715371 18.23
GDP (current US$)* 288773039611 9.46 881879572504 4.87
GDP (constant 2000 US$)* 194728311276 3.68 692581881108 3.73
Transport services (% of service exports, BoP) 18 0.16 22 2.70
selected Trade Facilitation in Indonesia and ASEAN

Analysis Output to Indonesia’s Rice Export
Regression Summary for Dependent Variable: Rice Export (Tons) R= .79396702 R²= .63038363 Adjusted R²= .50717818 F(4,12)=5.1165 p<.01219 Std.Error of estimate: 1.6233
Coeffcients Std. Err t p-level Intercept*** -799.690 286.0065 -2.79606 0.016162 GDP*** 27.790 9.7597 2.84743 0.014693 Internet users*** -3.268 0.7915 -4.12826 0.001400 Transport services*** 8.496 3.1428 2.70339 0.019189 Taxes on international trade 0.673 0.6608 1.01851 0.328531
Note: ***= very significant ( =1%)

Analysis Output to ASEAN’s Rice Export
Regression Summary for Dependent Variable: Rice Export (Tons) R= .91231685 R²= .83232203 Adjusted R²= .77642938 F(4,12)=14.891 p<.00013 Std.Error of estimate: .09237
Coeffcients Std. Err t p-level Intercept -13.0576 23.82385 -0.548088 0.593681 GDP 0.9340 0.81925 1.140059 0.276506 Internet users -0.0628 0.08019 -0.783073 0.448763 Transport services*** 0.7807 0.26370 2.960527 0.011909 Taxes on international trade -0.2517 0.25858 -0.973311 0.349611
Note: ***= very significant ( =1%)
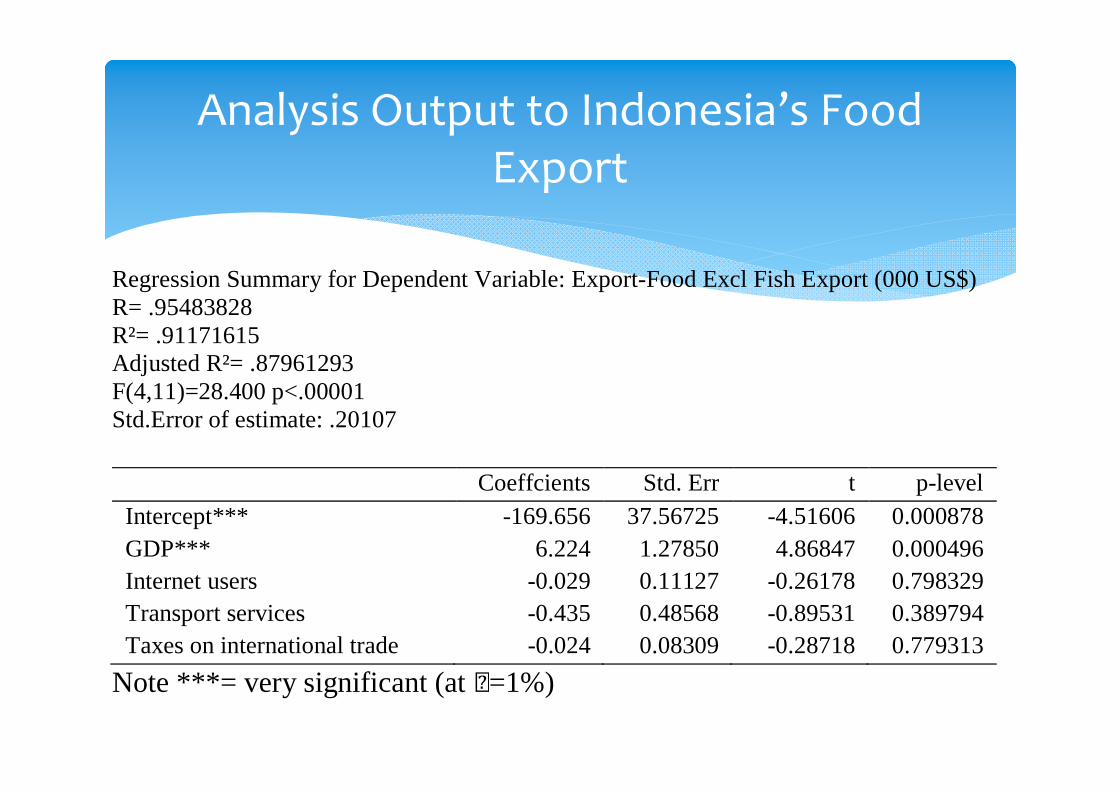
Analysis Output to Indonesia’s Food Export
Regression Summary for Dependent Variable: Export-Food Excl Fish Export (000 US$) R= .95483828 R²= .91171615 Adjusted R²= .87961293 F(4,11)=28.400 p<.00001 Std.Error of estimate: .20107
Coeffcients Std. Err t p-level Intercept*** -169.656 37.56725 -4.51606 0.000878 GDP*** 6.224 1.27850 4.86847 0.000496 Internet users -0.029 0.11127 -0.26178 0.798329 Transport services -0.435 0.48568 -0.89531 0.389794 Taxes on international trade -0.024 0.08309 -0.28718 0.779313
Note ***= very significant (at =1%)
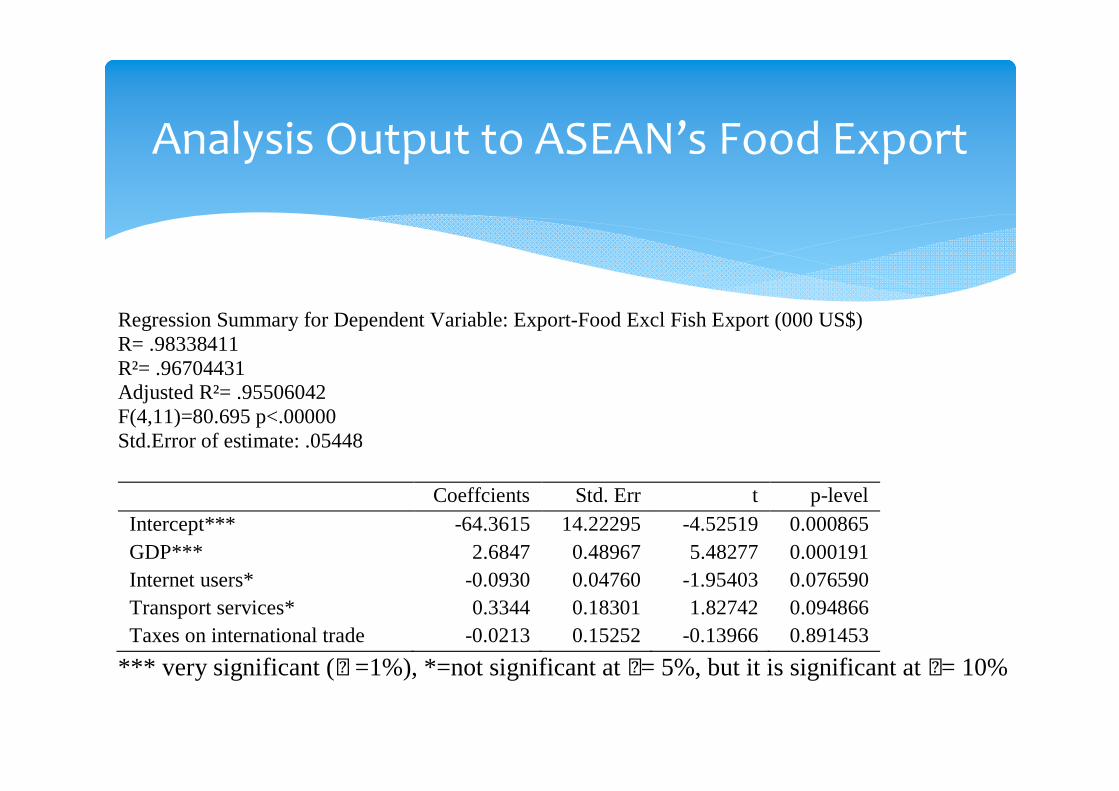
Analysis Output to ASEAN’s Food Export
Regression Summary for Dependent Variable: Export-Food Excl Fish Export (000 US$) R= .98338411 R²= .96704431 Adjusted R²= .95506042 F(4,11)=80.695 p<.00000 Std.Error of estimate: .05448
Coeffcients Std. Err t p-level Intercept*** -64.3615 14.22295 -4.52519 0.000865GDP*** 2.6847 0.48967 5.48277 0.000191Internet users* -0.0930 0.04760 -1.95403 0.076590Transport services* 0.3344 0.18301 1.82742 0.094866Taxes on international trade -0.0213 0.15252 -0.13966 0.891453
*** very significant ( =1%), *=not significant at = 5%, but it is significant at = 10%
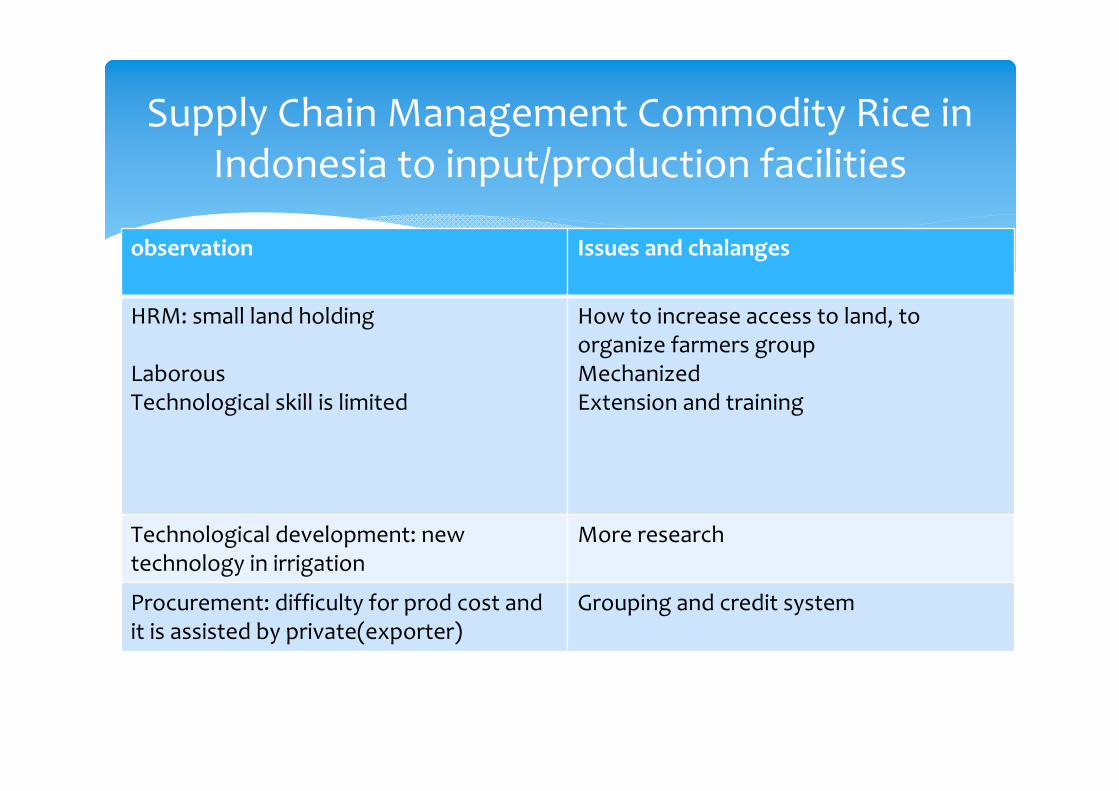
observation Issues and chalanges
HRM: small land holding
LaborousTechnological skill is limited
How to increase access to land, to organize farmers groupMechanizedExtension and training
Technological development: new technology in irrigation
More research
Procurement: difficulty for prod cost and it is assisted by private(exporter)
Grouping and credit system
Supply Chain Management Commodity Rice in Indonesia to input/production facilities
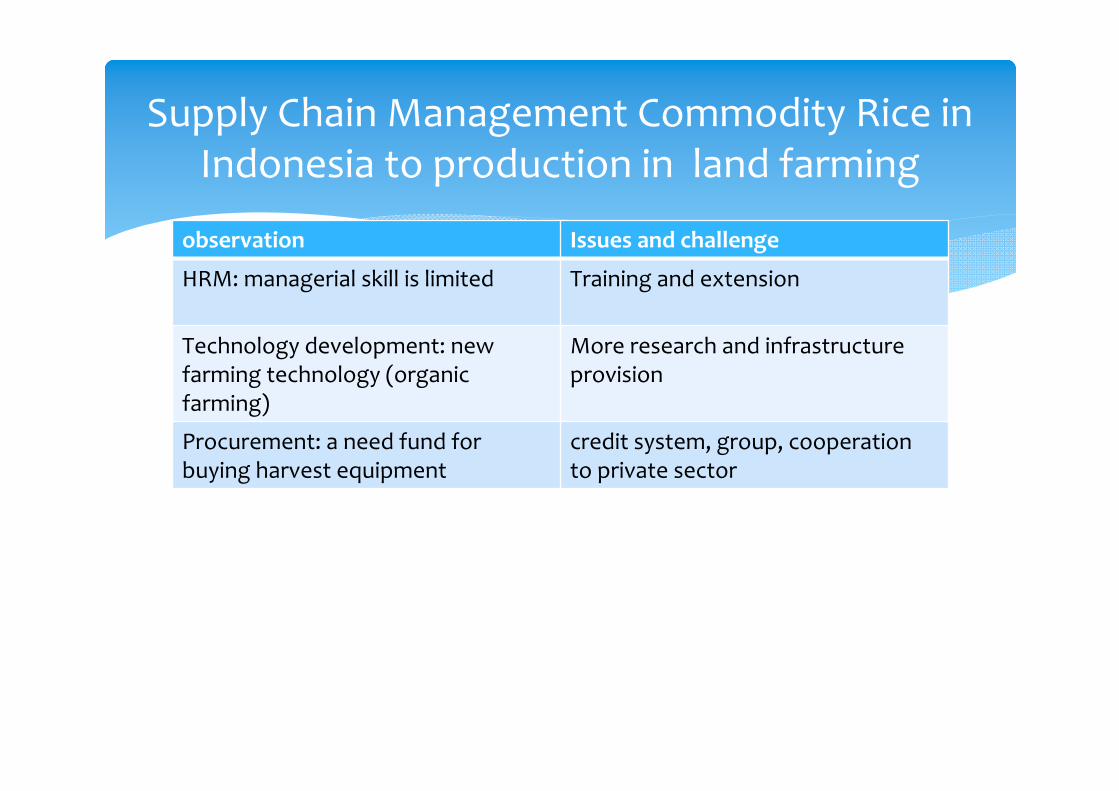
observation Issues and challenge
HRM: managerial skill is limited Training and extension
Technology development: new farming technology (organic farming)
More research and infrastructure provision
Procurement: a need fund for buying harvest equipment
credit system, group, cooperation to private sector
Supply Chain Management Commodity Rice in Indonesia to production in land farming
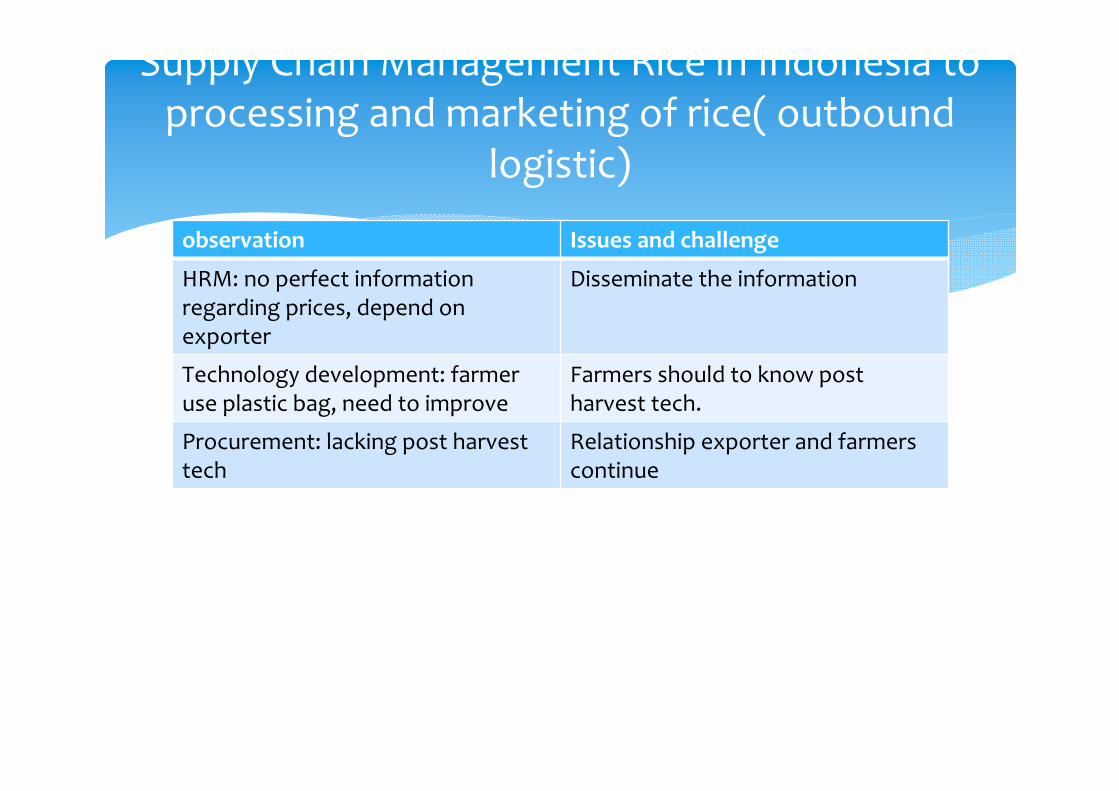
observation Issues and challenge
HRM: no perfect information regarding prices, depend on exporter
Disseminate the information
Technology development: farmer use plastic bag, need to improve
Farmers should to know post harvest tech.
Procurement: lacking post harvest tech
Relationship exporter and farmers continue
Supply Chain Management Rice in Indonesia to processing and marketing of rice( outbound
logistic)
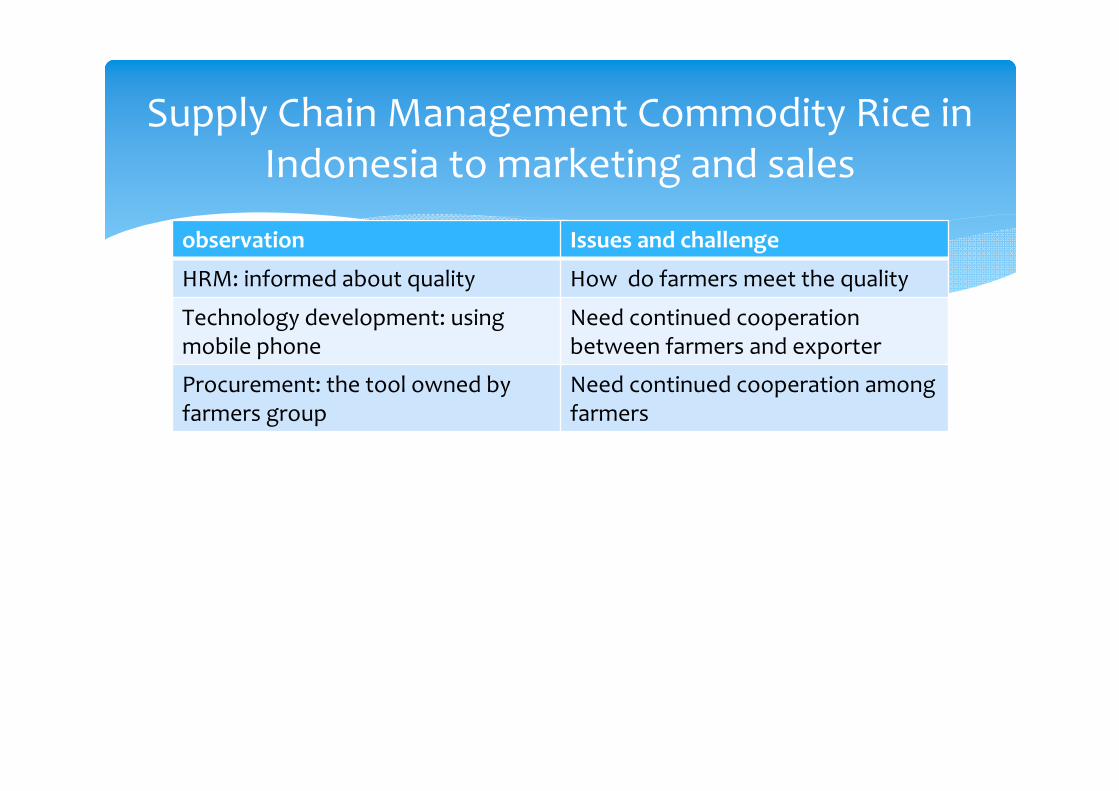
observation Issues and challenge
HRM: informed about quality How do farmers meet the quality
Technology development: using mobile phone
Need continued cooperation between farmers and exporter
Procurement: the tool owned by farmers group
Need continued cooperation among farmers
Supply Chain Management Commodity Rice in Indonesia to marketing and sales
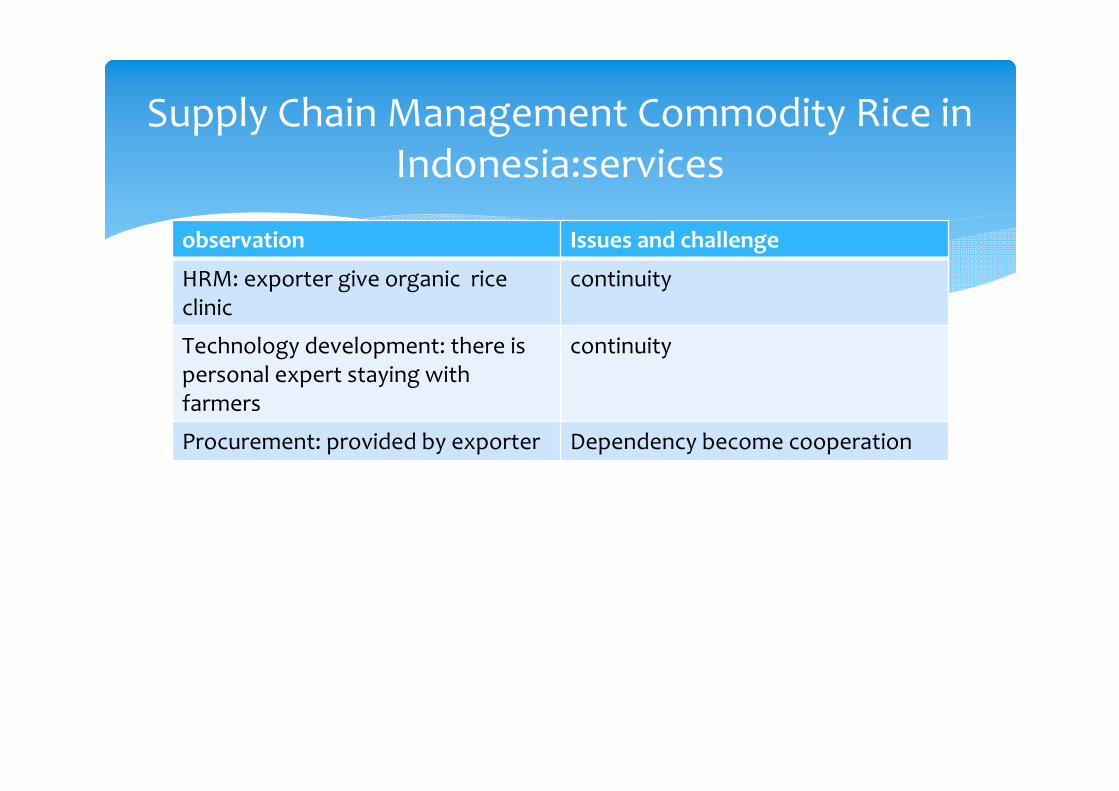
observation Issues and challenge
HRM: exporter give organic rice clinic
continuity
Technology development: there is personal expert staying with farmers
continuity
Procurement: provided by exporter Dependency become cooperation
Supply Chain Management Commodity Rice in Indonesia:services
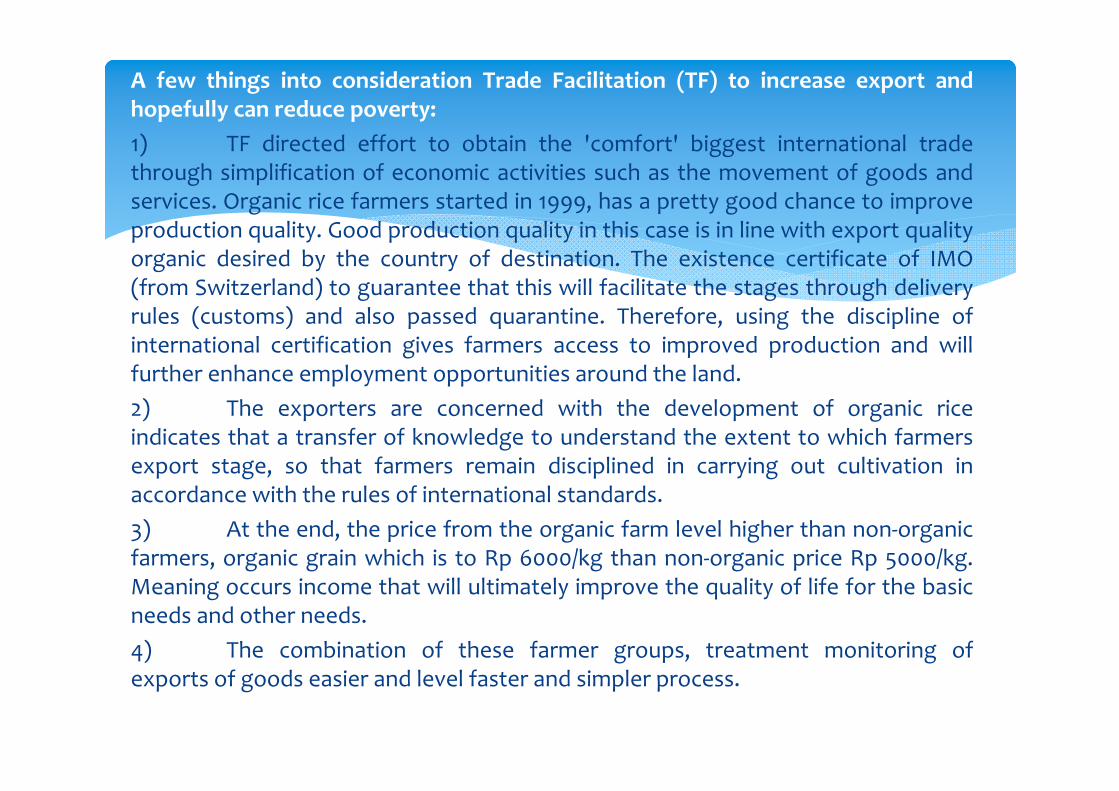
A few things into consideration Trade Facilitation (TF) to increase export and hopefully can reduce poverty:1) TF directed effort to obtain the 'comfort' biggest international trade through simplification of economic activities such as the movement of goods and services. Organic rice farmers started in 1999, has a pretty good chance to improve production quality. Good production quality in this case is in line with export quality organic desired by the country of destination. The existence certificate of IMO (from Switzerland) to guarantee that this will facilitate the stages through delivery rules (customs) and also passed quarantine. Therefore, using the discipline of international certification gives farmers access to improved production and will further enhance employment opportunities around the land.2) The exporters are concerned with the development of organic riceindicates that a transfer of knowledge to understand the extent to which farmers export stage, so that farmers remain disciplined in carrying out cultivation in accordance with the rules of international standards.3) At the end, the price from the organic farm level higher than non‐organic farmers, organic grain which is to Rp 6000/kg than non‐organic price Rp 5000/kg. Meaning occurs income that will ultimately improve the quality of life for the basic needs and other needs.4) The combination of these farmer groups, treatment monitoring of exports of goods easier and level faster and simpler process.
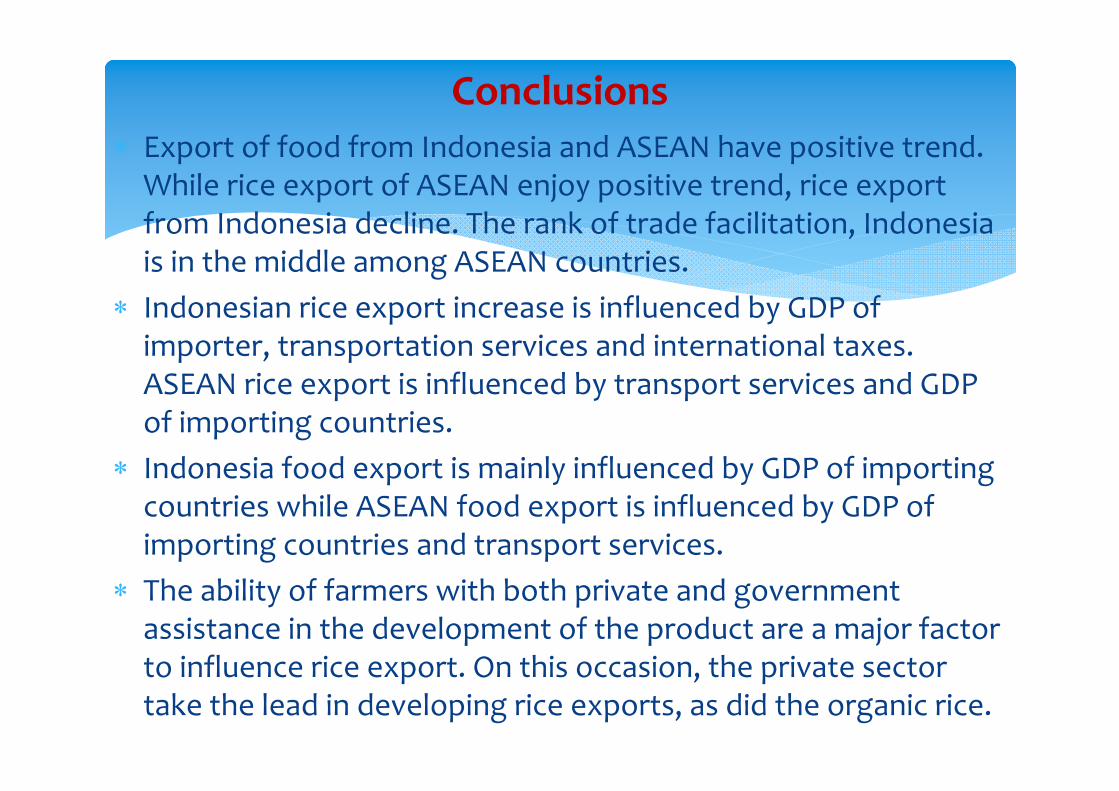
Export of food from Indonesia and ASEAN have positive trend. While rice export of ASEAN enjoy positive trend, rice export from Indonesia decline. The rank of trade facilitation, Indonesia is in the middle among ASEAN countries.
Indonesian rice export increase is influenced by GDP of importer, transportation services and international taxes. ASEAN rice export is influenced by transport services and GDP of importing countries.
Indonesia food export is mainly influenced by GDP of importing countries while ASEAN food export is influenced by GDP of importing countries and transport services.
The ability of farmers with both private and government assistance in the development of the product are a major factor to influence rice export. On this occasion, the private sector take the lead in developing rice exports, as did the organic rice.
Conclusions

Ocupation: Professor in Agricultural Economics, UGM, Indonesia Senior researcher at Center for World Trade Studies, UGM (Universitas gadjah Mada), Indonesia
Chairman of Doctoral Program in agricultural sciences, UGM, Yogyakarta, Indonesia
UGM Consortium Coordinator: South East Asian Graduate Studies in Natural Resources and Agriculture
Vice President: Indonesian Agricultural Economic Society.
Curriculum vitae: Masyhuri [email protected]
Recommended