THE INFLUENCE OF ETHICAL WORK CLIMATE
(EWC) AND DEMOGRAPHIC VARIABLES ON
AUDITORS’ ETHICAL EVALUATION
SKRIPSI
By
Devi Selena
008201200053
presented to the
Faculty of Business President University
in partial fulfillment of the requirements for
Bachelor Degree in Economics Major in Accounting
President University
CikarangBaru – Bekasi
Indonesia
2016


iv
ABSTRACTS
Ethics are considered to be important in audit practice. The intensive
works lead ethical dilemma, especially when there is no exact rules exist.
Researchers have responded by attempting to investigate and analyze the ethical
behavior. While each ethical reasoning process is important, the ability of
auditors to evaluate ethical problems (second phase of Rest’s ethical reasoning
process) that may not be obvious should be studied and understood. This study
will indentify the influence of ethical work climate (EWC) and specified
demographic variables (age, gender, and length of experience) on ethical
evaluation. The climate of accounting public firm is examined based on Victor
and Cullen’s ethical work climate type.
Findings in this study are based on response to scenarios that is related to
cost and time pressures in the fieldwork such as underreporting of time (URT)
and quality threatening behavior (QTB). We targeted the respondents who work
as professional public auditors in Java Island, Indonesia. From 300 questionnaires
distributed, researcher got feedback from 283 auditors. The data is analyzed by
using structural equation model method. Structural equation method is used
because ethical evaluation and ethical work climate cannot be measured directly.
The finding revealed that ethical work climate has significant influence on
auditors’ ethical evaluation. Ethical work climate which exist in public
accounting firm in Java area is composed by six dimensions such as efficiency,
friendship, team interest, social responsibility/public interest, company rules and
procedures, and laws and professional codes climates. Specified demographic
variables are found to give insignificant influence on auditors’ ethical evaluation.
Implications of findings and areas for future research are discussed in the last
chapter.
KEY WORDS: auditors’ ethical evaluation, ethical work climate, age, gender,
length of experience, underreporting of time (URT), quality threatening behavior
(QTB).
v
ACKNOWLEDGMENT
This research is hardly to be done without the big supports from many
parties. Author would like to express my gratitude to:
1. Ida Sang Hyang Widhi Wasa for His favor and the wisdom that are given
during the thesis process.
2. Dr. Sumarno Zain, SE, Ak, M.B.A as advisor of my thesis for giving me
advice, guidance, and recommendation to collate and arrange the thesis
properly.
3. Drs. Gatot Imam Nugroho, Ak, MBA, CA and Drs. Asep Supriatna, MBA
as examiners during defense and comprehensive test for giving me
excellent experience.
4. Putu Purna Wirawan and Ni Nyoman Dwi Adnyani as my parents for their
loves and pray for my success. Nadia Indah Devianty and Made Sandika
D. as my sister and brother in law for giving inspiration during writing
thesis.
5. Ketut Dwi Adnyawati as my twin mother, Putu Venessa, and Made Wina
Sadina as my beloved cousins for helping me to correct my grammar.
6. Ongky Aristian for giving me spirit and love to finish my thesis.
7. Angelina Suryani and Geraldo Risa Maranatha for helping me in
distributing my questionnaires to public accounting firms.
8. Wratsari Windrawati W., Tasya Firsty Annissa, and Deviani Riasari
Nalurita as my roommates for encouraging me when I am feeling down.
9. Daisy Wijaya and Prasetio Nur as my best senior for giving guidance in
each obstacle that I have found in university life.
10. Febru Aulia Ramadhani and Nursa Sherli Yoanita as my beloved team in
competition for attending and support me during defense.
11. Natasya, Ariana, Adam Maulana Akbar, Merinda, Melisa Anggreni, and
Vania Marleen for attending my defense.
12. All members in Accounting Club for encourage me and becoming my
family.
vi
13. KAP Hendrawinata Eddy Siddharta & Tanzil, KAP Mulyamin Sensi
Suryanto & Lianny, KAP Joachim Poltak Lian Michell dan Rekan, KAP
Meidina Ratna, KAP Jansen & Ramdan, KAP Drs. Bernardi & Rekan,
KAP Jojo Sunarjo & Rekan, KAP Drs. Selamat, Ak., BAP, KAP Drs.
Bambang Mudjiono & Widiarto, KAP Maurice Ganda Nainggolan, KAP
Rama Wendra, KAP Aria Kanaka & Rekan, KAP Basyiruddin & Wildan,
KAP Abdul Aziz Fiby Ariza, KAP Warnoyo, S.E., M.Si., KAP Yuwono
H., KAP Drs. Bambang Sudaryono & Rekan, KAP Effendy & Rekan,
KAP Heliantono & Rekan (Cabang Bekasi), KAP Drs. Mohammad
Yoesoef dan Rekan, KAP Moh. Mahsun, Ak, M.Si, CPA, KAP Toton
Sucipto and all external auditors as respondents for giving feedback of my
questionnaires.
14. All accounting students batch 2012.
15. All related people that cannot be mentioned one by one.
Researcher needs critics and suggestions to get better knowledge about what parts
to be improved in this research. Researcher hopes that this thesis will be useful
for the reader. Thank you.
Cikarang, 1st February 2016
Devi Selena
vii
TABLE OF CONTENTS
THE ADVISER RECOMMENDATION LETTER .............................................. i
DECLARATION OF ORIGINALITY ................................................................ ii
PANELS OF EXAMINERS APPROVAL SHEET ............................................ iii
APPROVAL SHEET ......................................................................................... iii
ABSTRACTS .................................................................................................... iv
ACKNOWLEDGMENT ...................................................................................... v
LIST OF TABLES ............................................................................................... x
LIST OF FIGURES ........................................................................................... xi
LIST OF ACRONYMS .................................................................................... xii
CHAPTER I ........................................................................................................ 1
INTRODUCTION ............................................................................................... 1
1.1. Research Background ............................................................................ 1
1.2. Problem Identification ........................................................................... 2
1.3. Statement of the Problem ....................................................................... 3
1.4. Research Objective ................................................................................ 4
1.5. Significance of the Study ....................................................................... 4
1.6. Scope and Limitation of the Study Assumption...................................... 6
1.7. Definition of Terms ............................................................................... 6
CHAPTER II ....................................................................................................... 7
LITERATURE REVIEW .................................................................................... 7
2.1. Rest’s Ethical Reasoning Process ........................................................... 7
2.2. Kohlberg Theory of Cognitive Development ......................................... 8
2.3. Ethical Work Climate Theory .............................................................. 10
2.4. Ethical Behaviors Examined ................................................................ 12
viii
2.5. Relationship between Ethical Evaluation and Ethical Work Climate
(EWC) ........................................................................................................... 13
2.6. Relationship between Ethical Evaluation and Demographics Variables 15
2.7. Theoretical Framework ........................................................................ 18
2.8. Assumption and Hypothesis ................................................................. 21
Chapter III ......................................................................................................... 22
Data Processing Method .................................................................................... 22
3.1. Research Method ................................................................................. 22
3.2. Operational Variable Identification ...................................................... 23
3.3. Data Collection Method ....................................................................... 25
3.4. Sampling Design ................................................................................. 25
3.5. Data Analysis ...................................................................................... 26
Stage 1: Defining individual constructs (Pretesting questionnaire) .............. 28
Stage 2: Developing and specifying the measurement model ...................... 28
Stage 3: Designing a study to produce empirical results .............................. 29
Stage 4: Assessing measurement model validity ......................................... 29
Stage 5: Specifying the structural model ..................................................... 33
Stage 6: Assessing the structural model validity .......................................... 33
3.6. Refining measures model ..................................................................... 34
3.6.1. Model I ......................................................................................... 34
3.6.2. Model II ....................................................................................... 40
3.6.3. Model III ...................................................................................... 46
3.6.4. Model IV ...................................................................................... 52
3.7. Hypothesis Testing .............................................................................. 58
3.8. Limitations .......................................................................................... 58
CHAPTER IV.................................................................................................... 59
ix
ANALYSIS OF DATA AND INTERPRETATION OF RESULTS ................... 59
4.1. Structural Model .................................................................................. 59
4.2. Testing of Structural Model Validity.................................................... 59
4.3. Hypothesis Testing .............................................................................. 60
4.4. Data Interpretation ............................................................................... 62
4.4.1. The influence ethical work climate on ethical evaluation .............. 62
4.4.2. The influence specified demographic variables (age, gender, and
length of experience) on ethical evaluation ................................................. 63
CHAPTER V ..................................................................................................... 66
CONCLUSIONS AND RECOMMENDATIONS .............................................. 66
5.1. Conclusion .......................................................................................... 66
5.2. Recommendations ............................................................................... 66
REFERENCES
APPENDIX 1 - Definition of Terms
APPENDIX 2A - Model I
APPENDIX 2B - Model II
APPENDIX 2C - Model III
APPENDIX 2D - Model IV
APPENDIX 3 - Model that has deleted demographic variables
APPENDIX 4 - Ethical evaluation: Means
APPENDIX 5 - Questionnaire
APPENDIX 6 - List of public accounting firms

x
LIST OF TABLES
Table 3.1 Operational variable identification ...................................................... 24
Table 3.2 Demographics details of the sample ................................................... 26
Table 3.3 Goodness-of-fit indices based on situational criterion (Hair, Black,
Babin, Anderson, & Tatham, 2006) ................................................................... 30
Table 3.4 Pre-testing of reliability ethical valuation variables model I ................ 34
Table 3.5 Pre-testing of reliability ethical work climate variables model I .......... 35
Table 3.6 Pre-testing of validity model I ............................................................ 35
Table 3.7 GOF measurement model I ................................................................. 38
Table 3.8 Reliability test of model I ................................................................... 38
Table 3.9 Validity test of model I ....................................................................... 39
Table 3.10 Pre-testing of reliability ethical evaluation variables model II ........... 40
Table 3.11 Pre-testing of reliability ethical work climate variables model II ....... 40
Table 3.12 Pretesting of validity model II .......................................................... 41
Table 3.13 Goodness-of-fit measurement model II ............................................. 43
Table 3.14 Reliability test of measurement model II .......................................... 44
Table 3.15 Validity test of model II ................................................................... 45
Table 3.16 Pre-testing of reliability ethical evaluation variables model III ......... 46
Table 3.17 Pre-testing of reliability ethical work climate variables model III ..... 46
Table 3.18 Pre-testing of validity model III ........................................................ 47
Table 3.19 GOF measurement model III ............................................................ 49
Table 3.20 Reliability test model III ................................................................... 50
Table 3.21 Validity test of measurement model III ............................................. 51
Table 3.22 Pre-testing of ethical evaluation variables model IV ......................... 52
Table 3.23 Pre-testing of reliability EWC variables model IV ............................ 52
Table 3.24 Pre-testing validity model IV ............................................................ 53
Table 3.25 Goodness-of-fit measurement model IV ........................................... 56
Table 3.26 Reliability test of measurement model IV ......................................... 56
Table 3.27 Validity test of measurement model IV............................................. 57
Table 4.1 t-value result ...................................................................................... 60

xi
LIST OF FIGURES
Figure 2.1 Rest's ethical reasoning process (Rest & Narvaez, Moral development
in the professions, 1994) ...................................................................................... 7
Figure 2.2 Teorectical ethical climate type (Victor & Cullen, A theory and
measure of ethical climate in organization, 1987) ............................................... 11
Figure 3.1 Six stages process of SEM (Hair, Black, Babin, Anderson, & Tatham,
2006) ................................................................................................................. 27
Figure 3.2 x-measurement model I ..................................................................... 36
Figure 3.3 y-measurement model I ..................................................................... 36
Figure 3.4 x-measurement model II................................................................... 41
Figure 3.5 y-measurement model II ................................................................... 42
Figure 3.6 x-measurement model III .................................................................. 47
Figure 3.7 y-measurement model III .................................................................. 48
Figure 3.8 x-measurement model IV .................................................................. 54
Figure 3.9 y-measurement model IV .................................................................. 54
Figure 4.1 Structural model ................................................................................ 59

xii
LIST OF ACRONYMS
EWC : Ethical Work Climate
PSO : Premature Sign Off
QTB : Quality Threatening Behavior
URT : Underreporting of Time
SEM : Structural Equation Model
GAAP : Generally Accepted Accounting Principles
IFRS : International Financial Reporting Standards
GAAS : Generally Accepted Auditing Standard

1
CHAPTER I
INTRODUCTION
1.1. Research Background
The well-known accounting case, Enron, has raised question about the
auditors’ creditability as consequences of their external auditors’ role play in the
manipulation of financial statements. The implication of Enron’s external auditor,
Arthur Andersen, to engage with unethical action was suspended permanently,
although they have given assurance services for a long time. The Enron case also
initiated crisis facing the profession. The trust of auditors was wrecked. Auditors
suppose to have greater responsibility to the public rather than their client because
they have main responsibility to assure the financial statement that prepared by
management of company is reported fairly which will be used by external users.
The society expects auditors to have high standard of ethical behavior. Due to the
auditors’ ethical crisis, society doubt whether they could rely on to the
information given in audited financial statements. US Congress responded the
ethical crisis by issuing Sarbanes-Oxley Act in 2002 which legislates ethical
behavior for both public company and accounting public firms. Canary &
Jennings (2008) study found that corporation, particularly in the post-SOX time
frame, is at least attempting to make ethics a central concern of everyday
practices.
Ethics are considered to be important in every aspect, especially while
performing audit quality. But, auditors still engage in unethical behavior such as a
quality threatening behavior (QTB) and underreporting of time (URT) cause of
extremely time and cost pressure on audit. Being labor intensive, controlling cost
and time on an audit experience are high time and cost pressure on audit and put a
lot of stress on auditors. In the Janis and Mann’s decision model, stress is a key of
conflict model in ethical dilemmas (Janis & Mann, 1977). The auditors should
have technical and ethical experts in solving this dilemma (Gaa, 1994). Ethical

2
experts will determine the audit quality especially in the condition where there is
no exact rules existed.
A considerable amount of the research on ethics within auditing
profession has focused on the second elements of Rest’s ethical reasoning process
model, those being the individuals’ ethical evaluation of a relevant situation.
Previous researchers have elaborated the model by exploring the various
individual and contextual factors influence on ethical evaluation. Several studies
investigate the association between auditors’ ethical judgment and demographic
characteristics: age, gender, and length of experience. Researchers also
investigate the influence of ethical work climate that is already designed by
Victor and Cullen on auditors’ ethical evaluation.
Researcher initiates to examine the impact of ethical work climate and
demographic variables on the ethical evaluation element of the Rest’s model
within the context of certain time pressure-related dysfunctional auditor behaviors
– especially URT and QTB. Other main purpose is to fulfill the requirement for
graduating from President University. The researcher is seeking the data by
distributing questionnaire to a group of experience level auditors in Java Island.
The methodology that is used in the research is explanatory quantitative to
explain the influence of one variable to other variables.
1.2. Problem Identification
Unethical behavior is the most of unwilling act in the audit field work;
however, it often occurs in the real world. Some study found that when
accountability pressure exists, auditors tend to tailor their message to the audience
when the audience is known (Buchman, Tetlock, & Reed, 1996; Cuccia,
Hackenbrack, & Nelson, 1995; Hackenbrack & Nelson, 1996) and auditors’
judgment variability decreases (Ashton, 1992; DeZoort, Horrison, & Taylor,
2006). Increasing the quality of an audit involves investing more time in the audit

3
that leads of further costs and aggressive audit fee competition (Beattie &
Fearnley, 1998).
Based on Rest’s reasoning process, there is the phase of auditor to be
aware of the situation or dilemma that may affect the welfare of others, evaluate
their ethical, decide what they will do ethically, and actual behavior. Once an
ethical dilemma is identified, the auditor will frame an ethical strategy for
resolving ethical dilemma. At this point, auditor judges whose line of action is
ethically justifiable and then decides how the dilemma ought to be resolved. A
connection between organizational climate and demographic variables influences
and individual ethical judgment have long been assumed. The sub-organizational
climate that we will talk about is ethical work climate. The types of ethical work
climate use the theoretical designed by Victor-Cullen that has nine dimensions.
Demographic variables that will be examined are age, gender, and length of
experience.
1.3. Statement of the Problem
This research is about determining the influence of ethical work climate
on auditors’ ethical evaluation of ethical issues in the context of time and budget
pressure. Researcher wants to find out the correlation between ethical evaluation
and ethical work climate whether ethical work climate has a significant influence
on ethical evaluation or not. This study will add knowledge about the ethical
evaluation and the influence of ethical work climate into it, giving suggestion to
the public accountant firms in order to maintain the ethical work climate.
Statement of the problem 1: Does ethical work climate have significant
influence on ethical evaluation?
Researcher wants to determine the influence of specified demographic
variables (age, gender, and length of experience) on auditors’ ethical evaluation
of ethical issues in the context of time and budget pressure. Researcher is seeking
the impact of age, gender, and length of experience on ethical evaluation to enrich
4
literature in auditing field by giving empirical evidence about the impact of work
ethical climate and demographic variables on auditors’ ethical evaluation.
Statement of the problem 2: Does age have significant influence on ethical
evaluation?
Statement of the problem 3: Does gender have significant influence on ethical
evaluation?
Statement of the problem 2: Does length of experience have significant
influence on ethical evaluation?
1.4. Research Objective
The objectives to meet in this research which has a title “The Influence of Ethical
Work Climate and Demographic Variables on Auditors’ Ethical Evaluation” are
as follows:
1. To fulfill the requirement of graduating from President University
2. To examine the influence of ethical work climate on auditors’ ethical
evaluation.
3. To examine the influence of age on auditors’ ethical evaluation.
4. To examine the influence of gender on auditors’ ethical evaluation.
5. To examine the influence of experience on auditors’ ethical evaluation.
1.5. Significance of the Study
Research is a study and analysis of factors, subject, or problem to find the
solution, discover information, and reach an understanding. The result of this
research is expected to give benefit to several parties, they are:
1. External auditors
External auditors have responsibilities to serve public interest. They
should have great competence, integrity in the practice. This research will
5
help them to maintain their ethics that suppose to be important and
concerned of being professional auditor.
2. Public accounting firm
Public accounting firm has an employment level such as: partner, director,
manager auditor, senior auditor, associate level, and staff. Above level of
employment in public accounting firms need to monitor and supervise
their co-worker in the audit team. This research will help them to make
right decision regarding the ethical matter in work field and control the
behavior of senior associate level and associates level.
3. Accountant’s professional organizations
Accountant’s professional organization will be greatly benefited from the
finding of this study as consideration in order to improve code of conduct
or rules that give strict punishment to any auditors who do unethical act.
The rules exist to maintain the auditors’ responsibility to serve public
interest.
4. Academician
Researcher expects this study will give additional knowledge in context of
Accountant Professional Ethics about the factors influence toward
auditors’ ethical evaluation. The finding of this research will enrich
literature in ethical field by giving empirical evidence about the impact of
work ethical climate and demographic variables on auditors’ ethical
evaluation.
5. Researchers
This research could be a reference for future researchers who conduct
research regarding auditor ethics in context of pressure.
6
1.6. Scope and Limitation of the Study Assumption
There are some points that should be clarified for the equalization
perception among reader and researcher regarding the matter of the research. This
research examines the evaluation of ethical issues in the context of time and
budgeting pressure such as underreporting of time (URT) and quality threatening
behavior (QTB). Thus, only one step of Rest’s ethical reasoning process is
discussed in this research without examining other phases. The variables used in
this research to examine auditors’ ethical evaluation are ethical work climate,
gender, length of experience, and age. The climate of accounting public firm will
examine based on theoretical ethical work climate type that developed by Victor
and Cullen. Researcher examines the public firm in Java Island due to time and
cost barrier.
1.7. Definition of Terms
The definitions provide a common frame of reference to improve the
understanding and usefulness of this study. Please refer to APPENDIX 1 to see
the terms.

7
CHAPTER II
LITERATURE REVIEW
2.1. Rest’s Ethical Reasoning Process
Kohlberg (1969) theory of cognitive development has provided a
framework for the majority of studies on auditors’ ethical reasoning (Jones,
Massey, & Thorne, An experimental examination of the effects of individual and
situational factors on unethical behavioral intentions in the workplace, 1996).
Drawing upon the Kohlberg’s theory, Rest & Narvaez (1994) identified four
sequential components of the ethical reasoning process: sensitivity in identifying
the existence of a moral question, ethical evaluation, intention to act morally and
actual moral behavior (Figure 2.1). Moral reasoning is much more than moral
judgment in producing moral behavior which included, but is not limited to moral
sensitivity, judgment, motivation, and character which are all interrelated in the
moral development of individual (Rest & Narvaez, Moral development in the
professions, 1994).
Figure 2.1 Rest's ethical reasoning process (Rest & Narvaez, Moral development in the
professions, 1994)
The first component (ethical sensitivity) refers to the recognition of an issue as
having ethical implications. Failure of an individual to recognize that a situation
may or may not contain a moral element would impede that individual from going
any further in the moral analysis of the situation (Wortman, 2006). Jones T. M.
(1991) identified that there is two necessary components to recognize a moral
dilemma: the individual must understand that his/her actions will affect others and
Ethical
sensitivity
Ethical
evaluation
Intention
to act
Actual
Behavior
8
that she/he has a choice in a matter. When person is able to be aware, then that
person will continue to the next steps. The second involves making a judgment if
an action is ethically correct. Once an individual makes a judgment about a moral
dilemma, s/he still has the opportunity to decide what behavior to adopt
(Wortman, 2006). The third deals with intention to act which is determined by the
value of an individual places on the ethical course of action versus the value of
other courses of action. The fourth distinguishes the intention from the actual
action. An intention may not result in an action and, therefore, Rest sees this as a
separate and distinct component.
2.2. Kohlberg Theory of Cognitive Development
Kohlberg postulates that cognitive structures and interpretative processes
precipitate an individual’s ethical decision choices (Trevino, Experimental
approaches to studying ethical-unethical behavior in organization, 1992).
Kohlberg theory is developmental in focus and proposes three broad levels of
sophistication in ethical reasoning. At first level, the pre-conventional level, the
individual decides what is right or wrong based upon consequences. At the
second level, the conventional level, the individual is concerned about
expectations of significant others and relies upon rules and laws to determine
what is right or wrong. At the third level, the post-conventional level, the
individual decides what is right or wrong in using universal ethical principles
such as common good and justice (Kohlberg, Stage and sequences: The cognitive
development approach to socialization, 1969; Rest, Narvaez, Bebeau, & Thoma,
1999). In specific, the stages of cognitive moral development are as follows.
(Kohlberg, Continuities in childhood and adult moral development revisited,
1973; Kohlberg, The philosophy of moral development 1, 1981; Logsdon &
Yuthas, 1997)
Pre-convential level: Behavioral norms are viewed as being external to the
individual.
9
Stage 1: Punishment-obidience orientation.
Stage 2: Instrumental hedonism and concrete reciprocity.
Conventional level: Externally validated norms are internalized by the individual.
Stage 3: Orientation to interpersonnal relation of mutuality.
Stage 4: Maintenance of social order; fixed rules and authority.
Post-conventional level: Individual recognition that external norms may not fully
encompass ethical behavior.
Stage 5: Social contract, with conscience orientation.
Stage 6: Universal ethical principle orientation.
At the pre-conventional level, a person views rules as imposed and
external to himself/herself. Moral decisions are justified in terms of one’s own
hedonistic interests and in terms of rewards and punishment. Stage one of
individuals form moral judgments guided by obedience for its own sake and to
avoid punishment. Stage two moral judgments are guided by a “you scratch my
back, I will scratch yours” reciprocity. (Arnaud, 2006).
At level two, the conventional level, the individual internalizes the shared
moral norms of the society or a group of the society (e.g. family). What is
considered morally right is explained in terms of living up to roles and what is
expected of the individual by others, and fulfilling duties, rules and laws. Stage
three individuals find ethical behavior to be what pleases and help others. Stage
four individuals’ perspective broaden to consider the society of which they are
part. At this stage, moral judgments consider the riles and laws of social, legal, or
religious systems that are designed to promote the common good. (Arnaud, 2006)
At level three, the post-conventional level, the individual has gone beyond
identification with others’ expectation, rules and laws. Stage five individuals
recognize the relativism of personal values. They still emphasize laws and rules
because they represent the social contract, but they understand the laws can be

10
changed for socially useful purposed. Stage six individuals guided by self chosen
ethical principles of justice and human right. Kohlberg claimed that higher stage
moral judgments are better and more desirable (Arnaud, 2006).
2.3. Ethical Work Climate Theory
Victor & Cullen (1987) define ethical work climate (EWC) as the shared
perceptions of what is ethically correct behavior and how ethical issue should be
handled. They noted “organization are social actors responsible for the ethical or
unethical behaviors of their employees,” and there is “…increasing concern for
understanding and managing organzational normative systems that may guide the
ethical behavior of employees,” (Victor & Cullen, The organizational bases of
ethical work climates, 1988). Ethical work climate is environment of company
that support ethical behavior as guidance for their employees. In regard forming
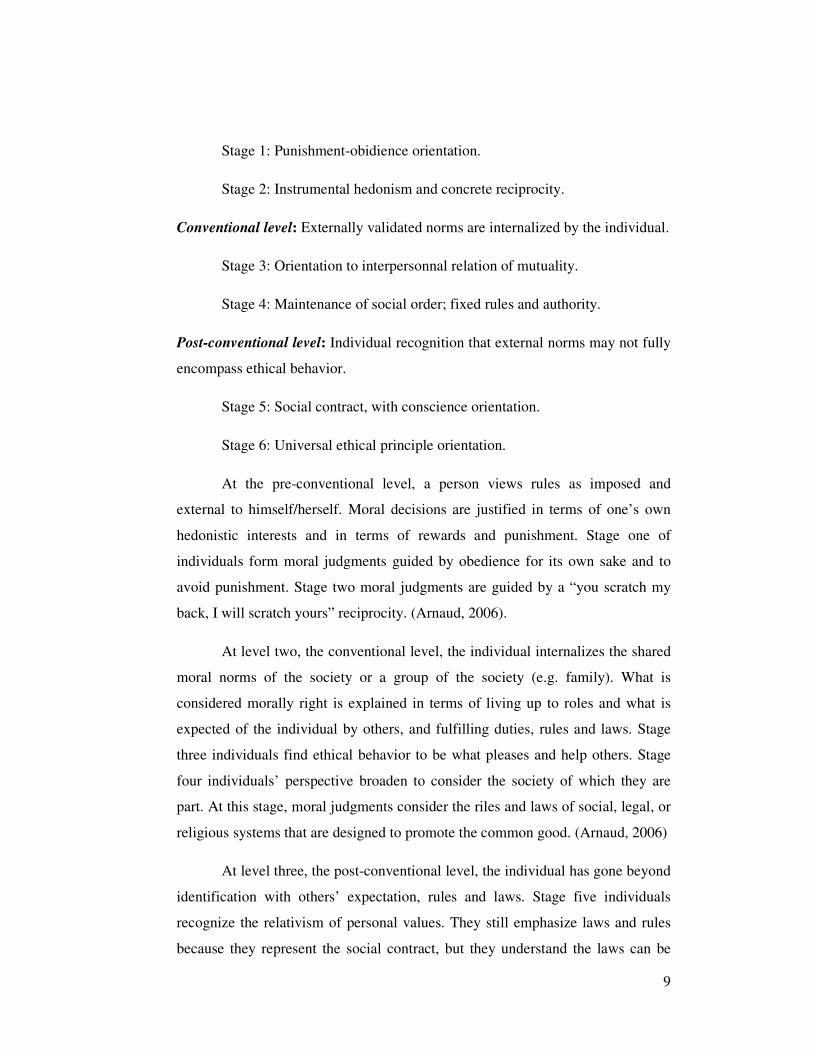
possible ethical climate types, Victor & Cullen (1987) combine two dimensions:
the ethical criteria used for organizational decision making and the loci of anaysis
as referent in ethical decision making.
2.3.1. The ethical criteria dimension
This dimension of EWC is grounded in Kohlberg’s theory of
cognitive moral development (Arnaud, 2006). Victor & Cullen (1987)
draw three levels of cognitive moral reasoning to define ethical dimension
of their model. They termed these criteria egoism, benevolence, and
principle, corresponding to Kohlberg’s preconventional, conventional, and
postconventional moral reasoning, respectively. The egoistic criterionis
characterized by employees’ desires to maximise self interest. The
benevolence ethical criterion is characterised by employees’ desires to
maximise the collective interest of the organization. The principle ethical
criterion is characterised by employees’ adhrence to broader principles of
society and humanity. Egoistic climate tends to lead less ethical decision
rather than benevolent and principle climate (Shafer, Poon, & Tjosvold,
2013).

11
2.3.2. Loci of analysis
The second dimension of Victor & Cullen (1987) framework
borrows from Kohlberg’s theory who defines three loci of concern at
which three ethical criterias are to be considered. The first two of
Kohlberg’s stages, the locus of concern is individual; in the third and
fourth stages the individual’s referent group becomes a larger social
system; and in the highest stages consideration is given to humanity and
other consideration as a whole (VanSandt, Shepard, & Zappe, 2006).
The crossing of these dimensions produces the 3x3 matrix of climate type shown
as below.
Figure 2.2 Theoretical ethical climate type (Victor & Cullen, A theory and measure of
ethical climate in organization, 1987)
The self-interest climate is only care about what is best for them. Individual tends
to protect his/her own interest above others. People in company profit climate are
expected to do anything of further the company’s profit. Profit organization is
mainly goal to achieve higher profit over year to year. They expect their people to
work efficiently in the company (egoism/cosmopolitan). Organization with
benevolence/individual is care about each individual decision making. The
benevolence/local is essential climate. This climate concerns for the good of all

12
people in the company or placing other people’s interest first. Organization
concerned the effect of decision to public in benevolence/cosmopolitan climate.
In principle/individual climate, organization members are expected to follow their
own personal and moral beliefs to identify and make ethical decisions (Wortman,
2006). Organizational with principle/local climate is described in terms of “it is
important to follow strictly the company’s rules and procedures”. Most behaviors
in this climate are directed towards the enforcement of policies and procedure that
build in company. Within principle/cosmopolitan climate, members of company
are primarily concerned with conformity to and abiding by professional standards
and laws (e.g. GAAP, IFRS, GAAS).
2.4. Ethical Behaviors Examined
Ethics research in accounting has focused on a multitude of unethical
behaviors and research on ethical decision making suggests an adverse effect of
time pressure on ethical principles (Moberg, 2000). A stream of literature exists
since the 1970s on time pressure-induced auditor behaviors which are considered
dysfunctional for audit firms and potentially damaging for the profession (e.g.
Buchheit, Pasewark Jr., & Strawser, 2003; Kelley & Margheim, 1987; Rhode,
1978; Sweeney & Pierce, 2006). The range of the behaviors examined in previous
research includes URT and various QTB such as biasing of sample selection,
premature sign-off (PSO) (where auditors sign-off work as completed without
actually completing the work), unauthorized reduction of sample size, greater
than appropriate reliance on client work, acceptance of weak client explanations,
and failure to properly document work (Pierce & Sweeney, Auditor responses to
cost control, 2003).
QTB has been associated with both time deadline and time budget
pressures (Kelley & Margheim, 1999; Pierce & Sweeney, 2004), whereas URT is
only relevant in the context of time budget pressure (Sweeney & Pierce, 2006).
Regarding the ethicality of these behaviors, QTB has been described as an ethical
issue, as it ‘has consequences for others and involves choice or volition on the
13
part of the auditor’ (Coram, Glavovic, Ng, & Woodliff, 2008) and this also
applies to URT.
The type of QTB behavior was considered important by audit seniors in
determining the consequences, with premature sign-off being much more serious
than small reductions in sample size (Pierce & Sweeney, 2006). Perceived
consequences of URT were less severe and included positive consequences such
as improved performance evaluations, increased firm profitability and negative
consequences such as pressure on the individual to maintain image of efficiency
and reduction in the quality of management information (Sweeney & Pierce,
2006). While QTB and URT are not specifically referred to in ethical guidelines
of the profession, the behaviors can be considered contrary to the spirit of the
guidelines. It would be expected that the perceived magnitude of consequences
and perceived social consensus regarding the unacceptability of the behaviors
would be highest for PSO and lowest for URT.
Yet, Pierce & Sweeney (2006) found that audit seniors expressed a low
level of concern over the ethicality of QTB, while Sweeney & Pierce (2006)
found that audit seniors’ concern over the ethicality of URT was virtually non-
existent. Sweeney, Arnold, & Pierce (2010) found URT can be perceived as an
ethical act and PSO is more unacceptable behavior than some other types of QTB.
2.5. Relationship between Ethical Evaluation and Ethical Work
Climate (EWC)
In general, egoistic climates tend to lead to less ethical decisions, while
benevolent and principled climates lead to more ethical decisions (Shafer, Poon,
& Tjosvold, 2013). Indeed, with their explicit focus on the pursuit of self-interest
(egoistic/individual) and narrowly defined firm interests such as profitability
(egoistic/local), it seems logical that egoistic climates should be associated with
less ethical behavior (Shafer, Poon, & Tjosvold, 2013). In the case of benevolent
climates, the welfare of individuals, organizational groups or members of society
14
at large are a primary focus of concern (Shafer, Poon, & Tjosvold, 2013).
Members within benevolent/local organizational climate are concerned about
what is best for everyone in the company. Often this ethical climate is manifested
through communication, employee inclusiveness, valuing people, and
demonstration of concern (Whitener, Brodt, Korsgaard, & Werner, 1998). These
factors all make up a sense of trust which has been linked to decision making
process (Gao, Sirgy, & Bird, 2005).
In such climates, employees perceive that decisions are made based on an
overarching concern for the well-being of these parties (Martin & Cullen, 2006);
thus, such decisions should generally be viewed as ethical in nature. It is
somewhat more difficult to generalize regarding the effects of principled climates
on ethical behavior. As noted by Trevino, Butterfield, & McCabe (1998), this
difficulty arises primarily due to the uncertain effects of principled/individual
climates. When the organizational climate encourages individuals to follow their
own moral principles, it is difficult to predict behavior and whether such behavior
will be viewed by others as ethical. The principled/local and
principled/cosmopolitan climates, however, should clearly promote relatively
ethical behavior due to their emphasis on following prescribed organizational or
professional rules and codes of conduct (Shafer, Poon, & Tjosvold, 2013).
Significant variation exists in the specific ethical climates identified across
studies (Trevino, Butterfield, & McCabe, The ethical context in organizations:
influences on employee attitudes and behaviors, 1998; Martin & Cullen, 2006).
Indeed, the nine theoretical climate types were intended only as a general
framework for the conceptualization of ethical climates and thus inconsistencies
across organizational settings should be expected (Victor & Cullen, A theory and
measure of ethical climate in organization, 1987). Nonetheless, recent studies of
ethical climate in public accounting firms have consistently found support for the
existence of benevolent/cosmopolitan (public interest) and
principled/cosmopolitan climates, as well as egoistic/individual and/or
egoistic/local climates (Cullen, Parboteeah, & Victor, 2003; Parboteeah, Cullen,
Victor, & Sakano, 2005; Shafer W. , 2009). Due to the emphasis on serving the

15
public interest and following professional codes of conduct in public accounting
(AICPA, 2009), it is not surprising that benevolent/cosmopolitan and
principled/cosmopolitan climates have consistently emerged in this context.
Codes of conduct (principle climate dimension) have been a common proxy for
the ethical environment in accounting and auditing literature, because
organization, including accounting firms, and their employees consider them to
be relevant and important (Lamberton, Mihalek, & Smith, 2005) in making
explicit ethical values, putting employees on notice as to what is ethical, and
shifting accountability for actions from firms to individuals.
Egoistic/individual and egoistic/local climates also appear highly relevant
to the public accounting context, since the pursuit of self-interest and firm
profitability are arguably among the primary obstacles to serving the public
interest and following the spirit of professional codes of conduct (Shafer, Poon, &
Tjosvold, 2013). The ethical climate construct has been quite influential in the
business ethics literature and the weight of the evidence suggests that employees’
perceptions of the prevailing climates in their organization affect ethical
decisions, and are also associated with work outcomes such as organizational
commitment and job satisfaction (Martin & Cullen, 2006).
2.6. Relationship between Ethical Evaluation and Demographics
Variables
This research examines the impact of specified demographic variables:
age, gender, and the length of experience towards ethical evaluation.
2.6.1. Age
Mixed findings have been reported on the relationship between age
and ethical decision making (Ford & Richardson, Ethical decision
making: A review of the empirical literature, 1994). Clarke, Hill, &
Stevens (1996) found that age and moral development were significantly
negatively related for Big 6 practitioners, while Ruegger & King (1992)

16
found that age was positively correlated to ethical attitudes. Lane (1995),
Loe, Ferrel, & Mansfield (2000), Longeneeker, McKinney, & Moore
(1989), and Yoo & Donthu (2002) found a possitive correlation between
age and ethical decision making indicating that older students are more
likely to act ethically than the younger students. Early reviews (Ford &
Richardson, Ethical decision making: A review of the empirical literature,
1994; Loe, Ferrel, & Mansfield, 2000) found seven out of eight studies
indicating older people are more ethical than younger people. Age showed
a significant positive relationship with ethical evaluation (Sweeney,
Arnold, & Pierce, 2010). Ethical judgment was associated with increased
age (Valentine & Rittenburg, 2007). O'Fallon & Butterfield (2005) further
found mixed results with eight of their 21 findings not producing
significant results. Six studies found a positive relationship between age
and ethical decision making, while five studies indicated a negative
relationship. In Lehnert, Park, & Singh (2015) review four findings that
reported a significant effect of age. Three findings reported that older
people tend to behave more ethically than younger people. Mixed results
in previous studies indicate that the role of age in ethical decision making
is not clear; therefore, researcher concludes age may have a significant
influence on auditors’ ethical evaluation.
2.6.2. Gender
A number of studies has examined the impact of gender on ethical
decision making, with some findings that females have higher ethical
decision making ability than males (Barnett, Bass, & Brown, 1994;
Bernardi & Arnold, 1997; Cohen, Pant, & Sharp, 1998; Clarke, Hill, &
Stevens, 1996; Eynon, Hill, & Stevens, 1997; Sweeney, Arnold, & Pierce,
2010) and others showing no difference between males and females
(Dubinsky & Levy, 1985; Radtke, 2000; Ponemon, Ethical reasoning and
selection socialization in accounting., 1992; Armstrong, 1987). Sweeney,
Arnold, & Pierce (2010) study indicated females reported significantly

17
higher ethical evaluation than males. O'Fallon & Butterfield (2005) noted
49 studies in gender category, with the majority or tose studies (23
studies) not finding significant differences. In the 16 studies found
significant gender differences, females were found to be more ethical than
males. Glover, Bumpus, Logan, & Ciesla (1997) found a significant
correlation between gender and ethiccal decision making. They found that
women’s decision about moral issues were more ethical than men’s.
Female seems to be more aware of ethical issues and more likely to act
ethically than their male counterparts (Robin & Babin, 1997; Borkowski
& Ugras, 1998). In (Craft, 2013), discussion of the impact of various
gender-specific variable on ethical decision making highlights that
females are more ethical than males, however, males are more consistent
in their decision making. As general, researcher concludes that gender has
significant influence on auditors’ ethical sensitivity.
2.6.3. Length of experience
Glover, Bumpus, Sharp, & Munchus (2002) found a positive
relationship between years of management experience and ethical choice.
They argued that greater experience may be linked with greater awareness
of acceptable ethics and a greater experience of dealing with similar
situations (Sweeney, Arnold, & Pierce, 2010). Otherwise, Thorne,
Massey, & Magnan (2003) found that there is a significant negative
corelation between years experience and ethical judgment. Eweje &
Brunton (2010) found that more experienced students appeared to be more
ethically oriented. A study found a positive and significant relationship
between work experience and ethical decisoin making with the other two
reporting non significant results (Lehnert, Park, & Singh, 2015). Ethical
judgement was associated incrased experience (Valentine & Rittenburg,
2007).
18
General auditing experience has been found to be positively
related to auditors’ judgment performance when the audit task requires
exercise of individual judgment (Martinov-Bennie & Pflugrath, 2009). For
more complex tasks requiring greater exercise of judgment, general
auditing experience can improve performance by providing the necessary
skills and/or knowledge required to complete these tasks (Anderson,
Koonce, & Marchant, 1994; Anderson & Maletta, 1994). Task specific
experience has been shown to be able to provide additional improvement
in the quality of auditors’ judgments for semi-structured and unstructured
tasks (Bonner & Lewis, 1990; Libby & Tan, 1994; O’Reilly, Leitch, &
Wedell, 2004; Pincus, 1991; Wright, 2001). Martinov-Bennie & Pflugrath
(2009) found greater task-specific experience provide more significantly
higher quality technical judgments than those with lower levels of task-
specific experience.
According to previous studies, researcher concludes that length of
experience has significant influence on auditors’ ethical evaluation.
2.7. Theoretical Framework
Rest (1986) has suggested that one needs to perform four basic
psychological processes in order to behave ethically. The four basic psychological
processes are called as Rest’s ethical reasoning. In short, the process begins with
the awareness of moral problem exists, and then individual decides the correct
moral and has willingness to behave ethically. The last phase is actual behavior.
The evaluation of ethical issue is really important for the professionals to
decide what is right or wrong, ethical or unethical act while they have extremely
pressure on audit. Some study found that when accountability pressure exists,
auditors tend to tailor their message to the audience when the audience is known
(Buchman, Tetlock, & Reed, 1996; Cuccia, Hackenbrack, & Nelson, 1995;
Hackenbrack & Nelson, 1996) and auditors’ judgment variability decreases
19
(Ashton, 1992; DeZoort, Horrison, & Taylor, 2006). Cost and time pressures are
also caused in ethical dilemma of auditor. Bigger cost of audit is probably caused
of extended time on audit for increasing audit quality. Imbalance in audit work
and staffing, client induces pressure, and complexity of business environment will
increase time pressure on auditor. The un-behaved actions will be arisen from
cost and time pressures are quality threatening behaviors (QTB) and
underreporting of time (URT). In specific, dysfunctional responses caused of time
and budget pressure are biasing the sample selection, too much reliance on client
work, phantom ticking, and an overall lower standard of work.
Some previous literature already expanded the Rest’s model by
recognizing influence of multiple variables and their interactions. They have
developed the relationship between individual factors into Rest’s model such as
general demographics characteristics (e.g. gender (Gilligan, 1982; Barnett, Bass,
& Brown, 1994; Bernardi & Arnold, 1997; Clarke, Hill, & Stevens, 1996; Cohen,
Pant, & Sharp, 1998; Browning & B., 1983; Dubinsky & Levy, 1985; Radtke,
2000), political orientation (Elmer, Renwick, & Malone, 1983)), ethical
development (Trevino, 1986), etc. Prior researchers also identified the influence
of contextual factors into the Rest’s model which include the immediate job
context (time and budget pressure, role pressure, rewards and sactions, and the
influence of significant others) (Trevino & Weaver, Managing ethics in the
business organization: Social scientific perspectives, 2003), the external context
(professional environment, organizational environment), and issue specific
factors. The ethical climate construct has been quite influential in the business
ethics literature and the weight of the evidence suggests that employees’
perceptions of the prevailing climates in their organization affect ethical
decisions, and are also associated with work outcomes such as organizational
commitment and job satisfaction (Martin & Cullen, 2006).
Organizational climate is conceptualized as the way individuals perceive
personal impact of their environment (James, James, & Ashe, 1990). Thus,
climate encompasses the set of characteristics, which the members of the
organization perceive and come to describe in a shared way (Verbeke, Volgering,

20
& Hessels, 1998). Victor & Cullen (1987) develop theoretical ethical work
climate types by combining the locus of analysis and ethical criterion that adopted
from Kohlberg theory. Indeed, the nine theoretical climate types were intended
only as a general framework for the conceptualization of ethical climates and thus
inconsistencies across organizational settings should be expected (Victor &
Cullen, A theory and measure of ethical climate in organization, 1987).
Nonetheless, recent studies of ethical climate in public accounting firms have
consistently found support for the existence of benevolent/cosmopolitan (public
interest) and principled/cosmopolitan climates, as well as egoistic/individual
and/or egoistic/local climates (Cullen, Parboteeah, & Victor, 2003; Parboteeah,
Cullen, Victor, & Sakano, 2005; Shafer W. , 2009). The ethical climate construct
has been quite influential in the business ethics literature and the weight of the
evidence suggests that employees’ perceptions of the prevailing climates in their
organization affect ethical decisions (Martin & Cullen, 2006).
The influence of auditors’ ethical evaluation may also come from
demographic variable. According to Cambridge advanced learner's dictionary
third edition (2008), demographic is the quantity and characteristics of the people
who live in particular area, especially in relation to their age, how much money
they have and what they spend it on. Demographic variables are talking about
gender, age, and length of experience that will be discussed in this study. Mixed
findings have been reported on the relationship between specified demographic
variables (age, gender, and length of experience) and ethical decision making.
Researcher concludes that those demographic variables may have significant
influence on ethical evaluation.
21
2.8. Assumption and Hypothesis
According to explanation of theories above and formulation of problems
from previous chapter, several hypotheses suggest as follows.
H1: Ethical work climate has significant influence on ethical evaluation.
H2: Age has significant influence on ethical evaluation.
H3: Gender has significant influence on ethical evaluation.
H4: Length of experience has significant influence on ethical evaluation.
22
Chapter III
Data Processing Method
3.1. Research Method
The research employed a quantitative methodology that uses statistical
measurement to obtain the result. The quantitative methodology is best suited for
study due to concrete result as the basis to prove the hypothesis. The procedures
of quantitative methodology will form the scientific foundation to explain the
relationship between independent variables and dependent variables in targeted
population that is called as explanatory approach. In explanatory approach,
statistical techniques are used to test the significant relationship among variables.
The variables of this study are as follows.
3.1.1. Dependent variable
Dependent variable is the main variable that researcher wants to
investigate deeply. Researcher is interested in quantifying and measuring
dependent variable to get solution of the problem. The dependent variable
of this research is auditors’ ethical evaluation. Auditors’ ethical evaluation
is auditors’ ability to evaluate the action.
3.1.2. Independent variable
Independent variable causes the change in dependent variable in
either positive or negative way. The independent variables that may have
influenced on auditors’ ethical evaluation are ethical work climate and
demographic variable.
23
3.2. Operational Variable Identification
Operational variable identification is to determine how measurement of
variables will be made. Each variable will be defined operationally.
1. Auditors’ ethical evaluation
To identify auditors’ ability to evaluate the action, the researcher prepares
the cases related to certain time and cost pressure-related dysfunctional
auditor behaviors – especially URT and QTB. Auditors is requested to
give their preference in five point scale (1 = favor the action; 5 = oppose
the action). The higher score given reflects a higher ethical evaluation as it
indicates that the behaviors represented in the cases are considered
unethical.
2. Ethical work climate
The nine theoretical climate types were intended to be evaluated. The nine
questions of ethical work climate are adopted from Victor & Cullen
(1987, 1988). Each indicator is to be rated by the respondents based on
how they are perceived it really in their organization, not how they prefer
it to be, in a five point scale, ranging from “strongly disagree” to :strongly
agree”.
3. Specified demographic variables
The demographic variables that are willing to execute in this research are
age, gender, and length of experience. A question is prepared for each
variable to determine how long their experience in professional field, their
age, and their gender.
The indicators of each variable are elaborated on table 3.1 below.

24
VARIABLE INDICATOR SYMBOL* SCALE
MEASUREMENT
Auditors'
ethical
evaluation
a. Auditors evaluate behavior about biasing
sample selection. EV1 Ordinal
b. Auditors evaluate behavior about over-reliance
on client work. EV2 Ordinal
c. Auditors evaluate behavior about URT. EV3 Ordinal
d. Auditors evaluate behavior about PSO. EV4 Ordinal
Ethical work
climate a. People in this company are very concerned
about what is best for them (egoism-individual
climate)
EWC1 Ordinal
b. People are expected to do anything o further
the company’s interest (egoism-local climate). EWC2 Ordinal
c. In this company, each person is expected,
above all, to work efficiently (egoism-
cosmopolitan climate).
EWC3 Ordinal
d. It is expected that each individual is cared for
when making decisions here (benevolence-
individual climate).
EWC4 Ordinal
e. Our major consideration is what is best for
everyone in this company (benevolence-local
climate).
EWC5 Ordinal
f. The effect of decisions on the customer and the
public are primary concerned in this company
(benevolence-cosmopolitan climate).
EWC6 Ordinal
g. Each person in this company decides for
himself what is right and wrong (principle-
individual climate).
EWC7 Ordinal
h. It is important to follow strictly the company’s
rules and procedures (principle-local climate). EWC8 Ordinal
i. In this company, people are expected to strictly
follow legal or professional standards (principle-
cosmopolitan climate).
EWC9 Ordinal
Specified Demographic
variables (age, gender,
length of
experience)
a. Auditors give their personal information about
their age. AGEM Ordinal
b. Auditors give personal information about their
gender. GENDERM Ordinal
c. Auditors give personal information about how
long they have worked at professional accounting
firm.
LEM Ordinal
* symbol in path diagram
Table 3.1 Operational variable identification

25
3.3. Data Collection Method
Data collection methods are designed to maintain the integrity of the
study. In order to provide sufficient information for the study, the author uses the
qualitative data. The qualitative data is used as the data that presents related
literatures and concepts to support this study. To address the research questions,
researcher collected data from several sources as below:
1. Questionnaire is one of three main data collections in survey research.
Due to the limitation of researcher, the questionnaire will be manually and
electronically distributed. Questionnaires were distributed to professional
auditor at big four public accounting firms and non big four public
accounting firms in Java Island. To measure auditors’ ethical evaluation,
researcher distributed questionnaires with cases that adopted and explored
from previous study. The respondents will give their opinion of each
statement in the 5 point scale. The questionnaire includes 3 parts: 1)
unethical action cases to measure ethical evaluation variable 2) ethical
work climate 3) personal information in regards to demographic variables
(see APPENDIX 5).
2. Literature review is secondary data to gather the data from source that
already exist. Literature review is a method of collecting theoretical data
by reading and studying some books and other writing materials which are
relevant to the topic that the author has chosen. The materials will be used
as guidance to develop conceptual framework and supporting argument of
the finding.
3.4. Sampling Design
The sample must represent the population interest and must be adequate
for subsequent analysis. Some form of random sampling is used in probability
sample design to enable researcher in using probability theory to determine the
accuracy of results through the computation of standard error. Two types that are
explained in probability theory are probability sampling designs and non

26
probability sampling designs. The auditor uses the purposive sampling, one of
non probability sampling design types. Researcher received back 283
questionnaires from 300 questionnaires distributed. Researcher is also
compromising the data from the auditor into four types of demographic variables
which are age, gender, firm size, and length of experience in table 3.2.
Demographic details Total data
Non big four 205
Big four 78
Female 147
Male 136
Mean length experience 2.5231
Mean age 24.9965
Table 3.2 Demographics details of the sample
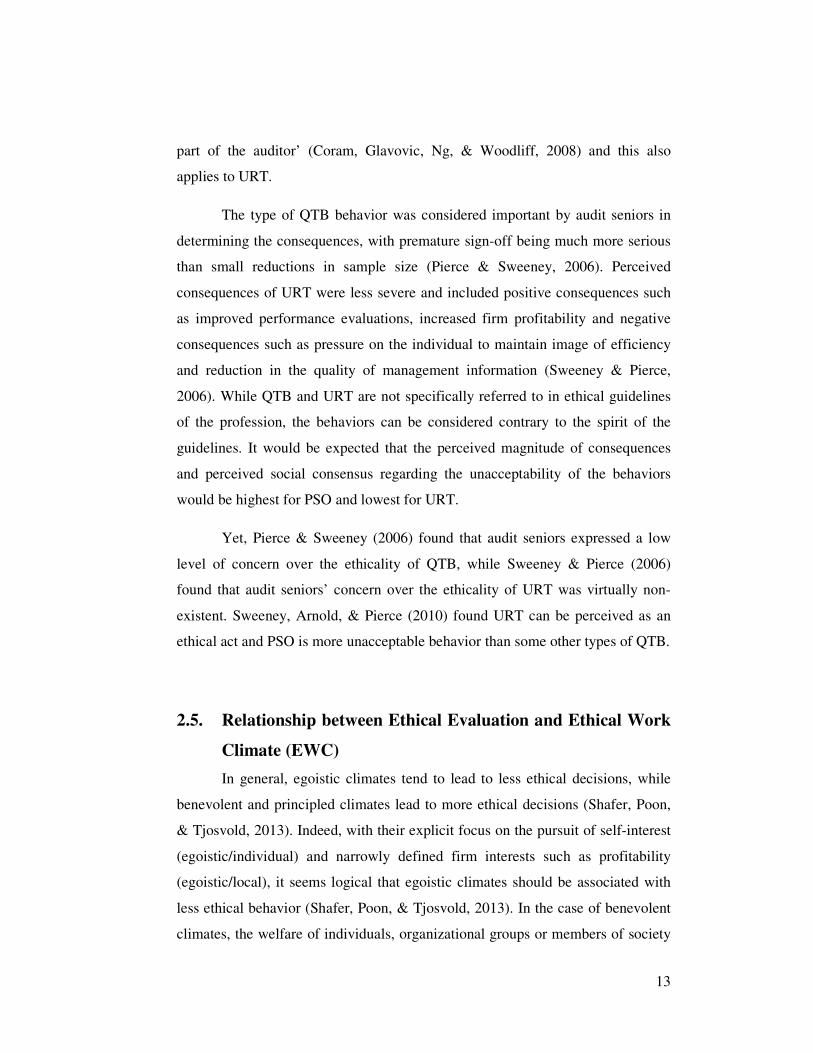
3.5. Data Analysis
The research model is tested using structural equation modeling.
Structural equation modeling (SEM) is used to describe the causal relation among
the latent variables. The software for data processing is used LISREL. SEM is
also able to give information about factor loading and measurement errors of
variables. SEM is composed of two parts: measurement model and structural
model. Structural model describes relationship between latent variables.
Meanwhile, measurement model describes factor loading between observed
variables and latent variables.
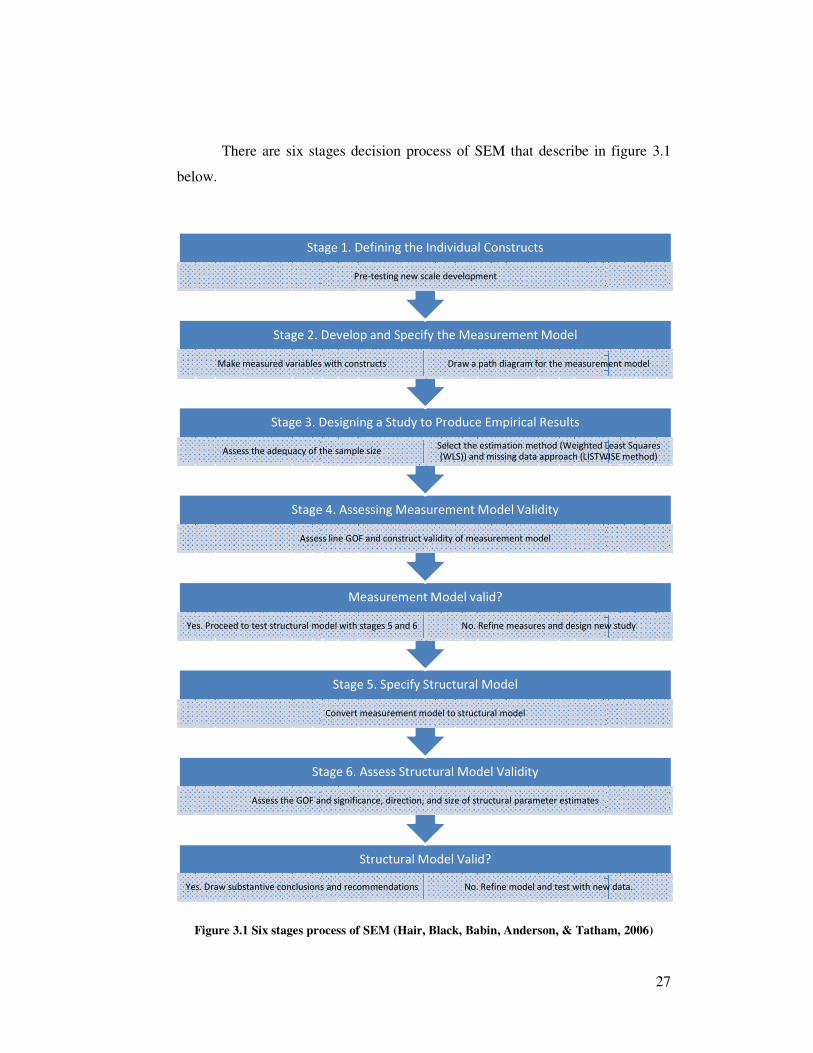
There are six stages decisi
below.
Figure 3.1 Six stages process of SEM
Yes. Draw substantive conclusions and recommendations
Stage 6. Assess Structural Model Validity
Assess the GOF and significance, direction, and size of structural parameter estimates
Yes. Proceed to test structural model with stages 5 and 6
Stage 4. Assessing Measurement Model Validity
Assess line GOF and construct validity of measurement model
Stage 3. Designing a Study to Produce Empirical Results
Assess the adequacy of the sample size
Stage 2. Develop and Specify the Measurement Model
Make measured variables with constructs
Stage 1. Defining the Individual Constructs
six stages decision process of SEM that describe in
Six stages process of SEM (Hair, Black, Babin, Anderson, & Tatham, 2006)
Structural Model Valid?
Yes. Draw substantive conclusions and recommendations No. Refine model and test with new data.
Stage 6. Assess Structural Model Validity
Assess the GOF and significance, direction, and size of structural parameter estimates
Stage 5. Specify Structural Model
Convert measurement model to structural model
Measurement Model valid?
Yes. Proceed to test structural model with stages 5 and 6 No. Refine measures and design new study
Stage 4. Assessing Measurement Model Validity
Assess line GOF and construct validity of measurement model
Stage 3. Designing a Study to Produce Empirical Results
Assess the adequacy of the sample sizeSelect the estimation method (Weighted Least Squares
(WLS)) and missing data approach (LISTWISE method)
Stage 2. Develop and Specify the Measurement Model
Make measured variables with constructs Draw a path diagram for the measurement model
Stage 1. Defining the Individual Constructs
Pre-testing new scale development
27
in figure 3.1
(Hair, Black, Babin, Anderson, & Tatham, 2006)
No. Refine model and test with new data.
No. Refine measures and design new study
Select the estimation method (Weighted Least Squares
(WLS)) and missing data approach (LISTWISE method)
Draw a path diagram for the measurement model
28
The six stages process is consistent with two-step SEM process. By two-
step, we test the fit and construct validity of the proposed measurement model.
Once a satisfactory measurement model is achieved, the second step is to test the
structural theory. Both of steps are assessing fit and the validity. Researcher
illustrates the six stages in detail as below.
Stage 1: Defining individual constructs (Pretesting questionnaire)
The collected questionnaires are adopted and explored by researcher.
Cause of the new scale items, researcher should do pretesting questionnaire by
testing the reliability and validity among constructs. The reliability and validity
testing discussed as below.
1. Test reliability
Reliability testing is a measurement to test whether respondents could
answer the question consistently or not. There are two latent variables
such as ethical evaluation and ethical work climate. The measurement of
these variables is measured by statistics testing Cronbach Alpha (α).
Based on Nunnaly criterion, variables are reliable if their alpha is above
60% (Ghozali, 2006).
2. Test validity
Test validity is a measurement if the questions have already measured
what researcher wants to. Researcher uses Kaiser Meyer Oikin (KMO)
and Barlett’s Test to test validity among constructs. Based on the criteria
which is KMO should be more than 0.5 (Ghozali, 2006), the test factor
analysis could be done.
Stage 2: Developing and specifying the measurement model
In this stage, each latent construct to be included in the model is identified
and the measured indicator variables (items) are assigned to latent constructs.
This process will be represented with diagram in the next section.
29
Stage 3: Designing a study to produce empirical results
Designing a study to produce empirical results, we should concern about
two issues which are missing value method and estimation technique.
1. Weighted Least Square (WLS) Estimator
When assumption of multivariate normality is not met, researcher could
use alternative estimation technique which is Weighted Least Square
(WLS) (Hair, Black, Babin, Anderson, & Tatham, 2006). WLS is
estimation method that adapted from Asymptotically Distribution Free
(ADF). ADF is general estimation which does not depend on type of
distribution data. WLS needs ten respondents for each observed variable
(Wijayanto, 2008).
2. LISTWISE method
LISTWISE method or complete case approach is the simplest method for
dealing with missing data. Even though, it is easy for use, LISTWISE
method increases the likelihood of non-convergence (SEM program
cannot find any solution). But we can tackle this disadvantage because we
have large sample sizes (283 samples).
Stage 4: Assessing measurement model validity
Three measurements are using for assessing measurement model validity.
All the measurement should be valid to continue to the next stage.
1. Goodness-of-fit (GOF)
Hair, Black, Babin, Anderson, & Tatham (2006) categorize GOF indices
into three groups: absolute fit measures, incremental fit indices, and
parsimony fit indices. Absolute fit measures are direct measures of how
well the model specified the researcher reproduces the observed data.
Incremental fit indices assess how well a specified model fits relative to
some alternative baseline model. Parsimony fit indices are designed

30
specially to provide information about which model among sets if
competing models is the best, considering its fit relative to its complexity.
According to Hair, Black, Babin, Anderson, & Tatham (2006), using three
to four fit indices provides adequate evidence of model fit. The researcher
should report at least one incremental index and one absolute indices, in
addition to the χ2 and the associated degree of freedom. At least one of the
indices should be a badness of fit index. There are characteristics of
different fit indices used in demonstrating goodness of fit across different
model situation (Hair, Black, Babin, Anderson, & Tatham, 2006).
N<250 N>250
m≤12 12<m<30 m≥30 m≤12 12<m<30 m≥30
χ2 Insignificant
ρ-values
expected.
Significant
ρ-values
can result
even with
good fit.
Significant
ρ-values
expected.
Insignificant
ρ-values
expected.
Significant
ρ-values
expected.
Significant
ρ-values
expected.
CFI or
TLI
0.97 or
better.
0.95 or
better.
Above
0.92.
0.95 or
better.
Above
0.92.
Above
0.90.
SRMR Could be
biased
upward, use
other
indices.
0.80 or
less (with
CFI of
0.95 or
higher)..
Less than
0.09 (with
CFI above
0.92)
Could be
biased
upward, use
other
indices.
0.80 or
less (with
CFI of
0.92 or
higher).
0.80 or
less (with
CFI of
0.92 or
higher).
RMSEA Values <
0.08 with
CFI ≥ 0.97.
Values <
0.08 with
CFI ≥
0.95.
Values <
0.08 with
CFI ≥
0.92.
Values <
0.07 with
CFI ≥ 0.97.
Values <
0.07 with
CFI ≥
0.92.
Values <
0.07 with
CFI ≥
0.90.
Table 3.3 Goodness-of-fit indices based on situational criterion (Hair, Black, Babin,
Anderson, & Tatham, 2006)
31
Beside the above criteria, researcher could use indices below to
accept the overall fit.
a. Goodness-of-Fit Index (GFI) is less sensitive to sample size. Its
range value is 0 to 1 with higher values indicating better fit. In the
past, GFI values of greater than 0.90 typically were considered good.
Others argue 0.95 should be used (Hair, Black, Babin, Anderson, &
Tatham, 2006). Meanwhile, 0.80 ≤ GFI ≤ 0.90 is called marginal fit
(Wijayanto, 2008).
b. Normed Fit Index (NFI) is ratio of the difference in the χ2
value for
the fitted model and a null model divided by χ2
value for null model. A
model with perfect ft would produce an NFI of 1 (Hair, Black, Babin,
Anderson, & Tatham, 2006). NFI value ≥ 0.90 shows good fit and
0.80 ≤ NFI < 0.90 is referred to marginal fit (Wijayanto, 2008).
c. Adjusted Goodness of Fit Index (AGFI) is extended of GFI that
adjusted with ratio between degree of freedom of null or independence
or baseline model and degree of freedom of estimated model. Like as
GFI, AGFI value is around 0 to 1 and AGFI value that is higher than
or equal to 0.90 shows good fit. Meanwhile, 0.80 ≤ GFI < 0.90 is
usually called as marginal fit.
d. Parsimonious Normal Fit Index (PNFI) and Parsimony Goodness-
of-fit Index (PGFI) consider the number of degree of freedom to
achieve a good fit (Wijayanto, 2008). The values of the PNFI and
PGFI are meant to be used in comparing one model to another with the
highest PNFI and PGFI value being most supported with respect to the
criteria captured by these indices (Hair, Black, Babin, Anderson, &
Tatham, 2006).
2. Construct validity
To assess construct validity, researcher examines validity testing and
reliability testing as follows.
32
a. Validity testing of measurement model.
According to Ridgon & Ferguson (1991) and Doll, Xia, & Torkzadeh
(1994), a variable is valid if t-value of factor loading should be equal or
more than its critical value (or 1.96) and its standardized factor loading is
equal and higher than 0.70. Hair, Black, Babin, Anderson, & Tatham
(2006) state that standardized factor loading ≥ 0.50 is very significant.
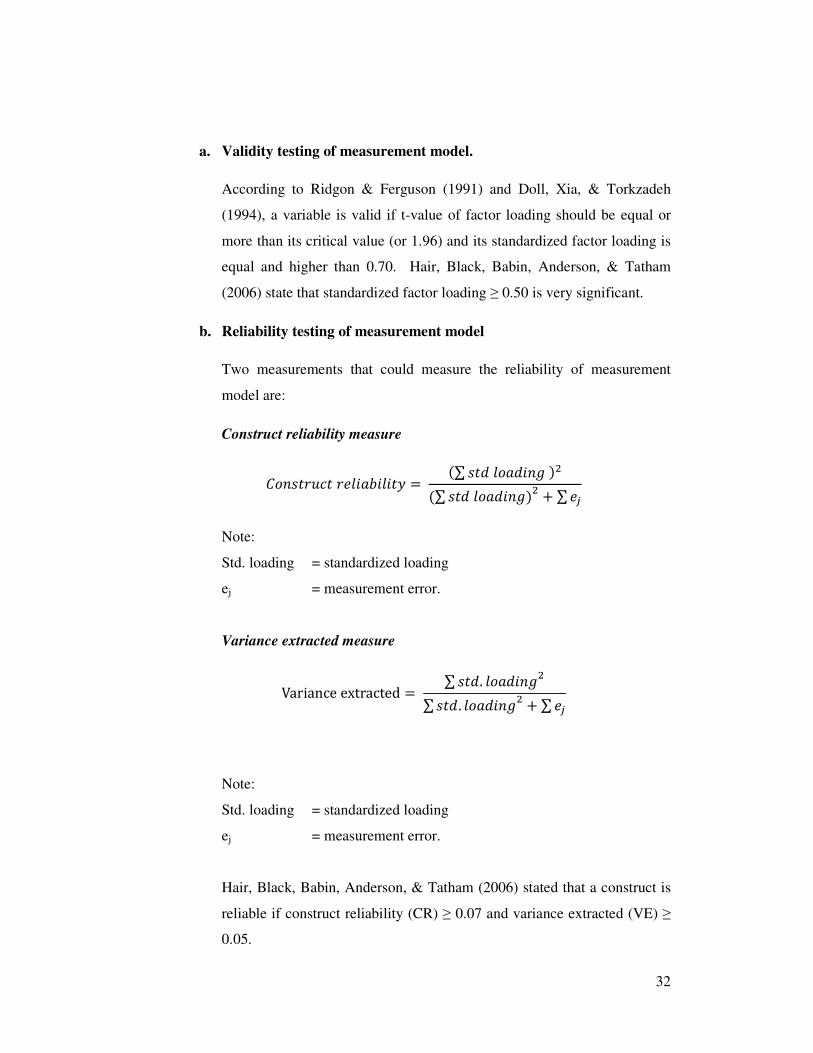
b. Reliability testing of measurement model
Two measurements that could measure the reliability of measurement
model are:
Construct reliability measure
��������� ��� ������ = �∑ ��� �� ���� ��
�∑ ��� �� ������
+ ∑ �
Note:
Std. loading = standardized loading
ej = measurement error.
Variance extracted measure
Variance extracted = ∑ ���. �� ����
�
∑ ���. �� �����
+ ∑ �
Note:
Std. loading = standardized loading
ej = measurement error.
Hair, Black, Babin, Anderson, & Tatham (2006) stated that a construct is
reliable if construct reliability (CR) ≥ 0.07 and variance extracted (VE) ≥
0.05.

33
Stage 5: Specifying the structural model
Stage 5 involves specifying the structural model by assigning relationships
from one construct to another based on the proposed theoretical model (Hair,
Black, Babin, Anderson, & Tatham, 2006). In detail, it will be illustrated in the
next chapter.
Stage 6: Assessing the structural model validity
The fit of structural model can be tested by structural model GOF. The
overall fit can be assessed using the same criteria as the measurement model:
using the χ2 value for structural model, one other absolute index, one incremental
index, one goodness-of-fit indicator, and badness-of-fit indicator (Hair, Black,
Babin, Anderson, & Tatham, 2006). The model of this researcher is considered as
saturated structural model then, the fit for saturated theoretical model should be
the same as those obtained for the CFA model. Researcher does not need to test
goodness-of-fit of structural model.
Good model fit alone is insufficient to support a proposed theory.
Researcher also examines the individual estimation to test specific hypothesis. A
theoretical model is considered valid to the extent that the parameter estimates are
statistically significant and in the predicted direction (Hair, Black, Babin,
Anderson, & Tatham, 2006). As other multivariate techniques, the significant
influence of the exogenous variables on endogenous variable can be shown from
its t-value. Researcher compares the t-value of each parameter to its critical value.
The higher absolute t-value than critical value indicates significant influence. If
the significant value is 0.05, its critical value is ±1.96 (two-tail). Therefore,
absolute t-test should be higher than 1.96 to get significant correlation and accept
the hypothesis. The standardized factor loading of structural model (γ) indicates
nature of relationship. If they are greater than zero, it means positive relationship.
If they are less than zero, it means negative relationships.
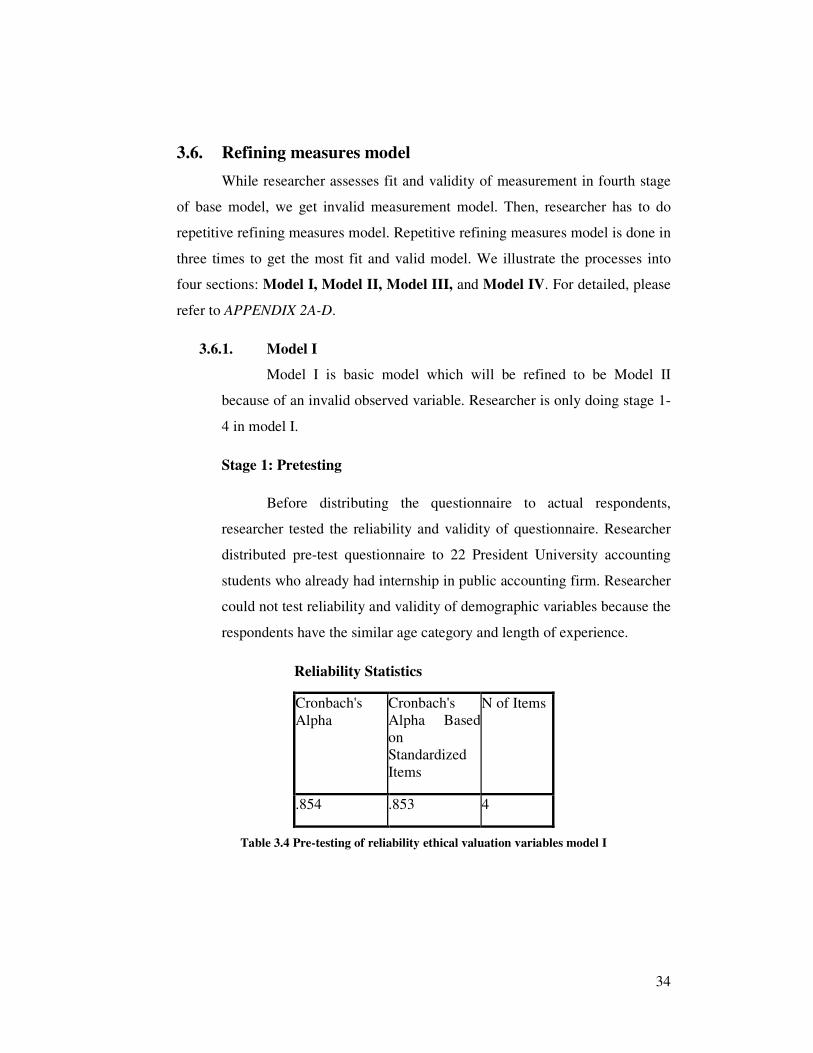
34
3.6. Refining measures model
While researcher assesses fit and validity of measurement in fourth stage
of base model, we get invalid measurement model. Then, researcher has to do
repetitive refining measures model. Repetitive refining measures model is done in
three times to get the most fit and valid model. We illustrate the processes into
four sections: Model I, Model II, Model III, and Model IV. For detailed, please
refer to APPENDIX 2A-D.
3.6.1. Model I
Model I is basic model which will be refined to be Model II
because of an invalid observed variable. Researcher is only doing stage 1-
4 in model I.
Stage 1: Pretesting
Before distributing the questionnaire to actual respondents,
researcher tested the reliability and validity of questionnaire. Researcher
distributed pre-test questionnaire to 22 President University accounting
students who already had internship in public accounting firm. Researcher
could not test reliability and validity of demographic variables because the
respondents have the similar age category and length of experience.
Reliability Statistics
Cronbach's
Alpha
Cronbach's
Alpha Based
on
Standardized
Items
N of Items
.854 .853 4
Table 3.4 Pre-testing of reliability ethical valuation variables model I

35
Reliability Statistics
Cronbach's
Alpha
Cronbach's
Alpha Based
on
Standardized
Items
N of Items
.755 .800 9
Table 3.5 Pre-testing of reliability ethical work climate variables model I
KMO and Bartlett's Test
Kaiser-Meyer-Olkin Measure of Sampling
Adequacy. .567
Bartlett's Test of
Sphericity
Approx. Chi-Square 182.470
Df 78
Sig. .000
Table 3.6 Pre-testing of validity model I
According to the result, ethical evaluation and ethical work climates
constructs show Conbach Alpha 85.3%, and 80%, respectively. Based on
Nunnaly criteria, the constructs are reliable. KMO = 0.567 indicates that
researcher could be continuing to do factor analysis.
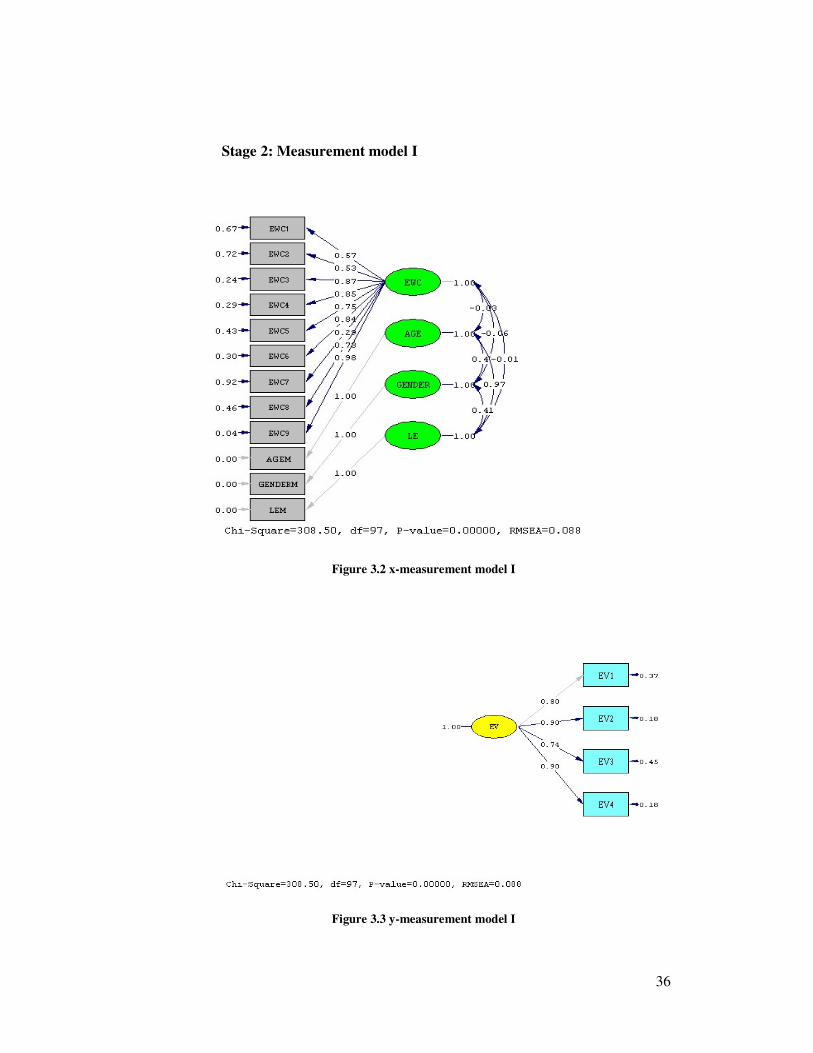
36
Stage 2: Measurement model I
Figure 3.2 x-measurement model I
Figure 3.3 y-measurement model I
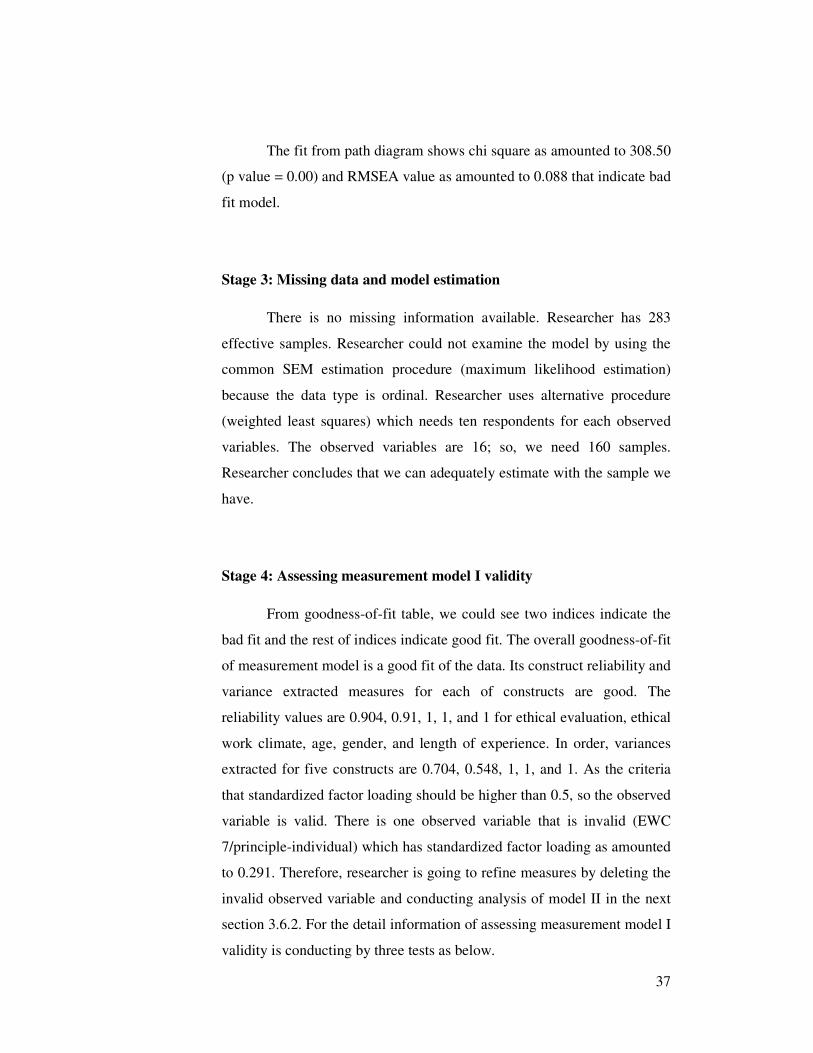
37
The fit from path diagram shows chi square as amounted to 308.50
(p value = 0.00) and RMSEA value as amounted to 0.088 that indicate bad
fit model.
Stage 3: Missing data and model estimation
There is no missing information available. Researcher has 283
effective samples. Researcher could not examine the model by using the
common SEM estimation procedure (maximum likelihood estimation)
because the data type is ordinal. Researcher uses alternative procedure
(weighted least squares) which needs ten respondents for each observed
variables. The observed variables are 16; so, we need 160 samples.
Researcher concludes that we can adequately estimate with the sample we
have.
Stage 4: Assessing measurement model I validity
From goodness-of-fit table, we could see two indices indicate the
bad fit and the rest of indices indicate good fit. The overall goodness-of-fit
of measurement model is a good fit of the data. Its construct reliability and
variance extracted measures for each of constructs are good. The
reliability values are 0.904, 0.91, 1, 1, and 1 for ethical evaluation, ethical
work climate, age, gender, and length of experience. In order, variances
extracted for five constructs are 0.704, 0.548, 1, 1, and 1. As the criteria
that standardized factor loading should be higher than 0.5, so the observed
variable is valid. There is one observed variable that is invalid (EWC
7/principle-individual) which has standardized factor loading as amounted
to 0.291. Therefore, researcher is going to refine measures by deleting the
invalid observed variable and conducting analysis of model II in the next
section 3.6.2. For the detail information of assessing measurement model I
validity is conducting by three tests as below.
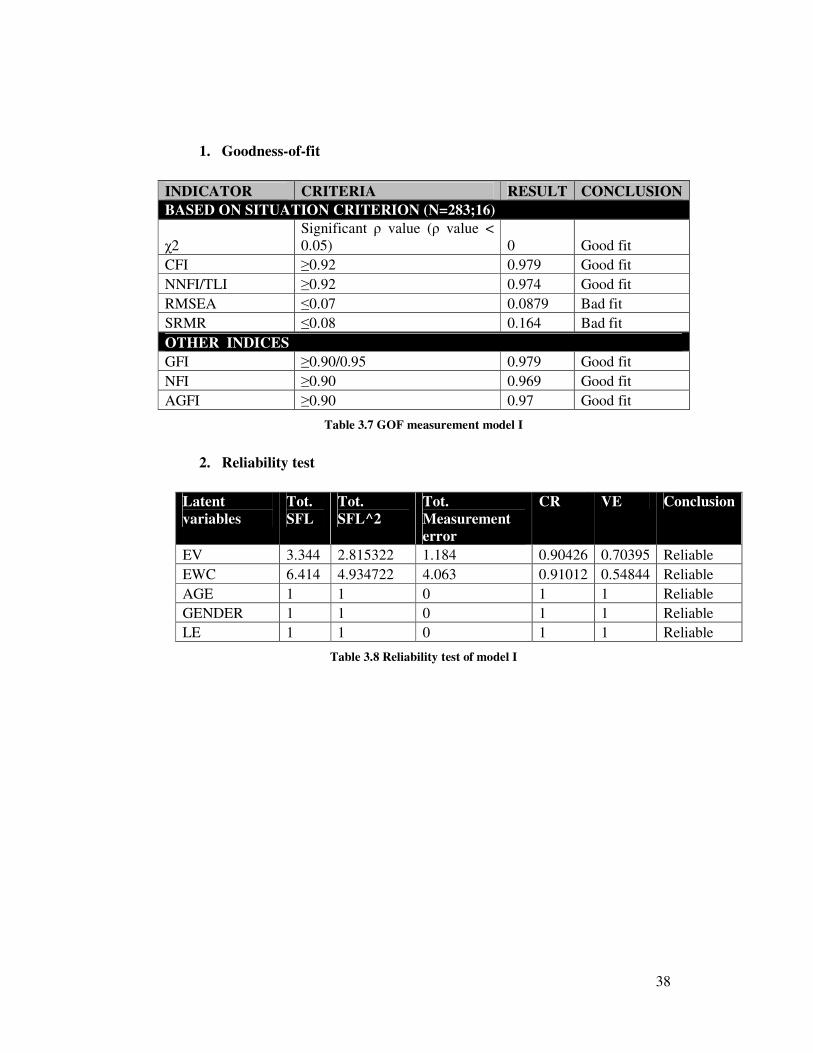
38
1. Goodness-of-fit
INDICATOR CRITERIA RESULT CONCLUSION
BASED ON SITUATION CRITERION (N=283;16)
χ2
Significant ρ value (ρ value <
0.05) 0 Good fit
CFI ≥0.92 0.979 Good fit
NNFI/TLI ≥0.92 0.974 Good fit
RMSEA ≤0.07 0.0879 Bad fit
SRMR ≤0.08 0.164 Bad fit
OTHER INDICES
GFI ≥0.90/0.95 0.979 Good fit
NFI ≥0.90 0.969 Good fit
AGFI ≥0.90 0.97 Good fit
Table 3.7 GOF measurement model I
2. Reliability test
Latent
variables
Tot.
SFL
Tot.
SFL^2
Tot.
Measurement
error
CR VE Conclusion
EV 3.344 2.815322 1.184 0.90426 0.70395 Reliable
EWC 6.414 4.934722 4.063 0.91012 0.54844 Reliable
AGE 1 1 0 1 1 Reliable
GENDER 1 1 0 1 1 Reliable
LE 1 1 0 1 1 Reliable
Table 3.8 Reliability test of model I
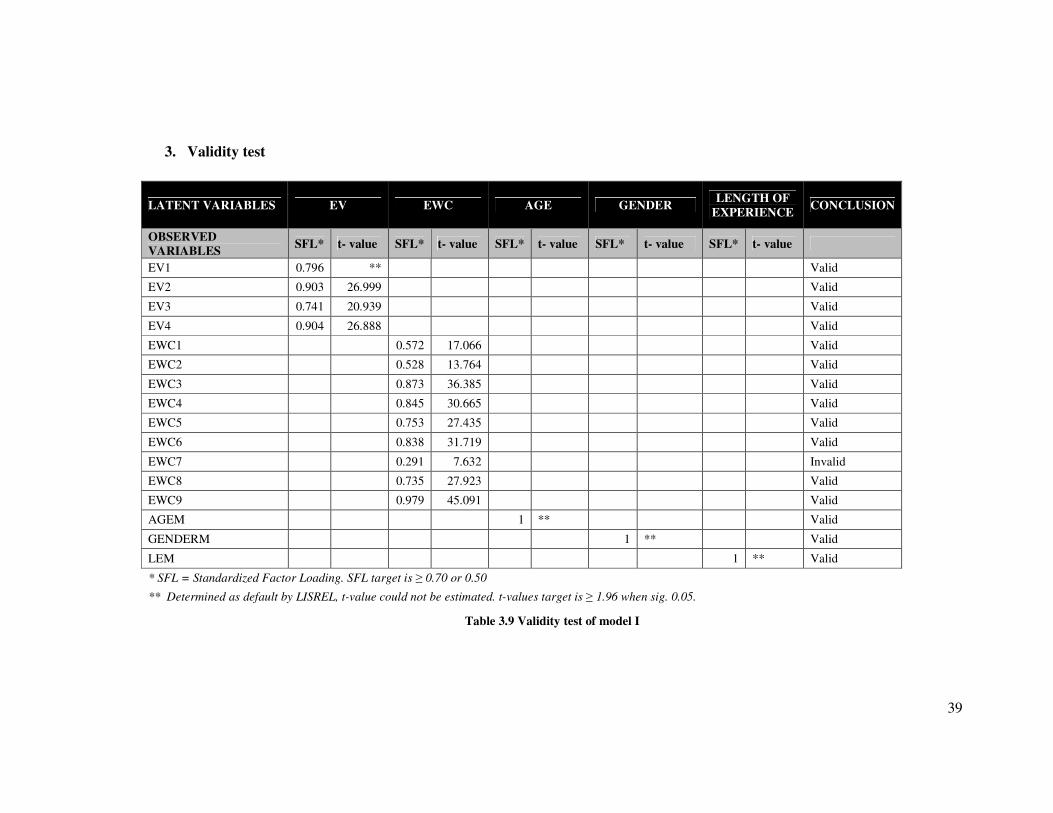
39
3. Validity test
LATENT VARIABLES EV EWC AGE GENDER LENGTH OF
EXPERIENCE CONCLUSION
OBSERVED
VARIABLES SFL* t- value SFL* t- value SFL* t- value SFL* t- value SFL* t- value
EV1 0.796 ** Valid
EV2 0.903 26.999 Valid
EV3 0.741 20.939 Valid
EV4 0.904 26.888 Valid
EWC1 0.572 17.066 Valid
EWC2 0.528 13.764 Valid
EWC3 0.873 36.385 Valid
EWC4 0.845 30.665 Valid
EWC5 0.753 27.435 Valid
EWC6 0.838 31.719 Valid
EWC7 0.291 7.632 Invalid
EWC8 0.735 27.923 Valid
EWC9 0.979 45.091 Valid
AGEM 1 ** Valid
GENDERM 1 ** Valid
LEM 1 ** Valid
* SFL = Standardized Factor Loading. SFL target is ≥ 0.70 or 0.50
** Determined as default by LISREL, t-value could not be estimated. t-values target is ≥ 1.96 when sig. 0.05.
Table 3.9 Validity test of model I

40
3.6.2. Model II
Due to time and cost barrier, the researcher uses the available data
and does refining measures model by deleting the invalid observed
variable (EWC 7/principle-individual) from model I.
Stage 1: Pretesting
Like as the model I, researcher does pretesting questionnaire to 22
accounting students in President University who have similar
demographic background.
Reliability Statistics
Cronbach's
Alpha
Cronbach's
Alpha Based
on
Standardized
Items
N of Items
.854 .853 4
Table 3.10 Pre-testing of reliability ethical evaluation variables model II
Reliability Statistics
Cronbach's
Alpha
Cronbach's
Alpha Based
on
Standardized
Items
N of Items
.827 .832 8
Table 3.11 Pre-testing of reliability ethical work climate variables model II
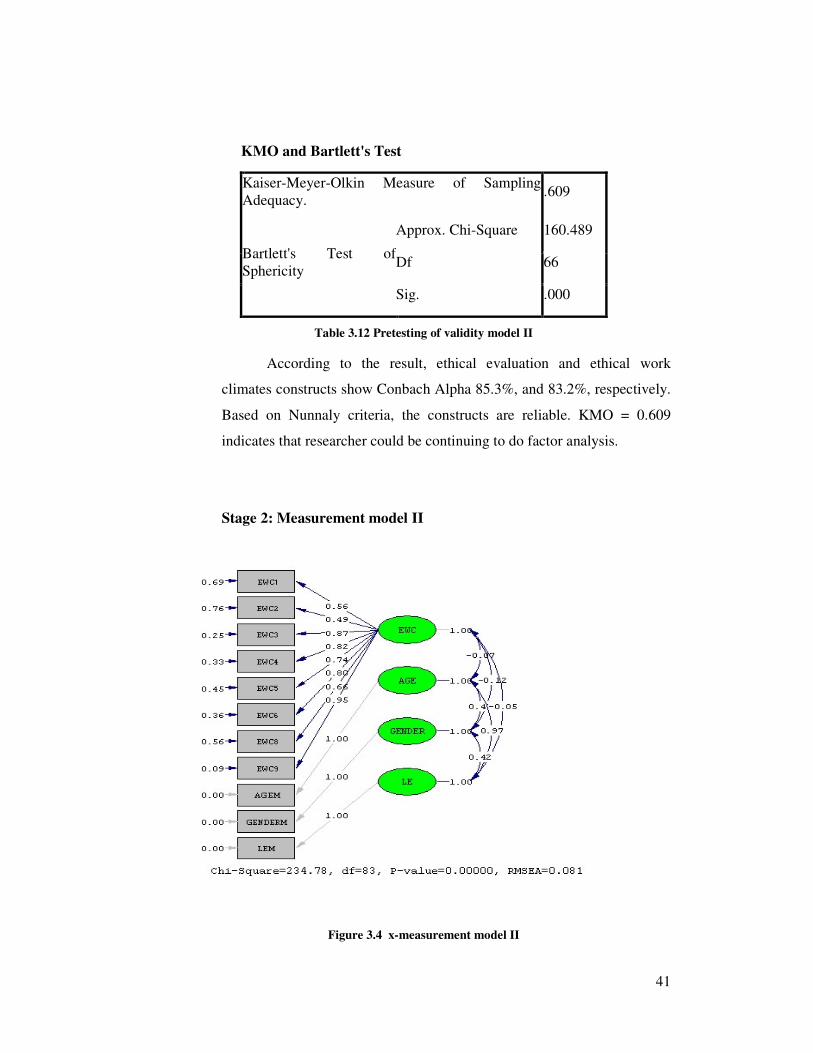
41
KMO and Bartlett's Test
Kaiser-Meyer-Olkin Measure of Sampling
Adequacy. .609
Bartlett's Test of
Sphericity
Approx. Chi-Square 160.489
Df 66
Sig. .000
Table 3.12 Pretesting of validity model II
According to the result, ethical evaluation and ethical work
climates constructs show Conbach Alpha 85.3%, and 83.2%, respectively.
Based on Nunnaly criteria, the constructs are reliable. KMO = 0.609
indicates that researcher could be continuing to do factor analysis.
Stage 2: Measurement model II
Figure 3.4 x-measurement model II
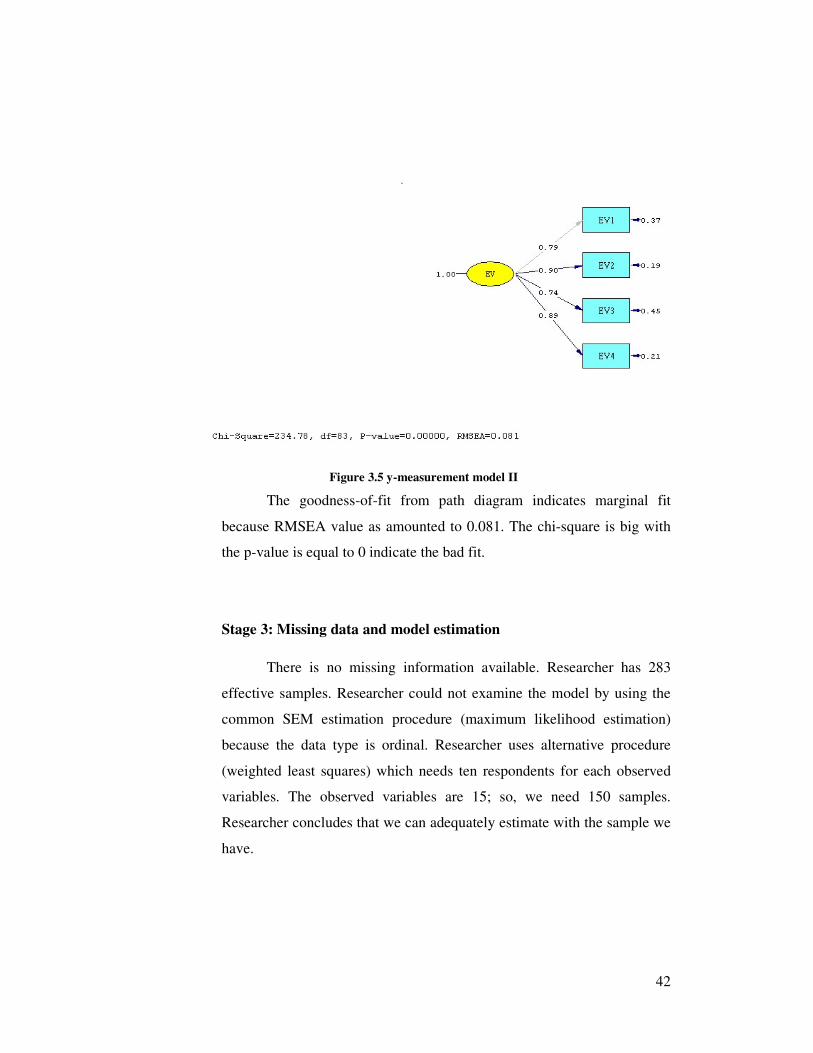
42
Figure 3.5 y-measurement model II
The goodness-of-fit from path diagram indicates marginal fit
because RMSEA value as amounted to 0.081. The chi-square is big with
the p-value is equal to 0 indicate the bad fit.
Stage 3: Missing data and model estimation
There is no missing information available. Researcher has 283
effective samples. Researcher could not examine the model by using the
common SEM estimation procedure (maximum likelihood estimation)
because the data type is ordinal. Researcher uses alternative procedure
(weighted least squares) which needs ten respondents for each observed
variables. The observed variables are 15; so, we need 150 samples.
Researcher concludes that we can adequately estimate with the sample we
have.
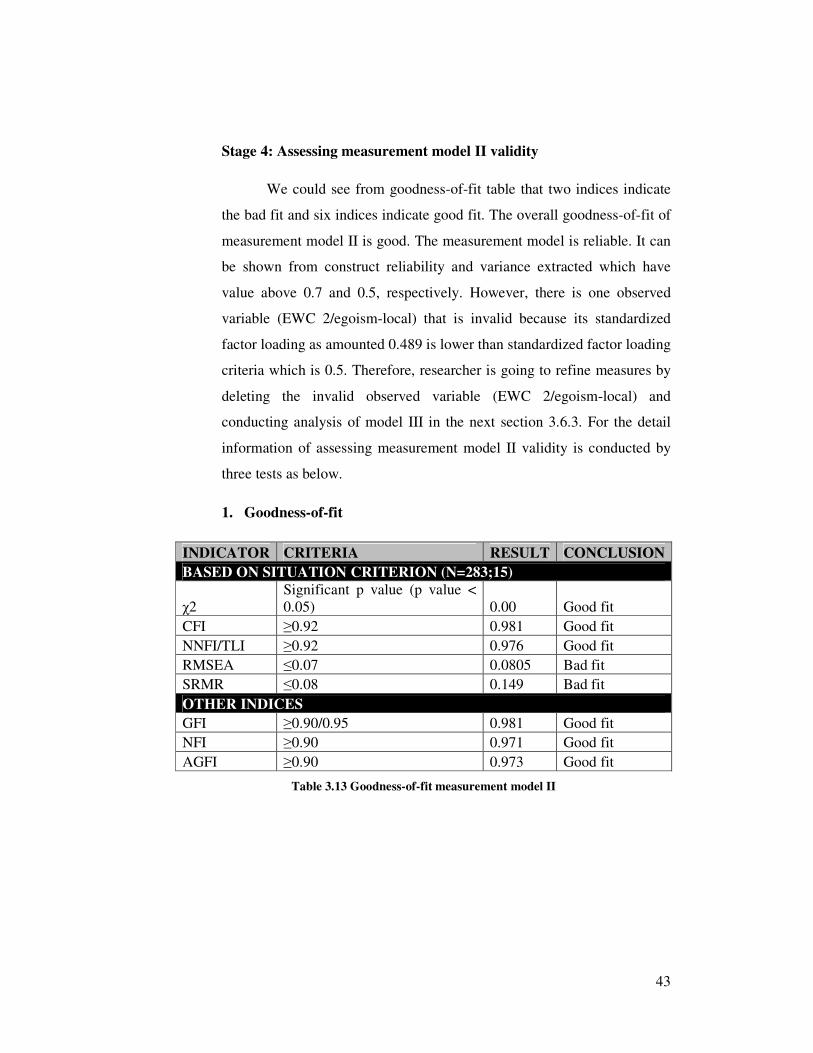
43
Stage 4: Assessing measurement model II validity
We could see from goodness-of-fit table that two indices indicate
the bad fit and six indices indicate good fit. The overall goodness-of-fit of
measurement model II is good. The measurement model is reliable. It can
be shown from construct reliability and variance extracted which have
value above 0.7 and 0.5, respectively. However, there is one observed
variable (EWC 2/egoism-local) that is invalid because its standardized
factor loading as amounted 0.489 is lower than standardized factor loading
criteria which is 0.5. Therefore, researcher is going to refine measures by
deleting the invalid observed variable (EWC 2/egoism-local) and
conducting analysis of model III in the next section 3.6.3. For the detail
information of assessing measurement model II validity is conducted by
three tests as below.
1. Goodness-of-fit
INDICATOR CRITERIA RESULT CONCLUSION
BASED ON SITUATION CRITERION (N=283;15)
χ2
Significant p value (p value <
0.05) 0.00 Good fit
CFI ≥0.92 0.981 Good fit
NNFI/TLI ≥0.92 0.976 Good fit
RMSEA ≤0.07 0.0805 Bad fit
SRMR ≤0.08 0.149 Bad fit
OTHER INDICES
GFI ≥0.90/0.95 0.981 Good fit
NFI ≥0.90 0.971 Good fit
AGFI ≥0.90 0.973 Good fit
Table 3.13 Goodness-of-fit measurement model II

44
2. Reliability test
Latent
variables
Tot.
SFL
Tot.
SFL^2
Tot.
Measureme
nt error
CR VE Conclusio
n
EV 3.323 2.77908
9
1.221 0.90043
5
0.69475
7
Reliable
EWC 5.891 4.51023
1
3.488 0.90867
2
0.56390
4
Reliable
AGE 1 1 0 1 1 Reliable
GENDER 1 1 0 1 1 Reliable
LE 1 1 0 1 1 Reliable
Table 3.14 Reliability test of measurement model II

45
3. Validity test
LATENT
VARIABLES EV EWC AGE GENDER
LENGTH OF
EXPERIENCE CONCLUSION
OBSERVED
VARIABLES SFL* t- value SFL* t- value SFL* t- value SFL* t- value SFL* t- value
EV1 0.792 ** Valid
EV2 0.902 23.324 Valid
EV3 0.739 17.913 Valid
EV4 0.89 22.504 Valid
EWC1 0.56 15.234 Valid
EWC2 0.489 11.699 Invalid
EWC3 0.866 31.432 Valid
EWC4 0.818 26.155 Valid
EWC5 0.739 24.634 Valid
EWC6 0.802 25.685 Valid
EWC8 0.664 20.896 Valid
EWC9 0.953 38.606 Valid
AGEM 1 ** Valid
GENDERM 1 ** Valid
LEM - 1 ** Valid
* SFL = Standardized Factor Loadings. SFL target is ≥ 0.70 or 0.50
** Determined as default by LISREL, t-value could not be estimated. t-values target is ≥ 1.96 when sig. 0.05.
Table 3.15 Validity test of model II

46
3.6.3. Model III
Model III is as the result of refining model II which has invalid
observed variable of ethical work climate constructs (EWC 2/egoism-
local).
Step 1: Pretesting
Pretesting is conducting for testing validity and reliability of
variables before distributing to actual respondents. Researcher uses the
pretest data from model I and deletes the invalid variables from previous
model (EWC 2/egoism-local and EWC 7/principle-cosmopolitan).
Reliability Statistics
Cronbach's
Alpha
Cronbach's
Alpha Based
on
Standardized
Items
N of Items
.854 .853 4
Table 3.16 Pre-testing of reliability ethical evaluation variables model III
Reliability Statistics
Cronbach's
Alpha
Cronbach's
Alpha Based
on
Standardized
Items
N of Items
.832 .845 7
Table 3.17 Pre-testing of reliability ethical work climate variables model III
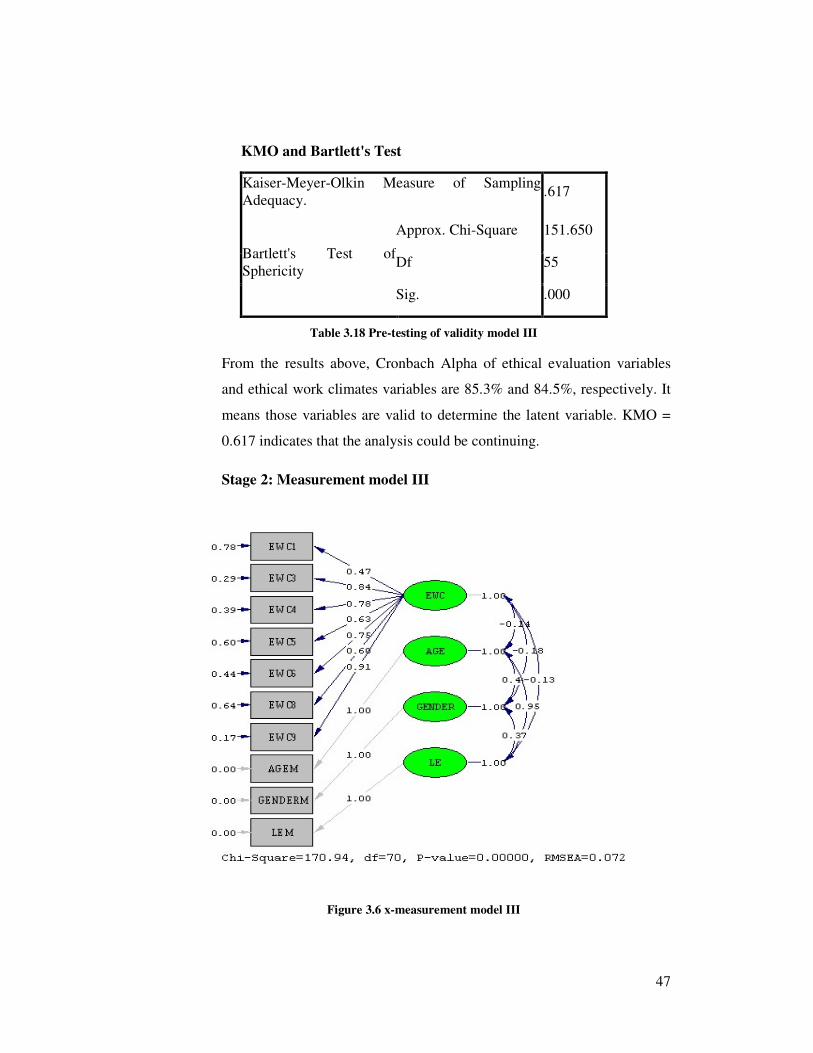
47
KMO and Bartlett's Test
Kaiser-Meyer-Olkin Measure of Sampling
Adequacy. .617
Bartlett's Test of
Sphericity
Approx. Chi-Square 151.650
Df 55
Sig. .000
Table 3.18 Pre-testing of validity model III
From the results above, Cronbach Alpha of ethical evaluation variables
and ethical work climates variables are 85.3% and 84.5%, respectively. It
means those variables are valid to determine the latent variable. KMO =
0.617 indicates that the analysis could be continuing.
Stage 2: Measurement model III
Figure 3.6 x-measurement model III

48
Figure 3.7 y-measurement model III
The chi square of path diagram is still big but it is smaller than the
chi square of previous models (model I and model II) indicates that the
model is better than previous models. The RMSEA as amounted to 0.0072
indicates good fit model.
Stage 3: Missing data and model estimation
There is no missing information available. Researcher has 283
effective samples. Researcher uses alternative procedure (weighted least
squares) which needs ten respondents for each observed variables. The
observed variables are 14; so, we need 140 samples. Researcher concludes
that we can adequately estimate with the sample we have.
Stage 4: Assessing measurement model III validity
We could see from goodness-of-fit table that two indices indicate
bad fit and six indices indicate good fit. Researcher concludes that the
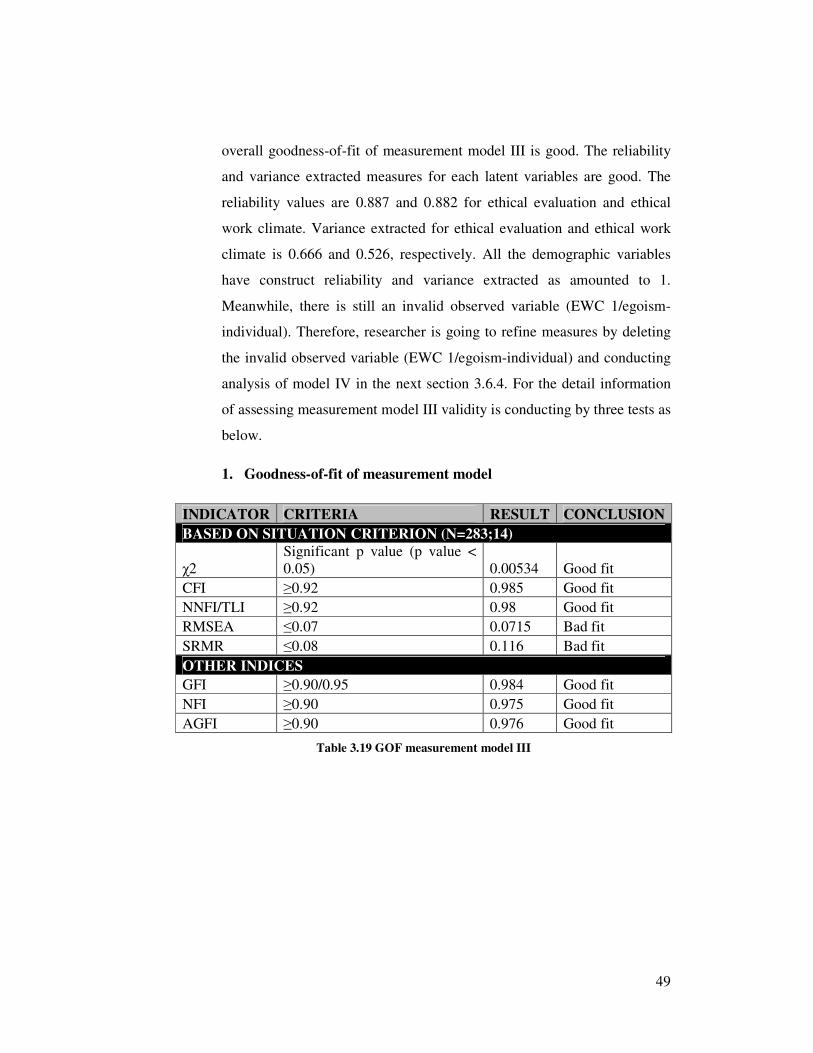
49
overall goodness-of-fit of measurement model III is good. The reliability
and variance extracted measures for each latent variables are good. The
reliability values are 0.887 and 0.882 for ethical evaluation and ethical
work climate. Variance extracted for ethical evaluation and ethical work
climate is 0.666 and 0.526, respectively. All the demographic variables
have construct reliability and variance extracted as amounted to 1.
Meanwhile, there is still an invalid observed variable (EWC 1/egoism-
individual). Therefore, researcher is going to refine measures by deleting
the invalid observed variable (EWC 1/egoism-individual) and conducting
analysis of model IV in the next section 3.6.4. For the detail information
of assessing measurement model III validity is conducting by three tests as
below.
1. Goodness-of-fit of measurement model
INDICATOR CRITERIA RESULT CONCLUSION
BASED ON SITUATION CRITERION (N=283;14)
χ2
Significant p value (p value <
0.05) 0.00534 Good fit
CFI ≥0.92 0.985 Good fit
NNFI/TLI ≥0.92 0.98 Good fit
RMSEA ≤0.07 0.0715 Bad fit
SRMR ≤0.08 0.116 Bad fit
OTHER INDICES
GFI ≥0.90/0.95 0.984 Good fit
NFI ≥0.90 0.975 Good fit
AGFI ≥0.90 0.976 Good fit
Table 3.19 GOF measurement model III
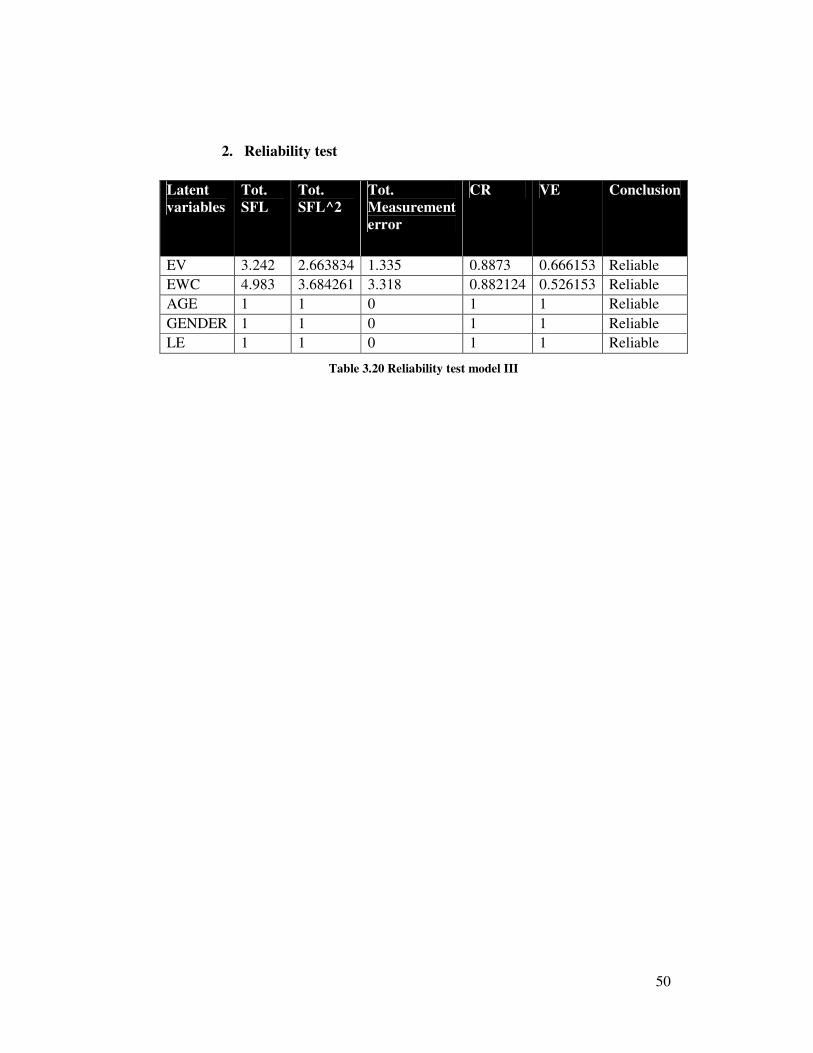
50
2. Reliability test
Latent
variables
Tot.
SFL
Tot.
SFL^2
Tot.
Measurement
error
CR VE Conclusion
EV 3.242 2.663834 1.335 0.8873 0.666153 Reliable
EWC 4.983 3.684261 3.318 0.882124 0.526153 Reliable
AGE 1 1 0 1 1 Reliable
GENDER 1 1 0 1 1 Reliable
LE 1 1 0 1 1 Reliable
Table 3.20 Reliability test model III

51
3. Validity test
LATENT VARIABLES EV EWC AGE GENDER LENGTH OF
EXPERIENCE
CONCLUSION
OBSERVED
VARIABLES
SFL* t- value SFL* t- value SFL* t- value SFL* t- value SFL* t- value
EV1 0.763 ** Valid
EV2 0.891 21.863 Valid
EV3 0.678 15.903 Valid
EV4 0.91 20.482 Valid
EWC1 0.473 10.235 Invalid
EWC3 0.84 27.747 Valid
EWC4 0.78 21.825 Valid
EWC5 0.629 16.197 Valid
EWC6 0.749 21.109 Valid
EWC8 0.603 16.282 Valid
EWC9 0.909 32.216 Valid
AGEM 1 ** Valid
GENDERM 1 ** Valid
LEM 1 ** Valid
* SFL = Standardized Factor Loadings. SFL target is ≥ 0.70 or 0.50
** Determined as default by LISREL, t-value could not be estimated. t-values target is ≥ 1.96 when sig. 0.05.
Table 3.21 Validity test of measurement model III
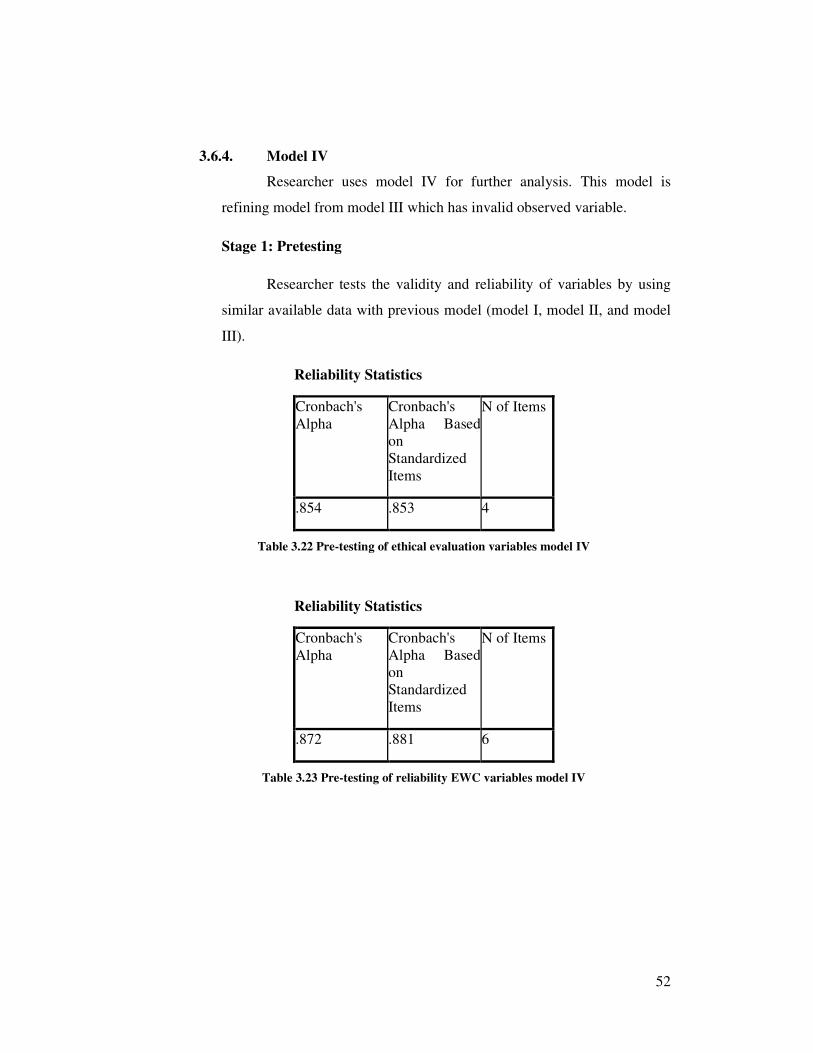
52
3.6.4. Model IV
Researcher uses model IV for further analysis. This model is
refining model from model III which has invalid observed variable.
Stage 1: Pretesting
Researcher tests the validity and reliability of variables by using
similar available data with previous model (model I, model II, and model
III).
Reliability Statistics
Cronbach's
Alpha
Cronbach's
Alpha Based
on
Standardized
Items
N of Items
.854 .853 4
Table 3.22 Pre-testing of ethical evaluation variables model IV
Reliability Statistics
Cronbach's
Alpha
Cronbach's
Alpha Based
on
Standardized
Items
N of Items
.872 .881 6
Table 3.23 Pre-testing of reliability EWC variables model IV

53
KMO and Bartlett's Test
Kaiser-Meyer-Olkin Measure of Sampling
Adequacy. .648
Bartlett's Test of
Sphericity
Approx. Chi-Square 145.303
Df 45
Sig. .000
Table 3.24 Pre-testing validity model IV
By comparing the result with prior model, the Cronbach Alpha of
ethical work climate variables (EWC 3/egoism-cosmopolitan, EWC
4/benevolence-individual, EWC 5/benevolence-local, EWC
6/benevolence-cosmopolitan, EWC 8/principle-local, and EWC
9/principle-cosmopolitan) is increasing than the Cronbach Alpha of
ethical work climate in the previous models. That means the reliability of
construct ethical work climate is higher than previous construct which is
88.1%. Because the ethical evaluation uses similar indicator with previous
constructs, the Cronbach Alpha is same as amounted to 85.3% that
indicates the reliability among indicators. According to KMO result which
is 0.648, it indicates the analysis could be analyzed further.
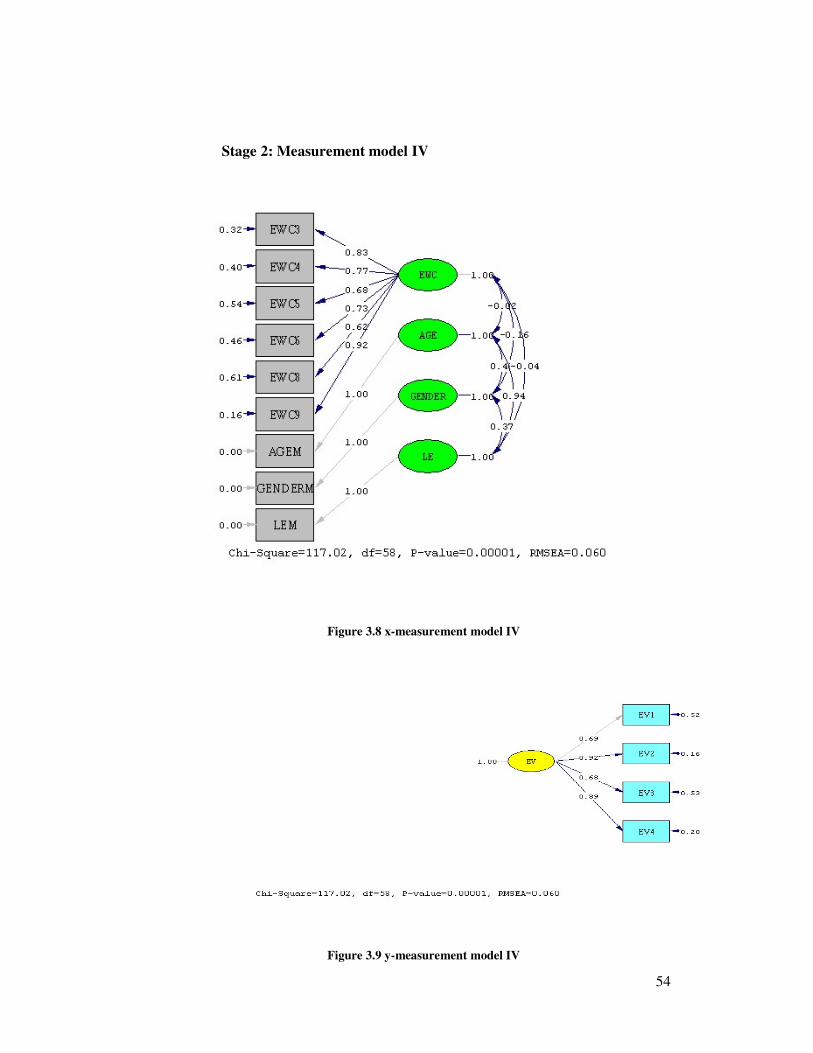
54
Stage 2: Measurement model IV
Figure 3.8 x-measurement model IV
Figure 3.9 y-measurement model IV
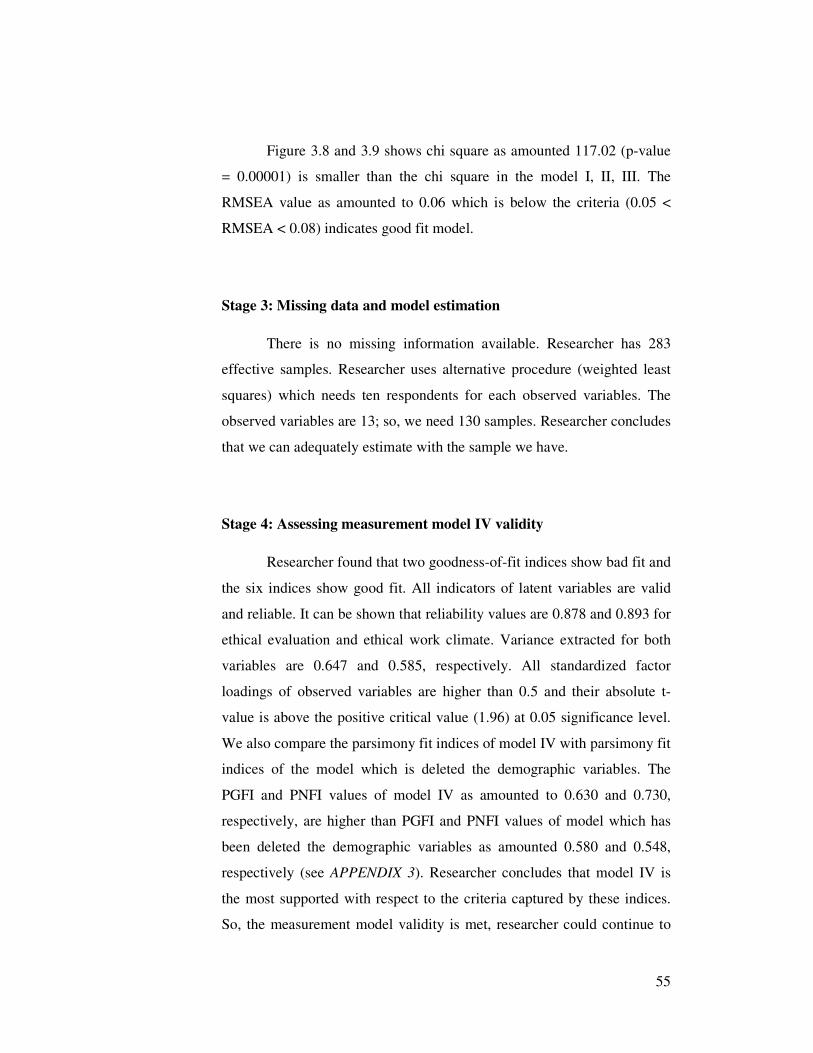
55
Figure 3.8 and 3.9 shows chi square as amounted 117.02 (p-value
= 0.00001) is smaller than the chi square in the model I, II, III. The
RMSEA value as amounted to 0.06 which is below the criteria (0.05 <
RMSEA < 0.08) indicates good fit model.
Stage 3: Missing data and model estimation
There is no missing information available. Researcher has 283
effective samples. Researcher uses alternative procedure (weighted least
squares) which needs ten respondents for each observed variables. The
observed variables are 13; so, we need 130 samples. Researcher concludes
that we can adequately estimate with the sample we have.
Stage 4: Assessing measurement model IV validity
Researcher found that two goodness-of-fit indices show bad fit and
the six indices show good fit. All indicators of latent variables are valid
and reliable. It can be shown that reliability values are 0.878 and 0.893 for
ethical evaluation and ethical work climate. Variance extracted for both
variables are 0.647 and 0.585, respectively. All standardized factor
loadings of observed variables are higher than 0.5 and their absolute t-
value is above the positive critical value (1.96) at 0.05 significance level.
We also compare the parsimony fit indices of model IV with parsimony fit
indices of the model which is deleted the demographic variables. The
PGFI and PNFI values of model IV as amounted to 0.630 and 0.730,
respectively, are higher than PGFI and PNFI values of model which has
been deleted the demographic variables as amounted 0.580 and 0.548,
respectively (see APPENDIX 3). Researcher concludes that model IV is
the most supported with respect to the criteria captured by these indices.
So, the measurement model validity is met, researcher could continue to
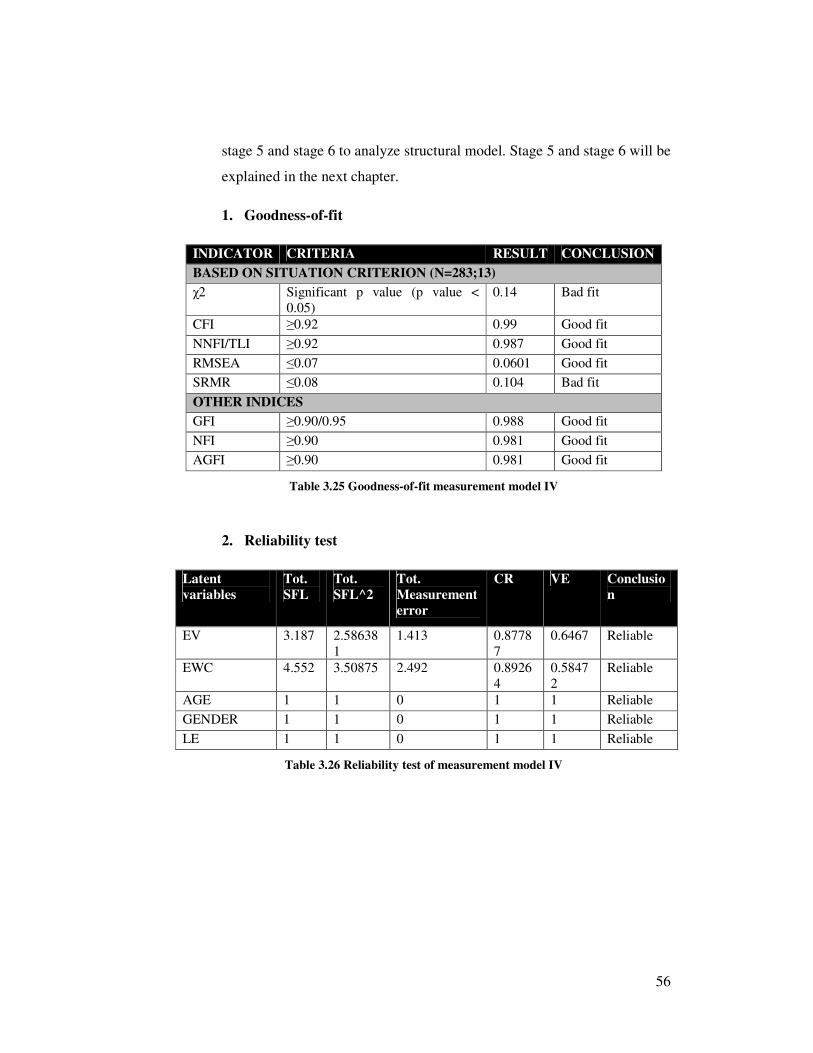
56
stage 5 and stage 6 to analyze structural model. Stage 5 and stage 6 will be
explained in the next chapter.
1. Goodness-of-fit
INDICATOR CRITERIA RESULT CONCLUSION
BASED ON SITUATION CRITERION (N=283;13)
χ2 Significant p value (p value <
0.05) 0.14 Bad fit
CFI ≥0.92 0.99 Good fit
NNFI/TLI ≥0.92 0.987 Good fit
RMSEA ≤0.07 0.0601 Good fit
SRMR ≤0.08 0.104 Bad fit
OTHER INDICES
GFI ≥0.90/0.95 0.988 Good fit
NFI ≥0.90 0.981 Good fit
AGFI ≥0.90 0.981 Good fit
Table 3.25 Goodness-of-fit measurement model IV
2. Reliability test
Latent
variables Tot.
SFL Tot.
SFL^2 Tot.
Measurement
error
CR VE Conclusio
n
EV 3.187 2.58638
1 1.413 0.8778
7 0.6467 Reliable
EWC 4.552 3.50875 2.492 0.8926
4 0.5847
2 Reliable
AGE 1 1 0 1 1 Reliable
GENDER 1 1 0 1 1 Reliable
LE 1 1 0 1 1 Reliable
Table 3.26 Reliability test of measurement model IV
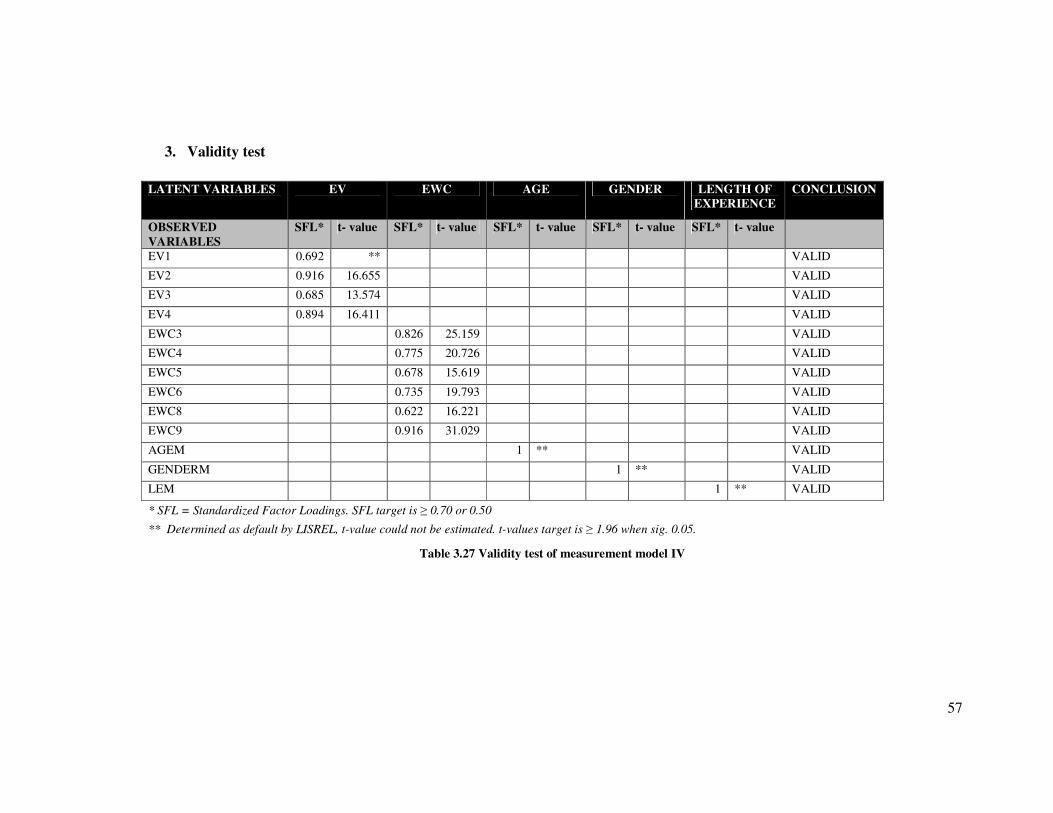
57
3. Validity test
LATENT VARIABLES EV EWC AGE GENDER LENGTH OF
EXPERIENCE
CONCLUSION
OBSERVED
VARIABLES
SFL* t- value SFL* t- value SFL* t- value SFL* t- value SFL* t- value
EV1 0.692 ** VALID
EV2 0.916 16.655 VALID
EV3 0.685 13.574 VALID
EV4 0.894 16.411 VALID
EWC3 0.826 25.159 VALID
EWC4 0.775 20.726 VALID
EWC5 0.678 15.619 VALID
EWC6 0.735 19.793 VALID
EWC8 0.622 16.221 VALID
EWC9 0.916 31.029 VALID
AGEM 1 ** VALID
GENDERM 1 ** VALID
LEM 1 ** VALID
* SFL = Standardized Factor Loadings. SFL target is ≥ 0.70 or 0.50
** Determined as default by LISREL, t-value could not be estimated. t-values target is ≥ 1.96 when sig. 0.05.
Table 3.27 Validity test of measurement model IV
58
3.7. Hypothesis Testing
As discussed in the section 3.5., researcher tests the hypothesis by using t-
test after measurement model and structural model is valid.
3.6.1 T-test
The t-value is the value of the t-test statistic that the corresponding
parameter is equal to zero. Practically, if the sample size is large,
researcher can evaluate the obtained t-value, shown on LISREL printout,
against the critical value of z researcher selects based upon researcher
choice of significant level. If absolute t-value is larger than the positive
critical value, the null hypothesis is rejected and the conclusion is that the
parameter is significantly different from zero. (Output question)
3.8. Limitations
Researcher experiences difficulties while gathering data. Several public
accounting firms rejected my questionnaire and got non-responses of few
questionnaires due to high season and their policies to not receive any
questionnaires. Many of public accounting firms gave positive feedback.
Researcher can get sufficient data for doing analysis of model although it is
taking time so long.
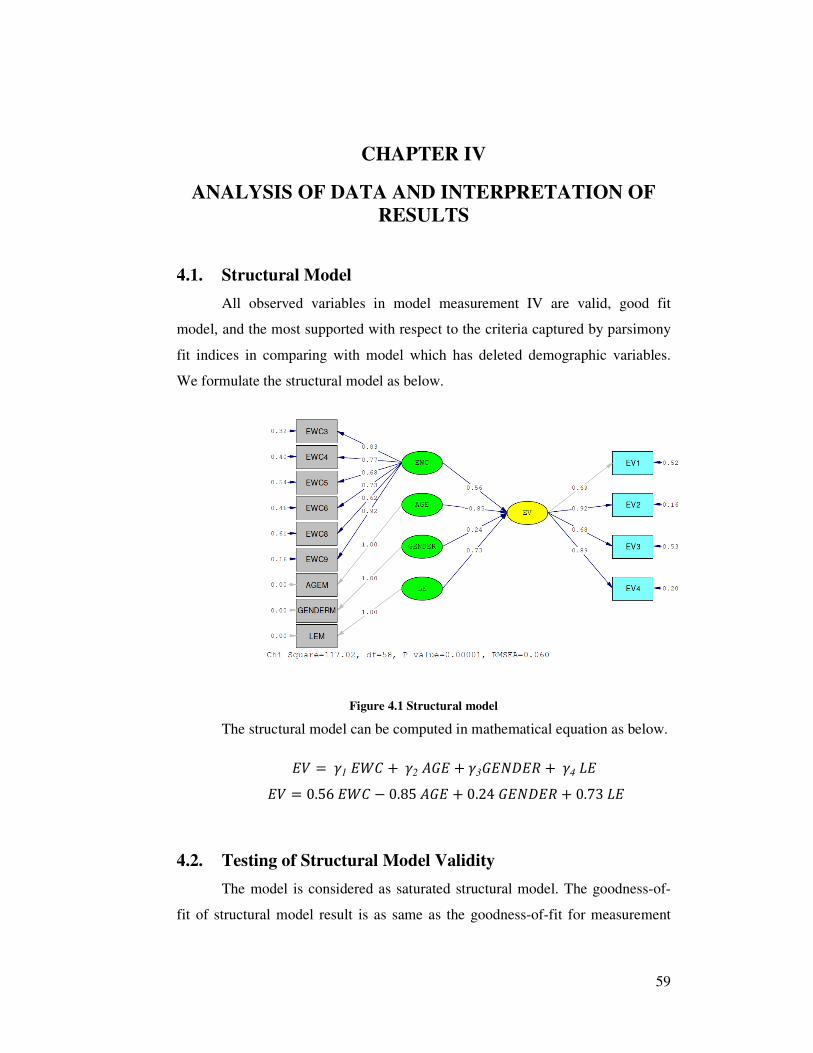
59
CHAPTER IV
ANALYSIS OF DATA AND INTERPRETATION OF
RESULTS
4.1. Structural Model
All observed variables in model measurement IV are valid, good fit
model, and the most supported with respect to the criteria captured by parsimony
fit indices in comparing with model which has deleted demographic variables.
We formulate the structural model as below.
Figure 4.1 Structural model
The structural model can be computed in mathematical equation as below.
$% = &1 $'� + &2 ()$ + &3)$*+$, + &4 -$
$% = 0.56 $'� − 0.85 ()$ + 0.24 )$*+$, + 0.73 -$
4.2. Testing of Structural Model Validity
The model is considered as saturated structural model. The goodness-of-
fit of structural model result is as same as the goodness-of-fit for measurement
60
model result. The goodness-of-fit for measurement results good fit model, so does
structural model.
4.3. Hypothesis Testing
T-test on principals shows how far the influence of one exogenous
variable toward endogenous variable. The criteria to take the decision is if the
absolute obtained t-value is higher than the positive critical value of z researcher
selects based upon the choice of significance level, the null hypothesis is rejected
and the parameter is significant. Researcher chooses the significant level at 0.05
which has critical value ±1.96. The absolute t-value of all parameters should be
above 1.96. Table 4.1 below shows the t-value each parameters and its gamma (γ)
coefficients for each relationship between an exogenous variable and an
endogenous variable.
PARAMETERS γ t-value
EWC → EV 0.559 8.094
AGE → EV -0.847 -1.127
GENDER → EV 0.238 1.604
LE → EV 0.732 1.052
Table 4.1 t-value result
The table above shows only ethical work climate as exogenous variable
has significant influence on ethical evaluation. The researcher presents the result
as follows.
1. First hypothesis
H0 : Ethical work climate has insignificant influence on ethical
evaluation.
Ha/H1 : Ethical work climate has significant influence on ethical
evaluation.
EWC t statistic value (8.094) is on rejected area when the critical
value at 1.96. Statistically, hypothesis H0 is rejected. It means that ethical
61
work climate has significant influence on auditors’ ethical evaluation in
context of time and cost pressure.
2. Second hypothesis
H0 : Age has insignificant influence on ethical evaluation.
Ha/H2 : Age has significant influence on ethical evaluation.
AGE t statistic value (-1.127) is on accepted area when the critical
value at 1.96. Statistically, hypothesis H0 is accepted. It means that age
has insignificant influence on auditors’ ethical evaluation in context of
time and cost pressure.
3. Third hypothesis
H0 : Gender has insignificant influence on ethical evaluation.
Ha/H3 : Gender has significant influence on ethical evaluation.
GENDER t statistic value (1.604) is on accepted area when the
critical value at 1.96. Statistically, hypothesis H0 is accepted. It means that
gender has insignificant influence on auditors’ ethical evaluation in
context of time and cost pressure.
4. Fourth hypothesis
H0 : Length of experience has insignificant influence on ethical
evaluation.
Ha/H4 : Length of experience has significant influence on ethical
evaluation.
LE t statistic value (1.052) is on accepted area when the critical
value at 1.96. Statistically, hypothesis H0 is accepted. It means that length
of experience has insignificant influence on auditors’ ethical evaluation in
context of time and cost pressure.

62
4.4. Data Interpretation
4.4.1. The influence ethical work climate on ethical evaluation
The public accounting firms in Java Island identified six climates
that were statistically significant – efficiency, friendship, team interest,
social responsibility/public interest, company rules and procedures, and
laws and professional codes. Laws and professional codes climate is the
most strongly perceived ethical climate that emerged as the predominant
factor. It is not surprising because accounting firms and their employees
(auditors) consider law and professional code to be important in their
practice. Auditors considered company’s rules and procedures to
implement in their practice. The auditors in Java area perceived
benevolent ethical climate that employees perceive that decisions are
made based on an overarching concern for the well-being of their
company. Egoism/individual (self interest) and egoism/local (company
profit) climates do not exist in public accounting firms reflects the
auditors to not focus on auditors’ self interest and public accounting firm’s
interest. Moreover, the employees of public accounting firms are expected
to work efficiently.
Based on the hypothesis testing result, factor loading between
ethical work climate and auditors’ ethical evaluation is 0.559 and t-value
is 8.094. The result indicates ethical work climate with six dimensions has
significant influence positively on auditors’ ethical evaluation in the
context of time and cost pressure. When auditors are more perceived the
six ethical work climates, the auditors will be better to evaluate what is
right or wrong ethically.
63
4.4.2. The influence specified demographic variables (age, gender,
and length of experience) on ethical evaluation
In hypothesis result, the parameter of the influence age on
auditors’ ethical evaluation has factor loading as amounted to -0.847 and
t-value as amounted to -1.127. It indicates that age has insignificant
influence negatively on auditors’ ethical evaluation in context of cost and
time pressure. Other words, increasing age will decrease insignificantly
the ability to evaluate ethical action. It is contradictive with the previous
researches that stated older people are more ethical than younger people.
For further analysis, we can see in APPENDIX 4, auditors who are
younger than 25 years old have higher ethical evaluation in case 2 and
case 4, meanwhile, auditors who are older than or equal to 25 years old
have higher ethical evaluation in case 1 and 4. Thus, age gives no impact
on auditors’ ethical evaluation.
Hypothesis 3 stated that gender has significant influence on
auditors’ ethical evaluation. But, the hypothesis is rejected because its
factor loading is 0.238 and its t-value is 1.604 which is below than critical
value at 0.05 significant levels. Researcher concludes that gender has
insignificant positively influence on ethical evaluation statistically. From
table in APPENDIX 4, we could see that males have higher ethical
evaluation ability than females in case 1, 2, and 4. This finding is
supported by Dubinsky & Levy (1985), Radtke (2000) and Armstrong
(1987). They also found that males have greater ethical evaluation ability
than females. In APPENDIX 4, we can see females have greater ethical
evaluation than females in case 3. It is consistent with numbers of
previous researches that found females have higher ethical decision
making than males. The inconsistency of ethical evaluation among cases
indicates males and females may have great ethical evaluation.
Researcher hypothesize that length of experience will have
significant influence on auditors’ ethical evaluation. However, the result
has different answer for the fourth hypothesis. In table 4.1, the factor
64
loading of the parameter is 0.732 and its t-value is 1.052. It means length
of experience has insignificant positively influence on ethical evaluation.
The greater experience is associated with increasing ability to evaluate
ethical action insignificantly in context of cost and time pressure. The
result is consistent with the Glover, Bumpus, Sharp, & Munchus (2002)
and Lehnert, Park, & Singh (2015) finding that there is a positive
relationship between years of management experience and ethical choice.
Researcher also analyzes the impact of experience on ethical evaluation by
dividing sample into two groups (experience less than 2 years and
experience more than or equal to 2 years). It shows on table in
APPENDIX 4 that auditors who have experience more than 2 years have
higher ethical evaluation ability than auditors who have experience less
than 2 years. It is consistent with Martinov-Bennie & Pflugrath (2009)
finding. They found greater task-specific experience provides more
significantly higher quality technical judgments than those with lower
levels of task-specific experience.
In the age categorical, case 4 has the highest means (4.023 for age
< 25 years old and 4.019 for age ≥ 25 years old) and case 3 has the lowest
means (3.32 for age < 25 years old and 3.343 for age ≥ 25 years old) than
the other cases. By observing the highest and lowest score of cases among
gender groups, case 4 shows the highest means (3.986 for female and
4.059 for male) and case 3 shows the lowest means (3.34 for female and
3.316 for male). We can conclude that female and male auditors evaluate
that PSO is the most unethical act and URT is the least unethical act than
other cases. The auditors who have length of experience is less than 2
years and more than 2 years also evaluate that PSO is the most unethical
act and URT is the least unethical act by observing the lowest and highest
score of the groups. As overall, auditors evaluate that PSO is the most
unethical act and URT is the least unethical act than other cases (biasing
sample selection and over-reliance on client work cases). It is consistent
with previous studies which suggest that auditors evaluate PSO as being a

65
more unacceptable behavior than some other types of QTB (Sweeney,
Arnold, & Pierce, 2010) and URT were less severe (Sweeney & Pierce,
2006).

66
CHAPTER V
CONCLUSIONS AND RECOMMENDATIONS
5.1. Conclusion
Based on the analysis, test result, and discussion in chapter IV, researcher
summarizes the conclusion as follows.
1. Efficiency, friendship, team interest, social responsibility/public interest,
company rules and procedures, and laws and professional codes climates
have significant influence on auditors’ ethical evaluation. The auditors
should perceived this six climates in their company to increase their
ethical evaluation.
2. Age has no influence on auditors’ ethical evaluation. Ethical evaluation is
not affected of auditors’ age.
3. Gender has no influence on auditors’ ethical evaluation. Ethical evaluation
is not affected of auditors’ gender type.
4. Length of experience has insignificant influence on auditors’ ethical
evaluation. Even though it is insignificant, auditors who have more
experience will have greater ethical evaluation than auditors who have less
experience.
5.2. Recommendations
For future improvement, researcher proposes some recommendations to
several parties as follows.
5.2.1. Future researchers
The findings indicate a need for future research, including
consideration of ethical sensitivity of the behaviors. The ethical sensitivity
is the important key to recognize the existence of ethical issues. Once
people can be aware of ethical issues, they will be able to evaluate the

67
issues. Finding in this study are based on responses to hypothetical
scenarios, and this method of data collection does not capture the pressure
of ethical evaluation in the real audit environment. Future research should
conduct the research by using qualitative method (interview) for capturing
the real condition. Researcher suggests comparing of the variables
impacting on ethical decision making for multiple employment levels
within accounting firms. Future researches are needed on other factors
which impact ethical evaluation such as perceived ethical intensity and
training. Furthermore, interaction between independents variables should
be considered.
5.2.2. External auditors
Based on the result, auditor should perceive higher ethical work
climate which composed by efficiency, friendship, team interest, social
responsibility/public interest, company rules and procedures, and laws and
professional codes because these climates have significantly influence in
their ability to evaluate ethical act statistically. Auditors have moderate
ability to evaluate ethical act in case 1, 2, and 3. They suppose to increase
their ethical evaluation by ethical training.
5.2.3. Public accounting firms
Public accounting also should provide training for their auditors
for increasing their technical and ethical skills. Technical and ethical skills
are considered to be important in solving ethical dilemma.
REFERENCES
AICPA. (2009). AICPA Professional Standards, American Institute of Certified
Public Accountant Vol. II. New York, NY.
Ampofo, A. A. (2004). An empirical investigation into the relationship of
organizational ethical culture to ethical decision making by
accounting/finance professionals in the insurance industry in the USA.
United States: UMI.
Anderson, B. H., & Maletta, M. (1994). Auditor attendance to negative and
positive information: The effect of experience related difference.
Behavioral Research in Accounting 6 , 1-20.
Anderson, U., Koonce, L., & Marchant, G. (1994). The effects of source
competence information and its timing on auditors' performance of
analytical procedures. Auditing: A Journal of Practice and Theory 13 ,
137-148.
Armstrong, M. B. (1987). Moral development and accouting education. Journal
of Accounting Education, (Spring) , 27-43.
Arnaud, A. (2006). A new theory and measure of ethical work climate: The
psychological process model (PPM) and the ethical climate index (ECI).
Florida: Spring Team.
Ashton, R. (1992). Effects of justification and a mechanical aid on judgment
performance. Organizational Behavior anf Human Decision Performance
52 , 292-306.
Barnett, T., Bass, K., & Brown, K. (1994). The ethical judgments of college
students regarding business issues. Journal of Education for Business 69 ,
333-338.
Beattie, V., & Fearnley, S. (1998). Auditor changes and tendering: UK interview
evidence. Accounting, Auditing, & Accountability Journal Vol 11 No. 1 ,
72-98.
Bebeau, M. J., Rest, J. R., & Yamoor, C. (1985). Measuring dental student’s
ethical sensitivity. Journal of Dental Education 49 , 225–235.
Bernardi, R. A., & Arnold, D. F. (1997). An examination of moral development
within public accounting by gender, staff level and firm. Contemporary
Accounting Research 14(4) , 653-668.
Bernardi, R. (1994). Fraud detection: The effect of client integrity and
competence on auditor cognitive style. Auditing: A Journal of Theory and
Practice 13 (Supplement , 68-84.
Bollen, K. A. (1989). Structural equation with latent variables. John Wiley &
Sons.
Bonner, S. E., & Lewis, B. L. (1990). Determinants of auditor expertise. Journal
of Accounting Research 28 , 1-20.
Booth, P., & Schulz, A. K. (2004). The impact of an ethical environment on
managers' project evaluation judgments under agency problem conditions.
Accounting, Organization, and Society 29 , 473-488.
Borkowski, S., & Ugras, Y. (1998). Business students and ethics: A meta
analysis. Journal of Business Ethics 17 , 17-27.
Browne, M. W., & Cudeck, R. (1993). Alternaive ways of assessing model fit.
Sage Publication.
Browning, J., & B., Z. N. (1983). How Ethical are Industrial Buyers? Industrial
Marketing Management 12 , 219–224.
Buchheit, S., Pasewark Jr., W. R., & Strawser, J. R. (2003). No need to
compromise: Evidence of public accounting’s changing culture regarding
budgetary performance. Journal of Business Ethics 42 , 151–163.
Buchman, T., Tetlock, O., & Reed, R. (1996). Accountability and auditors'
judgment about contingent events. Journal of Business Finance &
Accounting 23(3) , 379-398.
Cambridge advanced learner's dictionary third edition. (2008). Cambridge:
Cambridge University Press.
Canary, H. E., & Jennings, M. M. (2008). Principle and influence in codes of
ethics: A centering resonance analysis comparing pre- and post- sarbanes-
oxley codes of ethic. Journal of Business Ethics 80 , 263-278.
Clarke, P., Hill, N., & Stevens, N. (1996). Ethical reasoning abilities: Accounting
practitioners in Ireland. Irish Business and Administrative Research 17 ,
94-109.
Cohen, J. R., Pant, L. W., & Sharp, D. J. (1998). The effect of gender and
academic discipline diversity on the ethical evaluations, intentions and
ethical orientation of potential public accounting recruits. Accounting
Horizons 12(3) , 250–270.
Coram, P., Glavovic, A., Ng, J., & Woodliff, D. R. (2008). The moral intensity of
reduced audit quality acts. Auditing: A Journal of Practice and Theory
27(1) , 127–149.
Cote, J. A., & Greenberg, R. (1990). Specifying measurement error in structural
equation models: Are congeneric measurement models appropriate?
Advances in Consumer Research Volume 17 , 426-433.
Craft, J. L. (2013). A review of the empirical etical decision making literature:
2004-2011. Journal of Business Ethics 117(2) , 221-259.
Cuccia, A., Hackenbrack, D., & Nelson, M. (1995). The ability of professional
standards to mitigate aggressive reporting. Accounting Review 70 , 111-
132.

Cullen, J. B., Parboteeah, K. P., & Victor, B. (2003). The effects of ethical
climates on organizational commitment: a two-study analysis. Journal of
Business Ethics Vol. 46 , 127-141.
DeZoort, T., Horrison, P., & Taylor, M. (2006). Accountability and auditors'
materiality judgments: The effects of differential pressure strength on
conservatism, variability and effort. Accounting Organization and Society
31(4-5) , 373-390.
Doll, W. J., Xia, W., & Torkzadeh, G. (1994). Confirmatory factor analysis of the
end user computing satisfaction instrument. MIS Quarterly December ,
453-461.
Dubinsky, A. J., & Levy, M. (1985). Ethics in retailing: Perceptions of
salespeople. Journal of Academy of Marketing Science 13(1) , 1–16.
Duska, R., Duska, B. S., & Ragatz, J. A. (2011). Accounring ethics 2nd ed.
United Kingdom: A John Wiley & Sons, Ltd.
Elmer, Renwick, N. S., & Malone, B. (1983). The relationship between moral
reasoning and political orientation. Journal of Personality and Social
Psychology , 1072-1080.
Eweje, G., & Brunton, M. (2010). Ethical perceptions of business students in a
New Zealand university: Do gender, age and work experience matter?
Business Ethics: A European Review, 19(1) , 95–111.
Eynon, G., Hill, N., & Stevens, K. (1997). Factors that influence the moral
reasoning abilities of accountants: Implications for universities and
professions. Journal of Business EThics 16 , 1297-1309.
Ford, R. C., & Richardson, W. D. (1994). Ethical decision making: A review of
the empirical literature. Journal of Business Ethics 13(3) , 205–221.
Ford, R. C., & Richardson, W. D. (1994). Ethical decision making: A review of
the empirical literature. Journal of Business Ethics 13(3) , 205-221.
Frederick, W. C., & Weber, J. (1987). The values of corporate managers and their
critics, in W. C. Frederick (ed.). Research in Corporate Social
Performance , 131-152.
Fritzsche, D. J. (1995). Personal values: Potential keys to ethical decision making.
Journal of Business Ethics , 909-922.
Gaa, J. C. (1994). The ethical foundation of public accounting. Research
Monograph 22 .
Gao, T., Sirgy, J., & Bird, M. M. (2005). Reducing buyer decision-making
uncertainty in organizational purchasing: Can supplier trust, commitment,
and dependence help? Journal of Business Research 58 , 397-405.
Ghozali, H. I. (2006). Aplikasi analisis multivariate dengan program SPSS.
Semarang: Badan Penerbit Universitas Diponegoro.
Gibbins, M., & Mason, A. (1988). Professional judgment in financial reporting.
Toronto: Canadian Institute of Chartered Accountant.
Gilligan, C. (1982). In a different voice: Psychological theory and women's
development. Cambridge, MA: Harvard University Press.
Glover, S. H., Bumpus, M. A., Logan, J. E., & Ciesla, J. R. (1997). Re-examining
the influence of individual values on ethical decision making. Journal of
Business Ethics 16 , 1319–1329.
Glover, S. H., Bumpus, M. A., Sharp, G. F., & Munchus, G. A. (2002). Gender
differences in ethical decision making. Women in Management Review
17(5) , 217–227.
Goolsby, J. R., & Hunt, S. D. (1992). Cognitive moral development and
marketing. Journal of Marketing 56(1) , 55-68.
Hackenbrack, V., & Nelson, M. (1996). Auditors' incentives and their
applications of financial accounting standards. Accounting Review 71 , 43-
59.

Hair, J. F., Black, B., Babin, B., Anderson, R. E., & Tatham, R. L. (2006).
Multivariate data analysis 6th Ed. Pearson Prentice Hall.
Helliar, C., & Bebbington, J. (2004). Taking ethics to heart. A discussion
document by the Research Committee of The Institute of Chartered
Accountants in Scotland . Edinburgh: ICAS.
Homer, P. M., & Kahle, L. R. (1988). A structural equation test of the value
attitude behavior hierarchy. Journal of Personality and Social Psychology
, 638-646.
Hunt, S. D., Wood, V. R., & Chonko, L. B. (1989). Corporate ethical values and
organizational commitment in marketing. Journal of Marketing 53 , 79-
90.
Investopedia. (2015). Retrieved December 21, 2015, from
http://www.investopedia.com/terms/s/sample_selection_basis.asp
James, L. R., James, L. A., & Ashe, D. K. (1990). The measning of organization,
the role of cognition and values. Organizational Climate and Culture , 40-
84.
Janis, I. L., & Mann, L. (1977). Decision making: A psychological analysis of
conflict choice and commitment. New York: The Free Press.
Jones, J., Massey, D. W., & Thorne, L. (1996). An experimental examination of
the effects of individual and situational factors on unethical behavioral
intentions in the workplace. Journal of Business Ethics 15(5) , 511-523.
Jones, J., Massey, D. W., & Thorne, L. (2003). Auditors' ethical reasoning:
Insights from past research and implications for the future. Journal of
Accounting Literature 22 , 45-103.
Jones, T. M. (1991). Ethical decision making by individuals in organizations: An
issue-contingent model. Academy of Management Review 16 , 366-395.
Jones, T. M., & Ryan, L. V. (1998). The effect of organizational forces on
individual morality. Business Ethics Quarterly 8 , 431-445.
Kaplan, S. E. (1995). An examination of auditors' reporting intention upon
dicovery of procedures prematurely signed off. Auditing: A Journal of
Practice and Theory 14(2) , 90-104.
Karacaer, S., Gohar, R., Aygun, M., & Sayin, C. (2009). Effects of personal
values on auditor's ethical decisions: A comparison of Pakistani and
Turkish professional auditors. Journal of Business Ethics 88 , 53-64.
Karcher, J. (1996). Accountants' ability to discern the presence of ethical
problem. Journal of Business Ethics 15 , 1033-1050.
Kelley, T., & Margheim, L. (1999). Survey on the differential effects of time
deadline pressure versus time budget pressure. Journal of Applied
Business Research 15(4) , 117–128.
Kelley, T., & Margheim, L. (1987). The effect of audit billing arrangement on
underreporting of time and audit quality reduction acts. Advances in
Accounting 5 , 221–233.
Kohlberg, L. (1973). Continuities in childhood and adult moral development
revisited. In P. B. Baltes, & K. Schaine, Life-Span Development
Psychology: Personality and Socialization. New York: Academic Press.
Kohlberg, L. (1969). Stage and sequences: The cognitive development approach
to socialization. Handbook of Socialization Theory and Research (Rand
McNally, Chicago) , 347-480.
Kohlberg, L. (1981). The philosophy of moral development 1. San Fransisco:
Harper & Row.
Lamberton, B., Mihalek, P. H., & Smith, C. S. (2005). The tone at the top and the
ethical conduct connection. Strategic Finance 86(9) , 37-39.

Lane, J. (1995). Ethics of business students: Some marketing perspectives.
Journal of Business Ethics 14(7) , 571-581.
Lee, B. (2002). Professional socialisation, commercial pressures, and junior staff's
time-pressired irregular auditing - a contextual interpretation. British
Accounting Review 4 , 315-333.
Lehnert, K., Park, Y.-h., & Singh, N. (2015). Research note and review of th
emirical ethical decision making literature: boundary condition and
extenions. Journal of Business Ethics 129 , 195-219.
Libby, R., & Tan, H. (1994). Modelling the determinants of audit expertise.
Accounting, Organizations and Society 19(8) , 701-716.
Loe, T., Ferrel, L., & Mansfield, P. (2000). A review of empirical studies
assessing ethical decision making in business. Journal of Business Ethics ,
185-204.
Logsdon, J. M., & Yuthas, K. (1997). Corporate social performance, stakeholder
orientation, and organizational moral development. Journal of Business
Ethics 16 , 1213-1226.
Longeneeker, J., McKinney, J., & Moore, C. (1989). The generation gap in
business ethics . Business Horizons 32(5) , 9-15.
Martin, K. D., & Cullen, J. B. (2006). Continuities and extensions of ethical
climate theory: a meta-analytic review. Journal of Business Ethics Vol. 69
, 175-194.
Martinov, N. (2005). An investigation of the moral intensity construct on auditors'
decision making and independence. UNSW.
Martinov-Bennie, N., & Pflugrath, G. (2009). The strength of an accounting
firm's ethical environment and the quality of auditors' judgment. Journal
of Business Ethics 87 , 237-253.

McCallum, R. C., Browne, M. W., & Sugarawa, H. W. (1996). Power analysis
and determination of sample size for convariance structure modeling.
Psychological Methods 1 , 130-149.
McDevitt, R., Giapponi, C., & Tromley, C. (2007). A model of ethical decision
making: The integration of process and content. Journal of Business
Ethics 73 , 219-229.
Moberg, D. J. (2000). Time Pressure and Ethical Decision-Making: The Case for
Moral Readiness. Business and Professional Ethics Journal 19(2) , 41–67.
Nichols, W. (2001). Random house Webster's unabridged dictonary. New York,
NY: Random House, Inc.
O’Reilly, D. M., Leitch, R. A., & Wedell, D. H. (2004). The effects of immediate
context on auditors’ judgements of loan quality. Auditing: A Journal of
Practice and Theory 23(1) , 89-105.
O'Fallon, M. J., & Butterfield, K. D. (2005). A review of the empirical ethical
decision making literature: 1996-2003. Journal of Business Ethics 59(4) ,
375-413.
Output question. (n.d.). Retrieved January 6, 2016, from
http://www.ssicentral.com/lisrel/WebHelp/FAQs/Output_Questions.htm
Parboteeah, K. P., Cullen, J. B., Victor, B., & Sakano, T. (2005). National culture
and ethical climates: a comparison of US and Japanese accounting firms.
Management International Review Vol. 45 , 459-481.
Patterson, D. (2001). Causal effects of regulatory, organizational, and personal
factors on ethical sensitivity. Journal of Business Ethics 30 , 123-159.
Pierce, B., & Sweeney, B. (2003). Auditor responses to cost control. Irish
Accounting Review 10(1) , 45–68.
Pierce, B., & Sweeney, B. (415–441). Cost quality conflict in audit firms: An
empirical investigation. European Accounting Review 13(3) , 2004.
Pierce, B., & Sweeney, B. (2006). Perceived adverse consequences of quality
threatening behaviour in audit firms. International Journal of Auditing
10(1) , 19–39.
Pincus, K. V. (1991). Audit judgment confidence. Behavioral Research in
Accounting 3 , 39–65.
Ponemon, L. (1992). Ethical reasoning and selection socialization in accounting.
Accounting, Organizations, and Society 17 , 239-258.
Ponemon, L. (1993). The influence of ethical reasoning on auditors' perception o
management's integrity and competence. Advances in Accounting , 1-23.
Ponemon, L., & Gabhart. (1993). Ethical reasoning in accounting and auditing.
Vancouver: Canadian General Accountants' Research Foundation.
Radtke, R. R. (2000). The effects of gender and setting on accountants’ ethically
sensitive decisions. Journal of Business Ethics 24 , 299–312.
Reeder, G., & Coovert, M. (1986). Revising an impression of morality. Social
Cognition , 1-17.
Rest, J. (1979). Development in judging moral issues.
Rest, J. (1986). Moral development: Advances in Research and Theory. New
York: Praeger Press.
Rest, J., & Narvaez, D. (1994). Moral development in the professions. Hillsdale,
NJ: Erlbaum and associates.
Rest, J., Narvaez, D., Bebeau, M., & Thoma, S. (1999). Post-conventional ethical
thinking: A neo-kohlbergian approach. Mahwah, NJ: Lawrence Erlbaum
Associates.
Rhode, J. G. (1978). The Independent Auditor’s Work Environment: A Survey.
New York: AICPA.

Ridgon, E. E., & Ferguson, C. E. (1991). The performance of polychoric
correlation coefficient and selected fitting function in confirmatory factor
analysis with ordinal data. Journal of Marketing and Research 28 , 491-
497.
Robin, D., & Babin, L. (1997). Making sense of the research on gender and ethics
in business. Business Ethics Quarterly 7(4) , 61-90.
Rokeach, M. (1973). The nature of human values. New York: The Free Press.
Ruegger, D., & King, E. (1992). A study of the effect of age and gender upon
student business ethics . Journal of Business Ethics 11 , 179-186.
Ruegger, D., & King, E. W. (1992). A study of the effect of age and gender upon
student business ethics. Journal of Business Ethics 11 , 179–186.
Salehi, Mahdi, Mansoury, A., & Pirayesh, R. (2008). Factors affecting quality of
audit: Empirical evidence of Iran. Journal Business Research Vol. 2 No.
1&2 , 24-32.
Scofield, S. B., Phillips Jr., T. J., & Bailey, C. D. (2004). An empirical reanalysis
of the selection-socialization hyphothesis: A research note. Accounting,
Organization, and Society 29(5-6) , 543-563.
Shafer, W. E., Poon, M. C., & Tjosvold, D. (2013). Ethical climate, goal
interdependence, and commitment among Asian auditors. Managerial
Auditing Journal Vol. 28 No. 3 , 217-244.
Shafer, W. (2009). Ethical climate, organizational-professional conflict and
organizational commitment: a study of Chinese auditors. Accounting,
Auditing & Accountability Journal Vol. 22 , 1087-1110.
Shapeero, M. P., Chye Koh, H., & Killough, L. N. (2003). Underreporting and
premature sign-off in public accounting. Managerial Auditing Journal
18(6/7) , 478–489.

Shaub, M. K., Finn, D. W., & Munter, P. (1993). The effects o f auditors' ethical
orientation on commitment and ethical sensitivity. Behavioral Research in
Accounting 5(1) , 145-169.
Shaub, M., & J., L. (1996). Ethics, experience, and professional skepticism: A
situation analysis. Behavioral Research in Accounting 8 (Supplement) ,
124-157.
Shawver, T. J., & Sennetti, J. T. (2009). Measuring ethical sensitivity and
evaluation. Journal of Business Ethics 88 , 663-678.
Sparks, J. R., & Merenski, J. P. (2000). Recognition based measures of ethical
sensitivity and reformulated cognitive moral development: An
examination and evidence of nomological validity. Teaching Business
Ethics 4 , 359-377.
Sweeney, B., & Pierce, B. (2006). Good hours and bad hours: A multi-
perspective examination of the dysfunctionality of auditor underreporting
of time. Accounting, Auditing and Accountability Journal 19(6) , 858–
892.
Sweeney, B., Arnold, D., & Pierce, B. (2010). The impact of perceived ethical
cultue of the firm and demographic variables. Journal of Business Ethics
93 , 531-551.
Swenson, T., & Lepper. (2005). Ethical sensitivity for organizational
communication issues: Examining individual and organizational
differences. Journal of Business Ethics 59 , 205-231.
Thorne, L., Massey, D., & Magnan, M. (2003). Institutional context and auditors'
moral reasoning: a Canada - USA comparison. Journal of Business Ethics
43(3) , 305-321.
Trevino, L. K. (1986). Ethical decision making in organizations: a person-
situation interactionist model. Academy of Management Review 11(3) ,
601-617.
Trevino, L. K. (1992). Experimental approaches to studying ethical-unethical
behavior in organization. Business Ethics Quarterly 2 , 121-136.
Trevino, L. K., & Weaver, G. (2003). Managing ethics in the business
organization: Social scientific perspectives. Stanford: Stanford Business
Books.
Trevino, L. K., Butterfield, K. D., & McCabe, D. L. (1998). The ethical context in
organizations: influences on employee attitudes and behaviors. Business
Ethics Quarterly Vol. 8 , 447-476.
Valentine, S. R., & Rittenburg, T. L. (2007). The ethical decision making of men
and women executives in international business situation. Journal of
Business Ethics 71 , 125-134.
VanSandt, C. V., Shepard, J. M., & Zappe, S. M. (2006). An examination of the
relationship between ethical work climate and moral awareness. Journal
of Business Ethics 68 , 409-432.
Verbeke, W., Volgering, M., & Hessels, M. (1998). Exploring the conceptual
expansion within field of organization behaviour, organization climate and
organizational culture. Journal of Management Studies 35 , 303-329.
Victor, B., & Cullen, J. B. (1987). A theory and measure of ethical climate in
organization. In W. C. Frederick, Research in COrporate Social
Performance and Policy 9. Greenwich: JAI Press.
Victor, B., & Cullen, J. B. (1988). The organizational bases of ethical work
climates. Administrative Science Quarterly 33 , 101-125.
Watts, R. L., & Zimmerman, J. L. (1986). Positive accounting theory. Englewood
Cliffs, NJ: Prentice-Hall, Inc.
Whitener, E. M., Brodt, S. E., Korsgaard, M. A., & Werner, J. M. (1998).
Managers as initiators of trust: An exchange relationship framework for
understanding managerial trustworthy behavior. Academy of Management
Review 23 , 513-531.
Wijayanto, S. H. (2008). Structural equation modeling dengan LISREL 8.8:
Konsep dan tutorial. Yogyakarta: Graha Ilmu.
Wortman, J. S. (2006). Ethical decision making: The effect of temporal
immediacy, perspective-taking, moral courage, and ethical work climate.
Proquest Dissertations and Theses , 106-106p.
Wright, W. F. (2001). Task experience as a predictor of superior loan loss
judgments. Auditing: A Journal of Practice and Theory 20(1) , 147-155.
Yoo, B., & Donthu, N. (2002). The effect of marketing education and individual
cultural values on marketing ethics on students. Journal of Marketing
Education 24(2) , 92-104.
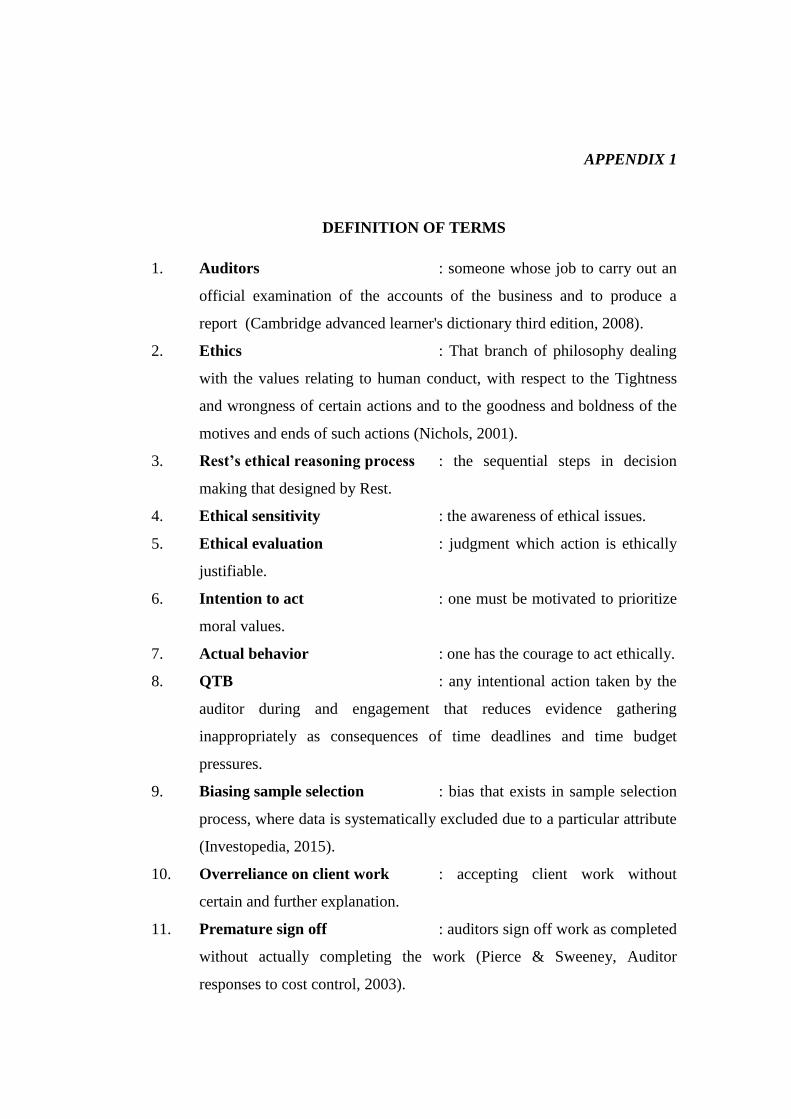
15
APPENDIX 1
DEFINITION OF TERMS
1. Auditors : someone whose job to carry out an
official examination of the accounts of the business and to produce a
report (Cambridge advanced learner's dictionary third edition, 2008).
2. Ethics : That branch of philosophy dealing
with the values relating to human conduct, with respect to the Tightness
and wrongness of certain actions and to the goodness and boldness of the
motives and ends of such actions (Nichols, 2001).
3. Rest’s ethical reasoning process : the sequential steps in decision
making that designed by Rest.
4. Ethical sensitivity : the awareness of ethical issues.
5. Ethical evaluation : judgment which action is ethically
justifiable.
6. Intention to act : one must be motivated to prioritize
moral values.
7. Actual behavior : one has the courage to act ethically.
8. QTB : any intentional action taken by the
auditor during and engagement that reduces evidence gathering
inappropriately as consequences of time deadlines and time budget
pressures.
9. Biasing sample selection : bias that exists in sample selection
process, where data is systematically excluded due to a particular attribute
(Investopedia, 2015).
10. Overreliance on client work : accepting client work without
certain and further explanation.
11. Premature sign off : auditors sign off work as completed
without actually completing the work (Pierce & Sweeney, Auditor
responses to cost control, 2003).
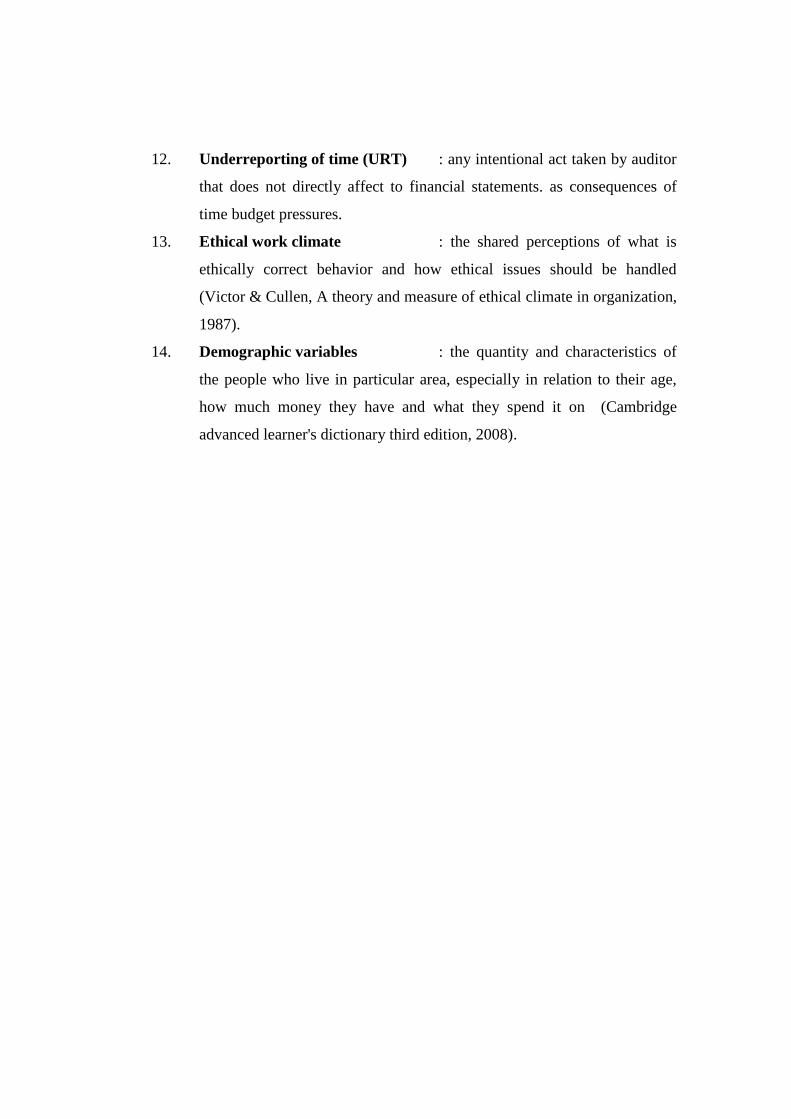
16
12. Underreporting of time (URT) : any intentional act taken by auditor
that does not directly affect to financial statements. as consequences of
time budget pressures.
13. Ethical work climate : the shared perceptions of what is
ethically correct behavior and how ethical issues should be handled
(Victor & Cullen, A theory and measure of ethical climate in organization,
1987).
14. Demographic variables : the quantity and characteristics of
the people who live in particular area, especially in relation to their age,
how much money they have and what they spend it on (Cambridge
advanced learner's dictionary third edition, 2008).

APPENDIX 2A
MODEL I

DATE: 1/15/2016 TIME: 3:14 L I S R E L 8.72 BY Karl G. Jöreskog & Dag Sörbom This program is published exclusively by Scientific Software International, Inc. 7383 N. Lincoln Avenue, Suite 100 Lincolnwood, IL 60712, U.S.A. Phone: (800)247-6113, (847)675-0720, Fax: (847)675-2140 Copyright by Scientific Software International, Inc., 1981-2005 Use of this program is subject to the terms specified in the Universal Copyright Convention. Website: www.ssicentral.com The following lines were read from file F:\PRESUNIV - ENA\thesis - ena\LISREL - TESTING\NEW TRIAL\LISREL\BASIC\EV SFL ABOBE 0.5 ALL EWC\1 SYNTAX CFA.PR2: OBSERVED VARIABLES EV1 EV2 EV3 EV4 EWC1 EWC2 EWC3 EWC4 EWC5 EWC6 EWC7 EWC8 EWC9 AGEM GENDERM LEM COVARIANCE MATRIX FROM FILE EVALL.COV ASYMPTOTIC COVARIANCE MATRIX FROM FILE EVALL.ACM SAMPLE SIZE = 283 LATENT VARIABLES EV EWC AGE GENDER LE EV1-EV4 = EV EWC1-EWC9 = EWC AGEM = 1*AGE GENDERM = 1*GENDER LEM = 1*LE EV = EWC AGE GENDER LE SET ERROR VARIANCE OF AGEM TO 0 SET ERROR VARIANCE OF GENDERM TO 0 SET ERROR VARIANCE OF LEM TO 0 LISREL OUTPUT: ND=3 SC ME=WLS PATH DIAGRAM END OF PROBLEM
Covariance Matrix
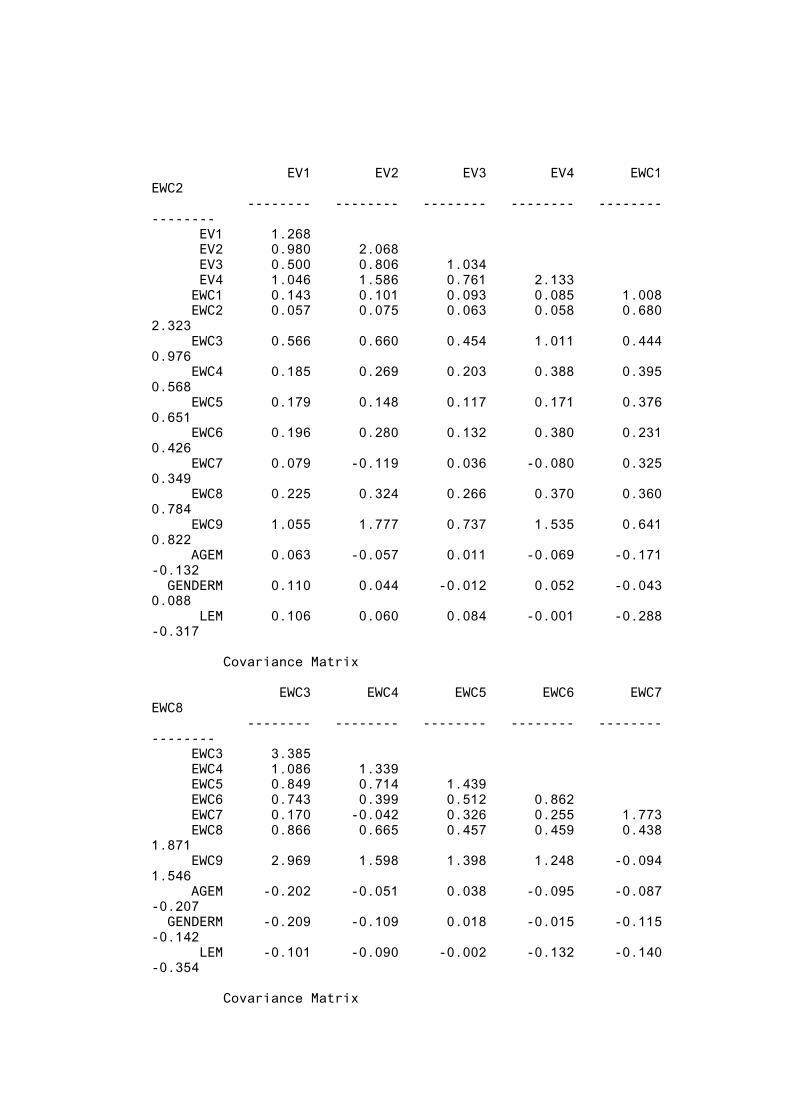
19
EV1 EV2 EV3 EV4 EWC1 EWC2 -------- -------- -------- -------- -------- -------- EV1 1.268 EV2 0.980 2.068 EV3 0.500 0.806 1.034 EV4 1.046 1.586 0.761 2.133 EWC1 0.143 0.101 0.093 0.085 1.008 EWC2 0.057 0.075 0.063 0.058 0.680 2.323 EWC3 0.566 0.660 0.454 1.011 0.444 0.976 EWC4 0.185 0.269 0.203 0.388 0.395 0.568 EWC5 0.179 0.148 0.117 0.171 0.376 0.651 EWC6 0.196 0.280 0.132 0.380 0.231 0.426 EWC7 0.079 -0.119 0.036 -0.080 0.325 0.349 EWC8 0.225 0.324 0.266 0.370 0.360 0.784 EWC9 1.055 1.777 0.737 1.535 0.641 0.822 AGEM 0.063 -0.057 0.011 -0.069 -0.171 -0.132 GENDERM 0.110 0.044 -0.012 0.052 -0.043 0.088 LEM 0.106 0.060 0.084 -0.001 -0.288 -0.317 Covariance Matrix EWC3 EWC4 EWC5 EWC6 EWC7 EWC8 -------- -------- -------- -------- -------- -------- EWC3 3.385 EWC4 1.086 1.339 EWC5 0.849 0.714 1.439 EWC6 0.743 0.399 0.512 0.862 EWC7 0.170 -0.042 0.326 0.255 1.773 EWC8 0.866 0.665 0.457 0.459 0.438 1.871 EWC9 2.969 1.598 1.398 1.248 -0.094 1.546 AGEM -0.202 -0.051 0.038 -0.095 -0.087 -0.207 GENDERM -0.209 -0.109 0.018 -0.015 -0.115 -0.142 LEM -0.101 -0.090 -0.002 -0.132 -0.140 -0.354 Covariance Matrix
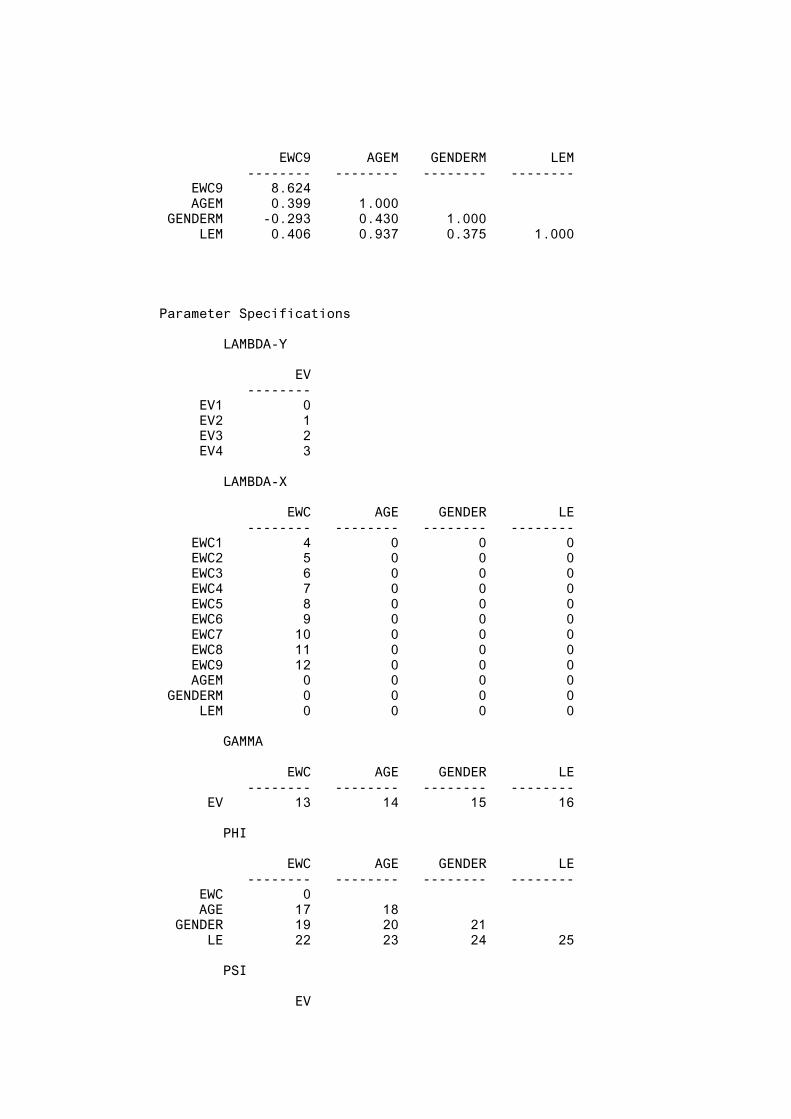
20
EWC9 AGEM GENDERM LEM -------- -------- -------- -------- EWC9 8.624 AGEM 0.399 1.000 GENDERM -0.293 0.430 1.000 LEM 0.406 0.937 0.375 1.000
Parameter Specifications LAMBDA-Y EV -------- EV1 0 EV2 1 EV3 2 EV4 3 LAMBDA-X EWC AGE GENDER LE -------- -------- -------- -------- EWC1 4 0 0 0 EWC2 5 0 0 0 EWC3 6 0 0 0 EWC4 7 0 0 0 EWC5 8 0 0 0 EWC6 9 0 0 0 EWC7 10 0 0 0 EWC8 11 0 0 0 EWC9 12 0 0 0 AGEM 0 0 0 0 GENDERM 0 0 0 0 LEM 0 0 0 0 GAMMA EWC AGE GENDER LE -------- -------- -------- -------- EV 13 14 15 16 PHI EWC AGE GENDER LE -------- -------- -------- -------- EWC 0 AGE 17 18 GENDER 19 20 21 LE 22 23 24 25 PSI EV
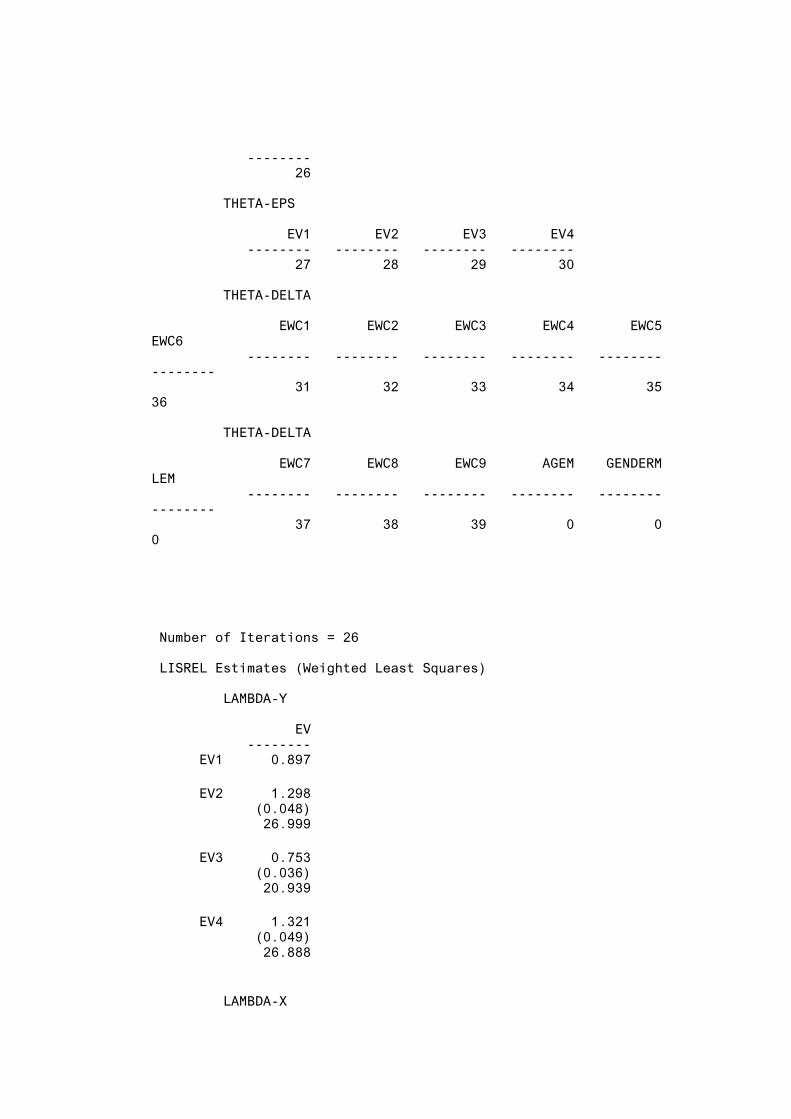
21
-------- 26 THETA-EPS EV1 EV2 EV3 EV4 -------- -------- -------- -------- 27 28 29 30 THETA-DELTA EWC1 EWC2 EWC3 EWC4 EWC5 EWC6 -------- -------- -------- -------- -------- -------- 31 32 33 34 35 36 THETA-DELTA EWC7 EWC8 EWC9 AGEM GENDERM LEM -------- -------- -------- -------- -------- -------- 37 38 39 0 0 0
Number of Iterations = 26 LISREL Estimates (Weighted Least Squares) LAMBDA-Y EV -------- EV1 0.897 EV2 1.298 (0.048) 26.999 EV3 0.753 (0.036) 20.939 EV4 1.321 (0.049) 26.888 LAMBDA-X
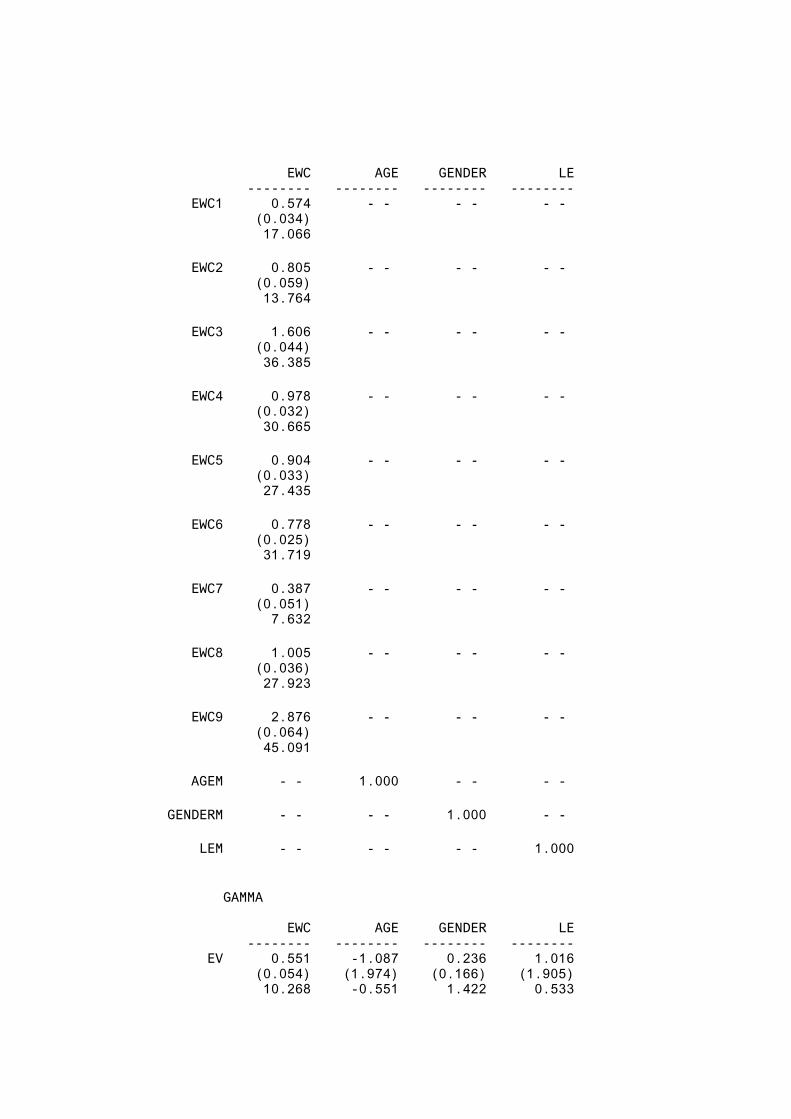
22
EWC AGE GENDER LE -------- -------- -------- -------- EWC1 0.574 - - - - - - (0.034) 17.066 EWC2 0.805 - - - - - - (0.059) 13.764 EWC3 1.606 - - - - - - (0.044) 36.385 EWC4 0.978 - - - - - - (0.032) 30.665 EWC5 0.904 - - - - - - (0.033) 27.435 EWC6 0.778 - - - - - - (0.025) 31.719 EWC7 0.387 - - - - - - (0.051) 7.632 EWC8 1.005 - - - - - - (0.036) 27.923 EWC9 2.876 - - - - - - (0.064) 45.091 AGEM - - 1.000 - - - - GENDERM - - - - 1.000 - - LEM - - - - - - 1.000 GAMMA EWC AGE GENDER LE -------- -------- -------- -------- EV 0.551 -1.087 0.236 1.016 (0.054) (1.974) (0.166) (1.905) 10.268 -0.551 1.422 0.533
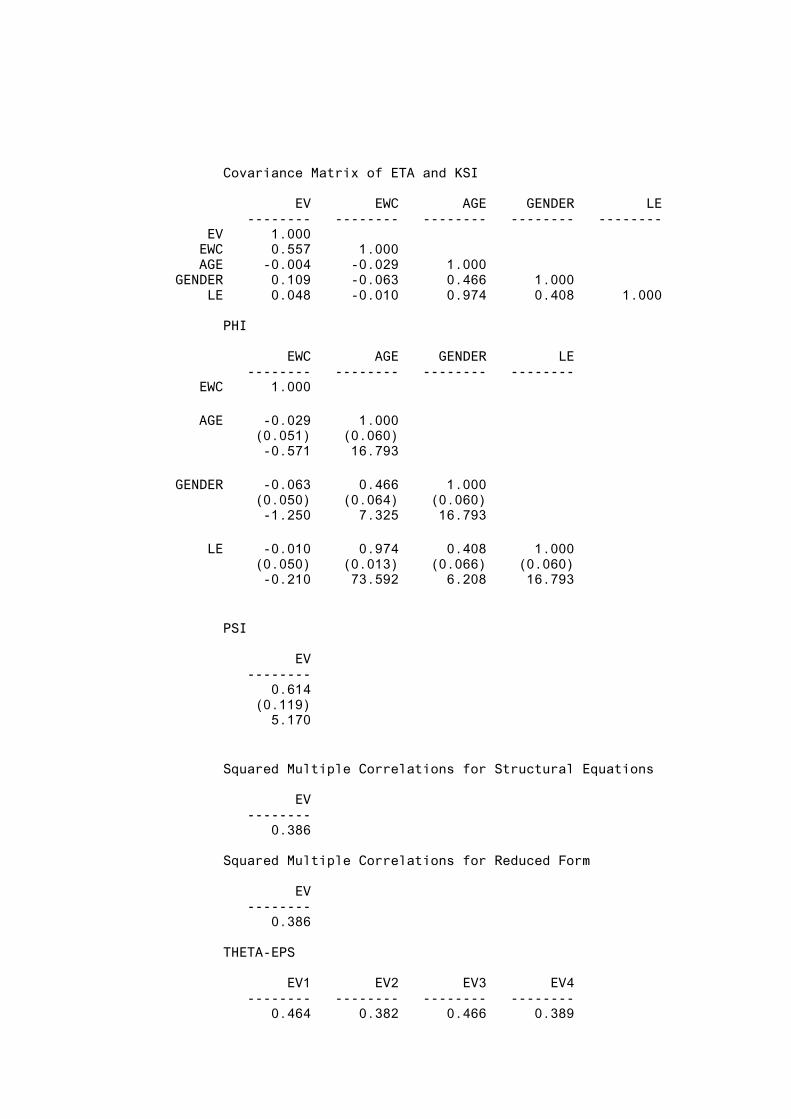
23
Covariance Matrix of ETA and KSI EV EWC AGE GENDER LE -------- -------- -------- -------- -------- EV 1.000 EWC 0.557 1.000 AGE -0.004 -0.029 1.000 GENDER 0.109 -0.063 0.466 1.000 LE 0.048 -0.010 0.974 0.408 1.000 PHI EWC AGE GENDER LE -------- -------- -------- -------- EWC 1.000 AGE -0.029 1.000 (0.051) (0.060) -0.571 16.793 GENDER -0.063 0.466 1.000 (0.050) (0.064) (0.060) -1.250 7.325 16.793 LE -0.010 0.974 0.408 1.000 (0.050) (0.013) (0.066) (0.060) -0.210 73.592 6.208 16.793 PSI EV -------- 0.614 (0.119) 5.170 Squared Multiple Correlations for Structural Equations EV -------- 0.386 Squared Multiple Correlations for Reduced Form EV -------- 0.386 THETA-EPS EV1 EV2 EV3 EV4 -------- -------- -------- -------- 0.464 0.382 0.466 0.389
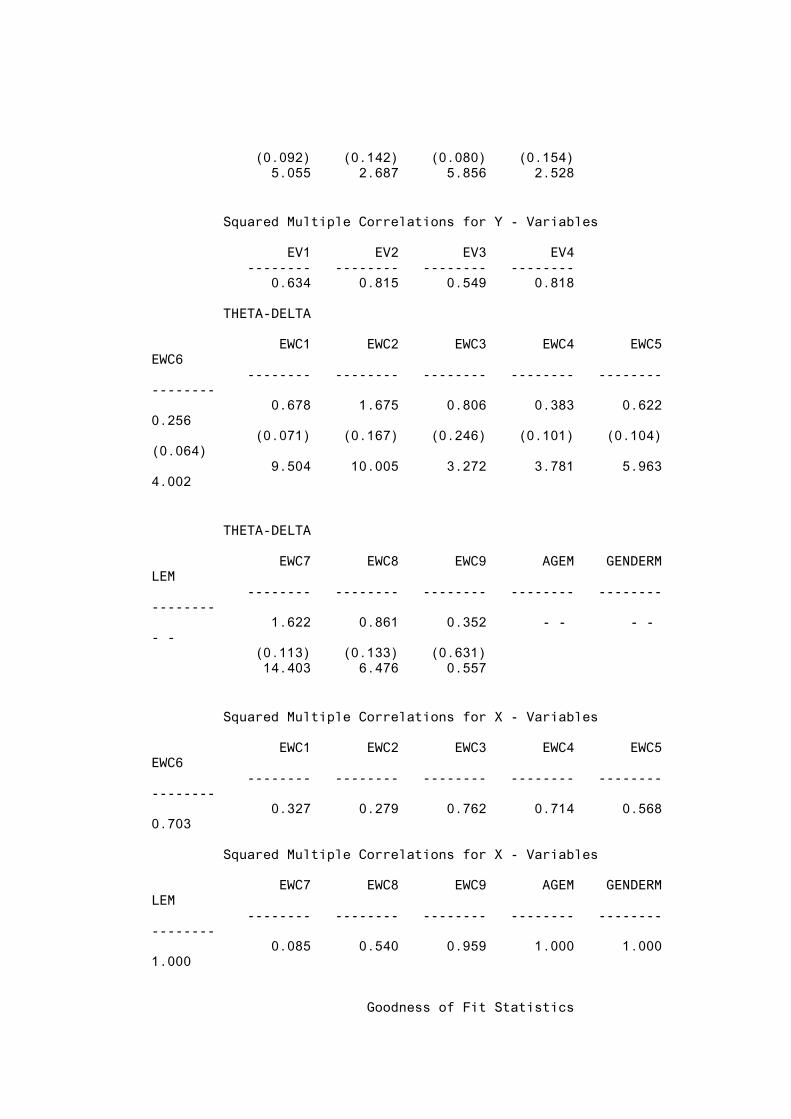
24
(0.092) (0.142) (0.080) (0.154) 5.055 2.687 5.856 2.528 Squared Multiple Correlations for Y - Variables EV1 EV2 EV3 EV4 -------- -------- -------- -------- 0.634 0.815 0.549 0.818 THETA-DELTA EWC1 EWC2 EWC3 EWC4 EWC5 EWC6 -------- -------- -------- -------- -------- -------- 0.678 1.675 0.806 0.383 0.622 0.256 (0.071) (0.167) (0.246) (0.101) (0.104) (0.064) 9.504 10.005 3.272 3.781 5.963 4.002 THETA-DELTA EWC7 EWC8 EWC9 AGEM GENDERM LEM -------- -------- -------- -------- -------- -------- 1.622 0.861 0.352 - - - - - - (0.113) (0.133) (0.631) 14.403 6.476 0.557 Squared Multiple Correlations for X - Variables EWC1 EWC2 EWC3 EWC4 EWC5 EWC6 -------- -------- -------- -------- -------- -------- 0.327 0.279 0.762 0.714 0.568 0.703 Squared Multiple Correlations for X - Variables EWC7 EWC8 EWC9 AGEM GENDERM LEM -------- -------- -------- -------- -------- -------- 0.085 0.540 0.959 1.000 1.000 1.000 Goodness of Fit Statistics

25
Degrees of Freedom = 97 Minimum Fit Function Chi-Square = 308.505 (P = 0.0) Estimated Non-centrality Parameter (NCP) = 211.505 90 Percent Confidence Interval for NCP = (162.220 ; 268.406) Minimum Fit Function Value = 1.094 Population Discrepancy Function Value (F0) = 0.750 90 Percent Confidence Interval for F0 = (0.575 ; 0.952) Root Mean Square Error of Approximation (RMSEA) = 0.0879 90 Percent Confidence Interval for RMSEA = (0.0770 ; 0.0991) P-Value for Test of Close Fit (RMSEA < 0.05) = 0.000 Expected Cross-Validation Index (ECVI) = 1.371 90 Percent Confidence Interval for ECVI = (1.196 ; 1.572) ECVI for Saturated Model = 0.965 ECVI for Independence Model = 35.879 Chi-Square for Independence Model with 120 Degrees of Freedom = 10085.851 Independence AIC = 10117.851 Model AIC = 386.505 Saturated AIC = 272.000 Independence CAIC = 10192.178 Model CAIC = 567.677 Saturated CAIC = 903.781 Normed Fit Index (NFI) = 0.969 Non-Normed Fit Index (NNFI) = 0.974 Parsimony Normed Fit Index (PNFI) = 0.784 Comparative Fit Index (CFI) = 0.979 Incremental Fit Index (IFI) = 0.979 Relative Fit Index (RFI) = 0.962 Critical N (CN) = 121.945 Root Mean Square Residual (RMR) = 0.398 Standardized RMR = 0.164 Goodness of Fit Index (GFI) = 0.979 Adjusted Goodness of Fit Index (AGFI) = 0.970 Parsimony Goodness of Fit Index (PGFI) = 0.698
Standardized Solution
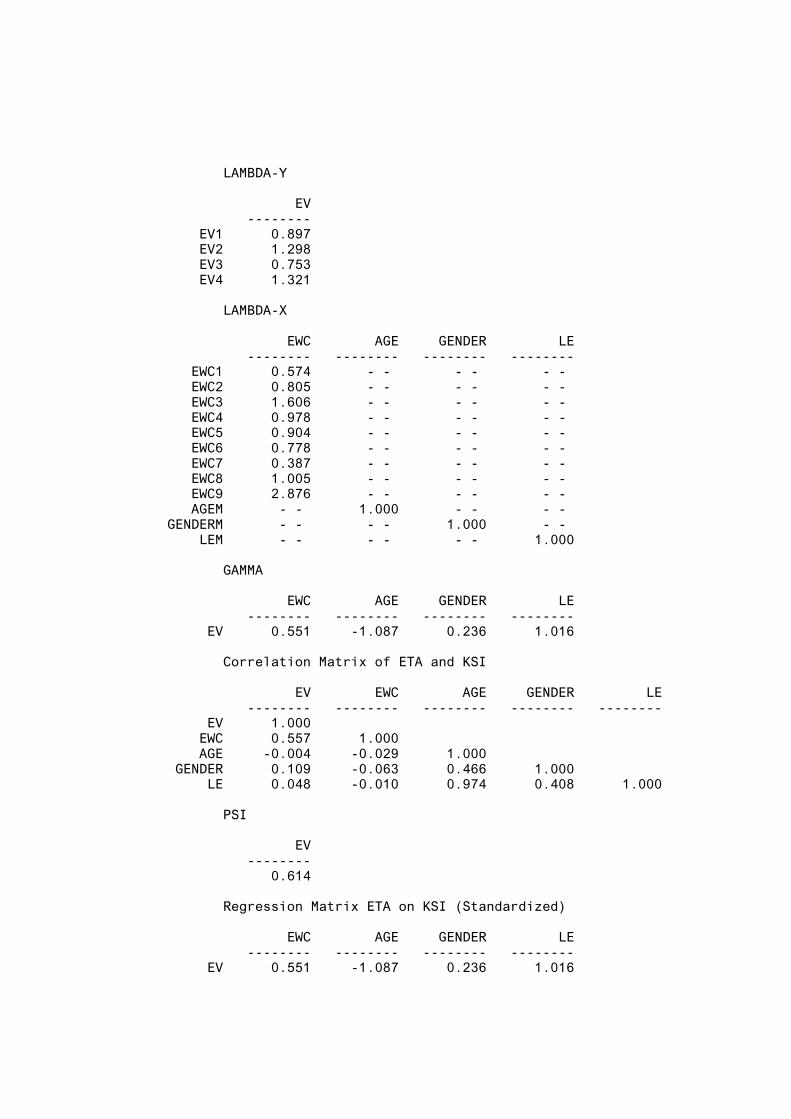
26
LAMBDA-Y EV -------- EV1 0.897 EV2 1.298 EV3 0.753 EV4 1.321 LAMBDA-X EWC AGE GENDER LE -------- -------- -------- -------- EWC1 0.574 - - - - - - EWC2 0.805 - - - - - - EWC3 1.606 - - - - - - EWC4 0.978 - - - - - - EWC5 0.904 - - - - - - EWC6 0.778 - - - - - - EWC7 0.387 - - - - - - EWC8 1.005 - - - - - - EWC9 2.876 - - - - - - AGEM - - 1.000 - - - - GENDERM - - - - 1.000 - - LEM - - - - - - 1.000 GAMMA EWC AGE GENDER LE -------- -------- -------- -------- EV 0.551 -1.087 0.236 1.016 Correlation Matrix of ETA and KSI EV EWC AGE GENDER LE -------- -------- -------- -------- -------- EV 1.000 EWC 0.557 1.000 AGE -0.004 -0.029 1.000 GENDER 0.109 -0.063 0.466 1.000 LE 0.048 -0.010 0.974 0.408 1.000 PSI EV -------- 0.614 Regression Matrix ETA on KSI (Standardized) EWC AGE GENDER LE -------- -------- -------- -------- EV 0.551 -1.087 0.236 1.016

27
Completely Standardized Solution LAMBDA-Y EV -------- EV1 0.796 EV2 0.903 EV3 0.741 EV4 0.904 LAMBDA-X EWC AGE GENDER LE -------- -------- -------- -------- EWC1 0.572 - - - - - - EWC2 0.528 - - - - - - EWC3 0.873 - - - - - - EWC4 0.845 - - - - - - EWC5 0.753 - - - - - - EWC6 0.838 - - - - - - EWC7 0.291 - - - - - - EWC8 0.735 - - - - - - EWC9 0.979 - - - - - - AGEM - - 1.000 - - - - GENDERM - - - - 1.000 - - LEM - - - - - - 1.000 GAMMA EWC AGE GENDER LE -------- -------- -------- -------- EV 0.551 -1.087 0.236 1.016 Correlation Matrix of ETA and KSI EV EWC AGE GENDER LE -------- -------- -------- -------- -------- EV 1.000 EWC 0.557 1.000 AGE -0.004 -0.029 1.000 GENDER 0.109 -0.063 0.466 1.000 LE 0.048 -0.010 0.974 0.408 1.000 PSI EV -------- 0.614 THETA-EPS EV1 EV2 EV3 EV4 -------- -------- -------- -------- 0.366 0.185 0.451 0.182
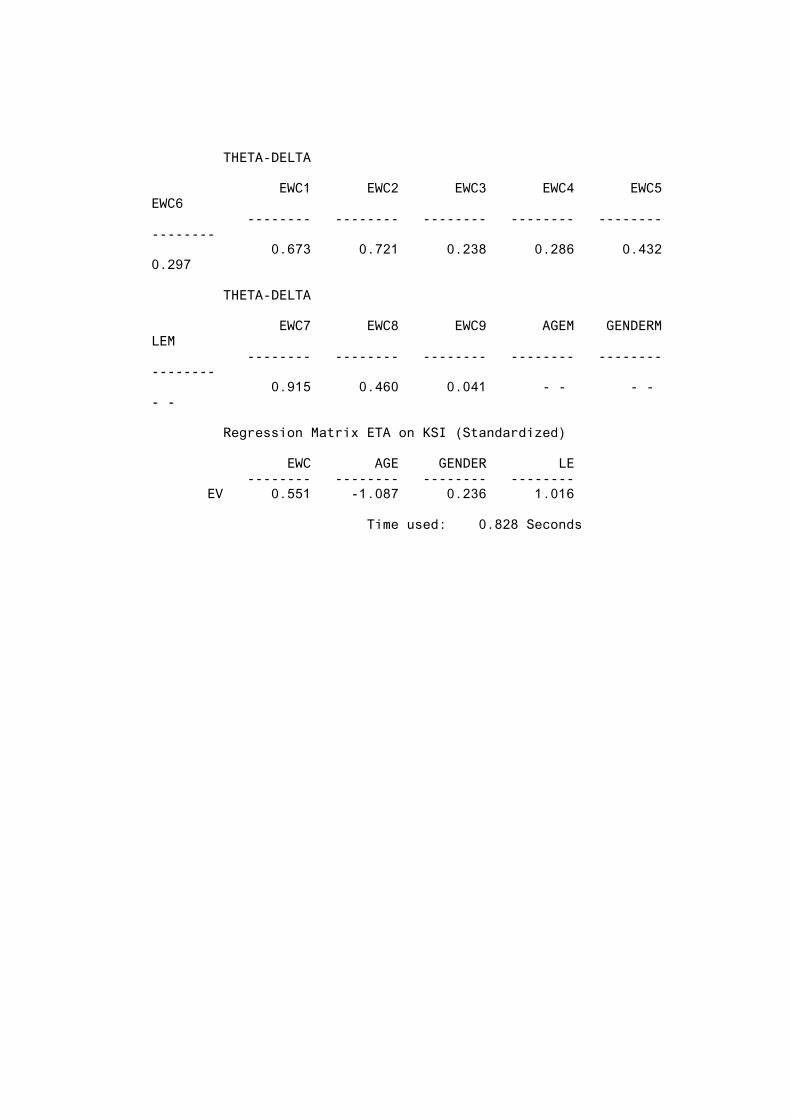
28
THETA-DELTA EWC1 EWC2 EWC3 EWC4 EWC5 EWC6 -------- -------- -------- -------- -------- -------- 0.673 0.721 0.238 0.286 0.432 0.297 THETA-DELTA EWC7 EWC8 EWC9 AGEM GENDERM LEM -------- -------- -------- -------- -------- -------- 0.915 0.460 0.041 - - - - - - Regression Matrix ETA on KSI (Standardized) EWC AGE GENDER LE -------- -------- -------- -------- EV 0.551 -1.087 0.236 1.016 Time used: 0.828 Seconds
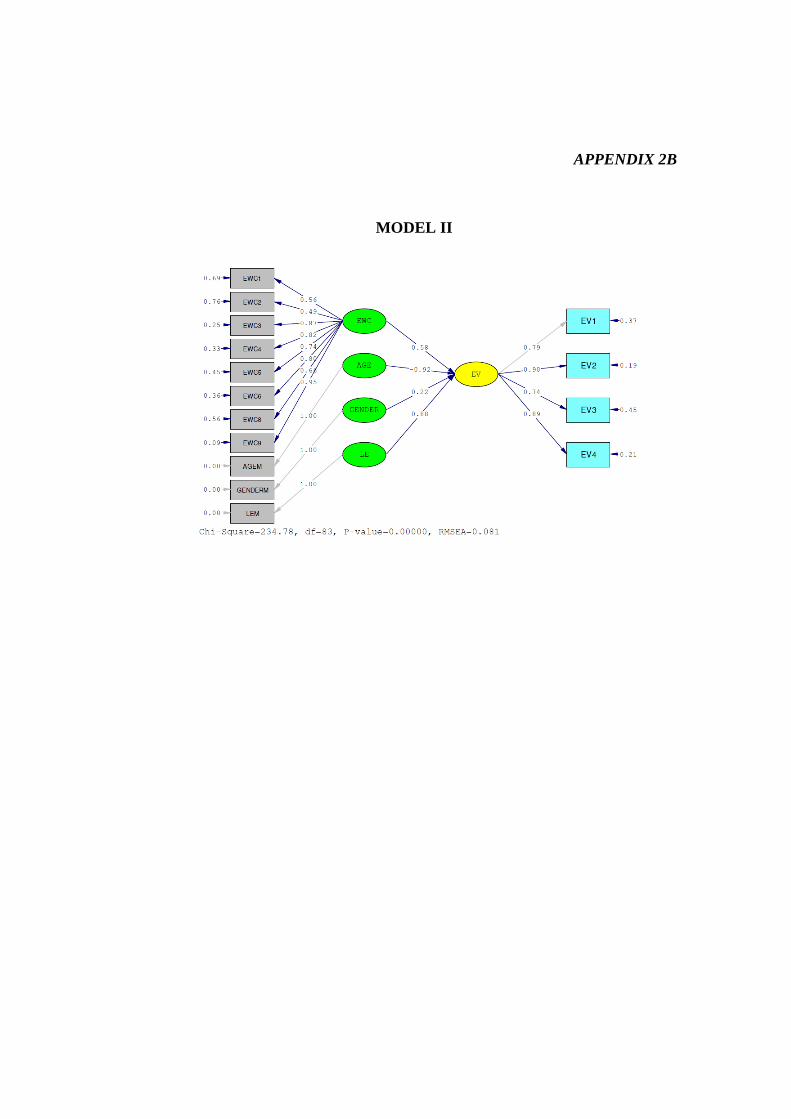
APPENDIX 2B
MODEL II

DATE: 1/15/2016 TIME: 3:18 L I S R E L 8.72 BY Karl G. Jöreskog & Dag Sörbom This program is published exclusively by Scientific Software International, Inc. 7383 N. Lincoln Avenue, Suite 100 Lincolnwood, IL 60712, U.S.A. Phone: (800)247-6113, (847)675-0720, Fax: (847)675-2140 Copyright by Scientific Software International, Inc., 1981-2005 Use of this program is subject to the terms specified in the Universal Copyright Convention. Website: www.ssicentral.com The following lines were read from file F:\PRESUNIV - ENA\thesis - ena\LISREL - TESTING\NEW TRIAL\LISREL\BASIC\EV SFL ABOBE 0.5 ALL EWC\2 SYNTAX CFA.PR2: OBSERVED VARIABLES EV1 EV2 EV3 EV4 EWC1 EWC2 EWC3 EWC4 EWC5 EWC6 EWC8 EWC9 AGEM GENDERM LEM COVARIANCE MATRIX FROM FILE EVALL2.COV ASYMPTOTIC COVARIANCE MATRIX FROM FILE EVALL2.ACM SAMPLE SIZE = 283 LATENT VARIABLES EV EWC AGE GENDER LE EV1-EV4 = EV EWC1-EWC9 = EWC AGEM = 1*AGE GENDERM = 1*GENDER LEM = 1*LE EV = EWC AGE GENDER LE SET ERROR VARIANCE OF AGEM TO 0 SET ERROR VARIANCE OF GENDERM TO 0 SET ERROR VARIANCE OF LEM TO 0 LISREL OUTPUT: ND=3 SC ME=WLS PATH DIAGRAM END OF PROBLEM
Covariance Matrix
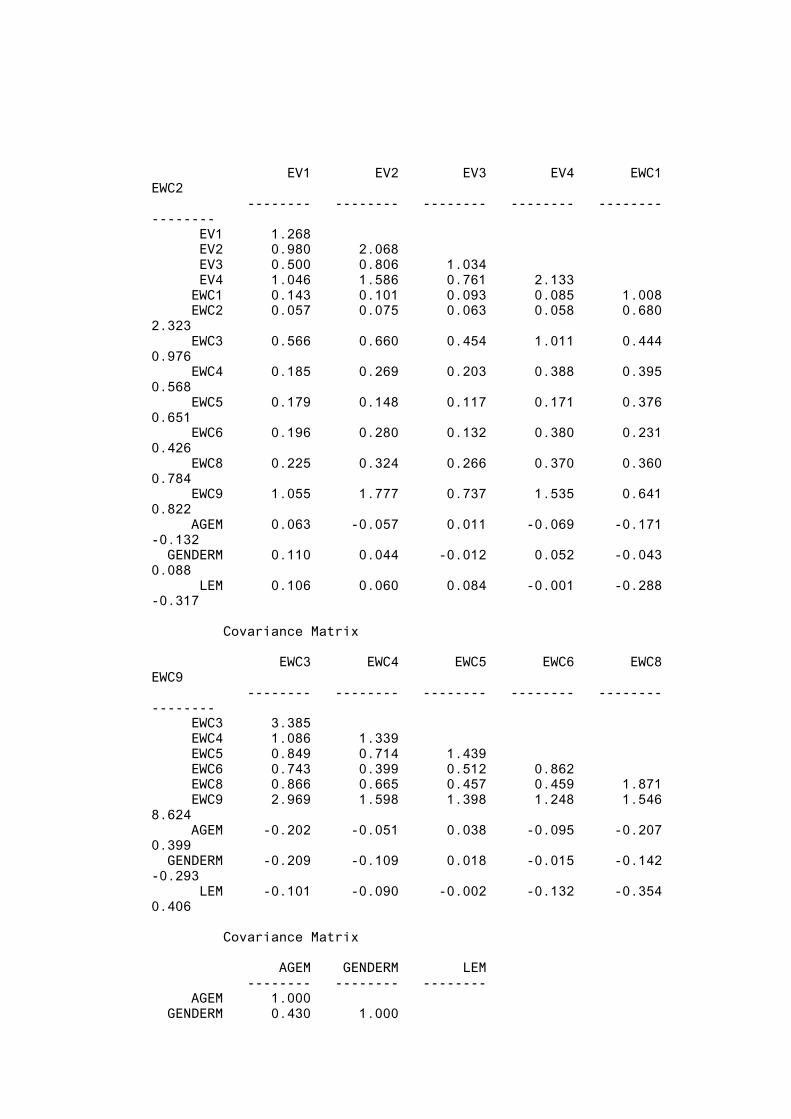
31
EV1 EV2 EV3 EV4 EWC1 EWC2 -------- -------- -------- -------- -------- -------- EV1 1.268 EV2 0.980 2.068 EV3 0.500 0.806 1.034 EV4 1.046 1.586 0.761 2.133 EWC1 0.143 0.101 0.093 0.085 1.008 EWC2 0.057 0.075 0.063 0.058 0.680 2.323 EWC3 0.566 0.660 0.454 1.011 0.444 0.976 EWC4 0.185 0.269 0.203 0.388 0.395 0.568 EWC5 0.179 0.148 0.117 0.171 0.376 0.651 EWC6 0.196 0.280 0.132 0.380 0.231 0.426 EWC8 0.225 0.324 0.266 0.370 0.360 0.784 EWC9 1.055 1.777 0.737 1.535 0.641 0.822 AGEM 0.063 -0.057 0.011 -0.069 -0.171 -0.132 GENDERM 0.110 0.044 -0.012 0.052 -0.043 0.088 LEM 0.106 0.060 0.084 -0.001 -0.288 -0.317 Covariance Matrix EWC3 EWC4 EWC5 EWC6 EWC8 EWC9 -------- -------- -------- -------- -------- -------- EWC3 3.385 EWC4 1.086 1.339 EWC5 0.849 0.714 1.439 EWC6 0.743 0.399 0.512 0.862 EWC8 0.866 0.665 0.457 0.459 1.871 EWC9 2.969 1.598 1.398 1.248 1.546 8.624 AGEM -0.202 -0.051 0.038 -0.095 -0.207 0.399 GENDERM -0.209 -0.109 0.018 -0.015 -0.142 -0.293 LEM -0.101 -0.090 -0.002 -0.132 -0.354 0.406 Covariance Matrix AGEM GENDERM LEM -------- -------- -------- AGEM 1.000 GENDERM 0.430 1.000

32
LEM 0.937 0.375 1.000
Parameter Specifications LAMBDA-Y EV -------- EV1 0 EV2 1 EV3 2 EV4 3 LAMBDA-X EWC AGE GENDER LE -------- -------- -------- -------- EWC1 4 0 0 0 EWC2 5 0 0 0 EWC3 6 0 0 0 EWC4 7 0 0 0 EWC5 8 0 0 0 EWC6 9 0 0 0 EWC8 10 0 0 0 EWC9 11 0 0 0 AGEM 0 0 0 0 GENDERM 0 0 0 0 LEM 0 0 0 0 GAMMA EWC AGE GENDER LE -------- -------- -------- -------- EV 12 13 14 15 PHI EWC AGE GENDER LE -------- -------- -------- -------- EWC 0 AGE 16 17 GENDER 18 19 20 LE 21 22 23 24 PSI EV -------- 25 THETA-EPS EV1 EV2 EV3 EV4
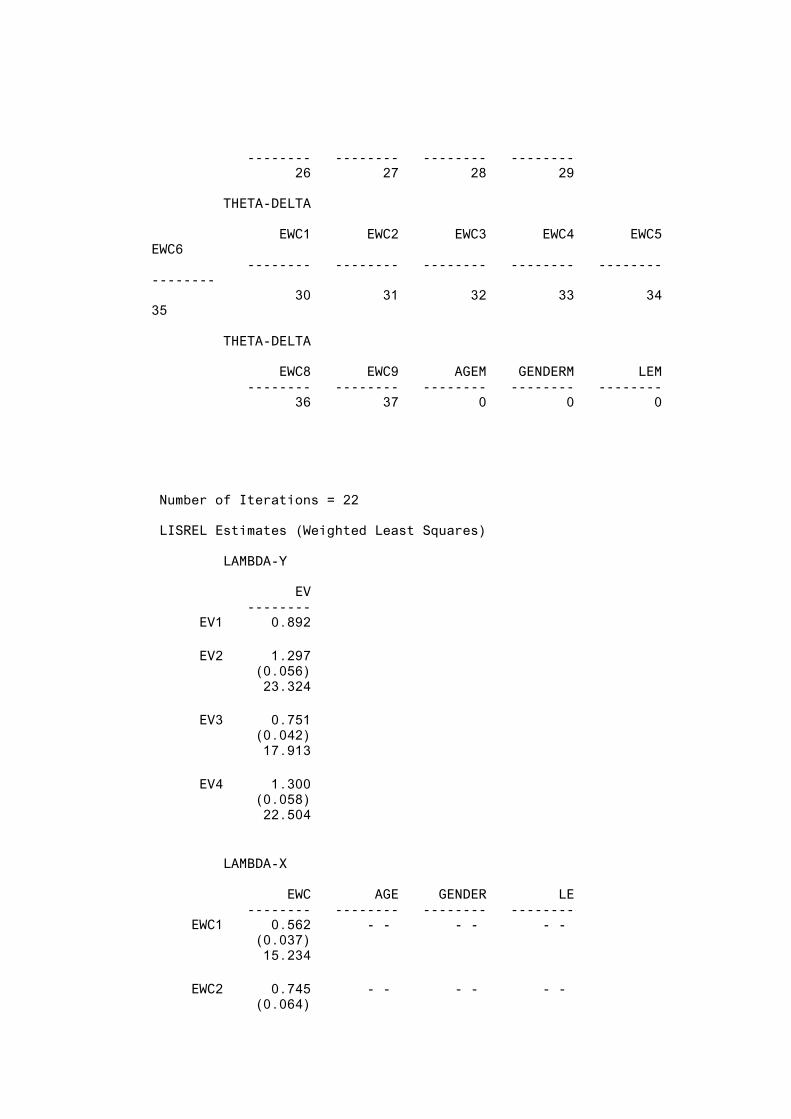
33
-------- -------- -------- -------- 26 27 28 29 THETA-DELTA EWC1 EWC2 EWC3 EWC4 EWC5 EWC6 -------- -------- -------- -------- -------- -------- 30 31 32 33 34 35 THETA-DELTA EWC8 EWC9 AGEM GENDERM LEM -------- -------- -------- -------- -------- 36 37 0 0 0
Number of Iterations = 22 LISREL Estimates (Weighted Least Squares) LAMBDA-Y EV -------- EV1 0.892 EV2 1.297 (0.056) 23.324 EV3 0.751 (0.042) 17.913 EV4 1.300 (0.058) 22.504 LAMBDA-X EWC AGE GENDER LE -------- -------- -------- -------- EWC1 0.562 - - - - - - (0.037) 15.234 EWC2 0.745 - - - - - - (0.064)
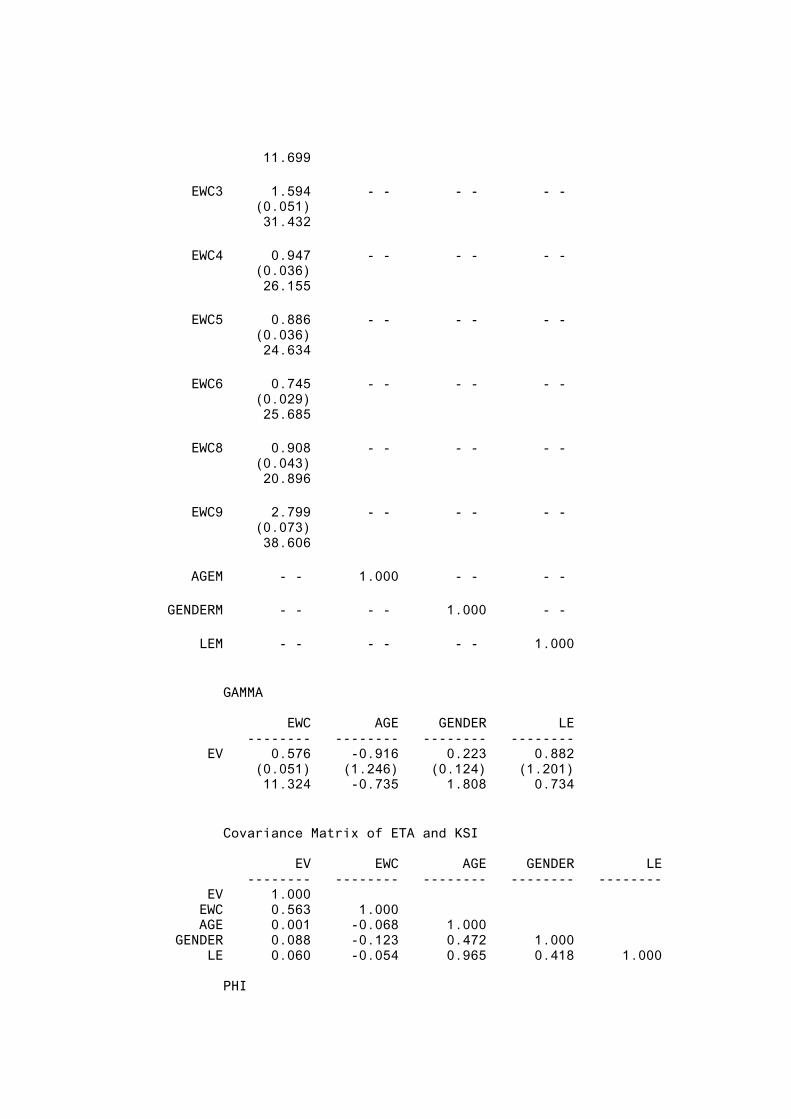
34
11.699 EWC3 1.594 - - - - - - (0.051) 31.432 EWC4 0.947 - - - - - - (0.036) 26.155 EWC5 0.886 - - - - - - (0.036) 24.634 EWC6 0.745 - - - - - - (0.029) 25.685 EWC8 0.908 - - - - - - (0.043) 20.896 EWC9 2.799 - - - - - - (0.073) 38.606 AGEM - - 1.000 - - - - GENDERM - - - - 1.000 - - LEM - - - - - - 1.000 GAMMA EWC AGE GENDER LE -------- -------- -------- -------- EV 0.576 -0.916 0.223 0.882 (0.051) (1.246) (0.124) (1.201) 11.324 -0.735 1.808 0.734 Covariance Matrix of ETA and KSI EV EWC AGE GENDER LE -------- -------- -------- -------- -------- EV 1.000 EWC 0.563 1.000 AGE 0.001 -0.068 1.000 GENDER 0.088 -0.123 0.472 1.000 LE 0.060 -0.054 0.965 0.418 1.000 PHI
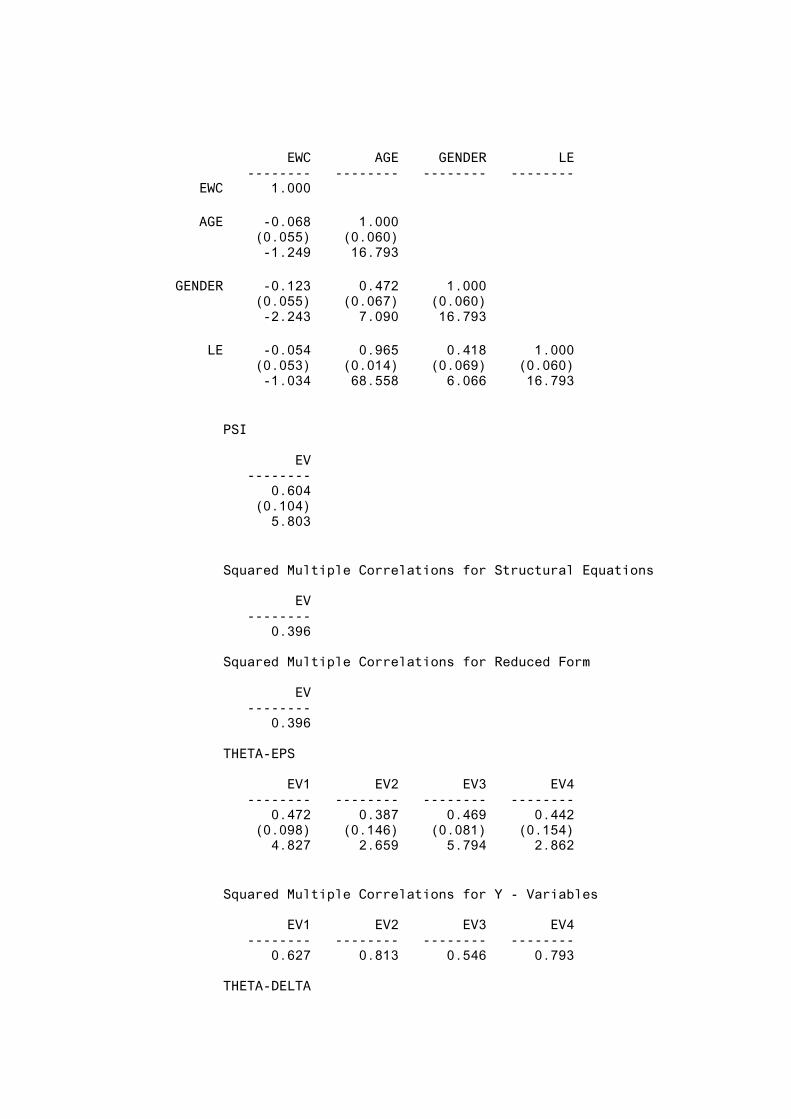
35
EWC AGE GENDER LE -------- -------- -------- -------- EWC 1.000 AGE -0.068 1.000 (0.055) (0.060) -1.249 16.793 GENDER -0.123 0.472 1.000 (0.055) (0.067) (0.060) -2.243 7.090 16.793 LE -0.054 0.965 0.418 1.000 (0.053) (0.014) (0.069) (0.060) -1.034 68.558 6.066 16.793 PSI EV -------- 0.604 (0.104) 5.803 Squared Multiple Correlations for Structural Equations EV -------- 0.396 Squared Multiple Correlations for Reduced Form EV -------- 0.396 THETA-EPS EV1 EV2 EV3 EV4 -------- -------- -------- -------- 0.472 0.387 0.469 0.442 (0.098) (0.146) (0.081) (0.154) 4.827 2.659 5.794 2.862 Squared Multiple Correlations for Y - Variables EV1 EV2 EV3 EV4 -------- -------- -------- -------- 0.627 0.813 0.546 0.793 THETA-DELTA
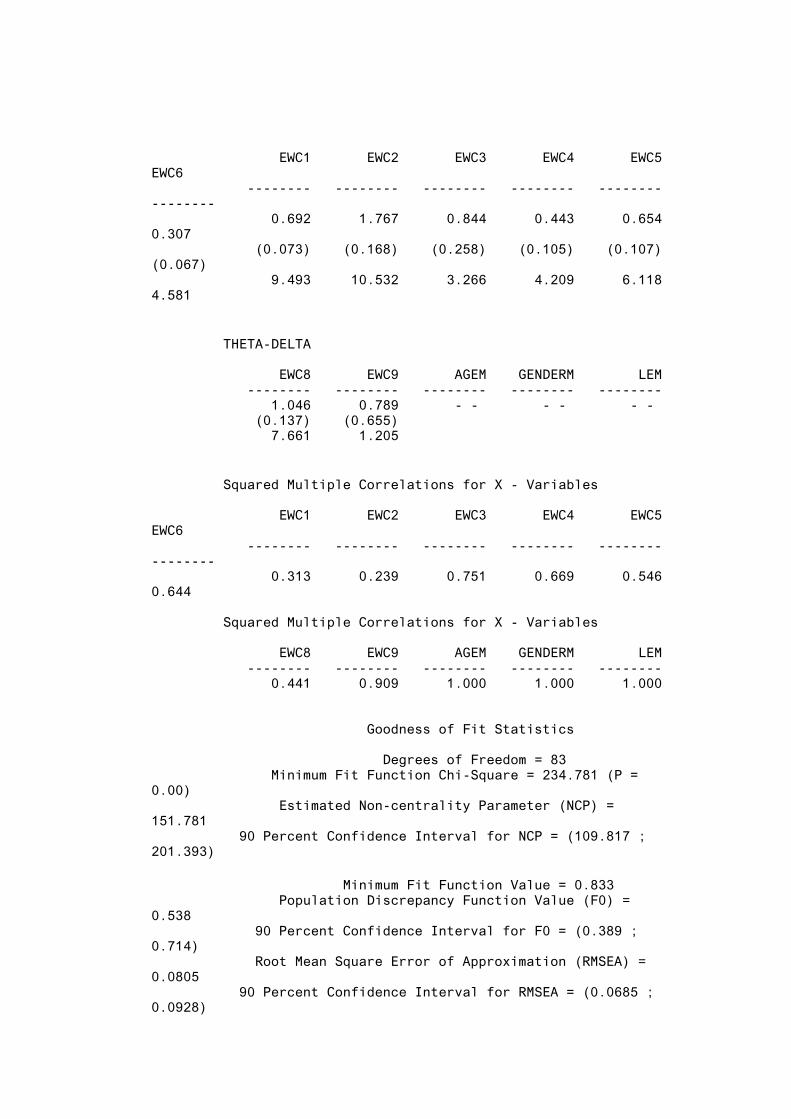
36
EWC1 EWC2 EWC3 EWC4 EWC5 EWC6 -------- -------- -------- -------- -------- -------- 0.692 1.767 0.844 0.443 0.654 0.307 (0.073) (0.168) (0.258) (0.105) (0.107) (0.067) 9.493 10.532 3.266 4.209 6.118 4.581 THETA-DELTA EWC8 EWC9 AGEM GENDERM LEM -------- -------- -------- -------- -------- 1.046 0.789 - - - - - - (0.137) (0.655) 7.661 1.205 Squared Multiple Correlations for X - Variables EWC1 EWC2 EWC3 EWC4 EWC5 EWC6 -------- -------- -------- -------- -------- -------- 0.313 0.239 0.751 0.669 0.546 0.644 Squared Multiple Correlations for X - Variables EWC8 EWC9 AGEM GENDERM LEM -------- -------- -------- -------- -------- 0.441 0.909 1.000 1.000 1.000 Goodness of Fit Statistics Degrees of Freedom = 83 Minimum Fit Function Chi-Square = 234.781 (P = 0.00) Estimated Non-centrality Parameter (NCP) = 151.781 90 Percent Confidence Interval for NCP = (109.817 ; 201.393) Minimum Fit Function Value = 0.833 Population Discrepancy Function Value (F0) = 0.538 90 Percent Confidence Interval for F0 = (0.389 ; 0.714) Root Mean Square Error of Approximation (RMSEA) = 0.0805 90 Percent Confidence Interval for RMSEA = (0.0685 ; 0.0928)

37
P-Value for Test of Close Fit (RMSEA < 0.05) = 0.000 Expected Cross-Validation Index (ECVI) = 1.095 90 Percent Confidence Interval for ECVI = (0.946 ; 1.271) ECVI for Saturated Model = 0.851 ECVI for Independence Model = 29.044 Chi-Square for Independence Model with 105 Degrees of Freedom = 8160.488 Independence AIC = 8190.488 Model AIC = 308.781 Saturated AIC = 240.000 Independence CAIC = 8260.169 Model CAIC = 480.662 Saturated CAIC = 797.454 Normed Fit Index (NFI) = 0.971 Non-Normed Fit Index (NNFI) = 0.976 Parsimony Normed Fit Index (PNFI) = 0.768 Comparative Fit Index (CFI) = 0.981 Incremental Fit Index (IFI) = 0.981 Relative Fit Index (RFI) = 0.964 Critical N (CN) = 140.186 Root Mean Square Residual (RMR) = 0.354 Standardized RMR = 0.149 Goodness of Fit Index (GFI) = 0.981 Adjusted Goodness of Fit Index (AGFI) = 0.973 Parsimony Goodness of Fit Index (PGFI) = 0.679
Standardized Solution LAMBDA-Y EV -------- EV1 0.892 EV2 1.297 EV3 0.751 EV4 1.300 LAMBDA-X EWC AGE GENDER LE -------- -------- -------- -------- EWC1 0.562 - - - - - - EWC2 0.745 - - - - - - EWC3 1.594 - - - - - - EWC4 0.947 - - - - - -

38
EWC5 0.886 - - - - - - EWC6 0.745 - - - - - - EWC8 0.908 - - - - - - EWC9 2.799 - - - - - - AGEM - - 1.000 - - - - GENDERM - - - - 1.000 - - LEM - - - - - - 1.000 GAMMA EWC AGE GENDER LE -------- -------- -------- -------- EV 0.576 -0.916 0.223 0.882 Correlation Matrix of ETA and KSI EV EWC AGE GENDER LE -------- -------- -------- -------- -------- EV 1.000 EWC 0.563 1.000 AGE 0.001 -0.068 1.000 GENDER 0.088 -0.123 0.472 1.000 LE 0.060 -0.054 0.965 0.418 1.000 PSI EV -------- 0.604 Regression Matrix ETA on KSI (Standardized) EWC AGE GENDER LE -------- -------- -------- -------- EV 0.576 -0.916 0.223 0.882
Completely Standardized Solution LAMBDA-Y EV -------- EV1 0.792 EV2 0.902 EV3 0.739 EV4 0.890 LAMBDA-X EWC AGE GENDER LE -------- -------- -------- -------- EWC1 0.560 - - - - - - EWC2 0.489 - - - - - - EWC3 0.866 - - - - - -
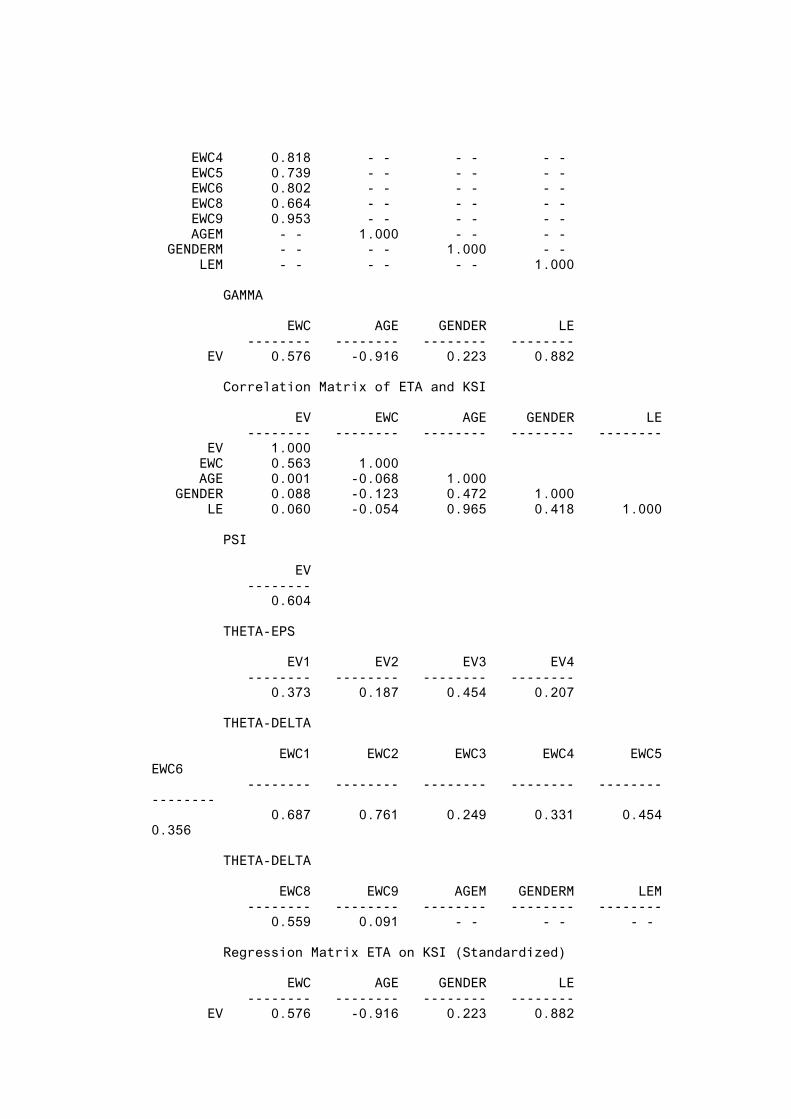
39
EWC4 0.818 - - - - - - EWC5 0.739 - - - - - - EWC6 0.802 - - - - - - EWC8 0.664 - - - - - - EWC9 0.953 - - - - - - AGEM - - 1.000 - - - - GENDERM - - - - 1.000 - - LEM - - - - - - 1.000 GAMMA EWC AGE GENDER LE -------- -------- -------- -------- EV 0.576 -0.916 0.223 0.882 Correlation Matrix of ETA and KSI EV EWC AGE GENDER LE -------- -------- -------- -------- -------- EV 1.000 EWC 0.563 1.000 AGE 0.001 -0.068 1.000 GENDER 0.088 -0.123 0.472 1.000 LE 0.060 -0.054 0.965 0.418 1.000 PSI EV -------- 0.604 THETA-EPS EV1 EV2 EV3 EV4 -------- -------- -------- -------- 0.373 0.187 0.454 0.207 THETA-DELTA EWC1 EWC2 EWC3 EWC4 EWC5 EWC6 -------- -------- -------- -------- -------- -------- 0.687 0.761 0.249 0.331 0.454 0.356 THETA-DELTA EWC8 EWC9 AGEM GENDERM LEM -------- -------- -------- -------- -------- 0.559 0.091 - - - - - - Regression Matrix ETA on KSI (Standardized) EWC AGE GENDER LE -------- -------- -------- -------- EV 0.576 -0.916 0.223 0.882

APPENDIX 2C
MODEL III

DATE: 1/15/2016 TIME: 3:22 L I S R E L 8.72 BY Karl G. Jöreskog & Dag Sörbom This program is published exclusively by Scientific Software International, Inc. 7383 N. Lincoln Avenue, Suite 100 Lincolnwood, IL 60712, U.S.A. Phone: (800)247-6113, (847)675-0720, Fax: (847)675-2140 Copyright by Scientific Software International, Inc., 1981-2005 Use of this program is subject to the terms specified in the Universal Copyright Convention. Website: www.ssicentral.com The following lines were read from file F:\PRESUNIV - ENA\thesis - ena\LISREL - TESTING\NEW TRIAL\LISREL\BASIC\EV SFL ABOBE 0.5 ALL EWC\3 SYNTAX CFA.PR2: OBSERVED VARIABLES EV1 EV2 EV3 EV4 EWC1 EWC3 EWC4 EWC5 EWC6 EWC8 EWC9 AGEM GENDERM LEM COVARIANCE MATRIX FROM FILE EVALL3.COV ASYMPTOTIC COVARIANCE MATRIX FROM FILE EVALL3.ACM SAMPLE SIZE = 283 LATENT VARIABLES EV EWC AGE GENDER LE EV1-EV4 = EV EWC1-EWC9 = EWC AGEM = 1*AGE GENDERM = 1*GENDER LEM = 1*LE EV = EWC AGE GENDER LE SET ERROR VARIANCE OF AGEM TO 0 SET ERROR VARIANCE OF GENDERM TO 0 SET ERROR VARIANCE OF LEM TO 0 LISREL OUTPUT: ND=3 SC ME=WLS PATH DIAGRAM END OF PROBLEM
Covariance Matrix
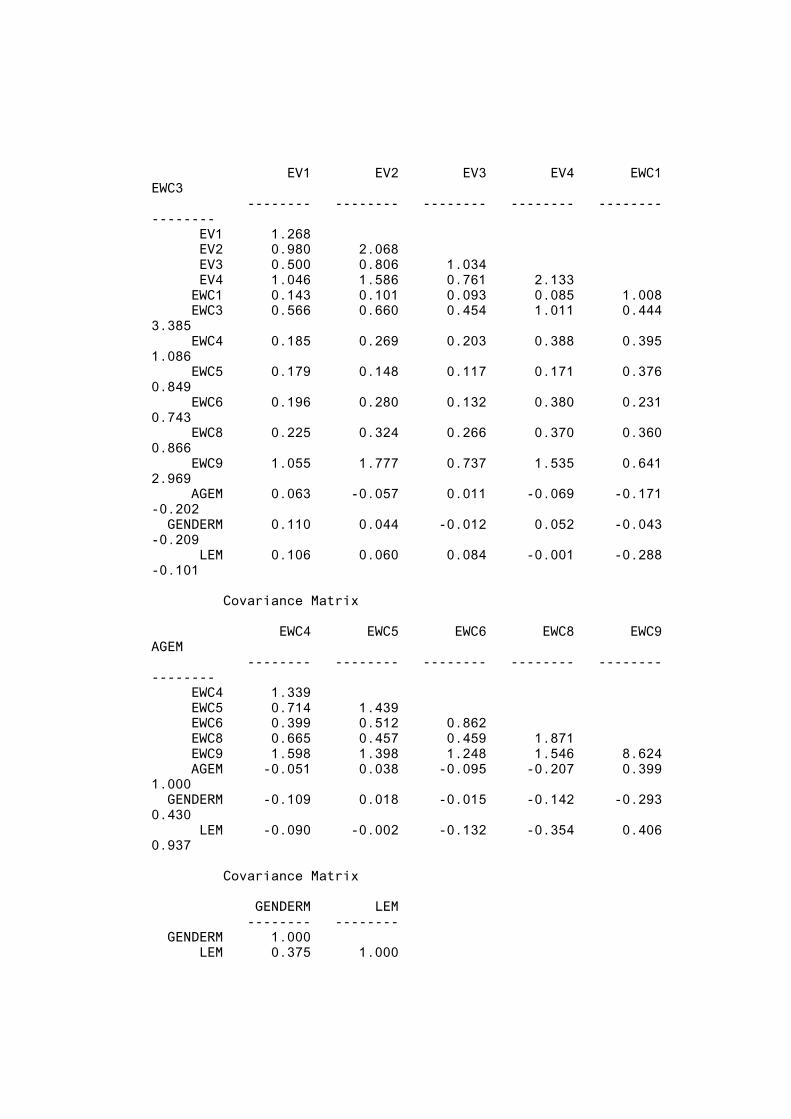
42
EV1 EV2 EV3 EV4 EWC1 EWC3 -------- -------- -------- -------- -------- -------- EV1 1.268 EV2 0.980 2.068 EV3 0.500 0.806 1.034 EV4 1.046 1.586 0.761 2.133 EWC1 0.143 0.101 0.093 0.085 1.008 EWC3 0.566 0.660 0.454 1.011 0.444 3.385 EWC4 0.185 0.269 0.203 0.388 0.395 1.086 EWC5 0.179 0.148 0.117 0.171 0.376 0.849 EWC6 0.196 0.280 0.132 0.380 0.231 0.743 EWC8 0.225 0.324 0.266 0.370 0.360 0.866 EWC9 1.055 1.777 0.737 1.535 0.641 2.969 AGEM 0.063 -0.057 0.011 -0.069 -0.171 -0.202 GENDERM 0.110 0.044 -0.012 0.052 -0.043 -0.209 LEM 0.106 0.060 0.084 -0.001 -0.288 -0.101 Covariance Matrix EWC4 EWC5 EWC6 EWC8 EWC9 AGEM -------- -------- -------- -------- -------- -------- EWC4 1.339 EWC5 0.714 1.439 EWC6 0.399 0.512 0.862 EWC8 0.665 0.457 0.459 1.871 EWC9 1.598 1.398 1.248 1.546 8.624 AGEM -0.051 0.038 -0.095 -0.207 0.399 1.000 GENDERM -0.109 0.018 -0.015 -0.142 -0.293 0.430 LEM -0.090 -0.002 -0.132 -0.354 0.406 0.937 Covariance Matrix GENDERM LEM -------- -------- GENDERM 1.000 LEM 0.375 1.000
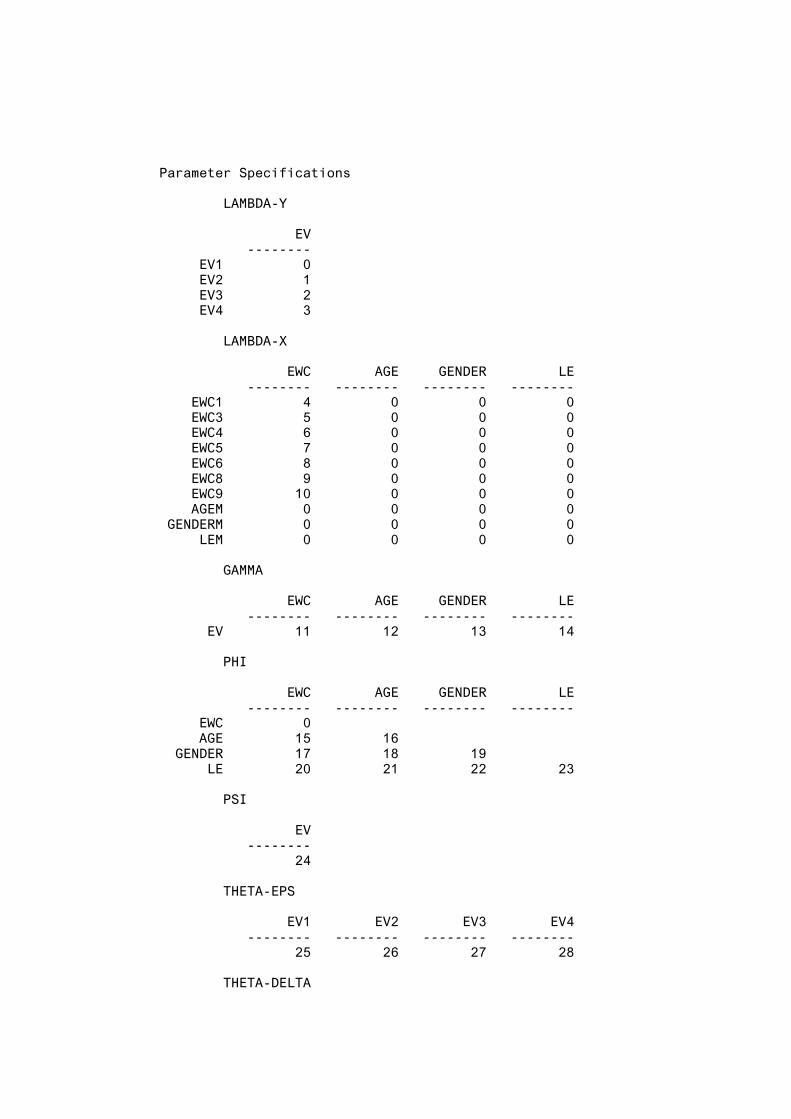
43
Parameter Specifications LAMBDA-Y EV -------- EV1 0 EV2 1 EV3 2 EV4 3 LAMBDA-X EWC AGE GENDER LE -------- -------- -------- -------- EWC1 4 0 0 0 EWC3 5 0 0 0 EWC4 6 0 0 0 EWC5 7 0 0 0 EWC6 8 0 0 0 EWC8 9 0 0 0 EWC9 10 0 0 0 AGEM 0 0 0 0 GENDERM 0 0 0 0 LEM 0 0 0 0 GAMMA EWC AGE GENDER LE -------- -------- -------- -------- EV 11 12 13 14 PHI EWC AGE GENDER LE -------- -------- -------- -------- EWC 0 AGE 15 16 GENDER 17 18 19 LE 20 21 22 23 PSI EV -------- 24 THETA-EPS EV1 EV2 EV3 EV4 -------- -------- -------- -------- 25 26 27 28 THETA-DELTA
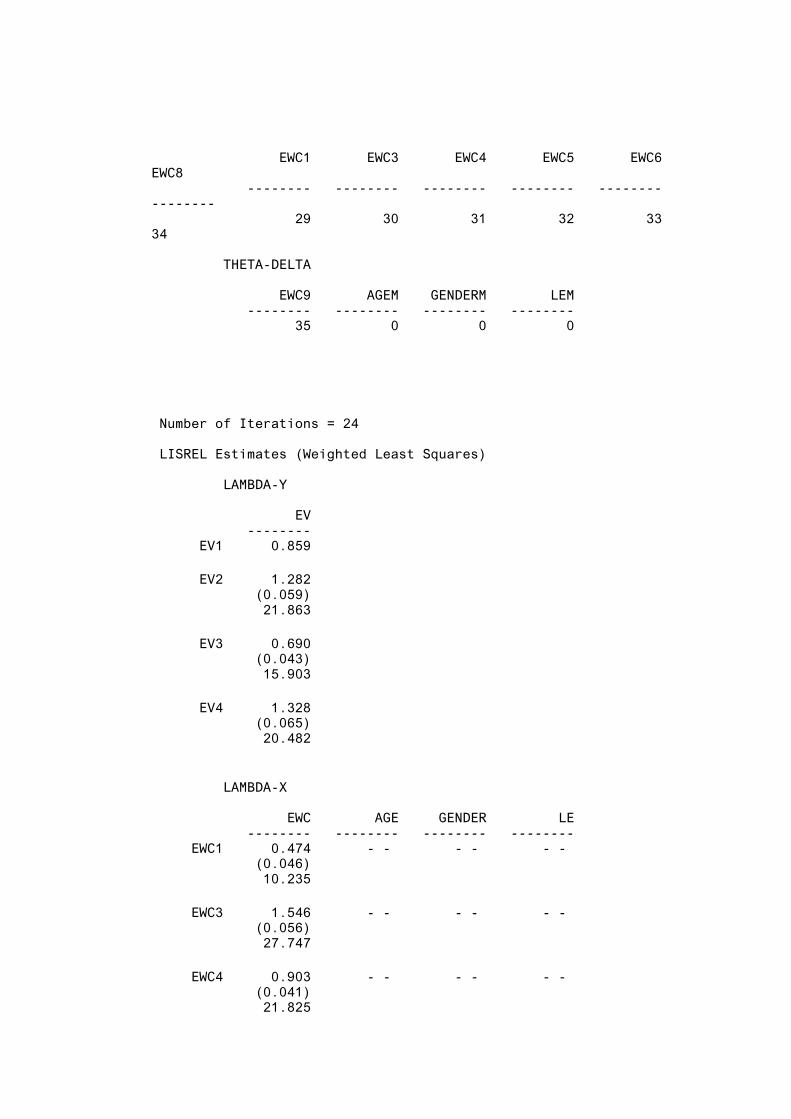
44
EWC1 EWC3 EWC4 EWC5 EWC6 EWC8 -------- -------- -------- -------- -------- -------- 29 30 31 32 33 34 THETA-DELTA EWC9 AGEM GENDERM LEM -------- -------- -------- -------- 35 0 0 0
Number of Iterations = 24 LISREL Estimates (Weighted Least Squares) LAMBDA-Y EV -------- EV1 0.859 EV2 1.282 (0.059) 21.863 EV3 0.690 (0.043) 15.903 EV4 1.328 (0.065) 20.482 LAMBDA-X EWC AGE GENDER LE -------- -------- -------- -------- EWC1 0.474 - - - - - - (0.046) 10.235 EWC3 1.546 - - - - - - (0.056) 27.747 EWC4 0.903 - - - - - - (0.041) 21.825
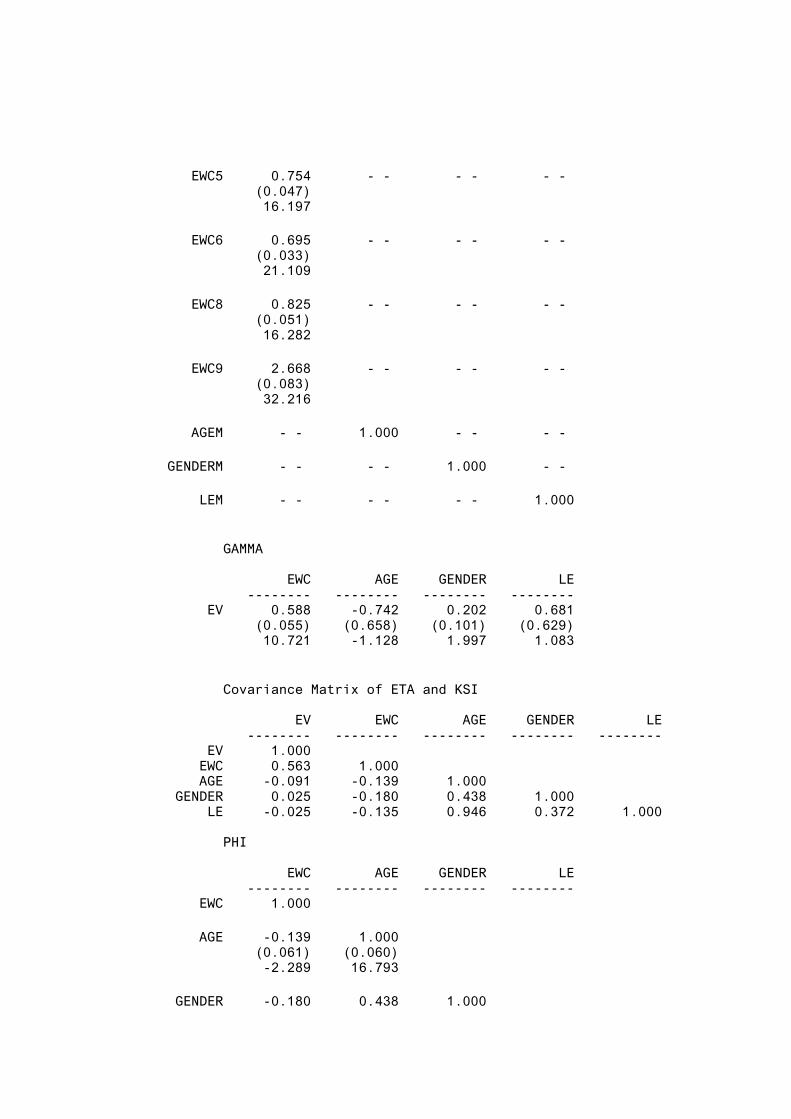
45
EWC5 0.754 - - - - - - (0.047) 16.197 EWC6 0.695 - - - - - - (0.033) 21.109 EWC8 0.825 - - - - - - (0.051) 16.282 EWC9 2.668 - - - - - - (0.083) 32.216 AGEM - - 1.000 - - - - GENDERM - - - - 1.000 - - LEM - - - - - - 1.000 GAMMA EWC AGE GENDER LE -------- -------- -------- -------- EV 0.588 -0.742 0.202 0.681 (0.055) (0.658) (0.101) (0.629) 10.721 -1.128 1.997 1.083 Covariance Matrix of ETA and KSI EV EWC AGE GENDER LE -------- -------- -------- -------- -------- EV 1.000 EWC 0.563 1.000 AGE -0.091 -0.139 1.000 GENDER 0.025 -0.180 0.438 1.000 LE -0.025 -0.135 0.946 0.372 1.000 PHI EWC AGE GENDER LE -------- -------- -------- -------- EWC 1.000 AGE -0.139 1.000 (0.061) (0.060) -2.289 16.793 GENDER -0.180 0.438 1.000
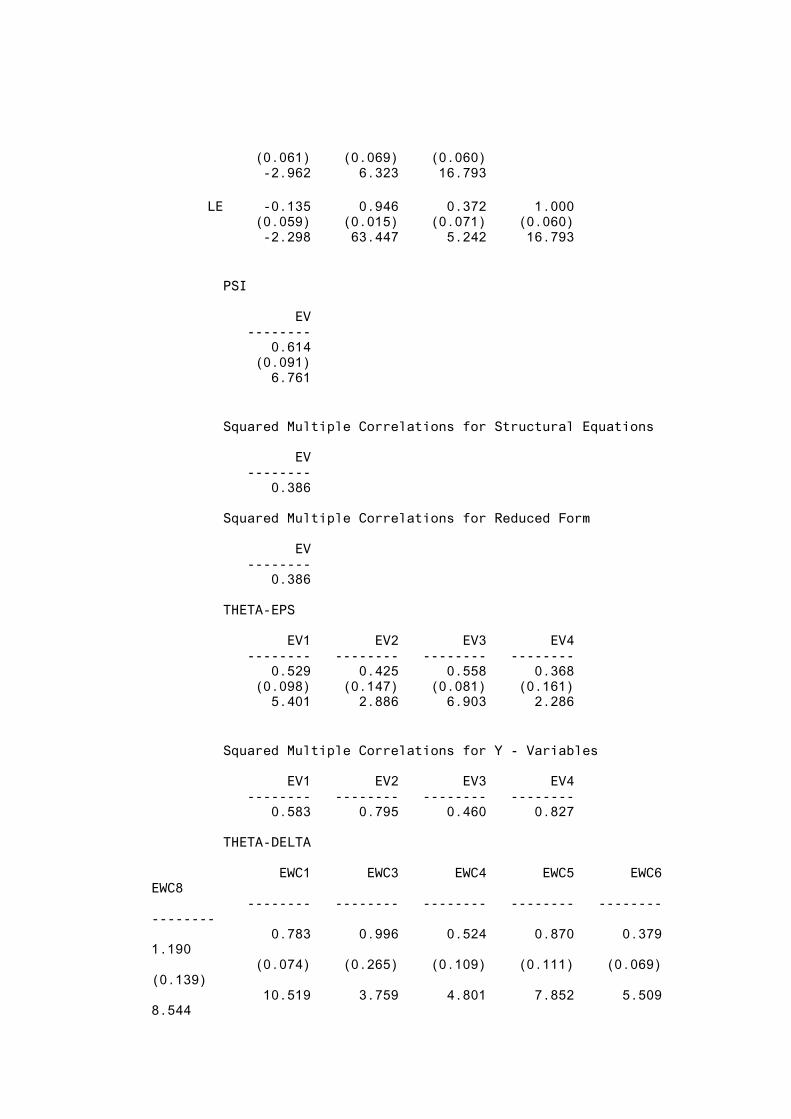
46
(0.061) (0.069) (0.060) -2.962 6.323 16.793 LE -0.135 0.946 0.372 1.000 (0.059) (0.015) (0.071) (0.060) -2.298 63.447 5.242 16.793 PSI EV -------- 0.614 (0.091) 6.761 Squared Multiple Correlations for Structural Equations EV -------- 0.386 Squared Multiple Correlations for Reduced Form EV -------- 0.386 THETA-EPS EV1 EV2 EV3 EV4 -------- -------- -------- -------- 0.529 0.425 0.558 0.368 (0.098) (0.147) (0.081) (0.161) 5.401 2.886 6.903 2.286 Squared Multiple Correlations for Y - Variables EV1 EV2 EV3 EV4 -------- -------- -------- -------- 0.583 0.795 0.460 0.827 THETA-DELTA EWC1 EWC3 EWC4 EWC5 EWC6 EWC8 -------- -------- -------- -------- -------- -------- 0.783 0.996 0.524 0.870 0.379 1.190 (0.074) (0.265) (0.109) (0.111) (0.069) (0.139) 10.519 3.759 4.801 7.852 5.509 8.544
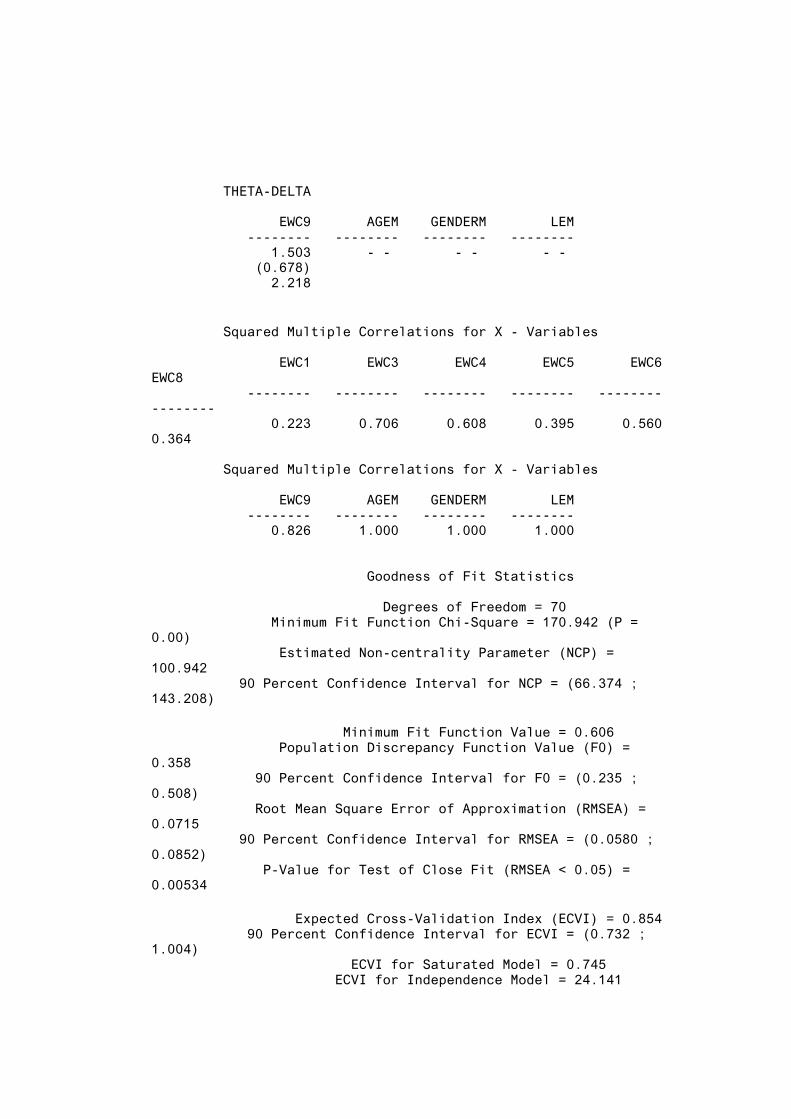
47
THETA-DELTA EWC9 AGEM GENDERM LEM -------- -------- -------- -------- 1.503 - - - - - - (0.678) 2.218 Squared Multiple Correlations for X - Variables EWC1 EWC3 EWC4 EWC5 EWC6 EWC8 -------- -------- -------- -------- -------- -------- 0.223 0.706 0.608 0.395 0.560 0.364 Squared Multiple Correlations for X - Variables EWC9 AGEM GENDERM LEM -------- -------- -------- -------- 0.826 1.000 1.000 1.000 Goodness of Fit Statistics Degrees of Freedom = 70 Minimum Fit Function Chi-Square = 170.942 (P = 0.00) Estimated Non-centrality Parameter (NCP) = 100.942 90 Percent Confidence Interval for NCP = (66.374 ; 143.208) Minimum Fit Function Value = 0.606 Population Discrepancy Function Value (F0) = 0.358 90 Percent Confidence Interval for F0 = (0.235 ; 0.508) Root Mean Square Error of Approximation (RMSEA) = 0.0715 90 Percent Confidence Interval for RMSEA = (0.0580 ; 0.0852) P-Value for Test of Close Fit (RMSEA < 0.05) = 0.00534 Expected Cross-Validation Index (ECVI) = 0.854 90 Percent Confidence Interval for ECVI = (0.732 ; 1.004) ECVI for Saturated Model = 0.745 ECVI for Independence Model = 24.141
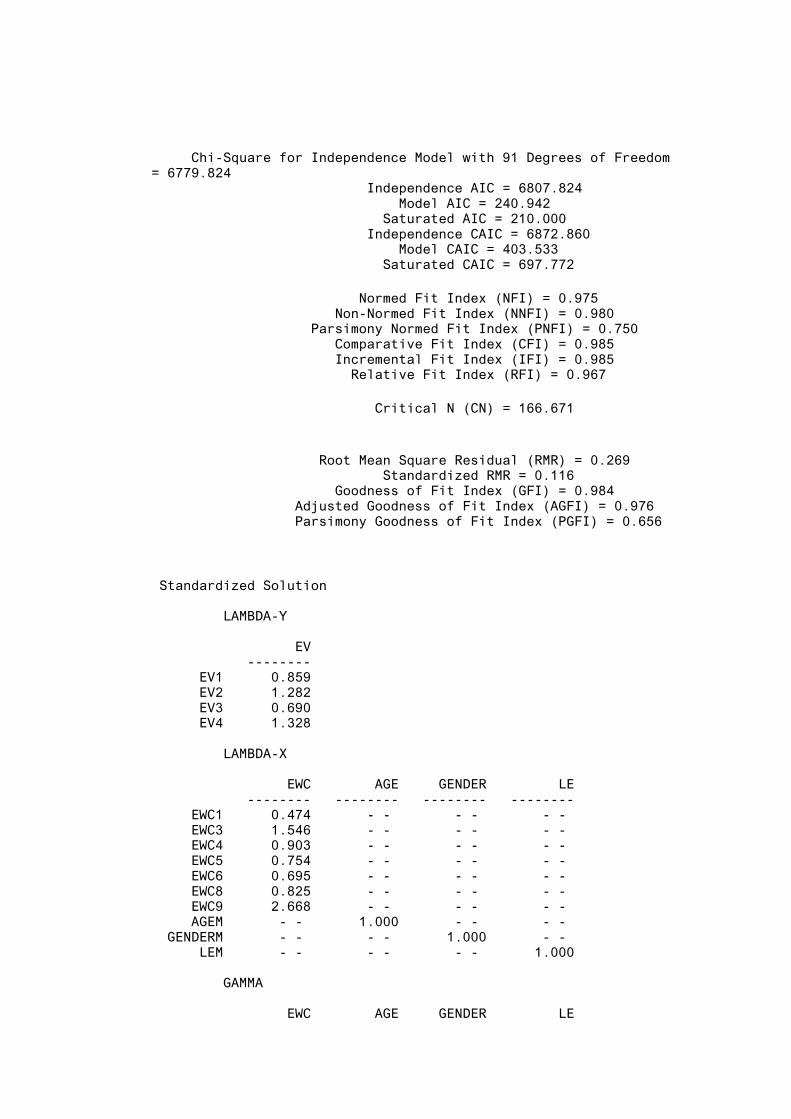
48
Chi-Square for Independence Model with 91 Degrees of Freedom = 6779.824 Independence AIC = 6807.824 Model AIC = 240.942 Saturated AIC = 210.000 Independence CAIC = 6872.860 Model CAIC = 403.533 Saturated CAIC = 697.772 Normed Fit Index (NFI) = 0.975 Non-Normed Fit Index (NNFI) = 0.980 Parsimony Normed Fit Index (PNFI) = 0.750 Comparative Fit Index (CFI) = 0.985 Incremental Fit Index (IFI) = 0.985 Relative Fit Index (RFI) = 0.967 Critical N (CN) = 166.671 Root Mean Square Residual (RMR) = 0.269 Standardized RMR = 0.116 Goodness of Fit Index (GFI) = 0.984 Adjusted Goodness of Fit Index (AGFI) = 0.976 Parsimony Goodness of Fit Index (PGFI) = 0.656
Standardized Solution LAMBDA-Y EV -------- EV1 0.859 EV2 1.282 EV3 0.690 EV4 1.328 LAMBDA-X EWC AGE GENDER LE -------- -------- -------- -------- EWC1 0.474 - - - - - - EWC3 1.546 - - - - - - EWC4 0.903 - - - - - - EWC5 0.754 - - - - - - EWC6 0.695 - - - - - - EWC8 0.825 - - - - - - EWC9 2.668 - - - - - - AGEM - - 1.000 - - - - GENDERM - - - - 1.000 - - LEM - - - - - - 1.000 GAMMA EWC AGE GENDER LE

49
-------- -------- -------- -------- EV 0.588 -0.742 0.202 0.681 Correlation Matrix of ETA and KSI EV EWC AGE GENDER LE -------- -------- -------- -------- -------- EV 1.000 EWC 0.563 1.000 AGE -0.091 -0.139 1.000 GENDER 0.025 -0.180 0.438 1.000 LE -0.025 -0.135 0.946 0.372 1.000 PSI EV -------- 0.614 Regression Matrix ETA on KSI (Standardized) EWC AGE GENDER LE -------- -------- -------- -------- EV 0.588 -0.742 0.202 0.681
Completely Standardized Solution LAMBDA-Y EV -------- EV1 0.763 EV2 0.891 EV3 0.678 EV4 0.910 LAMBDA-X EWC AGE GENDER LE -------- -------- -------- -------- EWC1 0.473 - - - - - - EWC3 0.840 - - - - - - EWC4 0.780 - - - - - - EWC5 0.629 - - - - - - EWC6 0.749 - - - - - - EWC8 0.603 - - - - - - EWC9 0.909 - - - - - - AGEM - - 1.000 - - - - GENDERM - - - - 1.000 - - LEM - - - - - - 1.000 GAMMA EWC AGE GENDER LE
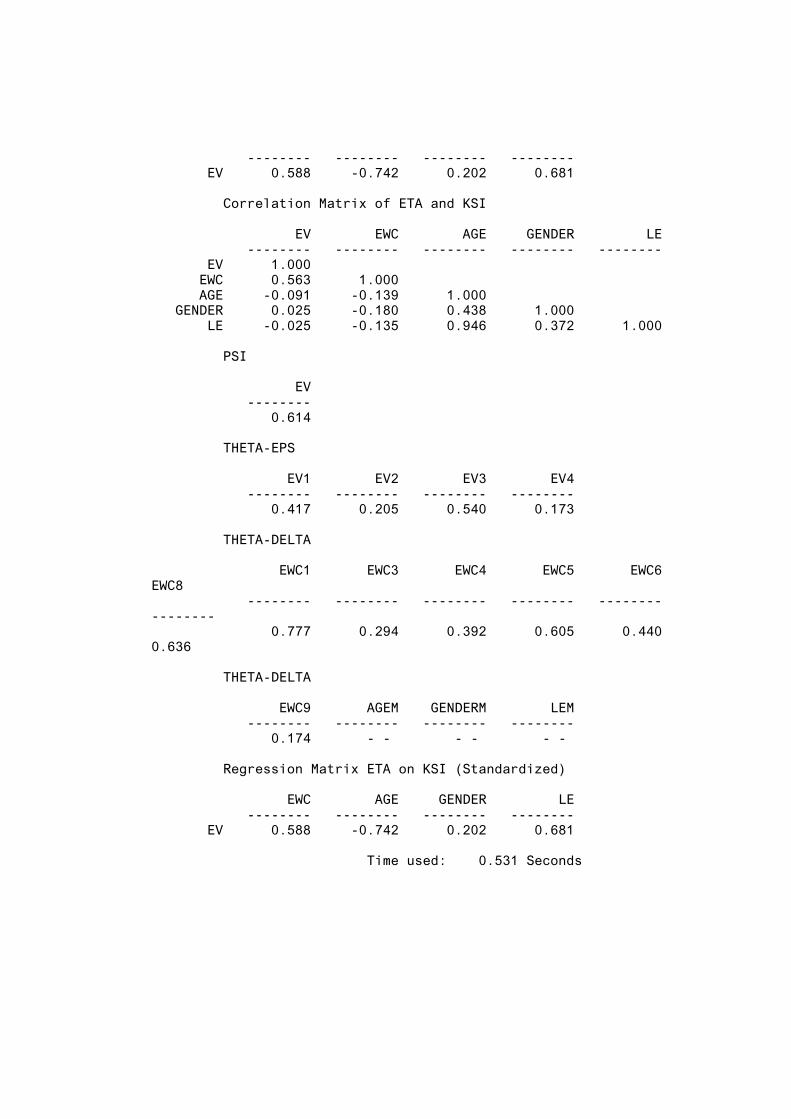
50
-------- -------- -------- -------- EV 0.588 -0.742 0.202 0.681 Correlation Matrix of ETA and KSI EV EWC AGE GENDER LE -------- -------- -------- -------- -------- EV 1.000 EWC 0.563 1.000 AGE -0.091 -0.139 1.000 GENDER 0.025 -0.180 0.438 1.000 LE -0.025 -0.135 0.946 0.372 1.000 PSI EV -------- 0.614 THETA-EPS EV1 EV2 EV3 EV4 -------- -------- -------- -------- 0.417 0.205 0.540 0.173 THETA-DELTA EWC1 EWC3 EWC4 EWC5 EWC6 EWC8 -------- -------- -------- -------- -------- -------- 0.777 0.294 0.392 0.605 0.440 0.636 THETA-DELTA EWC9 AGEM GENDERM LEM -------- -------- -------- -------- 0.174 - - - - - - Regression Matrix ETA on KSI (Standardized) EWC AGE GENDER LE -------- -------- -------- -------- EV 0.588 -0.742 0.202 0.681 Time used: 0.531 Seconds
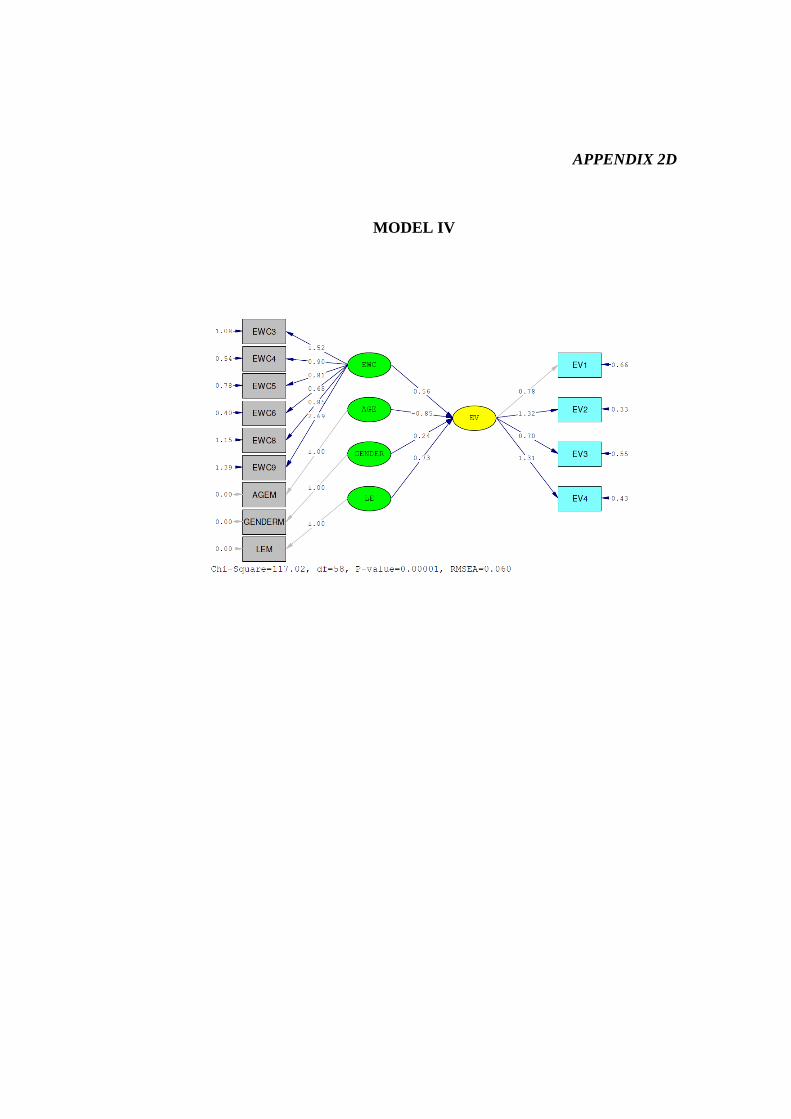
APPENDIX 2D
MODEL IV
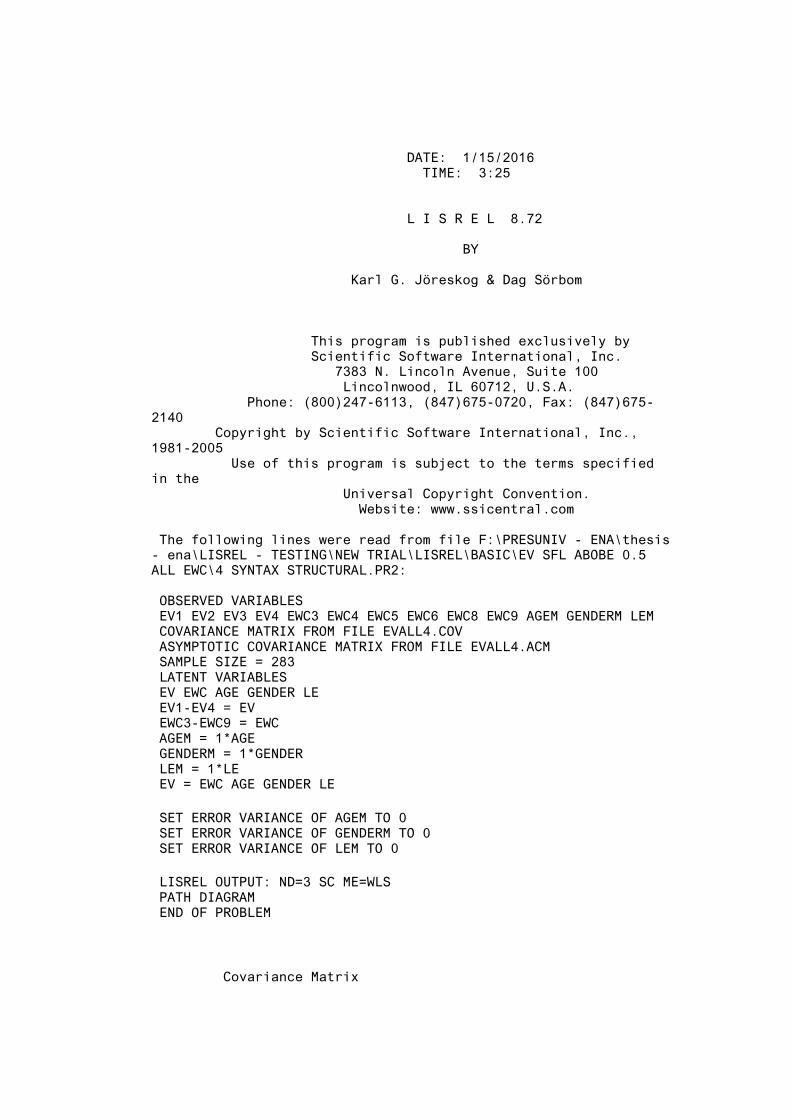
DATE: 1/15/2016 TIME: 3:25 L I S R E L 8.72 BY Karl G. Jöreskog & Dag Sörbom This program is published exclusively by Scientific Software International, Inc. 7383 N. Lincoln Avenue, Suite 100 Lincolnwood, IL 60712, U.S.A. Phone: (800)247-6113, (847)675-0720, Fax: (847)675-2140 Copyright by Scientific Software International, Inc., 1981-2005 Use of this program is subject to the terms specified in the Universal Copyright Convention. Website: www.ssicentral.com The following lines were read from file F:\PRESUNIV - ENA\thesis - ena\LISREL - TESTING\NEW TRIAL\LISREL\BASIC\EV SFL ABOBE 0.5 ALL EWC\4 SYNTAX STRUCTURAL.PR2: OBSERVED VARIABLES EV1 EV2 EV3 EV4 EWC3 EWC4 EWC5 EWC6 EWC8 EWC9 AGEM GENDERM LEM COVARIANCE MATRIX FROM FILE EVALL4.COV ASYMPTOTIC COVARIANCE MATRIX FROM FILE EVALL4.ACM SAMPLE SIZE = 283 LATENT VARIABLES EV EWC AGE GENDER LE EV1-EV4 = EV EWC3-EWC9 = EWC AGEM = 1*AGE GENDERM = 1*GENDER LEM = 1*LE EV = EWC AGE GENDER LE SET ERROR VARIANCE OF AGEM TO 0 SET ERROR VARIANCE OF GENDERM TO 0 SET ERROR VARIANCE OF LEM TO 0 LISREL OUTPUT: ND=3 SC ME=WLS PATH DIAGRAM END OF PROBLEM
Covariance Matrix
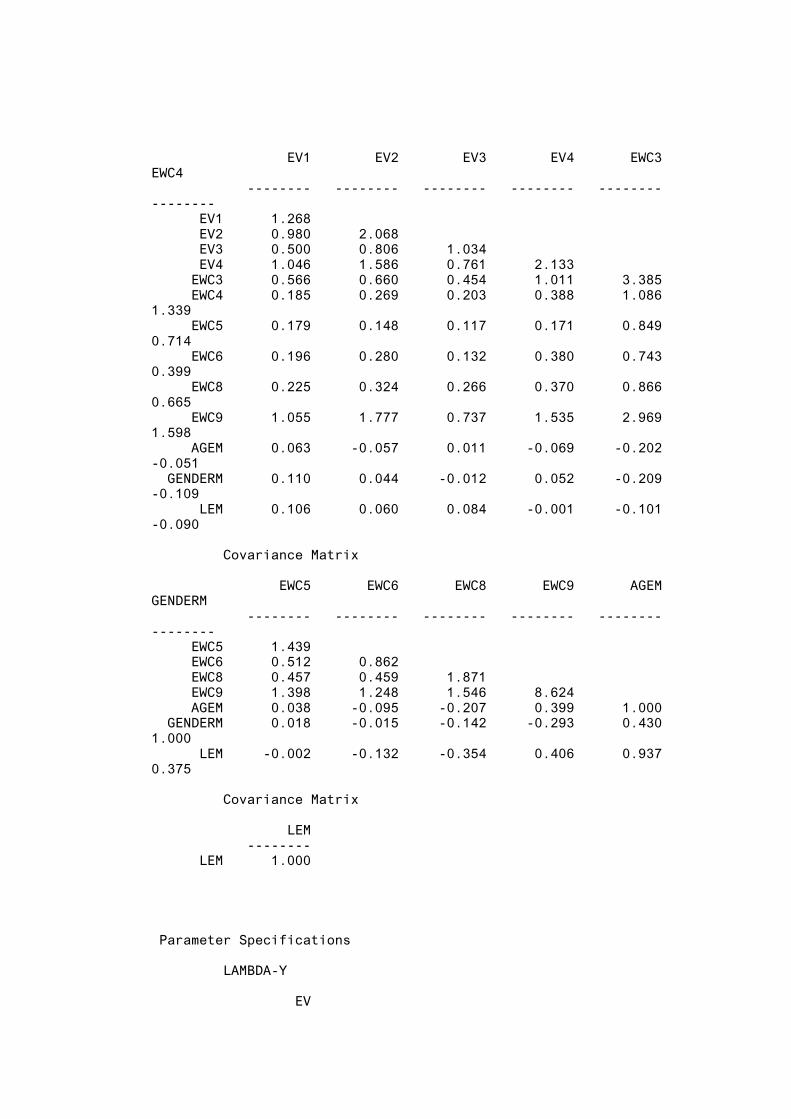
53
EV1 EV2 EV3 EV4 EWC3 EWC4 -------- -------- -------- -------- -------- -------- EV1 1.268 EV2 0.980 2.068 EV3 0.500 0.806 1.034 EV4 1.046 1.586 0.761 2.133 EWC3 0.566 0.660 0.454 1.011 3.385 EWC4 0.185 0.269 0.203 0.388 1.086 1.339 EWC5 0.179 0.148 0.117 0.171 0.849 0.714 EWC6 0.196 0.280 0.132 0.380 0.743 0.399 EWC8 0.225 0.324 0.266 0.370 0.866 0.665 EWC9 1.055 1.777 0.737 1.535 2.969 1.598 AGEM 0.063 -0.057 0.011 -0.069 -0.202 -0.051 GENDERM 0.110 0.044 -0.012 0.052 -0.209 -0.109 LEM 0.106 0.060 0.084 -0.001 -0.101 -0.090 Covariance Matrix EWC5 EWC6 EWC8 EWC9 AGEM GENDERM -------- -------- -------- -------- -------- -------- EWC5 1.439 EWC6 0.512 0.862 EWC8 0.457 0.459 1.871 EWC9 1.398 1.248 1.546 8.624 AGEM 0.038 -0.095 -0.207 0.399 1.000 GENDERM 0.018 -0.015 -0.142 -0.293 0.430 1.000 LEM -0.002 -0.132 -0.354 0.406 0.937 0.375 Covariance Matrix LEM -------- LEM 1.000
Parameter Specifications LAMBDA-Y EV
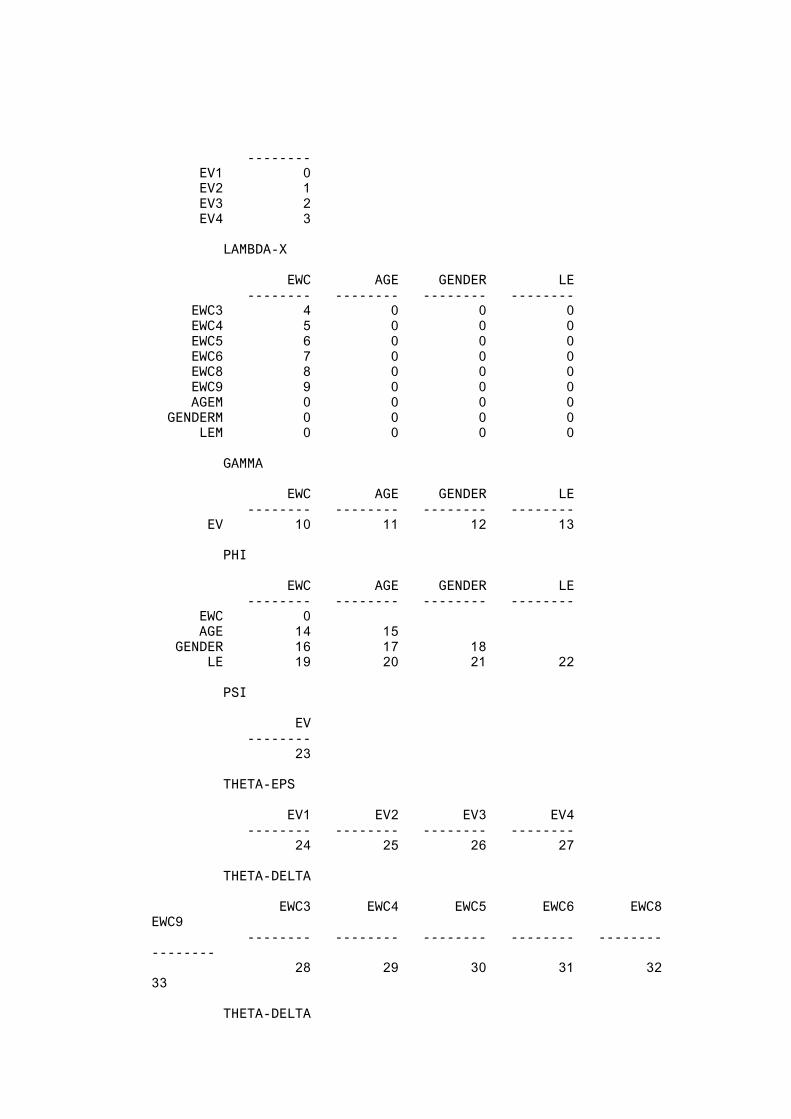
54
-------- EV1 0 EV2 1 EV3 2 EV4 3 LAMBDA-X EWC AGE GENDER LE -------- -------- -------- -------- EWC3 4 0 0 0 EWC4 5 0 0 0 EWC5 6 0 0 0 EWC6 7 0 0 0 EWC8 8 0 0 0 EWC9 9 0 0 0 AGEM 0 0 0 0 GENDERM 0 0 0 0 LEM 0 0 0 0 GAMMA EWC AGE GENDER LE -------- -------- -------- -------- EV 10 11 12 13 PHI EWC AGE GENDER LE -------- -------- -------- -------- EWC 0 AGE 14 15 GENDER 16 17 18 LE 19 20 21 22 PSI EV -------- 23 THETA-EPS EV1 EV2 EV3 EV4 -------- -------- -------- -------- 24 25 26 27 THETA-DELTA EWC3 EWC4 EWC5 EWC6 EWC8 EWC9 -------- -------- -------- -------- -------- -------- 28 29 30 31 32 33 THETA-DELTA
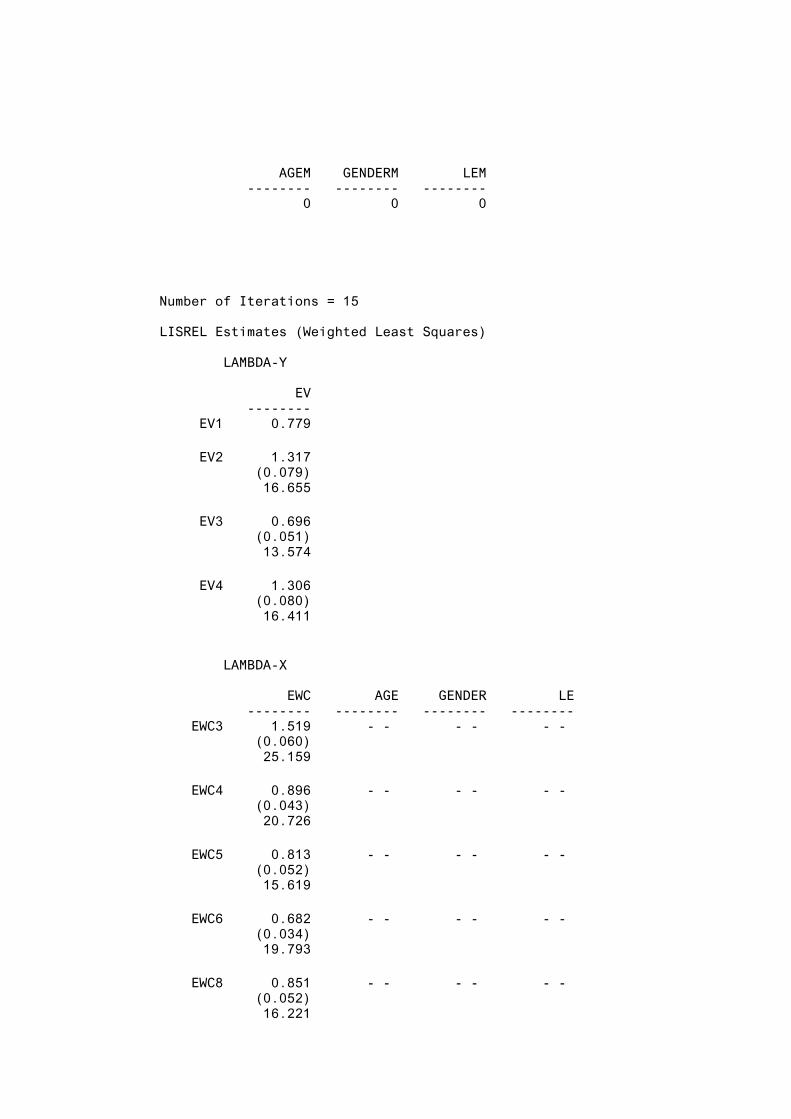
55
AGEM GENDERM LEM -------- -------- -------- 0 0 0
Number of Iterations = 15 LISREL Estimates (Weighted Least Squares) LAMBDA-Y EV -------- EV1 0.779 EV2 1.317 (0.079) 16.655 EV3 0.696 (0.051) 13.574 EV4 1.306 (0.080) 16.411 LAMBDA-X EWC AGE GENDER LE -------- -------- -------- -------- EWC3 1.519 - - - - - - (0.060) 25.159 EWC4 0.896 - - - - - - (0.043) 20.726 EWC5 0.813 - - - - - - (0.052) 15.619 EWC6 0.682 - - - - - - (0.034) 19.793 EWC8 0.851 - - - - - - (0.052) 16.221
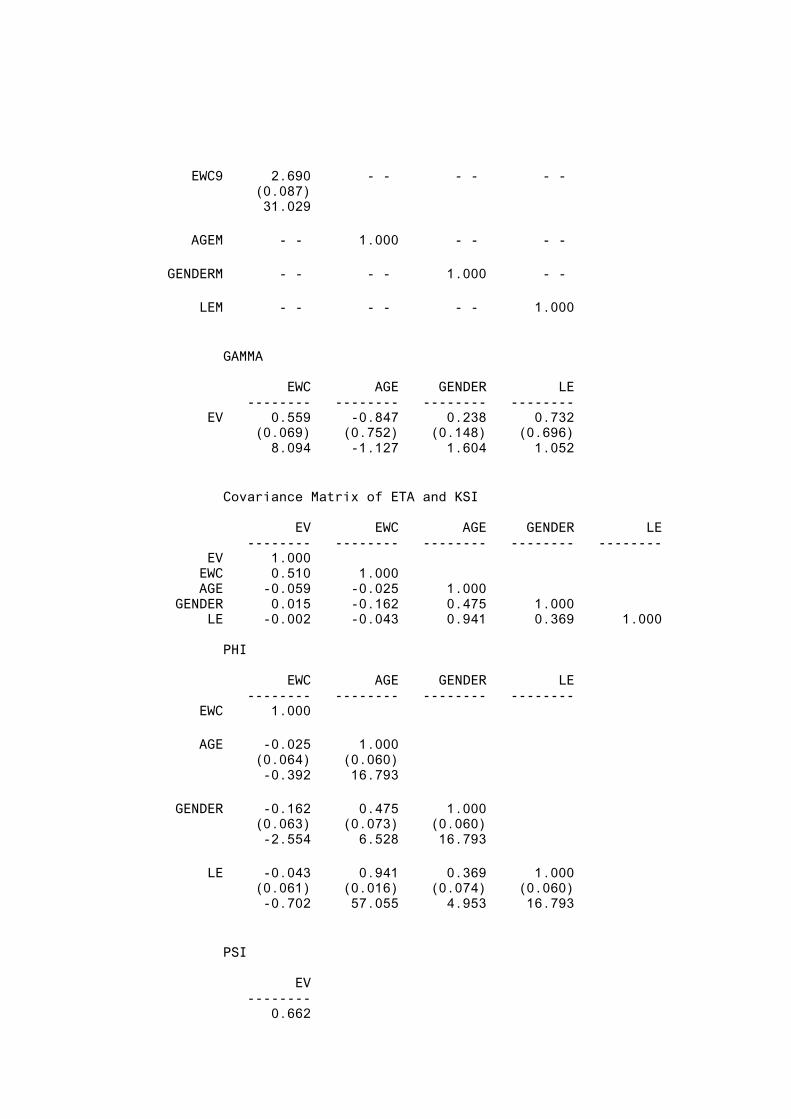
56
EWC9 2.690 - - - - - - (0.087) 31.029 AGEM - - 1.000 - - - - GENDERM - - - - 1.000 - - LEM - - - - - - 1.000 GAMMA EWC AGE GENDER LE -------- -------- -------- -------- EV 0.559 -0.847 0.238 0.732 (0.069) (0.752) (0.148) (0.696) 8.094 -1.127 1.604 1.052 Covariance Matrix of ETA and KSI EV EWC AGE GENDER LE -------- -------- -------- -------- -------- EV 1.000 EWC 0.510 1.000 AGE -0.059 -0.025 1.000 GENDER 0.015 -0.162 0.475 1.000 LE -0.002 -0.043 0.941 0.369 1.000 PHI EWC AGE GENDER LE -------- -------- -------- -------- EWC 1.000 AGE -0.025 1.000 (0.064) (0.060) -0.392 16.793 GENDER -0.162 0.475 1.000 (0.063) (0.073) (0.060) -2.554 6.528 16.793 LE -0.043 0.941 0.369 1.000 (0.061) (0.016) (0.074) (0.060) -0.702 57.055 4.953 16.793 PSI EV -------- 0.662
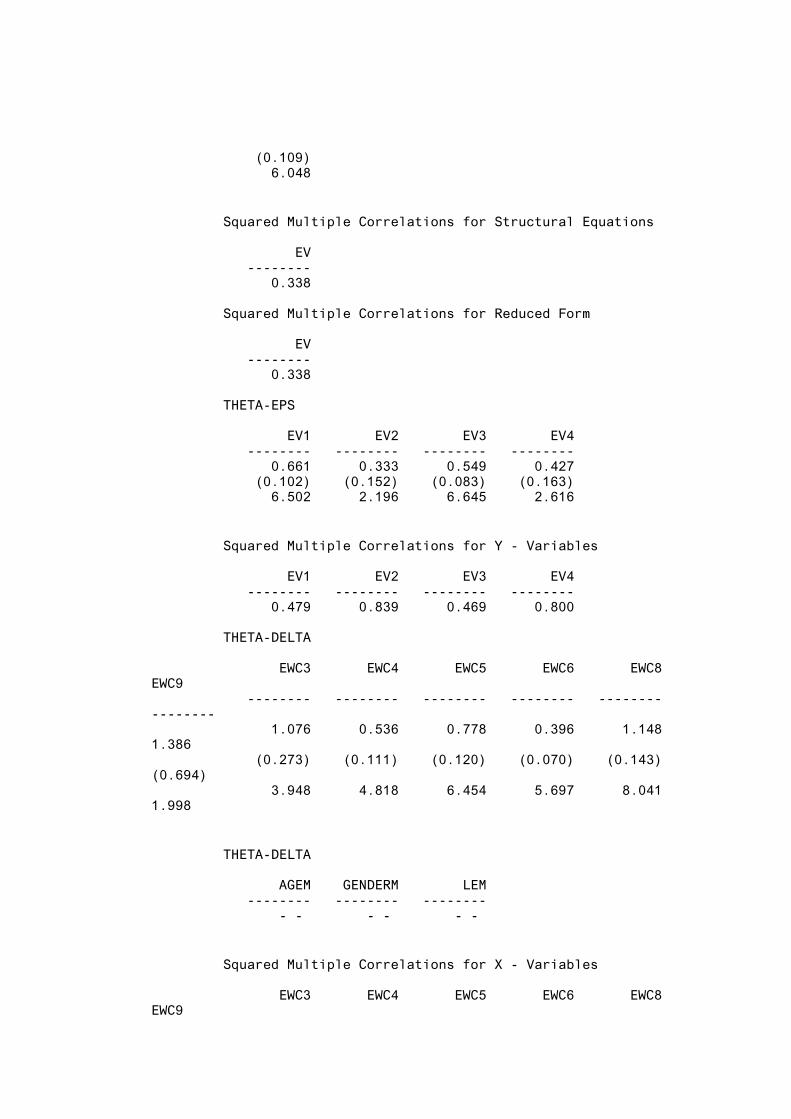
57
(0.109) 6.048 Squared Multiple Correlations for Structural Equations EV -------- 0.338 Squared Multiple Correlations for Reduced Form EV -------- 0.338 THETA-EPS EV1 EV2 EV3 EV4 -------- -------- -------- -------- 0.661 0.333 0.549 0.427 (0.102) (0.152) (0.083) (0.163) 6.502 2.196 6.645 2.616 Squared Multiple Correlations for Y - Variables EV1 EV2 EV3 EV4 -------- -------- -------- -------- 0.479 0.839 0.469 0.800 THETA-DELTA EWC3 EWC4 EWC5 EWC6 EWC8 EWC9 -------- -------- -------- -------- -------- -------- 1.076 0.536 0.778 0.396 1.148 1.386 (0.273) (0.111) (0.120) (0.070) (0.143) (0.694) 3.948 4.818 6.454 5.697 8.041 1.998 THETA-DELTA AGEM GENDERM LEM -------- -------- -------- - - - - - - Squared Multiple Correlations for X - Variables EWC3 EWC4 EWC5 EWC6 EWC8 EWC9
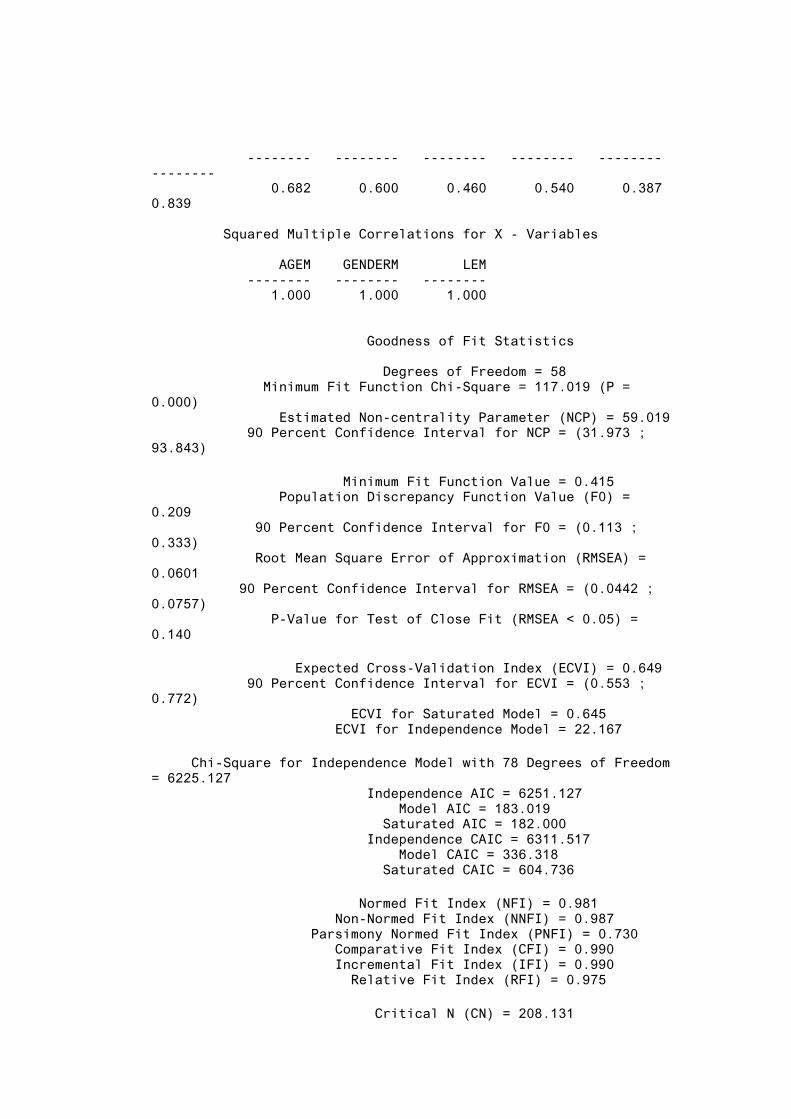
58
-------- -------- -------- -------- -------- -------- 0.682 0.600 0.460 0.540 0.387 0.839 Squared Multiple Correlations for X - Variables AGEM GENDERM LEM -------- -------- -------- 1.000 1.000 1.000 Goodness of Fit Statistics Degrees of Freedom = 58 Minimum Fit Function Chi-Square = 117.019 (P = 0.000) Estimated Non-centrality Parameter (NCP) = 59.019 90 Percent Confidence Interval for NCP = (31.973 ; 93.843) Minimum Fit Function Value = 0.415 Population Discrepancy Function Value (F0) = 0.209 90 Percent Confidence Interval for F0 = (0.113 ; 0.333) Root Mean Square Error of Approximation (RMSEA) = 0.0601 90 Percent Confidence Interval for RMSEA = (0.0442 ; 0.0757) P-Value for Test of Close Fit (RMSEA < 0.05) = 0.140 Expected Cross-Validation Index (ECVI) = 0.649 90 Percent Confidence Interval for ECVI = (0.553 ; 0.772) ECVI for Saturated Model = 0.645 ECVI for Independence Model = 22.167 Chi-Square for Independence Model with 78 Degrees of Freedom = 6225.127 Independence AIC = 6251.127 Model AIC = 183.019 Saturated AIC = 182.000 Independence CAIC = 6311.517 Model CAIC = 336.318 Saturated CAIC = 604.736 Normed Fit Index (NFI) = 0.981 Non-Normed Fit Index (NNFI) = 0.987 Parsimony Normed Fit Index (PNFI) = 0.730 Comparative Fit Index (CFI) = 0.990 Incremental Fit Index (IFI) = 0.990 Relative Fit Index (RFI) = 0.975 Critical N (CN) = 208.131

59
Root Mean Square Residual (RMR) = 0.254 Standardized RMR = 0.104 Goodness of Fit Index (GFI) = 0.988 Adjusted Goodness of Fit Index (AGFI) = 0.981 Parsimony Goodness of Fit Index (PGFI) = 0.630
Standardized Solution LAMBDA-Y EV -------- EV1 0.779 EV2 1.317 EV3 0.696 EV4 1.306 LAMBDA-X EWC AGE GENDER LE -------- -------- -------- -------- EWC3 1.519 - - - - - - EWC4 0.896 - - - - - - EWC5 0.813 - - - - - - EWC6 0.682 - - - - - - EWC8 0.851 - - - - - - EWC9 2.690 - - - - - - AGEM - - 1.000 - - - - GENDERM - - - - 1.000 - - LEM - - - - - - 1.000 GAMMA EWC AGE GENDER LE -------- -------- -------- -------- EV 0.559 -0.847 0.238 0.732 Correlation Matrix of ETA and KSI EV EWC AGE GENDER LE -------- -------- -------- -------- -------- EV 1.000 EWC 0.510 1.000 AGE -0.059 -0.025 1.000 GENDER 0.015 -0.162 0.475 1.000 LE -0.002 -0.043 0.941 0.369 1.000 PSI EV -------- 0.662

60
Regression Matrix ETA on KSI (Standardized) EWC AGE GENDER LE -------- -------- -------- -------- EV 0.559 -0.847 0.238 0.732
Completely Standardized Solution LAMBDA-Y EV -------- EV1 0.692 EV2 0.916 EV3 0.685 EV4 0.894 LAMBDA-X EWC AGE GENDER LE -------- -------- -------- -------- EWC3 0.826 - - - - - - EWC4 0.775 - - - - - - EWC5 0.678 - - - - - - EWC6 0.735 - - - - - - EWC8 0.622 - - - - - - EWC9 0.916 - - - - - - AGEM - - 1.000 - - - - GENDERM - - - - 1.000 - - LEM - - - - - - 1.000 GAMMA EWC AGE GENDER LE -------- -------- -------- -------- EV 0.559 -0.847 0.238 0.732 Correlation Matrix of ETA and KSI EV EWC AGE GENDER LE -------- -------- -------- -------- -------- EV 1.000 EWC 0.510 1.000 AGE -0.059 -0.025 1.000 GENDER 0.015 -0.162 0.475 1.000 LE -0.002 -0.043 0.941 0.369 1.000 PSI EV -------- 0.662
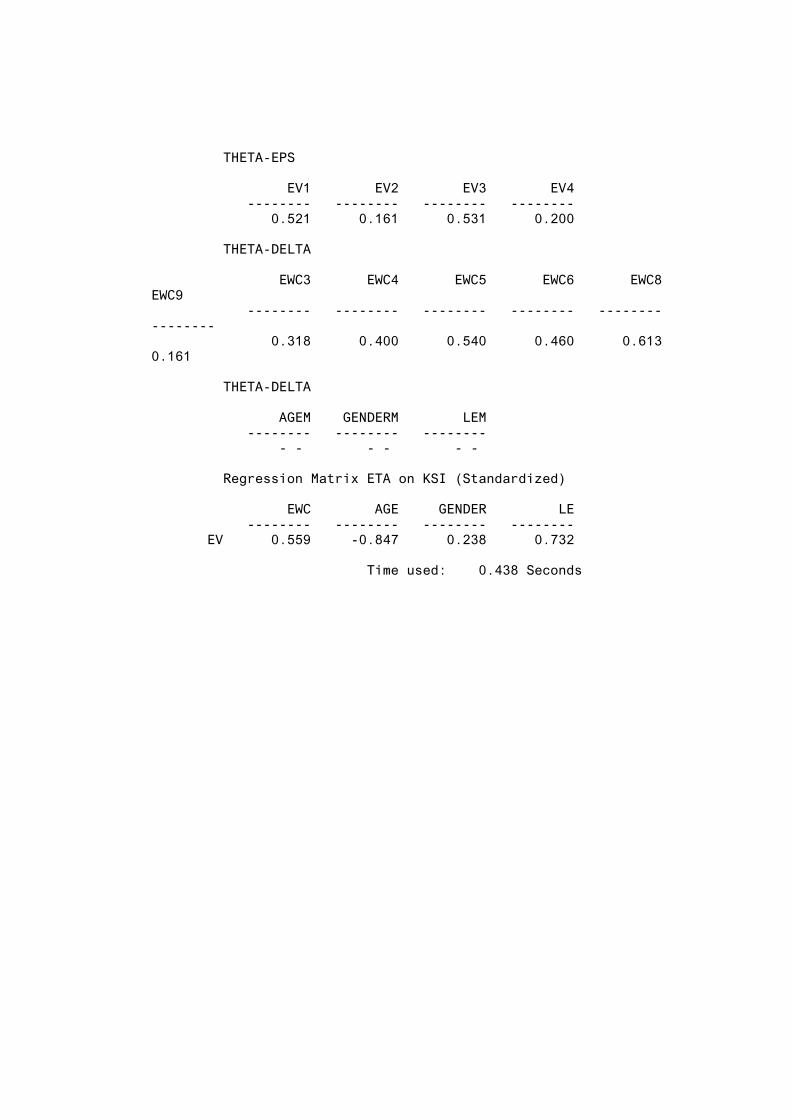
61
THETA-EPS EV1 EV2 EV3 EV4 -------- -------- -------- -------- 0.521 0.161 0.531 0.200 THETA-DELTA EWC3 EWC4 EWC5 EWC6 EWC8 EWC9 -------- -------- -------- -------- -------- -------- 0.318 0.400 0.540 0.460 0.613 0.161 THETA-DELTA AGEM GENDERM LEM -------- -------- -------- - - - - - - Regression Matrix ETA on KSI (Standardized) EWC AGE GENDER LE -------- -------- -------- -------- EV 0.559 -0.847 0.238 0.732 Time used: 0.438 Seconds
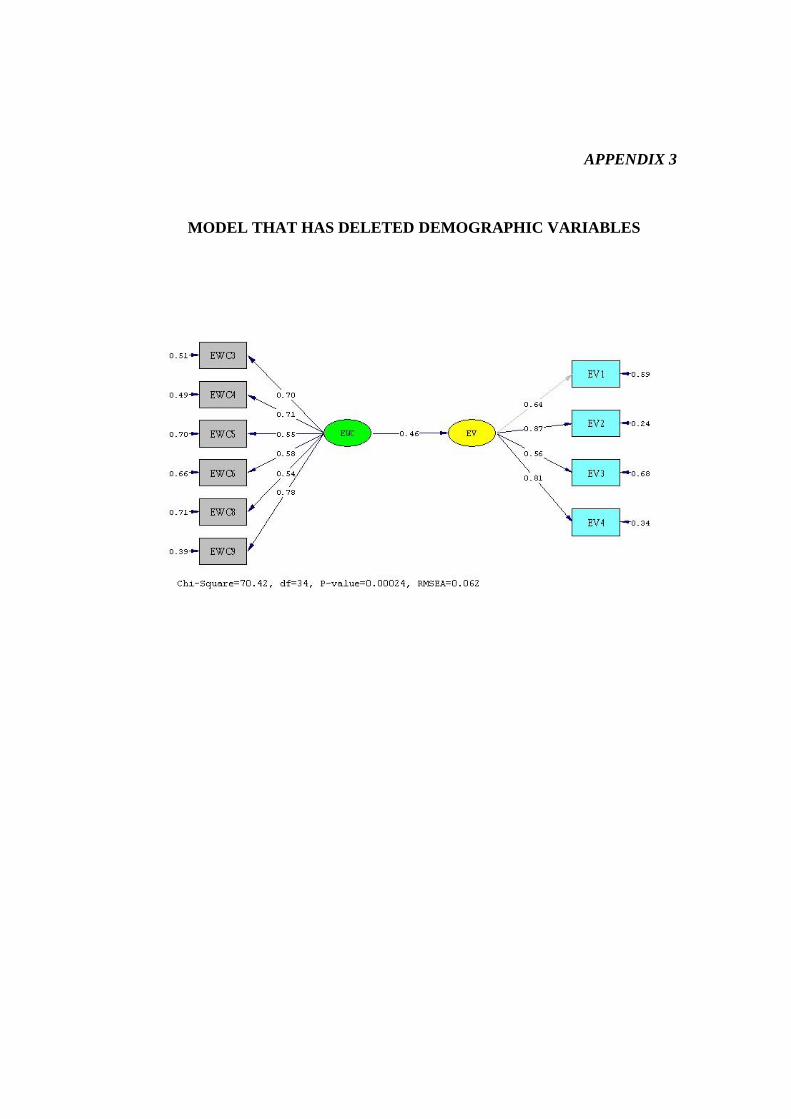
APPENDIX 3
MODEL THAT HAS DELETED DEMOGRAPHIC VARIABLES
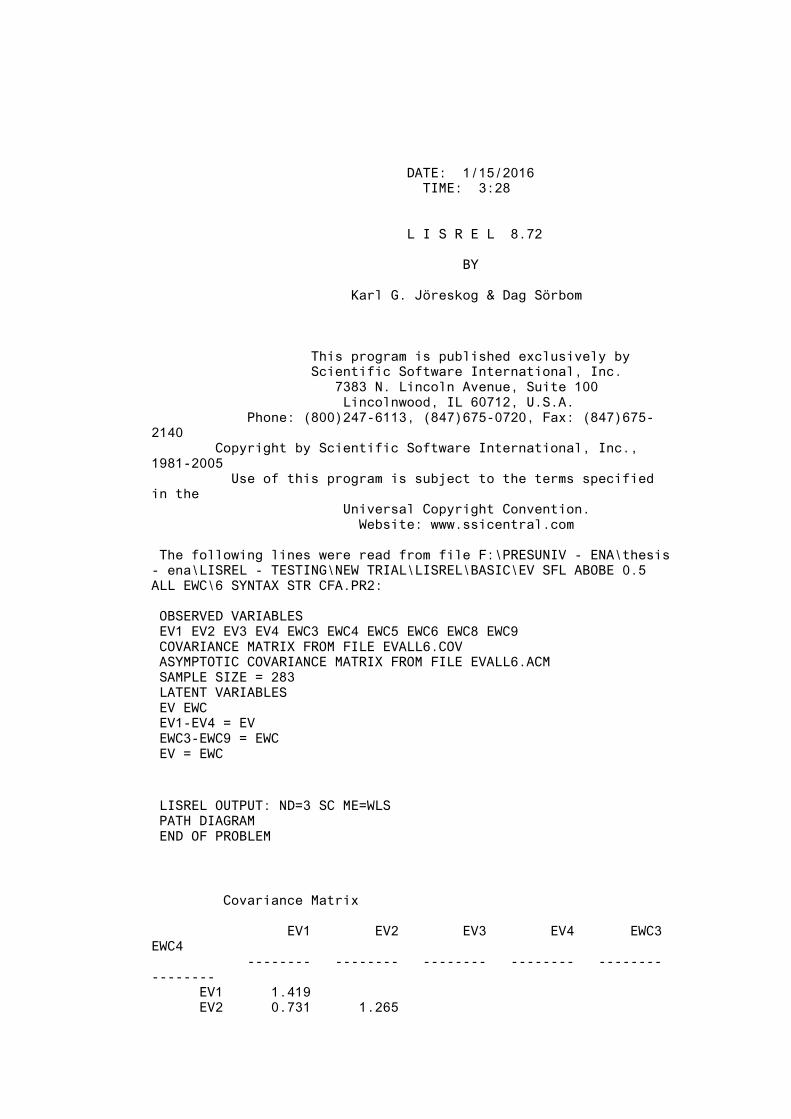
DATE: 1/15/2016 TIME: 3:28 L I S R E L 8.72 BY Karl G. Jöreskog & Dag Sörbom This program is published exclusively by Scientific Software International, Inc. 7383 N. Lincoln Avenue, Suite 100 Lincolnwood, IL 60712, U.S.A. Phone: (800)247-6113, (847)675-0720, Fax: (847)675-2140 Copyright by Scientific Software International, Inc., 1981-2005 Use of this program is subject to the terms specified in the Universal Copyright Convention. Website: www.ssicentral.com The following lines were read from file F:\PRESUNIV - ENA\thesis - ena\LISREL - TESTING\NEW TRIAL\LISREL\BASIC\EV SFL ABOBE 0.5 ALL EWC\6 SYNTAX STR CFA.PR2: OBSERVED VARIABLES EV1 EV2 EV3 EV4 EWC3 EWC4 EWC5 EWC6 EWC8 EWC9 COVARIANCE MATRIX FROM FILE EVALL6.COV ASYMPTOTIC COVARIANCE MATRIX FROM FILE EVALL6.ACM SAMPLE SIZE = 283 LATENT VARIABLES EV EWC EV1-EV4 = EV EWC3-EWC9 = EWC EV = EWC LISREL OUTPUT: ND=3 SC ME=WLS PATH DIAGRAM END OF PROBLEM
Covariance Matrix EV1 EV2 EV3 EV4 EWC3 EWC4 -------- -------- -------- -------- -------- -------- EV1 1.419 EV2 0.731 1.265

64
EV3 0.494 0.601 1.129 EV4 0.733 0.856 0.543 1.234 EWC3 0.219 0.180 0.173 0.282 0.664 EWC4 0.083 0.083 0.122 0.136 0.285 0.717 EWC5 0.106 0.056 0.074 0.067 0.240 0.294 EWC6 0.148 0.145 0.103 0.209 0.262 0.223 EWC8 0.108 0.110 0.139 0.120 0.189 0.295 EWC9 0.273 0.298 0.201 0.256 0.357 0.284 Covariance Matrix EWC5 EWC6 EWC8 EWC9 -------- -------- -------- -------- EWC5 0.641 EWC6 0.254 0.640 EWC8 0.175 0.213 0.787 EWC9 0.265 0.275 0.217 0.720
Parameter Specifications LAMBDA-Y EV -------- EV1 0 EV2 1 EV3 2 EV4 3 LAMBDA-X EWC -------- EWC3 4 EWC4 5 EWC5 6 EWC6 7 EWC8 8 EWC9 9 GAMMA EWC -------- EV 10 PSI
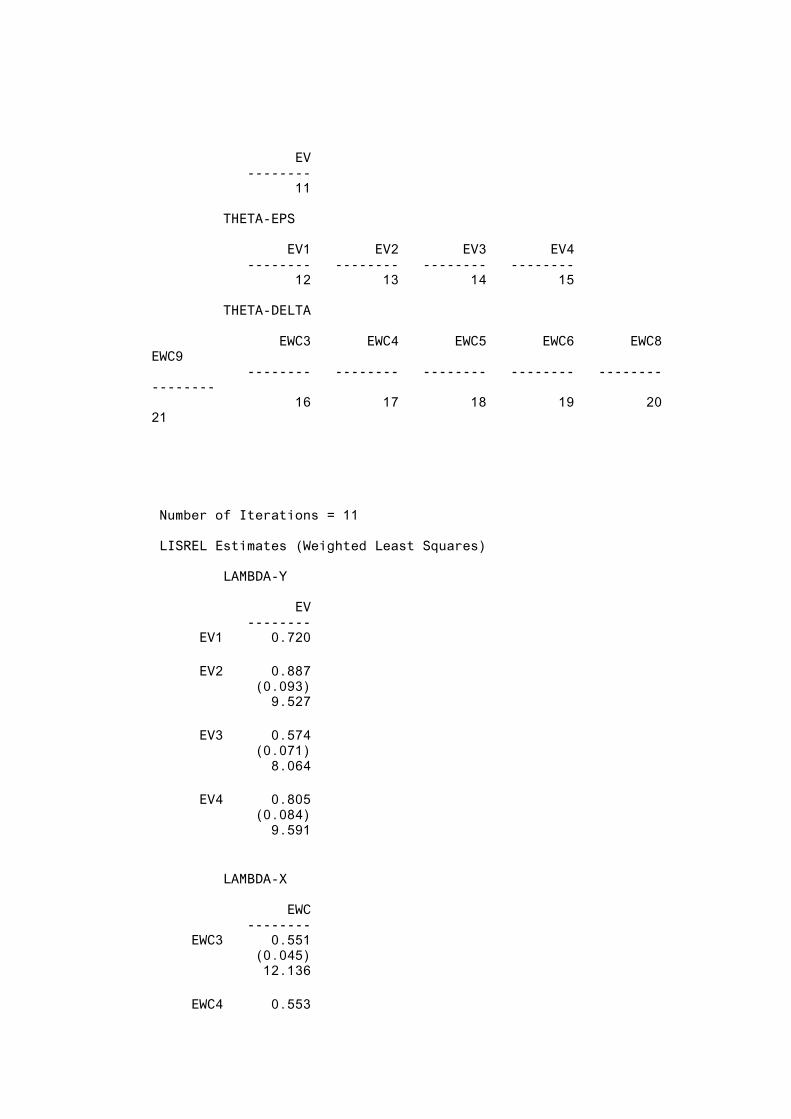
65
EV -------- 11 THETA-EPS EV1 EV2 EV3 EV4 -------- -------- -------- -------- 12 13 14 15 THETA-DELTA EWC3 EWC4 EWC5 EWC6 EWC8 EWC9 -------- -------- -------- -------- -------- -------- 16 17 18 19 20 21
Number of Iterations = 11 LISREL Estimates (Weighted Least Squares) LAMBDA-Y EV -------- EV1 0.720 EV2 0.887 (0.093) 9.527 EV3 0.574 (0.071) 8.064 EV4 0.805 (0.084) 9.591 LAMBDA-X EWC -------- EWC3 0.551 (0.045) 12.136 EWC4 0.553
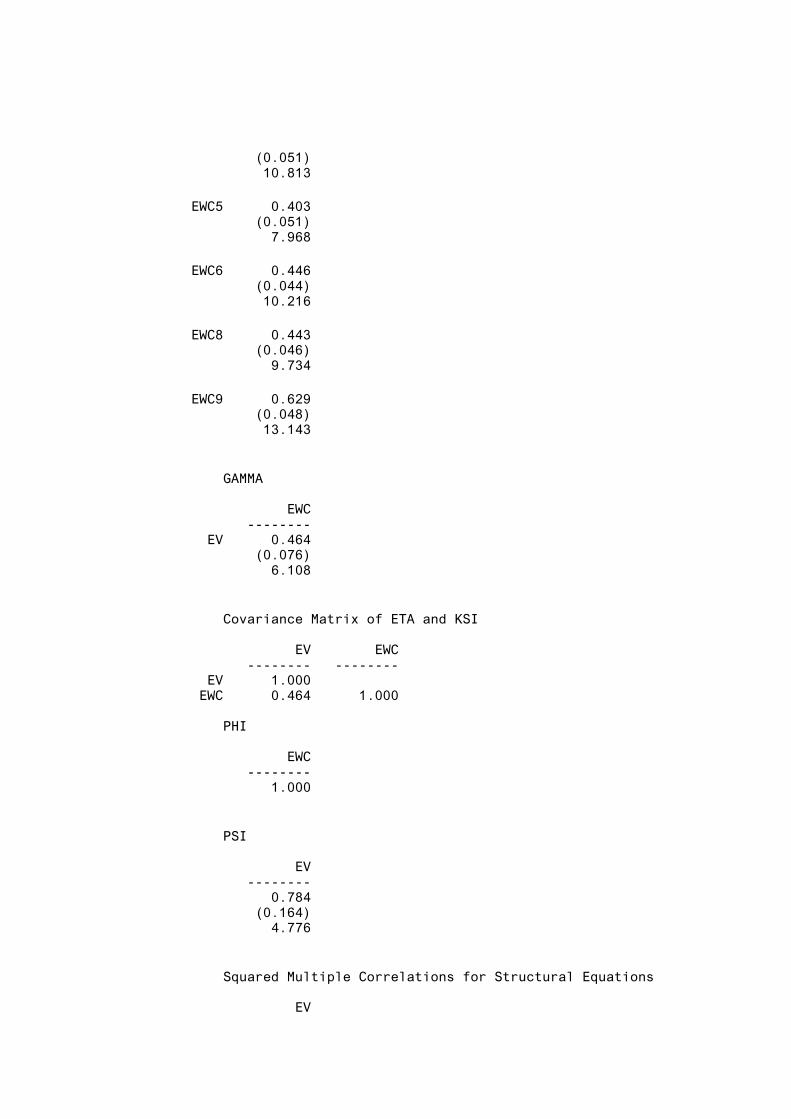
66
(0.051) 10.813 EWC5 0.403 (0.051) 7.968 EWC6 0.446 (0.044) 10.216 EWC8 0.443 (0.046) 9.734 EWC9 0.629 (0.048) 13.143 GAMMA EWC -------- EV 0.464 (0.076) 6.108 Covariance Matrix of ETA and KSI EV EWC -------- -------- EV 1.000 EWC 0.464 1.000 PHI EWC -------- 1.000 PSI EV -------- 0.784 (0.164) 4.776 Squared Multiple Correlations for Structural Equations EV
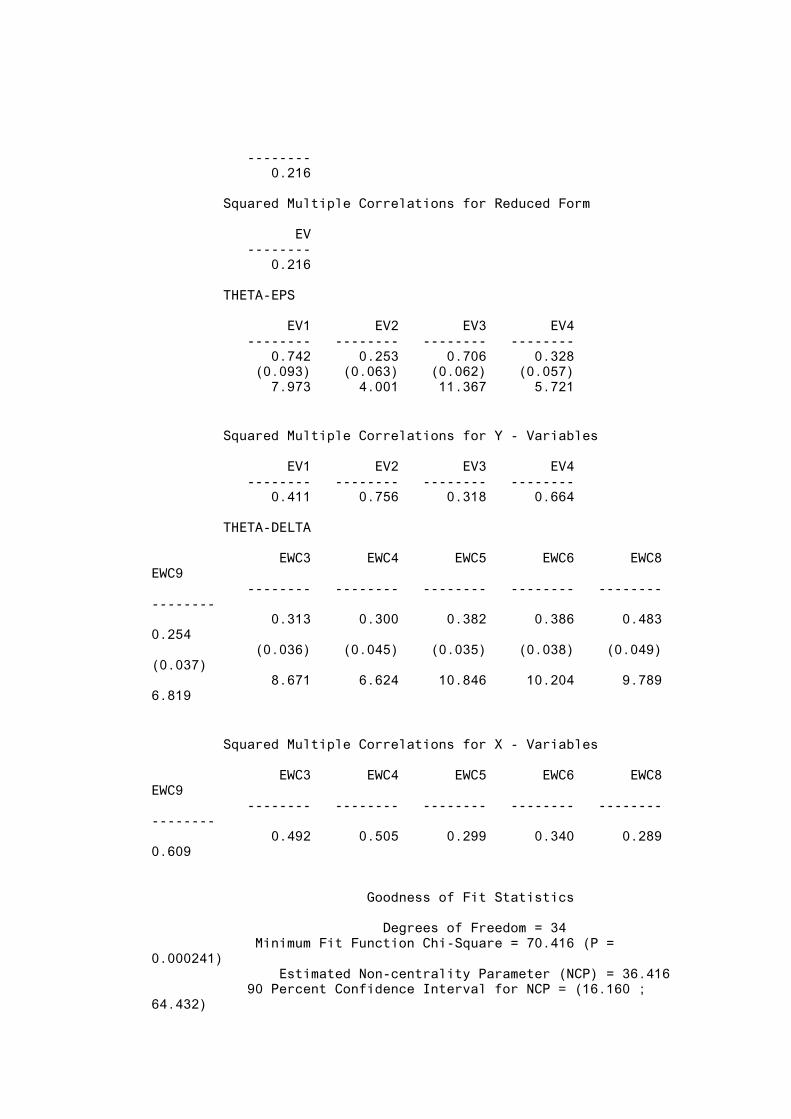
67
-------- 0.216 Squared Multiple Correlations for Reduced Form EV -------- 0.216 THETA-EPS EV1 EV2 EV3 EV4 -------- -------- -------- -------- 0.742 0.253 0.706 0.328 (0.093) (0.063) (0.062) (0.057) 7.973 4.001 11.367 5.721 Squared Multiple Correlations for Y - Variables EV1 EV2 EV3 EV4 -------- -------- -------- -------- 0.411 0.756 0.318 0.664 THETA-DELTA EWC3 EWC4 EWC5 EWC6 EWC8 EWC9 -------- -------- -------- -------- -------- -------- 0.313 0.300 0.382 0.386 0.483 0.254 (0.036) (0.045) (0.035) (0.038) (0.049) (0.037) 8.671 6.624 10.846 10.204 9.789 6.819 Squared Multiple Correlations for X - Variables EWC3 EWC4 EWC5 EWC6 EWC8 EWC9 -------- -------- -------- -------- -------- -------- 0.492 0.505 0.299 0.340 0.289 0.609 Goodness of Fit Statistics Degrees of Freedom = 34 Minimum Fit Function Chi-Square = 70.416 (P = 0.000241) Estimated Non-centrality Parameter (NCP) = 36.416 90 Percent Confidence Interval for NCP = (16.160 ; 64.432)

68
Minimum Fit Function Value = 0.250 Population Discrepancy Function Value (F0) = 0.129 90 Percent Confidence Interval for F0 = (0.0573 ; 0.228) Root Mean Square Error of Approximation (RMSEA) = 0.0616 90 Percent Confidence Interval for RMSEA = (0.0411 ; 0.0820) P-Value for Test of Close Fit (RMSEA < 0.05) = 0.163 Expected Cross-Validation Index (ECVI) = 0.399 90 Percent Confidence Interval for ECVI = (0.327 ; 0.498) ECVI for Saturated Model = 0.390 ECVI for Independence Model = 0.978 Chi-Square for Independence Model with 45 Degrees of Freedom = 255.812 Independence AIC = 275.812 Model AIC = 112.416 Saturated AIC = 110.000 Independence CAIC = 322.267 Model CAIC = 209.970 Saturated CAIC = 365.500 Normed Fit Index (NFI) = 0.725 Non-Normed Fit Index (NNFI) = 0.771 Parsimony Normed Fit Index (PNFI) = 0.548 Comparative Fit Index (CFI) = 0.827 Incremental Fit Index (IFI) = 0.836 Relative Fit Index (RFI) = 0.636 Critical N (CN) = 225.514 Root Mean Square Residual (RMR) = 0.0834 Standardized RMR = 0.0983 Goodness of Fit Index (GFI) = 0.938 Adjusted Goodness of Fit Index (AGFI) = 0.899 Parsimony Goodness of Fit Index (PGFI) = 0.580
Standardized Solution LAMBDA-Y EV -------- EV1 0.720 EV2 0.887 EV3 0.574
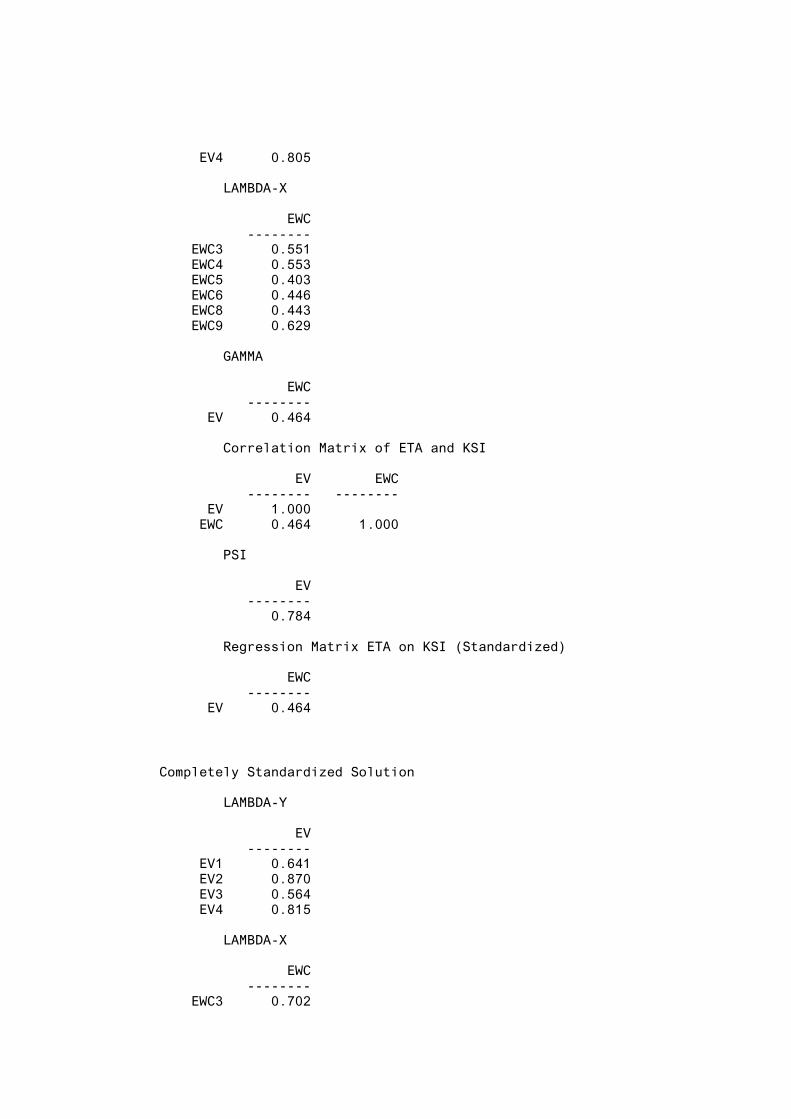
69
EV4 0.805 LAMBDA-X EWC -------- EWC3 0.551 EWC4 0.553 EWC5 0.403 EWC6 0.446 EWC8 0.443 EWC9 0.629 GAMMA EWC -------- EV 0.464 Correlation Matrix of ETA and KSI EV EWC -------- -------- EV 1.000 EWC 0.464 1.000 PSI EV -------- 0.784 Regression Matrix ETA on KSI (Standardized) EWC -------- EV 0.464
Completely Standardized Solution LAMBDA-Y EV -------- EV1 0.641 EV2 0.870 EV3 0.564 EV4 0.815 LAMBDA-X EWC -------- EWC3 0.702

70
EWC4 0.711 EWC5 0.546 EWC6 0.583 EWC8 0.538 EWC9 0.781 GAMMA EWC -------- EV 0.464 Correlation Matrix of ETA and KSI EV EWC -------- -------- EV 1.000 EWC 0.464 1.000 PSI EV -------- 0.784 THETA-EPS EV1 EV2 EV3 EV4 -------- -------- -------- -------- 0.589 0.244 0.682 0.336 THETA-DELTA EWC3 EWC4 EWC5 EWC6 EWC8 EWC9 -------- -------- -------- -------- -------- -------- 0.508 0.495 0.701 0.660 0.711 0.391 Regression Matrix ETA on KSI (Standardized) EWC -------- EV 0.464 Time used: 0.125 Seconds
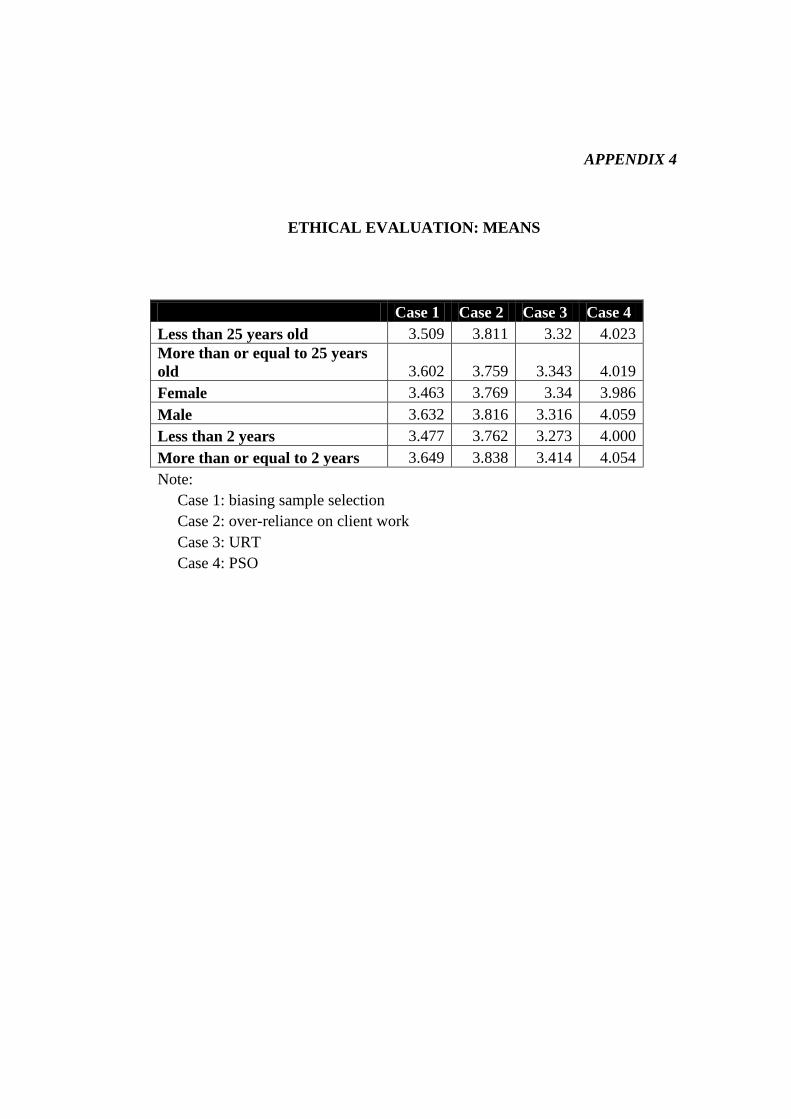
71
APPENDIX 4
ETHICAL EVALUATION: MEANS
Case 1 Case 2 Case 3 Case 4
Less than 25 years old 3.509 3.811 3.32 4.023
More than or equal to 25 years
old 3.602 3.759 3.343 4.019
Female 3.463 3.769 3.34 3.986
Male 3.632 3.816 3.316 4.059
Less than 2 years 3.477 3.762 3.273 4.000
More than or equal to 2 years 3.649 3.838 3.414 4.054
Note:
Case 1: biasing sample selection
Case 2: over-reliance on client work
Case 3: URT
Case 4: PSO
72
APPENDIX 5
QUESTIONNAIRES
This questionnaire prepared in regards to my data collection in thesis. The topic
that arises is about evaluating the ethical issues.Your response will strictly
confidential.
Background information
Keith is the audit senior assigned to the audit of J company. This is Keith's second
year on this audit, and there were no particular problems found in the last year's
audit. The general review of the accounting and internal control systems did not
indicate anything particularly worrisome, but the audit partner instructed the audit
team to take the normal precautionary measures when doing the audit.
The audit team members are under considerable time pressure on this audit. Keith
has had previous time problems on audits and has received poor evaluations. He
believes that it is important that he meets the time budget and deadline for this
audit to get a good evaluation. While the audit manager will generally listen to
requests to go over the time budget and deadline, he generally expects that the
audit staff will do the work in the time allocated, unless extraordinary
circumstances dictate otherwise.
According to the audit program for J Company, one of the audit tests specified
that Keith was to select 10 stock items from the stock sheets and check that they
had been correctly valued by comparing cost prices on the stock sheets with those
on the supplier invoices. The company has a large number of stock items with
different serial codes, and the act of locating the invoice and comparing the price
can be time consuming.

73
Instruction: Please state your preference for what action to take in the case on
five point scale. (1 = strongly favor the action; 5 = strongly oppose the action)
Case 1 2 3 4 5
Case 1: Keith selects 10 stock items, and for 9 of the stock
items has no problem while comparing and agreeing the cost
prices to the invoices. However, for one of the stock items, he
finds a discrepancy between the cost price on the stock sheet
and the price on the invoice. Since he is already under time
pressure, he decides to ignore that stock item and selects
another stock item for which the price agrees with the invoice.
He noted on the audit file that all prices were checked and
found to be correct for all the 10 stock items selected.
Case 2: The client presents Keith with a sample of 15 stock
items which the client has already matched with invoices to
save Keith’s time. Keith relies on the client work and signs off
the test without noting the reliance on the client work.
Case 3: The audit manager informs Keith that meeting the time
budget is more important than meeting the time deadline. Keith
completes all his work but does not charge the total time he has
spent on the audit work on his timesheet. This allows him to
meet the budget for the job.
Case 4: In order to save time, Keith does not attempt this test at
all but signs it off on the audit program as completed.
Questions asked regarding your firm (ethical work climate)

74
Instructions: Please answer the following questions about the general climate in
your company in terms of how it really is in your company, not how you would
prefer it to be by using five point scale. (1 = strongly disagree; 5 = strongly
agree)
Statements 1 2 3 4 5
(EI) People in this company are very concerned about what is
best for them.
(EL) People are expected to do anything o further the
company’s interest.
(EC) In this company, each person is expected, above all, to
work efficiently.
(BI) It is expected that each individual is cared for when
making decisions here.
(BL) Our major consideration is what is best for everyone in
this company.
(BC) The effect of decisions on the customer and the public are
primary concerned in this company.
(PI) Each person in this company decides for himself what is
right and wrong.
(PL) It is important to follow strictly the company’s rules and
procedures.
(PC) In this company, people are expected to strictly follow
legal or professional standards.
Personal information
How old are you?

75
______ years
Are you male or female? Please use checklist for the answer ()
( ) Male ( ) Female
How long have you worked in public accounting firm?
_____ year _____ month
Which of the following describes your audit firm? Please use checklist for the
answer ()
( ) Big Four ( ) 0-5 partners ( ) 6-15
partners
( ) 16+ audit partners but not Big Four
What is your current position? Please use checklist for the answer ()
( ) Partner ( ) Director ( ) Manager
( ) Assistant Manager ( ) Senior Associate ( ) Associate
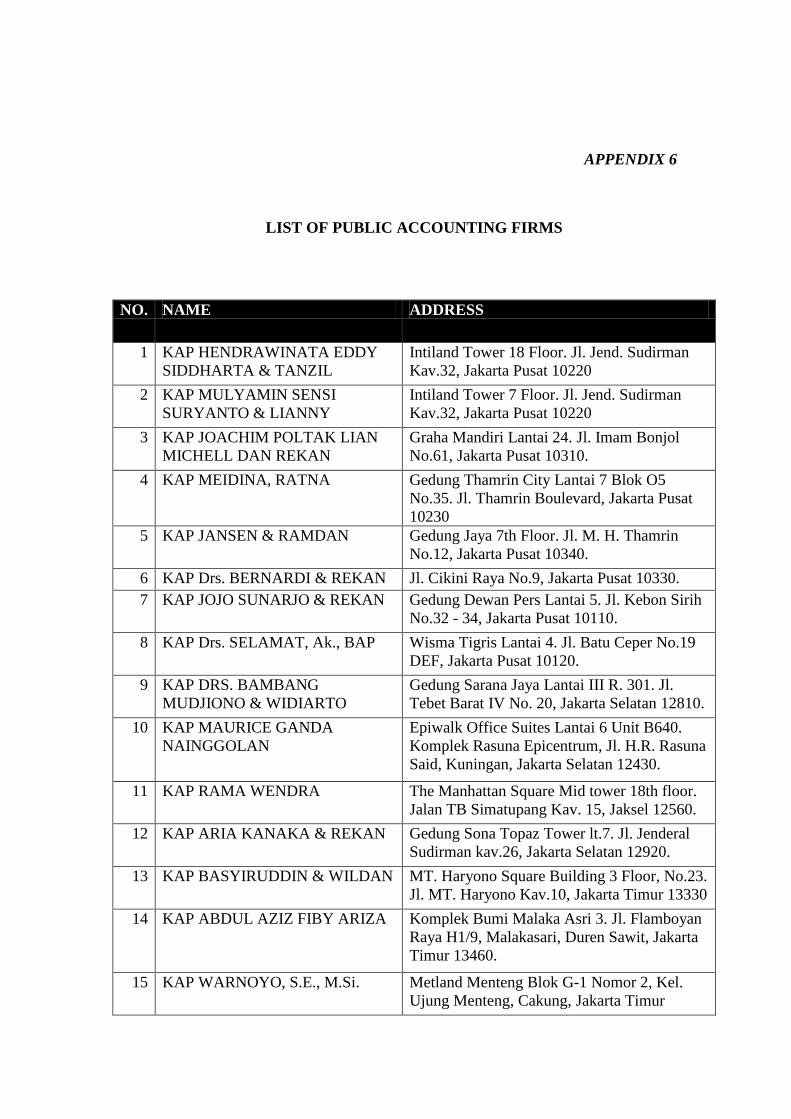
76
APPENDIX 6
LIST OF PUBLIC ACCOUNTING FIRMS
NO. NAME ADDRESS
1 KAP HENDRAWINATA EDDY
SIDDHARTA & TANZIL
Intiland Tower 18 Floor. Jl. Jend. Sudirman
Kav.32, Jakarta Pusat 10220
2 KAP MULYAMIN SENSI
SURYANTO & LIANNY
Intiland Tower 7 Floor. Jl. Jend. Sudirman
Kav.32, Jakarta Pusat 10220
3 KAP JOACHIM POLTAK LIAN
MICHELL DAN REKAN
Graha Mandiri Lantai 24. Jl. Imam Bonjol
No.61, Jakarta Pusat 10310.
4 KAP MEIDINA, RATNA Gedung Thamrin City Lantai 7 Blok O5
No.35. Jl. Thamrin Boulevard, Jakarta Pusat
10230
5 KAP JANSEN & RAMDAN Gedung Jaya 7th Floor. Jl. M. H. Thamrin
No.12, Jakarta Pusat 10340.
6 KAP Drs. BERNARDI & REKAN Jl. Cikini Raya No.9, Jakarta Pusat 10330.
7 KAP JOJO SUNARJO & REKAN Gedung Dewan Pers Lantai 5. Jl. Kebon Sirih
No.32 - 34, Jakarta Pusat 10110.
8 KAP Drs. SELAMAT, Ak., BAP Wisma Tigris Lantai 4. Jl. Batu Ceper No.19
DEF, Jakarta Pusat 10120.
9 KAP DRS. BAMBANG
MUDJIONO & WIDIARTO
Gedung Sarana Jaya Lantai III R. 301. Jl.
Tebet Barat IV No. 20, Jakarta Selatan 12810.
10 KAP MAURICE GANDA
NAINGGOLAN
Epiwalk Office Suites Lantai 6 Unit B640.
Komplek Rasuna Epicentrum, Jl. H.R. Rasuna
Said, Kuningan, Jakarta Selatan 12430.
11 KAP RAMA WENDRA The Manhattan Square Mid tower 18th floor.
Jalan TB Simatupang Kav. 15, Jaksel 12560.
12 KAP ARIA KANAKA & REKAN Gedung Sona Topaz Tower lt.7. Jl. Jenderal
Sudirman kav.26, Jakarta Selatan 12920.
13 KAP BASYIRUDDIN & WILDAN MT. Haryono Square Building 3 Floor, No.23.
Jl. MT. Haryono Kav.10, Jakarta Timur 13330
14 KAP ABDUL AZIZ FIBY ARIZA Komplek Bumi Malaka Asri 3. Jl. Flamboyan
Raya H1/9, Malakasari, Duren Sawit, Jakarta
Timur 13460.
15 KAP WARNOYO, S.E., M.Si. Metland Menteng Blok G-1 Nomor 2, Kel.
Ujung Menteng, Cakung, Jakarta Timur

77
13950.
16 KAP YUWONO H Jl. Arabika VIII Blok AA.2 No. 2, Pondok
Kopi, Jakarta Timur 13350.
17 KAP Drs. BAMBANG
SUDARYONO & REKAN
Jl. Wisma Jaya No.2, Rawamangun, Jakarta
Timur 13220.
18 KAP EFFENDY & REKAN Grand Galaxy City. Jl. Grand Galaxy
Boulevard Blok FE - 525, Bekasi Selatan,
Bekasi 17147.
19 KAP HELIANTONO & REKAN
(CABANG)
Komplek Ruko Fajar. Jl. Kalimalang Raya
No.59 A, Jakasampurna, Bekasi 17145.
20 KAP Drs. MOHAMMAD
YOESOEF DAN REKAN
Jl. Damar IV No.15, Jatibening 2, Pondok
Gede, Bekasi 17412
21 KAP MOH. MAHSUN, Ak, M.Si,
CPA
Jl. Prof. Dr. Soepomo Gg. Lucida No.02
Janturan Umbulharjo Yogyakarta 55164,
Indonesia.
22 KAP TANUDIREDJA,
WIBISANA & REKAN
Plaza 89 Lantai 11, 12 & 12 M. Jl. H.R.
Rasuna Said X-7 No.6, Jakarta Selatan 12940.
23 KAP. SIDDHARTA WIDJAJA &
REKAN
Wisma GKBI Lantai 33. Jl. Jend. Sudirman
Kav.28, Jakarta Pusat 10210.
24 KAP OSMAN BING SATRIO &
ENY
The Plaza Office Tower, Lantai 32. Jl. M. H.
Thamrin Kav.28 - 30, Jakarta Pusat 10350.
25 KAP ARYANTO, AMIR JUSUF,
MAWAR & SAPTOTO
Plaza ASIA Lantai 10 & 11. Jl. Jendral
Sudirman Kav.59, Jakarta Selatan 12190.
26 KAP TANUBRATA SUTANTO
FAHMI DAN REKAN
Prudential Tower Lantai 17. Jl. Jend.
Sudirman Kav.79, Jakarta Selatan 12910.
27 KAP TOTON SUCIPTO Metland Transyogi, Gandaria XII No. 40
Cileungsi Bogor, Indonesia 16820
Recommended