The Influence of Tropical-Extratropical Interactions
on ENSO Variability
Michael Alexander
NOAA/Earth System Research Lab
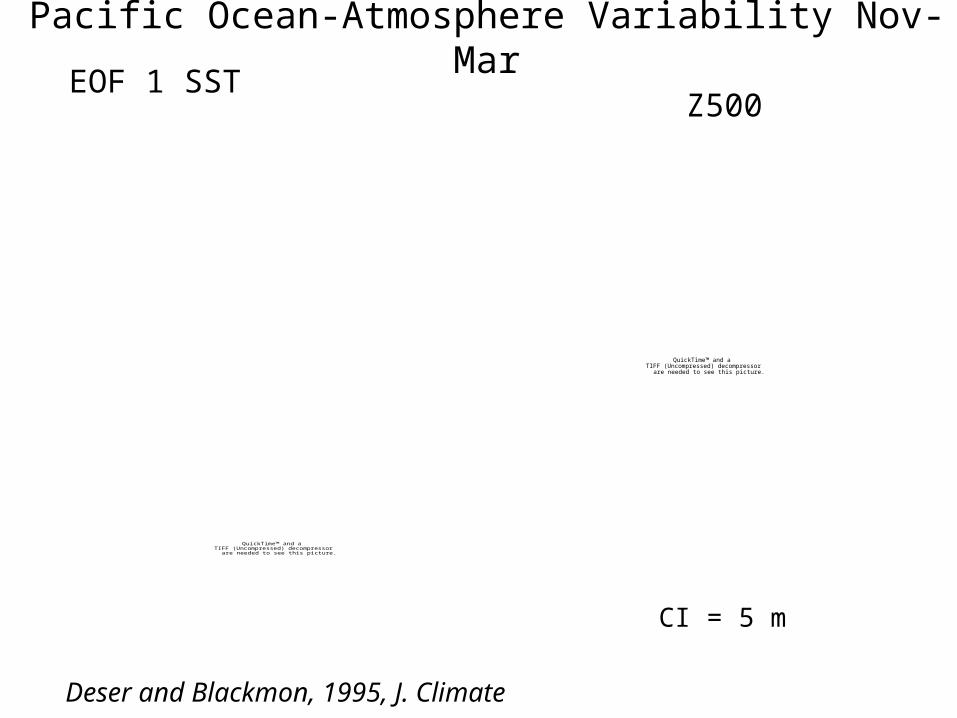
Pacific Ocean-Atmosphere Variability Nov-Mar
QuickTime™ and aTIFF (Uncompressed) decompressor
are needed to see this picture.
Deser and Blackmon, 1995, J. Climate
QuickTime™ and aTIFF (Uncompressed) decompressor
are needed to see this picture.
QuickTime™ and aTIFF (Uncompressed) decompressor
are needed to see this picture.
CI = 5 m
Z500EOF 1 SST
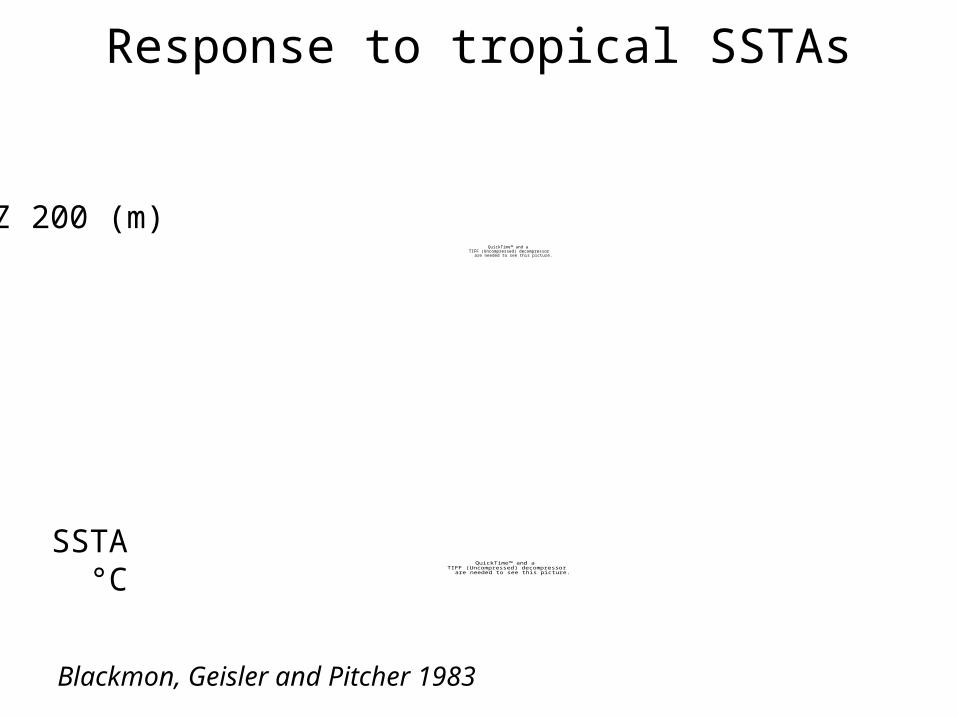
Response to tropical SSTAs
QuickTime™ and aTIFF (Uncompressed) decompressor
are needed to see this picture.
QuickTime™ and aTIFF (Uncompressed) decompressor
are needed to see this picture.
SSTA °C
Z 200 (m)
Blackmon, Geisler and Pitcher 1983
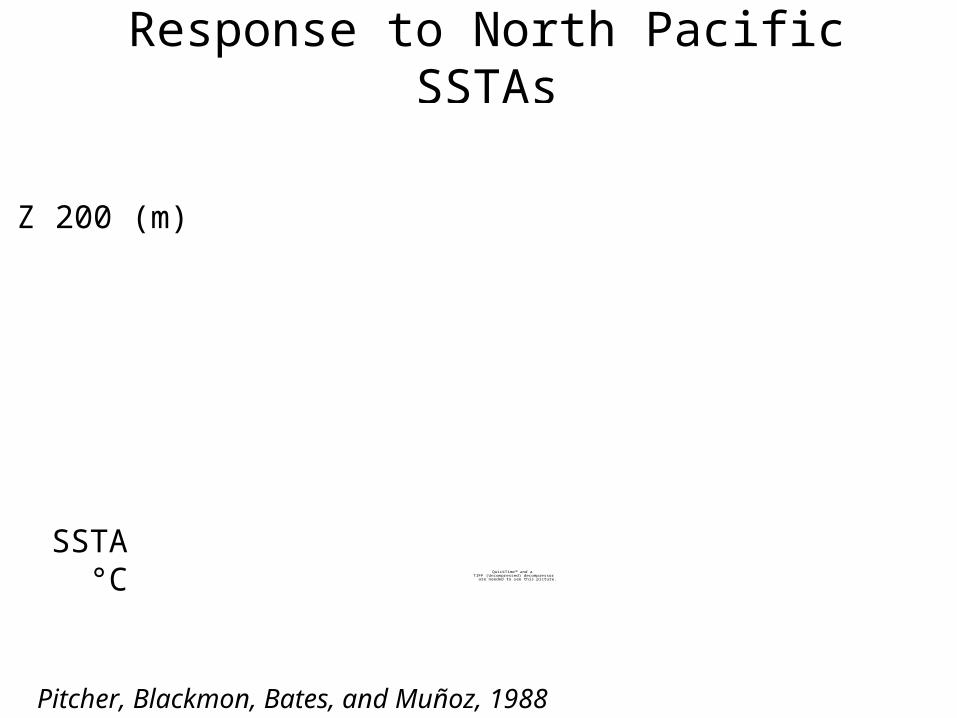
Response to North Pacific SSTAs
QuickTime™ and aTIFF (Uncompressed) decompressor
are needed to see this picture.
QuickTime™ and aTIFF (Uncompressed) decompressor
are needed to see this picture.
Z 200 (m)
SSTA °C
Pitcher, Blackmon, Bates, and Muñoz, 1988
Response to Tropical and North Pacific SSTs
QuickTime™ and aTIFF (Uncompressed) decompressor
are needed to see this picture.
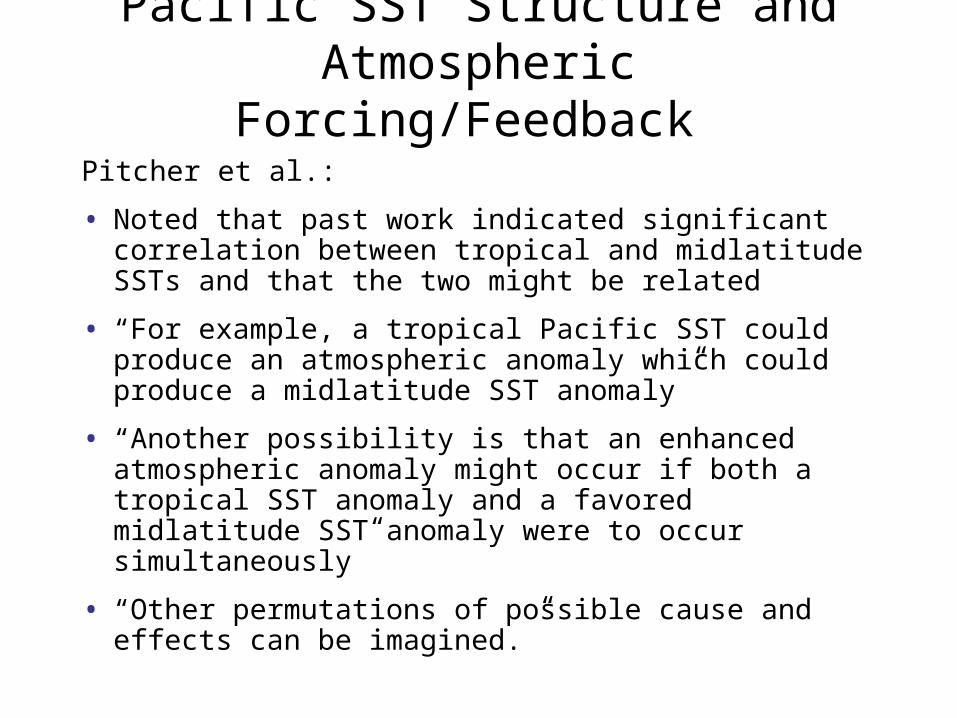
Pacific SST Structure and Atmospheric Forcing/Feedback
Pitcher et al.:
• Noted that past work indicated significant correlation between tropical and midlatitude SSTs and that the two might be related
• “For example, a tropical Pacific SST could produce an atmospheric anomaly which could produce a midlatitude SST anomaly”
• “Another possibility is that an enhanced atmospheric anomaly might occur if both a tropical SST anomaly and a favored midlatitude SST anomaly were to occur simultaneously”
• “Other permutations of possible cause and effects can be imagined.”
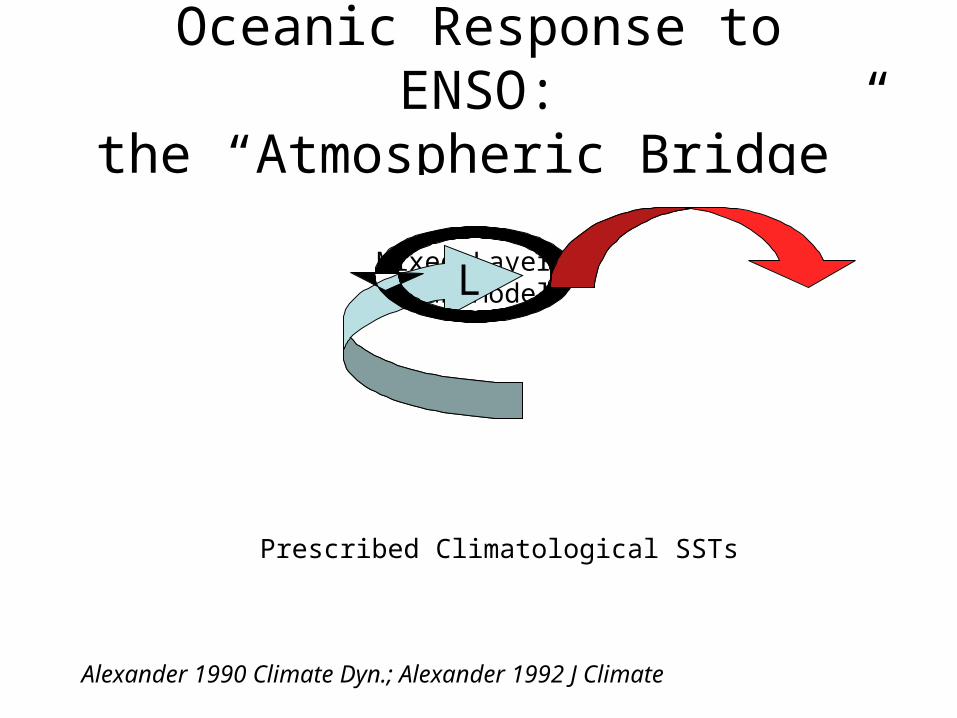
Oceanic Response to ENSO:the “Atmospheric Bridge”
QuickTime™ and aTIFF (Uncompressed) decompressor
are needed to see this picture.
Alexander 1990 Climate Dyn.; Alexander 1992 J Climate
Prescribed Climatological SSTs
Mixed Layer Ocean ModelL
ENSO’s impact on the North Pacific
QuickTime™ and aTIFF (Uncompressed) decompressor
are needed to see this picture.
QuickTime™ and aTIFF (Uncompressed) decompressor
are needed to see this picture.
SSTx 10 °C
Qnet
W m-2
Response to Pacific SST Anomalies
z200 (m) DJF
QuickTime™ and aTIFF (Uncompressed) decompressor
are needed to see this picture.
Tropical
QuickTime™ and aTIFF (Uncompressed) decompressor
are needed to see this picture.
North
Shading: > 95% significance by t-test
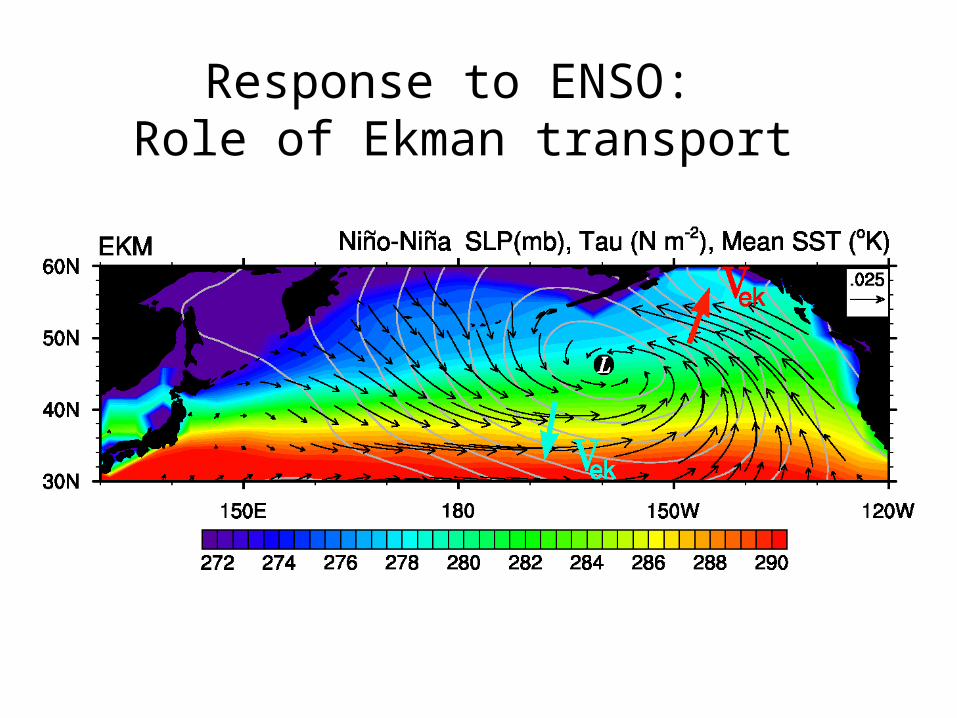
Response to ENSO: Role of Ekman transport
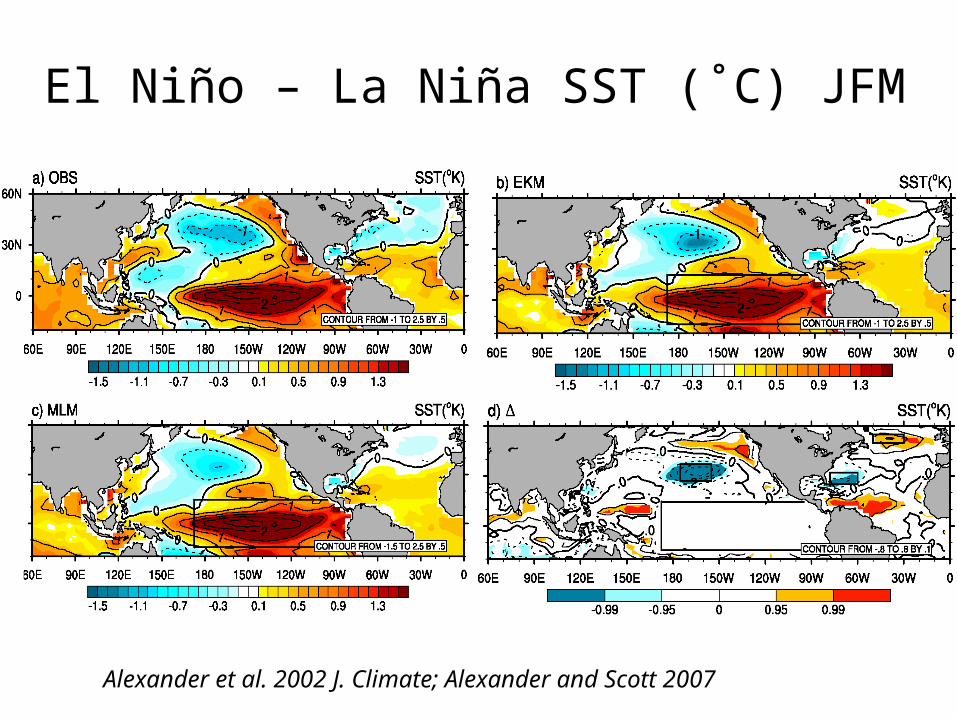
El Niño – La Niña SST (˚C) JFM
Alexander et al. 2002 J. Climate; Alexander and Scott 2007
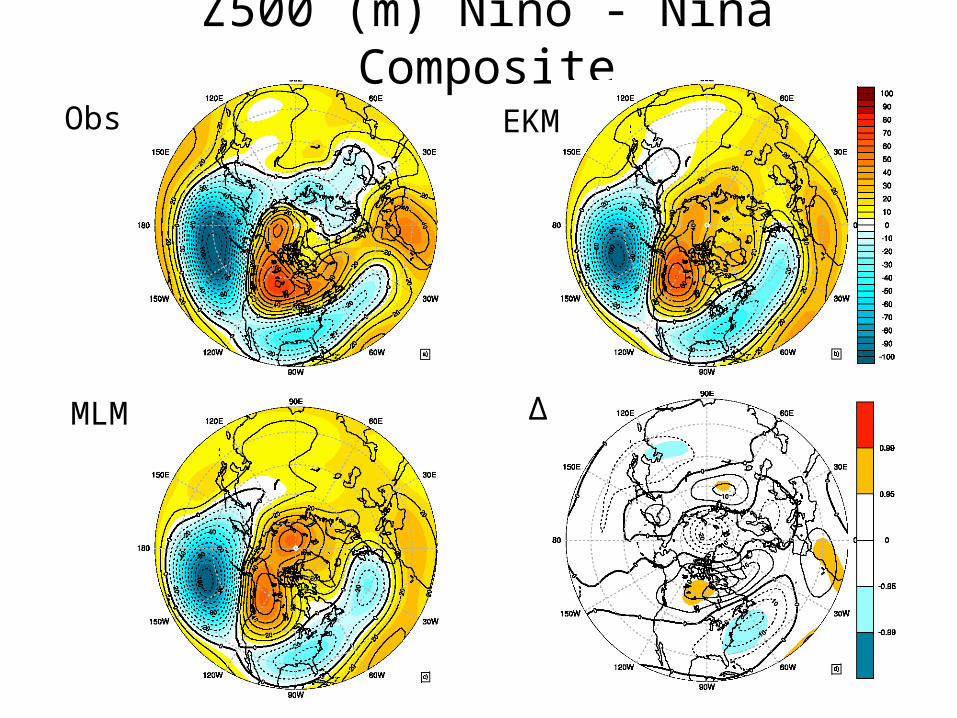
Z500 (m) Niño - Niña Composite
Obs
MLM
EKM
∆
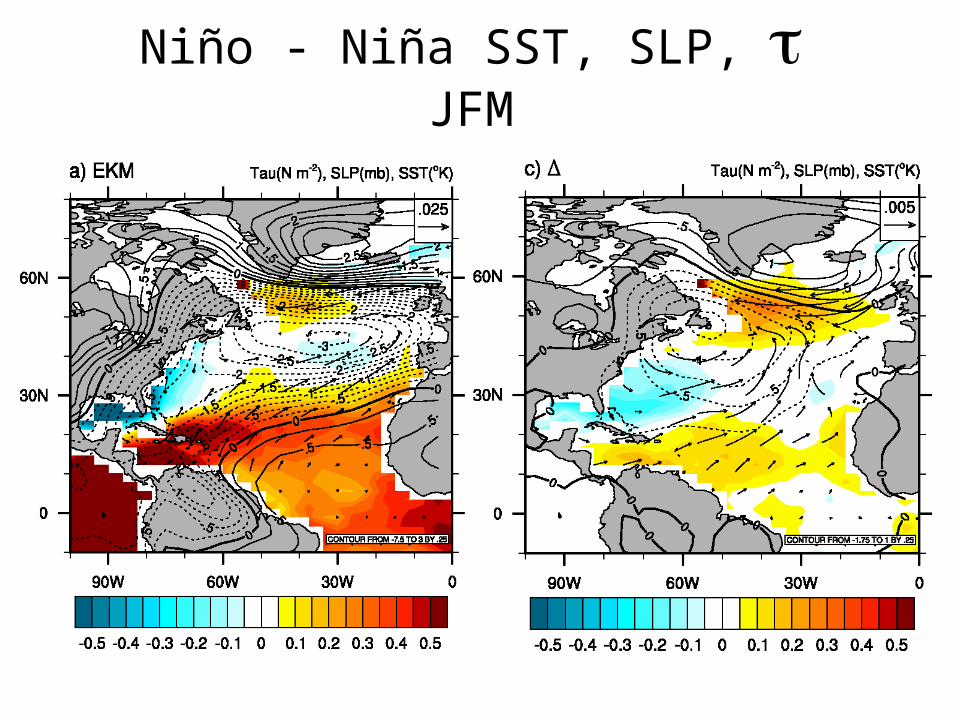
Niño - Niña SST, SLP, JFM
Extratropical => Tropical Air Sea Interactions
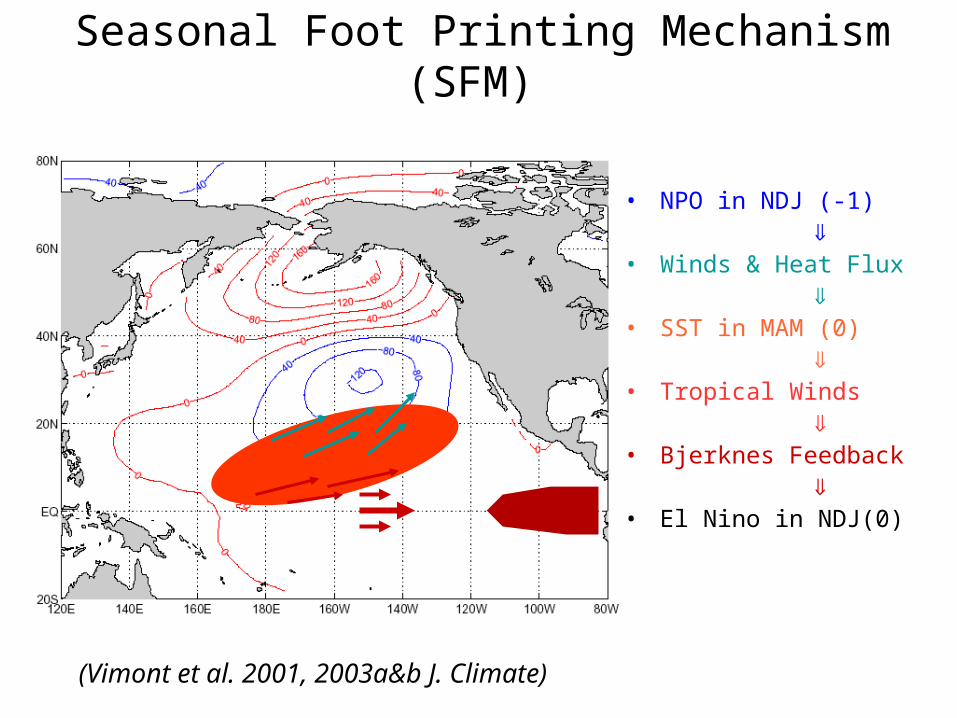
Seasonal Foot Printing Mechanism (SFM)
• NPO in NDJ (-1)
• Winds & Heat Flux • SST in MAM (0)
• Tropical Winds
• Bjerknes Feedback
• El Nino in NDJ(0)
(Vimont et al. 2001, 2003a&b J. Climate)
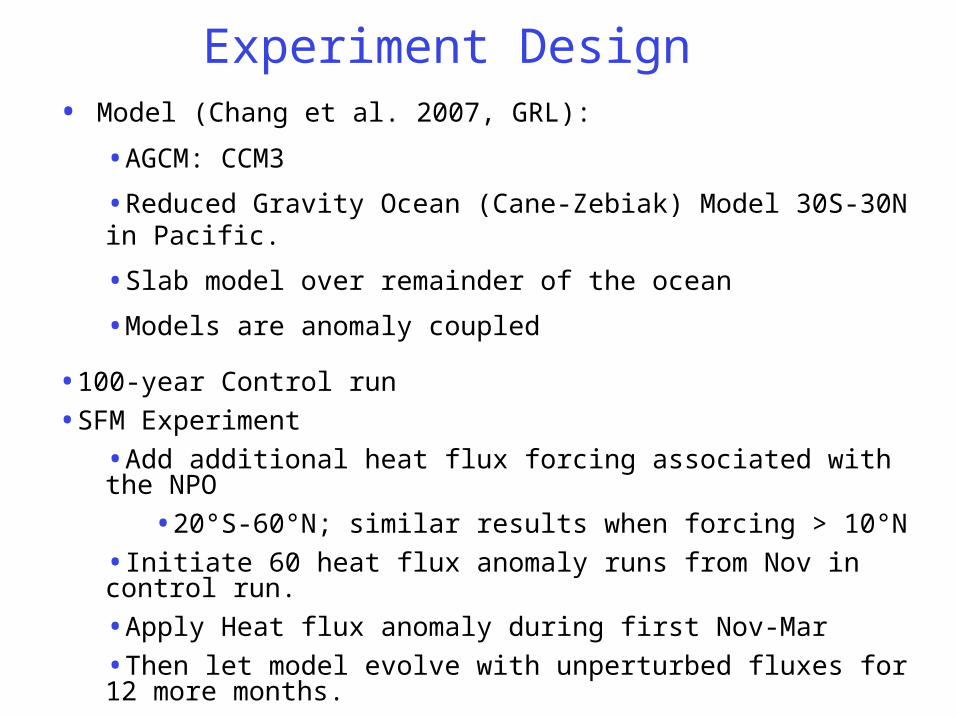
• Model (Chang et al. 2007, GRL):
•AGCM: CCM3
•Reduced Gravity Ocean (Cane-Zebiak) Model 30S-30N in Pacific.
•Slab model over remainder of the ocean
•Models are anomaly coupled
•100-year Control run
•SFM Experiment
•Add additional heat flux forcing associated with the NPO
•20°S-60°N; similar results when forcing > 10°N
•Initiate 60 heat flux anomaly runs from Nov in control run.
•Apply Heat flux anomaly during first Nov-Mar
•Then let model evolve with unperturbed fluxes for 12 more months.
• Compare ENSO evolution in perturbation and control runs.
• Note: model already includes SFM
Experiment Design
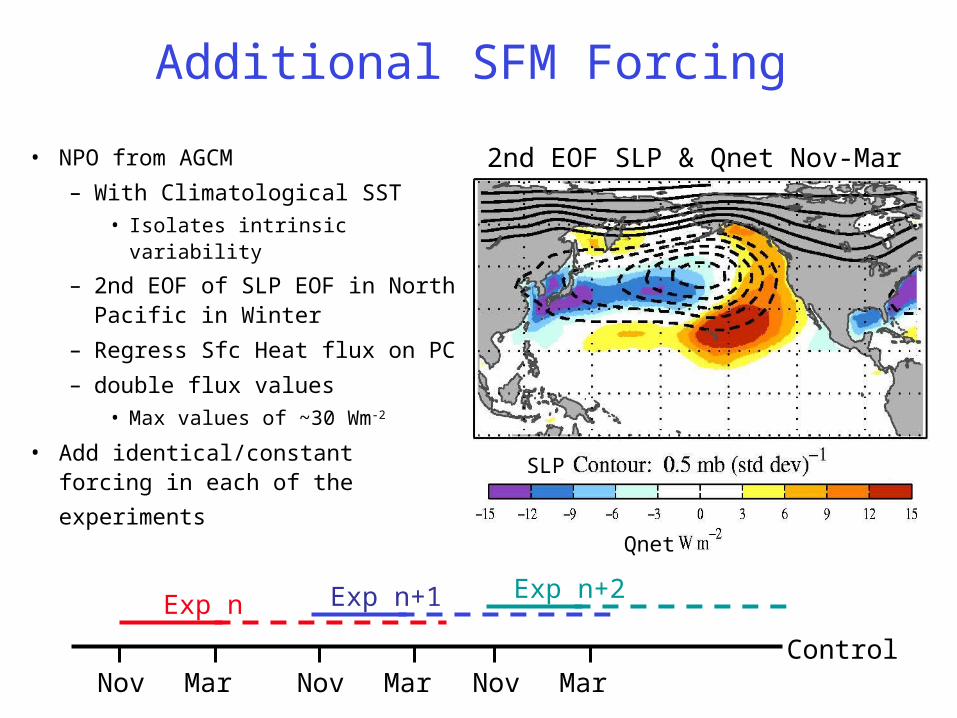
Additional SFM Forcing
• NPO from AGCM
– With Climatological SST• Isolates intrinsic variability
– 2nd EOF of SLP EOF in North Pacific in Winter
– Regress Sfc Heat flux on PC
– double flux values • Max values of ~30 Wm-2
• Add identical/constant forcing in
each of the experiments
Nov MarNov Mar Nov MarControl
Exp n Exp n+1 Exp n+2
2nd EOF SLP & Qnet Nov-Mar
SLP
Qnet
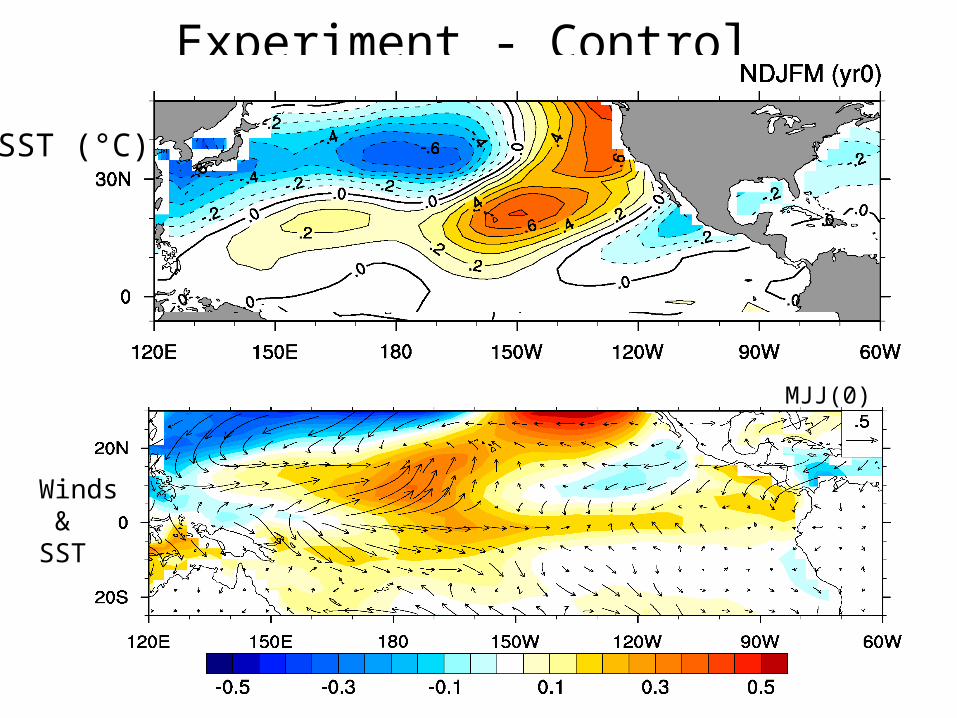
Experiment - Control
SST (°C)
Winds &SST
MJJ(0)
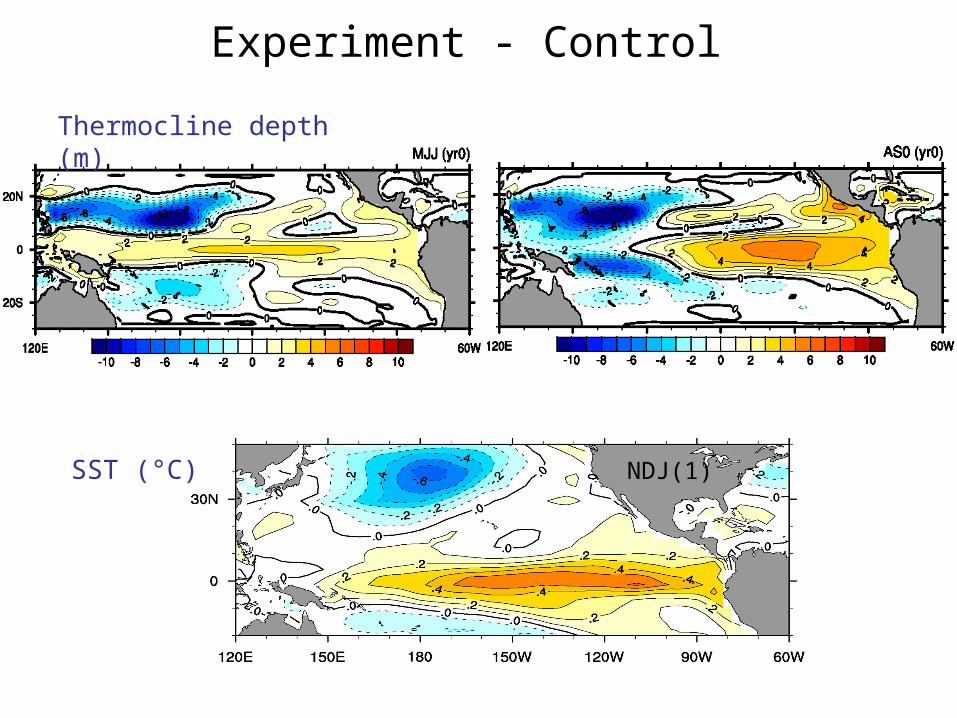
Experiment - Control
SST (°C) NDJ(1)
Thermocline depth (m)
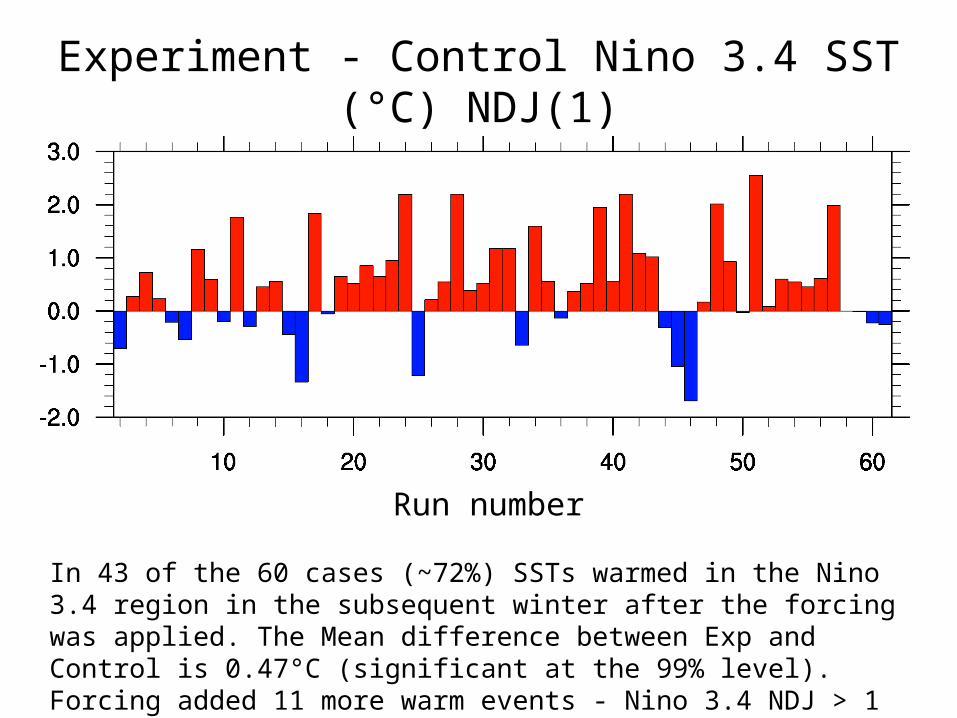
Experiment - Control Nino 3.4 SST (°C) NDJ(1)
In 43 of the 60 cases (~72%) SSTs warmed in the Nino 3.4 region in the subsequent winter after the forcing was applied. The Mean difference between Exp and Control is 0.47°C (significant at the 99% level). Forcing added 11 more warm events - Nino 3.4 NDJ > 1 control.
Run number
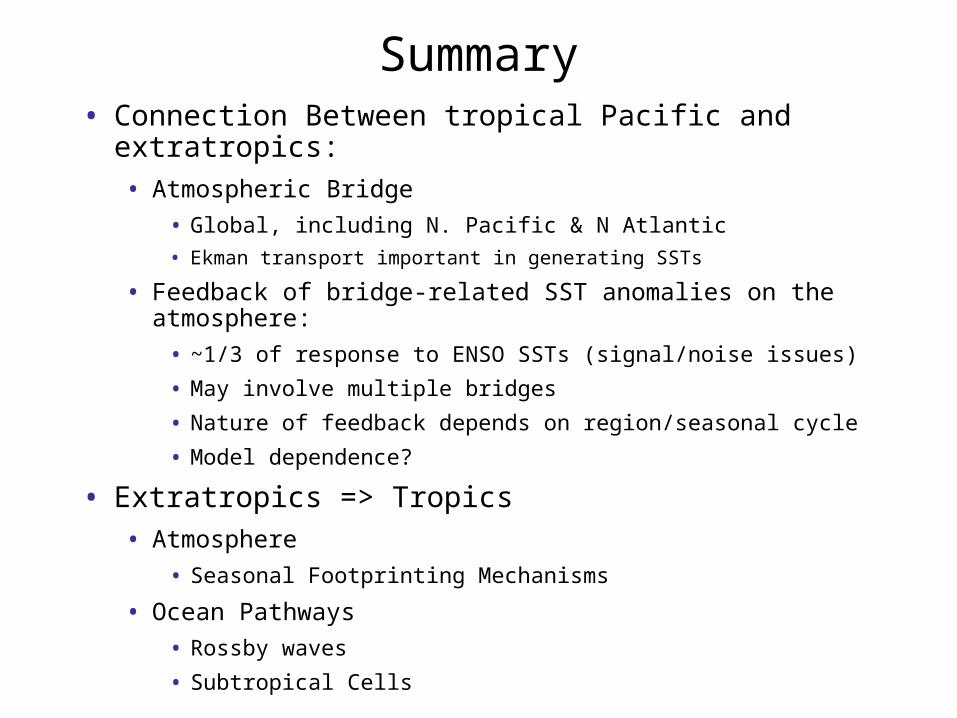
Summary• Connection Between tropical Pacific and extratropics:
• Atmospheric Bridge
• Global, including N. Pacific & N Atlantic
• Ekman transport important in generating SSTs
• Feedback of bridge-related SST anomalies on the atmosphere:
• ~1/3 of response to ENSO SSTs (signal/noise issues)
• May involve multiple bridges
• Nature of feedback depends on region/seasonal cycle
• Model dependence?
• Extratropics => Tropics
• Atmosphere
• Seasonal Footprinting Mechanisms
• Ocean Pathways
• Rossby waves
• Subtropical Cells

Additional Slides
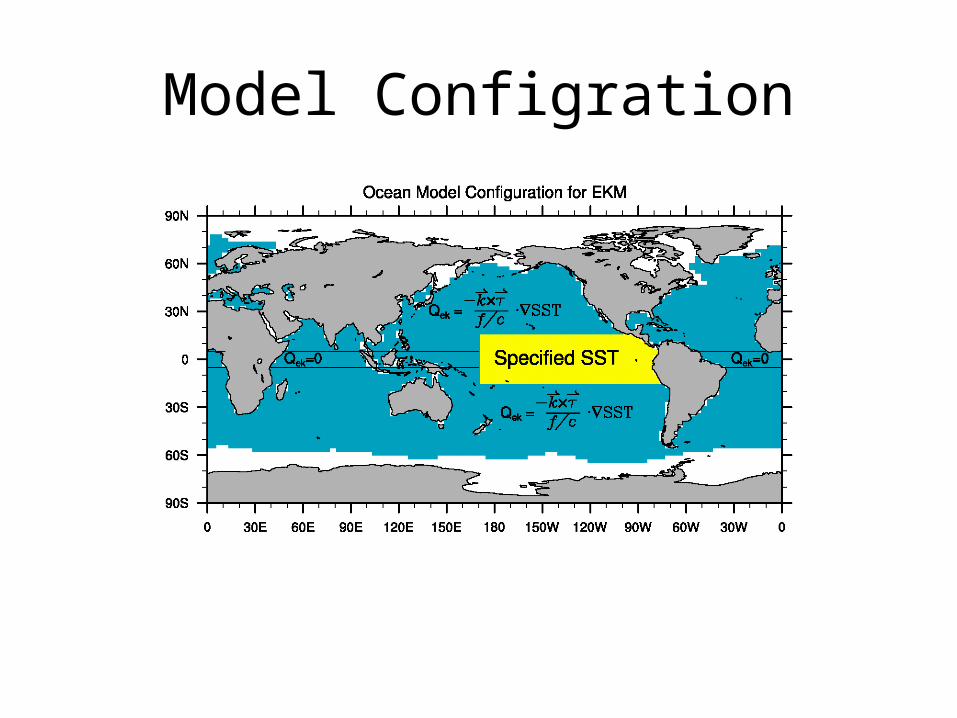
Model Configration
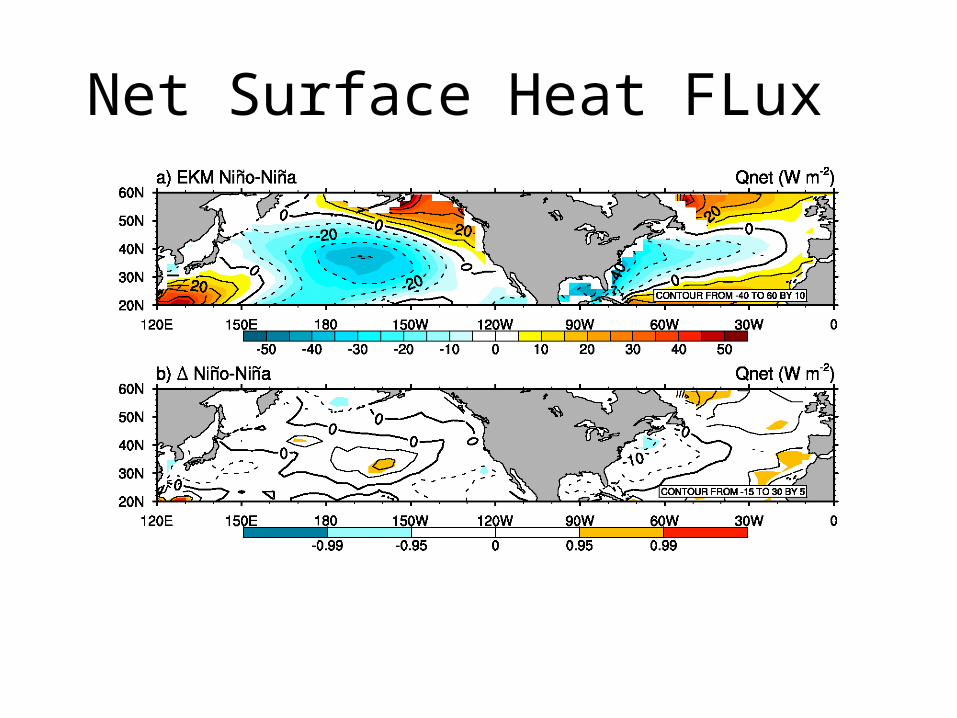
Net Surface Heat FLux
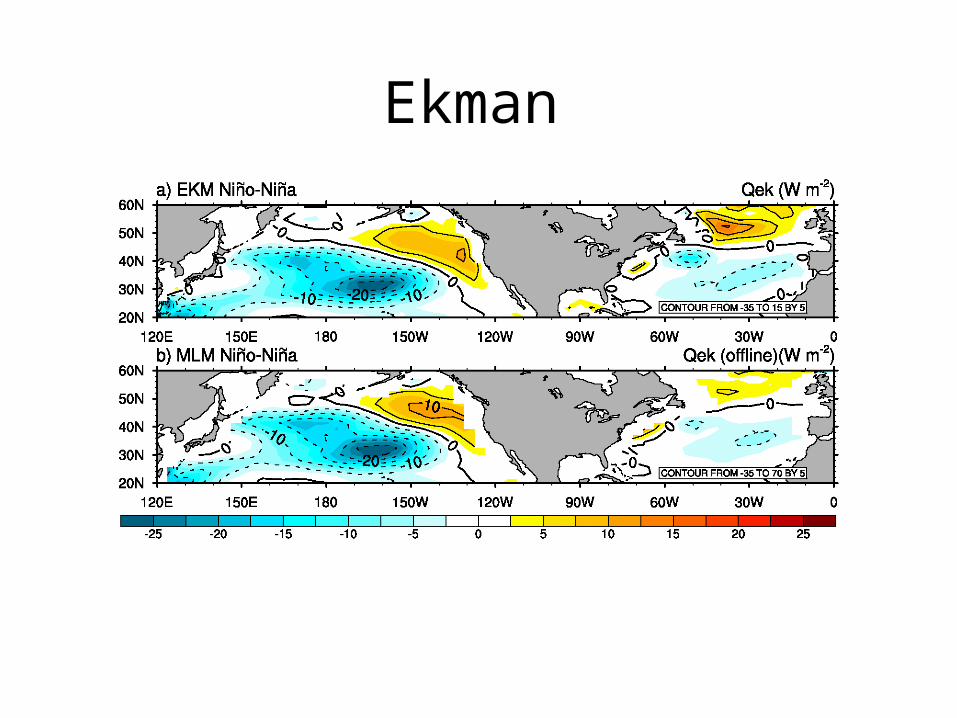
Ekman
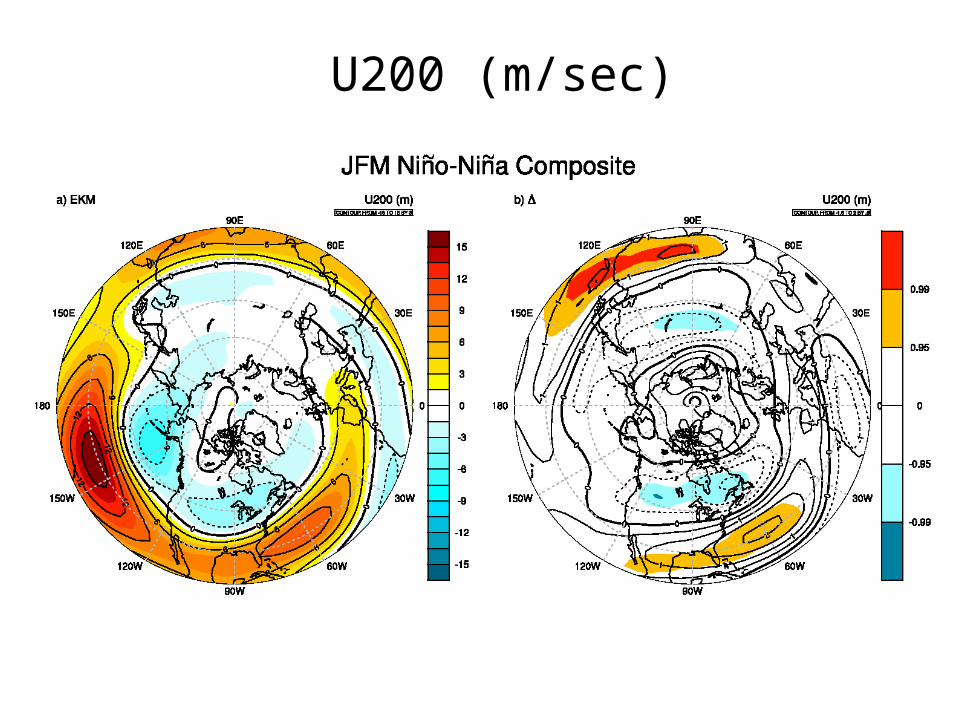
U200 (m/sec)
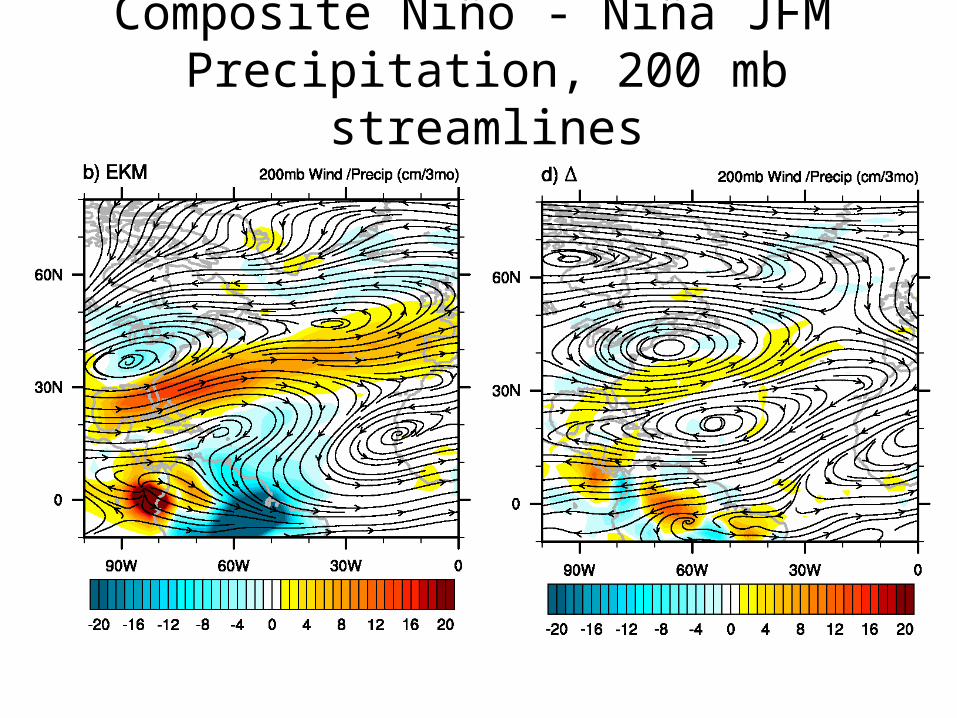
Composite Niño - Niña JFM Precipitation, 200 mb streamlines
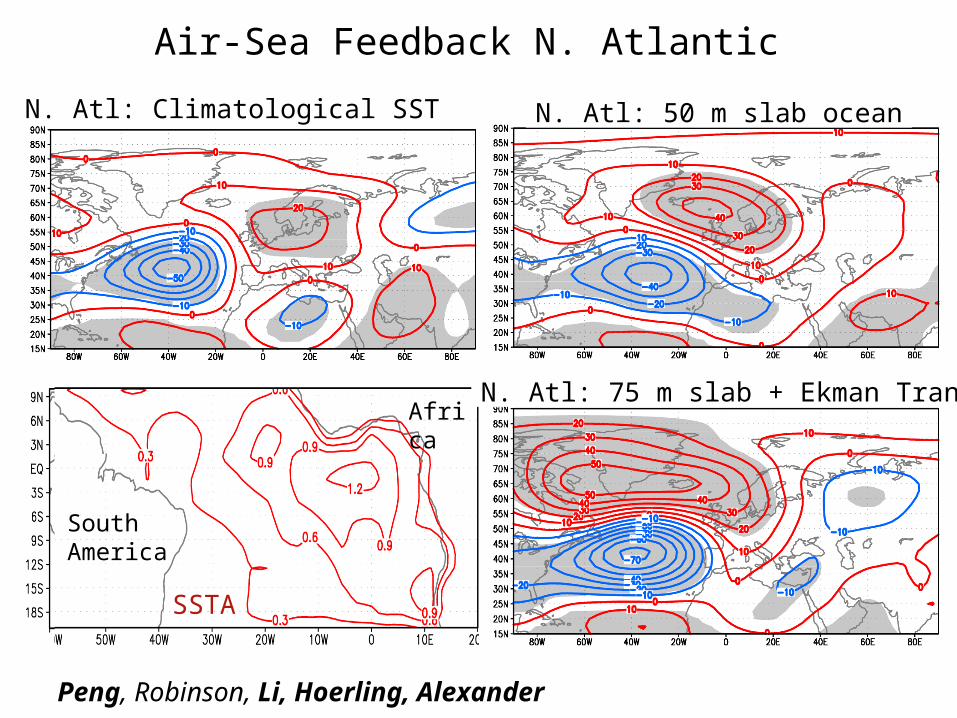
Air-Sea Feedback N. Atlantic
Peng, Robinson, Li, Hoerling, Alexander
N. Atl: 50 m slab ocean
N. Atl: 75 m slab + Ekman Trans
Atmospheric Response500 mb January
SSTA
N. Atl: Climatological SST
Africa
SouthAmerica
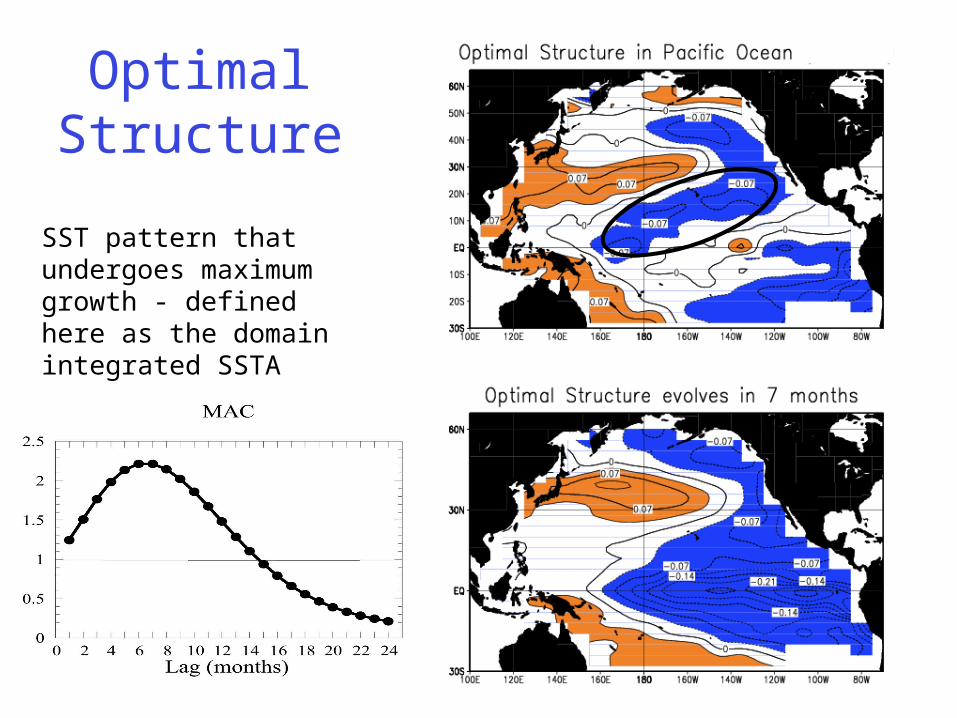
Optimal Structure
SST pattern that undergoes maximum growth - defined here as the domain integrated SSTA variance
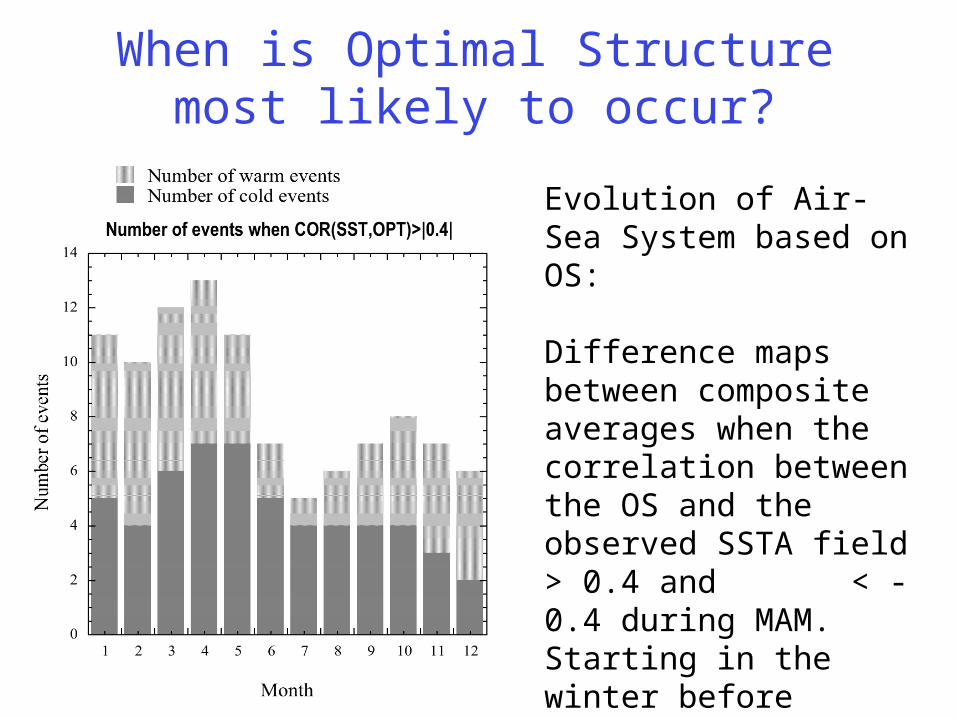
When is Optimal Structure most likely to occur?
Evolution of Air-Sea System based on OS:
Difference maps between composite averages when the correlation between the OS and the observed SSTA field > 0.4 and < -0.4 during MAM.Starting in the winter before through the following winter
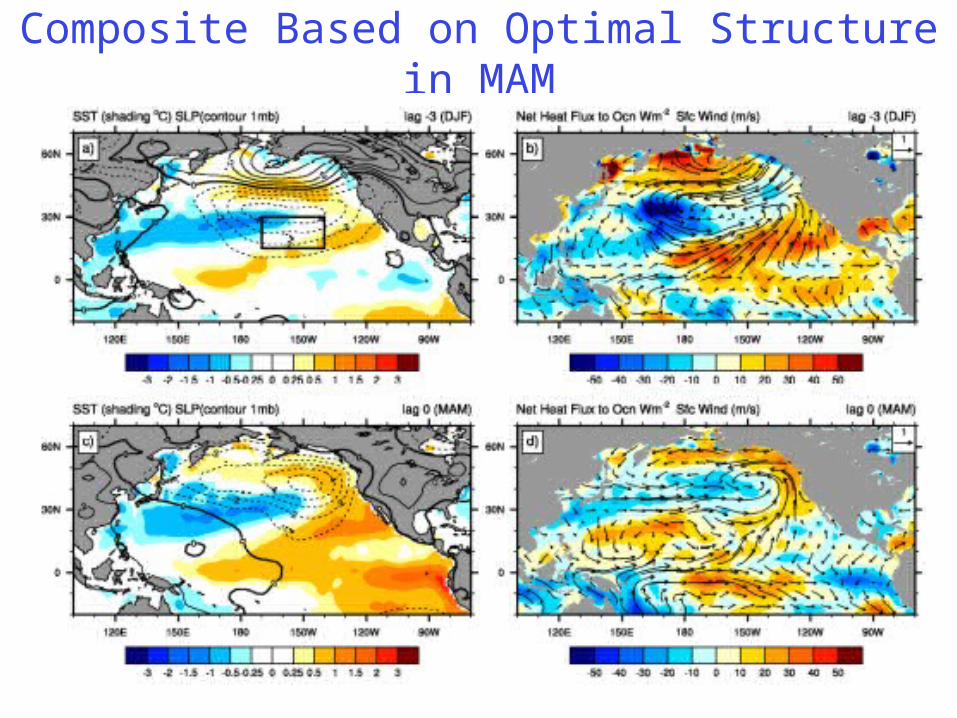
Composite Based on Optimal Structure in MAM
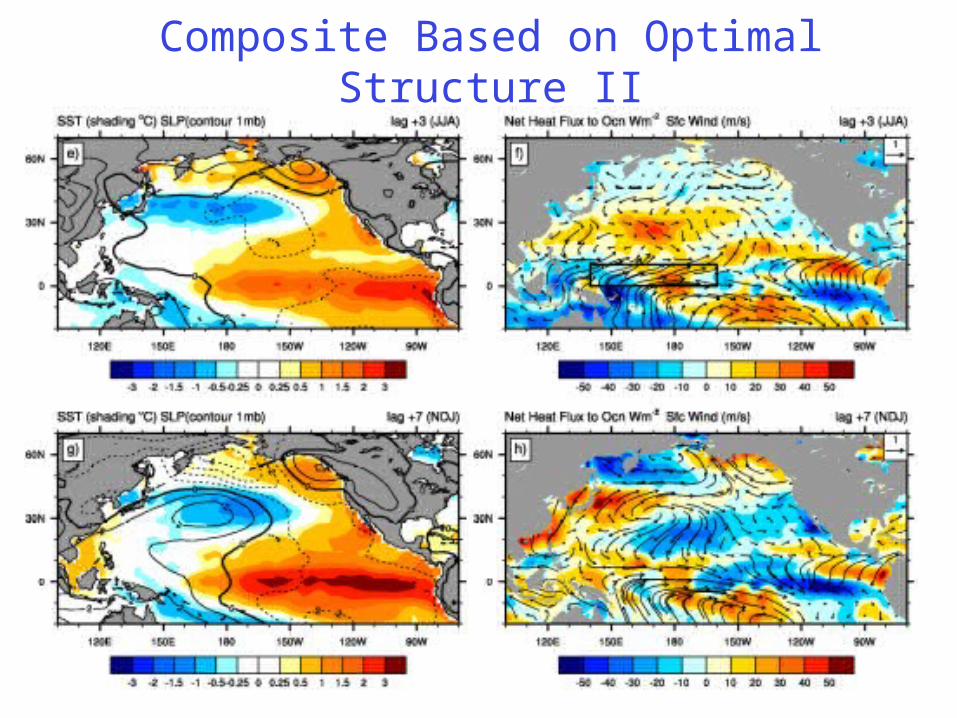
Composite Based on Optimal Structure II
Recommended


![Update from the NOAA MAPP Model Diagnostics Task Force …...mean moisture distribution]) •* Eric Maloney (diagnostics on MJO tropical-extratropical teleconnections) • Annamalai](https://img.pdfslide.net/doc/110x75/6010a29675b22e4a6b3e7d1a/update-from-the-noaa-mapp-model-diagnostics-task-force-mean-moisture-distribution.jpg)