The Metabolic Syndrome
Miriam Cnop, MD PhD
Division of Endocrinology and
Laboratory of Experimental Medicine
Université Libre de Bruxelles
Metabolic Syndrome
Clustering of cardiovascular risk factors
Central obesity
Diabetes
Hypertension
Dyslipidemia

Also known as
The Dysmetabolic Syndrome
The Insulin Resistance Syndrome
Deadly quartet

First report
The degree of masculine differentiation to obesity:
a factor determining predisposition to diabetes,
atherosclerosis, gout and uric calculus disease.
(Vague Am J Clin Nutr 4:20, 1956)
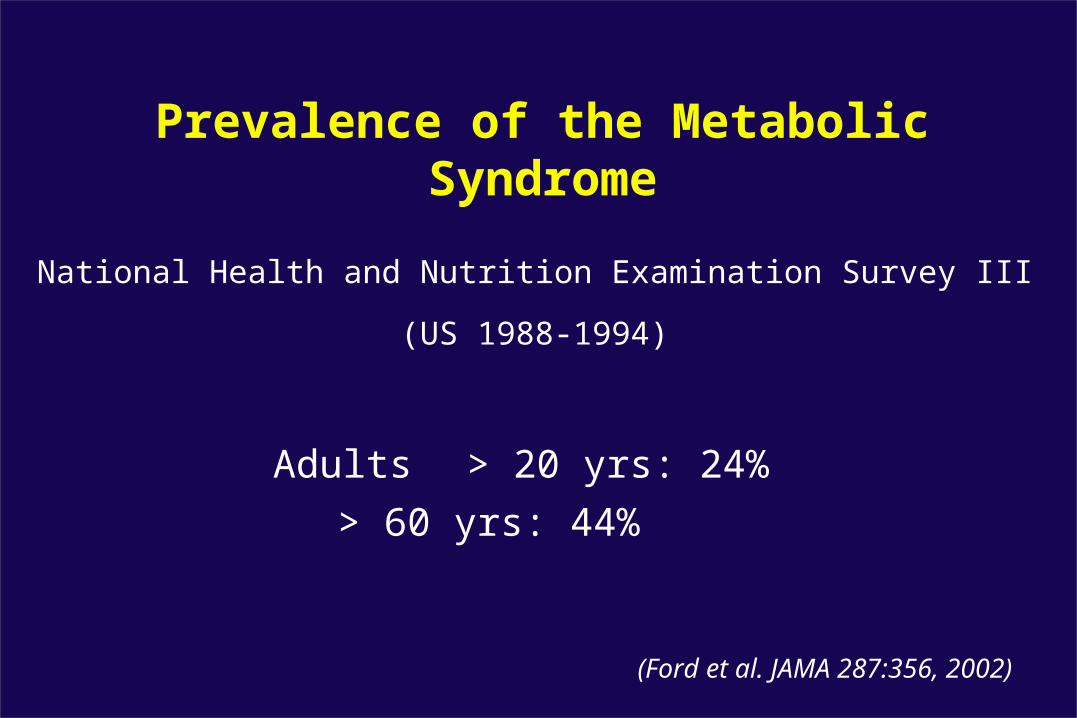
Prevalence of the Metabolic Syndrome
National Health and Nutrition Examination Survey III
(US 1988-1994)
Adults > 20 yrs: 24%
> 60 yrs: 44%
(Ford et al. JAMA 287:356, 2002)

Global Epidemic
QuickTime™ and aTIFF (Uncompressed) decompressor
are needed to see this picture.
Body Mass Index = weight (kg)/[height (m)]2

Obesity Trends* Among U.S. Adults1985
No Data <10% 10%–14%
(*BMI ≥30)
(Behavioral Risk Factor Surveillance System, Centers for Disease Control)

Obesity Trends* Among U.S. Adults1986
No Data <10% 10%–14%
(*BMI ≥30)

Obesity Trends* Among U.S. Adults1987
No Data <10% 10%–14%
(*BMI ≥30)
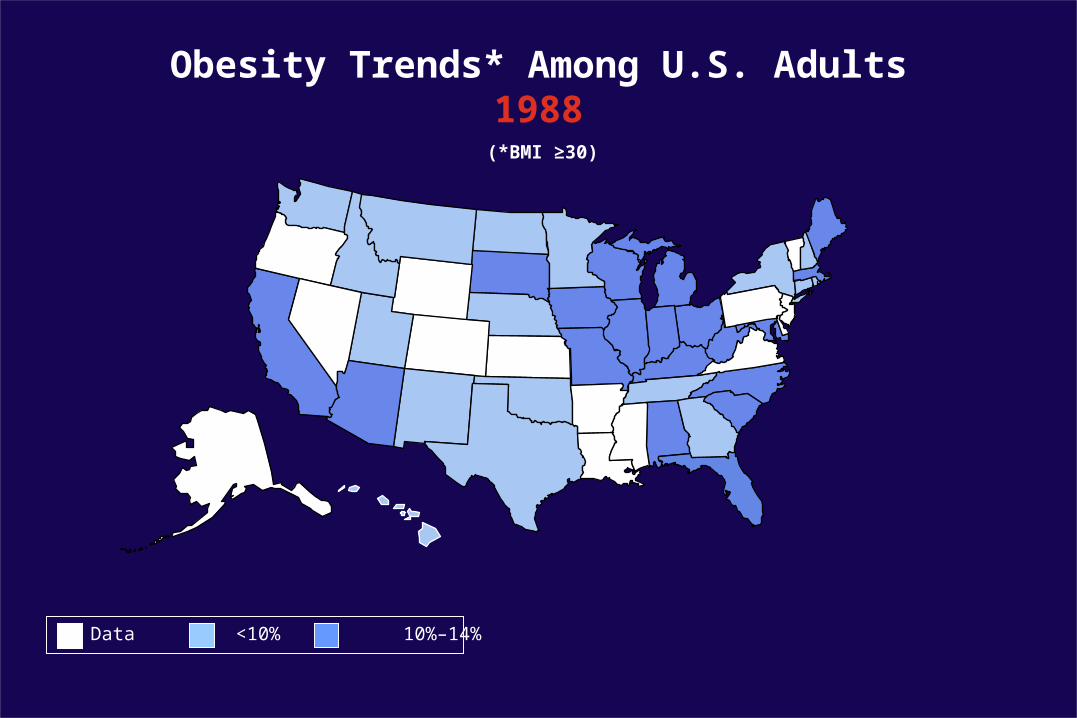
Obesity Trends* Among U.S. Adults1988
No Data <10% 10%–14%
(*BMI ≥30)

Obesity Trends* Among U.S. Adults1989
No Data <10% 10%–14%
(*BMI ≥30)

Obesity Trends* Among U.S. Adults1990
No Data <10% 10%–14%
(*BMI ≥30)

Obesity Trends* Among U.S. Adults1991
No Data <10% 10%–14% 15%–19%
(*BMI ≥30)

Obesity Trends* Among U.S. Adults1992
No Data <10% 10%–14% 15%–19%
(*BMI ≥30)

Obesity Trends* Among U.S. Adults1993
No Data <10% 10%–14% 15%–19%
(*BMI ≥30)

Obesity Trends* Among U.S. Adults1994
No Data <10% 10%–14% 15%–19%
(*BMI ≥30)

Obesity Trends* Among U.S. Adults1995
No Data <10% 10%–14% 15%–19%
(*BMI ≥30)

Obesity Trends* Among U.S. Adults1996
No Data <10% 10%–14% 15%–19%
(*BMI ≥30)

Obesity Trends* Among U.S. Adults1997
No Data <10% 10%–14% 15%–19% ≥20
(*BMI ≥30)

Obesity Trends* Among U.S. Adults1998
No Data <10% 10%–14% 15%–19% ≥20
(*BMI ≥30)
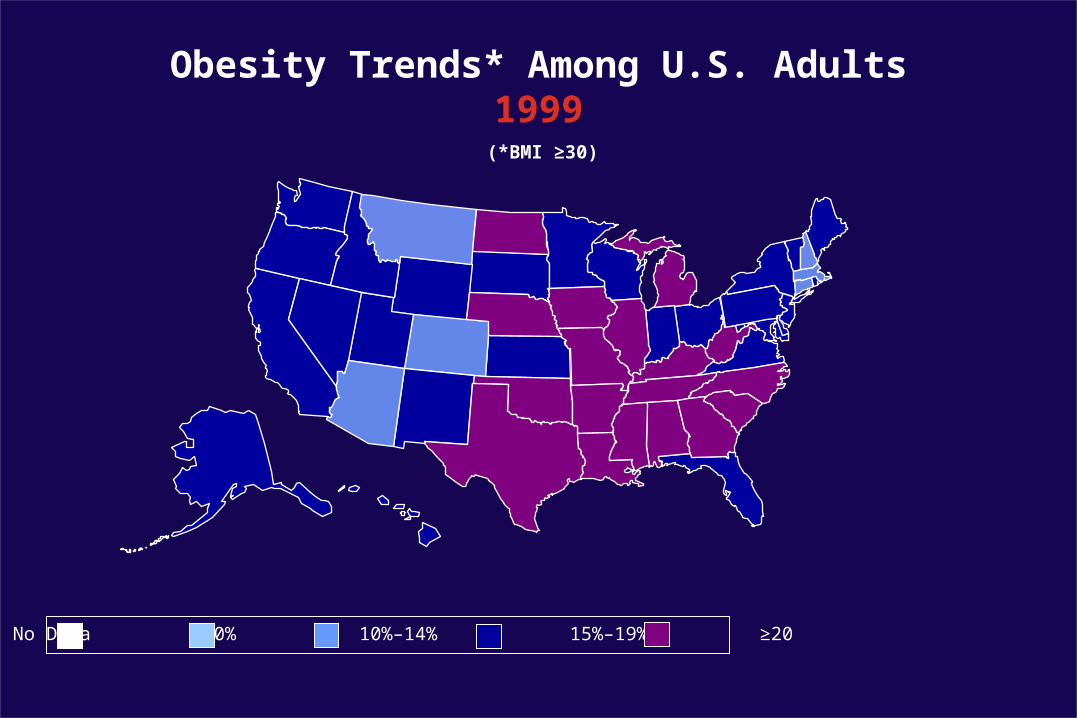
Obesity Trends* Among U.S. Adults1999
No Data <10% 10%–14% 15%–19% ≥20
(*BMI ≥30)

Obesity Trends* Among U.S. Adults2000
No Data <10% 10%–14% 15%–19% ≥20
(*BMI ≥30)

Obesity Trends* Among U.S. Adults2001
No Data <10% 10%–14% 15%–19% 20%–24% ≥25%
(*BMI ≥30)

No Data <10% 10%–14% 15%–19% 20%–24% ≥25%
Obesity Trends* Among U.S. Adults2002(*BMI ≥30)

Source: Behavioral Risk Factor Surveillance System, CDC
No Data <10% 10%–14% 15%–19% 20%–24% ≥25%
Obesity Trends* Among U.S. Adults2003(*BMI ≥30)

QuickTime™ and aTIFF (Uncompressed) decompressor
are needed to see this picture.
Predicted evolution of BMI distribution
(AM Prentice Br Med Bull 53:229, 1997)
20th century
21st century

Many people enjoy the opportunity of eating more than they
need with little requirement for physical exertion.
(Pinkney et al. Lancet 357:1357, 2001)
Pathogenesis of obesity

Obesity = chronic imbalance between
caloric intake and expenditure
Obesity = chronic imbalance between
caloric intake and expenditure
Obesity = chronic imbalance between
caloric intake and expenditure
Body fat mass is the result of energy balance
The US food industry produces 3800 kcal/person/day
whereas the average requirement is 2000 kcal/day.3 to 5-y-old UK children spend only 2% of their time in moderate
to vigorous physical activity. Their total energy expenditure was
200 kcal/day lower than the estimated requirement.
(Reilly et al. Lancet 363:211, 2004)

QuickTime™ and aTIFF (LZW) decompressor
are needed to see this picture.
(Photograph Howard Berman 1990)

Environmental and genetic factors determine insulin sensitivity
Variability in insulin sensitivity is accounted for by:
Adiposity 25-30%
Physical fitness 25-30%
Genetic factors 40-50%
Insulin resistance = decreased ability of peripheral
tissues to respond properly to normal circulating
concentrations of insulin

QuickTime™ and aTIFF (Uncompressed) decompressor
are needed to see this picture.
(Zimmet et al. J Intern Med 254:114, 2003)

Definition: World Health Organization (1999)
Type 2 diabetes
Impaired Glucose Tolerance
(2h glucose 140-199 mg/dl)
Insulin Resistance
Obesity BMI>30 kg/m2
Waist/hip >0.90 (M)
>0.85 (F)
Hypertension (>140/90 mm Hg)
Dyslipidemia (high TG, low HDL)
Microalbuminuria
At least 1 of At least 2 of+

Definition:National Cholesterol Education Program (2001)
At least 3 of
Abdominal obesity: waist circumference > 102 cm (M)
> 88 cm (F)
Hypertriglyceridemia > 150 mg/dl
Low HDL cholesterol < 40 mg/dl (M)
< 50 mg/dl (F)
Hypertension (> 130/85 mm Hg)
Impaired Fasting Glucose or Type 2 diabetes (> 100 mg/dl)
(ATP III. JAMA 285:2486, 2001)
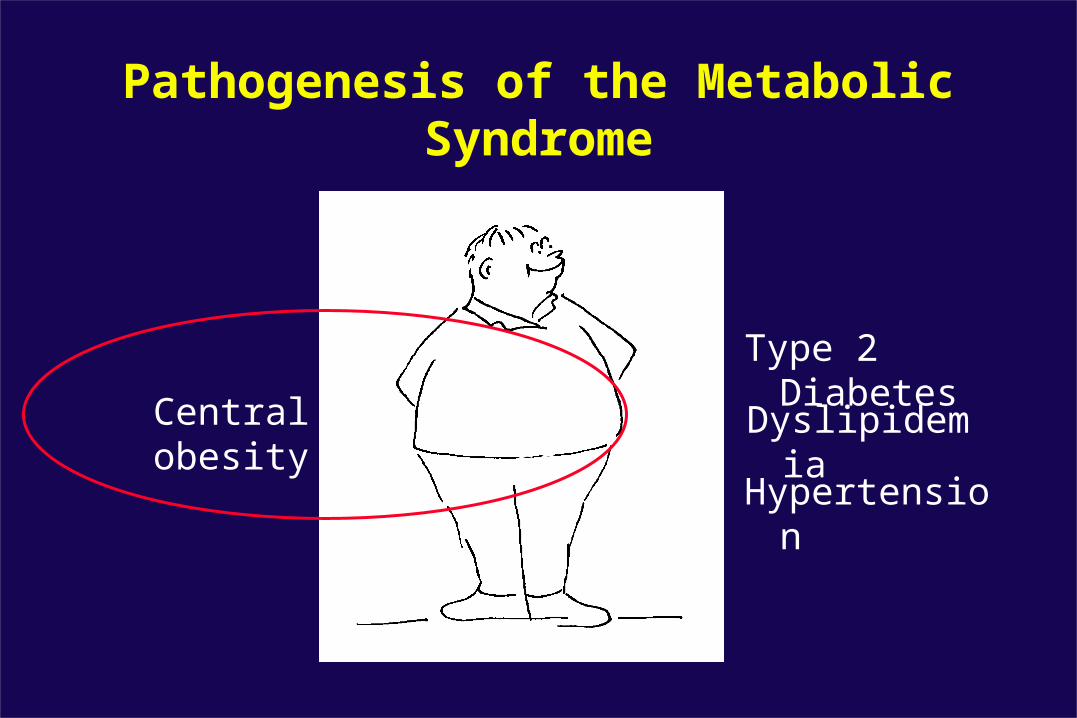
Pathogenesis of the Metabolic Syndrome
Type 2 Diabetes
Hypertension
Dyslipidemia
Central obesityInsulin
Resistance

Assessment of Insulin Sensitivity
Gold Standard: Hyperinsulinemic clamp
0
2
4
6
8
15 30 45 60 75 90 105 120
20
40
60
80
100
120
0 30 60 90 120
40
80
120Glycemia
Insulinemia
Glucose Infusion Rate
(Cnop and Fery; Unpublished data)

Assessment of Insulin Sensitivity
Fasting insulin
Homeostasis Model Assessment HOMA IR
Insulin (U/ml) x Glucose (mmol/l) / 22.5
Quantitative Insulin Sensitivity Check Index QUICKY
1/[log Insulin (U/ml) + log Glucose (mg/dl)]
Oral Glucose Tolerance Test
Intravenous Glucose Tolerance Test IVGTT

Relationship between BMI and insulin sensitivity
174 healthy, normoglycemic subjects
73 M and 101 F
age 52.5±0.7 yrs
Determine BMI and quantify the insulin sensitivity
index (SI) using Bergman’s minimal model

Insulin sensitivity in healthylean and obese subjects
0
10
20
30
15 20 25 30 35 40 45
BMI (kg/m2)
SI (
x10-5
min
-1/p
M)
(Cnop et al. Diabetes 51:1005, 2002)
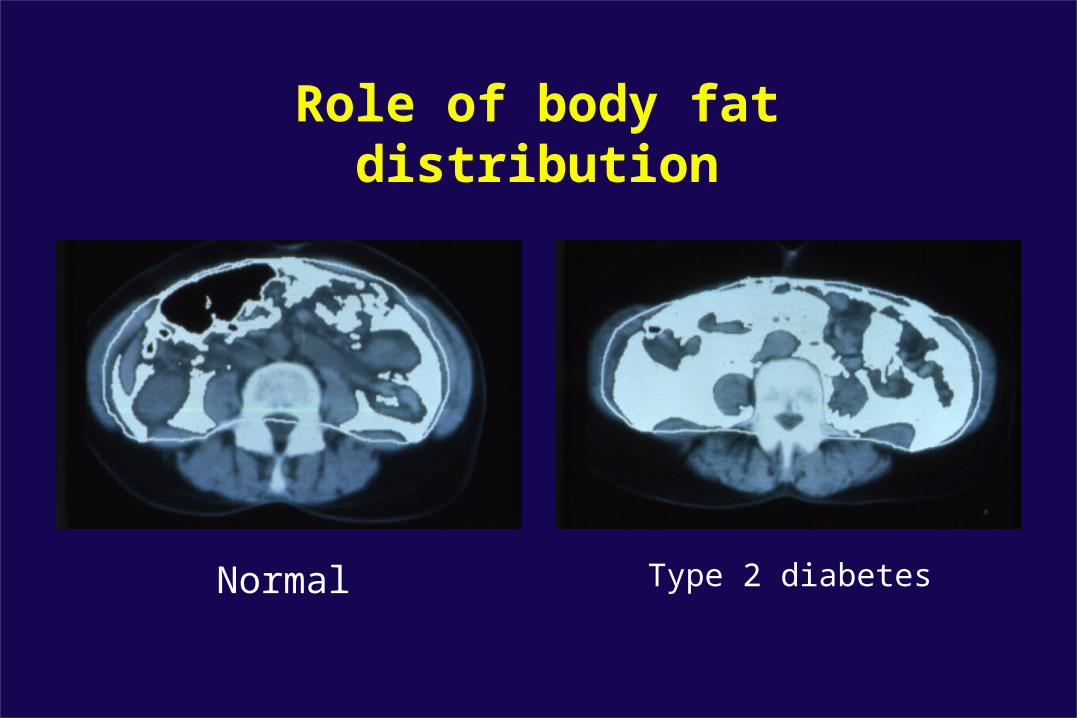
Role of body fat distribution
Normal Type 2 diabetes

Question
Do lean insulin sensitive, lean insulin resistant, and
obese insulin resistant subjects have similar
abdominal fat distribution?
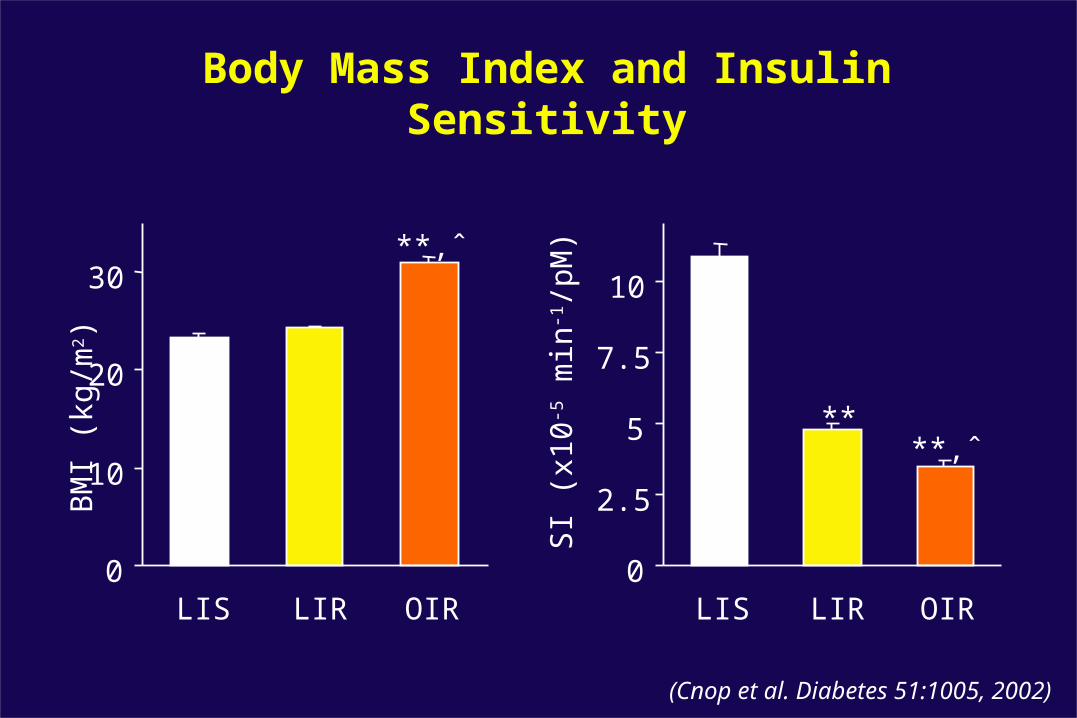
Body Mass Index and Insulin Sensitivity
0
10
20
30
LIS LIR OIR
BM
I (kg
/m2 )
**,ˆ
0
2.5
5
7.5
10
LIS LIR OIR
SI (
x10-5
min
-1/p
M)
**,ˆ**
(Cnop et al. Diabetes 51:1005, 2002)

Intra-Abdominal and Subcutaneous Fat Areas
0
50
100
150
LIS LIR OIR
IAF
are
a (c
m2 )
**,ˆ
**
0
100
200
300
LIS LIR OIR
SC
F a
rea
(cm
2 )
**,ˆ
**
(Cnop et al. Diabetes 51:1005, 2002)

Summary
Compared to lean insulin sensitive subjects, lean insulin resistant and obese insulin resistant subjects have:
• increased intra-abdominal fat area
• increased subcutaneous fat area
Whereas the BMI of the 2 lean groups did not differ, LIR subjects had 50% more abdominal fat.

Question
Is insulin resistance associated with a particular fat depot?

Intra-abdominal fat is highly predictive ofinsulin sensitivity
SI (
x10-5
min
-1/p
M)
0
10
20
30
0 100 200 300 400
Intra-abdominal fat area (cm2)
-1
0
1
2
3
2.0 3.0 4.0 5.0 6.0
Loge Intra-abdominal fat area
Log e
SI
r = -0.688
(Cnop et al. Diabetes 51:1005, 2002)

SI (
x10-5
min
-1/p
M)
0
10
20
30
0 100 200 300 400
Intra-abdominal fat area (cm2)
Intra-abdominal fat is highly predictive ofinsulin sensitivity

Summary
InsulinResistance

Adipose tissue: an endocrine organ
Fat
Adiponectin
FFA
InsulinResistance
TNFIL-6, Leptin, Resistin

Relationship between leptin andsubcutaneous fat
0
10
20
30
40
50
60
0 200 400 600 800
Subcutaneous fat area (cm2)
Lept
in (
ng/m
l)
0
10
20
30
40
50
60
70
0 200 400 600 800
Subcutaneous fat area (cm2)
r = 0.754
r = 0.783
(Cnop et al. Diabetes 51:1005, 2002)

Relationship between adiponectin andintra-abdominal fat
0
5
10
15
20
0 100 200 300 400
Intra-abdominal fat area (cm2)
Adi
pone
ctin
(g
/ml)
0
5
10
15
20
0 100 200 300 400
Intra-abdominal fat area (cm2)
(Cnop et al. Diabetologia 46:459, 2003)
r=-0.362r=-0.218

The Metabolic Syndrome
Type 2 Diabetes
Hypertension
Dyslipidemia
Central obesityInsulin
Resistance

Worldwide prevalence of type 2 diabetes
mill
ion
0
100
200
300
1980 1990 2000 2010 2020 2030
Year
(Adapted from Zimmet Nature 414:782, 2001)

Background
Type 2 diabetes is characterized by variable degrees of insulin resistance and pancreatic -cell dysfunction.
First-degree relatives of individuals with type 2 diabetes are at increased risk of developing hyperglycemia.

1994 2001 p
n 35 34BMI (kg/m2) 28.9 ± 0.8 31.3 ± 1.1 <0.01
Waist circumference (cm) 101 ± 2 105 ± 3 <0.05
Hip circumference (cm) 111 ± 2 110 ± 2Glucose (mg/dl) 93 ± 1 95 ± 3HDL cholesterol (mg/dl) 44 ± 2 43 ± 2LDL cholesterol (mg/dl) 118 ± 5 125 ± 4 <0.05
Triglycerides (mg/dl) 85 ± 9 96 ± 7 <0.05
Systolic BP (mm Hg) 116 ± 2 123 ± 3 <0.01
Diastolic BP (mm Hg) 73 ± 2 75 ± 2
(Cnop and Kahn; Unpublished data)

Evolution of glucose tolerance categories over 7 years
0
25
50
75
100
1994 2001
Diabetes
IGT
NGT
% o
f su
bje
cts
(Cnop and Kahn; Unpublished data)

Evolution of cell function over 7 years
(Cnop and Kahn; Unpublished data)
DI (%)
0
10
20
30
1994 2001
p<0.05

Summary
While insulin sensitivity did not change, -cell
function declined over time in first-degree relatives
of individuals with type 2 diabetes.

Pathogenesis of type 2 diabetes
Insulin Deficiency
Type 2 Diabetes
Hypertension
Dyslipidemia
Central obesityInsulin
Resistance

Hypothesis
Pancreatic cell Dysfunction
Fat
Adiponectin
FFA, TNFLeptin, Resistin
InsulinResistance
Pancreatic cell Dysfunction
(Cnop et al. Diabetes 50:1771, 2001)(Cnop et al. Endocrinology 143:3449, 2002)
(Kharroubi et al. BBRC 312:1118, 2003)
In vitro studies

The Metabolic Syndrome
Type 2 Diabetes
Hypertension
Dyslipidemia
Central obesityInsulin
Resistance

DyslipidemiaDensity Gradient Ultracentrifugation
(Nieves et al. Diabetes 52:172, 2003)
0
10
20
30
38 34 30 26 22 18 14 10 6 2
Lipoprotein fractions
Cholesterol (mg/dl) HDL
VLDLIDL LDL
buoyant dense

Dyslipidemia and the Metabolic Syndrome
VLDL
IDL
LDL
buoyant
dense
HDL-10
-5
0
5
10
C
ho
lest
ero
l (m
g/d
l)
(Nieves et al. Diabetes 52:172, 2003)
InsulinResistant
InsulinSensitive
Adiponectin
(Cnop et al. Diabetologia 46:459, 2003)

The Metabolic Syndrome and Hypertension
(Steinberger et al. Circulation 107:1448, 2003)
Intra-abdominal adiposity and insulin resistance are
associated with increased:
• Sodium retention and sensitivity
• Angiotensinogen and angiotensin II levels
• Sympathetic activity
• PAI-1 levels
• Cortisol production in visceral fat compartment

QuickTime™ and aTIFF (Uncompressed) decompressor
are needed to see this picture.NAFLD
Oxidativestress
CoagulopathyInflammation
Endothelialdysfunction
Sleep apneasyndrome
Polycystic ovarysyndrome
Heartfailure
Breastcancer

Treatment: Lifestyle
(NIH Guidelines, 1998)(Hill et al. Science 299:853, 2003)
Diet: Estimate the patients current daily caloric needs
- 500 kcal/d
Initial goal is 10% weight loss over 6 months
(- 25-30% in visceral fat and insulin resistance)
Exercise: 30 min/day
100/100 plan: reduce intake by 100 kcal/day
increase activity by 100 kcal/day

(“Slimming Down” Photographer unidentified. From the Everett Collection)
QuickTime™ and aTIFF (LZW) decompressor
are needed to see this picture.

(“Only in the US”, from the Only in … series)

Treatment: Lifestyle
Its effectiveness recalls Voltaire’s dictum that the
art of medicine is “ to keep the patient occupied
while the disease runs its inevitable course ”
(Pinkney et al. Lancet 357:1357, 2001)

Treatment: Lifestyle
(Tuomilehto et al. N Engl J Med 344:1343, 2002)(Chiasson et al. Lancet 359:2072, 2002)
(Diabetes Prevention Program Research Group. N Engl J Med 346:393, 2003)
Finnish Diabetes Prevention Study
STOP-NIDDM Trial
US Diabetes Prevention Program
7% weight loss
150 min/week exercise
Reduction of diabetes incidence by 60%
Compared to 25-30% reduction for pharmacological intervention

Treatment: Drugs
(Haffner et al. Circulation 108:1541, 2003)
Underlying conditions (hypertension, diabetes, lipid disorders)
should be treated.
An aggressive and early treatment strategy has been proposed.
Therapeutic agents might include fibrates, statins, metformin,
thiazolidinediones, and, possibly, dual PPAR- and agonists.
No consensus optimal treatment targets have been determined
and pharmacotherapy remains at present unproven.

Preop 4 m 2.5 yrs
Weight (kg) 116 92 76
relative loss 21% 34% (12-53)
success rate (>20%) 94%
failure rate (<5%) 0%
BMI (kg/m2) 42 33 28
Surgical treatment of obesity Follow up data (n=32)
For both: p<0.001 by ANOVA for repeated measures

Preop 2.5 yrs
Body fat mass (%) 41±1 32±1
Leptin (ng/ml) 57±3 16±2
Subcutaneous fat area (cm2) 664±21 331±26
Intra-abdominal fat area (cm2) 160±12 69±8
HOMA IR (%) 39±3 88±5
Surgical treatment of obesity Follow up data
For all: p<0.001 by ANOVA for repeated measures

Preop 4 m 2.5 yrs
Glucose (mg/dl) 92±2 85±2 82±1 p<0.01
Normal 81% 92% 97%
Impaired 16% 8% 3%
Diabetic 3% 0% 0%
Surgical treatment of obesity Follow up data
NGT 65%IGT 26%DGT 9%

Preop 4 m 2.5 yrs
Blood pressure
Systolic 125 117 115 p<0.01
Diastolic 73 71 70 NS
Hypertension
Systolic 48% 14% 5%
Diastolic 39% 25% 29%
Surgical treatment of obesity Follow up data

Preop 4 m 2.5 yrs
Lipids
Triglycerides 163±15 123±10 91±8 p<0.001
HDL cholesterol 51±3 47±2 61±2 p<0.001
Dyslipidemia
Triglycerides 47% 28% 3%
HDL cholesterol 50% 60% 23%
Surgical treatment of obesity Follow up data

Conclusions
We are facing a global epidemic of the Metabolic Syndrome, and of its associated cardiovascular and other diseases.
Intra-abdominal adiposity is strongly related to insulin resistance, probably via the secretion of adipocyte-derived free fatty acids and adipokines. These compounds can also contribute to the development of the disorders associated with the Metabolic Syndrome.
Implementing lifestyle modifications for the prevention and treatment of this disease will prove to be a challenge.

Acknowledgments
Steven KahnBob KnoppWil FujimotoJohn BrunzellPeter Havel
Françoise FéryJean Mockel
Division of Metabolism, University of Washington, Seattle
Division of Endocrinology, ULB
Décio EizirikIlham Kharroubi
Laboratory of Experimental Medicine, ULB

Thank you
Recommended