
The Millennial Economy 2018Millennials are changing with the
world around them
2
On behalf of Ernst & Young LLP, Research Now conducted a
survey of 1,202 20- to 36-year-old US citizens nationwide. Of
those respondents, 842 were contacted online, and 360 were
contacted via cellphone. Survey participants were contacted
between June 27 and July 13, 2018.
The 2016 Millennial Economy study was conducted by Public
Opinion Strategies and GBA Strategies on behalf of EY US
and the Economic Innovation Group (EIG). The poll,
conducted between June 15 and June 20, 2016, contacted
1,200 18- to 34-year-olds nationwide.
Methodology

3
The new millennial
In 2016, an Ernst & Young LLP and Economic Innovation
Group (EIG) survey found that millennials were a deeply
pessimistic generation. The results painted a complex picture
of this generation lacking confidence in the economy and
uncertain about the future.
In two years, millennials (now 20-36) are progressing —
they’re graduating college, finding full-time jobs, buying
houses and getting married.
While recognizing they are living in a more stable economic
environment, they aren’t convinced this stability will last. The
oldest millennials have lived through three recessions in their
lifetimes and few have confidence the economy will remain
strong.

4
Millennial growth and progress
► Millennials are graduating from college, finding full-time
jobs, buying houses and getting married.
► They’re proving to be successful in their careers —
millennials are self-reliant and know the best way to get
ahead in life is through hard work.
► They believe the economy has improved but still hesitate
to start their own businesses.
► They’re deeply distrustful of traditional American
institutions, preferring to rely on themselves and a good
education.
► They believe the US tax system is unfair and are inclined
to believe that the full implementation of the Tax Cuts and
Jobs Act (TCJA) won’t change that.

5
Millennials and American dreams
Exploring key milestones

6
► In 2018, 40% of millennials report owning their own homes, a
lower rate of homeownership than that of all Americans 18 years
and older, 64% of whom report owning their own homes.1
► First-time home buyers make up 34% of all home buyers, a decrease
from approximately 50% in 2010.2
► In 2016, 28.8% of millennials (ages 25-34) owned their home,
compared to 51.9% of the same age group in 1975.3
► In 2018, only 38% of millennials surveyed are married. This is
lower than the rate of marriage across all US adults, 50% of
whom are married today.4
► In 1960, 72% of US adults were married.5
► Americans are marrying later in life — the median age for a first
marriage was 27.4 for women and 29.5 for men in 2016 — an
increase of about seven years compared to 1960 (20.3 for women
and 22.8 for men).6
1https://www.census.gov/housing/hvs/index.html.2National Association of Realtors. 2017 Profile of Home Buyers and Sellers. November 2017.3Vespa, Jonathan. The Changing Economics and Demographics of Young Adulthood: 1975 – 2016. April 2017.4http://www.pewresearch.org/fact-tank/2017/09/14/as-u-s-marriage-rate-hovers-at-50-education-gap-in-marital-status-widens/5Id.6Id. at note 4.
Millennials and American dreams

7
-21-Ideal age to move out
of parents’ houseOnly 47% of Americans have
moved out by age 21
Dreams* vs. Reality
-25-Ideal age to get
marriedOnly 24% of 25-year-olds
are married
-25-Ideal age to have a
childOnly 38% of women have
children by age 25
Vespa, Jonathan. The Changing Economics and Demographics of Young Adulthood: 1975-2016. April 2017.
*Based on opinions of American adults polled via the General Social Survey

8
40% 43%
16%26%
43%30%
Own Rent Live with parents
Millennials between the ages of 20 and 23 who live with their parents
decreased 27 percentage points in two
years — from 63% in 2016 to 36% in 2018.
Renters in that age range have increased
from 27% to 44%.
As younger millennials move into the renting market, older millennials are making the leap to home ownership
Where millennials live – homeownership is up from 2016
2018
2016
Approximately
2018
2016
Gender split — Men are more likely to own their own homes, while the percentage of female renters has increased since 2016
29%
41%
30%
48%
37%
14%
Men
22%
46%
30%
32%
50%
18%
Women
Live with parents
Rent
Own
Millennials are moving out of their parents’ homes
1Urban Institute. Millennial Homeownership: Why Is It So Low, and How Can We Increase It?. July 2018.
45%of Gen Xers and Baby Boomers owned their homes when they were between the ages of 25 and 34.1
Home ownership for Millennials between the ages of 28 and 31 increased from 27% to 47% in two years (ownership of those aged 32-36 increased from 46% to 57%).
27% 47%
But they still fall behind older generations in home ownership

9
Millennials and city-living
In the past 10 years (2007-2017),
median rental housing costs have
increased 29% in urban areas,1 while
25-34 year olds have seen only a
17% increase in median income.2 The
16% increase in rural housing costs3
more closely aligns with millennials’
median wage growth.
Raises aren’t keeping pace
with housing costs …
12017 American Community Survey 1-Year Estimates, “MEDIAN MONTHLY HOUSING COSTS FOR RENTER-OCCUPIED HOUSING UNITS (DOLLARS) - United States -- Urban/Rural and Inside/Outside Metropolitan and Micropolitan Area”2Census Bureau, “Table P-10. Age--People (Both Sexes Combined--All Races) by Median and Mean Income: 1974 to 2016”3Id. at note 1.4https://www.creditkarma.com/insights/i/millennials-spend-nearly-100k-on-rent/5https://www.nytimes.com/2018/05/25/business/how-student-debt-can-ruin-home-buying-dreams.html 6Id.7Id. at note 5.
… and rising student debt
makes it hard to buy a home
Student debt was responsible for up to
35% of the decline in homeownership
for those in their late 20s and early 30s
from 2007 to 2015.5
If student debt levels had remained
constant from 2001 to 2015, more than
360,000 people in this age group
would have purchased a home. 6
37%City
38%Suburb
15%Smalltown
9%Rural
Millennials will spend nearly
on rent in their lifetime4#
$100,000
Over
say student debt has forced them to delay homeownership7 4
80% of millennials75% of millennials live
in the city or suburbs,
similar to 2016

10
58%
69%
Never Been Married
Millennials are tying the knot sooner than they did in 2016
38%
27%
Married
MillennialsThe biggest increase in marriage comes from millennials born
between 1987 and 1994, who are currently 24–31 years old
of all Americans
over 18 are
married
1US Census. Marital Status of People 15 Years and Over, by Age, Sex, and Personal Earning. 2016.2US Census. Estimated Median Age at First Marriage, by Sex: 1890 to the Present. 2017.
2018
2016
2018
2016
15%1995—1998
26%1991—1994
45%1987—1990
54%1982—1986
20–23 24–27
28–31 32–36
53%
29%have never been
married1
The median age of marriage in the US is 27 and 29 for women and
men, respectively2
7%15%
33%
50%

11
1Share of millennials with children under the age of 18 currently living at home2http://www.pewresearch.org/fact-tank/2018/05/04/more-than-a-million-millennials-are-becoming-moms-each-year/3https://www.axios.com/millennials-a-tale-of-two-generations-ff2a6de5-cfde-42c5-ab38-ec0908fbfcc9.html
When women from Generation X (those
born between 1965 and 1980) were the
same age as Millennials are today,
Almost half of 34-year-olds who have
never been married have children —
roughly 16 percentage points higher
than past generations.3
27%1995—1998
39%1987—1990
33%1991—1994
58%1982—1986
Millennials are starting families later than the national average
40%of millennial
women have
children in
20181
As millennials enter their 30s, they are more likely to have a child than those
still in their 20s
27% of millennial women aged 20–23 have a child compared to 58% of millennial women between 32 and 36
were already moms.253%

12
Millennials are career-focused and hardworkingMillennials and careers

13
► 86% of millennials believe working hard is an extremely or
very important factor in getting ahead in life, and 36% think
staying with one company and working your way up the
ladder is the best way to advance your career, consistent
with 2016.
► Nearly 30% of millennials rank pay equity as their top
career concern, followed by flexibility (22%) and clear
upward trajectory (17%).
► Americans born in the 1960s–1980s averaged two job
changes by 32 years old, while present-day millennials
average closer to three or four.1
► 40% of millennials believe they should be promoted every
two years, without taking performance into consideration.2
1https://www.thebalancecareers.com/how-often-do-people-change-jobs-20604672Joel Stein. Millennials: The Me Me Me Generation. Time. May 2013.
Millennials at work

14
Millennials are graduating from college and entering the workforce with full-time jobs
14%
20%
19%
47%
15%
10%
11%
63%
1991—1994
21%
5%
18%
56%
12%
2%
8%
78%
1987—1990
20%
5%
14%
60%
12%
2%
8%
77%
1982—1986
15%
44%
24%
17%
18%
25%
23%
34%
Not working
Student
Part time
Full time
1995—1998
Millennials born in 1987 or earlier have made strides
toward full-time employment
Older millennials are more likely to have full-time employment than they were in 2016
66%
11% 8%14%
45%
19% 18% 17%
Working full time Working part time Full-time student Not working
2018
2016

15
Millennials’ primary priority is pay equity, but flexibility is also important in their career
18%
26%
28%
53%
50%
12%
13%
14%
19%
29%
6%
13%
14%
34%
21%
Diversity & inclusion efforts
Managerial opportunities
Clear upward trajectory
Pay equity
Flexibility options
9%
15%
19%
24%
22%
10%
20%
19%
16%
25%
19%
35%
38%
41%
47%
29% of respondents rank pay equity as their current top
career concern
Rank 1
Rank 2
Women are much more concerned about pay equity than
men, with 34% ranking it as their primary career concern
14%
17%
22%
29%
17%
17%
27%
18%
31%
34%
49%
47%
Managerialopportunities
Clear upwardtrajectory
Flexibility options
Pay equity
Women Men
Women, Rank 1
Women, Rank 2
Men, Rank 1
Men, Rank 2
Single women
are the most
concerned about
pay equity
57%consider it a
top concern
53% 51%of millennials with
children
of married
millennials
value flexibility over pay equity

16
Millennials see themselves as their best resource for career development
Rank 1
Rank 2
Which of the following groups do you think should be primarily responsible for providing access to skills development and opportunities
needed to perform in your career?
14%
17%
26%
35%
14%
27%
30%
21%
27%
44%
57%
56%
Corporations and businesses
Government
Universities or other academic institutions
It's up to me to seek skills and opportunities proactively, wherever theyare offered
56%
28%
It's up to me to seek skills and opportunities proactively, wherever they are offered

17
Millennials are risk-averse in their careers, an attitude that has not changed from 2016
36%
21% 21%
13%
1%
To stay withone companyand work your
way up theladder
To move fromjob to job at
differentcompanies,advancing
along the way
To attainadditional
education orjob training
To start yourown company
Other
A plurality believe loyalty to one company is the
best way to advance your career, challenging the
stereotype of the job-hopping, rootless millennial. 67% believe taking risks is extremely or very important to getting ahead
in life
Millennials think that hard work, and not luck, is
the key to getting ahead in life
36%
59%
61%
67%
71%
86%
60%
38%
37%
29%
26%
12%
Being lucky
Training for a specific career
Having a great education
Taking risks and beingwilling to fail
Knowing the right people
Working hard
Extremely or very important Somewhat or not too important Don’t know
Which one of the following would you say is the best way to advance your career?
Taking risks and being willing to fail
18
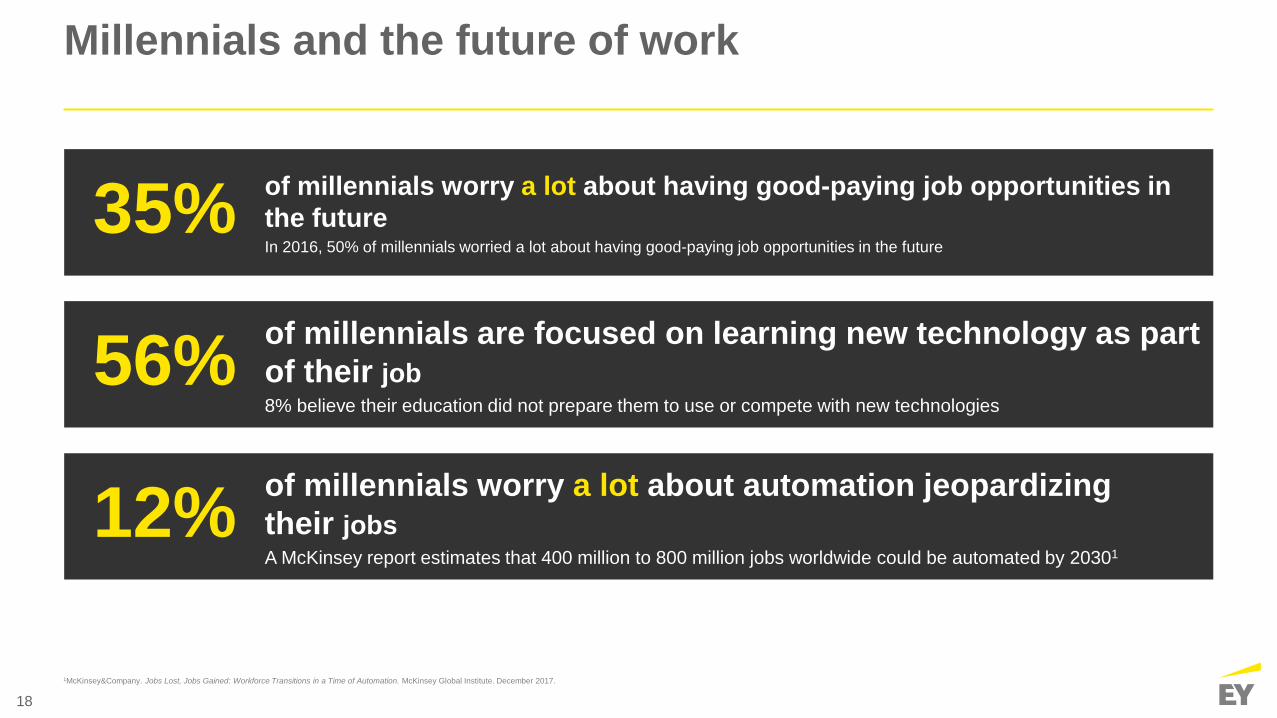
1McKinsey&Company. Jobs Lost, Jobs Gained: Workforce Transitions in a Time of Automation. McKinsey Global Institute. December 2017.
Millennials and the future of work
35%of millennials worry a lot about having good-paying job opportunities in
the futureIn 2016, 50% of millennials worried a lot about having good-paying job opportunities in the future
56%of millennials are focused on learning new technology as part
of their job8% believe their education did not prepare them to use or compete with new technologies
12%of millennials worry a lot about automation jeopardizing
their jobsA McKinsey report estimates that 400 million to 800 million jobs worldwide could be automated by 20301

19
In a thriving economy, millennials are stillrisk-averse
Millennials and financial confidence

20
1Figures as of July/Q2 20182https://fred.stlouisfed.org/series/GDP#02https://fred.stlouisfed.org/series/CPIAUCSL#03https://fred.stlouisfed.org/series/UNRATE#0
US economy and financial confidence
► Today’s1 economy is strong — 5.4% growth in GDP,2 2.9%
inflation,3 and 3.9% unemployment.4
► Millennials are feeling more positive about the economy than
they were in 2016 – 41% would describe it as excellent or good
in 2018 compared to only 28% who said the same in 2016.
► The future is less clear – respondents are evenly split on the how
the economy will fair within the next year and only one-third
believe their standard of living will be better than their parents’
long-term.
► 50% of respondents currently paying off, or plan to take on,
student loan debt.
► Business majors are the least likely to have debt (44%) and
humanities majors are the most likely (64%).
► STEM majors are the mostly likely to believe their college
education is worth the financial cost.

21
Millennials are feeling more upbeat about the economy, but only 9% would describe it as excellent
9%
32% 36%
18%4%
24%
44%
26%
Excellent Good Only fair Poor
26%32% 34%
25%36%
29%
Better than it is today The same as it is today Worse than it is today
How would you describe the state of the nation’s economy these days?
How do you expect the national economy to be a year from now?
But a good economy today doesn’t mean millennials aren’t anxious about the future
2018
2016
2018
2016
22
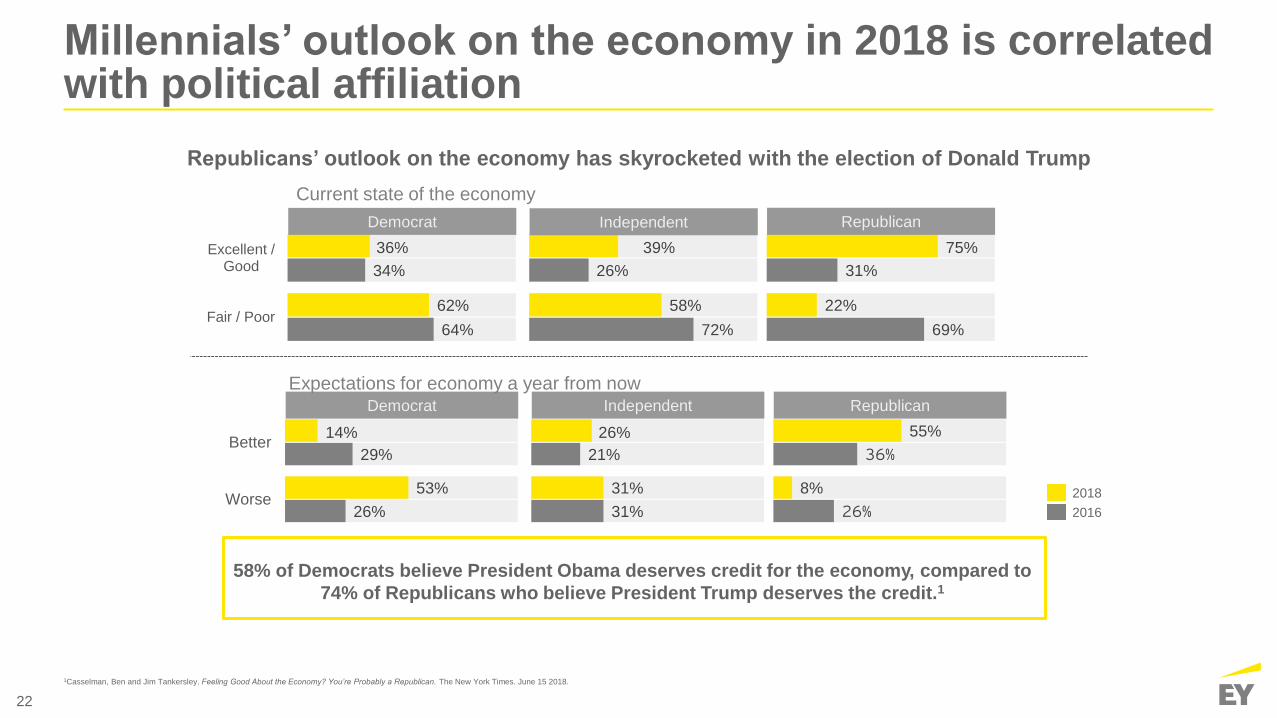
Millennials’ outlook on the economy in 2018 is correlated with political affiliation
72%
26%
58%
39%
Independent
69%
31%
22%
75%
Republican
64%
34%
62%
36%
Fair / Poor
Excellent /Good
Democrat
Current state of the economy
31%
21%
31%
26%
Independent
26%
36%
8%
55%
Republican
26%
29%
53%
14%
Worse
Better
Democrat
Expectations for economy a year from now
Republicans’ outlook on the economy has skyrocketed with the election of Donald Trump
58% of Democrats believe President Obama deserves credit for the economy, compared to
74% of Republicans who believe President Trump deserves the credit.1
1Casselman, Ben and Jim Tankersley. Feeling Good About the Economy? You’re Probably a Republican. The New York Times. June 15 2018.
2018
2016
23
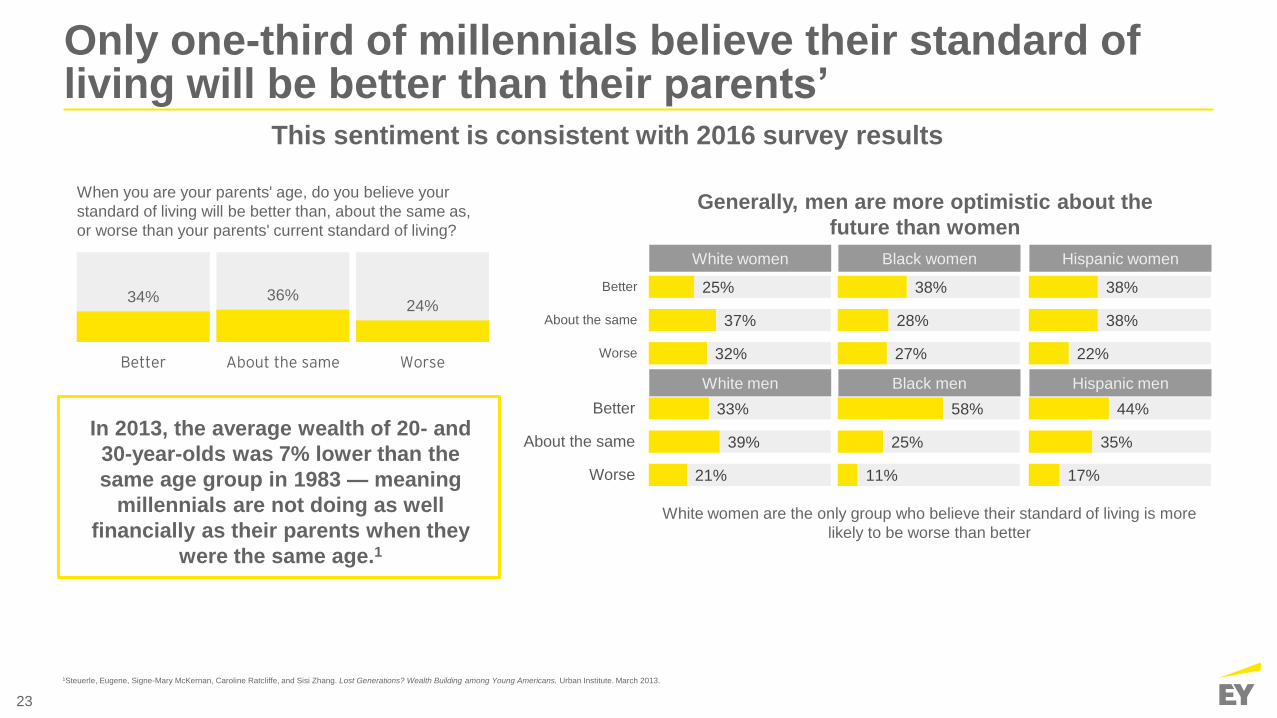
Only one-third of millennials believe their standard of living will be better than their parents’
34% 36%24%
Better About the same Worse
When you are your parents' age, do you believe your
standard of living will be better than, about the same as,
or worse than your parents' current standard of living?
White women are the only group who believe their standard of living is more
likely to be worse than better
Generally, men are more optimistic about the
future than women
32%
37%
25%
Worse
About the same
Better
White women
27%
28%
38%
Black women
22%
38%
38%
Hispanic women
21%
39%
33%
Worse
About the same
Better
White men
11%
25%
58%
Black men
17%
35%
44%
Hispanic men
In 2013, the average wealth of 20- and
30-year-olds was 7% lower than the
same age group in 1983 — meaning
millennials are not doing as well
financially as their parents when they
were the same age.1
1Steuerle, Eugene, Signe-Mary McKernan, Caroline Ratcliffe, and Sisi Zhang. Lost Generations? Wealth Building among Young Americans. Urban Institute. March 2013.
This sentiment is consistent with 2016 survey results
24
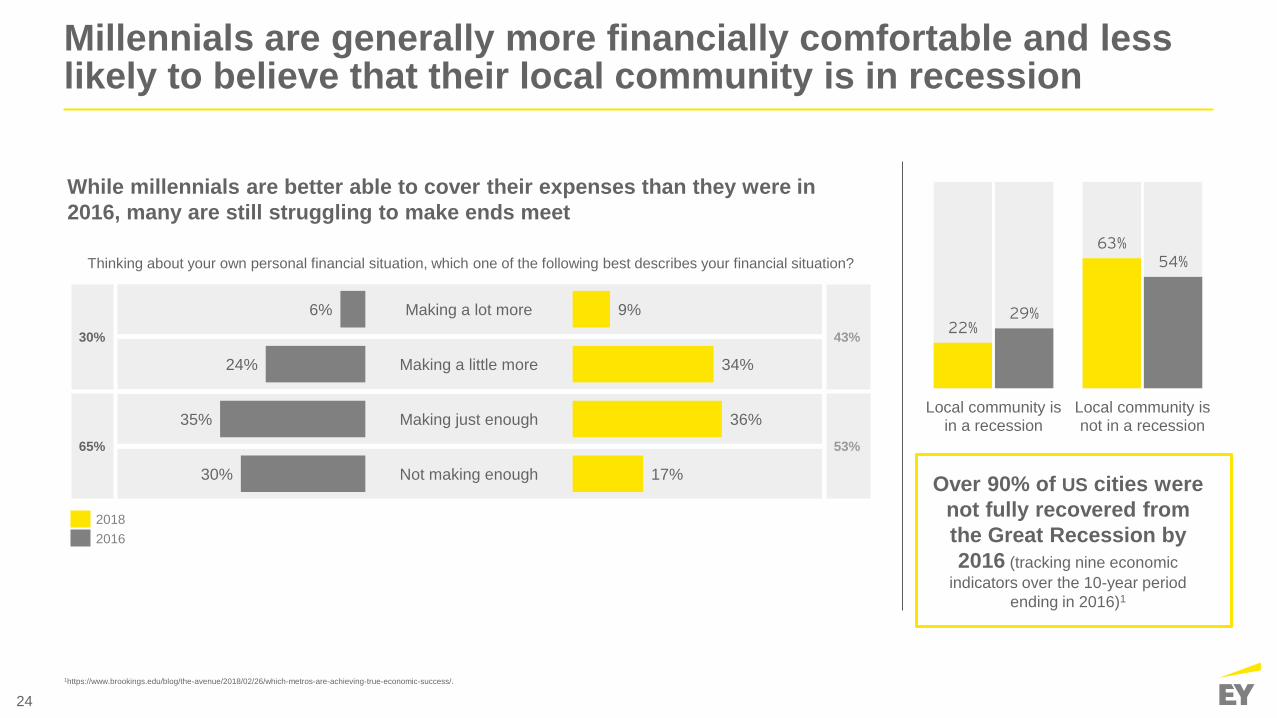
Millennials are generally more financially comfortable and less likely to believe that their local community is in recession
22%
63%
29%
54%
Local community isin a recession
Local community isnot in a recession
30%
35%
24%
6%
Not making enough
Making just enough
Making a little more
Making a lot more
17%
36%
34%
9%
Thinking about your own personal financial situation, which one of the following best describes your financial situation?
While millennials are better able to cover their expenses than they were in
2016, many are still struggling to make ends meet
43%
53%
30%
65%
2018
2016
Over 90% of US cities were
not fully recovered from
the Great Recession by
2016 (tracking nine economic
indicators over the 10-year period
ending in 2016)1
1https://www.brookings.edu/blog/the-avenue/2018/02/26/which-metros-are-achieving-true-economic-success/.

25
Millennials are not as concerned about competition for jobs as they are about their retirement and the state of the country’s balance sheet
31%
35%
46%
56%
65%
70%
70%
71%
75%
64%
58%
47%
38%
30%
25%
25%
23%
20%
Foreign competition for jobs
Job jeopardization by automation
Inability to pay back student loans
Effect of tax and regulatory policies on US businesses
High healthcare bills
Future job opportunities
Not enough money at retirement
America's debt and deficit levels
Lack of Social Security at retirement
Worry a lot or some Worry not very much or not at all Don’t know
How much do each of the following worry you personally? Do they worry you a lot, some, not very much or not at all.
While companies are increasingly offering unique perks geared toward millennials — spa services, catered dinners, Ping-Pong, etc. —
these services don’t help millennials build their careers. In fact, most employees value basic benefits above these new perks. Good health
insurance, flexibility, and more vacation time top the list of benefits valued by employees.1
1Kerry Jones. The Most Desirable Employee Benefits. Harvard Business Review. February 2017.
In 2016, respondents had similar top concerns:
79% Were worried about not having enough money at retirement
78% Were worried about America’s debt and deficit levels
78% Were worried about future job opportunities

26
47%
38%
12%
45%
32%
21%
No debt Currently paying off Plan on taking on
1Federal Reserve. “Report on the Economic Well-Being of U.S. Households in 2015”. May 2016
2018
2016
Personal finance and student debtThe burden is getting lighter but continues to be a limitation
50%of millennials are currently paying off, or plan to take on, student loan debt
On average, Americans have $30,000 of student loan debt1

27
Business majors are the least likely to have debt, humanities majors are the most likely
44%Business
64%Humanities
57%Education
58%STEM
56%Other
Share of millennials currently paying off or planning to take on student loan debt
63%68%
54%46%
63%
Humanities STEM Education Other Business
Share of millennials who believe their college education is worth the financial cost
Despite a large share carrying debt, STEM majors are most likely to believe college is worth it

28
Why aren’t more millennials starting businesses?
Millennials and entrepreneurship

29
1Sangeeta Badal. Entrepreneurship and Job Creation. Gallup. September 2010.2US Small Business Administration. “The Missing Millennial Entrepreneurs”. February 2016.3https://www.bls.gov/bdm/entrepreneurship/entrepreneurship.htm
Millennial entrepreneurship remains historically low
► 72% of millennials believe start-ups are essential to the economy,
and they are right – US startups create 40% of new jobs
annually, adding an average 6.5 jobs per new establishment.1
► However, the percentage of millennials considering starting their
own business is down from 2016 – only 58% report this today
while 62% of respondents indicated the same in 2016.
► At age 30, less than 4% of millennials reported self-employment
in 2014. This is compared to 5.4% of Gen Xers and 6.7% of Baby
Boomers who report the same.2
► Consistent with this trend, the number of jobs created by
establishments less than 1 year old decreased from 4.1 million in
1994 to 3 million in 2015.3

30
Millennials believe that startups are essential to the economy
38%
21%16%
10% 9%
I don't have the financial meansto start a business
I have no desire to start abusiness
I am afraid that if I started a newbusiness, it would fail
I don't have an idea for a newbusiness but if I did I would start
one
I don't know how to start abusiness
But say the biggest obstacle in starting their own business is financial
72%
15% 13%
Startups and entrepreneurship areessential for new innovation and
jobs in our economy
The US economy can be strongwithout lots of startup and
entrepreneurial activity
Don't know
I am afraid that if I started a new business, it would fail
I don’t have an idea for a new business but if I did I
would start one
31
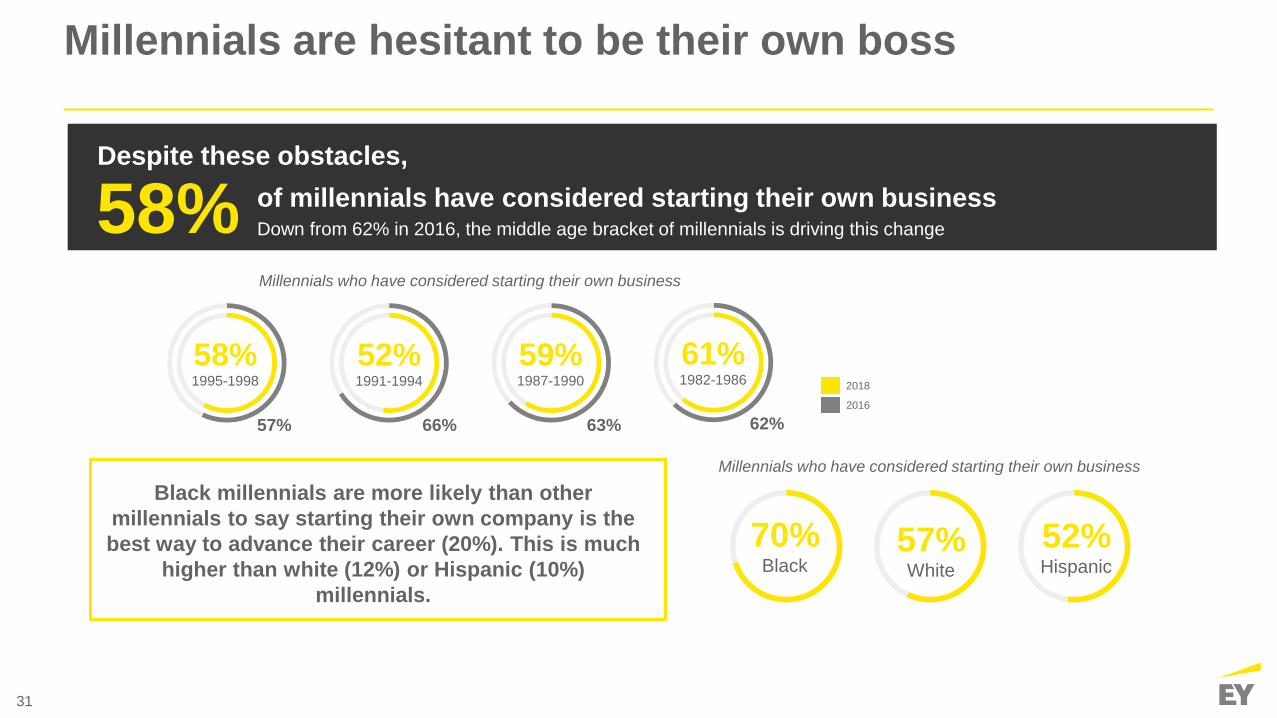
52%1991-1994
59%1987-1990
58%1995-1998
61%1982-1986
Black millennials are more likely than other
millennials to say starting their own company is the
best way to advance their career (20%). This is much
higher than white (12%) or Hispanic (10%)
millennials.
70%Black
52%Hispanic
57%White
2018
2016
Millennials who have considered starting their own business
Millennials are hesitant to be their own boss
58% of millennials have considered starting their own businessDown from 62% in 2016, the middle age bracket of millennials is driving this change
Despite these obstacles,
Millennials who have considered starting their own business
57% 66% 63% 62%

32
58%
26%16%
55%
29%16%
More entrepreneurial Less entrepreneurial Don't know
2018
2016
Millennials believe that their generation as a whole is more entrepreneurial than the other generations
49% of millennials know someone who has
started or works for a startup 79%of those who do know someone who
has started their own business consider
them a success
57% of millennials believe the government makes it more difficult to succeed in starting their own business
Do you believe your generation is generally more entrepreneurial than previous generations, or less?
The reality is at age 30,
less than 4% of millennials reported self-employment in 2014. This is compared to 5.4% of Gen Xers and 6.7% of Baby Boomers.1
1US Small Business Administration. “The Missing Millennial Entrepreneurs”. February 2016.

33
Joining the gig economy
11%
7%
18%
Additional source of income
Primary source of income
Participate in gig economy
White
13%
14%
28%
Black
12%
4%
17%
Hispanic
1Aaron Smith. Gig Work, Online Selling and Home Sharing. Pew Research Center. November 2016.
Millennials who participate in the gig economy are more likely to have considered
starting their own business than those who don’t.
Participation in the gig economy varies across racial lines19%
of millennials participate in the gig economy
Compared to 8% of Americans who reported earning money from an online job platform in 20151
75% of millennials who participate in the gig economy and consider it
their primary source of income have considered starting their own
business compared to 58% of the total survey population.
34
Millennials are wary of American institutionsMillennials and institutions

35
► 77% of millennials report that they are proud to
be American.
► 30% of millennials report high levels of confidence in
American institutions; confidence is highest in the military,
with 51% of millennials expressing a great deal, or quite a
lot, of confidence.
► Since 2016, millennials’ trust in higher education, corporate
America, Silicon Valley, organized labor and the criminal
justice system has decreased.
► Trust in the media, organized religion, the military, and local
government has increased since 2016.
► 84% of millennials report that they are registered to
vote, and 86% say they likely will vote in the 2020
presidential election.
Millennials and American institutions

36
36%Blackmen
31%Hispanic
men
31%Whitemen
27%White
women
32%Hispanic women
30%Black
women
Confidence in American institutions remains low for millennials
2018 2016
Since 2016,
confidence in
institutions
has …
The news media +5
Governors +3
Organized religion +2
Mayors +1
Military -4
Colleges and universities -2
Silicon Valley -1
Criminal justice system -1
Organized labor -1
Corporate America -1
Professional sports -1
…in
cre
ase
d
…d
ecre
ase
d
30%of millennials report high levels of confidence in American institutions* in both 2016 and 2018
(Share of millennials with a great deal, or quite a lot, of confidence in all polled institutions)
47% 36% 32% 25% 25% 23%
*The military, colleges and universities, professional sports, organized labor, banks and financial institutions, organized religion, mayors, news media, Silicon Valley, the criminal justice system, governors, the federal government, and corporate America

37
Millennials continue to struggle to trust institutions
19%
22%
24%
25%
26%
26%
26%
27%
29%
29%
31%
49%
51%
73%
73%
70%
69%
54%
69%
67%
65%
66%
61%
61%
47%
43%
Corporate America
Federal government
Governors
Criminal justice system
Silicon Valley
The news media
Mayors
Organized religion
Banks and financial institutions
Organized labor
Professional sports
Colleges and universities
Military
Have a great deal or quite a lot of confidence Have some or very little confidence Don’t know
A 2018 Gallup poll found that 74% of Americans have confidence in the military, 29% have confidence in public schools, 22% have
confidence in the news media, 11% have confidence in Congress, and 25% have confidence in big business.1
Overall confidence in American institutions has decreased from 44% in 1973 to 27% in 2018.1
1https://news.gallup.com/poll/236243/military-small-business-police-stir-confidence.aspx
Banks and financial institutions
Only 51% of respondents express high levels of confidence in the most trusted institution
38
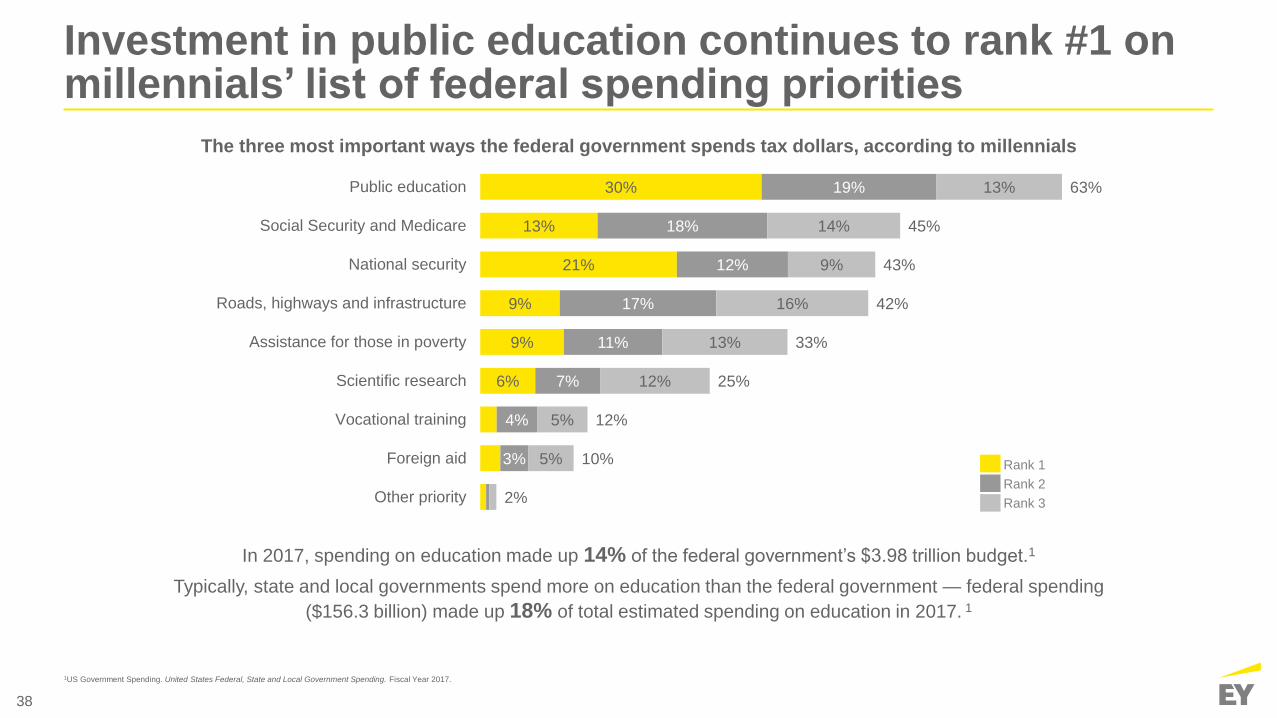
Investment in public education continues to rank #1 on millennials’ list of federal spending priorities
Rank 1
Rank 2
Rank 3
6%
9%
9%
21%
13%
30%
3%
4%
7%
11%
17%
12%
18%
19%
5%
5%
12%
13%
16%
9%
14%
13%
2%
10%
12%
25%
33%
42%
43%
45%
63%
Other priority
Foreign aid
Vocational training
Scientific research
Assistance for those in poverty
Roads, highways and infrastructure
National security
Social Security and Medicare
Public education
The three most important ways the federal government spends tax dollars, according to millennials
In 2017, spending on education made up 14% of the federal government’s $3.98 trillion budget.1
Typically, state and local governments spend more on education than the federal government — federal spending
($156.3 billion) made up 18% of total estimated spending on education in 2017. 1
1US Government Spending. United States Federal, State and Local Government Spending. Fiscal Year 2017.

39
Overall, millennials still believe the country is on the wrong track, but this 2018 survey reflects a significant disparity between those who identify as Democrats and Republicans
27%
61%
25%
63%
Country is going in theright direction
Country is on thewrong track
67%
61%
Independent
79%
23%
Republican
47%
87%
Democrat
87% of
millennial Democrats
believe the country is
on the wrong track
2018
2016
compared to only
23% of
millennial
Republicans
Percentage of millennials who think the country is on the wrong track by party

40
55%High school or less
72%Some college
77%All Millennials
55%High school or less
87%College+
72%Some college
77%All Millennials
Share of Millennials, by education level, who report having voted in
the 2016 Presidential election
Per the US Census Bureau, 53% of millennials
voted in the 2016 election (compared to 61%
of all US citizens)2; however, millennials
surveyed report voting at higher rates
1US Census Bureau. Reported Voting and Registration, by Race, Hispanic Origin, Sex, and Age, for the United States. November 2016.2Id.
76%say they will likely vote in the 2018
midterms
86%say they will likely vote in the 2020
election
Millennials at the polls
84% of millennials report being registered voters
In 2016, 55% of citizens between the ages 18 and 24 reported being registered to vote1

41
Millennials think the US tax system is imbalanced, even after the Tax Cuts and Jobs ActMillennials and taxes

42
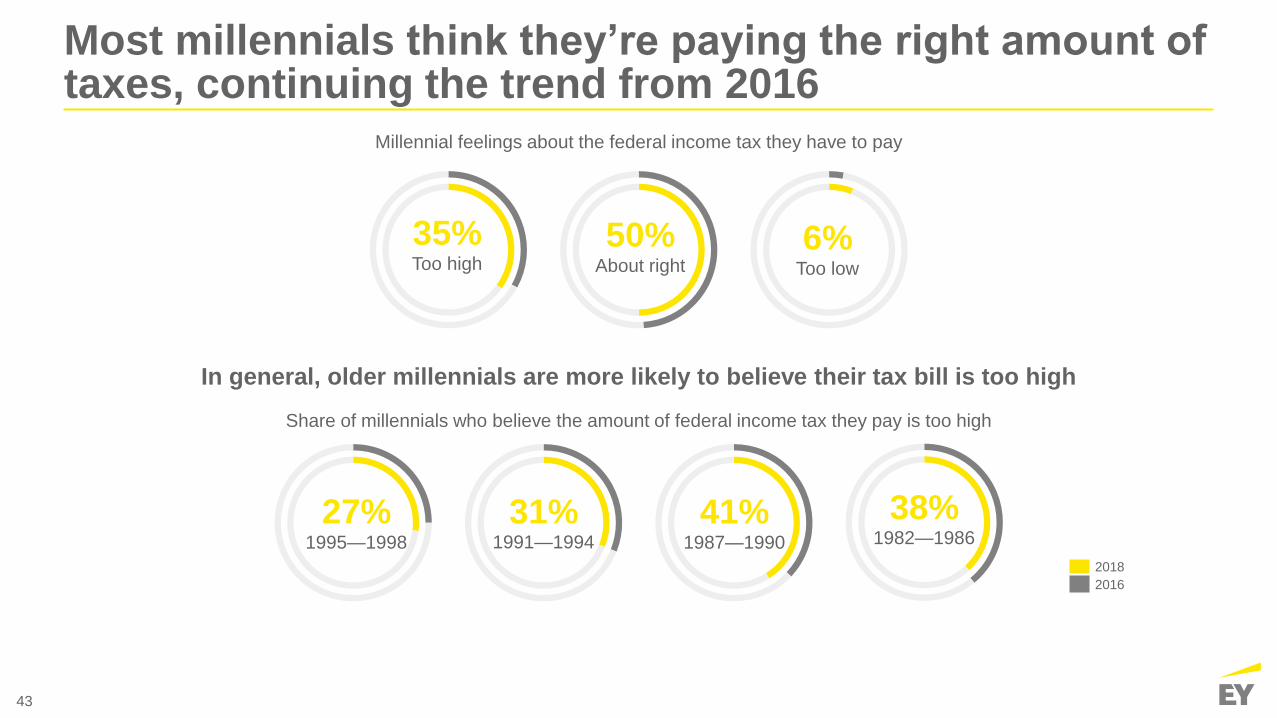
► As in 2016, about half of millennials believe they are paying the
right amount in taxes and a third believe their tax bill is too high.
► Approximately two-thirds of millennials believe high-net worth
individuals and large corporations aren’t paying the right amount
of taxes. Half of respondents believe small businesses and lower-
income and middle class Americans are paying too much in taxes.
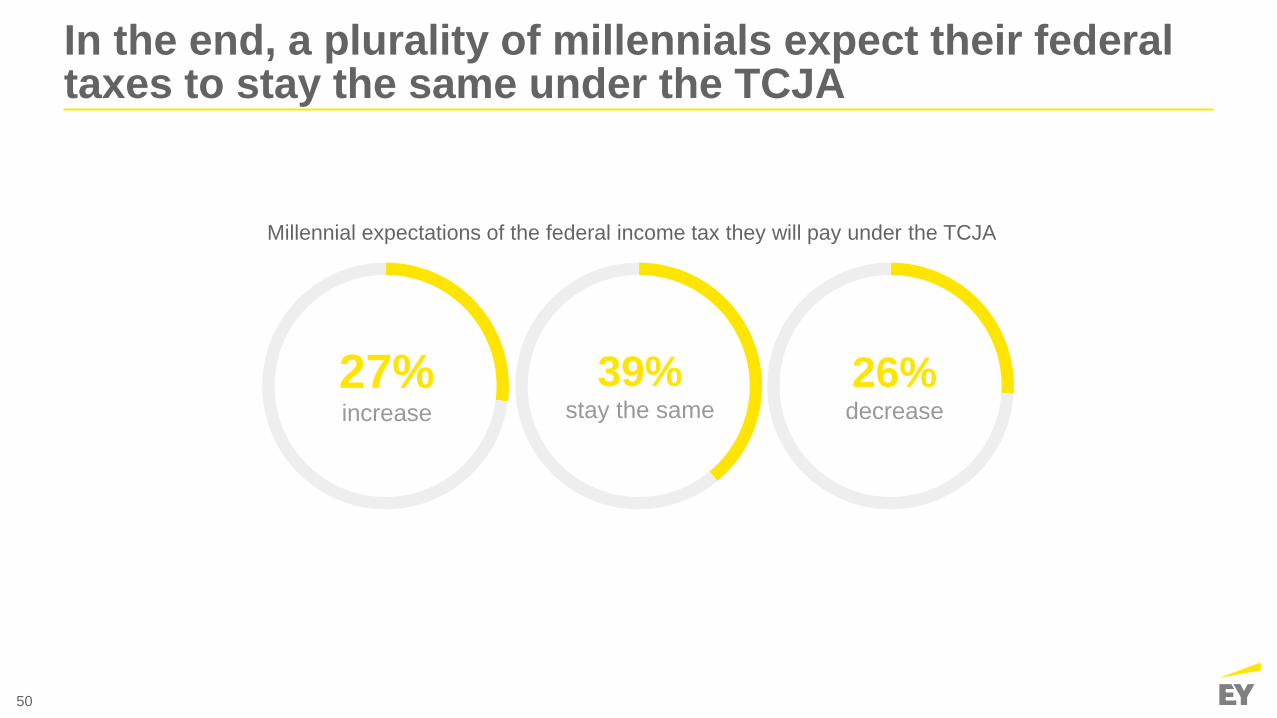
► 74% of millennials report knowing at least a little about the new
TCJA, but are split on how they will be affected by it – 27%
believe their taxes will increase and 39% believe they will
stay the same.
► Respondents believe high-net worth individuals and large
corporations will pay less under TCJA, but opinions vary across
party lines – 70% of Democrats think large corporations will pay
less under the TCJA compared to 46% of Republicans.
Millennials and taxes
43
27%1995—1998
31%1991—1994
41%1987—1990
38%1982—1986
Most millennials think they’re paying the right amount of taxes, continuing the trend from 2016
Millennial feelings about the federal income tax they have to pay
Share of millennials who believe the amount of federal income tax they pay is too high
In general, older millennials are more likely to believe their tax bill is too high
35%Too high
50%About right
6%Too low
2018
2016

44
Millennials remain convinced that the burden of the American tax system is not balanced
49%
28%
12%
56%
25%
10%
Too much About right Too little
51%
34%
6%
51%
35%
6%
Too much About right Too little
Lower-income Americans The middle class
9%18%
64%
10% 14%
70%
Too much About right Too little
High-net-worth individuals
8%16%
66%
Too much About right Too little
46%
32%
7%
Too much About right Too little
Large corporations Small businesses
Two-thirds of millennials believe high-net-worth individuals and large corporations do not pay the right amount of taxes
2018
2016

45
Across party lines, a plurality of millennials believe that large corporations do not pay the right amount of taxes
16%
31%
42%
Too much About right Too little
Democrat Independent Republican
9%
17%
66%
Too much About right Too little
3%9%
83%
Too much About right Too little

46
Do millennials’ views on tax affect their level of confidence in corporations?
Share of Millennials personally worried a lot about American businesses being hurt by high taxes and regulations
Even with their lack of confidence and belief that corporations don’t pay the right amount of tax, 23% of Millennials worry
a lot about American businesses being hurt by taxes and regulations
33%Republican
16%Democrat
18%Independent
Share of Millennials, by party, with a great deal, or quite a lot, of confidence in corporate America
28%Republican
19%Democrat
22%Independent
35%of millennials have very little confidence in corporate America (down slightly from 40% in 2016)
Only 19% report having a great deal or quite a lot of confidence in US corporations consistent with
2016 — corporate America is the lowest-ranked institution in both years
2018
2016
19% 19% 26%
21% 24% 37%
47
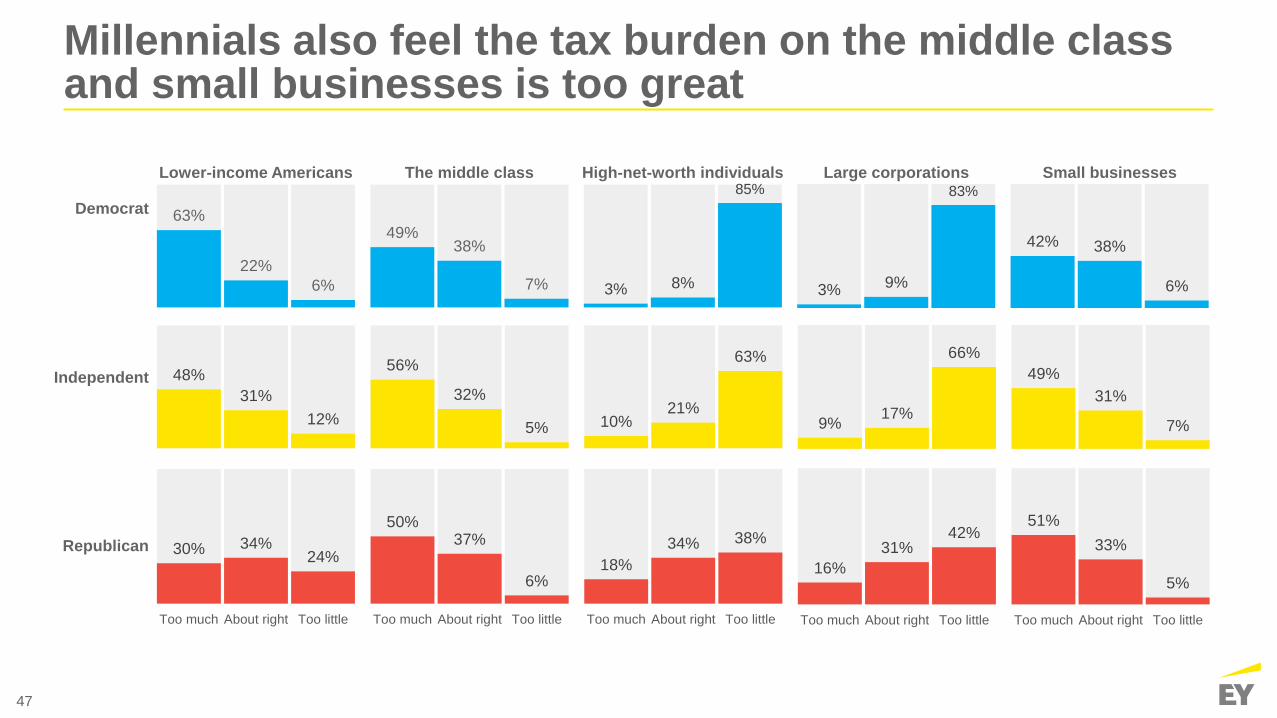
Millennials also feel the tax burden on the middle class and small businesses is too great
63%
22%
6%
Lower-income Americans
49%38%
7%
The middle class
3% 8%
85%High-net-worth individuals
3% 9%
83%
Large corporations
42% 38%
6%
Small businesses
30% 34%24%
Too much About right Too little
50%37%
6%
Too much About right Too little
18%
34% 38%
Too much About right Too little
16%
31%42%
Too much About right Too little
51%
33%
5%
Too much About right Too little
48%
31%
12%
56%
32%
5% 10%21%
63%
9%17%
66%
49%
31%
7%
Democrat
Independent
Republican

48
A majority of millennials know at least a little about the TCJA
31% 33% 28%
Pay more Pay thesame
Pay less
34% 30% 30%
Pay more Pay thesame
Pay less
Lower-income Americans The middle class
17% 19%
57%
Pay more Pay thesame
Pay less
High-net-worth individuals
15% 18%
60%
Pay more Pay thesame
Pay less
29% 27%35%
Pay more Pay thesame
Pay less
Large corporations Small businesses
A plurality of millennials believe small businesses, high-net-worth individuals, and large corporations will benefit from TCJA
Asked only of respondents who indicated they knew at least a little about the Tax Cuts and Jobs Act.
12%
29%33%
17%
A lotI know how it impacts me and
others
SomeI know how it impacts me
A littleI know a tax bill was passed
Nothing
But very few report understanding the full impact of the new law on themselves and others
I know how it impacts me and others
I know how it impacts me I know a tax bill was passed
How much would you say you know about the TCJA, the new tax law passed in December 2017?

49
Across party lines, millennials believe high-net-worth individuals and large corporations will pay less under TCJA
47%
27%19%
Lower-income Americans
42%31%
21%
The middle class
11% 12%
72%
High-net-worth individuals
10% 14%
70%
Large corporations
39%26% 25%
Small businesses
12%
37% 42%
Pay more Pay thesame
Pay less
17%31%
46%
Pay more Pay thesame
Pay less
26% 26%39%
Pay more Pay thesame
Pay less
22% 26%
46%
Pay more Pay thesame
Pay less
16%24%
53%
Pay more Pay thesame
Pay less
28%37%
28% 34% 28% 31%17% 22%
55%
15% 18%
60%
27% 29% 34%
Democrat
Independent
Republican
However, they are divided on how the taxes for lower-income and middle-class
Americans will change
Asked only of respondents who indicated they knew at least a little about the Tax Cuts and Jobs Act.
50
In the end, a plurality of millennials expect their federal taxes to stay the same under the TCJA
27%increase
26%decrease
39%stay the same
Millennial expectations of the federal income tax they will pay under the TCJA

EY | Assurance | Tax | Transactions | Advisory
About EY
EY is a global leader in assurance, tax, transaction and advisory
services. The insights and quality services we deliver help build trust
and confidence in the capital markets and in economies the world
over. We develop outstanding leaders who team to deliver on our
promises to all of our stakeholders. In so doing, we play a critical role
in building a better working world for our people, for our clients and
for our communities.
EY refers to the global organization, and may refer to one
or more, of the member firms of Ernst & Young Global Limited,
each of which is a separate legal entity. Ernst & Young
Global Limited, a UK company limited by guarantee, does not
provide services to clients. For more information about our
organization, please visit ey.com.
Ernst & Young LLP is a client-serving member firm of
Ernst & Young Global Limited operating in the US.
© 2018 Ernst & Young LLP.
All Rights Reserved.
1808-2841002
ED None
This material has been prepared for general informational purposes
only and is not intended to be relied upon as accounting, tax or other
professional advice. Please refer to your advisors for specific advice.
ey.com
Recommended
![A Millennial’s Guide to Homeownership · The Millennial Generation is the largest generation in United States history. According to the US Census Bureau: “[Millennials] born between](https://img.pdfslide.net/doc/110x75/5f2cd18d0149de46174b2a3b/a-millennialas-guide-to-homeownership-the-millennial-generation-is-the-largest.jpg)


![A Millennial s Guide to Homeownership€¦ · [Millennials] born between 1982-2000, now number 83.1 million and represent more than one-quarter of the nation s population. Their size](https://img.pdfslide.net/doc/110x75/5f801e67ecc6443b005dfcff/a-millennial-s-guide-to-homeownership-millennials-born-between-1982-2000-now.jpg)