Cerebral Cortex November 2009;19:2579--2594
doi:10.1093/cercor/bhp008
Advance Access publication February 24, 2009
The Neural Architecture of Music-EvokedAutobiographical Memories
Petr Janata
Department of Psychology, Center for Mind and Brain,
University of California, Davis, CA 95618, USA
The medial prefrontal cortex (MPFC) is regarded as a region of thebrain that supports self-referential processes, including theintegration of sensory information with self-knowledge and theretrieval of autobiographical information. I used functional magneticresonance imaging and a novel procedure for eliciting autobiograph-ical memories with excerpts of popular music dating to one’sextended childhood to test the hypothesis that music and autobio-graphical memories are integrated in the MPFC. Dorsal regions of theMPFC (Brodmann area 8/9) were shown to respond parametrically tothe degree of autobiographical salience experienced over the courseof individual 30 s excerpts. Moreover, the dorsal MPFC alsoresponded on a second, faster timescale corresponding to thesignature movements of the musical excerpts through tonal space.These results suggest that the dorsal MPFC associates music andmemories when we experience emotionally salient episodic memo-ries that are triggered by familiar songs from our personal past. MPFCacted in concert with lateral prefrontal and posterior cortices both interms of tonality tracking and overall responsiveness to familiar andautobiographically salient songs. These findings extend the results ofprevious autobiographical memory research by demonstrating thespontaneous activation of an autobiographical memory network ina naturalistic task with low retrieval demands.
Keywords: emotion, episodic memory, fMRI, medial prefrontal cortex,tonality
Introduction
The evocation of autobiographical memories and associated
emotions by music counts among the most poignant experi-
ences associated with music; yet, little is known about how
these prominent facets of the human experience are bound
together in the brain. In this study, I test the hypothesis that
the medial prefrontal cortex (MPFC) serves as a hub that
associates features of the music with autobiographical memo-
ries and emotions. I also describe the broader network of brain
areas that is recruited during the reliving of music-evoked
autobiographical memories (MEAMs).
There are several reasons to suspect that the MPFC might
support the integration of memories, emotions, and music.
Meta-analyses of autobiographical memory retrieval tasks
indicate MPFC involvement (Gilboa 2004; Svoboda et al.
2006), and more generally, the MPFC is engaged by judgments
regarding self-relevance and affect (Ochsner et al. 2004). The
reason to suspect that music engages the MPFC is 4-fold. First,
the region was observed to track the movement of a melody
through the tonal space created by the system of major and
minor keys underlying Western tonal music (Janata, Birk, et al.
2002). The trajectory that a piece of music takes in tonal space
serves as a signature of that piece of music. Given that excerpts
of music serve as potent retrieval cues for memories (Janata
et al. 2007), structural descriptors of such pieces (such as their
movements in tonal space) constitute probes with which to
identify brain regions that are responding to specific etholog-
ically valid memory retrieval cues. These time-varying descrip-
tors may complement simpler static descriptors (such as
whether the overall excerpt is familiar to the listener) in
identifying brain areas that respond to personally relevant
musical stimulation. Second, emotional responses to music and
the perceived pleasantness of music modulate activity in the
MPFC. Ventral regions in particular were shown to respond
more strongly to short consonant musical passages compared
with the same passages rendered increasingly more dissonant
(Blood et al. 1999), and the same areas were active while
listening to unfamiliar but pleasant music (Brown, Martinez,
and Parsons 2004). Third, a task involving ancillary familiarity
judgments about excerpts of music activated the MPFC broadly
(Platel et al. 2003), and judgments about the familiarity of
music and odors showed that familiar musical stimuli elicited
stronger responses in the MPFC than did unfamiliar stimuli
(Plailly et al. 2007). The final impetus for focusing on the MPFC
comes from a pair of observations regarding Alzheimer’s
disease (AD) patients. The first is spared memory for familiar
music in AD (Cuddy and Duffin 2005), and the other is the
relatively slower rate of cortical atrophy of the MPFC compared
with other brain areas during the progression of AD (Thomp-
son et al. 2003). Together, these observations suggest that
a neural substrate for associating music, emotions, and at least
certain types of memories is preserved in AD and that this
neural substrate is encompassed by the MPFC.
Taken together, these findings give rise to the as yet
untested hypothesis that the MPFC serves as a hub at which
music, memories, and emotions are associated. Two predic-
tions of this hypothesis are tested in this report. The first is that
the strength of the blood oxygen level--dependent (BOLD)
functional magnetic resonance imaging (fMRI) signal measured
in the MPFC will be positively correlated with the degree of
familiarity, autobiographical salience, and positive affect
evoked by excerpts of music. The second is that portions of
the MPFC that either directly overlap or are in close vicinity to
those that show such positive correlations will also track the
music’s movement through tonal space.
Materials and Methods
SubjectsAll the data collection procedures used in this study were approved by
the University of California at Davis Institutional Review Board.
� 2009 The Authors
This is an Open Access article distributed under the terms of the Creative Commons Attribution Non-Commercial License (http://creativecommons.org/licenses/by-nc/2.0/uk/) which
permits unrestricted non-commercial use, distribution, and reproduction in any medium, provided the original work is properly cited.
Thirteen UC Davis undergraduates (11 females, 18--22 years; mean
age: 20.0 years) participated in the experiment after providing
informed consent. These subjects had been invited to participate in
the fMRI experiment because they experienced at least 30% MEAMs in
an MEAM validation study (Janata et al. 2007).
Stimulus SelectionSelecting the set of stimuli to play to any given subject presented
aconsiderablechallenge.Thedesire tomeasure thephysiological response
to the reliving of remote memories without contamination by any prior
associations of the specificmusical excerptswith theexperiment imposed
the constraint of not prescreening individuals on a fixed library of song
excerpts as hearing a song identified as autobiographically salient a second
time in the experiment could simply evoke amemory of having heard that
song in the prescreening process. I also did not ask subjects to generate
a list of autobiographical memory-evoking music excerpts ahead of time,
both to avoid contaminating the experiencing of those pieces with the
memory of having added them to a list of personally salient pieces and in
recognition of the fact that it is possible to experience strong memories
and emotions in response to songswithout remembering their titles or the
names of the performing artists.
A second constraint, for the purpose of presenting suitable control
stimuli, was that the stimulus selection strategy had to result in a
distribution of excerpts into 3 stimulus categories: 1) those that were
wholly unfamiliar, 2) others that were familiar but not autobiographically
salient, and 3) those that were familiar and autobiographically salient. An
adequate strategy consisted of selecting excerpts at random from the
Billboard Top 100 Pop and R&B charts for the years when the subject was
between 7 and 19 years of age. This strategywas validated in a large sample
of ~300 subjects and is described in detail elsewhere (Janata et al. 2007).
Subjects from the validation study inwhomMEAMswere triggered at least
30% of the time were invited to participate in this fMRI study. Song
excerpts that had been heard by the subject in the prescreening phase
were excluded from the fMRI phase of the experiment. Across the 13
subjects, 341 unique song excerpts were presented.
Stimulus Presentation and Response CollectionThe experiment was controlled by Presentation software (Neuro-
behavioral Systems, Inc., Albany, CA) in conjunction with a Matlab
engine (The Mathworks, Natick, MA) that selected stimuli from
and submitted responses to ‘‘Ensemble,’’ an experiment control and
database system (http://atonal.ucdavis.edu/ensemble/) (Tomic and
Janata 2007). For each subject, all information pertaining to scanner
timing pulses, stimulus event codes and responses to questions were
written to a text file that was used subsequently to construct the design
matrices used in the statistical analyses.
Thirty song excerpts were presented across 2 scanning runs of 15
songs each. Each song excerpt was 30 s in song duration. The excerpts
were the samples available from the Apple iTunes Music Store (Apple,
Cupertino, CA). Thus, the difficult task of demarcating starting and
stopping locations in each song in order to extract a representative and
recognizable excerpt was already accomplished. Prior to a scanning
run, 15 excerpts were selected at random from a period of time that
the subject was between 7 and 19 years of age.
A timing marker from the scanner triggered the Presentation script.
One minute of resting state activity was recorded prior to the onset of
the first stimulus. Thirty stimuli were presented across 2 scanning runs
via electrostatic headphones (MR confon GmbH, Magdeburg, Germany).
Subjects also wore foam earplugs. Prior to the scanning runs, the volume
of the music was adjusted so that is was as loud as the subject could
comfortably stand but without noticeable distortion of the audio quality.
Following each excerpt, subjects provided ratings using 5 buttons on
a keypad (Lumitouch; Photon Control Inc., Burnaby, Canada) underneath
the fingers of their left hand in response to 6 verbal cues for questions
pertaining to: 1) affective valence while listening to the music (5-point
scale; 1 = very displeasing, 5 = very pleasing), 2) arousal while listening to
the music (5-point scale; 1 = not at all aroused, 5 = extremely aroused),
3) familiarity with the song (2-point scale; unfamiliar, familiar), 4)
autobiographical associations with the song (3-point scale; 1 = no
association, 2 = weak association, 3 = strong association), 5) the
orientation of their attention toward the memories (5-point scale;
1 = very unfocused, 5 = very focused), and 6) the orientation of their
attention toward the music (5-point scale; 1 = very unfocused, 5 = very
focused). When subjects entered a response, they heard the word
‘‘Okay,’’ indicating that their response had been recorded. They were
instructed to press the button again in the event that they had made
a response but had not heard the confirmation. The next song was
loaded and presented 1 s after the confirmation of the response. No time
limits were imposed on response latency, so the overall duration of each
trial varied somewhat, usually lasting slightly less than 1 min.
Given that subjects had to answer a large number of questions with
different response mappings following each stimulus, I provided them
with response training during the 10 min in which a high-resolution
anatomical MRI scan was obtained. Training trials consisted of hearing 1
of the 6 question cues—pleasantness, aroused, familiarity, autobiograph-
ical, memory focus, music focus—followed by a response category cue.
Subjects had to press the corresponding category button. If they made an
error, they heard 2 warning tones followed by the name of the finger
they should have used for their response. Question/category pairs were
selected at random until subjects had made 2 correct responses for every
pair. Unless subjects responded with minimal errors, the procedure was
iterated until they were committing none or extremely few errors and
felt comfortable with the response protocol.
Postscan Memory Test and Assay of Memory ContentImmediately following the scanning session, 11 of the 13 subjects were
seated at a computer in a quiet room and asked to complete a detailed
survey about their episodic memories for the songs that they had
flagged as autobiographically salient while in the scanner. This
procedure took the form of a recognition memory test in which
subjects heard a series of 20 s song fragments that included songs that
had been heard and labeled as autobiographical in the scanner as well
as 33% foils that had been heard neither in the scanner nor in the
prescreening session. For each song, a subject made a yes/no judgment
of whether he or she had heard it in the scanner, along with
a confidence rating on a 5-point scale (not at all, very little, somewhat,
fairly strongly, and very strongly). For songs that were flagged as
autobiographically salient and identified correctly as having been heard
in the scanner, subjects indicated whether they could recall the
content of the memories they experienced in the scanner. If they
could, they completed a larger set of questions about the content of the
memories, including ratings of image vividness; the degree to which the
song and memory evoke and emotion; and memories for lifetime
periods, places, people, and events (Janata et al. 2007). Although these
postscan memory assays were probably more susceptible to false
memories and distortions than if they had been presented immediately
following each song in the scanner, I felt they were a reasonable
compromise given the technical constraints of the experiment.
fMRI Acquisition ParametersMRI data were collected on a 3T Siemens Trio (Siemens Medical
Solutions, Erlangen, Germany) at the Imaging Research Center on the
UC Davis Medical Center campus. Three sets of MR images were
acquired for each subject. The first was a high-resolution 3D MPRAGE
structural image (field of view = 256 3 256 mm, 192 slices, resolution =1 3 1 3 1 mm, time repetition [TR] = 2.5 s, time echo [TE] = 4.82 ms,
flip angle = 7�). The second was a volume of T1-weighted axial images
using the same 34 slice positions and orientations as the subsequently
collected echoplanar images (EPI, TR = 600 ms, TE = 8.6 ms, flip
angle = 70�, in-plane resolution: 0.86 3 0.86 mm). Slices were
positioned obliquely with a superior to inferior tilt along the
anterior--posterior direction. Prior to acquisition of the EPI, a point-
spread function was obtained to estimate image distortion and was
applied to the EPI using the native Siemens distortion correction
algorithms. The native motion correction algorithm was also applied
during image acquisition. In 2 subjects, EPI volumes consisted of 30
slices (3.5 mm thick; in-plane resolution: 1.54 3 1.54 mm; TR = 2.5). In
the remaining subjects, EPI volumes consisted of 34 slices (4 mm thick,
no skip; in-plane resolution: 3.4 3 3.4 mm; TR = 2.0 s; TE = 25 ms; flip
angle = 90�).
2580 Music-Evoked Autobiographical Memories d Janata
Preprocessing of the MRI DataThe fMRI data were analyzed using SPM5 software (http://www.fil.
ion.ucl.ac.uk/spm/software/spm5/). I applied the following sequence of
preprocessing steps to the series of BOLD image volumes: realignment
of the first volume of the second run to the first volume of the first run
(the reference volume), realignment of the EPIs to the first volume of
each run, coregistration of the reference EPI volume to the ‘‘coplanar’’
T1-weighted axial images, coregistration of the coplanar volume to the
subject’s high-resolution (hires) structural volume, and spatial normal-
ization of the hires volume to the MNI251 T1 template with
propagation of the normalization parameters to the coplanar and EPI
volumes. The normalized images were resliced to consist of 2 mm
isotropic voxels (the default). Normalized images were smoothed with
a 5-mm isotropic kernel. A model was fit for each subject that included
the motion parameter estimates from the image realignment stage,
linear trends across each run, and the mean offset of each run. The
residuals from this model were used as input to the models of interest
described below.
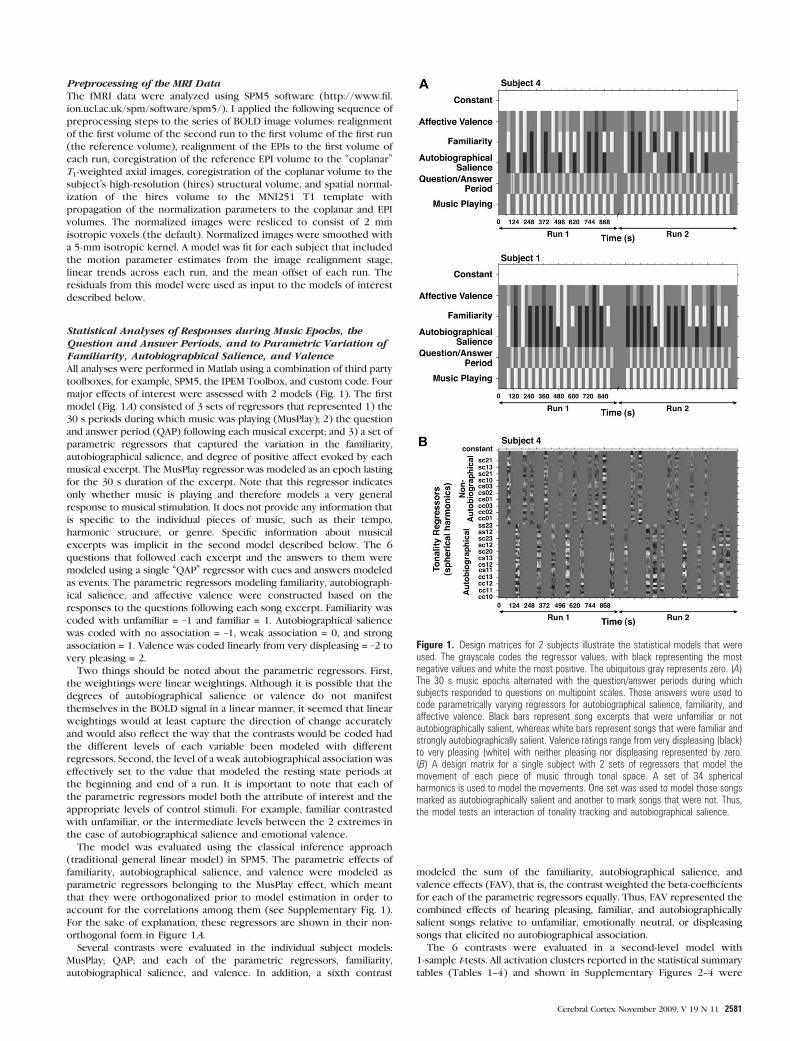
Statistical Analyses of Responses during Music Epochs, theQuestion and Answer Periods, and to Parametric Variation ofFamiliarity, Autobiographical Salience, and ValenceAll analyses were performed in Matlab using a combination of third party
toolboxes, for example, SPM5, the IPEM Toolbox, and custom code. Four
major effects of interest were assessed with 2 models (Fig. 1). The first
model (Fig. 1A) consisted of 3 sets of regressors that represented 1) the
30 s periods during which music was playing (MusPlay); 2) the question
and answer period (QAP) following each musical excerpt; and 3) a set of
parametric regressors that captured the variation in the familiarity,
autobiographical salience, and degree of positive affect evoked by each
musical excerpt. The MusPlay regressor was modeled as an epoch lasting
for the 30 s duration of the excerpt. Note that this regressor indicates
only whether music is playing and therefore models a very general
response to musical stimulation. It does not provide any information that
is specific to the individual pieces of music, such as their tempo,
harmonic structure, or genre. Specific information about musical
excerpts was implicit in the second model described below. The 6
questions that followed each excerpt and the answers to them were
modeled using a single ‘‘QAP’’ regressor with cues and answers modeled
as events. The parametric regressors modeling familiarity, autobiograph-
ical salience, and affective valence were constructed based on the
responses to the questions following each song excerpt. Familiarity was
coded with unfamiliar = –1 and familiar = 1. Autobiographical salience
was coded with no association = –1, weak association = 0, and strong
association = 1. Valence was coded linearly from very displeasing = –2 to
very pleasing = 2.
Two things should be noted about the parametric regressors. First,
the weightings were linear weightings. Although it is possible that the
degrees of autobiographical salience or valence do not manifest
themselves in the BOLD signal in a linear manner, it seemed that linear
weightings would at least capture the direction of change accurately
and would also reflect the way that the contrasts would be coded had
the different levels of each variable been modeled with different
regressors. Second, the level of a weak autobiographical association was
effectively set to the value that modeled the resting state periods at
the beginning and end of a run. It is important to note that each of
the parametric regressors model both the attribute of interest and the
appropriate levels of control stimuli. For example, familiar contrasted
with unfamiliar, or the intermediate levels between the 2 extremes in
the case of autobiographical salience and emotional valence.
The model was evaluated using the classical inference approach
(traditional general linear model) in SPM5. The parametric effects of
familiarity, autobiographical salience, and valence were modeled as
parametric regressors belonging to the MusPlay effect, which meant
that they were orthogonalized prior to model estimation in order to
account for the correlations among them (see Supplementary Fig. 1).
For the sake of explanation, these regressors are shown in their non-
orthogonal form in Figure 1A.
Several contrasts were evaluated in the individual subject models:
MusPlay; QAP; and each of the parametric regressors, familiarity,
autobiographical salience, and valence. In addition, a sixth contrast
modeled the sum of the familiarity, autobiographical salience, and
valence effects (FAV), that is, the contrast weighted the beta-coefficients
for each of the parametric regressors equally. Thus, FAV represented the
combined effects of hearing pleasing, familiar, and autobiographically
salient songs relative to unfamiliar, emotionally neutral, or displeasing
songs that elicited no autobiographical association.
The 6 contrasts were evaluated in a second-level model with
1-sample t-tests. All activation clusters reported in the statistical summary
tables (Tables 1--4) and shown in Supplementary Figures 2--4 were
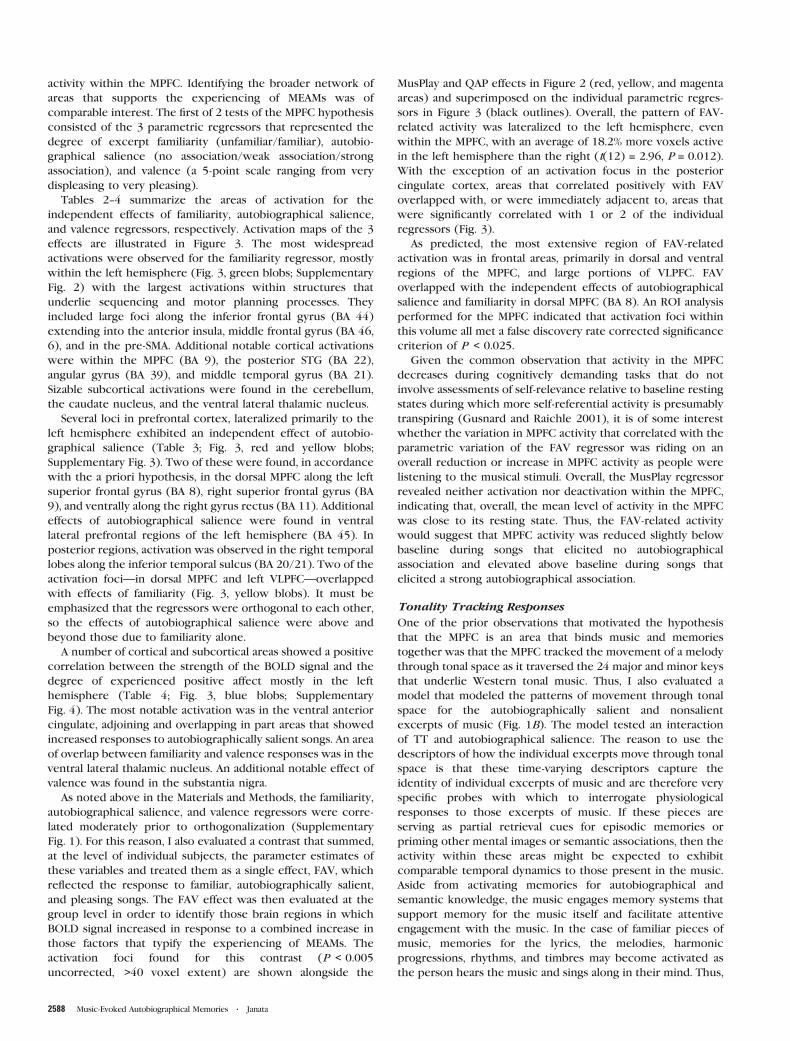
Figure 1. Design matrices for 2 subjects illustrate the statistical models that wereused. The grayscale codes the regressor values, with black representing the mostnegative values and white the most positive. The ubiquitous gray represents zero. (A)The 30 s music epochs alternated with the question/answer periods during whichsubjects responded to questions on multipoint scales. Those answers were used tocode parametrically varying regressors for autobiographical salience, familiarity, andaffective valence. Black bars represent song excerpts that were unfamiliar or notautobiographically salient, whereas white bars represent songs that were familiar andstrongly autobiographically salient. Valence ratings range from very displeasing (black)to very pleasing (white) with neither pleasing nor displeasing represented by zero.(B) A design matrix for a single subject with 2 sets of regressors that model themovement of each piece of music through tonal space. A set of 34 sphericalharmonics is used to model the movements. One set was used to model those songsmarked as autobiographically salient and another to mark songs that were not. Thus,the model tests an interaction of tonality tracking and autobiographical salience.
Cerebral Cortex November 2009, V 19 N 11 2581
identified by thresholding the statistical parametric maps with
a criterion of P < 0.001 (uncorrected) and a voxel extent threshold
of 10 contiguous voxels. Statistical maps shown in Figures 2 and 3 were
thresholded with a criterion of P < 0.005 and a cluster size threshold of
40 contiguous voxels. Note that for the figures, the height threshold
was not relaxed in order to find activations about which inferences
could be made but rather to provide a clearer impression of the spatial
extent in which the peak activation clusters identified with the more
stringent threshold were embedded.
A region-of-interest (ROI) analysis was performed for the MPFC for
the FAV contrast. The a priori ROI was defined as a region extending
14 mm laterally from the midline in both directions, extending from the
ventral to dorsal surfaces of the brain and bounded caudally by a plane
tangent to the genu of the corpus callosum at y = +29 mm. Activation
foci within this volume all met a false discovery rate corrected
significance criterion of P < 0.025.
Statistical Analyses of Tonality TrackingIn order to probe more sensitively how structural aspects of the music
interact with the memories and mental images that were called to mind
by the music, I performed an analysis based on earlier work that
identified brain areas that follow the movements of music through tonal
space (Janata, Birk, et al. 2002). The reason for performing this analysis
is the assumption that precise descriptors of individual excerpts of
music will be more sensitive probes for identifying brain activations
associated with those pieces of music than will less specific descriptors.
In other words, a model that explicitly captures the temporal dynamics
of the melodies and harmonic progressions that define each excerpt is
a much better model than one that indicates only generically that some
music is playing without regard for the structural properties of the
stimulus (as in the case of the MusPlay regressor described above). The
objective of this analysis was to identify, primarily within individual
subjects, the network of brain areas that was engaged as a person
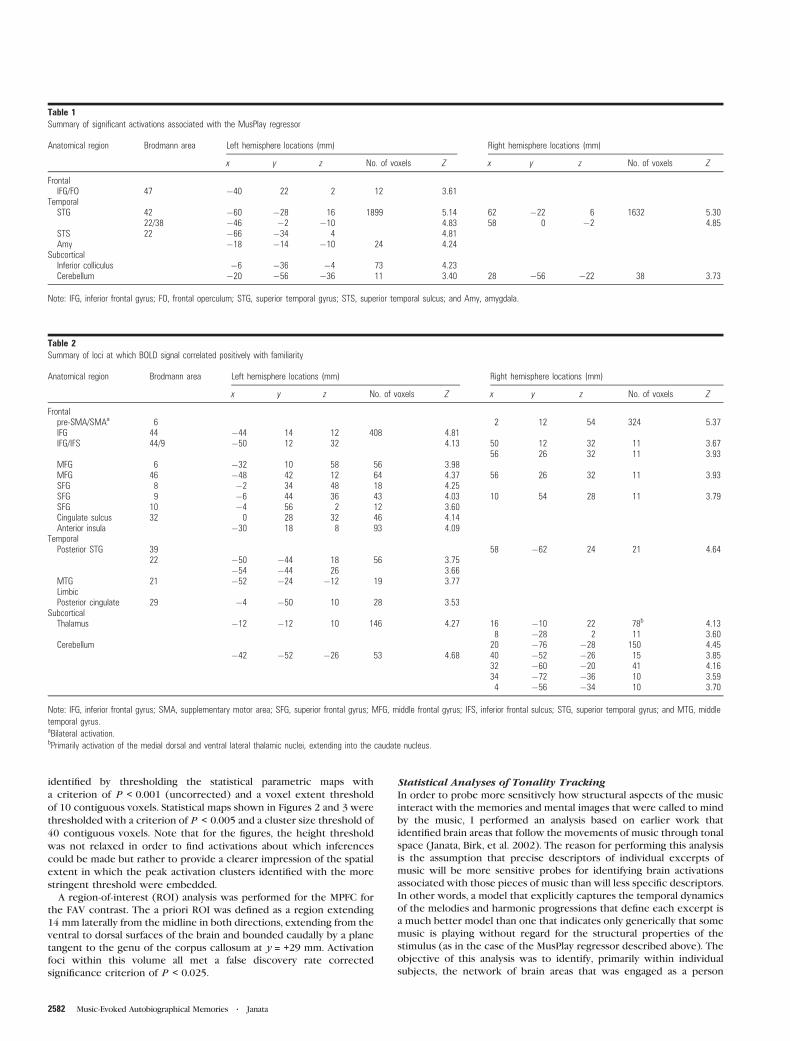
Table 1Summary of significant activations associated with the MusPlay regressor
Anatomical region Brodmann area Left hemisphere locations (mm) Right hemisphere locations (mm)
x y z No. of voxels Z x y z No. of voxels Z
FrontalIFG/FO 47 �40 22 2 12 3.61
TemporalSTG 42 �60 �28 16 1899 5.14 62 �22 6 1632 5.30
22/38 �46 �2 �10 4.83 58 0 �2 4.85STS 22 �66 �34 4 4.81Amy �18 �14 �10 24 4.24
SubcorticalInferior colliculus �6 �36 �4 73 4.23Cerebellum �20 �56 �36 11 3.40 28 �56 �22 38 3.73
Note: IFG, inferior frontal gyrus; FO, frontal operculum; STG, superior temporal gyrus; STS, superior temporal sulcus; and Amy, amygdala.
Table 2Summary of loci at which BOLD signal correlated positively with familiarity
Anatomical region Brodmann area Left hemisphere locations (mm) Right hemisphere locations (mm)
x y z No. of voxels Z x y z No. of voxels Z
Frontalpre-SMA/SMAa 6 2 12 54 324 5.37IFG 44 �44 14 12 408 4.81IFG/IFS 44/9 �50 12 32 4.13 50 12 32 11 3.67
56 26 32 11 3.93MFG 6 �32 10 58 56 3.98MFG 46 �48 42 12 64 4.37 56 26 32 11 3.93SFG 8 �2 34 48 18 4.25SFG 9 �6 44 36 43 4.03 10 54 28 11 3.79SFG 10 �4 56 2 12 3.60Cingulate sulcus 32 0 28 32 46 4.14Anterior insula �30 18 8 93 4.09
TemporalPosterior STG 39 58 �62 24 21 4.64
22 �50 �44 18 56 3.75�54 �44 26 3.66
MTG 21 �52 �24 �12 19 3.77LimbicPosterior cingulate 29 �4 �50 10 28 3.53
SubcorticalThalamus �12 �12 10 146 4.27 16 �10 22 78b 4.13
8 �28 2 11 3.60Cerebellum 20 �76 �28 150 4.45
�42 �52 �26 53 4.68 40 �52 �26 15 3.8532 �60 �20 41 4.1634 �72 �36 10 3.594 �56 �34 10 3.70
Note: IFG, inferior frontal gyrus; SMA, supplementary motor area; SFG, superior frontal gyrus; MFG, middle frontal gyrus; IFS, inferior frontal sulcus; STG, superior temporal gyrus; and MTG, middle
temporal gyrus.aBilateral activation.bPrimarily activation of the medial dorsal and ventral lateral thalamic nuclei, extending into the caudate nucleus.
2582 Music-Evoked Autobiographical Memories d Janata
listened attentively to the pieces of music and experienced memories,
mental images, and emotions in response to those pieces of music.
It is important to note that a tonality tracking (TT) analysis does not
assume that specific parts of a piece of music will always elicit the same
memory or emotion. However, it does assume the presence of a broad
associative memory network that encompasses implicit memory for
structure in Western tonal music, memories of varying strength for
specific pieces of music, and episodic memories for events or periods in
one’s life with which memories of certain musical genres or specific
pieces of music became bound. It is therefore expected that as a piece
of music unfolds in time, it is providing cues in the form of instrument
sounds (timbre), melodies, chord progressions, and lyrics that can
trigger a variety of associations. In this way, a model of the piece of
music may become a proxy for, or a pointer to, those thoughts,
memories, and emotions that are evoked as one follows along with the
music in one’s mind.
The Structure and Modeling of Tonal SpaceTonal space in Western tonal music comprises the 24 major and minor
keys. The shape of tonal space is that of a torus, with different keys
dwelling in different regions of the toroidal surface. Their relative
locations to each other on the surface are based on their theoretical,
psychological, and statistical distances from one another (Krumhansl
1990; Toiviainen and Krumhansl 2003; Janata 2007--2008). Keys are
characterized by sets of pitch classes, for example, the notes C, D, E,
A-flat, etc. The pitch class sets of adjacent keys have all but one of their
members in common, whereas increasingly distant keys share fewer
and fewer pitches. Moreover, not all the pitches in a key occur equally
often. Thus, any given location on the torus effectively represents
a probability distribution across the 12 pitch classes. Similar probability
distributions reside next to each other on the surface. Thus, as a piece
of music unfolds, the moment-to-moment distributions of pitch classes
change as the notes of the melodies and harmonic (chord) progressions
change. Consequently, the pattern of activation on the surface of the
torus changes in time as a piece of music progresses (for an example,
see Supplementary Movies).
In order to correlate the pattern of music’s movement through tonal
space with the BOLD data, a method is needed for describing the
temporal evolution of the changing intensity pattern on the surface of
the torus using a reasonable number of degrees of freedom. One set of
basis functions that can be used to describe the activation pattern on
the surface of a torus consists of spherical harmonics (spatial
frequencies on the toroidal surface). The activation pattern on the
toroidal surface at each moment in time is described as a weighted sum
of spherical harmonics. The time-varying weights of the spherical
harmonic components are used as regressors in the models of the
BOLD data (Fig. 1B).
The procedure for transforming an audio file of the music into the
spherical harmonic regressors is described and illustrated elsewhere
(Janata, Birk, et al. 2002; Janata 2005). Briefly, the IPEM Toolbox
(http://www.ipem.ugent.be/Toolbox/) was used to process the audio
signal. The toolbox models cochlear transduction and auditory nerve
firing patterns, which are then used to estimate the pitch distributions
in the signal using an autocorrelation method. The time-varying
periodicity pitch images are smoothed using leaky integration with
a time constant of 2 s in order to capture the pitch distribution
information within a sliding window. The pitch distribution at each
time frame is then projected to the toroidal surface via a weight matrix
that maps a distribution of pitches to a region of the torus. The weight
matrix was trained with a self-organizing map algorithm in the Finnish
SOM Toolbox (http://www.cis.hut.fi/projects/somtoolbox/) using
a melody that systematically moved through all the major and minor
keys in Western tonal music (Janata, Birk, et al. 2002; Janata et al. 2003).
The activation pattern at each moment in time was decomposed into
a set of spherical harmonics, and the time courses of the spherical
harmonic coefficients then served as sets of regressors in the analysis of
the BOLD data (Janata, Birk, et al. 2002; Janata 2005). Note that because
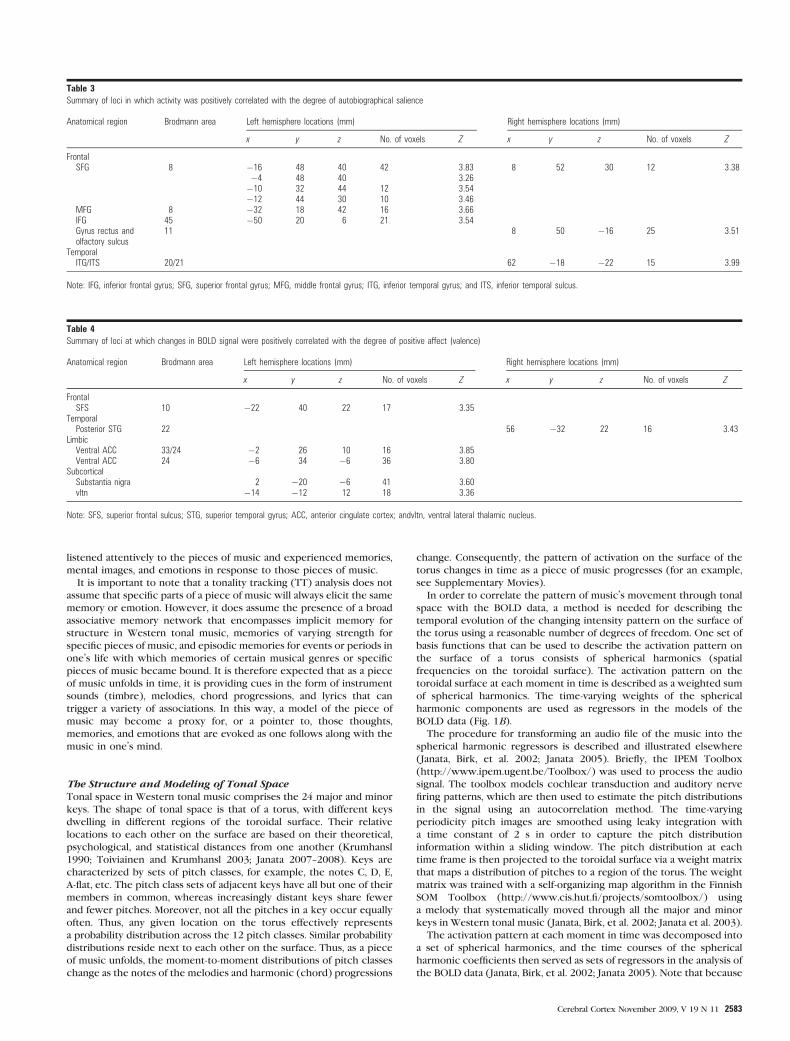
Table 4Summary of loci at which changes in BOLD signal were positively correlated with the degree of positive affect (valence)
Anatomical region Brodmann area Left hemisphere locations (mm) Right hemisphere locations (mm)
x y z No. of voxels Z x y z No. of voxels Z
FrontalSFS 10 �22 40 22 17 3.35
TemporalPosterior STG 22 56 �32 22 16 3.43
LimbicVentral ACC 33/24 �2 26 10 16 3.85Ventral ACC 24 �6 34 �6 36 3.80
SubcorticalSubstantia nigra 2 �20 �6 41 3.60vltn �14 �12 12 18 3.36
Note: SFS, superior frontal sulcus; STG, superior temporal gyrus; ACC, anterior cingulate cortex; andvltn, ventral lateral thalamic nucleus.
Table 3Summary of loci in which activity was positively correlated with the degree of autobiographical salience
Anatomical region Brodmann area Left hemisphere locations (mm) Right hemisphere locations (mm)
x y z No. of voxels Z x y z No. of voxels Z
FrontalSFG 8 �16 48 40 42 3.83 8 52 30 12 3.38
�4 48 40 3.26�10 32 44 12 3.54�12 44 30 10 3.46
MFG 8 �32 18 42 16 3.66IFG 45 �50 20 6 21 3.54Gyrus rectus andolfactory sulcus
11 8 50 �16 25 3.51
TemporalITG/ITS 20/21 62 �18 �22 15 3.99
Note: IFG, inferior frontal gyrus; SFG, superior frontal gyrus; MFG, middle frontal gyrus; ITG, inferior temporal gyrus; and ITS, inferior temporal sulcus.
Cerebral Cortex November 2009, V 19 N 11 2583
of the low-pass spatial frequency characteristics of the toroidal
activations, it was possible to accurately represent the toroidal
activation patterns using fewer degrees of freedom than if one used
every spot on the torus as its own regressor.
The TT RegressorsTwo groups of 34 spherical harmonic regressors were used to identify
TT voxels in each subject. One group modeled those songs that were
identified as weakly or strong autobiographically salient and the other
group modeled those songs for which the subject had no autobio-
graphical association. Both groups were entered into a single model
(Fig. 1B). This model tests an interaction between TT and autobio-
graphical salience. As described below, it allows one to compare the
relative amounts of variance explained by autobiographically salient
and nonautobiographical songs. This provides the strongest means,
given the present data and experimental design, of identifying brain
areas that associate music with memories.
Because the spherical harmonic regressors as a group describe the
time-varying pattern of activation, assessment of the amount of variance
they explain in the BOLD data must be done with an F-test across the
group of regressors. Not surprisingly, the F-tests for such large groups
of regressors with a multitude of time courses explained considerable
amounts of variance in the BOLD data. In order to guard against false
positives, it was therefore necessary to determine whether the variance
explained for any given voxel was due to the veridical model or
whether any model that retained critical time-varying properties of the
veridical set of regressors would have explained the data equally well.
I used a permutation test for this purpose.
The permutation test was applied to all voxels for which the omnibus
F-test of the veridical TT model was significant at P < 0.05 with the
SPM5 family-wise error correction. For each subject, 100 models were
evaluated in which the order of the songs in the model was shuffled at
random. The chosen permutation strategy was a conservative one
because it preserved both the correlation structure among the TT
regressors and the temporal properties of the music. If all the pieces of
music had similar patterns of movement across the tonal surface, the
permuted models would tend to be as probable as the original model,
rendering the original model nonsignificant. An alternative permutation
strategy would have been to randomly shuffle time points. While
preserving the correlation structure among the regressors, such
permutations would have disrupted smoothly varying trajectories
through tonal space, thus presenting a less difficult challenge to the
original model.
Statistical significance of the veridical model was tested by
comparing the residual mean square error of the veridical model
against the distribution of residual mean square errors from the
alternative models. The residual errors from the 100 models were
always normally distributed, so the mean and standard deviation (SD) of
the observed distribution were used to fit a Gaussian function. The
observed value for the veridical model was evaluated against the
estimated Gaussian function, rather than calculating the exact
probability using the number of permutations. Any voxel for which
the likelihood of observing the veridical model’s residual error given
the distribution of permutation model errors was P < 0.05 was
considered to be a TT voxel. Clusters of TT voxels were identified
using an extent threshold of 40 contiguous voxels.
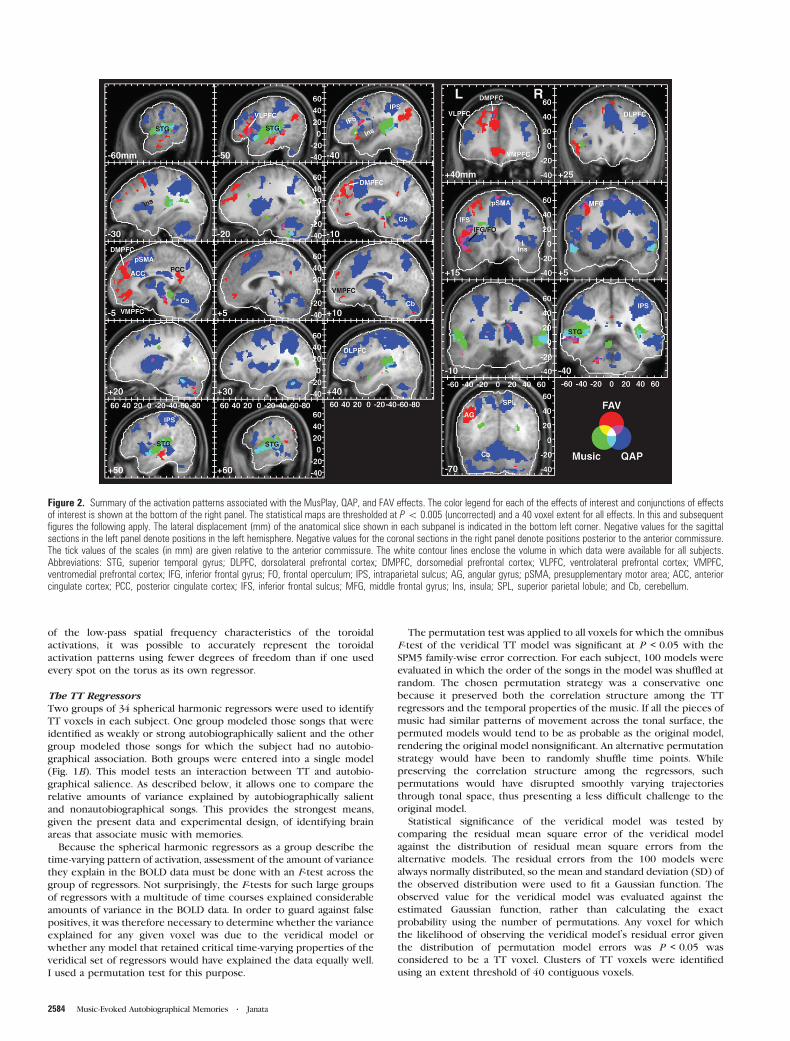
Figure 2. Summary of the activation patterns associated with the MusPlay, QAP, and FAV effects. The color legend for each of the effects of interest and conjunctions of effectsof interest is shown at the bottom of the right panel. The statistical maps are thresholded at P\ 0.005 (uncorrected) and a 40 voxel extent for all effects. In this and subsequentfigures the following apply. The lateral displacement (mm) of the anatomical slice shown in each subpanel is indicated in the bottom left corner. Negative values for the sagittalsections in the left panel denote positions in the left hemisphere. Negative values for the coronal sections in the right panel denote positions posterior to the anterior commissure.The tick values of the scales (in mm) are given relative to the anterior commissure. The white contour lines enclose the volume in which data were available for all subjects.Abbreviations: STG, superior temporal gyrus; DLPFC, dorsolateral prefrontal cortex; DMPFC, dorsomedial prefrontal cortex; VLPFC, ventrolateral prefrontal cortex; VMPFC,ventromedial prefrontal cortex; IFG, inferior frontal gyrus; FO, frontal operculum; IPS, intraparietal sulcus; AG, angular gyrus; pSMA, presupplementary motor area; ACC, anteriorcingulate cortex; PCC, posterior cingulate cortex; IFS, inferior frontal sulcus; MFG, middle frontal gyrus; Ins, insula; SPL, superior parietal lobule; and Cb, cerebellum.
2584 Music-Evoked Autobiographical Memories d Janata
Identification of Autobiographically Salient TTThe objective of having 2 sets of tonality regressors was to see whether
any given TT voxel showed a preference for autobiographically salient
songs. This preference was assessed by calculating the ratio of the
F-statistics of the autobiographically salient and autobiographically
nonsalient sets of tonality regressors:
bias =Fauto=nauto
Fnonauto=nnonauto
;
where n is the number of songs falling into each category. The
colormap for the images of individual subject’s TT voxels (Fig. 4)
reflects this measure.
Brain areas that showed TT at the group level (across subjects) were
identified as follows. For each subject, a binary mask was created from
the volume of TT voxels such that any voxel that met the significance
criterion from the permutation test and belonged to a cluster of 40 or
more voxels in size was assigned a value of 1. These masks were then
summed across subjects, resulting in a map showing the count of the
number of subjects showing TT activations at each voxel. The statistical
significance of voxels in this map was assessed with a Monte Carlo
simulation that estimated the likelihood that a voxel would exhibit TT
activity in N subjects. For each subject, the number of TT voxels was
first counted up and then distributed at random within a brain volume
that was defined as the intersection of all brain volume masks from
individual subjects. These random TT voxel distributions were then
summed across subjects to obtain the number of subjects hypothet-
ically activating each voxel by chance alone. A histogram was
constructed from all these voxel values to indicate how many voxels
were expected to be activated by N subjects, where N ranges from 0 to
13. The procedure of randomly distributing TT voxels was repeated
500 times, resulting in 500 histograms. These histograms were averaged
and normalized to obtain a final histogram showing the expected
distribution of numbers of voxels showing TT for N subjects. From this
distribution, it was possible to calculate the probability of observing N
subjects in any voxel by chance alone. The probabilities were P < 0.088
(N = 3), P < 0.014 (N = 4), P < 0.0015 (N = 5), and P < 0.0001 (N = 6).
Thus, the summed TT image was thresholded to retain only those
voxels that showed TT for 4 or more subjects and which belonged to
clusters of at least 40 contiguous voxels. Each cluster was then
examined in more detail to determine the number of unique subjects
who showed TT within that cluster and to determine the distribution of
TT biases across voxels within that cluster.
Conjunction AnalysesThe activation patterns for the different contrasts of interest were
compared with a conjunction analysis in order to identify brain areas
that responded to multiple effects of interest. The conjunction analysis
consists of calculating the intersection of the significance masks
created for each contrast (Nichols et al. 2005). The outcomes of these
analyses are shown in Figures 2, 3, and 5 through color-coded contrast
combinations (Fig. 2) or by showing the contours of one analysis
overlaid on the outcomes of other analyses (Figs 3 and 5). The results of
the conjunction analyses are not provided in separate tables, but the
figures are of sufficient resolution and labeled such that the coordinates
of conjunctions can be determined readily. Locations of conjunctions
of particular interest are noted in the text.
Anatomical Localization of Statistical EffectsAnatomical locations and Brodmann areas (BAs) were assigned through
a combination of comparing the locations of activation foci on the
average normalized high-resolution T1-weighted image of the group of
subjects with images in the Duvernoy atlas (Duvernoy 1999) and
finding the activation foci using the SPM5 plugin WFU_PickAtlas
(http://www.fmri.wfubmc.edu/cms/software) (Maldjian et al. 2003)
which contains masks corresponding to the different BAs.
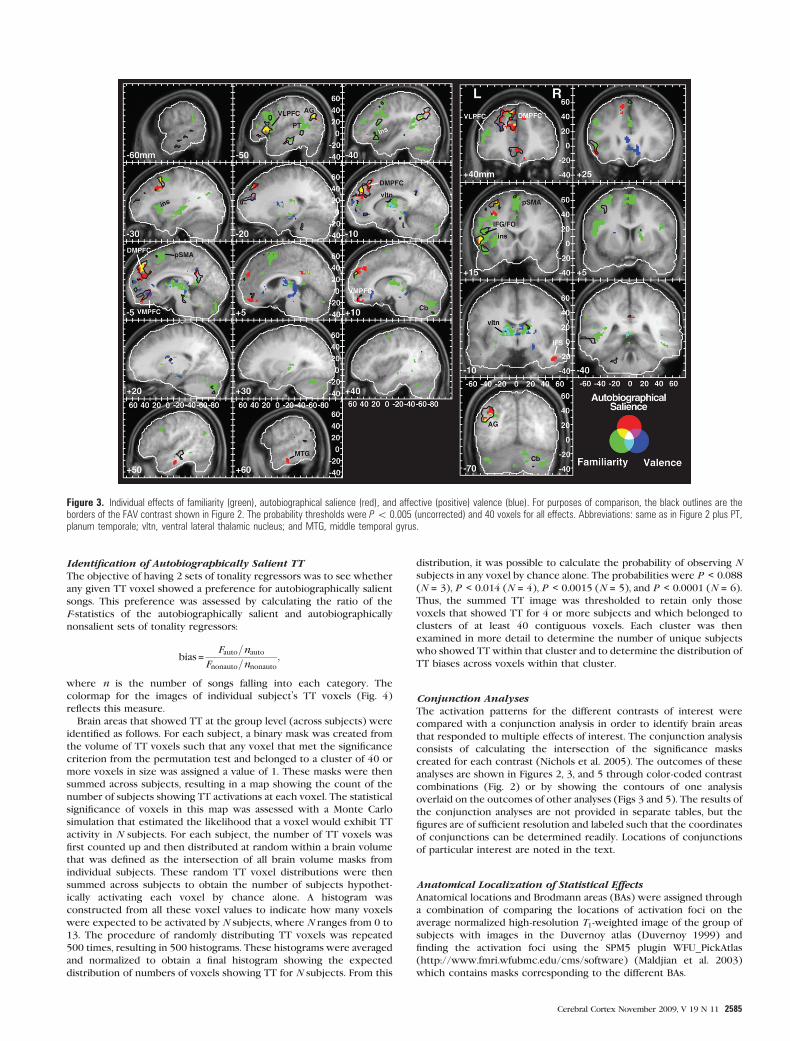
Figure 3. Individual effects of familiarity (green), autobiographical salience (red), and affective (positive) valence (blue). For purposes of comparison, the black outlines are theborders of the FAV contrast shown in Figure 2. The probability thresholds were P\ 0.005 (uncorrected) and 40 voxels for all effects. Abbreviations: same as in Figure 2 plus PT,planum temporale; vltn, ventral lateral thalamic nucleus; and MTG, middle temporal gyrus.
Cerebral Cortex November 2009, V 19 N 11 2585
Results
Triggering MEAMs
For each of 13 subjects, 30 stimuli were selected at random
from the Billboard Top 100 Pop and R&B charts for the years
when the subject was between 7 and 19 years of age. On
average, 56.2% (±18.0% SD) of the stimuli presented to a subject
were judged to be familiar (range: 20--80%) and 42.3% (±18.1%SD) were rated as ‘‘somewhat’’ or ‘‘strongly’’ autobiographical
(range: 11.1--73.3%). Although the majority (57%) of the
excerpts were experienced as ‘‘somewhat’’ or ‘‘very’’ pleasing
by subjects and 24.9% were experienced as neutral, there were
6 subjects who experienced between 20% and 40% as
somewhat or very displeasing. Overall, the distributions of
familiarity, autobiographical salience, and affective response
were suitable for examining the 2 hypotheses.
The postscan questionnaires provided information regarding
the distinction between weakly and strongly autobiographical
remembering episodes. Overall, subjects were very accurate
and confident in their identification of songs they had marked
as autobiographical while in the scanner (mean correct
identification = 93.5%; mean confidence = 4.8/5) and in their
correct rejection of foils (mean correct rejection = 93.6%;
mean confidence = 4.3/5). Although relatively few correctly
identified autobiographically salient songs were marked as not
having associated memory content, in 5 of 7 subjects who did
have such songs, the majority had been flagged in the scanner
as weakly autobiographical.
Images associated with strongly autobiographically songs
were rated as more vivid (mean = 2.36 on a 3-point scale where
1 = no clear images, 2 = somewhat vivid, and 3 = very vivid) than
for weakly autobiographical songs (mean = 1.79; t(9) = 5.784,
P < 0.0003). (In this analysis and following analyses of postscan
data, one subject who had no memory content for any weakly
salient songs was excluded from the analyses.).
Strongly autobiographical songs elicited stronger agreement
(t(9) = 3.442, P < 0.008) with the statement that, ‘‘Hearing this
song sometimes evokes an emotional reaction that is associated
with an event, period, or person in my life,’’ with a mean rating
of 5.62 falling between ‘‘agree somewhat’’ and ‘‘agree,’’ while
the mean rating of 4.8 for weakly autobiographical songs fell
between ‘‘neither agree nor disagree’’ and ‘‘agree somewhat.’’
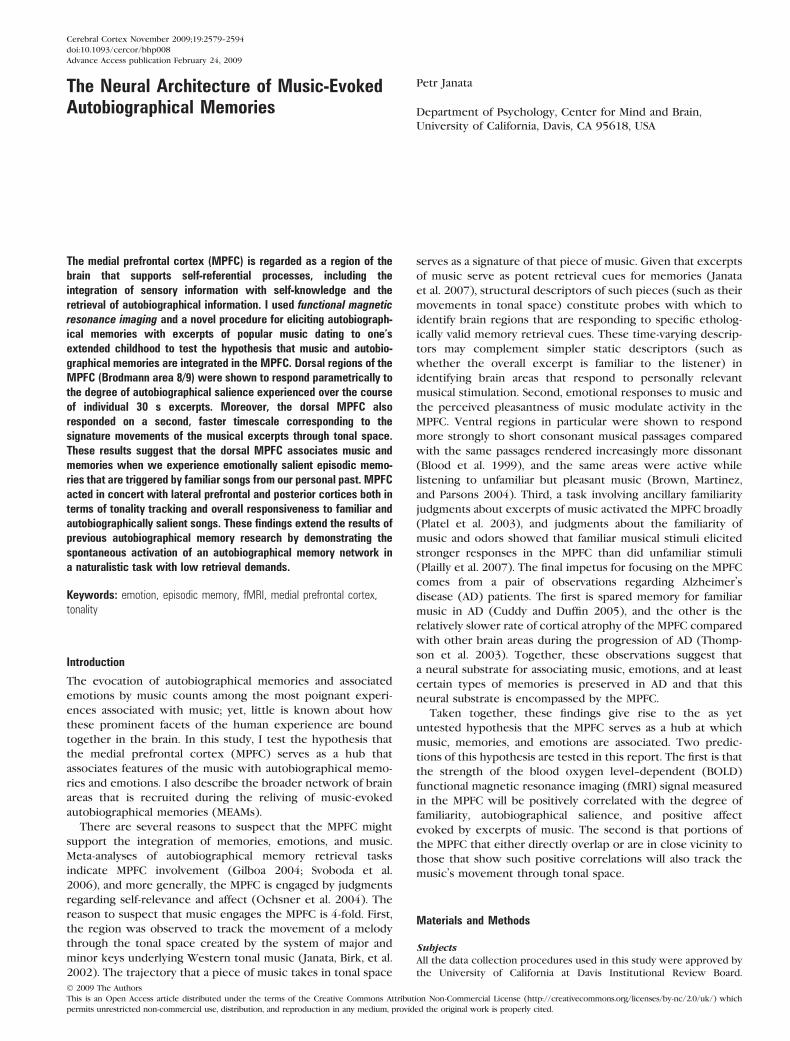
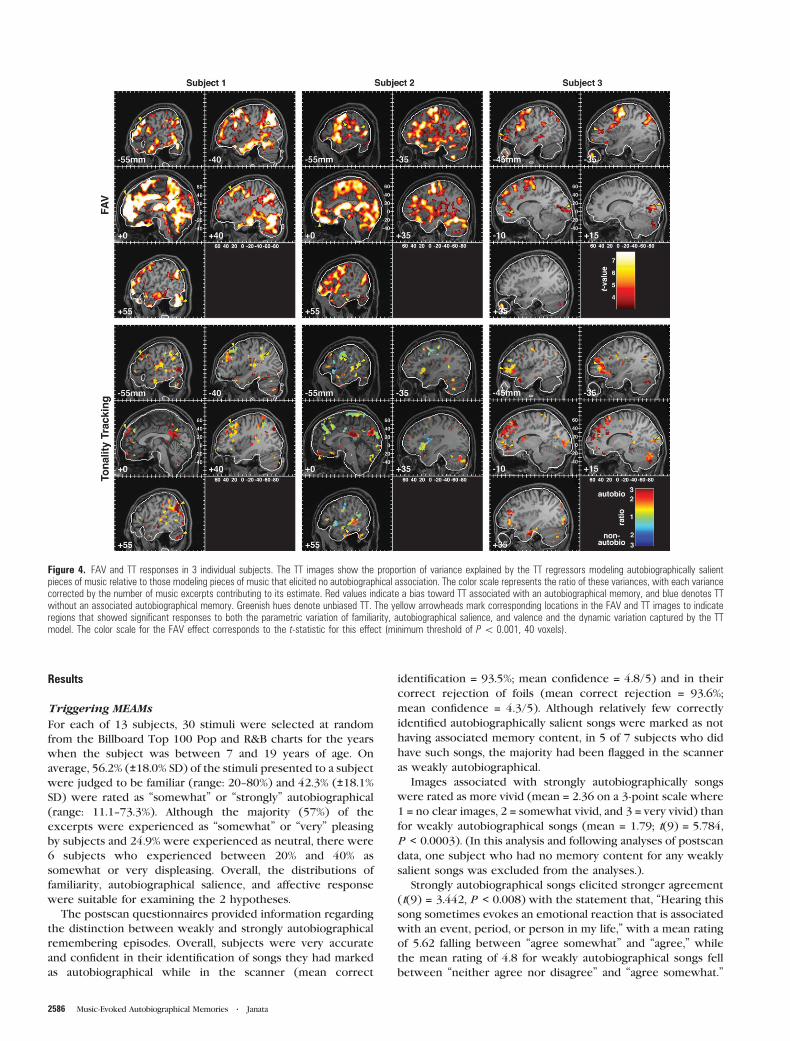
Figure 4. FAV and TT responses in 3 individual subjects. The TT images show the proportion of variance explained by the TT regressors modeling autobiographically salientpieces of music relative to those modeling pieces of music that elicited no autobiographical association. The color scale represents the ratio of these variances, with each variancecorrected by the number of music excerpts contributing to its estimate. Red values indicate a bias toward TT associated with an autobiographical memory, and blue denotes TTwithout an associated autobiographical memory. Greenish hues denote unbiased TT. The yellow arrowheads mark corresponding locations in the FAV and TT images to indicateregions that showed significant responses to both the parametric variation of familiarity, autobiographical salience, and valence and the dynamic variation captured by the TTmodel. The color scale for the FAV effect corresponds to the t-statistic for this effect (minimum threshold of P\ 0.001, 40 voxels).
2586 Music-Evoked Autobiographical Memories d Janata
The average proportion of memories associated with an event
was also significantly higher for strongly autobiographical songs
(mean = 0.44) than weakly autobiographical songs (mean =0.16; t(9) = 3.707, P < 0.005). The average proportion of
memories associated with people did not differ significantly
between weakly (mean = 0.40) and strongly (mean = 0.52)
salient memories (t(9) = 0.906, P < 0.39). The same was true
for memories of lifetime periods (weak mean = 0.4; strong
mean = 0.31; t(9) = –1.122, P < 0.29). Only the average
proportion of memories associated with places was signifi-
cantly higher for weak (mean = 0.42) than strong (mean = 0.22)
memories (t(9) = –3.56, P < 0.006). Overall, greater autobio-
graphical salience was associated with more vivid remembering
of more emotion-laden memories of events.
General Task-Related Activations
The first of 2 models examined general task-related activations
and the parametric variations in familiarity, autobiographical
salience, and valence. Figure 2 illustrates the spatial relation-
ships among the networks identified by the MusPlay, QAP, and
FAV regressors. The simple model of whether or not music was
playing (MusPlay) showed extensive activation bilaterally in the
auditory cortex along the superior temporal gyrus (STG) as
expected (Table 1; Fig. 2, regions shown in green, yellow, and
cyan). The activation extended rostrally along the STG from the
planum temporale to the planum polare. Peak activations were
observed in auditory association areas (BA 22) rostral to
Heschl’s gyrus. One prefrontal activation focus was observed in
the ventrolateral prefrontal cortex (VLPFC) in the vicinity of
the frontal operculum of the left hemisphere.
The second general task-related regressor modeled activity
associated with the QAPs that followed each musical excerpt.
From the perspective of mental computations, QAP represents
the deployment of attention to service a series of interactions
with an external agent. These interactions depend on orienting
to, perceiving, and interpreting the auditory retrieval cues,
retrieving information prompted by the cue, and preparing
and executing a response. The objective of this study was not
to dissociate these various cognitive processes as these have
been examined in great detail in the cognitive neuroscience
literature (Cabeza and Nyberg 2000). Accordingly, I expected
this regressor to identify activations of a network consisting of
frontal and parietal areas typically engaged in attention tasks
and frontal areas involved in decision making, response
planning, and response execution along with attendant sub-
cortical activations of the cerebellum, thalamus, and basal
ganglia. Aside from the activations of the auditory cortex as
modeled by the MusPlay regressor, the QAP activations were
the most highly statistically significant effect at the group level.
Because the exact loci of the peak activations throughout this
network are of secondary importance to this paper, they are
not listed in a table. However, Figure 2 provides the interested
reader with sufficient information for determining the
coordinates of activated nodes in this network.
Parametric Modeling of Familiarity, AutobiographicalSalience, and Affective Response
The motivating interest for this study was a test of the
hypothesis that the experiencing of MEAMs would evoke
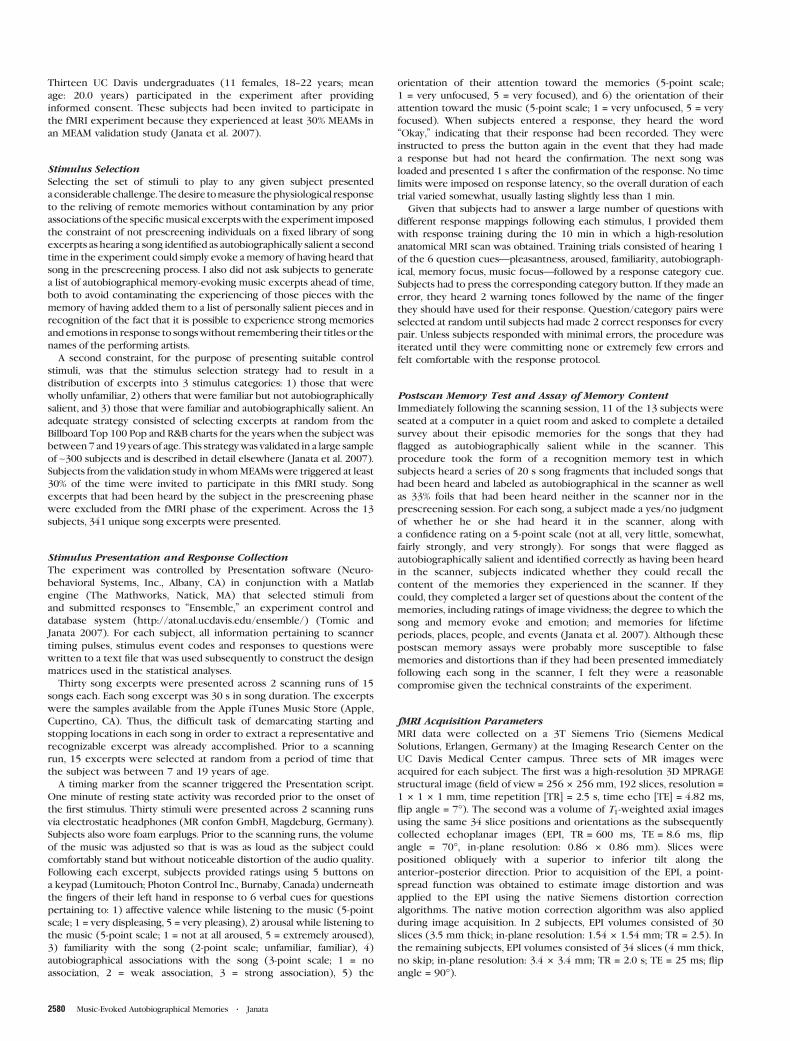
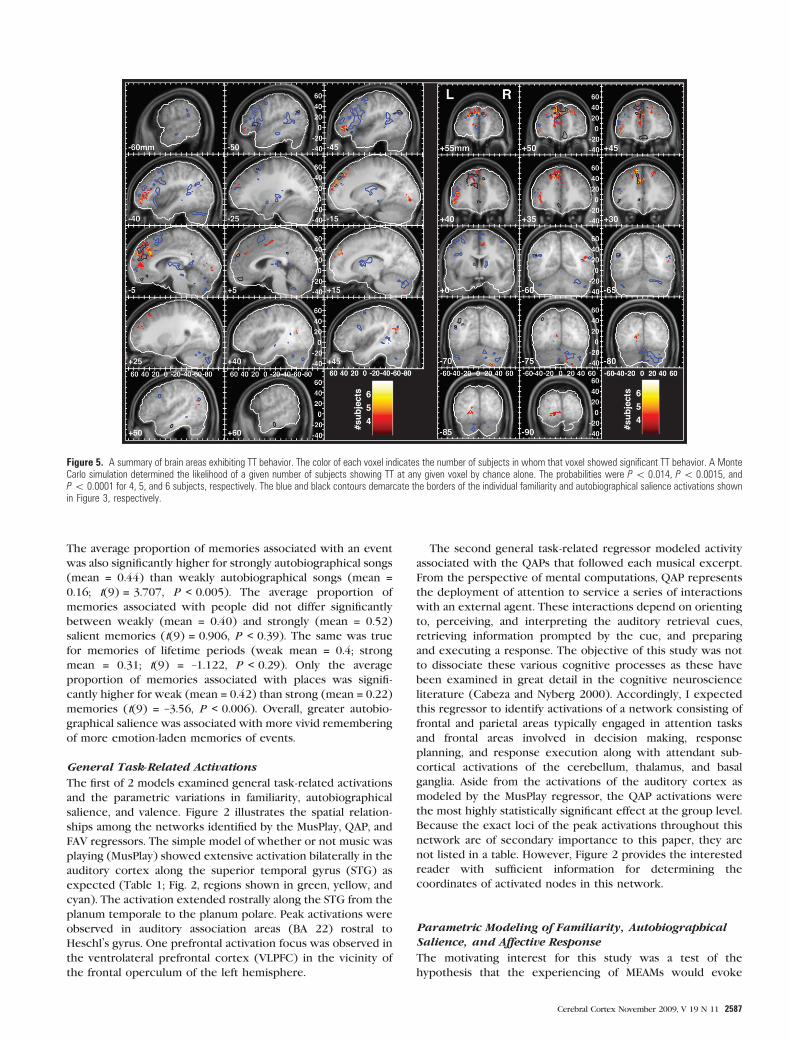
Figure 5. A summary of brain areas exhibiting TT behavior. The color of each voxel indicates the number of subjects in whom that voxel showed significant TT behavior. A MonteCarlo simulation determined the likelihood of a given number of subjects showing TT at any given voxel by chance alone. The probabilities were P\ 0.014, P\ 0.0015, andP\ 0.0001 for 4, 5, and 6 subjects, respectively. The blue and black contours demarcate the borders of the individual familiarity and autobiographical salience activations shownin Figure 3, respectively.
Cerebral Cortex November 2009, V 19 N 11 2587
activity within the MPFC. Identifying the broader network of
areas that supports the experiencing of MEAMs was of
comparable interest. The first of 2 tests of the MPFC hypothesis
consisted of the 3 parametric regressors that represented the
degree of excerpt familiarity (unfamiliar/familiar), autobio-
graphical salience (no association/weak association/strong
association), and valence (a 5-point scale ranging from very
displeasing to very pleasing).
Tables 2--4 summarize the areas of activation for the
independent effects of familiarity, autobiographical salience,
and valence regressors, respectively. Activation maps of the 3
effects are illustrated in Figure 3. The most widespread
activations were observed for the familiarity regressor, mostly
within the left hemisphere (Fig. 3, green blobs; Supplementary
Fig. 2) with the largest activations within structures that
underlie sequencing and motor planning processes. They
included large foci along the inferior frontal gyrus (BA 44)
extending into the anterior insula, middle frontal gyrus (BA 46,
6), and in the pre-SMA. Additional notable cortical activations
were within the MPFC (BA 9), the posterior STG (BA 22),
angular gyrus (BA 39), and middle temporal gyrus (BA 21).
Sizable subcortical activations were found in the cerebellum,
the caudate nucleus, and the ventral lateral thalamic nucleus.
Several loci in prefrontal cortex, lateralized primarily to the
left hemisphere exhibited an independent effect of autobio-
graphical salience (Table 3; Fig. 3, red and yellow blobs;
Supplementary Fig. 3). Two of these were found, in accordance
with the a priori hypothesis, in the dorsal MPFC along the left
superior frontal gyrus (BA 8), right superior frontal gyrus (BA
9), and ventrally along the right gyrus rectus (BA 11). Additional
effects of autobiographical salience were found in ventral
lateral prefrontal regions of the left hemisphere (BA 45). In
posterior regions, activation was observed in the right temporal
lobes along the inferior temporal sulcus (BA 20/21). Two of the
activation foci—in dorsal MPFC and left VLPFC—overlapped
with effects of familiarity (Fig. 3, yellow blobs). It must be
emphasized that the regressors were orthogonal to each other,
so the effects of autobiographical salience were above and
beyond those due to familiarity alone.
A number of cortical and subcortical areas showed a positive
correlation between the strength of the BOLD signal and the
degree of experienced positive affect mostly in the left
hemisphere (Table 4; Fig. 3, blue blobs; Supplementary
Fig. 4). The most notable activation was in the ventral anterior
cingulate, adjoining and overlapping in part areas that showed
increased responses to autobiographically salient songs. An area
of overlap between familiarity and valence responses was in the
ventral lateral thalamic nucleus. An additional notable effect of
valence was found in the substantia nigra.
As noted above in the Materials and Methods, the familiarity,
autobiographical salience, and valence regressors were corre-
lated moderately prior to orthogonalization (Supplementary
Fig. 1). For this reason, I also evaluated a contrast that summed,
at the level of individual subjects, the parameter estimates of
these variables and treated them as a single effect, FAV, which
reflected the response to familiar, autobiographically salient,
and pleasing songs. The FAV effect was then evaluated at the
group level in order to identify those brain regions in which
BOLD signal increased in response to a combined increase in
those factors that typify the experiencing of MEAMs. The
activation foci found for this contrast (P < 0.005
uncorrected, >40 voxel extent) are shown alongside the
MusPlay and QAP effects in Figure 2 (red, yellow, and magenta
areas) and superimposed on the individual parametric regres-
sors in Figure 3 (black outlines). Overall, the pattern of FAV-
related activity was lateralized to the left hemisphere, even
within the MPFC, with an average of 18.2% more voxels active
in the left hemisphere than the right (t(12) = 2.96, P = 0.012).
With the exception of an activation focus in the posterior
cingulate cortex, areas that correlated positively with FAV
overlapped with, or were immediately adjacent to, areas that
were significantly correlated with 1 or 2 of the individual
regressors (Fig. 3).
As predicted, the most extensive region of FAV-related
activation was in frontal areas, primarily in dorsal and ventral
regions of the MPFC, and large portions of VLPFC. FAV
overlapped with the independent effects of autobiographical
salience and familiarity in dorsal MPFC (BA 8). An ROI analysis
performed for the MPFC indicated that activation foci within
this volume all met a false discovery rate corrected significance
criterion of P < 0.025.
Given the common observation that activity in the MPFC
decreases during cognitively demanding tasks that do not
involve assessments of self-relevance relative to baseline resting
states during which more self-referential activity is presumably
transpiring (Gusnard and Raichle 2001), it is of some interest
whether the variation in MPFC activity that correlated with the
parametric variation of the FAV regressor was riding on an
overall reduction or increase in MPFC activity as people were
listening to the musical stimuli. Overall, the MusPlay regressor
revealed neither activation nor deactivation within the MPFC,
indicating that, overall, the mean level of activity in the MPFC
was close to its resting state. Thus, the FAV-related activity
would suggest that MPFC activity was reduced slightly below
baseline during songs that elicited no autobiographical
association and elevated above baseline during songs that
elicited a strong autobiographical association.
Tonality Tracking Responses
One of the prior observations that motivated the hypothesis
that the MPFC is an area that binds music and memories
together was that the MPFC tracked the movement of a melody
through tonal space as it traversed the 24 major and minor keys
that underlie Western tonal music. Thus, I also evaluated a
model that modeled the patterns of movement through tonal
space for the autobiographically salient and nonsalient
excerpts of music (Fig. 1B). The model tested an interaction
of TT and autobiographical salience. The reason to use the
descriptors of how the individual excerpts move through tonal
space is that these time-varying descriptors capture the
identity of individual excerpts of music and are therefore very
specific probes with which to interrogate physiological
responses to those excerpts of music. If these pieces are
serving as partial retrieval cues for episodic memories or
priming other mental images or semantic associations, then the
activity within these areas might be expected to exhibit
comparable temporal dynamics to those present in the music.
Aside from activating memories for autobiographical and
semantic knowledge, the music engages memory systems that
support memory for the music itself and facilitate attentive
engagement with the music. In the case of familiar pieces of
music, memories for the lyrics, the melodies, harmonic
progressions, rhythms, and timbres may become activated as
the person hears the music and sings along in their mind. Thus,
2588 Music-Evoked Autobiographical Memories d Janata
the temporal dynamics of activity in brain regions that support
the retrieval of this information are expected to follow, in large
part, the temporal dynamics of the music.
The bottom panels in Figure 4 illustrate TT responses in 3
representative subjects. The color at each voxel represents the
degree to which that part of the brain exhibited relatively more
TT during excerpts identified as autobiographically salient (red)
than during nonautobiographical excerpts (blue). Green indi-
cates TT without regard for autobiographical salience. The data
for each of these subjects show that TT transpired within
a network of brain areas distributed throughout the brain and
that the details of these networks differed across subjects.
However, careful inspection of the activation patterns reveals
that certain common brain regions showed TT in these subjects.
For example, Ss 1 and 2 showed TT responses along the superior
temporal sulcus (STS) and STG. Each of the subjects showed
some degree of TT in the MPFC and lateral prefrontal areas.
Biases in TT toward autobiographically salient excerpts were
observed in the MPFC, in the posterior cingulate cortex (Ss 1
and 2), and in the lateral prefrontal cortex (Ss 1--3). In S3, most
TT voxels were biased toward autobiographically salient
excerpts, whereas S2 showed a greater mixture of biases.
Figure 4 also illustrates within individual subjects the
relationship between the TT and FAV models. Of interest here
is the fact that these models reflect different timescales. The
FAV model represents sustained responses throughout a 30-s
epoch, whereas the TT model reflects the tonal/harmonic
dynamics of the pieces that vary on a faster timescale (Fig. 1B).
Though some points of overlap exist (small yellow arrow-
heads), it is clear that TT in one region does not predict a more
sustained FAV response at that same location, even in the case
of autobiographically salient stimuli. This result indicates that
the fluctuations in BOLD signal within a brain area could reflect
the movement of the music in tonal space without necessarily
showing a change in the overall level of activity over the entire
duration of the excerpt. Similarly, brain areas could show
overall shifts in the level of activity related to the degree of
familiarity, autobiographical salience, and affect, without
necessarily following the structural details of the music.
Despite the variability in spatial distributions of FAV and TT
foci among individual subjects, several brain areas showed TT
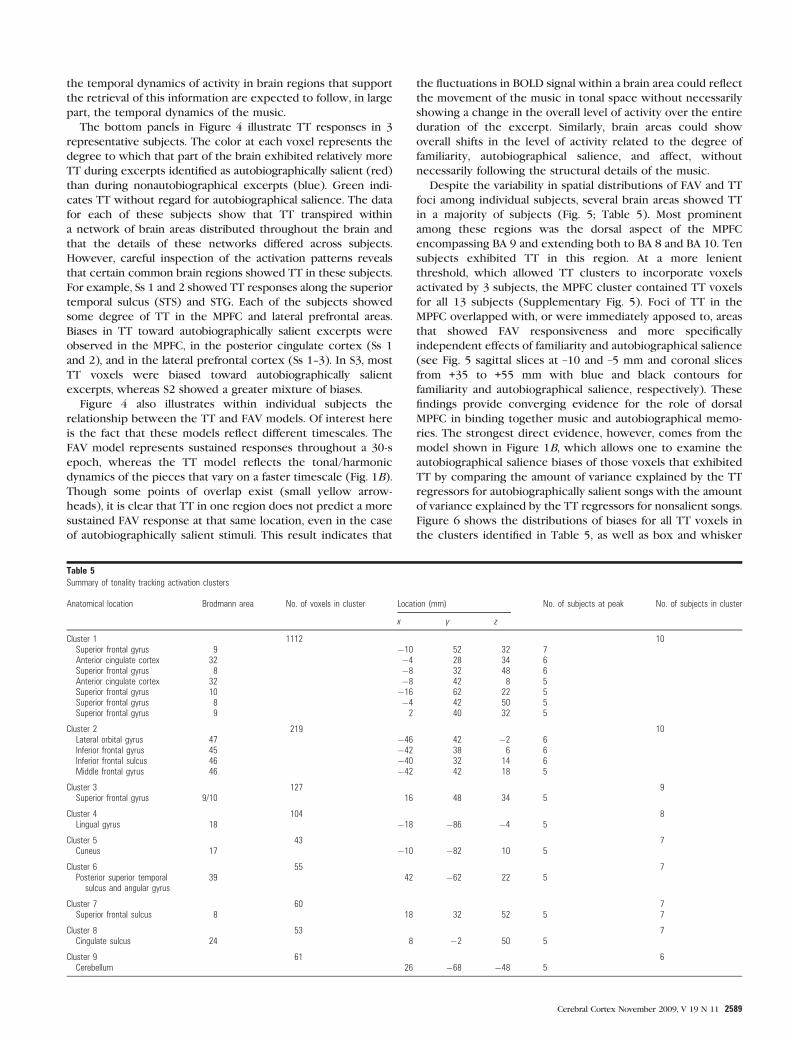
in a majority of subjects (Fig. 5; Table 5). Most prominent
among these regions was the dorsal aspect of the MPFC
encompassing BA 9 and extending both to BA 8 and BA 10. Ten
subjects exhibited TT in this region. At a more lenient
threshold, which allowed TT clusters to incorporate voxels
activated by 3 subjects, the MPFC cluster contained TT voxels
for all 13 subjects (Supplementary Fig. 5). Foci of TT in the
MPFC overlapped with, or were immediately apposed to, areas
that showed FAV responsiveness and more specifically
independent effects of familiarity and autobiographical salience
(see Fig. 5 sagittal slices at –10 and –5 mm and coronal slices
from +35 to +55 mm with blue and black contours for
familiarity and autobiographical salience, respectively). These
findings provide converging evidence for the role of dorsal
MPFC in binding together music and autobiographical memo-
ries. The strongest direct evidence, however, comes from the
model shown in Figure 1B, which allows one to examine the
autobiographical salience biases of those voxels that exhibited
TT by comparing the amount of variance explained by the TT
regressors for autobiographically salient songs with the amount
of variance explained by the TT regressors for nonsalient songs.
Figure 6 shows the distributions of biases for all TT voxels in
the clusters identified in Table 5, as well as box and whisker
Table 5Summary of tonality tracking activation clusters
Anatomical location Brodmann area No. of voxels in cluster Location (mm) No. of subjects at peak No. of subjects in cluster
x y z
Cluster 1 1112 10Superior frontal gyrus 9 �10 52 32 7Anterior cingulate cortex 32 �4 28 34 6Superior frontal gyrus 8 �8 32 48 6Anterior cingulate cortex 32 �8 42 8 5Superior frontal gyrus 10 �16 62 22 5Superior frontal gyrus 8 �4 42 50 5Superior frontal gyrus 9 2 40 32 5
Cluster 2 219 10Lateral orbital gyrus 47 �46 42 �2 6Inferior frontal gyrus 45 �42 38 6 6Inferior frontal sulcus 46 �40 32 14 6Middle frontal gyrus 46 �42 42 18 5
Cluster 3 127 9Superior frontal gyrus 9/10 16 48 34 5
Cluster 4 104 8Lingual gyrus 18 �18 �86 �4 5
Cluster 5 43 7Cuneus 17 �10 �82 10 5
Cluster 6 55 7Posterior superior temporalsulcus and angular gyrus
39 42 �62 22 5
Cluster 7 60 7Superior frontal sulcus 8 18 32 52 5 7
Cluster 8 53 7Cingulate sulcus 24 8 �2 50 5
Cluster 9 61 6Cerebellum 26 �68 �48 5
Cerebral Cortex November 2009, V 19 N 11 2589
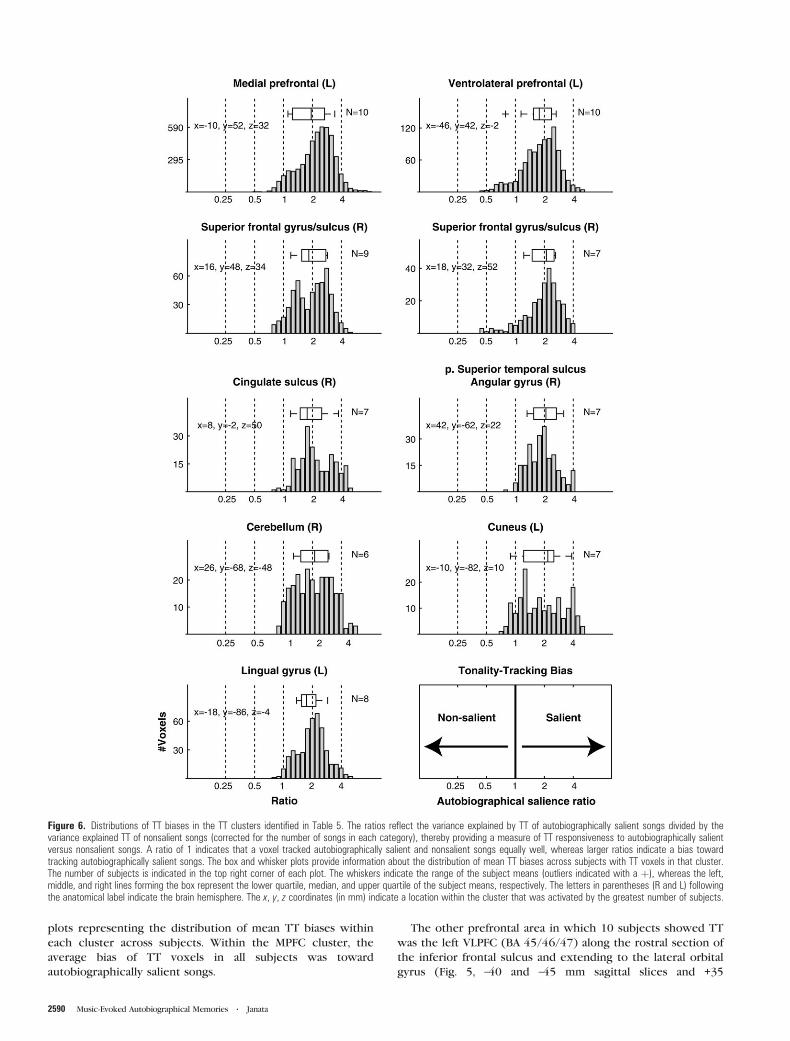
plots representing the distribution of mean TT biases within
each cluster across subjects. Within the MPFC cluster, the
average bias of TT voxels in all subjects was toward
autobiographically salient songs.
The other prefrontal area in which 10 subjects showed TT
was the left VLPFC (BA 45/46/47) along the rostral section of
the inferior frontal sulcus and extending to the lateral orbital
gyrus (Fig. 5, –40 and –45 mm sagittal slices and +35
Figure 6. Distributions of TT biases in the TT clusters identified in Table 5. The ratios reflect the variance explained by TT of autobiographically salient songs divided by thevariance explained TT of nonsalient songs (corrected for the number of songs in each category), thereby providing a measure of TT responsiveness to autobiographically salientversus nonsalient songs. A ratio of 1 indicates that a voxel tracked autobiographically salient and nonsalient songs equally well, whereas larger ratios indicate a bias towardtracking autobiographically salient songs. The box and whisker plots provide information about the distribution of mean TT biases across subjects with TT voxels in that cluster.The number of subjects is indicated in the top right corner of each plot. The whiskers indicate the range of the subject means (outliers indicated with a þ), whereas the left,middle, and right lines forming the box represent the lower quartile, median, and upper quartile of the subject means, respectively. The letters in parentheses (R and L) followingthe anatomical label indicate the brain hemisphere. The x, y, z coordinates (in mm) indicate a location within the cluster that was activated by the greatest number of subjects.
2590 Music-Evoked Autobiographical Memories d Janata
through +45 mm coronal slices). As with the MPFC cluster,
a more lenient criterion for defining the cluster resulted in the
inclusion of TT voxels from all subjects in the cluster
(Supplementary Fig. 5). Within the VLPFC cluster, the
distribution of TT voxels was also skewed toward autobio-
graphically biased, and all but one subject showed an average
TT bias toward autobiographically salient songs.
TT was also found for the majority of subjects in posterior
areas, most notably in the extrastriate visual areas (BA 18),
in the temporal lobe, and in the cerebellum. In the right
hemisphere, the posterior temporal activations extended to the
angular gyrus (BA 39). Supplementary Figure 5 shows the
summary TT map that was obtained when clusters could
include voxels activated by only 3 subjects. The main
consequence of lowering the threshold was an increase in
the size of the posterior cluster of TT voxels, such that it
encompassed posterior regions of the STG and sulcus and
additional extrastriate areas. The greater topographical vari-
ability in the posterior TT activations is perhaps best un-
derstood in the context of prefrontally guided retrieval of
semantic content and representations from posterior cortices,
as described below, which would be expected to vary more
extensively across memories within and between subjects.
Discussion
Music and Memories in the Prefrontal Cortex
The primary hypothesis, that music and memories are
associated in the MPFC, was supported by 2 complementary
pieces of evidence. First, dorsal MPFC (BA 8/9) responded
parametrically to the degree of autobiographical salience
experienced over the course of individual excerpts. Second,
the same areas (either the same or adjoining voxels) tracked
the movements of the musical excerpts through tonal space,
with stronger TT for autobiographically salient songs. The locus
of the FAV, Autobio, familiarity, and TT responses in dorsal
MPFC was found at the same location at which a familiarity
effect has been reported for odors and music (Plailly et al.
2007). The present results demonstrate not only that this area
shows a generalized increase to the degree of familiarity and
autobiographical salience but also that this region follows the
structural aspects of the music. In other words, this region
exhibits the properties of a mechanism that associates
structural aspects of a retrieval cue with episodic memories.
Rostral and ventral aspects of the MPFC also exhibited FAV and
TT responses and a main effect of autobiographical salience.
Activation foci were in close proximity to a previously reported
effect of musical familiarity (Plailly et al. 2007), TT (Janata, Birk,
et al. 2002), and positive affect experienced in response to
music (Blood et al. 1999; Brown, Martinez, and Parsons 2004).
The effect of increased positive valence, in particular, echoed
the ventral medial activations reported in the latter studies.
MEAM-related and TT activity were not, however, restricted
to the MPFC. One of the unique findings in the present study
was the presence of FAV and TT responses in both lateral and
medial prefrontal areas. Typically, lateral prefrontal cortex is
engaged during tasks that require orienting toward the
external environment (Cabeza and Nyberg 2000; Corbetta
and Shulman 2002), whereas MPFC is mainly involved in the
evaluation of self-relevant information and emotions (Ochsner
et al. 2004; Gilbert et al. 2006; Northoff et al. 2006; Schmitz and
Johnson 2007). Lateral and medial prefrontal areas are usually
associated with ‘‘task-positive’’ and ‘‘task-negative’’ (‘‘default-
mode’’ or ‘‘self-referential’’) networks, respectively, which
exhibit anticorrelated activity (Fox et al. 2005; Fransson
2006). Behaviors and experimental paradigms in which
elements of both networks are simultaneously active are,
therefore, of considerable interest because they may facilitate
our understanding of these networks’ interactions in everyday
experiential states.
The most parsimonious explanation for the recruitment of
both prefrontal regions during MEAMs is that multiple memory
retrieval processes are summoned in order to assemble different
bits of semantic and episodic content into a multifaceted
recollective experience (sequence of episodic memories) that
also has an affective component to it (Miller and Cohen 2001;
Wood and Grafman 2003; Ochsner and Gross 2005). These
processes may operate on the structural aspects of the stimulus
as well as its semantic content. From the perspective of content
retrieval, lateral retrieval processes may control the retrieval of
semantic or episodic information (Cabeza and Nyberg 2000;
Wagner et al. 2001). By contrast, medially situated processes (BA
8/10) serve the retrieval of episodic and affective elements of
autobiographical memories (Gilboa 2004; Svoboda et al. 2006).
More generally, prefrontal cortex controls the retrieval of
representations from posterior brain areas, such as extrastriate
visual or temporal lobe areas described below (Miller and Cohen
2001; Gold and Buckner 2002).
In the music domain, VLPFC activity has been reported
mainly in studies that manipulate musical structure. Perturbed
syntactic relationships such as insertions of unexpected
chords into chord progressions elicit robust responses in
VLPFC, particularly in the frontal opercular region at the
junction with the anterior insula (Tillmann et al. 2003; Koelsch
2005). VLPFC also responds more strongly to extended pieces
of real music when they are played normally compared with
when they are played in reverse (Levitin and Menon 2003) or
simultaneously with a pitch-shifted copy of themselves that
renders them unpleasant (Koelsch et al. 2006). These results
have suggested that this region helps integrate musical events
into syntactically coherent sequences (Levitin and Menon
2003; Tillmann et al. 2003; Koelsch 2005) as part of its domain
general role in structuring syntactic relationships (Patel 2003;
Fiebach and Schubotz 2006). The TT responses in left VLPFC
(BA 45/46/47) in the present study further this set of
observations by tying activity in this region to an explicit
model of dynamical musical structure.
The observation of TT in both medial and lateral prefrontal
regions is also a first step toward understanding the coupling
of prefrontal areas during the processing of musical stimuli. In
the original study of TT (Janata, Birk, et al. 2002), activation of
MPFC was highlighted because the area showed TT consis-
tently across days in individual subjects and across the entire
sample of subjects in response to a single melody that
modulated through all the major and minor keys. TT was not,
however, restricted only to the MPFC, with individual listeners
exhibiting consistent TT across recording sessions in other
prefrontal and posterior brain areas (see supplementary table S2
in Janata, Birk, et al. 2002). The present study extends the
previous TT results by generalizing to a large number of
selections of recorded popular music, thereby demonstrating
TT responses in a more ethological context.
Cerebral Cortex November 2009, V 19 N 11 2591

Music and Autobiographical Memories in a DistributedNetwork
A distributed-representation view of autobiographical memory
(Conway and Pleydell-Pearce 2000) maintains that an autobio-
graphical memory experience is the outcome of a constructive
process in which different pieces and forms of autobiograph-
ical knowledge—such as specific event or lifetime period
knowledge—are dynamically summoned and structured into
a particular memory event (Conway and Pleydell-Pearce 2000).
The relevant knowledge is distributed in a broad associative
network and can vary in the degree of episodic versus semantic
content or personal versus nonpersonal salience. Such varia-
tions in memory content are, therefore, expected to bias the
spatial distributions of activity across a number of cortical areas
during remembering episodes (Damasio 1989; Levine et al.
2004; Svoboda et al. 2006).
Overall, the strong left-hemisphere bias in prefrontal and
temporal activations for the FAV effect corroborates the results
of many neuroimaging studies of autobiographical memory
retrieval, though some notable differences exist (Maguire 2001;
Svoboda et al. 2006). In relation to previous studies, this study
differs substantially in the type of retrieval cue and task
instructions and consequently the nature of autobiographical
memory retrieval. The degree to which these differences
explain the differences in activation patterns remains to be
determined by further studies. The most notable difference is
in the recruitment of medial temporal lobe (MTL) structures.
The analysis of 24 studies by Svoboda et al. (2006) found
reports of medial prefrontal and MTL involvement in 62% and
58% of the studies, respectively. Together with posterior
cingulate and midlateral temporal areas, these were the most
common activation loci. I observed considerable medial
prefrontal engagement as a function of familiarity and also
autobiographical salience but I did not find any MTL activation.
Although the specific details of contrasts between conditions
might account for some of the variability in MTL activation
sightings across studies (Svoboda et al. 2006), an analysis of the
methods in the 24 studies suggests that tasks emphasizing
event retrieval, brief, and deliberate retrieval episodes associ-
ated with short phrase cues and the need to make decisions
about viewed items are all conditions that promote MTL
engagement (Maguire and Mummery 1999; Ryan et al. 2001;
Niki and Luo 2002; Maguire and Frith 2003; Piefke et al. 2003;
Addis et al. 2004; Cabeza et al. 2004; Gilboa et al. 2004; Levine
et al. 2004; Svoboda et al. 2006).
Subjects in the present MEAM study were aware that the
study was about autobiographical memories and that they
would be asked to rate their salience, but subjects were not
instructed to attempt to retrieve memories in response to
hearing the musical excerpts. A difference in spontaneous
versus effortful memory retrieval could, therefore, explain the
difference in MTL results. One other study that was designed
such that it could elicit spontaneous autobiographical memory
recall (in response to photographs of personally familiar and
unfamiliar events that had not been viewed prior to the scan)
did find activation of the hippocampus for personally relevant
events (Gilboa et al. 2004). However, subjects were asked to
recall and relive the event depicted in the photographs to the
best of their ability and retrieve as much episodic information
as possible. Thus, remembering episodes were likely associated
with effortful retrieval.
Another commonly reported activation locus in autobio-
graphical memory studies is the posterior cingulate gyrus
(Svoboda et al. 2006). In the present study, the most extensive
activation of the posterior cingulate was observed in the
combined contrast that represented the responses to familiar,
autobiographically sensitive, and positively valenced pieces of
music (P < 0.005 unc.; Figs 2 and 3). Smaller activation foci in
this region were observed for the separate familiarity,
autobiographical salience, and valence regressors, with the
strictest significance criterion being reached for the effect of
familiarity (Table 2). The distinctions among the familiarity and
autobiographical salience effects highlight a unique aspect of
this study, which is the fact that a subject can have a very vivid
experience of the retrieval cue which is associated with their
autobiographical past, which leads to a high familiarity rating,
yet not necessarily have a strong autobiographical remember-
ing episode that entails retrieval of memories other than the
details of the retrieval cue itself.
Finding suitable retrieval cues poses a challenge to autobio-
graphical memory research, and previous neuroimaging studies
of autobiographical memory have utilized single words or
images as retrieval cues in conditions in which subjects are
explicitly required to retrieve memories (Gilboa 2004; Svoboda
et al. 2006) or imagine themselves in extended autobiograph-
ical episodes (Gilboa et al. 2004; Levine et al. 2004). The
present study complements this research by showing that the
left-hemispheric bias typically observed in autobiographical
memory studies also arises in situations in which 1) the cues
are complex, naturally occurring stimuli that evolve over time
and 2) the retrieval demands are low. MEAMs occurred
spontaneously and presumably with little retrieval effort as
there was no aspect of the task design that forced subjects to
retrieve memories to any given cue.
Posterior and Subcortical Activations
Hearing a familiar song resulted in the activation of several
structures that have been implicated in a variety of sequencing
tasks and music studies (Janata and Grafton 2003), including
the pre-SMA, left IFG, bilateral thalamus, and several cerebellar
loci, primarily in the right hemisphere. These activations likely
reflect a common response to hearing a piece of music one is
familiar with, which is to sing along in one’s mind or at least
anticipate various melodic, harmonic, lyric, or timbral events in
the music. Cerebellar activations, primarily lateralized to the
right, are also commonly observed in studies of autobiograph-
ical memory (Svoboda et al. 2006). Several of the cerebellar loci
that showed an effect of familiarity were within close
proximity of activations reported in music studies in which
subjects listened to familiar pieces of music that induced chills
(Blood and Zatorre 2001), performed target detection tasks on
a familiar melody (Janata, Birk, et al. 2002), listened to familiar
and unfamiliar excerpts of music (Platel et al. 2003), repeated
or harmonized with melodies they had just heard (Brown,
Martinez, Hodges, et al. 2004), or completed melodic fragments
with spontaneously generated melodies (Brown et al. 2006).
Other studies utilizingmusical stimuli have also found cerebellar
responses, though in those cases the activation loci were quite
different from those observed in the present study (Janata,
Tillmann, and Bharucha 2002; Levitin and Menon 2003; Tillmann
et al. 2003). Further studies will be needed to fully understand
the circumstances that give rise to and organize cerebellar
responses to familiar stimuli.
2592 Music-Evoked Autobiographical Memories d Janata
Given the absence of visual stimulation in this experiment,
the observation of TT in extrastriate visual areas is best
interpreted in terms of top-down activations of visual cortex.
Top-down activation of extrastriate areas is commonly observed
invisualmental imageryparadigms (e.g.,Handyet al. 2004), during
memory retrieval (Wheeler et al. 2000), and in some autobio-
graphical memory studies (Svoboda et al. 2006). The strong
positive correlation between the vividness of visual mental
images and salience of MEAMs (Janata et al. 2007) suggests that
the activity in extrastriate cortex in this experiment was related
to music-evoked visual mental images, and the correlation with
TT suggests that memory-related visual images in visual cortex
unfold with the same temporal dynamics as the harmonic
sequences and phrases in the music.
The posterior portions of the STS exhibited increased
activity as a function of responding to questions (QAP), FAV,
and TT. This region is an important locus of semantic
processing and polymodal binding and is activated in autobio-
graphical memory studies (Svoboda et al. 2006). The N400, an
index of brain electrical activity that marks semantic expec-
tancy violations, is often localized to this area (Halgren et al.
2002). N400 evidence indicates that the comparison of
semantic concepts primed by music and related and unrelated
words occurs in these regions (Koelsch et al. 2004).
In contrast to previous studies of autobiographical memory,
the present experiment illustrated the activation of an
autobiographical memory network on 2 different timescales.
One was on the order of 30 s epochs in which different degrees
of familiarity, autobiographical salience, and affective valence
were modeled as sustained shifts in BOLD response. The other
was on the faster timescale of tonality changes associated with
the melodies and chord progressions in the songs, a timescale
akin to phrase structure and prosody in language. Although
many further experiments remain to be performed, for
example, to tease apart contributions of memory processes to
the retrieval of lyrics or to relate distributed activation patterns
to the content of specific autobiographical episodes, this study
establishes the feasibility of studying autobiographical memory
in an experimental context that closely resembles the common
experience of hearing a song that evokes vivid memories and
shows that the MPFC plays a central role in this experience.
Supplementary Material
Supplementary movies and supplementary figures 1--5 can be found
at: http://www.cercor.oxfordjournals.org/
Funding
Templeton Advanced Research Program grant from the
Metanexus Institute; National Institutes of Health (DC05146).
Funding to pay the Open Access charges for this article was
provided by a Templeton Advanced Research Program grant
from the Metanexus Institute.
Notes
I am grateful to Susannah Cohen, John Ryan, Michael Buonocore, and
Cheryline Mancusi for assistance in data collection and an anonymous
reviewer for helpful comments on the manuscript. Conflict of Interest:
None declared.
Address Correspondence to Petr Janata, Department of Psychology,
Center for Mind and Brain, 267 Cousteau Place, Davis, CA 95618, USA.
Email: [email protected].
References
Addis DR, Moscovitch M, Crawley AP, McAndrews MP. 2004.
Recollective qualities modulate hippocampal activation during
autobiographical memory retrieval. Hippocampus. 14:752--762.
Blood AJ, Zatorre RJ. 2001. Intensely pleasurable responses to music
correlate with activity in brain regions implicated in reward and
emotion. Proc Natl Acad Sci USA. 98:11818--11823.
Blood AJ, Zatorre RJ, Bermudez P, Evans AC. 1999. Emotional responses
to pleasant and unpleasant music correlate with activity in
paralimbic brain regions. Nat Neurosci. 2:382--387.
Brown S, Martinez MJ, Hodges DA, Fox PT, Parsons LM. 2004. The song
system of the human brain. Cogn Brain Res. 20:363--375.
Brown S, Martinez MJ, Parsons LM. 2004. Passive music listening
spontaneously engages limbic and paralimbic systems. Neuroreport.
15:2033--2037.
Brown S, Martinez MJ, Parsons LM. 2006. Music and language side by
side in the brain: a PET study of the generation of melodies and
sentences. Eur J Neurosci. 23:2791--2803.
Cabeza R, Nyberg L. 2000. Imaging cognition II: an empirical review of
275 PET and fMRI studies. J Cogn Neurosci. 12:1--47.
Cabeza R, Prince SE, Daselaar SM, Greenberg DL, Budde M, Dolcos F,
LaBar KS, Rubin DC. 2004. Brain activity during episodic retrieval of
autobiographical and laboratory events: an fMRI study using a novel
photo paradigm. J Cogn Neurosci. 16:1583--1594.
Conway MA, Pleydell-Pearce CW. 2000. The construction of autobio-
graphical memories in the self-memory system. Psychol Rev.
107:261--288.
Corbetta M, Shulman GL. 2002. Control of goal-directed and stimulus-
driven attention in the brain. Nat Rev Neurosci. 3:201--215.
Cuddy LL, Duffin J. 2005. Music, memory, and Alzheimer’s disease: is
music recognition spared in dementia, and how can it be assessed?
Medical Hypotheses. 64:229--235.
Damasio AR. 1989. Time-locked multiregional retroactivation—a
systems-level proposal for the neural substrates of recall and
recognition. Cognition. 33:25--62.
Duvernoy HM. 1999. The human brain: surface, three-dimensional
sectional anatomy with MRI and blood supply. Vienna (Austria):
Springer-Verlag.
Fiebach CJ, Schubotz RI. 2006. Dynamic anticipatory processing of
hierarchical sequential events: a common role for Broca’s area and
ventral premotor cortex across domains? Cortex. 42:499--502.
Fox MD, Snyder AZ, Vincent JL, Corbetta M, Van Essen DC, Raichle ME.
2005. The human brain is intrinsically organized into dynamic,
anticorrelated functional networks. Proc Natl Acad Sci USA.
102:9673--9678.
Fransson P. 2006. How default is the default mode of brain function?
Further evidence from intrinsic BOLD signal fluctuations. Neuro-
psychologia. 44:2836--2845.
Gilbert SJ, Spengler S, Simons JS, Steele JD, Lawrie SM, Frith CD,
Burgess PW. 2006. Functional specialization within rostral prefrontal
cortex (area 10): a meta-analysis. J Cogn Neurosci. 18:932--948.
Gilboa A. 2004. Autobiographical and episodic memory—one and the
same? Evidence from prefrontal activation in neuroimaging studies.
Neuropsychologia. 42:1336--1349.
Gilboa A, Winocur G, Grady CL, Hevenor SJ, Moscovitch M. 2004.
Remembering our past: functional neuroanatomy of recollection
of recent and very remote personal events. Cereb Cortex. 14:
1214--1225.
Gold BT, Buckner RL. 2002. Common prefrontal regions coactivate
with dissociable posterior regions during controlled semantic and
phonological tasks. Neuron. 35:803--812.
Gusnard DA, Raichle ME. 2001. Searching for a baseline: functional
imaging and the resting human brain. Nat Rev Neurosci. 2:685--694.
Halgren E, Dhond RP, Christensen N, Van Petten C, Marinkovic K,
Lewine JD, Dale AM. 2002. N400-like magnetoencephalography
responses modulated by semantic context, word frequency, and
lexical class in sentences. NeuroImage. 17:1101--1116.
Handy TC, Miller MB, Schott B, Shroff NM, Janata P, Van Horn JD, Inati S,
Grafton ST, Gazzaniga MS. 2004. Visual imagery and memory—do
retrieval strategies affect what the mind’s eye sees? Eur J Cogn
Psychol. 16:631--652.
Cerebral Cortex November 2009, V 19 N 11 2593

Janata P. 2005. Brain networks that track musical structure. Ann N Y
Acad Sci. 1060:111--124.
Janata P. 2007--2008. Navigating tonal space. In: Hewlett WB, Selfridge-
Field E, Correia E, editors. Tonal theory for the digital age. Stanford
(CA): Center for Computer Assisted Research in the Humanities.
p. 39--50.
Janata P, Birk JL, Tillmann B, Bharucha JJ. 2003. Online detection
of tonal pop-out in modulating contexts. Music Percept. 20:
283--305.
Janata P, Birk JL, Van Horn JD, Leman M, Tillmann B, Bharucha JJ. 2002.
The cortical topography of tonal structures underlying Western
music. Science. 298:2167--2170.
Janata P, Grafton ST. 2003. Swinging in the brain: shared neural
substrates for behaviors related to sequencing and music. Nat
Neurosci. 6:682--687.
Janata P, Tillmann B, Bharucha JJ. 2002. Listening to polyphonic music
recruits domain-general attention and working memory circuits.
Cogn Affect Behav Neurosci. 2:121--140.
Janata P, Tomic ST, Rakowski SK. 2007. Characterisation of music-
evoked autobiographical memories. Memory. 15:845--860.
Koelsch S. 2005. Neural substrates of processing syntax and semantics
in music. Curr Opin Neurobiol. 15:207--212.
Koelsch S, Fritz T, von Cramon DY, Muller K, Friederici AD. 2006.
Investigating emotion with music: an fMRI study. Hum Brain Mapp.
27:239250.
Koelsch S, Kasper E, Gunter TC, Sammler D, Schulze K, Friederici AD.
2004. Music, language, and meaning: brain signatures of semantic
processing. Nat Neurosci. 7:302--307.
Krumhansl CL. 1990. Cognitive foundations of musical pitch. New York:
Oxford University Press.
Levine B, Turner GR, Tisserand D, Hevenor SJ, Graham SJ, McIntosh AR.
2004. The functional neuroanatomy of episodic and semantic
autobiographical remembering: a prospective functional MRI study.
J Cogn Neurosci. 16:1633--1646.
Levitin DJ, Menon V. 2003. Musical structure is processed in ‘‘language’’
areas of the brain: a possible role for Brodmann area 47 in temporal
coherence. NeuroImage. 20:2142--2152.
Maguire EA. 2001. Neuroimaging studies of autobiographical event
memory. Philos Trans R Soc Lond B Biol Sci. 356:1441--1451.
Maguire EA, Frith CD. 2003. Aging affects the engagement of the
hippocampus during autobiographical memory retrieval. Brain.
126:1511--1523.
Maguire EA, Mummery CJ. 1999. Differential modulation of a common
memory retrieval network revealed by positron emission tomogra-
phy. Hippocampus. 9:54--61.
Maldjian JA, Laurienti PJ, Burdette JB, Kraft RA. 2003. An automated
method for neuroanatomic and cytoarchitectonic atlas-based
interrogation of fMRI data sets. NeuroImage. 19:1233--1239.
Miller EK, Cohen JD. 2001. An integrative theory of prefrontal cortex
function. Annu Rev Neurosci. 24:167--202.
Nichols T, Brett M, Andersson J, Wager T, Poline J-B. 2005. Valid
conjunction inference with the minimum statistic. NeuroImage.
25:653--660.
Niki K, Luo J. 2002. An fMRI study on the time-limited role of the medial
temporal lobe in long-term topographical autobiographic memory.
J Cogn Neurosci. 14:500--507.
Northoff G, Heinzel A, Greck M, Bennpohl F, Dobrowolny H,
Panksepp J. 2006. Self-referential processing in our brain—a meta-
analysis of imaging studies on the self. NeuroImage. 31:440--457.
Ochsner KN, Gross JJ. 2005. The cognitive control of emotion. Trends
Cogn Sci. 9:242--249.
Ochsner KN, Knierim K, Ludlow DH, Hanelin J, Ramachandran T,
Glover G, Mackey SC. 2004. Reflecting upon feelings: an fMRI study
of neural systems supporting the attribution of emotion to self and
other. J Cogn Neurosci. 16:1746--1772.
Patel AD. 2003. Language, music, syntax and the brain. Nat Neurosci.
6:674--681.
Piefke M, Weiss PH, Zilles K, Markowitsch HJ, Fink GR. 2003.
Differential remoteness and emotional tone modulate the neural
correlates of autobiographical memory. Brain. 126:650--668.
Plailly J, Tillmann B, Royet J-P. 2007. The feeling of familiarity of music
and odors: the same neural signature? Cereb Cortex. 17:2650--2658.
Platel H, Baron JC, Desgranges B, Bernard F, Eustache F. 2003. Semantic
and episodic memory of music are subserved by distinct neural
networks. NeuroImage. 20:244--256.
Ryan L, Nadel L, Keil K, Putnam K, Schnyer D, Trouard T, Moscovitch M.
2001. Hippocampal complex and retrieval of recent and very
remote autobiographical memories: evidence from functional
magnetic resonance imaging in neurologically intact people.
Hippocampus. 11:707--714.
Schmitz TW, Johnson SC. 2007. Relevance to self: a brief review and
framework of neural systems underlying appraisal. Neurosci
Biobehav Rev. 31:585--596.
Svoboda E, McKinnon MC, Levine B. 2006. The functional neuroanat-
omy of autobiographical memory: a meta-analysis. Neuropsycholo-
gia. 44:2189--2208.
Thompson PM, Hayashi KM, de Zubicaray G, Janke AL, Rose SE,
Semple J, Herman D, Hong MS, Dittmer SS, Doddrell DM, et al. 2003.
Dynamics of gray matter loss in Alzheimer’s disease. J Neurosci.
23:994--1005.
Tillmann B, Janata P, Bharucha JJ. 2003. Activation of the inferior frontal
cortex in musical priming. Cognit Brain Res. 16:145--161.
Toiviainen P, Krumhansl CL. 2003. Measuring and modeling real-time
responses to music: the dynamics of tonality induction. Perception.
32:741--766.
Tomic ST, Janata P. 2007. Ensemble: a web-based system for psychology
survey and experiment management. Behav Res Methods. 39:
635--650.
Wagner AD, Pare-Blagoev EJ, Clark J, Poldrack RA. 2001. Recovering
meaning: left prefrontal cortex guides controlled semantic retrieval.
Neuron. 31:329--338.
Wheeler ME, Petersen SE, Buckner RL. 2000. Memory’s echo: vivid
remembering reactivates sensory-specific cortex. Proc Natl Acad Sci
USA. 97:11125--11129.
Wood JN, Grafman J. 2003. Human prefrontal cortex: processing and
representational perspectives. Nat Rev Neurosci. 4:139--147.
2594 Music-Evoked Autobiographical Memories d Janata
Recommended

![Ambiguity resolution in a Neural Blackboard Architecture ...€¦ · ral Blackboard Architecture for compositional (sentential) representation [1]. The Neural Blackboard Architecture,](https://img.pdfslide.net/doc/110x75/5feb3691b92eb911df2ecb84/ambiguity-resolution-in-a-neural-blackboard-architecture-ral-blackboard-architecture.jpg)