Amy Myers JaffeExecutive Director
Energy and Sustainability University of California -DAVIS
The Oil Price Conundrum: Cyclical, Geopolitical, or Technologically Structural?

Oil has been a cyclical commodity, but current price decline reflects more than the usual cycle shift.
• Demand: OECD, China energy and climate policies (and the US and Chinese economic stimulus clean tech targets) lowered oil demand and enabled innovation and advanced clean energy solutions
• High oil prices stimulated drilling innovations, that has led to a supply bubble.
Source: Medlock, K.B., Amy Jaffe, “The price of crude oil: deja vu all over again?”(2013), EIA

Technology Revolution is ushering in exponential gains in productivity, via transportational logistics, automation, big data, material science and biotech, artificial intelligence, 3-D printing.
This revolution will further decouple energy use and economic growth.

Boom & Bust Commodities Cycle /
Global EconomyGeopolitics
Technological / Structural Trends
Oil Price
Cycle unlikely to progress in exactly the same manner as past cycles as it reflects structural elements related to technological innovation.
Unparalleled changes creating confusion and uncertainty about long term demand trends.

Old Vs New Forces Impacting Demand
Population growthEmerging economy expansionExpanding global middle class
TechnologyLegislative and tax policy
Energy efficiency (energy per GDP declining)
Millennials reject vehicle ownershipGrowth of alternative energy
~90 Mil BBL/dayCurrently

Mobility in Emerging Markets Driver of Future Oil Demand
0
20
40
60
80
100
120
Current 2035
Global Oil Demand by Sector(Million Barrels of Oil per Day)
Transport
Industry
Residential CommercialAgriculture
Power
Source: IEA and Independent Analysis
-5 0 5 10
U.S.
EU
China
India
Rest of World
Global Oil Demand Growth by Region (Million Barrels of Oil Equivalent/Day)

ExxonMobil forecasts freight/diesel to dominate demand growth

• Population growth > 9 billion by 2040
• 5 billion people reach the Middle Class by 2030, up from 2 billion in 2014, according to Brookings Institution study
• Wealthier populations desire personal automobiles, world car stocks hit 1.7 billion cars, up from 825 million in 2010
• Economic growth driven by rising Asia, Africa, GDP per capita doubles in Brazil, Mexico, South Africa, Nigeria, Turkey, Iran, Thailand, Indonesia, other ASEAN
• Lower oil prices stimulate purchases of larger vehicles and more travel, autonomous vehicles increase VMT
• Strong global GDP growth (> 2% per annum) leads to increased energy demand, especially higher commercial transport, increasing difficulties for countries to meet COP 21 Paris commitments
Key Indicators of the High Growth Worldview

9
Economies are Expanding, but Getting more Efficient
Source: IEA, IMF, and CVX Analysis
Oil
Natural Gas
Coal
Power Generation
51%
Industry25%
Transportation 20%
© 2016 Chevron Corporation
GDP vs. Energy Demand by Country/Region
0
10
20
30
40
50
60
70
80
90
0 5 10 15 20 25 30 35 40
Ener
gy C
onsu
mpt
ion
in M
MBO
ED
GDP in Real 2014 PPP$
China
U.S.
EU
India
Latin America
SE AsiaAfrica
20302040
2020
2010
20001990

• Shale economics
• Utility scale renewables
• Logistics planning
• Mobility services
• Energy efficiency and the industrial internet
• To come, energy storage
Technology revolution is already impacting costs across the entire energy chain.
Rapidly falling costs causing some to predict an explosive S curve deployment effect that will strand fossil fuels
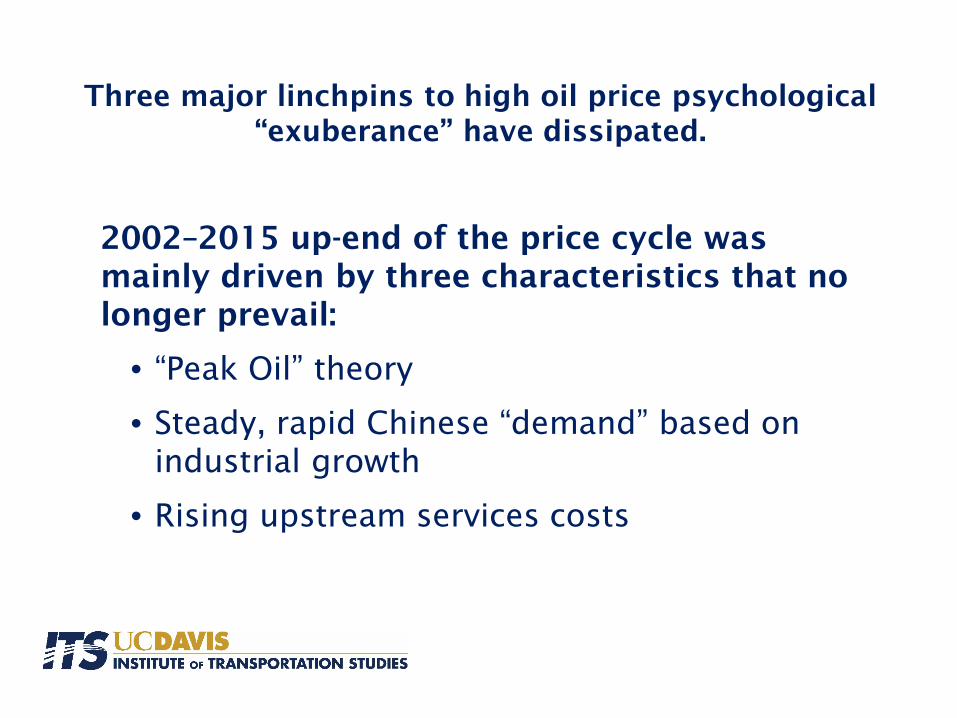
2002–2015 up-end of the price cycle was mainly driven by three characteristics that no longer prevail:
• “Peak Oil” theory
• Steady, rapid Chinese “demand” based on industrial growth
• Rising upstream services costs
Three major linchpins to high oil price psychological “exuberance” have dissipated.
$-
$20.00
$40.00
$60.00
$80.00
$100.00
$120.00
$140.00
5/1/
1983
1/1/
1984
9/1/
1984
5/1/
1985
1/1/
1986
9/1/
1986
5/1/
1987
1/1/
1988
9/1/
1988
5/1/
1989
1/1/
1990
9/1/
1990
5/1/
1991
1/1/
1992
9/1/
1992
5/1/
1993
1/1/
1994
9/1/
1994
5/1/
1995
1/1/
1996
9/1/
1996
5/1/
1997
1/1/
1998
9/1/
1998
5/1/
1999
1/1/
2000
9/1/
2000
5/1/
2001
1/1/
2002
9/1/
2002
5/1/
2003
1/1/
2004
9/1/
2004
5/1/
2005
1/1/
2006
9/1/
2006
5/1/
2007
1/1/
2008
9/1/
2008
5/1/
2009
1/1/
2010
9/1/
2010
5/1/
2011
1/1/
2012
9/1/
2012
5/1/
2013
1/1/
2014
9/1/
2014
5/1/
2015
Oil Price (1982-84 Real Dollars) Oil Price (Nominal Dollars)($ / bbl)
12
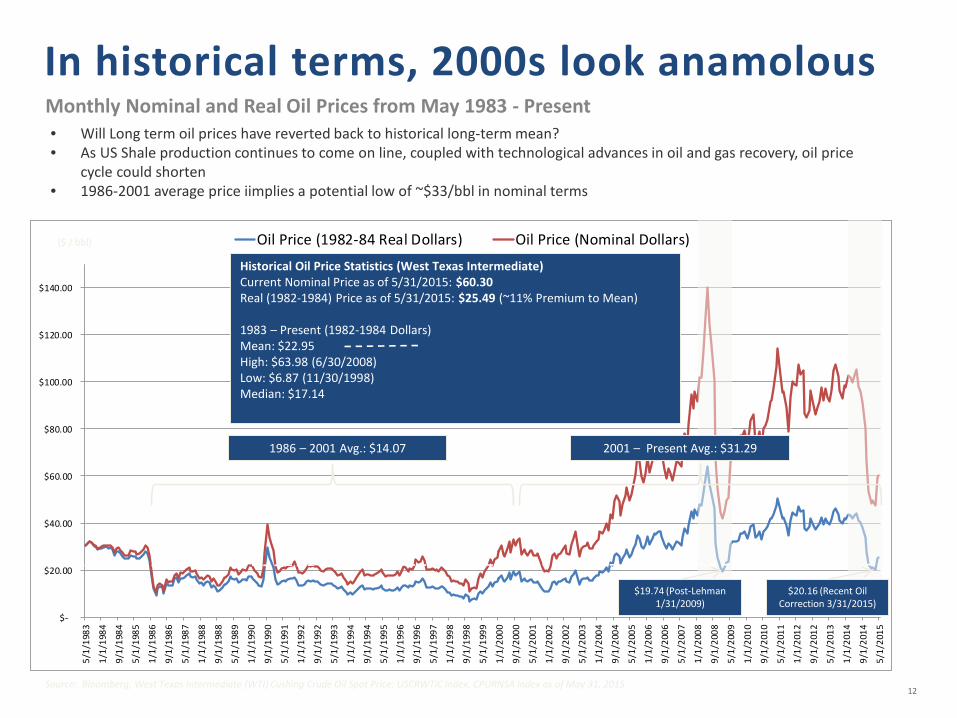
In historical terms, 2000s look anamolousMonthly Nominal and Real Oil Prices from May 1983 - Present
Historical Oil Price Statistics (West Texas Intermediate) Current Nominal Price as of 5/31/2015: $60.30Real (1982-1984) Price as of 5/31/2015: $25.49 (~11% Premium to Mean)
1983 – Present (1982-1984 Dollars)Mean: $22.95High: $63.98 (6/30/2008)Low: $6.87 (11/30/1998)Median: $17.14
$19.74 (Post-Lehman 1/31/2009)
$20.16 (Recent Oil Correction 3/31/2015)
1986 – 2001 Avg.: $14.07 2001 – Present Avg.: $31.29
• Will Long term oil prices have reverted back to historical long-term mean?• As US Shale production continues to come on line, coupled with technological advances in oil and gas recovery, oil price
cycle could shorten • 1986-2001 average price iimplies a potential low of ~$33/bbl in nominal terms
Source: Bloomberg, West Texas Intermediate (WTI) Cushing Crude Oil Spot Price: USCRWTIC Index, CPURNSA Index as of May 31, 2015

Oil Industry: Conventional Wisdom Increasingly Challenged
13
• Endless trending growth in oil demand is now increasingly questioned
• Paris Climate Agreement
• Slowing China and world growth and urbanization trend
• Other technology advances on the horizon (eg. improved fuel economy standards, improved logistics, battery breakthroughs, small scale technologies)
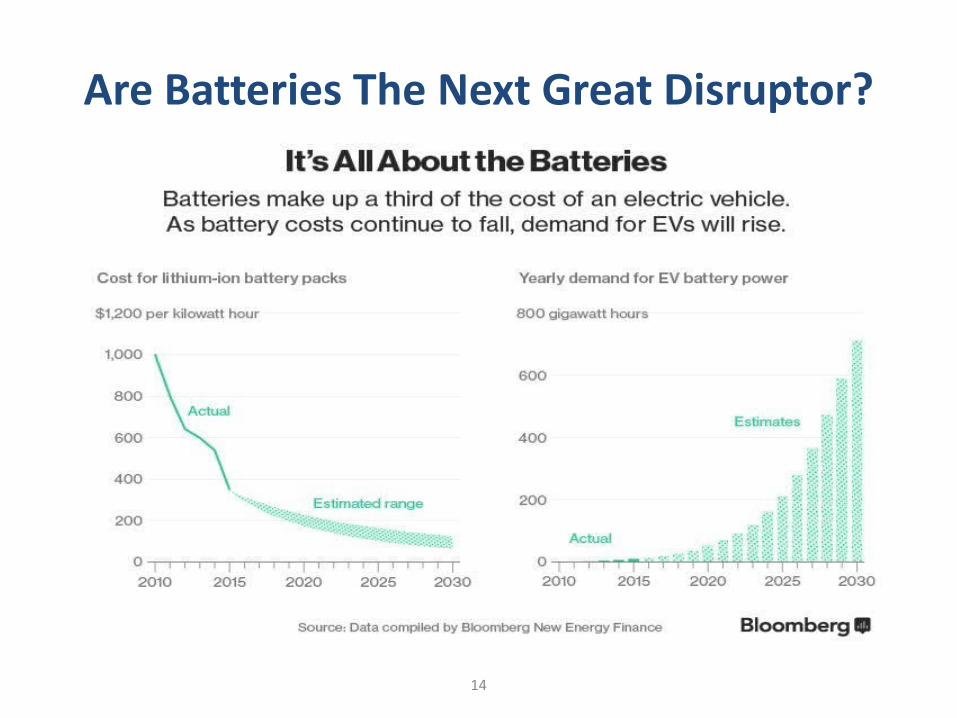
Are Batteries The Next Great Disruptor?
14

Battery Breakthrough Scenario - Oil Demand Impact Takes Many Years to Unfold
29% 28% 24% 26%18%
31% 30%30% 28%
24%
21% 21%23% 23%
23%
5% 6% 6% 6%
8%
10% 10% 10% 11%
12%
1% 2% 5% 3%12%
0%
20%
40%
60%
80%
100%
120%
2012 Oil BAU $150 KWH Oil BAU $150 KWH
Other Renewables
Bioenergy
Hydro
Nuclear
Gas
Oil
Coal94.3 74.686.5
2020 2030
90.3
Oil in million b/d
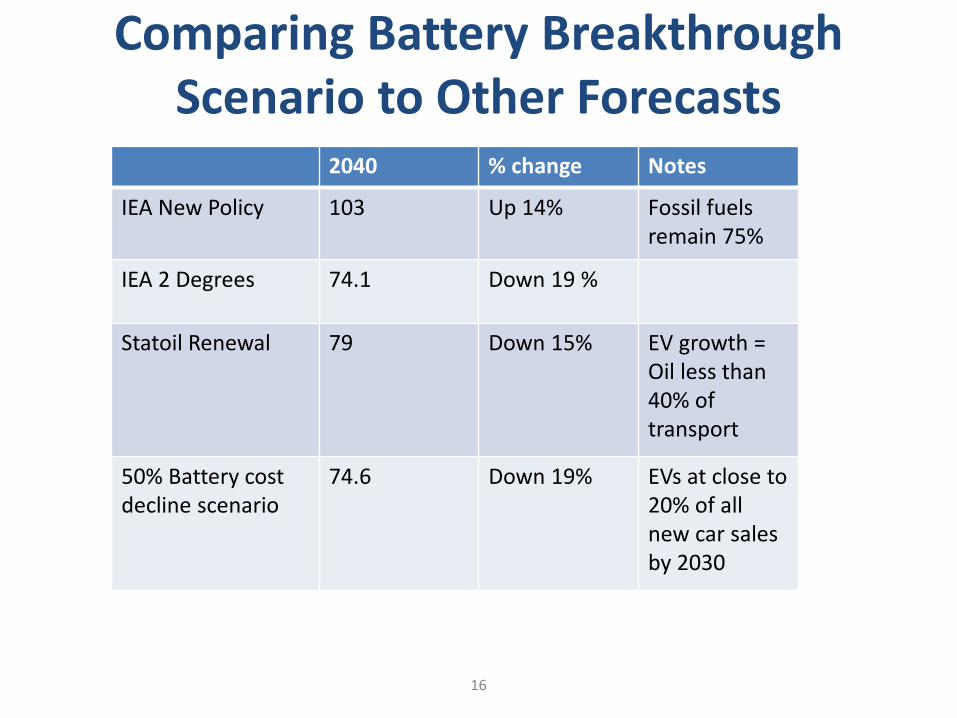
Comparing Battery Breakthrough Scenario to Other Forecasts
16
2040 % change Notes
IEA New Policy 103 Up 14% Fossil fuels remain 75%
IEA 2 Degrees 74.1 Down 19 %
Statoil Renewal 79 Down 15% EV growth = Oil less than 40% of transport
50% Battery cost decline scenario
74.6 Down 19% EVs at close to 20% of all new car sales by 2030

Scenario Results
17
0
10
20
30
40
50
60
70
80
90
100
2000 2005 2010 2015 2020 2025 2030 2035 2040 2045 2050
Oil C
onsu
mpt
ion
(mill
ion
bbl/d
ay)
Range of Oil Projection Scenarios
Business as Usual
"Kitchen Sink"
• Possible stagnation of oil demand through 2035 before growth resumes
Technological factors could be sufficient to reduce demand in the next two decades, but given the overwhelming influence of population growth, permanent peak in oil demand likely requires policy intervention.
Transportation sector is ~60% of oil demand and projection of vehicle miles driven influences greatly demand forecast

UC Davis Oil Demand Scenario Study: Testing Sensitivities of Peak Demand Transport Scenarios
18
Oil consumption projections through 2050.
Projected Oil Consumption (million bbl/day)
2015 2020 2025 2030 2035 2040 2045 2050 % Reduction Relative to Baseline 2050
Baseline 52.5 55.7 58.8 62.3 67.5 74.1 81.0 88.1 No China-India Growth 52.1 54.5 56.5 58.7 62.3 66.9 71.6 76.0 13.8%
Global GDP Growth Reduction 10% 51.8 53.6 55.0 57.1 61.2 66.8 73.1 79.8 9.4%No China Growth 52.4 55.1 57.6 60.4 64.8 70.4 76.4 82.2 6.7%
Shipping Logistics Improvement 52.4 55.0 57.2 59.5 63.7 69.2 75.7 82.3 6.5%Road Freight Efficiency Improvement 52.4 55.1 57.3 59.8 64.0 69.7 76.3 83.1 5.7%
China-US-India GDP Parity 52.5 55.7 58.8 62.4 67.1 72.9 78.6 84.1 4.6%Ridesharing 52.5 55.4 58.2 61.4 66.1 72.1 78.3 84.5 4.0%
China-US GDP Parity 52.4 55.4 58.2 61.5 66.3 72.3 78.6 84.8 3.8%ASEAN Extra Congestion 52.3 55.1 58.0 61.3 66.2 72.4 78.9 85.5 2.9%
Congestion 52.3 55.1 58.0 61.4 66.3 72.5 79.1 85.8 2.6%Air Traffic 52.5 54.9 57.9 61.4 66.5 72.9 79.8 86.7 1.6%
Natural Gas Trucks Share Increase 52.5 55.6 58.6 62.0 67.0 73.4 80.2 87.0 1.2%Electric Vehicle Advancement 52.5 55.7 58.8 62.3 67.5 73.9 80.6 87.4 0.8%
ASEAN Only Congestion 52.5 55.7 58.8 62.3 67.4 73.9 80.8 87.8 0.3%

How sensitive is oil demand to vehicle miles traveled?
19

Demand Scenarios Per Fuels
20
0
10
20
30
40
50
60
70
80
90
IEA NewPolicies
2015
IEA NewPolicies
2025
IEA NewPolicies
2040
IEA 4502015
IEA 4502025
IEA 4502040
UC DavisDigital
Scenario2015
UC DavisDigital
Scenario2025
UC DavisDigital
Scenario2040
HighDemand
2015
HighDemand
2025
HighDemand
2040
Oil
Cons
umpt
ion
in T
rans
port
atio
n (m
boe
per d
ay)
Conventional Gasoline Conventional Diesel Jet Fuel Residual Fuel

Comparing Indicators per Fuels
21
0
10
20
30
40
50
60
70
80
90O
il Co
nsum
ptio
n in
Tran
spor
tatio
n (m
boe
per d
ay)
Conventional Gasoline Conventional Diesel Jet Fuel Residual Fuel

Regional Distribution Oil Demand per Scenarios
22
0
10
20
30
40
50
60
70
IEA New Policies 2015 IEA New Policies 2030 UC Davis Digital Scenario2030
High Demand 2030
Oil C
onsu
mpt
ion
in Tr
ansp
orta
tion
(mbo
e per
day
)
OECD Africa ASEAN China-India Latin America Other

Regional Distribution per Demand for Gasoline
23
0
5
10
15
20
25
30
IEA New Policies 2015 IEA New Policies 2030 UC Davis Digital Scenario2030
High Demand 2030
Gaso
line C
onsu
mpt
ion
in Tr
ansp
orta
tion
(mbo
e pe
r day
)
OECD Africa ASEAN China-India Latin America Other

Comparing Battery Breakthrough Scenario to Other Forecasts
24
2040 % change Notes
IEA New Policy 103 Up 14% Fossil fuels remain 75%
IEA 2 Degrees 74.1 Down 19 %
Statoil Renewal 79 Down 15% EV growth = Oil less than 40% of transport
50% Battery cost decline scenario
74.6 Down 19% EVs at close to 20% of all new car sales by 2030
30 years of conventional wisdom is over now, forever
25
• Since 1980s, conventional wisdom held that “easy oil” in non-OPEC would be depleted by 2010s and the world would be increasingly reliant on OPEC oil.
• OPEC responded to this view by taking a revenues oriented strategy in the 2000s. Gulf countries viewed reserves as increasing in value over time for “future generations.”
• Paris climate accords and US shale boom throws this future reserves scarcity model into question
• Uncertainty about long term demand outlook shifting strategic calculus of largest reserve holders

Implications for OPEC
26
• Flattening or peaking global oil consumption can lead to the situation where not all oil producing countries will be able to exhaust their reserves.
• In such a situation, question becomes whether it is optimal for either OPEC or private oil companies to delay development and production of reserves.
• Musical chairs syndrome –timing to monetize reserves moves forward
New Market Realities
27
“Freeze” dynamic led all players to seek higher output from which to begin agreement
• Not a repeat of 1998: Context for freeze is long term adjustments that might be required to address peak in oil demand
• Game of Survivor: winner takes all • Downstream • Exploration

New Market Realities
28
Majors shift from a growth business model to a sales business model• Monetize legacy assets• Each time technology adoption eliminates demand, price of oil
and gas will fall again
Recommended