The OSF Playbook: A Journey to Investing in Future SciTech
Authors: Randal A. Koene, Lily Kim, Lisa M.P. Munoz, Jeff Klunzinger, Bryan Johnson Executive Summary
Investing in complex science and technology is hard, with higher risk and longer time horizons for returns. This is a mantra too often heard in venture capital (VC). For futuristic science and technology, 1
the playing field is even more challenging. Unlike Internet technologies, emerging domains such as synthetic biology, artificial intelligence, and space exploration lack a vibrant ecosystem of competing and complementary investment playbooks. Yet these domains are rapidly growing and are already working to address some of humanity’s most promising opportunities and vexing challenges. OS Fund, which aims to fund the best scitech startup companies working on quantumleap discoveries, wants to improve the landscape for VC science funding. We set out to demystify the duediligence process for science startups in emerging domains by creating an opensource decisionanalysis model. The goal was to learn, share with others, and collaborate with the broader community. We started with one playbook, synthetic biology, and one company to test the model. The power of the model is in identifying the right questions to ask and in iteratively capturing interactions between multiple, often interdependent factors. Using such a quantitative method takes us beyond the capacity of human working memory. The model maps through various possible outcomes rather than only focusing on risk and reward. It estimates a multiple on investment for different scenarios. This “expected return multiple” measures the overall attractiveness of the investment. Despite the quantitative nature of the model, we gained the most insight from the process of building the model, not from an absolute output number. The decision model produced insight both at the individual company and industry levels. It is thus a powerful tool in tackling emerging domains where there is little past guidance on investment evaluation and strategy. We consider this work our initial contribution to the increasingly open and collaborative culture in emerging science and technology investment. While many firms have been investing in biotechnology for decades, a fewer number have invested in emerging science and technology such as synthetic biology. We hope that our approach, detailed in this paper, will be helpful to others in their own decisionmaking processes and spark interest from investors new to the space.
1 Despite evidence to the contrary in some science sectors, such as biotech. Bruce Booth, March 2015. “Buying Time in 2014: Comparative Holding Periods For VCBacked M&A Events” http://lifescivc.com/2015/03/buyingtimein2014comparativeholdingperiodsforvcbackedmaevents/
1i

We also recognize that many investors have given these issues thoughtful consideration, and we believe that understanding, insight, and expertise comes from many iterations across different companies and situations. By openly sharing our methodology, we want to encourage other sciencefocused funds to share their thoughts and methodologies. Encouraging investment in emerging science and technology to create a viable path for its growth is key to rewriting the operating systems of humanity.
Taking the Plunge With Clarity
The decision of whether to invest in a startup is complex. Some risks may not stem from the company or the market but from the investor’s own decisionmaking process. Investors’ assumptions, cognitive biases, and the mechanics of how a decision is made can influence the decision and potentially jeopardize investments. Quantitative methods for evaluating startups have become more popular in recent years in VC, government, and industry, as we discovered through indepth research, interviews, and study of the literature. Traditionally, VCs rely on a set of heuristics and threshold criteria for return on investment. 2Other fields, however, such as the oil industry and pharmaceutical companies, have worked with decision 3
models for years with favorable results. Even in domains such as major league baseball and the NBA, 4quantitative methods are being successfully used to increase the likelihood of wins. As early as 1982, the literature suggests that major areas of the U.S. government had adopted decisionanalysis in some form or another, and agencies such as DARPA (Defense Advanced Research Projects Agency) have led the way 5
in funding highrisk science research. In venture capital, there appears to be an interest in better methods, but there is as yet insufficient data for a conclusive judgement about the push for dataintensive methods in VC. Moreover, this practice is not yet widespread for science startups. 6
To understand more about the possible risks and rewards of investing in a sciencebased company, we used decision analysis, which a few venture firms have begun to adopt. Quantitative methods are valuable because investments are inherently quantitative. Although numerical results should not be interpreted naively without other context, they can add insight when used appropriately. We based the model’s initial structure on an existing example of decision analysis in hightech venture capital by Clint Korver, a consultant with many years of experience applying similar models in industry. 7Korver analyzed startup company Inkling, which was developing etextbooks for the iPad. The decisionanalysis framework built a clearer picture of risks and returns, and his firm invested successfully.
2 Seth Levine, “Venture Outcomes are Even More Skewed Than You Think”, http://www.sethlevine.com/archives/2014/08/ventureoutcomesareevenmoreskewedthanyouthink.html 3 Reidar Bratvold, “DecisionMaking in Oil & Gas The Good, Bad, and the Ugly”, http://www.edpn.org/wp/wpcontent/uploads/2012/10/ReidarBratvold.pdf 4 Rick Maese, “Moneyball Movement Sweeps Pro Basketball”, October 25, 2013, Washington Post. http://www.washingtonpost.com/sports/wizards/nbaembracesadvancedanalyticsasmoneyballmovementsweepsprobasketball/2013/10/25/1bd40e243d7a11e3b0e7716179a2c2c7_story.html 5 Ulvila and Brown, “Decision Analysis Comes of Age”, September 1982, Harvard Business Review. https://hbr.org/1982/09/decisionanalysiscomesofage 6 Christina Farr, “Venture capital picks Up the Moneyball strategy”, Venturebeat. http://venturebeat.com/2012/11/09/startupalgorithm/ 7 Clint Korver, “Applying Decision Analysis to Venture Investing”, Kauffman Foundation. http://www.kauffmanfellows.org/journal_posts/applyingdecisionanalysistoventureinvesting/
2i

Diving Deep into Synthetic Biology We analyzed a synthetic biology company looking to grow and access new markets. While this case is based on a real example, details have been changed for anonymity. Synthetic biology is an emerging domain in which biological engineering is used to design living organisms to make products. Biological engineering has existed for decades, for example to make 8
pharmaceuticals, but recent advances are enabling a step change in efficiency and predictability of these systems. The synthetic biology company we analyzed is making replacements for specialty chemicals (e.g., petroleumderived or naturally occurring plant extracts) by using microorganisms to produce the chemicals. Such a process potentially offers cost, supply chain, and product quality advantages over making those same chemicals from petroleum or extracting them from plants. Similar to competing players, the company’s business model is based on upfront codevelopment fees and licensing royalties on the use of their biological technologies. The company has demonstrated some early technical success by producing small quantities of desired chemicals, but has yet to prove itself in the market. While decision analysis has been applied to laterstage biofuel plant operations, we are not aware of 9
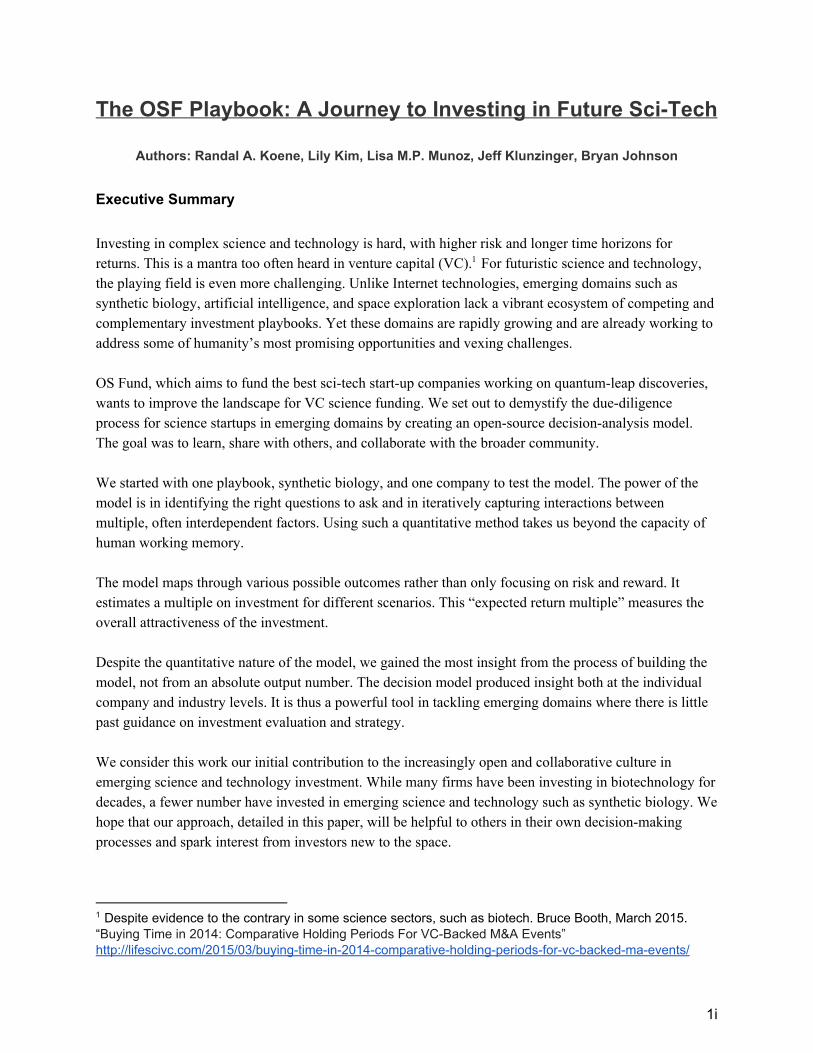
cases where decision analysis has been applied to earlystage investing in synthetic biology. Mapping the Landscape of Risks and Rewards To start, we took Korver’s decision analysis model and began iteratively tailoring it to capture factors, market dynamics, and exit scenarios appropriate for our case (Figure 1). Customization is essential for a decision model, to cater to each investment with domain and companyspecific factors and to reflect the risks and rewards of that particular situation. To identify the risks and potential rewards of the investment, we conducted basic diligence on the synthetic biology company and industry. Figure 2 shows a map summarizing how these risk and reward factors interact. Reward factors included market and financial factors, such as market size and share, the valuation model, prior shares, investments or debts, and the effects of future dilution on the current investment, among others. Risk factors included team risk, the ability to scale manufacturing, the effects of competition, and whether the company would be able to gain and hold a leading market position, among others. We also looked at the major milestones of company development (e.g., early phase, crossing the chasm, and mainstream adoption), and within each, how the company’s business plan depends on companyspecific factors, expressed in market, product, team, and financial categories.
8 Synthetic Biology Project, “What is Synthetic Biology?” http://www.synbioproject.org/topics/synbio101/definition/ 9 Scott Mongeau, “A Biofuel Plant Analysis”. http://blog.palisade.com/2011/08/11/usingthedecisiontoolssuiteforabiofuelplantanalysis/
3i
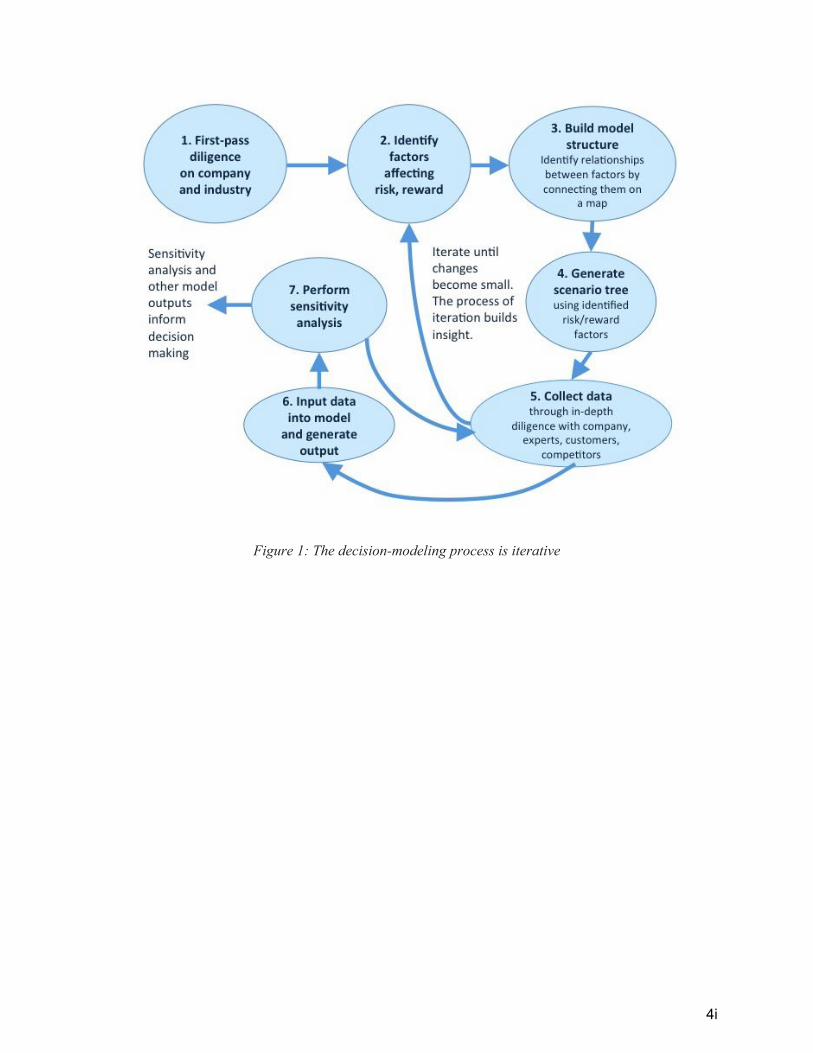
Figure 1: The decisionmodeling process is iterative
4i
Figure 2: Building model structure using factors that affect risk and reward
The decisionanalysis model incorporates the risks and rewards from Figure 2 into a probability tree (shown in Figure 3) that connects these riskreward factors with potential outcome scenarios and the overall return on investment.
5i

Figure 3: Each outcome scenario has a probability of success P (calculated by multiplying the probability of success along the branches to that outcome, e.g., P1=pa x pb x pc x pd) and a reward amount (calculated using the relationships in the risk/reward map of Figure 2). ERMi is the Expected Return Multiple, the probabilityweighted multiple on investment for each scenario. ERM (not shown) is the sum of the ERMi
across all scenarios, and is a measure of the expected value of the investment. Creating a Living DueDiligence Checklist
After setting up the initial model framework based on preliminary information about the synthetic biology company, we needed to gather more information from domain experts (See Sidebar 1) to assess factors in the model and validate the model’s structure (Step 5 in Figure 1). Because the model required numerical values for each factor, it enforced a certain rigor in our diligence process by making us evaluate each input and document why we chose those values. We translated the impact of technological details crucial to success into a common duediligence format. In this way, the model became a living dynamic duediligence checklist that we tailored to this specific company and industry. Just as Atul Gawande advocates checklists during complex surgical situations, developing a basic checklist for science investments could help investors avoid mistakes of 10
omission and focus on the most complex factors. Our understanding of the company and the synthetic biology domain grew as we developed the model and translated expert information into model inputs. Because the purpose of this paper is to discuss issues specific to investing in science companies, we focus here on the technical diligence process, and leave it to the reader to seek out existing excellent advice on evaluating other aspects of a company. Note that evaluating certain aspects, such as the quality of the team, may require customization for sciencebased companies. For example, Matthew Nordan emphasizes that for cleantech, a great team must include the core scientist who invented the technology. This might 11
differ in a software company where the innovation is in the business model rather than the technology.
10 Atul Gawande, “The Checklist: If something so simple can transform intensive care, what else can it do?”, December 2007, The New Yorker. http://www.newyorker.com/magazine/2007/12/10/thechecklist 11 Matthew Nordan, “What Makes a Great Cleantech Team?”, September 2012. http://mnordan.com/2012/09/24/whatmakesagreatcleantechteam/
6i
Sidebar 1: Leveraging Technical Expertise Technical domain experts are critical to better understand the potential risks and rewards for the company and industry. Experts should have a balance of optimism, skepticism, openness to new ideas, and significant fulltime industry experience. We found that previous fulltime industry experience is needed to assess the potential of the technology to be profitable and to identify possible pitfalls of manufacturing scaleup. One challenge with cuttingedge technologies is that there is often littletono demonstrated industrial validation, so it may be challenging to find experts with industry experience on particular technologies. In these cases, academic expertise alone is not enough; it must be complemented by expertise from the closest industries available (e.g., industries with similar technologies going after different markets, or analogous industries). In addition to domain experts, it is also essential to have technical generalists to bridge understanding between investment specialists and technical specialists.
For every model input, we assessed not only a base estimate but also a range from 'surprisingly low' to 'surprisingly high'. All due diligence for investments involves making estimates, no matter how good the experts involved are. For some factors, we may have high confidence, for others we may have low confidence and much uncertainty (see Sidebar 2 for more). We used the base case to estimate the expected value of the investment the expected return multiple (ERM). The range of estimates enabled us to perform a sensitivity analysis identifying which factors have the greatest influence on the return. These critical factors gave us insight into places to put more resources for due diligence or where company plans and operations should be carefully derisked.
Sidebar 2: Putting a Number on It Using ranges from “surprisingly low” to “surprisingly high” rather than single number estimates incorporates reallife uncertainty and enables a sensitivity analysis to highlight which factors might be most critical in an investment decision. Note that surprisingly low and surprisingly high estimates are not necessarily the same as realistic ‘pessimistic case’ and ‘optimistic case’ values. They are values that an expert would consider on the surprisingly low end or the surprisingly high end of possible estimates, and we use them to try to capture the broadest set of scenarios that might happen. Experts can provide their own ranges and the modelers can choose to combine them or to run separate models for each expert (computation is cheap). It is important to document every set of estimates to explain how they were obtained. Where factors are risk assessments (probabilities of success), they are measured on a range from 0 to 1, where 0 means ‘this cannot work’, 0.5 is a tossup and 1.0 means that risk is ‘certain to be overcome’. For example, if we are considering the skill set of the team, we may assign a value of 0.7 if the team has a good grasp of technical skills and competent leadership, but industrial experience from a different industry. (E.g. “overcome leadership risks” could be rated: surprisingly low = 0.3, base = 0.7, surprisingly high = 0.9.)
7i

Meanwhile, keep in mind that base estimates are used to calculate the expected value of the investment. Does a specific base estimate need closer scrutiny and deserve more investment of resources in due diligence?
Using our research on the company and its competitors, including materials from the company, industry/analyst reports, and additional resources, we developed an initial list of questions together with the domain experts. The model required answers to these questions (see example questions in Sidebar 3). We then conducted multiple meetings with the company and with our domain experts to gather information, each time generating followup questions until we had probed the main identifiable risk factors in enough depth to allow us to enter estimates into the model (Step 6 in Figure 1).
Sidebar 3: Knowing the Right Questions to Ask
Example Questions for Science Companies:
1. What is the technical concept? Does it hold up to scrutiny by experts? 2. Is the scientific basis for the profit model sound? In the ideal case, does the math work
out for this technology to make money considering costs of development and manufacturing?
3. What are the main risks? (technical and otherwise) What are the key milestones to derisk? What data exists and how strong is it?
4. What are the risks associated with successfully scaling up manufacturing from bench/prototype to commercial production? This is a common pitfall for many sciencebased companies. The technological process for making a prototype may be vastly 12
different from scaling up the manufacturing process to make thousands of the same item and may require a stepchange in technological development, not just an incremental expansion. There are significant risks if manufacturing cannot be performed rapidly enough at low enough cost. What experiments or milestones might derisk scaleup?
5. What is the intellectual property strategy? What IP has the company secured? How easy is it for a fast follower to compete?
6. Who are the main competitors? There may be “technical competitors” with similar technologies who may be pursuing different markets, and/or “market competitors” with different products but pursuing similar markets.
7. What is the technical advantage over competitors? How could it provide differentiation? What are the moats or barriers against competitors? (technical and otherwise?)
8. Is the team capable of the level of technical execution required? Is the original inventor part of the team?
12 “But, I think for manufacturing, very often people think of manufacturing as just some rote process of making copies. Which, actually, it isn't. Manufacturing is building the machine that makes the machine. If you think the machine is important, well, building the machine that makes the machine is also extremely important, and more often than not, what I've found is the manufacturing is harder than the original product. For example, at Tesla we can make one of a car very easily, but to make thousands of a car with high reliability and quality and where the cost is affordable, is extremely hard. I'd say, maybe 10 times harder than just making one prototype maybe more.” Elon Musk, Interview at MIT Aero/Astro Centennial Symposium, October 2014. http://webcast.amps.ms.mit.edu/fall2014/AeroAstro/indexFriPM.html
8i

Example Questions for Domains / Industries:
1. What is the industry clockspeed? (e.g., software is fast, pharmaceuticals is slow) How does industry speed influence timelines to product, revenue, exits?
2. How capital intensive is the industry? What level of investment is needed? Implications for competition, ability to sustain runway? Are there any trends to decrease costs of derisking? (e.g., falling cost of DNA synthesis)
3. What are examples of typical good investments in this domain and how often do these occur? Typical poor investments? What is the returnoninvestment landscape for the domain, and how does this affect investment strategy? (e.g., few, unlikely skyhigh returns vs. more modest returns with a higher probability of success)
4. How does the nature of IP in the domain affect strategy and outcomes? (e.g., compare software to pharmaceuticals)
5. Are there network effects? How do they influence market dynamics? (e.g., winnertakeall)
6. What is the rate of commoditization? What is the risk of being leapfrogged in a race to the bottom?
7. What are typical milestones or opportunities for exits?
Sizing Up Synthetic Biology Risks When we started, we didn’t know what the company’s greatest strengths or weaknesses might be. After a few rounds of discussion, we found that the company was well positioned to handle the technical challenges of creating engineered organisms at small, labscale volume. The greatest technical risk was whether it could successfully scale up manufacturing, which we found to be a key failure point for many synthetic biology companies. Working with domain experts, we established the company had solid data on strains it had created, and had developed a rich toolset and an organized, repeatable design process. We were surprised to find that unlike many sciencebased companies, the technical risk was relatively low because of the strength of their early data combined with competitors who had already demonstrated design, scaleup, and profitable sales of a plant extract replacement product. While the company had filed patents, it was not clear how much advantage this offers because it remains to be seen which key patents may dominate the synthetic biology space and which patents may offer little advantage due to potential workarounds. During the diligence process, we updated the value of technical risk factors based on new facts we learned and expert input. For example, expert due diligence helped explain how the company constrained its development by choosing a wellstudied organism, which lowered technical risk and increased our confidence in their ability to create the product. Each modification changed the outcome scenario ERM values (Figure 3), which helped direct the focus of our next questions to company and domain experts. We learned more about the company and industry by modeling not only the company itself but also its most significant competitor. After comparing their approaches, we found that common difficulties in this evolving domain were a) creating a commercial product that can be produced at scale, and b) creating significant technological advantage over and economic moats blocking competition.
9i

We gained further insights about the industry context by looking at the biggerpicture questions shown in Sidebar 3. It seems likely that the synthetic biology chemicals industry may settle into an oligopolistic market structure with a few dominant firms and many smaller niche players due to similarities with the traditional specialty chemicals and biotech industries which have such a market structure. Many synthetic biology companies are looking to manufacture similar chemical families, and most competitors are optimizing their processes for a certain parent biochemical pathway. A winnertakeall dynamic seems unlikely in this segment of synthetic biology given the variety of players, low technical differentiation, narrow moats, modest switching costs, and potential for IP workarounds. Gauging the Upside
Ultimately, the model produces a single number, the ERM, which measures the overall attractiveness of the investment and is the probabilityweighted average of all possible scenarios. It makes it possible to assess the relative impact of factors that have different units. ERM is a nextgeneration update to the rules of thumb VCs have been using for decades to try to maximize returns over a portfolio.
For example, there is the oftquoted heuristic to choose companies with a tenfold or greater return based on the assumption that onethird will fail, onethird will break even, and onethird will be winners. This guideline is easy to use, but turns out to be wrong much of the time. Instead of fixing assumptions about 13
probability of success, decision modeling estimates the chance of success for each startup individually. When performed across a portfolio, the model offers a tailored, integrated view of potential returns.
Under ideal circumstances with a perfectly chosen model structure and perfect base estimates for model factors the ERM would give us the actual expected value of the investment. Yet ERM depends on the assumptions behind the model structure and model inputs. We may be highly uncertain about some of these assumptions; the model can help us grapple with this uncertainty by allowing us to develop an intuitive feel for the system by changing input values and model structures and observing their effects on the value of the ERM. Thus, observing the distribution of ERM outcomes across many different sets of assumptions may be more useful than trying to develop a single perfect base case. In the model structure, we can accommodate different possible outcome scenarios, market scenarios, and exit scenarios that affect potential returns. We considered:
1) Using base case assumptions, is the expected return high or low? What is the ERM in an optimistic scenario? Are these numbers in line with typical values for this industry? If not, why not? Are the model assumptions suspect, or is the company truly an outlier?
2) Try changing the assumptions based on new insights or considered alternatives. Should the base case assumptions be changed? Why or why not?
3) Perform a sensitivity analysis based on the ERM to identify which factors have the highest impact on returns. What are the risk factors that might cause failure? If returns are low, what are assumptions that, if changed, might make the investment viable?
While ERM summarizes the expected value of the investment, the downside of a single value output is that you lose information about the likelihood of different scenarios. Thus, looking at the probabilities and
13 Seth Levine, “Venture Outcomes are Even More Skewed Than You Think”, http://www.sethlevine.com/archives/2014/08/ventureoutcomesareevenmoreskewedthanyouthink.html_
10i

rewards across scenarios is still important (see Figure 3), especially for VCs who may be investing in small numbers of companies. Identifying the Biggest Risks
To identify which factors have the most impact on returns, we performed a sensitivity analysis by varying one factor at a time across the lowtohigh range while keeping all other factors at their base case level. Sensitivity analysis is another key model output that goes handinhand with ERM and allows us to prioritize the diligence checklist.
Figure 4:Critical factors in the sensitivity analysis that have the most effect on the Expected Return Multiple (ERM): The width of the bar shows the range of resulting ERM values when that input factor ranges from low to high. The input factors with the widest bars are those with the greatest potential
impact on the ERM. Factors directly affecting valuation at exit had the most influence on returns, as seen in Figure 4. These included revenue in the exit year and any debt at that point, as well as market conditions affecting multipliers used for valuation. Similarly, factors affecting investor equity and its dilution were critical, including premoney valuation, investment this round, and percentage of new shares in subsequent rounds. On the technology front, the highest ranked factors were: cost/margin, commercial product, and R&D costs (Figure 4). The attractive cost/margin factor is critical for synthetic biology to replace existing manufacturing methods, and is heavily determined by the technology itself. The high rank of the commercial product factor is consistent with our diligence findings that the greatest technological risk was likely in scaling up from bench to commercial volumes. And finally, R&D costs in the exit year were important because they directly affect exit year earnings, which affect valuation. For a synthetic biology company like the test company, maintaining a strong intellectual property position via R&D is critical to staying competitive in the long term. However, the model emphasized that R&D costs can also impact the ability to raise more capital via an IPO. Therefore, the company will need to balance R&D spending with demonstrating strong earnings for a successful IPO.
11i
By identifying the most significant technical risk factors, we were able to identify the areas that most deserved investment of duediligence resources. For example, we devoted additional resources to investigate manufacturing scaleup. Our domain experts pressed for more detailed technical information during the duediligence process. The company was able to demonstrate that they had invested carefully in solutions that would derisk scaleup to commercial quantities, both by working with a wellknown largescale production facility and by hiring an expert with ample experience dealing with precisely that issue. Similarly, for each prioritized factor on the checklist, we were able to check which riskmitigation efforts the company had put in place for that technical risk. In the end, our model was actually the culmination of several preliminary models taking the initial model framework and iteratively customizing it for the individual company throughout the duediligence process. We started with a more typical default revenue model for an early startup (Figure 2) and ended up with a model (Figures 4 and 5) that spoke specifically to the technical and financial risks of the test company. These different phases of modeling could almost be thought of as separate models that enable a more nimble, foxlike approach to decision analysis. 14
Seeing How Synthetic Biology Stacks Up We compared our sensitivity analysis results to those from our reference example, Korver’s decisionanalysis model for etextbook company Inkling. (Figure 5). Any comparison must acknowledge the challenge that the models were created with different methods and assumptions. However, we found broad similarities and differences between the different domains (software vs. synthetic biology) reflected in the models.
Figure 5:Comparing sensitivity analysis output for an etextbook company from the literature (Clint
Korver, left) with our results for a synthetic biology company (right)
14 This is a reference to the fox / hedgehog categorization of thinking styles: ”The fox knows many things, the hedgehog knows one big thing.” Philip Tetlock has done research showing that people with foxtype thinking, who are selfcritical and open to simultaneously considering many angles on a problem, had better judgement about the longterm future. Tetlock, “Defining and Assessing Good Judgement” http://www.sas.upenn.edu/tetlock/publications
12i
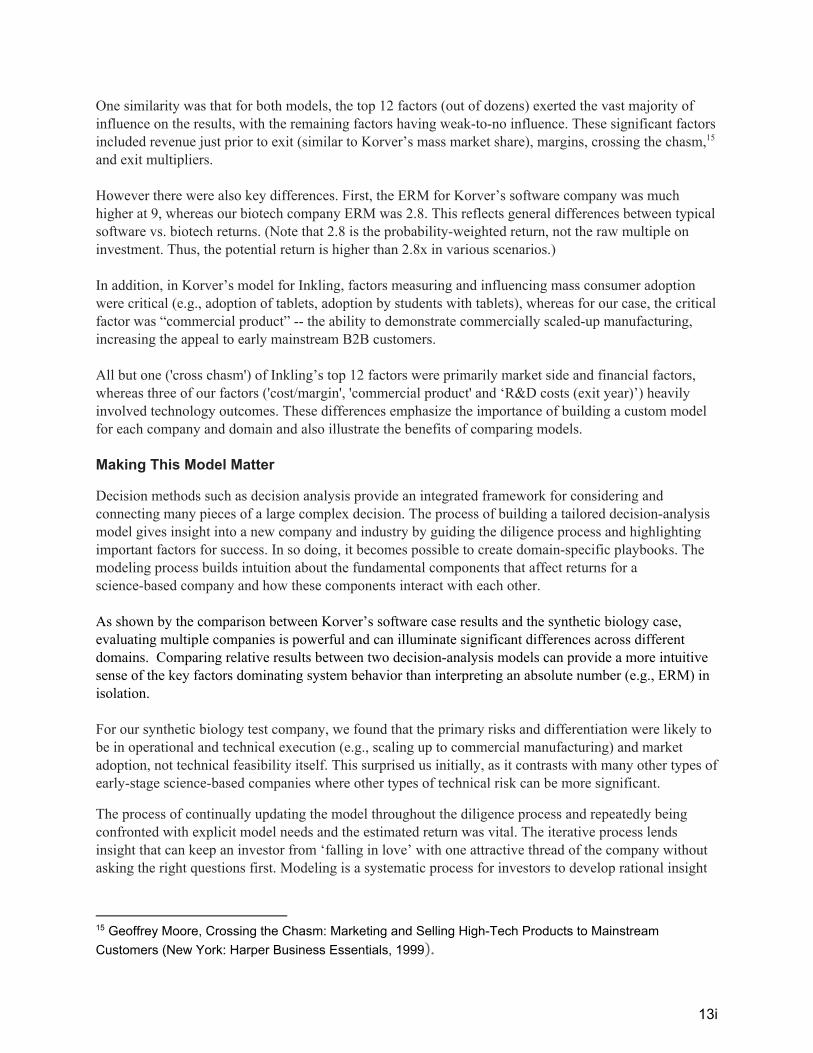
One similarity was that for both models, the top 12 factors (out of dozens) exerted the vast majority of influence on the results, with the remaining factors having weaktono influence. These significant factors included revenue just prior to exit (similar to Korver’s mass market share), margins, crossing the chasm, 15
and exit multipliers. However there were also key differences. First, the ERM for Korver’s software company was much higher at 9, whereas our biotech company ERM was 2.8. This reflects general differences between typical software vs. biotech returns. (Note that 2.8 is the probabilityweighted return, not the raw multiple on investment. Thus, the potential return is higher than 2.8x in various scenarios.) In addition, in Korver’s model for Inkling, factors measuring and influencing mass consumer adoption were critical (e.g., adoption of tablets, adoption by students with tablets), whereas for our case, the critical factor was “commercial product” the ability to demonstrate commercially scaledup manufacturing, increasing the appeal to early mainstream B2B customers. All but one ('cross chasm') of Inkling’s top 12 factors were primarily market side and financial factors, whereas three of our factors ('cost/margin', 'commercial product' and ‘R&D costs (exit year)’) heavily involved technology outcomes. These differences emphasize the importance of building a custom model for each company and domain and also illustrate the benefits of comparing models. Making This Model Matter
Decision methods such as decision analysis provide an integrated framework for considering and connecting many pieces of a large complex decision. The process of building a tailored decisionanalysis model gives insight into a new company and industry by guiding the diligence process and highlighting important factors for success. In so doing, it becomes possible to create domainspecific playbooks. The modeling process builds intuition about the fundamental components that affect returns for a sciencebased company and how these components interact with each other. As shown by the comparison between Korver’s software case results and the synthetic biology case, evaluating multiple companies is powerful and can illuminate significant differences across different domains. Comparing relative results between two decisionanalysis models can provide a more intuitive sense of the key factors dominating system behavior than interpreting an absolute number (e.g., ERM) in isolation. For our synthetic biology test company, we found that the primary risks and differentiation were likely to be in operational and technical execution (e.g., scaling up to commercial manufacturing) and market adoption, not technical feasibility itself. This surprised us initially, as it contrasts with many other types of earlystage sciencebased companies where other types of technical risk can be more significant.
The process of continually updating the model throughout the diligence process and repeatedly being confronted with explicit model needs and the estimated return was vital. The iterative process lends insight that can keep an investor from ‘falling in love’ with one attractive thread of the company without asking the right questions first. Modeling is a systematic process for investors to develop rational insight
15 Geoffrey Moore, Crossing the Chasm: Marketing and Selling HighTech Products to Mainstream Customers (New York: Harper Business Essentials, 1999).
13i
and gain confidence in their instincts, especially when making decisions about opportunities in science and technology domains beyond IT. Exploring Future Directions A useful validation for our method would be to apply it to historical example cases, companies that have a known track record and outcome. In addition, application of decision analysis to examples in additional domains (beyond synthetic biology and software) could point out further requirements, and validate and solidify the methodology for its application in various domains. Other future efforts could include developing the decisionanalysis model toward portfoliolevel analysis by evaluating all companies across a portfolio and combining those models quantitatively. Examples include: 1) How do the fortunes of a specific company affect the portfolio overall?; 2) How resilient is the portfolio to various changes in the markets?; and 3) How to design portfolio distributions across different industries and markets? While the present work focused exclusively on return on investment, decision analysis is a more general tool that could also be used to explore the effects of decisions on multiple simultaneous goals, such as impact on industry and society. In addition to decision analysis, complementary tools could strengthen the approach. Using multiple lenses is often more robust for complex problems. Developing industry analogies could be one tool to assess potential of a new industry. For example, the evolution of the chemical industry is analogous to the possible development of the synthetic biology industry, so studying that history expands the range of scenarios considered when assessing market potential in synthetic biology. We recommend developing frameworks to help identify good industry analogies, to make sure that any comparison is truly useful. All of these investigations may feed into the development of more robust, domainspecific playbooks to guide sciencebased investments. Letting a Thousand Playbooks Flourish This modeling framework is a starting point for those not yet investing in emerging science domains and will contribute to creating an even more open and robust ecosystem for technological investments. Supporting the development of technology that will make quantumleap discoveries is critical to humanity flourishing now and into the future. We look forward to working with the investment community to create more robust playbooks that take us beyond software. Only by addressing our most audacious opportunities and vexing challenges can we positively impact billions of people for generations to come.
14i
Recommended