The Place of Migrants in Contemporary Australia A Summary Report
This report was prepared by: Strategic Policy, Evaluation and Research Branch Department of Immigration and Border Protection July 2014
Comments about this paper and requests for further copies can be emailed to: [email protected]
Page 2 of 39
Table of Contents The Place of Migrants in Contemporary Australia .............................................................................. 1
A Summary Report ............................................................................................................................... 1
Table of Contents ................................................................................................................................. 3
List of Figures .......................................................................................................................................... 4
List of Tables ........................................................................................................................................... 6
Executive Summary ................................................................................................................................ 7
Introduction.............................................................................................................................................. 8
Background .......................................................................................................................................... 8
Underpinnings and Assumptions .......................................................................................................... 8
Demographics ......................................................................................................................................... 9
Source Regions .................................................................................................................................... 9
Families .............................................................................................................................................. 11
Geographical Distribution ................................................................................................................... 12
Labour Market and Economy ................................................................................................................ 15
Labour Force Participation ................................................................................................................. 15
Industry of Employment ...................................................................................................................... 18
Human Capital ...................................................................................................................................... 26
Education of Migrants ......................................................................................................................... 26
Children of Migrants ........................................................................................................................... 27
Returns on Education ......................................................................................................................... 28
Languages Spoken ............................................................................................................................. 29
Social Contribution ................................................................................................................................ 30
Citizenship .......................................................................................................................................... 30
Community Participation ..................................................................................................................... 34
Discrimination and Acceptance .......................................................................................................... 37
References ............................................................................................................................................ 39
Page 3 of 39
List of Figures Figure 1 Overseas born population, by region of birth, Census 2011 ......................................... 9
Figure 2 Overseas born population by source region and year of arrival to Australia ............ 10
Figure 3 Age distribution, Australian born and non-Australian born, Census 2011 ................. 10
Figure 4 Distribution of persons who arrived on Skill Stream visas, by states and territories, compared against total population distribution in 2011 (ABS, 2014b) ....................................... 14
Figure 5 Labour force status by place of birth, Census 2011 ...................................................... 16
Figure 6 Year of arrival in Australia and Labour Force Status of recent migrants, Census 2011 ...................................................................................................................................................... 17
Figure 7 Index of Dissimilarity of Industry of Employment, Australian born and overseas born workers ................................................................................................................................................ 19
Figure 8 Industry profiles of Australian born workers compared to those born in selected regions ................................................................................................................................................. 21
Figure 9 Top 20 migrant source regions by percentage of persons self-employed and contributing to family businesses, compared to Australian born workers (ranked by business ownership) ........................................................................................................................................... 23
Figure 10 Major occupations in which migrants work (at least one per cent of migrants) compared to Australian born workers ............................................................................................. 24
Figure 11 Top 20 occupations (with a workforce of 10,000 or more) in which migrants are over-represented ................................................................................................................................ 25
Figure 12 Skill level of occupation by visa stream (ABS, 2014b) ............................................... 25
Figure 13 Educational levels by place of birth ............................................................................... 26
Figure 14 Educational level achieved by place of birth ................................................................ 26
Figure 15 Secondary education completion rates of Australian born persons by the birthplace of their parents, Census 2011 ........................................................................................ 27
Figure 16 Highest post-secondary qualification attained by Australian born persons by the birthplace of their parents, Census 2011 ........................................................................................ 27
Figure 17 Weekly income by birthplace and birthplace of parents and post-school educational achievements ................................................................................................................ 28
Figure 18 Citizenship rates for overseas born residents by their arrival date, Census 2011 . 31
Figure 19 Citizenship take-up by visa stream and arrival date (ABS, 2014b) .......................... 31
Figure 20 Citizenship take-up by region of birth, overseas born Australian residents, 2011 . 32
Figure 21 Actual citizenship rates and time standardised citizenship rates by region of origin .............................................................................................................................................................. 33
Figure 22 Top ten source regions by English language proficiency and citizenship rates ..... 34
Figure 23 Participation in sport/physical activity or attendance at sporting events by birthplace and language proficiency, GSS 2010 ........................................................................... 35
Figure 24 Attendance at selected cultural institutions and events, by birthplace and language proficiency, GSS 2010 ....................................................................................................................... 35
Figure 25 Socialising by birthplace and language proficiency, GSS 2010 ................................ 36
Figure 26 Attendance at selected cultural institutions and events, by birthplace and education attainment, GSS 2010 ..................................................................................................... 36
Page 4 of 39

Figure 27 Attitudes towards Australia’s migrant intake, Scanlon foundation surveys 2007–2013 ...................................................................................................................................................... 37
Figure 28 Situations in which survey respondents reported having been subject to discrimination due to their ethnic origin .......................................................................................... 38
Page 5 of 39
List of Tables Table 1 Birthplace and birthplace of parents, Australian residents, Census 2011 .................... 9
Table 2 Migrant and non-migrant families, by family composition, 2009–10 ............................ 11
Table 3 Migrant and non-migrant persons by their family/household type characteristics, 2009–10 ............................................................................................................................................... 12
Table 4 Distribution of all overseas-born and recent arrivals (2007–11) within States and major urban areas, compared against total population distribution ............................................ 13
Table 5 Industry of employment as a percentage of total population, Australian-born and key migrant groups, Census 2011 .......................................................................................................... 18
Table 6 Top 10 industry sectors in which migrants are employed (excluding those smaller than 10,000) by Australian born and non-Australian born workforce, Census 2011 ............... 22
Table 7 Top five industries (with more than 10,000 workers) in which more of the workforce was born overseas than in Australia, by Australian born and non-Australian born workforce .............................................................................................................................................................. 22
Table 8 Languages which are spoken at home by more than 0.5% of the population, by Australian or non-Australian born, Census 2011 .......................................................................... 29
Table 9 Selected questions and responses on attitudes to other cultures ................................ 38
Page 6 of 39

Executive Summary Migrants are a major component of the Australian population. In 2011, nearly 5.3 million Australian residents reported being born overseas (more than 26 per cent of the population at the time). A further 1.8 million (8 per cent) reported that both of their parents were born overseas and 2.2 million (10 per cent) report one of their parents as overseas born. Collectively these three groups account for nearly half of the population.
Our diversity began with Australia’s First Peoples and has flourished through successive waves of new migrants, each adding something to the dynamic face of our country. For most of Australia’s history since European settlement, migrants from Europe and specifically the United Kingdom have been the dominant arrival group. This trend continued well into the mid-late 1900s. In recent decades however Asia has become the main source region for migrants, particularly from Southern Asia (India, Sri Lanka, Bangladesh, Pakistan, Nepal and Bhutan) and Chinese Asia (China, Mongolia, Hong Kong and Taiwan).
Contemporary Australia is a diverse nation. Our cultural, linguistic and religious diversity is at the heart of our national identity and intrinsic to our history and character. Migrants are thus a key element of Australia’s economy and social life. While different groups of migrants tend to be engaged with different sectors of the economy and different aspects of social life, there are few areas of Australian life in which migrants are not involved.
In terms of their contribution, the data suggests that migrants and their children contribute significantly to the Australian economy. We see this played out in the age-old desire of parents working hard to enable a better life for their children, and validated in departmental surveys which show that after economic considerations, a better future for their family is the main reason for migration among skilled migrants.1 Data also shows that the children of migrants achieve high level qualifications when compared to the general population. Many migrants have high employment and education rates and strong English language skills, however there are some migrants who require a greater level of support and responsiveness from Government in order to participate fully in Australia’s economic and social life.
There is widespread recognition of the positive contribution that migrants play in the economic and social wellbeing of Australian life. However, tolerance and acceptance of migrants is still an issue among some sectors of the Australian population. As such, there remain challenges for policy makers to ensure that new migrants are able to successfully adapt and integrate with Australian society now and into the future.
1 Main motives for migration to Australia are reported in the department’s third longitudinal survey of immigrants to Australia. See: www.immi.gov.au/media/research/lsia3/settlement.htm
Page 7 of 39
Introduction Background Migrants are a major component of the Australian population and increasingly so. Migration has contributed more to population growth in Australia than is occurring through natural increase every year since 2006 (ABS, 2014a). This report provides an overview of the place that migrants have in the contemporary Australian population. It seeks to shed light on some of the ways in which migrants fit into and contribute to selected aspects of contemporary Australia, where they are more or less prominent, and how some specific migrant cohorts differ. The key fields of focus are:
• the demography of the population, encompassing age, family composition, source region and geographical distribution;
• involvement with the economy, particularly in terms of labour force participation and the range of industries in which they tend to be employed;
• the human capital of migrants including their educational and language attributes and their children; and
• social issues encompassing citizenship, volunteering, community participation, experiences and attitudes towards migrants.
The report is not meant to be comprehensive in its coverage of these areas but provides a snapshot of key dimensions of contemporary Australia, and a glimpse at the ways migrants fit into those dimensions.
Underpinnings and Assumptions The report relies largely upon data collected in the 2011 Australian Census (ABS, 2011). Other sources of information are drawn upon where applicable and are clearly noted. Unless otherwise specified, all references to migrants in this report are based upon place of birth reported in the Census, regardless of whether they were born to Australian parents overseas, grew up in Australia or even whether they have become citizens. For the purposes of this report, anyone born overseas is a migrant and anyone born in Australia is not a migrant.
Unless otherwise noted, analysis of migrants by their birthplace is conducted at the ABS regional level (2 digit) rather than by individual countries. Australia has residents who have been born in almost every country on earth, thus detailed analysis at the individual country level was not possible. When appropriate however, individual countries are identified to make particular points.
Page 8 of 39
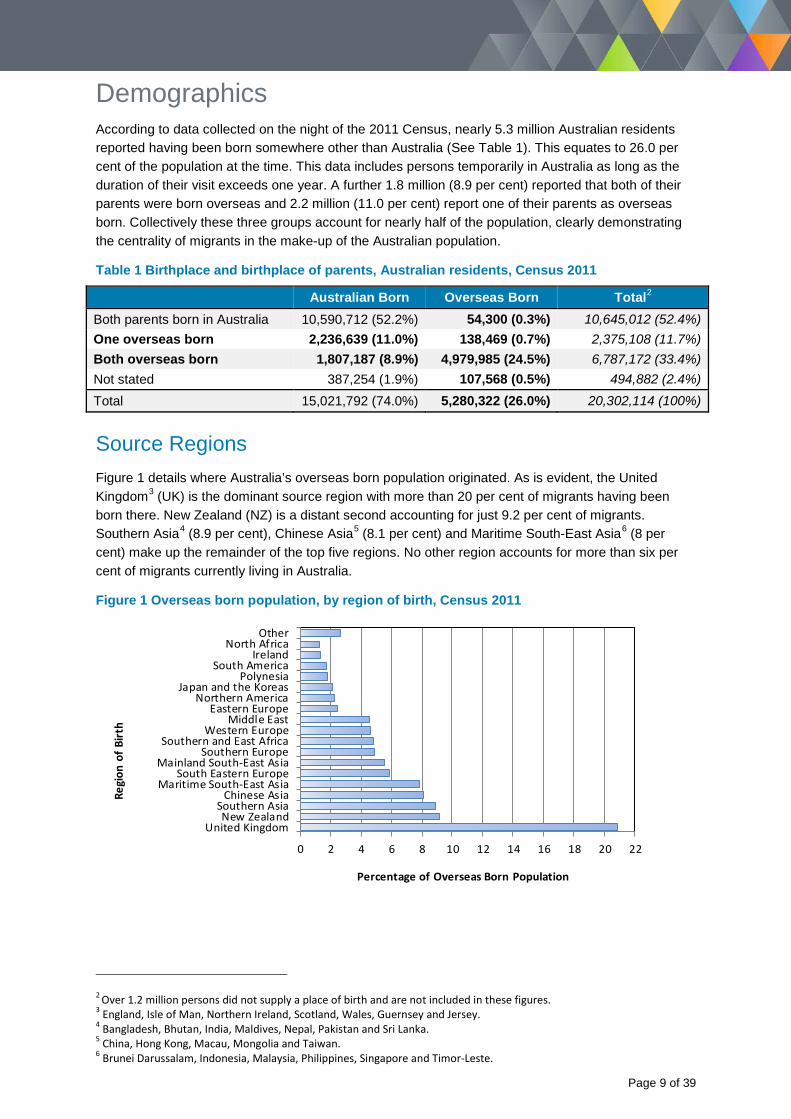
Demographics According to data collected on the night of the 2011 Census, nearly 5.3 million Australian residents reported having been born somewhere other than Australia (See Table 1). This equates to 26.0 per cent of the population at the time. This data includes persons temporarily in Australia as long as the duration of their visit exceeds one year. A further 1.8 million (8.9 per cent) reported that both of their parents were born overseas and 2.2 million (11.0 per cent) report one of their parents as overseas born. Collectively these three groups account for nearly half of the population, clearly demonstrating the centrality of migrants in the make-up of the Australian population.
Table 1 Birthplace and birthplace of parents, Australian residents, Census 2011
Australian Born Overseas Born Total2 Both parents born in Australia 10,590,712 (52.2%) 54,300 (0.3%) 10,645,012 (52.4%) One overseas born 2,236,639 (11.0%) 138,469 (0.7%) 2,375,108 (11.7%) Both overseas born 1,807,187 (8.9%) 4,979,985 (24.5%) 6,787,172 (33.4%) Not stated 387,254 (1.9%) 107,568 (0.5%) 494,882 (2.4%) Total 15,021,792 (74.0%) 5,280,322 (26.0%) 20,302,114 (100%)
Source Regions Figure 1 details where Australia’s overseas born population originated. As is evident, the United Kingdom3 (UK) is the dominant source region with more than 20 per cent of migrants having been born there. New Zealand (NZ) is a distant second accounting for just 9.2 per cent of migrants. Southern Asia4 (8.9 per cent), Chinese Asia5 (8.1 per cent) and Maritime South-East Asia6 (8 per cent) make up the remainder of the top five regions. No other region accounts for more than six per cent of migrants currently living in Australia.
Figure 1 Overseas born population, by region of birth, Census 2011
0 2 4 6 8 10 12 14 16 18 20 22
United KingdomNew Zealand
Southern AsiaChinese Asia
Maritime South-East AsiaSouth Eastern Europe
Mainland South-East AsiaSouthern Europe
Southern and East AfricaWestern Europe
Middle EastEastern Europe
Northern AmericaJapan and the Koreas
PolynesiaSouth America
IrelandNorth Africa
Other
Percentage of Overseas Born Population
Regi
on o
f Birt
h
2 Over 1.2 million persons did not supply a place of birth and are not included in these figures.
3 England, Isle of Man, Northern Ireland, Scotland, Wales, Guernsey and Jersey. 4 Bangladesh, Bhutan, India, Maldives, Nepal, Pakistan and Sri Lanka. 5 China, Hong Kong, Macau, Mongolia and Taiwan. 6 Brunei Darussalam, Indonesia, Malaysia, Philippines, Singapore and Timor-Leste.
Page 9 of 39

Figure 2 reveals the source regions of the current overseas born population by their year of arrival in Australia. Clear differences are evident across the groups. For example, those who arrived from the UK or elsewhere in Europe are more likely to have been in Australia since before 1970. Indeed, 30 per cent of all overseas born residents who arrived prior to 1990 were UK born. In contrast, those who came from Chinese or Southern Asian countries are much more likely to be very recent arrivals. Of the 1.6 million Australian residents who arrived in the decade ending 2010, only 200,000 (13 per cent) came from the UK. While this is the second largest source region for the period, it is significantly fewer than the almost 300,000 who arrived from Southern Asia, which has risen quickly to become the most dominant source region. India accounts for the majority of the Southern Asian cohort, over 80 per cent of whom arrived through the Migration Programme’s Skill Stream.
Figure 2 Overseas born population by source region and year of arrival to Australia
0
50000
100000
150000
200000
250000
300000
350000
Num
ber o
f Arr
ival
s
Pre 1941 1941-1950 1951-1960 1961-19701971-1980 1981-1990 1991-2000 2001-2010
Age
Figure 3 provides an age profile of the Australian population demarcated by Australian and overseas born persons. As the graph reveals, migrants account for over a third of the population in almost all age groups from 25 years and up. Migrants are thus a major potential contributor to the current labour force.
Figure 3 Age distribution, Australian born and non-Australian born, Census 2011
1,500,000 1,000,000 500,000 0 500,000
0-4 years5-9 years
10-14 years15-19 years20-24 years25-29 years30-34 years35-39 years40-44 years45-49 years50-54 years55-59 years60-64 years65-69 years70-74 years75-79 years80-84 years85-89 years90-94 years95-99 years100 years + Not Australian Born
Australian Born
Page 10 of 39
Whilst there is an apparent under-representation of overseas born persons in the younger age groups (up to 20 years of age), as noted earlier many Australian born persons have overseas born parents. Indeed Census data indicates that almost 20 per cent of those aged less than 20 years have two parents born overseas and a further 16 per cent have one overseas born parent. Additionally, many recent arrivals in the 20 to 30 year age ranges are likely to have migrated to Australia without children but may have children born in Australia in the future. The children of these migrants will thus be major contributors to the future labour force just as their parents are contributing to the current labour force.
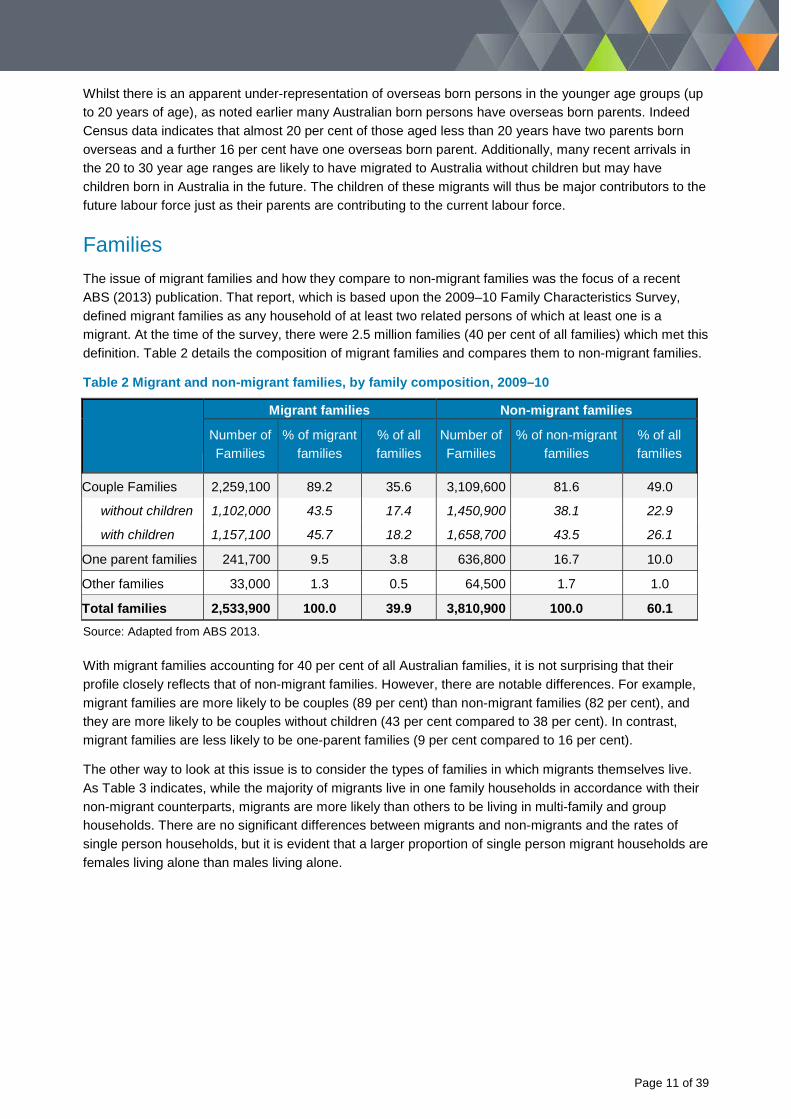
Families The issue of migrant families and how they compare to non-migrant families was the focus of a recent ABS (2013) publication. That report, which is based upon the 2009–10 Family Characteristics Survey, defined migrant families as any household of at least two related persons of which at least one is a migrant. At the time of the survey, there were 2.5 million families (40 per cent of all families) which met this definition. Table 2 details the composition of migrant families and compares them to non-migrant families.
Table 2 Migrant and non-migrant families, by family composition, 2009–10
Migrant families Non-migrant families
Number of Families
% of migrant families
% of all families
Number of Families
% of non-migrant families
% of all families
Couple Families 2,259,100 89.2 35.6 3,109,600 81.6 49.0
without children 1,102,000 43.5 17.4 1,450,900 38.1 22.9
with children 1,157,100 45.7 18.2 1,658,700 43.5 26.1
One parent families 241,700 9.5 3.8 636,800 16.7 10.0
Other families 33,000 1.3 0.5 64,500 1.7 1.0
Total families 2,533,900 100.0 39.9 3,810,900 100.0 60.1
Source: Adapted from ABS 2013.
With migrant families accounting for 40 per cent of all Australian families, it is not surprising that their profile closely reflects that of non-migrant families. However, there are notable differences. For example, migrant families are more likely to be couples (89 per cent) than non-migrant families (82 per cent), and they are more likely to be couples without children (43 per cent compared to 38 per cent). In contrast, migrant families are less likely to be one-parent families (9 per cent compared to 16 per cent).
The other way to look at this issue is to consider the types of families in which migrants themselves live. As Table 3 indicates, while the majority of migrants live in one family households in accordance with their non-migrant counterparts, migrants are more likely than others to be living in multi-family and group households. There are no significant differences between migrants and non-migrants and the rates of single person households, but it is evident that a larger proportion of single person migrant households are females living alone than males living alone.
Page 11 of 39
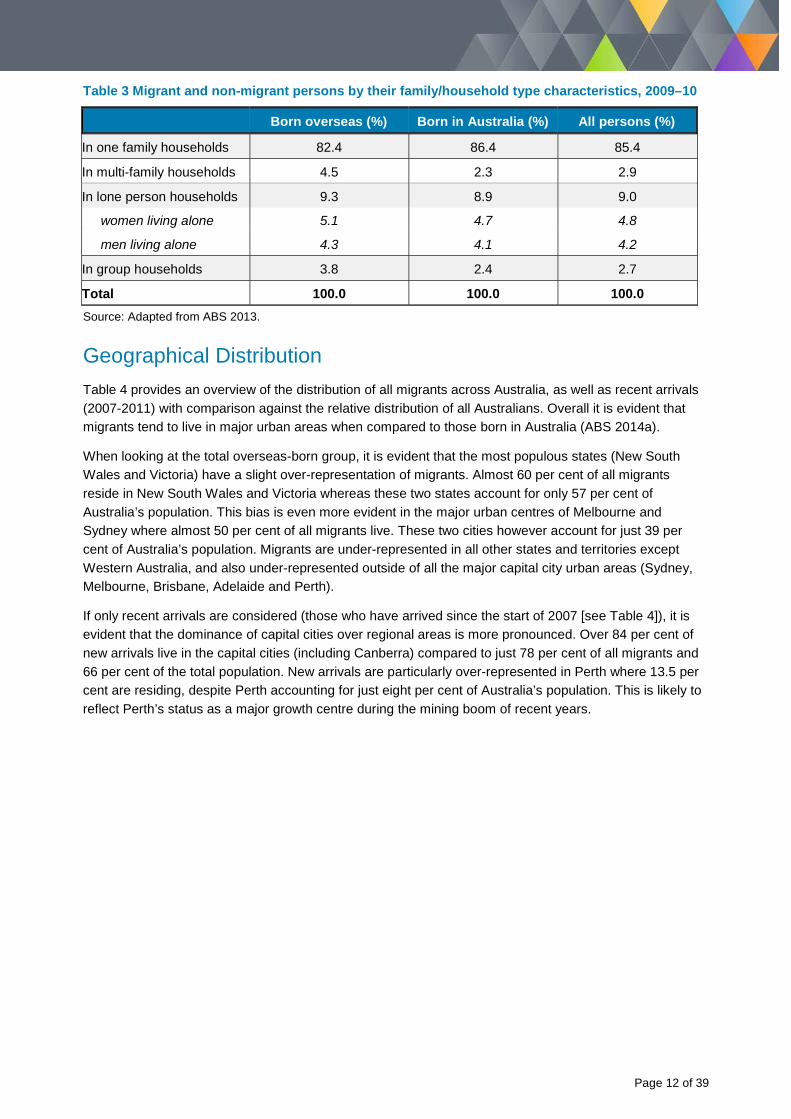
Table 3 Migrant and non-migrant persons by their family/household type characteristics, 2009–10
Born overseas (%) Born in Australia (%) All persons (%) In one family households 82.4 86.4 85.4 In multi-family households 4.5 2.3 2.9 In lone person households 9.3 8.9 9.0
women living alone 5.1 4.7 4.8 men living alone 4.3 4.1 4.2
In group households 3.8 2.4 2.7 Total 100.0 100.0 100.0 Source: Adapted from ABS 2013.
Geographical Distribution Table 4 provides an overview of the distribution of all migrants across Australia, as well as recent arrivals (2007-2011) with comparison against the relative distribution of all Australians. Overall it is evident that migrants tend to live in major urban areas when compared to those born in Australia (ABS 2014a).
When looking at the total overseas-born group, it is evident that the most populous states (New South Wales and Victoria) have a slight over-representation of migrants. Almost 60 per cent of all migrants reside in New South Wales and Victoria whereas these two states account for only 57 per cent of Australia’s population. This bias is even more evident in the major urban centres of Melbourne and Sydney where almost 50 per cent of all migrants live. These two cities however account for just 39 per cent of Australia’s population. Migrants are under-represented in all other states and territories except Western Australia, and also under-represented outside of all the major capital city urban areas (Sydney, Melbourne, Brisbane, Adelaide and Perth).
If only recent arrivals are considered (those who have arrived since the start of 2007 [see Table 4]), it is evident that the dominance of capital cities over regional areas is more pronounced. Over 84 per cent of new arrivals live in the capital cities (including Canberra) compared to just 78 per cent of all migrants and 66 per cent of the total population. New arrivals are particularly over-represented in Perth where 13.5 per cent are residing, despite Perth accounting for just eight per cent of Australia’s population. This is likely to reflect Perth’s status as a major growth centre during the mining boom of recent years.
Page 12 of 39

Table 4 Distribution of all overseas-born and recent arrivals (2007–11) within States and major urban areas, compared against total population distribution
All Overseas-Born
(%) Recent Arrivals (2007–11)
(%) Total Population
(%) New South Wales 33.5 28.5 32.2
Sydney 27.1 25.2 20.4 Rest of New South Wales 6.3 3.3 11.7
Victoria 25.9 26.7 24.9 Melbourne 22.7 24.8 18.6 Rest of Victoria 3.3 1.9 6.3
Queensland 17.6 19.4 20.1 Brisbane 9.5 11.8 9.6 Rest of Queensland 8.1 7.5 10.5
South Australia 6.6 6.5 7.4 Adelaide 5.6 6.1 5.7 Rest of South Australia 0.9 0.5 1.7
Western Australia 12.8 15.4 10.4 Perth 10.7 13.5 8.0 Rest of Western Australia 2.0 1.9 2.4
Tasmania 1.3 0.9 2.3 Hobart 0.6 0.5 1.0 Rest of Tasmania 0.7 0.4 1.3
Northern Territory 0.8 0.9 1.0 Darwin 0.6 0.7 0.6 Rest of Northern Territory 0.2 0.3 0.4
Australian Capital Territory 1.6 1.7 1.7 Total 100.0 100.0 100.0
In part then, these distributions are influenced by the contemporary geography of economic activity in Australia. For example, as the ABS (2014a) observes, suburbs which contain or are adjacent to universities tend to have higher proportions of migrants living in them, many of which are likely to be students.
Page 13 of 39
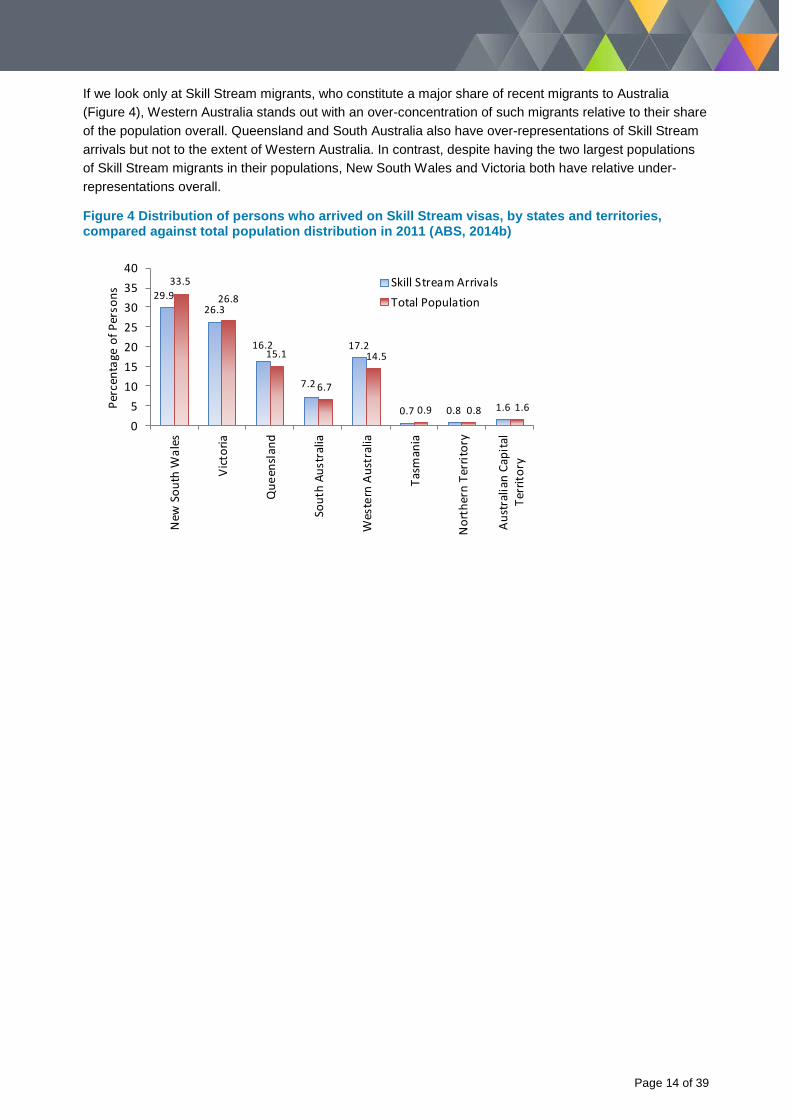
If we look only at Skill Stream migrants, who constitute a major share of recent migrants to Australia (Figure 4), Western Australia stands out with an over-concentration of such migrants relative to their share of the population overall. Queensland and South Australia also have over-representations of Skill Stream arrivals but not to the extent of Western Australia. In contrast, despite having the two largest populations of Skill Stream migrants in their populations, New South Wales and Victoria both have relative under-representations overall.
Figure 4 Distribution of persons who arrived on Skill Stream visas, by states and territories, compared against total population distribution in 2011 (ABS, 2014b)
29.926.3
16.2
7.2
17.2
0.7 0.8 1.6
33.5
26.8
15.1
6.7
14.5
0.9 0.8 1.6
05
10152025303540
New
Sou
th W
ales
Vict
oria
Que
ensl
and
Sout
h Au
stra
lia
Wes
tern
Aus
tral
ia
Tasm
ania
Nor
ther
n Te
rrito
ry
Aust
ralia
n Ca
pita
lTe
rrito
ry
Perc
enta
ge o
f Per
sons
Skill Stream ArrivalsTotal Population
Page 14 of 39
Labour Market and Economy Given that the vast majority of migrants currently living in Australia are in the working age range of between 20 and 65 years, it stands that migrants are a key contributor to Australia’s current labour force. As such, where and how migrants fit into the current labour market and the different economic sectors into which they contribute are examined here.
At the time of the 2011 Census there were just over 5 million migrants potentially available for inclusion in the Australian labour force. This equates to 31 per cent of the total potential labour force of 16.4 million residents aged over 15 years of age.
Labour Force Participation In terms of participation rates, there are few major differences between the Australian-born and migrant populations. Although there is a higher proportion of the migrant population not in the labour force in comparison to the Australian born population (39.6 per cent as opposed to 32.8 per cent), this is due to the older age profile of the overseas-born. Nineteen per cent of overseas-born residents are over 65 years of age and many of this group would already have retired from the workforce. In contrast, just 12 per cent of Australian born residents are aged over 65 years. Amongst those in the labour force, close to 60 per cent of both groups work full time. The migrant population has a slightly higher unemployment rate (6.5 as opposed to 5.3 per cent) while more Australian born than migrants are employed part-time.
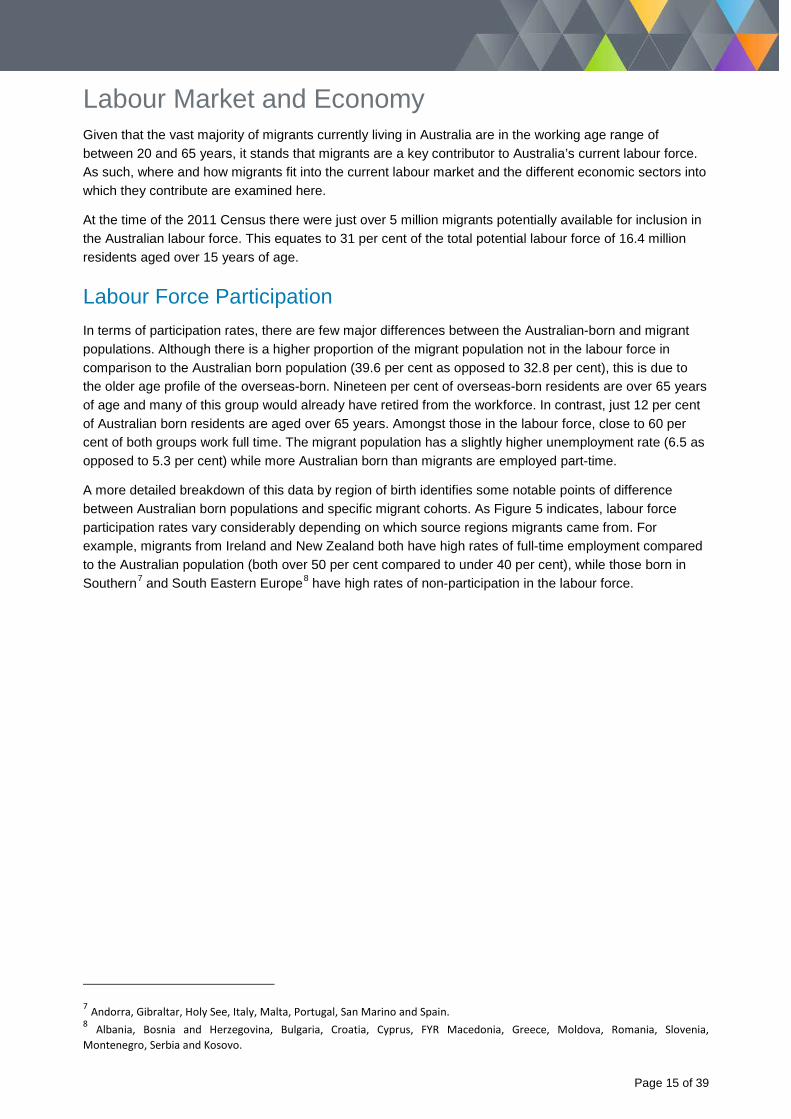
A more detailed breakdown of this data by region of birth identifies some notable points of difference between Australian born populations and specific migrant cohorts. As Figure 5 indicates, labour force participation rates vary considerably depending on which source regions migrants came from. For example, migrants from Ireland and New Zealand both have high rates of full-time employment compared to the Australian population (both over 50 per cent compared to under 40 per cent), while those born in Southern7 and South Eastern Europe8 have high rates of non-participation in the labour force.
7 Andorra, Gibraltar, Holy See, Italy, Malta, Portugal, San Marino and Spain. 8 Albania, Bosnia and Herzegovina, Bulgaria, Croatia, Cyprus, FYR Macedonia, Greece, Moldova, Romania, Slovenia, Montenegro, Serbia and Kosovo.
Page 15 of 39
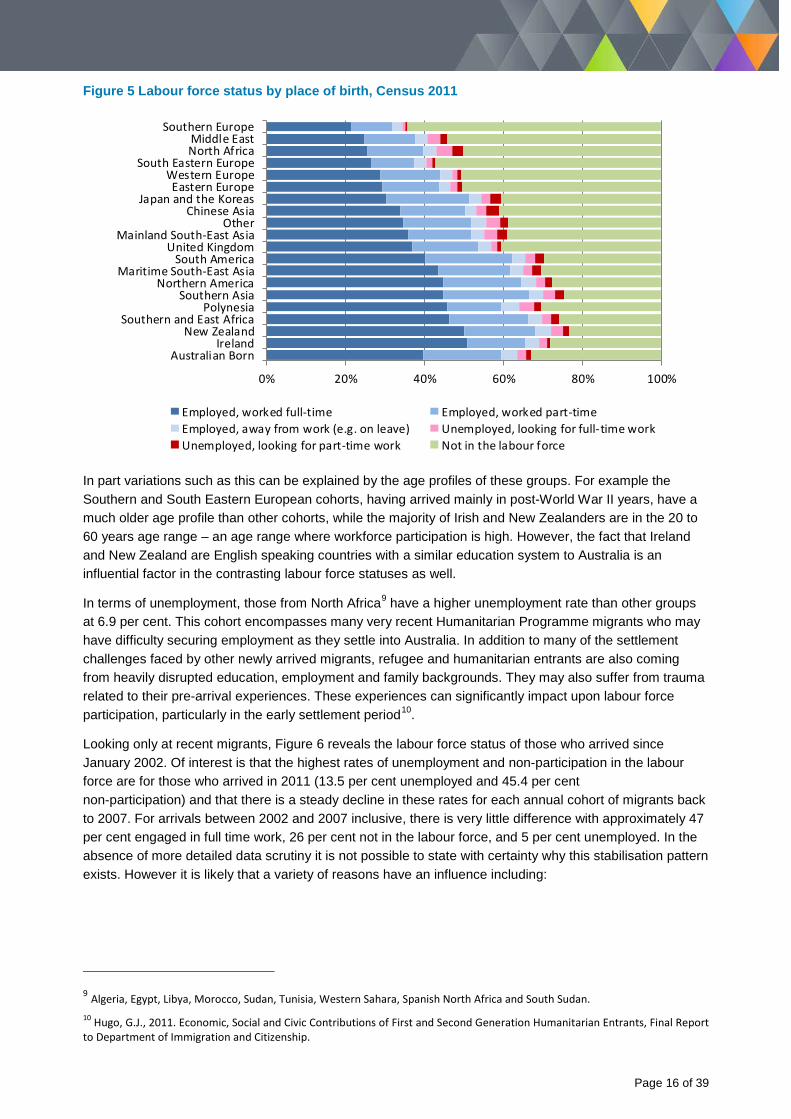
Figure 5 Labour force status by place of birth, Census 2011
0% 20% 40% 60% 80% 100%
Australian BornIreland
New ZealandSouthern and East Africa
PolynesiaSouthern Asia
Northern AmericaMaritime South-East Asia
South AmericaUnited Kingdom
Mainland South-East AsiaOther
Chinese AsiaJapan and the Koreas
Eastern EuropeWestern Europe
South Eastern EuropeNorth AfricaMiddle East
Southern Europe
Employed, worked full-time Employed, worked part-timeEmployed, away from work (e.g. on leave) Unemployed, looking for full-time workUnemployed, looking for part-time work Not in the labour force
In part variations such as this can be explained by the age profiles of these groups. For example the Southern and South Eastern European cohorts, having arrived mainly in post-World War II years, have a much older age profile than other cohorts, while the majority of Irish and New Zealanders are in the 20 to 60 years age range – an age range where workforce participation is high. However, the fact that Ireland and New Zealand are English speaking countries with a similar education system to Australia is an influential factor in the contrasting labour force statuses as well.
In terms of unemployment, those from North Africa9 have a higher unemployment rate than other groups at 6.9 per cent. This cohort encompasses many very recent Humanitarian Programme migrants who may have difficulty securing employment as they settle into Australia. In addition to many of the settlement challenges faced by other newly arrived migrants, refugee and humanitarian entrants are also coming from heavily disrupted education, employment and family backgrounds. They may also suffer from trauma related to their pre-arrival experiences. These experiences can significantly impact upon labour force participation, particularly in the early settlement period10.
Looking only at recent migrants, Figure 6 reveals the labour force status of those who arrived since January 2002. Of interest is that the highest rates of unemployment and non-participation in the labour force are for those who arrived in 2011 (13.5 per cent unemployed and 45.4 per cent non-participation) and that there is a steady decline in these rates for each annual cohort of migrants back to 2007. For arrivals between 2002 and 2007 inclusive, there is very little difference with approximately 47 per cent engaged in full time work, 26 per cent not in the labour force, and 5 per cent unemployed. In the absence of more detailed data scrutiny it is not possible to state with certainty why this stabilisation pattern exists. However it is likely that a variety of reasons have an influence including:
9 Algeria, Egypt, Libya, Morocco, Sudan, Tunisia, Western Sahara, Spanish North Africa and South Sudan. 10 Hugo, G.J., 2011. Economic, Social and Civic Contributions of First and Second Generation Humanitarian Entrants, Final Report to Department of Immigration and Citizenship.
Page 16 of 39
• A settling in period, whereby it takes time for new migrants (particularly Humanitarian Programme migrants) to establish the capacity, knowledge and skills with which to become employable and thus enter the work force; or
• Being able to take up citizenship after 48 months may play a part if employers are less inclined to recruit non-citizens.
The role of students in this pattern is also a factor. International students are counted in the Census (if they are here for at least 12 months) but they are unlikely to secure employment as soon as they arrive. Census data indicates that those who arrived in Australia since 2002 and are not in the labour force, are much more likely to be enrolled students. Indeed, the majority of migrants who arrived since 2008 and are not in the labour force, are enrolled students (between 50 and 60 per cent depending on the year). This is not the case for those who have been here longer, with fewer than 40 per cent of non-labour force migrants who arrived between 2002 and 2005 enrolled to study.
Figure 6 Year of arrival11 in Australia and Labour Force Status of recent migrants, Census 2011
0% 20% 40% 60% 80% 100%
2011201020092008200720062005200420032002
Employed, worked full-time Employed, worked part-timeEmployed, away from work (e.g. on leave) Unemployed, looking for full-time workUnemployed, looking for part-time work Not in the labour force
These data are in accordance with results from the Department’s Continuous Survey of Australia’s Migrants (CSAM) (DIAC, 2013) in that unemployment rates amongst recent migrants from both Family and Skill Streams, and key sub-groups within those cohorts, decreased over time and participation in full time and skilled employment increased. For example, more than 25 per cent of migrants on partner visas stated they were unemployed at wave 1 of CSAM (six months after arrival) but by wave 2 (twelve months after arrival) it had dropped to just 16 per cent. Also reported in the same series of CSAM surveys were improvements in income and higher rates of full-time employment between waves 1 and 2. Such findings are suggestive of the role that settling in can have on labour force participation given the relatively short period of reference for the CSAM surveys (six and 12 months after arrival) and the substantial improvements which are detected in this short period.
11 2011 arrivals include all persons who arrived up to and including 9th of August.
Page 17 of 39

Industry of Employment In terms of industry of employment, Table 5 provides an overview of the major migrant groups in Australia, with comparison against the total and Australian born populations. It is evident that some of the major migrant groups are over-represented in certain sectors while other groups are over-represented in other sectors. For example, health care and social assistance is the largest employment sector in the country in terms of total persons employed accounting for 11.6 per cent of all employees. As Table 5 indicates, although this sector is an important one for all of the cohorts for which data is presented (top three for all) for those from maritime South East Asia, this sector accounts for nearly 17.5 per cent of those in employment. This is the highest concentration of employees in any sector for any of the groups in the table. The key drivers of this are registered nurses, nursing support workers and aged care workers from the Philippines and to a slightly lesser extent, Malaysia. Migrants from both the UK and Southern Asia also have high levels of employment in the health care and social assistance sector.
In contrast to the abovementioned cases, migrants from New Zealand tend to be less concentrated in specific sectors. This is not surprising given the Trans-Tasman arrangements which permit New Zealanders to secure employment in most occupations in Australia without needing to apply for a visa.
Table 5 Industry of employment as a percentage of total population, Australian-born and key migrant groups, Census 2011
Total
Popn.
Australian
Born
New
Zealand
United
Kingdom
Maritime SE
Asia
Southern
Asia
Chinese
Asia
Agriculture/Forestry/Fishing 2.48 2.96 1.64 1.09 0.79 0.90 0.81 Mining 1.76 1.87 3.34 1.92 1.14 0.58 0.50 Manufacturing 8.98 8.25 10.65 9.01 11.32 9.62 9.49 Electricity/Gas/Water/Waste Services 1.15 1.23 1.17 1.16 0.89 1.16 0.47 Construction 8.24 8.76 10.66 8.41 2.90 1.91 3.91 Wholesale Trade 4.01 3.84 4.74 3.95 4.55 3.87 6.84 Retail Trade 10.51 11.21 8.73 8.13 8.11 9.22 10.92 Accommodation/Food Services 6.47 6.03 6.31 3.99 9.55 9.91 15.29 Transport/Postal/Warehousing 4.76 4.64 6.45 4.25 4.19 7.57 3.49 Information/Media/Telecoms. 1.77 1.73 1.80 2.05 2.02 2.51 1.96 Financial/Insurance Services 3.75 3.48 3.82 4.04 6.45 6.19 5.74 Rental/Hiring/Real Estate Services 1.58 1.66 1.83 1.61 1.28 0.73 1.61 Professional/Scientific/Technical 7.26 6.73 6.77 9.36 9.63 9.49 9.66 Administrative/Support Services 3.22 2.93 4.13 3.70 3.36 4.72 3.27 Public Administration and Safety 6.86 7.47 4.90 7.40 4.89 5.96 2.94 Education and Training 8.00 8.56 4.95 8.80 5.30 4.91 5.41 Health Care and Social Assistance 11.61 11.01 10.51 14.07 17.48 14.90 10.96 Arts and Recreation Services 1.51 1.63 1.53 1.47 1.28 0.66 1.05 Other Services 3.76 3.89 3.45 3.69 2.76 2.25 2.47 Not Stated/Inadequately Described 2.09 2.90 2.63 1.90 2.10 2.93 3.19 Total 100 100 100 100 100 100 100
Page 18 of 39
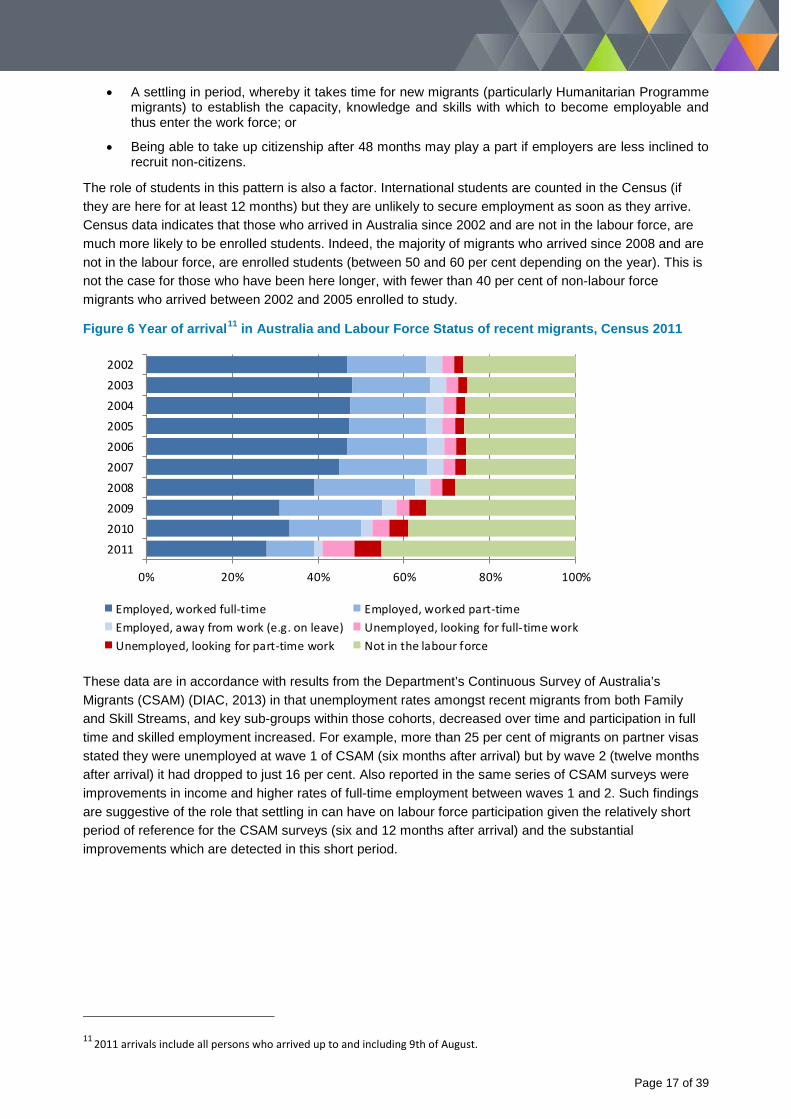
In order to look at how the employment profiles of migrants from different regions vary to the Australian born population, the index of dissimilarity (ID) was employed12. Dissimilarity was measured using industry of employment as the indicator. As shown in Figure 7, workers born in mainland South-East Asia have the highest dissimilarity score and those born in the United Kingdom the lowest. These scores indicate a more than 90 per cent overlap in the industry profiles of Australian and UK born workers but less than 75 per cent overlap when comparing Australian and mainland South East Asian born workers.
Figure 7 Index of Dissimilarity of Industry of Employment, Australian born and overseas born workers
0 5 10 15 20 25 30
Mainland South-East AsiaPolynesia
Southern AsiaJapan and the Koreas
Maritime South-East AsiaChinese Asia
IrelandNorthern America
South AmericaSouth Eastern Europe
Southern and East AfricaEastern Europe
Southern EuropeMiddle East
New ZealandOther
Western EuropeUnited Kingdom
Index of Dissimilarity
Looking more specifically at what is driving levels of dissimilarity between Australian born workers and those from other regions, Figure 8 provides comparisons of the industry profiles of six key cohorts of interest. The first two graphs provide profiles for the two regions with the highest level of dissimilarity, Mainland South East Asia and Polynesia. It is evident in both cases that manufacturing is a key point of difference with nearly 25 per cent of workers from Mainland South East Asia and nearly 20 per cent of Polynesian workers employed in that sector, compared to less than ten per cent of Australian born workers. High rates of employment in the accommodation and food sector amongst Mainland South East Asia born workers and in health care for Polynesian workers also influence the results. Low rates of employment across a number of industries including mining, education and construction also contribute to the high scores for both groups.
12 ID results range on a scale of 0 (similar) to 100 (dissimilar), so the greater the difference in industry profiles the higher the score. For example, if the Australian born workforce worked entirely in the mining sector and the North American born workforce worked entirely in the retail trade sector, the ID score would be 100. Generally however there is a portion of each group employed in each of the industry sectors. As such, the ID calculates the amount of overlap in each sector to generate a score based on the aggregate percentage point difference in each sector.
Page 19 of 39
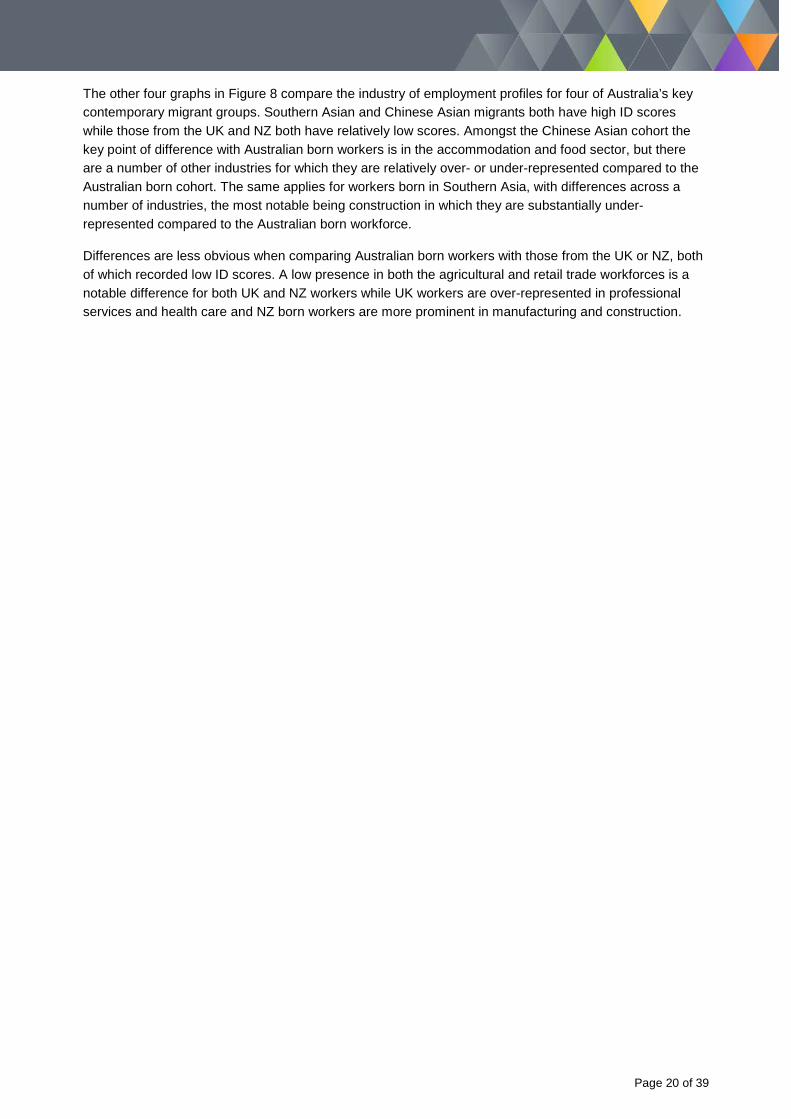
The other four graphs in Figure 8 compare the industry of employment profiles for four of Australia’s key contemporary migrant groups. Southern Asian and Chinese Asian migrants both have high ID scores while those from the UK and NZ both have relatively low scores. Amongst the Chinese Asian cohort the key point of difference with Australian born workers is in the accommodation and food sector, but there are a number of other industries for which they are relatively over- or under-represented compared to the Australian born cohort. The same applies for workers born in Southern Asia, with differences across a number of industries, the most notable being construction in which they are substantially under-represented compared to the Australian born workforce.
Differences are less obvious when comparing Australian born workers with those from the UK or NZ, both of which recorded low ID scores. A low presence in both the agricultural and retail trade workforces is a notable difference for both UK and NZ workers while UK workers are over-represented in professional services and health care and NZ born workers are more prominent in manufacturing and construction.
Page 20 of 39
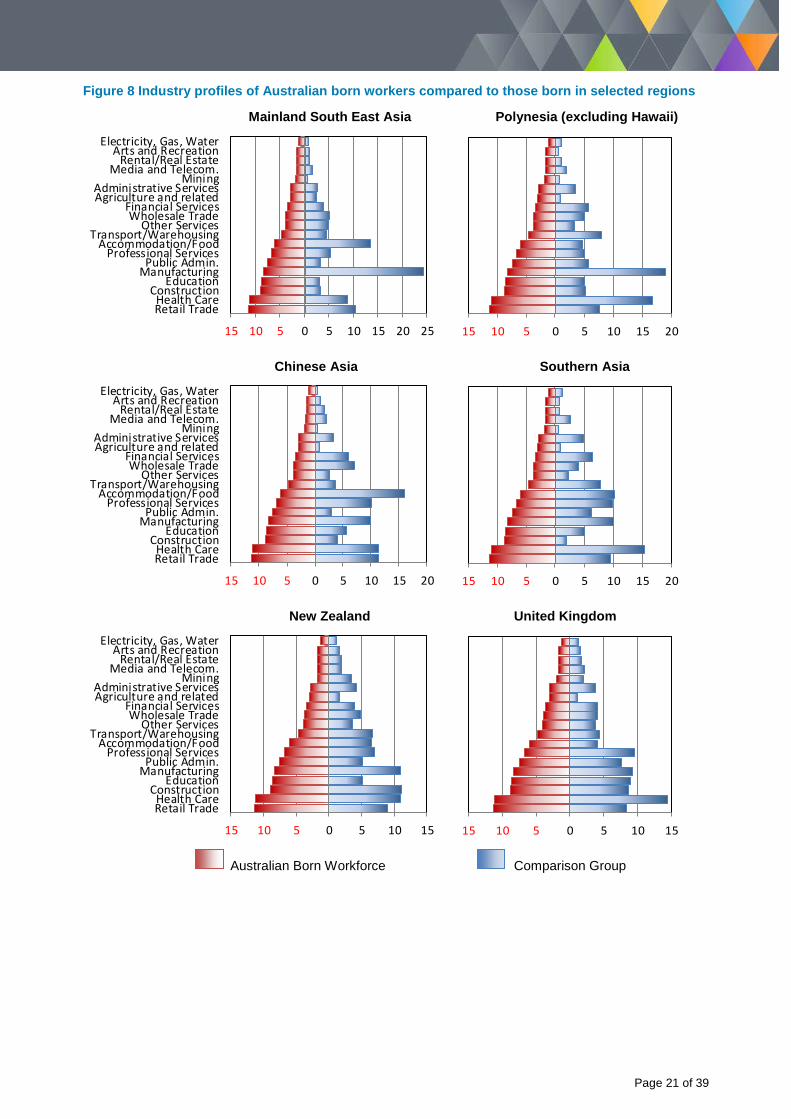
Figure 8 Industry profiles of Australian born workers compared to those born in selected regions
Mainland South East Asia Polynesia (excluding Hawaii)
15 10 5 0 5 10 15 20 25
Retail TradeHealth Care
ConstructionEducation
ManufacturingPublic Admin.
Professional ServicesAccommodation/Food
Transport/WarehousingOther Services
Wholesale TradeFinancial Services
Agriculture and relatedAdministrative Services
MiningMedia and Telecom.
Rental/Real EstateArts and Recreation
Electricity, Gas, Water
15 10 5 0 5 10 15 20
Chinese Asia Southern Asia
15 10 5 0 5 10 15 20
Retail TradeHealth Care
ConstructionEducation
ManufacturingPublic Admin.
Professional ServicesAccommodation/Food
Transport/WarehousingOther Services
Wholesale TradeFinancial Services
Agriculture and relatedAdministrative Services
MiningMedia and Telecom.
Rental/Real EstateArts and Recreation
Electricity, Gas, Water
15 10 5 0 5 10 15 20
New Zealand United Kingdom
15 10 5 0 5 10 15
Retail TradeHealth Care
ConstructionEducation
ManufacturingPublic Admin.
Professional ServicesAccommodation/Food
Transport/WarehousingOther Services
Wholesale TradeFinancial Services
Agriculture and relatedAdministrative Services
MiningMedia and Telecom.
Rental/Real EstateArts and Recreation
Electricity, Gas, Water
15 10 5 0 5 10 15
Australian Born Workforce Comparison Group
Page 21 of 39
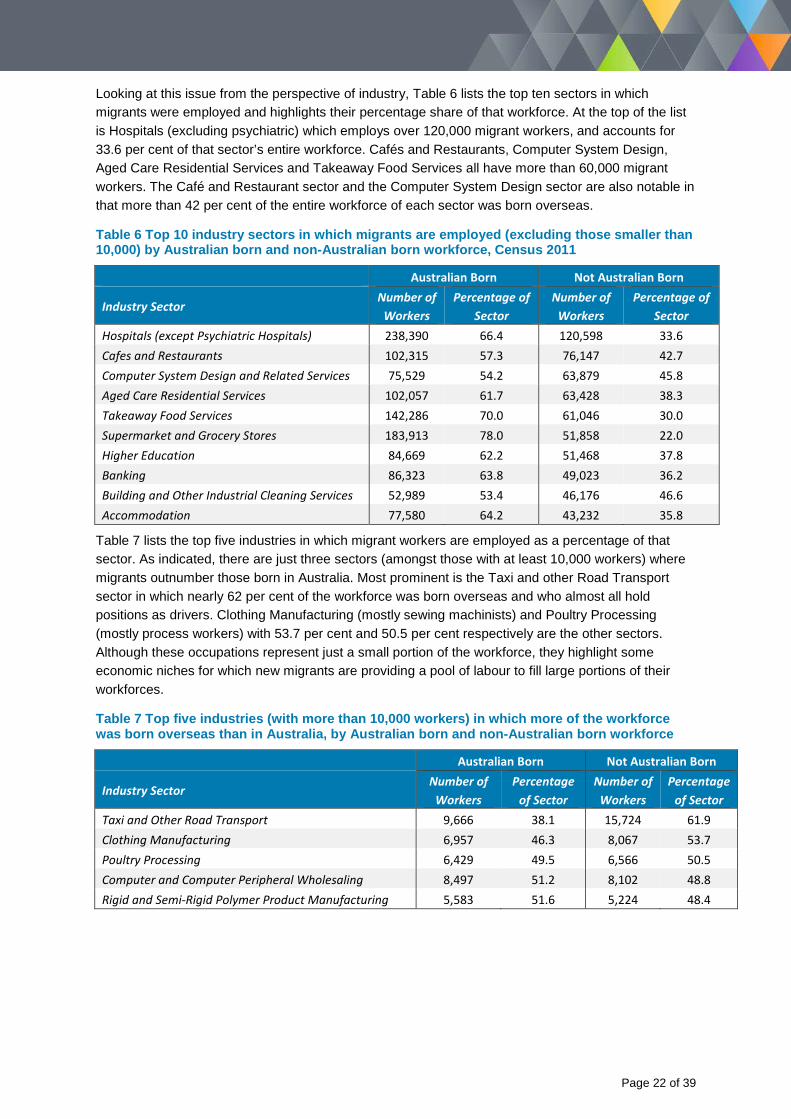
Looking at this issue from the perspective of industry, Table 6 lists the top ten sectors in which migrants were employed and highlights their percentage share of that workforce. At the top of the list is Hospitals (excluding psychiatric) which employs over 120,000 migrant workers, and accounts for 33.6 per cent of that sector’s entire workforce. Cafés and Restaurants, Computer System Design, Aged Care Residential Services and Takeaway Food Services all have more than 60,000 migrant workers. The Café and Restaurant sector and the Computer System Design sector are also notable in that more than 42 per cent of the entire workforce of each sector was born overseas.
Table 6 Top 10 industry sectors in which migrants are employed (excluding those smaller than 10,000) by Australian born and non-Australian born workforce, Census 2011
Australian Born Not Australian Born
Industry Sector Number of
Workers Percentage of
Sector Number of
Workers Percentage of
Sector Hospitals (except Psychiatric Hospitals) 238,390 66.4 120,598 33.6 Cafes and Restaurants 102,315 57.3 76,147 42.7 Computer System Design and Related Services 75,529 54.2 63,879 45.8 Aged Care Residential Services 102,057 61.7 63,428 38.3 Takeaway Food Services 142,286 70.0 61,046 30.0 Supermarket and Grocery Stores 183,913 78.0 51,858 22.0 Higher Education 84,669 62.2 51,468 37.8 Banking 86,323 63.8 49,023 36.2 Building and Other Industrial Cleaning Services 52,989 53.4 46,176 46.6 Accommodation 77,580 64.2 43,232 35.8
Table 7 lists the top five industries in which migrant workers are employed as a percentage of that sector. As indicated, there are just three sectors (amongst those with at least 10,000 workers) where migrants outnumber those born in Australia. Most prominent is the Taxi and other Road Transport sector in which nearly 62 per cent of the workforce was born overseas and who almost all hold positions as drivers. Clothing Manufacturing (mostly sewing machinists) and Poultry Processing (mostly process workers) with 53.7 per cent and 50.5 per cent respectively are the other sectors. Although these occupations represent just a small portion of the workforce, they highlight some economic niches for which new migrants are providing a pool of labour to fill large portions of their workforces.
Table 7 Top five industries (with more than 10,000 workers) in which more of the workforce was born overseas than in Australia, by Australian born and non-Australian born workforce
Australian Born Not Australian Born
Industry Sector Number of
Workers Percentage
of Sector Number of
Workers Percentage
of Sector Taxi and Other Road Transport 9,666 38.1 15,724 61.9 Clothing Manufacturing 6,957 46.3 8,067 53.7 Poultry Processing 6,429 49.5 6,566 50.5 Computer and Computer Peripheral Wholesaling 8,497 51.2 8,102 48.8 Rigid and Semi-Rigid Polymer Product Manufacturing 5,583 51.6 5,224 48.4
Page 22 of 39
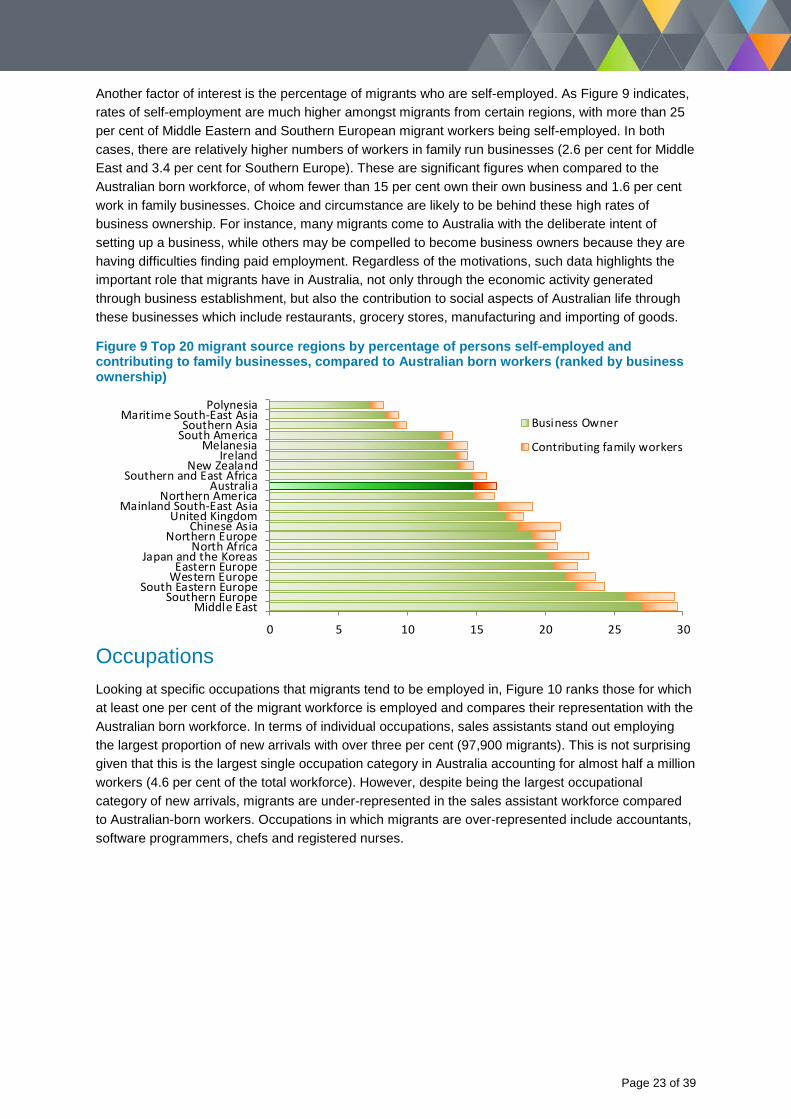
Another factor of interest is the percentage of migrants who are self-employed. As Figure 9 indicates, rates of self-employment are much higher amongst migrants from certain regions, with more than 25 per cent of Middle Eastern and Southern European migrant workers being self-employed. In both cases, there are relatively higher numbers of workers in family run businesses (2.6 per cent for Middle East and 3.4 per cent for Southern Europe). These are significant figures when compared to the Australian born workforce, of whom fewer than 15 per cent own their own business and 1.6 per cent work in family businesses. Choice and circumstance are likely to be behind these high rates of business ownership. For instance, many migrants come to Australia with the deliberate intent of setting up a business, while others may be compelled to become business owners because they are having difficulties finding paid employment. Regardless of the motivations, such data highlights the important role that migrants have in Australia, not only through the economic activity generated through business establishment, but also the contribution to social aspects of Australian life through these businesses which include restaurants, grocery stores, manufacturing and importing of goods.
Figure 9 Top 20 migrant source regions by percentage of persons self-employed and contributing to family businesses, compared to Australian born workers (ranked by business ownership)
0 5 10 15 20 25 30
Middle EastSouthern Europe
South Eastern EuropeWestern EuropeEastern Europe
Japan and the KoreasNorth Africa
Northern EuropeChinese Asia
United KingdomMainland South-East Asia
Northern AmericaAustralia
Southern and East AfricaNew Zealand
IrelandMelanesia
South AmericaSouthern Asia
Maritime South-East AsiaPolynesia
Business Owner
Contributing family workers
Occupations Looking at specific occupations that migrants tend to be employed in, Figure 10 ranks those for which at least one per cent of the migrant workforce is employed and compares their representation with the Australian born workforce. In terms of individual occupations, sales assistants stand out employing the largest proportion of new arrivals with over three per cent (97,900 migrants). This is not surprising given that this is the largest single occupation category in Australia accounting for almost half a million workers (4.6 per cent of the total workforce). However, despite being the largest occupational category of new arrivals, migrants are under-represented in the sales assistant workforce compared to Australian-born workers. Occupations in which migrants are over-represented include accountants, software programmers, chefs and registered nurses.
Page 23 of 39
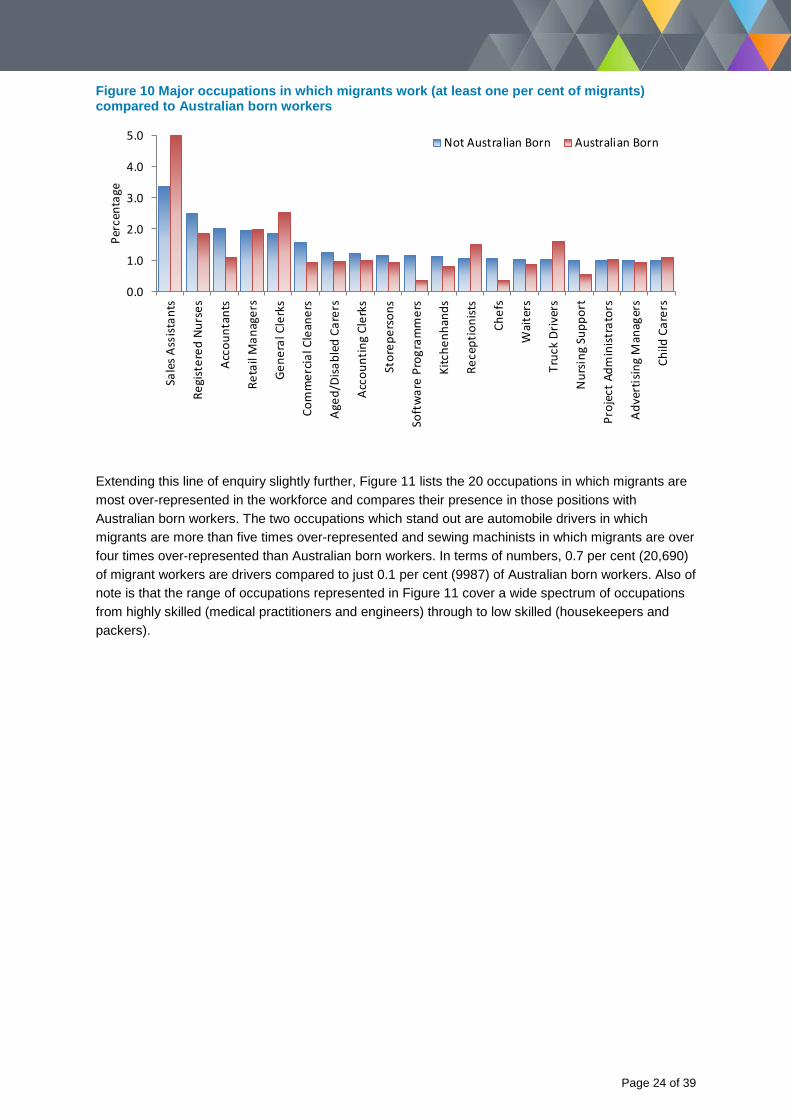
Figure 10 Major occupations in which migrants work (at least one per cent of migrants) compared to Australian born workers
0.0
1.0
2.0
3.0
4.0
5.0
Sale
s Ass
istan
ts
Regi
ster
ed N
urse
s
Acco
unta
nts
Reta
il M
anag
ers
Gene
ral C
lerk
s
Com
mer
cial C
lean
ers
Aged
/Disa
bled
Car
ers
Acco
untin
g Cl
erks
Stor
eper
sons
Soft
war
e Pr
ogra
mm
ers
Kitc
henh
ands
Rece
ptio
nist
s
Chef
s
Wai
ters
Truc
k Dr
iver
s
Nur
sing
Sup
port
Proj
ect A
dmin
istra
tors
Adve
rtis
ing
Man
ager
s
Child
Car
ers
Perc
enta
ge
Not Australian Born Australian Born
Extending this line of enquiry slightly further, Figure 11 lists the 20 occupations in which migrants are most over-represented in the workforce and compares their presence in those positions with Australian born workers. The two occupations which stand out are automobile drivers in which migrants are more than five times over-represented and sewing machinists in which migrants are over four times over-represented than Australian born workers. In terms of numbers, 0.7 per cent (20,690) of migrant workers are drivers compared to just 0.1 per cent (9987) of Australian born workers. Also of note is that the range of occupations represented in Figure 11 cover a wide spectrum of occupations from highly skilled (medical practitioners and engineers) through to low skilled (housekeepers and packers).
Page 24 of 39
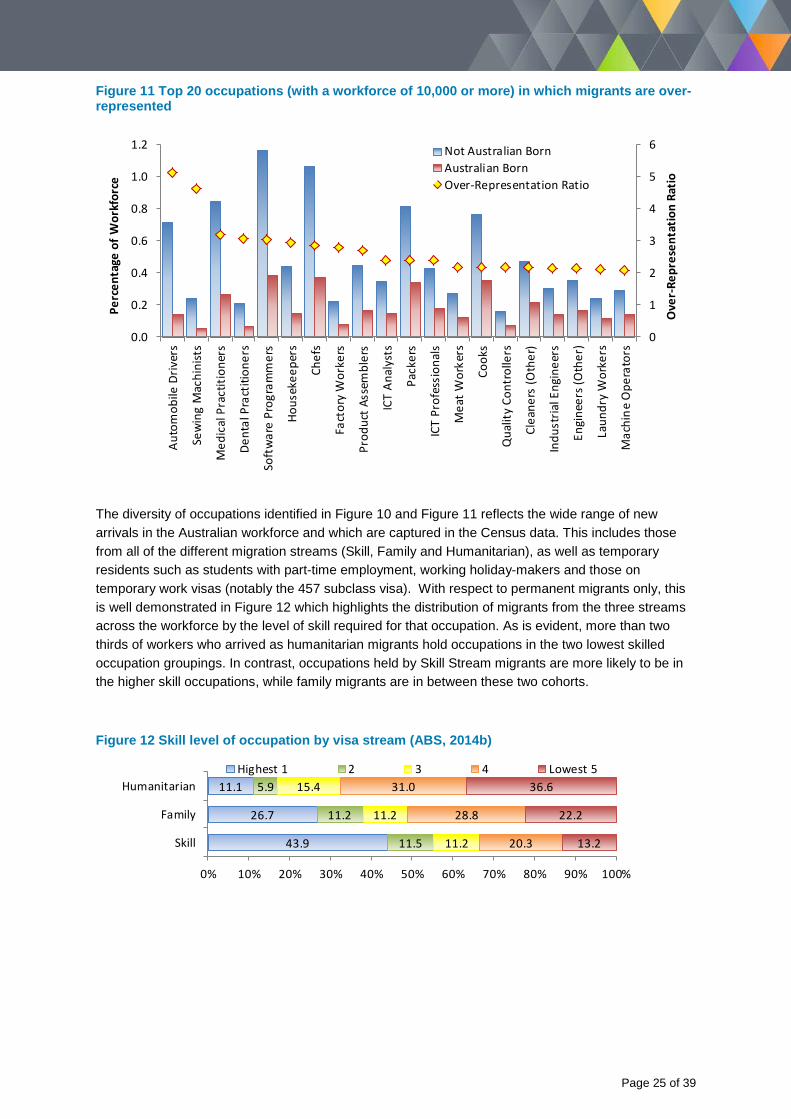
Figure 11 Top 20 occupations (with a workforce of 10,000 or more) in which migrants are over-represented
0
1
2
3
4
5
6
0.0
0.2
0.4
0.6
0.8
1.0
1.2
Auto
mob
ile D
river
s
Sew
ing
Mac
hini
sts
Med
ical
Pra
ctiti
oner
s
Dent
al P
ract
ition
ers
Soft
war
e Pr
ogra
mm
ers
Hous
ekee
pers
Chef
s
Fact
ory
Wor
kers
Prod
uct A
ssem
bler
s
ICT
Anal
ysts
Pack
ers
ICT
Prof
essi
onal
s
Mea
t Wor
kers
Cook
s
Qua
lity
Cont
rolle
rs
Clea
ners
(Oth
er)
Indu
stria
l Eng
inee
rs
Engi
neer
s (O
ther
)
Laun
dry
Wor
kers
Mac
hine
Ope
rato
rs
Ove
r-Re
pres
enta
tion
Ratio
Perc
enta
ge o
f Wor
kfor
ce
Not Australian BornAustralian BornOver-Representation Ratio
The diversity of occupations identified in Figure 10 and Figure 11 reflects the wide range of new arrivals in the Australian workforce and which are captured in the Census data. This includes those from all of the different migration streams (Skill, Family and Humanitarian), as well as temporary residents such as students with part-time employment, working holiday-makers and those on temporary work visas (notably the 457 subclass visa). With respect to permanent migrants only, this is well demonstrated in Figure 12 which highlights the distribution of migrants from the three streams across the workforce by the level of skill required for that occupation. As is evident, more than two thirds of workers who arrived as humanitarian migrants hold occupations in the two lowest skilled occupation groupings. In contrast, occupations held by Skill Stream migrants are more likely to be in the higher skill occupations, while family migrants are in between these two cohorts.
Figure 12 Skill level of occupation by visa stream (ABS, 2014b)
43.9
26.7
11.1
11.5
11.2
5.9
11.2
11.2
15.4
20.3
28.8
31.0
13.2
22.2
36.6
0% 10% 20% 30% 40% 50% 60% 70% 80% 90% 100%
Skill
Family
HumanitarianHighest 1 2 3 4 Lowest 5
Page 25 of 39
Human Capital As detailed in the previous section, migrants are an important element of the Australian workforce, particularly for some industry sectors which appear to rely heavily on them. However, labour is not the only quality which migrants bring to the country. Many migrants bring with them vital skills, new ideas, expertise and experience which can benefit Australia in numerous and immeasurable ways, of which only a fraction can be recorded and reported upon here.
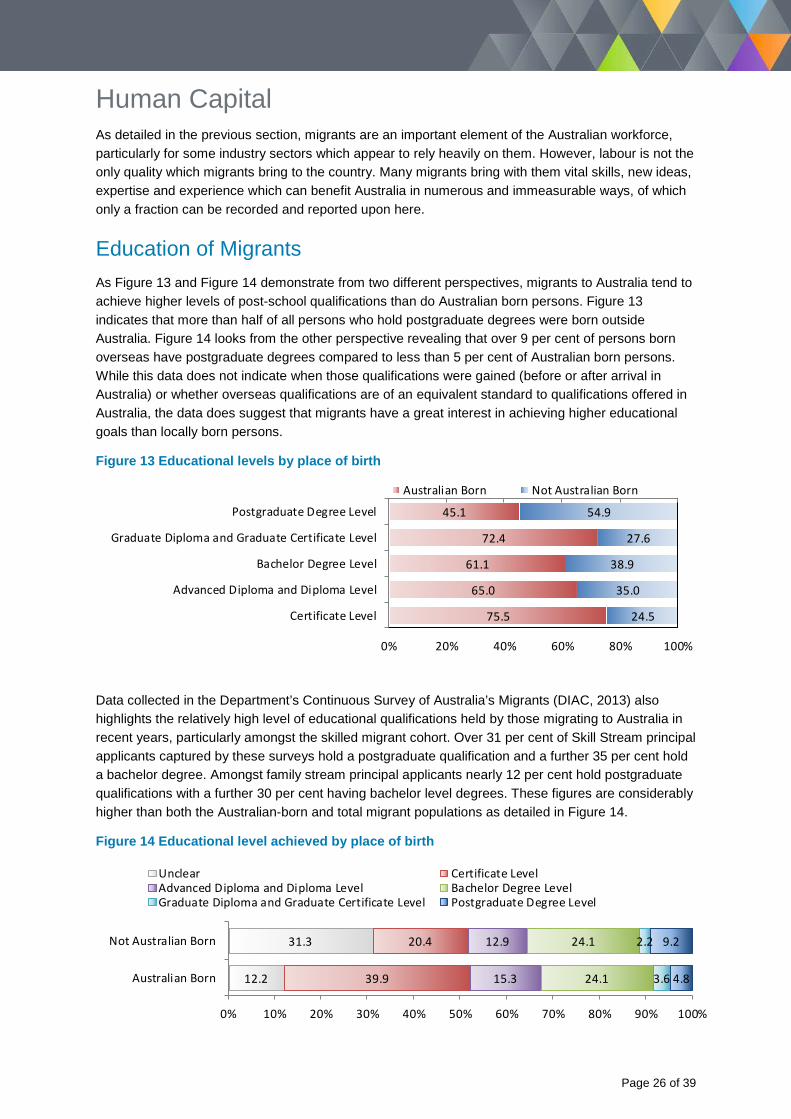
Education of Migrants As Figure 13 and Figure 14 demonstrate from two different perspectives, migrants to Australia tend to achieve higher levels of post-school qualifications than do Australian born persons. Figure 13 indicates that more than half of all persons who hold postgraduate degrees were born outside Australia. Figure 14 looks from the other perspective revealing that over 9 per cent of persons born overseas have postgraduate degrees compared to less than 5 per cent of Australian born persons. While this data does not indicate when those qualifications were gained (before or after arrival in Australia) or whether overseas qualifications are of an equivalent standard to qualifications offered in Australia, the data does suggest that migrants have a great interest in achieving higher educational goals than locally born persons.
Figure 13 Educational levels by place of birth
45.1
72.4
61.1
65.0
75.5
54.9
27.6
38.9
35.0
24.5
0% 20% 40% 60% 80% 100%
Postgraduate Degree Level
Graduate Diploma and Graduate Certificate Level
Bachelor Degree Level
Advanced Diploma and Diploma Level
Certificate Level
Australian Born Not Australian Born
Data collected in the Department’s Continuous Survey of Australia’s Migrants (DIAC, 2013) also highlights the relatively high level of educational qualifications held by those migrating to Australia in recent years, particularly amongst the skilled migrant cohort. Over 31 per cent of Skill Stream principal applicants captured by these surveys hold a postgraduate qualification and a further 35 per cent hold a bachelor degree. Amongst family stream principal applicants nearly 12 per cent hold postgraduate qualifications with a further 30 per cent having bachelor level degrees. These figures are considerably higher than both the Australian-born and total migrant populations as detailed in Figure 14.
Figure 14 Educational level achieved by place of birth
12.2
31.3
39.9
20.4
15.3
12.9
24.1
24.1
3.6
2.2
4.8
9.2
0% 10% 20% 30% 40% 50% 60% 70% 80% 90% 100%
Australian Born
Not Australian Born
Unclear Certificate LevelAdvanced Diploma and Diploma Level Bachelor Degree LevelGraduate Diploma and Graduate Certificate Level Postgraduate Degree Level
Page 26 of 39

Children of Migrants The educational level attained by children of migrants also provides a useful perspective on the contribution of migrants to the Australian population and their apparent higher levels of educational aspiration. As Figure 15 indicates, the Australian born children of migrants tend to stay at school longer than those with Australian born parents. Of those with two overseas born parents, nearly 60 per cent completed year 12 or equivalent. This contrasts to 53 per cent of those with one Australian parent and 45 per cent of those with two Australian born parents.
Figure 15 Secondary education completion rates of Australian born persons by the birthplace of their parents, Census 201113
0% 20% 40% 60% 80% 100%
Both parents born overseas
One parent born overseas
Both parents born in Australia
Did not go to school Year 8 or below Year 9 or equivalentYear 10 or equivalent Year 11 or equivalent Year 12 or equivalent
Extending this analysis to higher education, similar outcomes are evident. Figure 16 looks at persons who have attained a post-secondary qualification and indicates that those with overseas born parents are more likely to have attained higher level qualifications. Close to 50 per cent of those with both parents born overseas have secured a bachelor degree or higher compared to just 40 per cent of those with one Australian born parent and 36 per cent of those with two Australian born parents. It is thus evident that those with overseas born parents tend to be academic high achievers both at school and after they leave school.
Figure 16 Highest post-secondary qualification attained by Australian born persons by the birthplace of their parents, Census 201114
0% 20% 40% 60% 80% 100%
Both parents born overseas
One parent born overseas
Both parents born in Australia
Certificate Advanced Diploma/DiplomaBachelor Degree Graduate Diploma/CertificatePostgraduate Degree
13 This data excludes those for whom inadequate information was available to determine birthdate or level of schooling reached. 14 This data excludes those for whom inadequate information was available to determine birthdate or level of schooling reached. It also excludes those who have not attained a post-secondary qualification.
Page 27 of 39

Returns on Education As a basic measure for the returns which migrants gain from education, Figure 17 compares the level of income for persons born overseas and in Australia (and where their parents were born) by their level of education.
There are a number of points which emerge from this graph. At an overall level it is clear that persons with higher level post-school education tend to be in the higher income brackets regardless of where their parents were born. Within each educational bracket, it is evident that persons born overseas tend to be in lower income brackets than their Australian born counterparts. Language skills are likely to be influencing this result, with those born outside of Australia less likely to have the language skills required to attain employment in certain industries despite holding qualifications. This is less likely to be an issue for persons born and educated in Australia. Similarly, persons educated in Australia may be more likely to hold qualifications relevant to the Australian labour market than those born overseas.
Amongst Australian born persons, there are few differences. That is, regardless of where parents were born, those with similar qualifications also have similar income profiles. That being said, it is evident that those with one parent born overseas tend to have slightly lower income profiles than those with two parents born either overseas or in Australia.
Figure 17 Weekly income by birthplace and birthplace of parents and post-school educational achievements
3324 26 26 32
23 23 23 2515 16 15 18 13 14 13 19
9 10 9
3841 41 41 36
35 37 36 28
25 27 26 2523 24 24
24
15 18 17
1822 20 20 17
22 20 2020
25 26 25 2326 26 25 19
20 20 19
12 14 13 14 15 20 19 21 26 35 32 34 34 39 36 38 3855 52 55
0%10%20%30%40%50%60%70%80%90%
100%
Born
ove
rsea
sBo
th p
aren
ts b
orn
over
seas
One
par
ent b
orn
over
seas
Both
par
ents
bor
n in
Aus
tral
ia
Born
ove
rsea
sBo
th p
aren
ts b
orn
over
seas
One
par
ent b
orn
over
seas
Both
par
ents
bor
n in
Aus
tral
ia
Born
ove
rsea
sBo
th p
aren
ts b
orn
over
seas
One
par
ent b
orn
over
seas
Both
par
ents
bor
n in
Aus
tral
ia
Born
ove
rsea
sBo
th p
aren
ts b
orn
over
seas
One
par
ent b
orn
over
seas
Both
par
ents
bor
n in
Aus
tral
ia
Born
ove
rsea
sBo
th p
aren
ts b
orn
over
seas
One
par
ent b
orn
over
seas
Both
par
ents
bor
n in
Aus
tral
ia
Certificate Advanced Dip.and Diploma
Bachelor Degree Grad. Dip. andGrad. Cert.
PostgraduateDegree
$1500 ormore pw
$1000 -$1499pw$400 -$999 pw
Less than$400 pw
Page 28 of 39
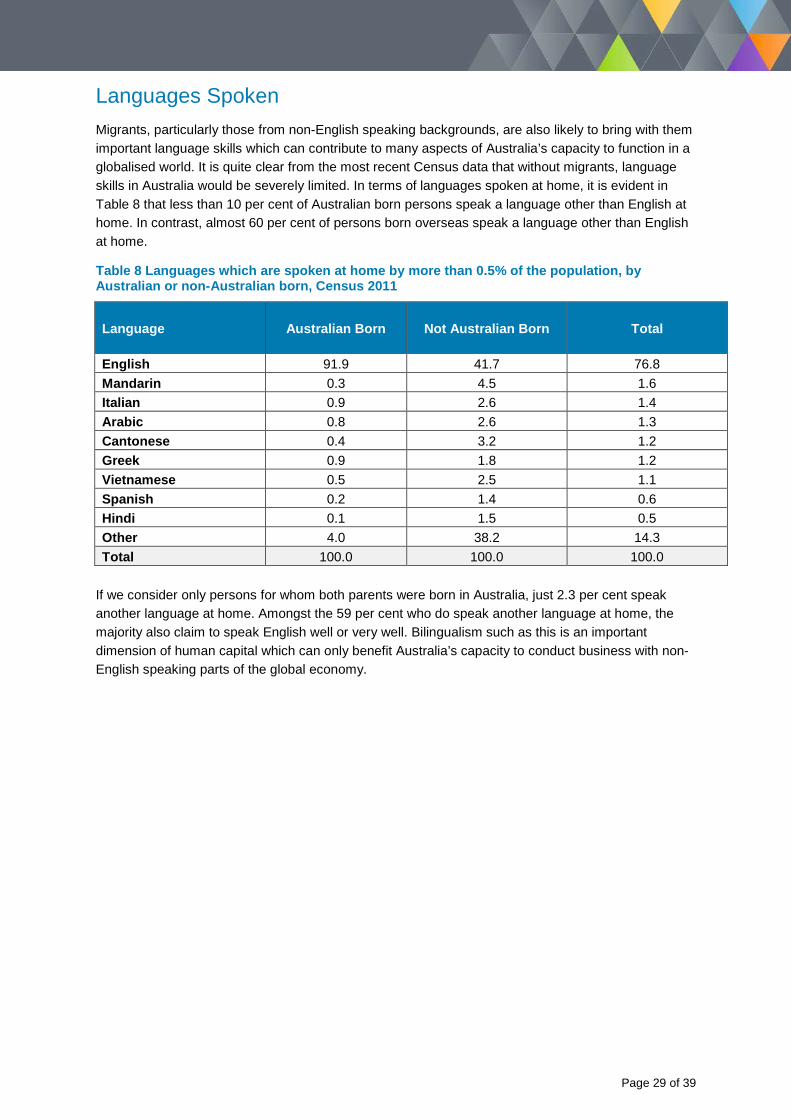
Languages Spoken Migrants, particularly those from non-English speaking backgrounds, are also likely to bring with them important language skills which can contribute to many aspects of Australia’s capacity to function in a globalised world. It is quite clear from the most recent Census data that without migrants, language skills in Australia would be severely limited. In terms of languages spoken at home, it is evident in Table 8 that less than 10 per cent of Australian born persons speak a language other than English at home. In contrast, almost 60 per cent of persons born overseas speak a language other than English at home.
Table 8 Languages which are spoken at home by more than 0.5% of the population, by Australian or non-Australian born, Census 2011
Language Australian Born Not Australian Born Total
English 91.9 41.7 76.8 Mandarin 0.3 4.5 1.6 Italian 0.9 2.6 1.4 Arabic 0.8 2.6 1.3 Cantonese 0.4 3.2 1.2 Greek 0.9 1.8 1.2 Vietnamese 0.5 2.5 1.1 Spanish 0.2 1.4 0.6 Hindi 0.1 1.5 0.5 Other 4.0 38.2 14.3 Total 100.0 100.0 100.0
If we consider only persons for whom both parents were born in Australia, just 2.3 per cent speak another language at home. Amongst the 59 per cent who do speak another language at home, the majority also claim to speak English well or very well. Bilingualism such as this is an important dimension of human capital which can only benefit Australia’s capacity to conduct business with non-English speaking parts of the global economy.
Page 29 of 39
Social Contribution The social contribution of migrants to Australia is also an important dimension to consider. More than bolstering Australia’s economic prosperity, migrants enrich our society at large in numerous, and often unquantifiable ways. A big part of Australia’s success as an immigration nation has been our high levels of social cohesion at a national level and harmony and resilience at a community level. The extent of this contribution emphasises the importance of participation and shared rights, responsibilities and obligations of all Australians. As outlined below however, while migrants participate in a wide variety of contemporary aspects of Australian life, participation rates differ across groups considerably.
Additionally, barriers to integration and participation in Australian life are evident. From the perspective of the migrant, evidence suggests that a lack of English language skills appear to present a major barrier to participation in social aspects of Australian life. From the other side of the equation, there is also evidence which suggests discrimination towards, and intolerance of new migrants still exists in some sections of the community. As such, some migrants who do seek to participate in mainstream social and cultural pursuits may encounter difficulties engaging fully due to their inability to communicate effectively but perhaps also due to the negative attitudes of those with whom they are seeking to engage.
Citizenship Australian citizenship is an important step in a person’s migration journey. By becoming a citizen, a person is making an ongoing commitment to Australia and all that it stands for. Citizenship also marks the beginning of their formal membership of the Australian community and carries with it certain responsibilities and privileges.
These include responsibilities to serve on a jury if called to do so, defend Australia should the need arise and vote in government elections. Australia citizens are also eligible to apply for work in the Australian Public Service or the Australian Defence Force, seek election to parliament, apply for an Australian passport, receive help from Australian officials while overseas and register children born overseas as Australian citizens by descent.
Of the 21.5 million residents of Australia, 85 per cent reported being citizens at the 2011 Census. Nine per cent reported not being citizens and six per cent did not report their citizenship status. When we consider only those who were born overseas, data indicates that 55 per cent have taken up Australian citizenship, 29 per cent have not, and 16 per cent did not report their status.
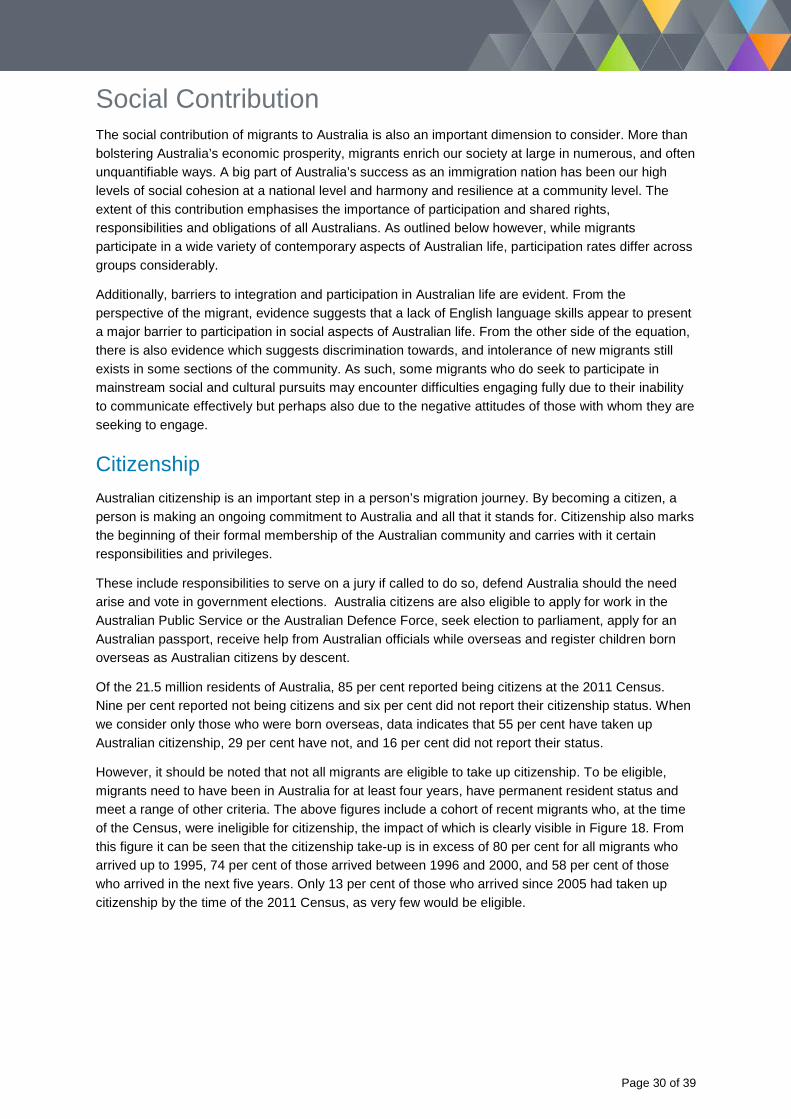
However, it should be noted that not all migrants are eligible to take up citizenship. To be eligible, migrants need to have been in Australia for at least four years, have permanent resident status and meet a range of other criteria. The above figures include a cohort of recent migrants who, at the time of the Census, were ineligible for citizenship, the impact of which is clearly visible in Figure 18. From this figure it can be seen that the citizenship take-up is in excess of 80 per cent for all migrants who arrived up to 1995, 74 per cent of those arrived between 1996 and 2000, and 58 per cent of those who arrived in the next five years. Only 13 per cent of those who arrived since 2005 had taken up citizenship by the time of the 2011 Census, as very few would be eligible.
Page 30 of 39
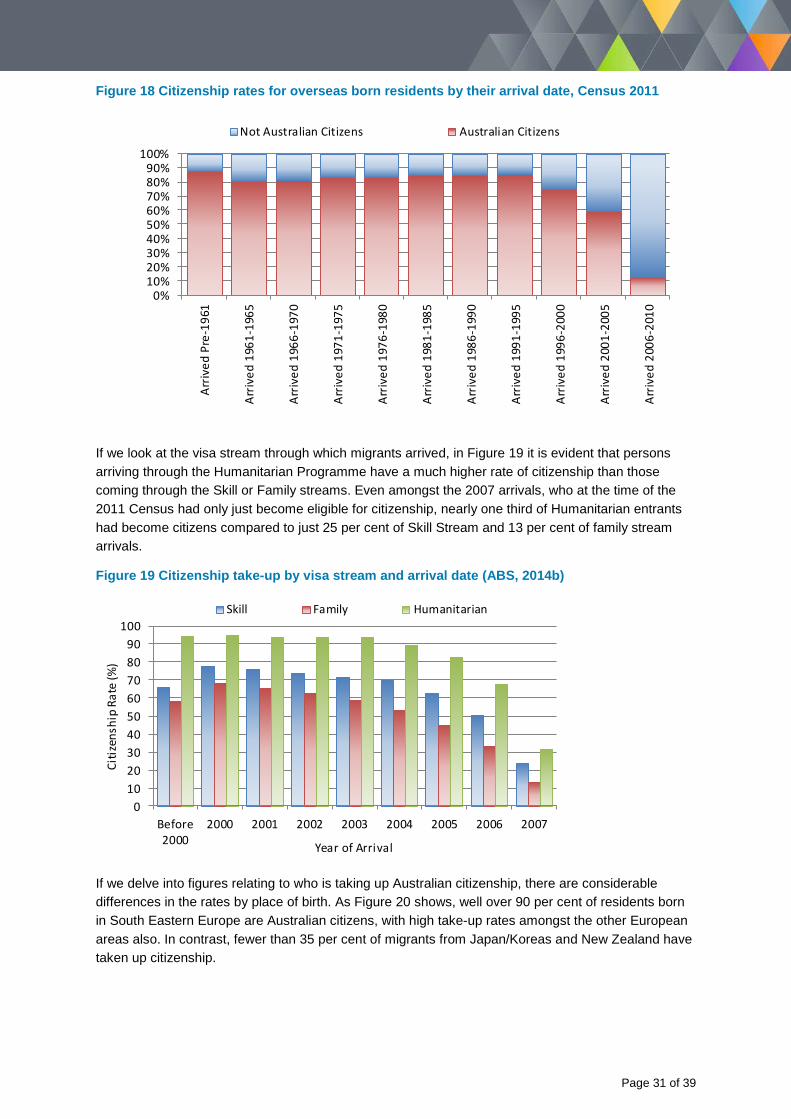
Figure 18 Citizenship rates for overseas born residents by their arrival date, Census 2011
0%10%20%30%40%50%60%70%80%90%
100%
Arriv
ed P
re-1
961
Arriv
ed 1
961-
1965
Arriv
ed 1
966-
1970
Arriv
ed 1
971-
1975
Arriv
ed 1
976-
1980
Arriv
ed 1
981-
1985
Arriv
ed 1
986-
1990
Arriv
ed 1
991-
1995
Arriv
ed 1
996-
2000
Arriv
ed 2
001-
2005
Arriv
ed 2
006-
2010
Not Australian Citizens Australian Citizens
If we look at the visa stream through which migrants arrived, in Figure 19 it is evident that persons arriving through the Humanitarian Programme have a much higher rate of citizenship than those coming through the Skill or Family streams. Even amongst the 2007 arrivals, who at the time of the 2011 Census had only just become eligible for citizenship, nearly one third of Humanitarian entrants had become citizens compared to just 25 per cent of Skill Stream and 13 per cent of family stream arrivals.
Figure 19 Citizenship take-up by visa stream and arrival date (ABS, 2014b)
0102030405060708090
100
Before2000
2000 2001 2002 2003 2004 2005 2006 2007
Citiz
ensh
ip R
ate
(%)
Year of Arrival
Skill Family Humanitarian
If we delve into figures relating to who is taking up Australian citizenship, there are considerable differences in the rates by place of birth. As Figure 20 shows, well over 90 per cent of residents born in South Eastern Europe are Australian citizens, with high take-up rates amongst the other European areas also. In contrast, fewer than 35 per cent of migrants from Japan/Koreas and New Zealand have taken up citizenship.
Page 31 of 39
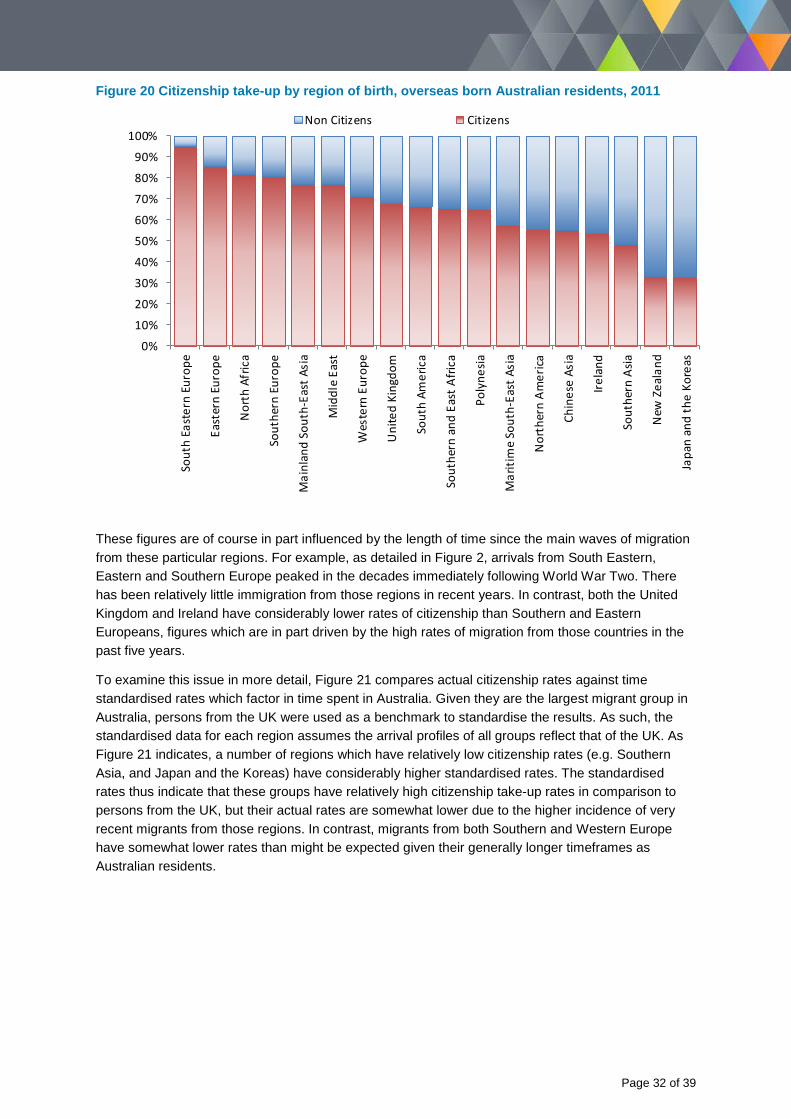
Figure 20 Citizenship take-up by region of birth, overseas born Australian residents, 2011
0%
10%
20%
30%
40%
50%
60%
70%
80%
90%
100%
Sout
h Ea
ster
n Eu
rope
East
ern
Euro
pe
Nor
th A
fric
a
Sout
hern
Eur
ope
Mai
nlan
d So
uth-
East
Asi
a
Mid
dle
East
Wes
tern
Eur
ope
Uni
ted
King
dom
Sout
h Am
eric
a
Sout
hern
and
Eas
t Afri
ca
Poly
nesia
Mar
itim
e So
uth-
East
Asi
a
Nor
ther
n Am
erica
Chin
ese
Asia
Irela
nd
Sout
hern
Asia
New
Zea
land
Japa
n an
d th
e Ko
reas
Non Citizens Citizens
These figures are of course in part influenced by the length of time since the main waves of migration from these particular regions. For example, as detailed in Figure 2, arrivals from South Eastern, Eastern and Southern Europe peaked in the decades immediately following World War Two. There has been relatively little immigration from those regions in recent years. In contrast, both the United Kingdom and Ireland have considerably lower rates of citizenship than Southern and Eastern Europeans, figures which are in part driven by the high rates of migration from those countries in the past five years.
To examine this issue in more detail, Figure 21 compares actual citizenship rates against time standardised rates which factor in time spent in Australia. Given they are the largest migrant group in Australia, persons from the UK were used as a benchmark to standardise the results. As such, the standardised data for each region assumes the arrival profiles of all groups reflect that of the UK. As Figure 21 indicates, a number of regions which have relatively low citizenship rates (e.g. Southern Asia, and Japan and the Koreas) have considerably higher standardised rates. The standardised rates thus indicate that these groups have relatively high citizenship take-up rates in comparison to persons from the UK, but their actual rates are somewhat lower due to the higher incidence of very recent migrants from those regions. In contrast, migrants from both Southern and Western Europe have somewhat lower rates than might be expected given their generally longer timeframes as Australian residents.
Page 32 of 39
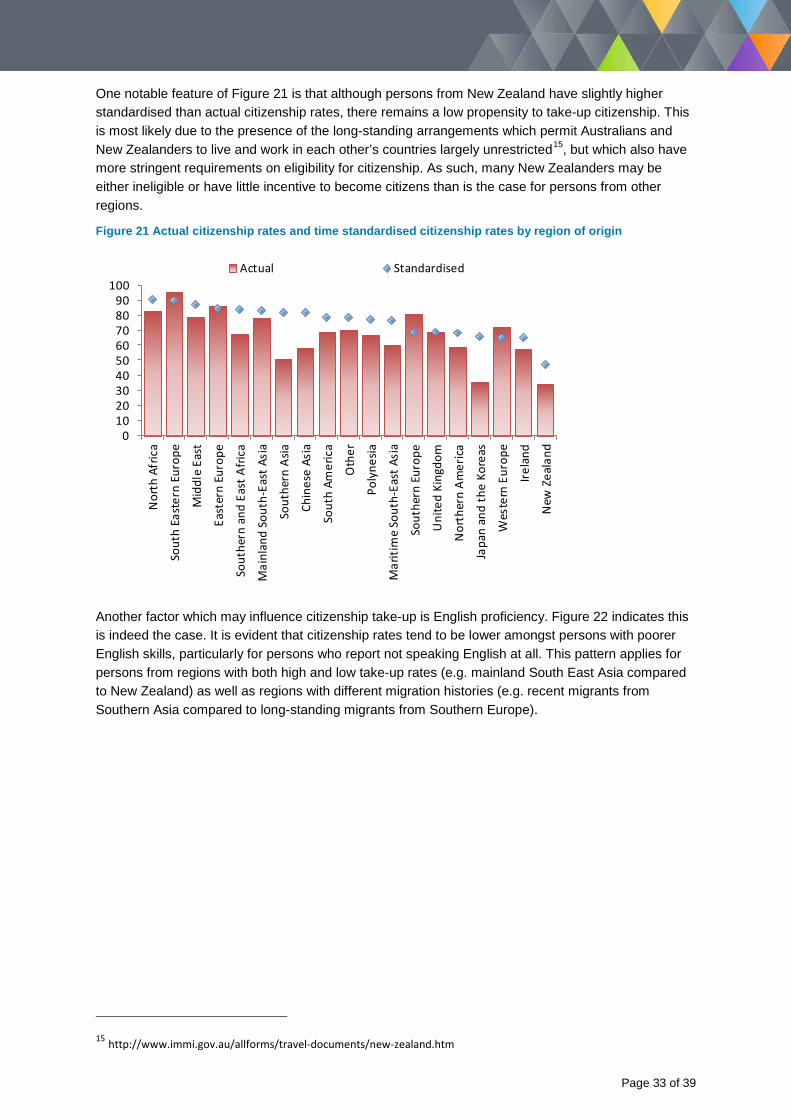
One notable feature of Figure 21 is that although persons from New Zealand have slightly higher standardised than actual citizenship rates, there remains a low propensity to take-up citizenship. This is most likely due to the presence of the long-standing arrangements which permit Australians and New Zealanders to live and work in each other’s countries largely unrestricted15, but which also have more stringent requirements on eligibility for citizenship. As such, many New Zealanders may be either ineligible or have little incentive to become citizens than is the case for persons from other regions.
Figure 21 Actual citizenship rates and time standardised citizenship rates by region of origin
0102030405060708090
100
Nor
th A
fric
a
Sout
h Ea
ster
n Eu
rope
Mid
dle
East
East
ern
Euro
pe
Sout
hern
and
Eas
t Afri
ca
Mai
nlan
d So
uth-
East
Asi
a
Sout
hern
Asia
Chin
ese
Asia
Sout
h Am
eric
a
Oth
er
Poly
nesia
Mar
itim
e So
uth-
East
Asi
a
Sout
hern
Eur
ope
Uni
ted
King
dom
Nor
ther
n Am
erica
Japa
n an
d th
e Ko
reas
Wes
tern
Eur
ope
Irela
nd
New
Zea
land
Actual Standardised
Another factor which may influence citizenship take-up is English proficiency. Figure 22 indicates this is indeed the case. It is evident that citizenship rates tend to be lower amongst persons with poorer English skills, particularly for persons who report not speaking English at all. This pattern applies for persons from regions with both high and low take-up rates (e.g. mainland South East Asia compared to New Zealand) as well as regions with different migration histories (e.g. recent migrants from Southern Asia compared to long-standing migrants from Southern Europe).
15 http://www.immi.gov.au/allforms/travel-documents/new-zealand.htm
Page 33 of 39
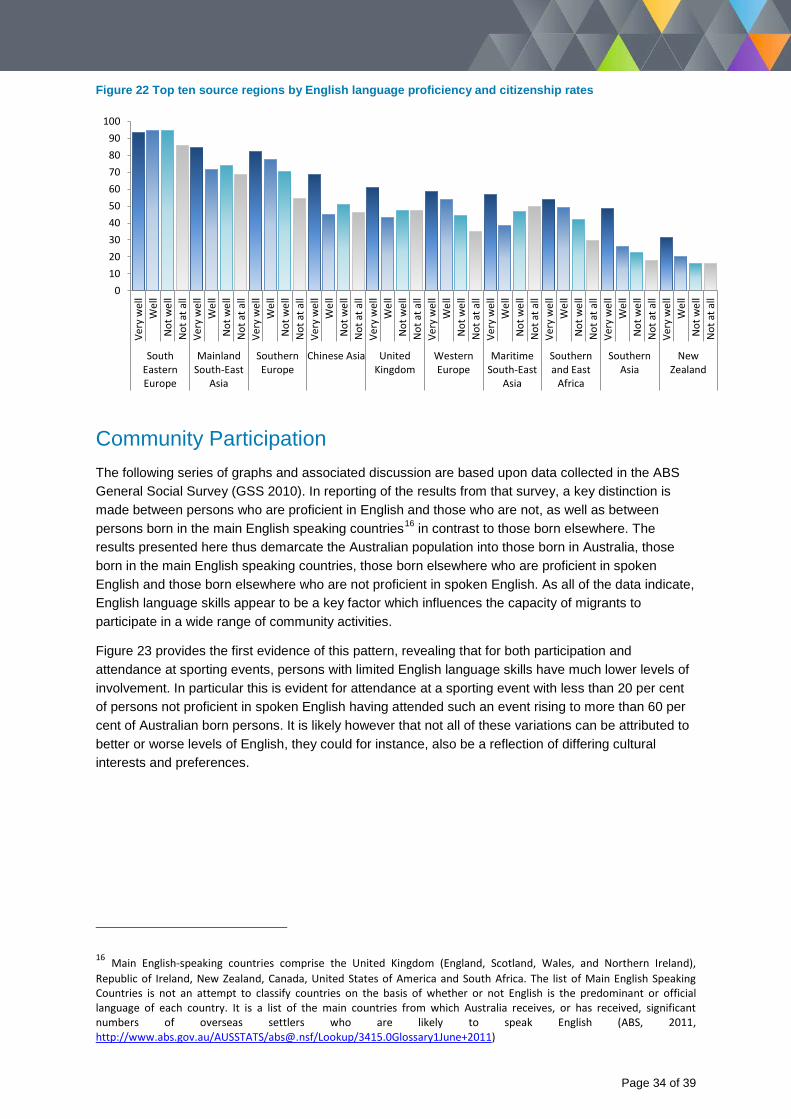
Figure 22 Top ten source regions by English language proficiency and citizenship rates
0102030405060708090
100Ve
ry w
ell
Wel
lN
ot w
ell
Not
at a
llVe
ry w
ell
Wel
lN
ot w
ell
Not
at a
llVe
ry w
ell
Wel
lN
ot w
ell
Not
at a
llVe
ry w
ell
Wel
lN
ot w
ell
Not
at a
llVe
ry w
ell
Wel
lN
ot w
ell
Not
at a
llVe
ry w
ell
Wel
lN
ot w
ell
Not
at a
llVe
ry w
ell
Wel
lN
ot w
ell
Not
at a
llVe
ry w
ell
Wel
lN
ot w
ell
Not
at a
llVe
ry w
ell
Wel
lN
ot w
ell
Not
at a
llVe
ry w
ell
Wel
lN
ot w
ell
Not
at a
ll
SouthEasternEurope
MainlandSouth-East
Asia
SouthernEurope
Chinese Asia UnitedKingdom
WesternEurope
MaritimeSouth-East
Asia
Southernand East
Africa
SouthernAsia
NewZealand
Community Participation The following series of graphs and associated discussion are based upon data collected in the ABS General Social Survey (GSS 2010). In reporting of the results from that survey, a key distinction is made between persons who are proficient in English and those who are not, as well as between persons born in the main English speaking countries16 in contrast to those born elsewhere. The results presented here thus demarcate the Australian population into those born in Australia, those born in the main English speaking countries, those born elsewhere who are proficient in spoken English and those born elsewhere who are not proficient in spoken English. As all of the data indicate, English language skills appear to be a key factor which influences the capacity of migrants to participate in a wide range of community activities.
Figure 23 provides the first evidence of this pattern, revealing that for both participation and attendance at sporting events, persons with limited English language skills have much lower levels of involvement. In particular this is evident for attendance at a sporting event with less than 20 per cent of persons not proficient in spoken English having attended such an event rising to more than 60 per cent of Australian born persons. It is likely however that not all of these variations can be attributed to better or worse levels of English, they could for instance, also be a reflection of differing cultural interests and preferences.
16 Main English-speaking countries comprise the United Kingdom (England, Scotland, Wales, and Northern Ireland), Republic of Ireland, New Zealand, Canada, United States of America and South Africa. The list of Main English Speaking Countries is not an attempt to classify countries on the basis of whether or not English is the predominant or official language of each country. It is a list of the main countries from which Australia receives, or has received, significant numbers of overseas settlers who are likely to speak English (ABS, 2011, http://www.abs.gov.au/AUSSTATS/[email protected]/Lookup/3415.0Glossary1June+2011)
Page 34 of 39

Figure 23 Participation in sport/physical activity or attendance at sporting events by birthplace and language proficiency, GSS 2010
01020304050607080
Participated in sport/physical activity Attended a sporting event
Per c
ent
Born in Australia Born in main English-speaking countriesProficient in spoken English Not proficient in spoken English
This overall pattern is less apparent when attendance at cultural institutions and events is considered. In Figure 24 it is evident that Australian born persons have the lowest rate of attendance at a public library (43 per cent), but rate highly for attendance at movies, concerts and the theatre. For the other three domains detailed in Figure 24, those not proficient in spoken English are much less likely to have participated than all other groups. For example, while 69 per cent or more of the other three groups reported attending a movie, concert or theatre event, just 30 per cent of the non-English proficient cohort had been to such an event.
Figure 24 Attendance at selected cultural institutions and events, by birthplace and language proficiency, GSS 2010
Page 35 of 39
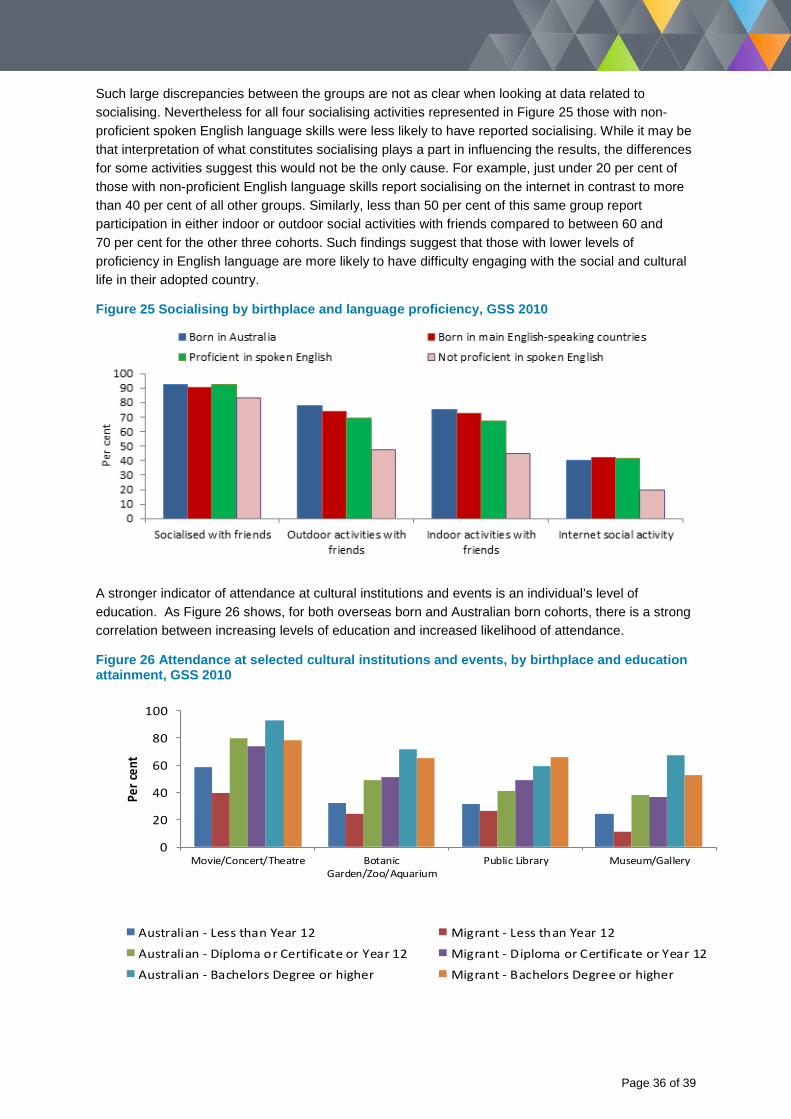
Such large discrepancies between the groups are not as clear when looking at data related to socialising. Nevertheless for all four socialising activities represented in Figure 25 those with non-proficient spoken English language skills were less likely to have reported socialising. While it may be that interpretation of what constitutes socialising plays a part in influencing the results, the differences for some activities suggest this would not be the only cause. For example, just under 20 per cent of those with non-proficient English language skills report socialising on the internet in contrast to more than 40 per cent of all other groups. Similarly, less than 50 per cent of this same group report participation in either indoor or outdoor social activities with friends compared to between 60 and 70 per cent for the other three cohorts. Such findings suggest that those with lower levels of proficiency in English language are more likely to have difficulty engaging with the social and cultural life in their adopted country.
Figure 25 Socialising by birthplace and language proficiency, GSS 2010
A stronger indicator of attendance at cultural institutions and events is an individual’s level of education. As Figure 26 shows, for both overseas born and Australian born cohorts, there is a strong correlation between increasing levels of education and increased likelihood of attendance.
Figure 26 Attendance at selected cultural institutions and events, by birthplace and education attainment, GSS 2010
0
20
40
60
80
100
Movie/Concert/Theatre BotanicGarden/Zoo/Aquarium
Public Library Museum/Gallery
Per c
ent
Australian - Less than Year 12 Migrant - Less than Year 12
Australian - Diploma or Certificate or Year 12 Migrant - Diploma or Certificate or Year 12
Australian - Bachelors Degree or higher Migrant - Bachelors Degree or higher
Page 36 of 39
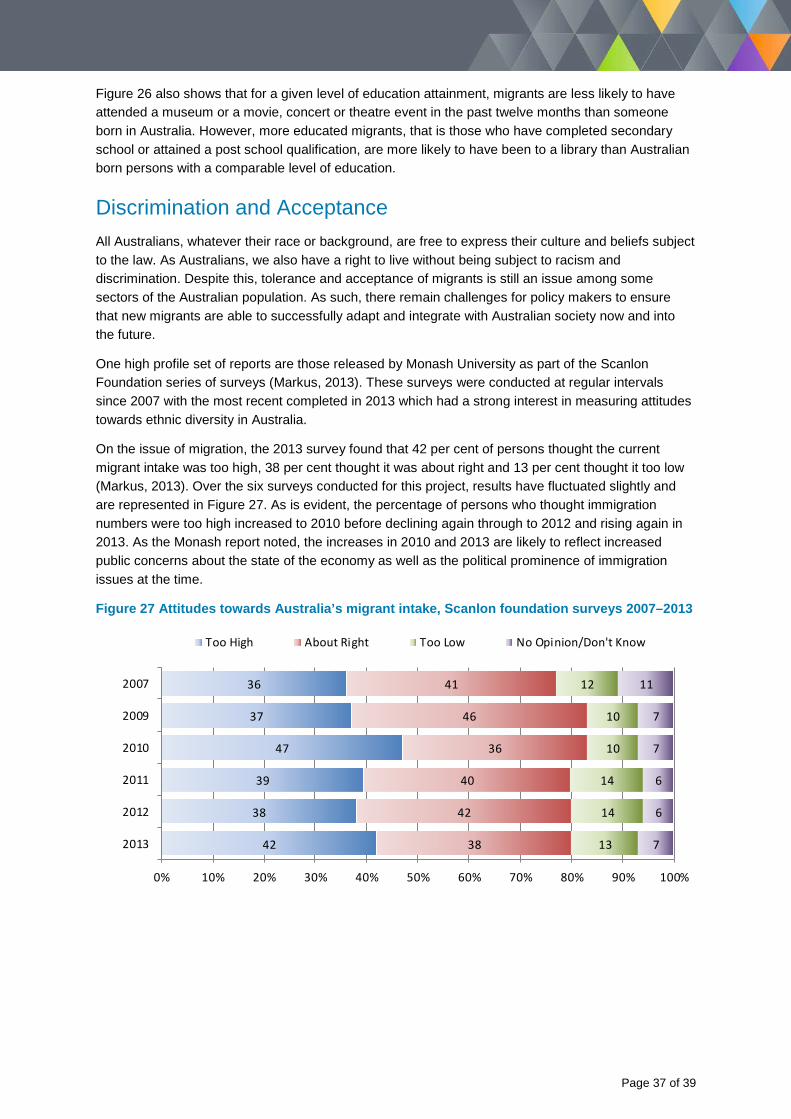
Figure 26 also shows that for a given level of education attainment, migrants are less likely to have attended a museum or a movie, concert or theatre event in the past twelve months than someone born in Australia. However, more educated migrants, that is those who have completed secondary school or attained a post school qualification, are more likely to have been to a library than Australian born persons with a comparable level of education.
Discrimination and Acceptance All Australians, whatever their race or background, are free to express their culture and beliefs subject to the law. As Australians, we also have a right to live without being subject to racism and discrimination. Despite this, tolerance and acceptance of migrants is still an issue among some sectors of the Australian population. As such, there remain challenges for policy makers to ensure that new migrants are able to successfully adapt and integrate with Australian society now and into the future.
One high profile set of reports are those released by Monash University as part of the Scanlon Foundation series of surveys (Markus, 2013). These surveys were conducted at regular intervals since 2007 with the most recent completed in 2013 which had a strong interest in measuring attitudes towards ethnic diversity in Australia.
On the issue of migration, the 2013 survey found that 42 per cent of persons thought the current migrant intake was too high, 38 per cent thought it was about right and 13 per cent thought it too low (Markus, 2013). Over the six surveys conducted for this project, results have fluctuated slightly and are represented in Figure 27. As is evident, the percentage of persons who thought immigration numbers were too high increased to 2010 before declining again through to 2012 and rising again in 2013. As the Monash report noted, the increases in 2010 and 2013 are likely to reflect increased public concerns about the state of the economy as well as the political prominence of immigration issues at the time.
Figure 27 Attitudes towards Australia’s migrant intake, Scanlon foundation surveys 2007–2013
36
37
47
39
38
42
41
46
36
40
42
38
12
10
10
14
14
13
11
7
7
6
6
7
0% 10% 20% 30% 40% 50% 60% 70% 80% 90% 100%
2007
2009
2010
2011
2012
2013
Too High About Right Too Low No Opinion/Don't Know
Page 37 of 39
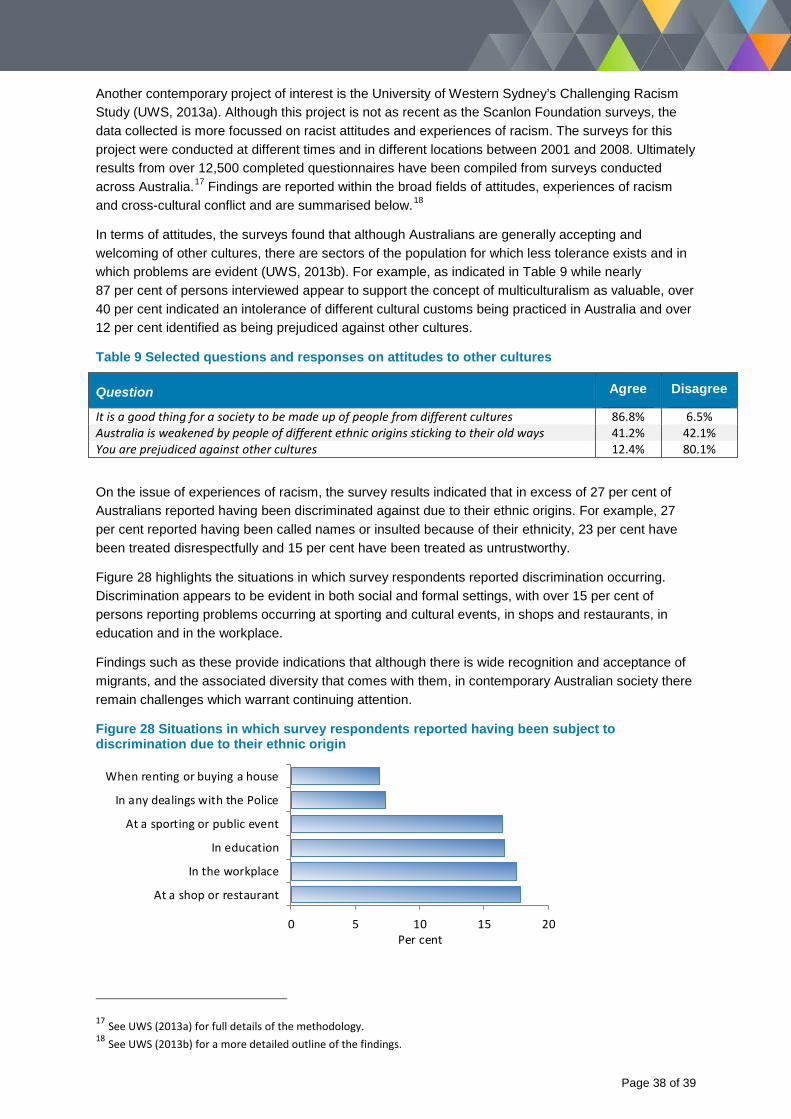
Another contemporary project of interest is the University of Western Sydney’s Challenging Racism Study (UWS, 2013a). Although this project is not as recent as the Scanlon Foundation surveys, the data collected is more focussed on racist attitudes and experiences of racism. The surveys for this project were conducted at different times and in different locations between 2001 and 2008. Ultimately results from over 12,500 completed questionnaires have been compiled from surveys conducted across Australia.17 Findings are reported within the broad fields of attitudes, experiences of racism and cross-cultural conflict and are summarised below.18
In terms of attitudes, the surveys found that although Australians are generally accepting and welcoming of other cultures, there are sectors of the population for which less tolerance exists and in which problems are evident (UWS, 2013b). For example, as indicated in Table 9 while nearly 87 per cent of persons interviewed appear to support the concept of multiculturalism as valuable, over 40 per cent indicated an intolerance of different cultural customs being practiced in Australia and over 12 per cent identified as being prejudiced against other cultures.
Table 9 Selected questions and responses on attitudes to other cultures
Question Agree Disagree
It is a good thing for a society to be made up of people from different cultures 86.8% 6.5% Australia is weakened by people of different ethnic origins sticking to their old ways 41.2% 42.1% You are prejudiced against other cultures 12.4% 80.1%
On the issue of experiences of racism, the survey results indicated that in excess of 27 per cent of Australians reported having been discriminated against due to their ethnic origins. For example, 27 per cent reported having been called names or insulted because of their ethnicity, 23 per cent have been treated disrespectfully and 15 per cent have been treated as untrustworthy.
Figure 28 highlights the situations in which survey respondents reported discrimination occurring. Discrimination appears to be evident in both social and formal settings, with over 15 per cent of persons reporting problems occurring at sporting and cultural events, in shops and restaurants, in education and in the workplace.
Findings such as these provide indications that although there is wide recognition and acceptance of migrants, and the associated diversity that comes with them, in contemporary Australian society there remain challenges which warrant continuing attention.
Figure 28 Situations in which survey respondents reported having been subject to discrimination due to their ethnic origin
0 5 10 15 20
At a shop or restaurant
In the workplace
In education
At a sporting or public event
In any dealings with the Police
When renting or buying a house
Per cent
17 See UWS (2013a) for full details of the methodology. 18 See UWS (2013b) for a more detailed outline of the findings.
Page 38 of 39
References ABS (2010) General Social Survey: Summary Results (ABS cat. no. 4159.0), Australian Bureau of
Statistics, Canberra.
ABS (2011a) Census of Population and Housing 2011 (TableBuilder: Counting Persons, Place of Usual Residence), Australian Bureau of Statistics, Canberra.
ABS (2011b) Migrant Data Matrices: Glossary of Migrant Related Terms (ABS cat. no. 3415.0), Australian Bureau of Statistics, Canberra.
ABS (2013) Perspectives on Migrants, Migrant Families in Australia (ABS cat. no. 3416.0), Australian Bureau of Statistics, Canberra.
ABS (2014a) Australian Social Trends-Where do Migrants Live? (ABS cat. no. 4102.0), Australian Bureau of Statistics, Canberra.
ABS (2014b) Australian Census and Migrants Integrated Dataset 2011 (ABS cat. no. 3417.0.55.001), Australian Bureau of Statistics, Canberra.
DIAC (2013) The Continuous Survey of Australia’s Migrants, Cohorts 1 to 5 Report 2009–11, Department of Immigration and Citizenship, Canberra.
Markus, A. (2013) Mapping Social Cohesion: the Scanlon Foundation Surveys 2013, National Report, Monash University, Caulfield East.
UWS (2013a) Challenging Racism Project: Method and Surveys, University of Western Sydney, Sydney.
UWS (2013b) Challenging Racism Project: National Level Findings, University of Western Sydney, Sydney.
Page 39 of 39
Recommended