The Proper Use of Simulation Technology for Collision and Rollover
Reconstructions and Highway Safety
Brian G McHenry
© McHenry Software, Inc.
2015 IPTM Special Problems, May 18, 2015
ABSTRACT
The principals at McHenry Software, Inc. (MSI), Raymond & Brian McHenry, have been active in the
field of highway safety research for a combined period of over 90 years. In that time they have
performed research for NHTSA, FHWA, NTSB, public and private research organizations and MSI
internal development through which they have invented, developed and enhanced the state-of-the art of
collision and rollover simulation programs and other reconstruction tools. The programs include
CRASH, SMAC and HVOSM which are acronyms for accident simulation and collision reconstruction
programs invented by Ray McHenry and on which Ray and Brian have extensively researched,
developed and published. These programs form the foundation for many of the accident reconstruction
and simulation tools in widespread use today.
Mr. McHenry will present a background on these programs, present some of their unique validations and
enhancements, as well as present more recent validation and correlation tests of their three-dimensional
next generation combination of these programs: msmac3D. The lecture will provide a discussion of the
proper demonstration of the validity of simulation and other reconstruction programs used for motor
vehicle collisions, rollovers, pole impacts and other types of highway accidents.
Mr. McHenry will also discuss procedures to insure accuracy and reliability when performing
reconstructions of highway accidents using these or any other simulation or reconstruction programs.
He will include an explanation of key elements which should be included in any analysis both before,
during and after the use of simulation or reconstruction programs in order to achieve the most reliable
and accurate determinations of vehicle speeds, impact speed changes and contributing factors of
accidents based on the factual evidence available.
INTRODUCTION
Today, on a PC or MAC laptop or desktop, anyone can easily and affordably make 3-Dimensional
animations which can rival Hollywood's best. With these phenomenal capabilities at your fingertips, it
can be very easy to make anything imagined look very realistic.
For example, a sample application which is included with some animation software is how to make a
cow fly! By following the example, anyone can create an animation of a cow flying. And very quickly
and easily someone could create a very realistic animation such that upon viewing the animation you
might believe that cows do indeed fly!
The Proper Use of Simulation Technology for Collision and Rollover Reconstructions and Highway Safety Brian G McHenry, © McHenry Software, Inc. 2015 IPTM Special Problems, May 18, 2015 Page 2
mchenrysoftware.com
So let us take this a bit further: Let's substitute a pig for the cow. And let’s say there is a court hearing to
determine whether pigs fly. And at the court, an expert with an advanced degree from an esteemed
university and years of experience testifies that 'pigs can fly!' and as part of the testimony the expert
offers a video to prove it! Well everyone know that pigs don't fly, yet, when the expert, with impeccable
and impressive academic credentials, counters that argument and supplements it with a realistic looking
movie of a pig flying, how will the jury avoid being swayed to believe something that we all know is
obviously not true.
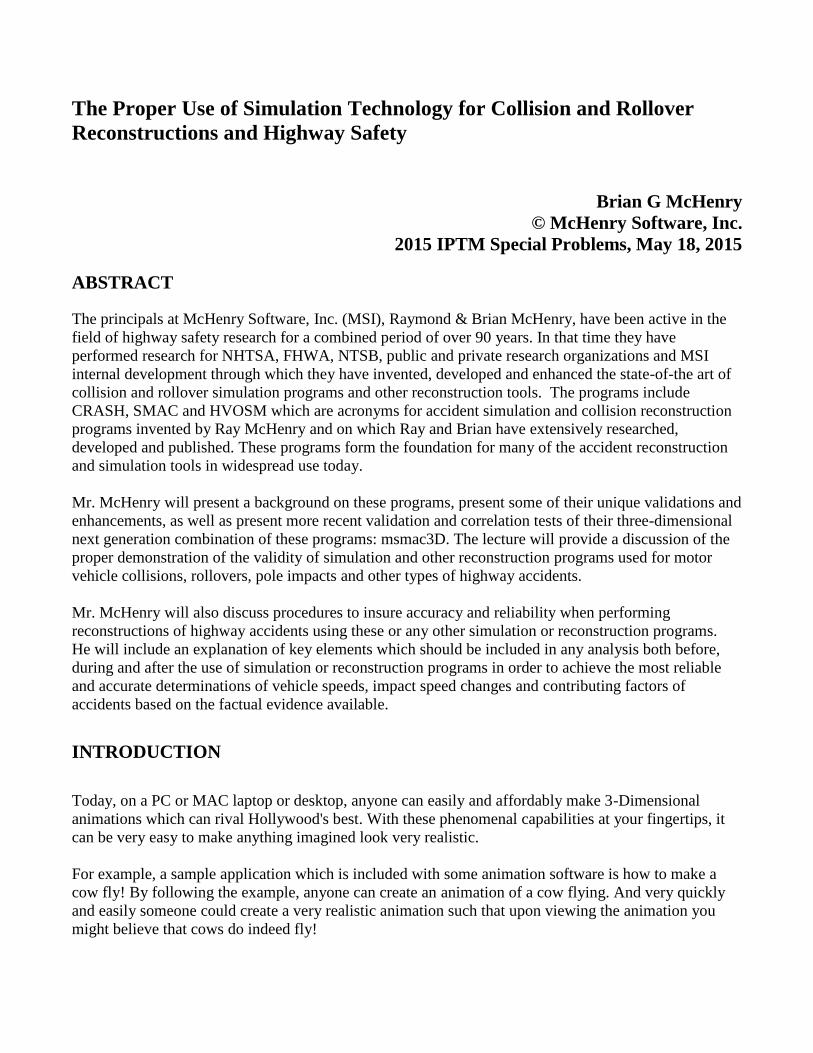
Figure 1 A flying pig from a Time Warner Cable commercial
For a sample of proof that ‘pigs fly’ take a look at an example from a Time Warner Cable Commercial
"Pigs", animated by la maison, directed by Bruno Aveillan [1]
In consideration of this extreme example you might begin to understand the possible problems which
can occur with improper application of simulation and/or animation. The field of accident reconstruction
has an increasing use (and abuse) of animation techniques for demonstrative evidence purposes.
So you may find yourself, either as an expert or attorney or defendant, being faced with an accident
reconstruction supplemented with a very realistic looking 3-dimensional animation.
The topic of this paper is “The Proper Use of Simulation Technology for Collision and Rollover
Reconstructions and Highway Safety:” This will include an overview of the origins, capabilities and
limitations of computer simulation programs which are used for reconstruction of collision and rollover
accidents to help you understand and identify when you might be faced with an expert trying to make
pigs fly!
QUOTES ON WHAT IS ACCIDENT RECONSTRUCTION?
“The process of reconstructing a collision must be seen as first collecting evidence from the accident site,
police report and photos, next obtaining from data sources the available vehicle specifications, and then
choosing a collision reconstruction technique to perform the most accurate and reliable reconstruction for
the data collected and time available.”
“Starting with a conclusion is a common way to take a wrong turn in accident reconstruction”.
“The fact that one believes strongly in an opinion is no proof of its validity”
J. Stannard Baker, Traffic Accident Reconstruction, Northwestern University Traffic Institute, 1990
“As scientists, engineers and accident reconstructionists, we should not let the unlimited possibilities of
making anything look real (with animation) obscure our duty to perform a careful and detailed
engineering analysis while also continually testing and evaluating the applied techniques, including
computer programs, to achieve the most accurate reconstruction possible.”
McHenry & McHenry, McHenry Accident Reconstruction, 2008 , McHenry Software
The Proper Use of Simulation Technology for Collision and Rollover Reconstructions and Highway Safety Brian G McHenry, © McHenry Software, Inc. 2015 IPTM Special Problems, May 18, 2015 Page 3
mchenrysoftware.com
BACKGROUND ON ACCIDENT RECONSTRUCTION
The process of reconstructing a motor vehicle collision involves collecting all available information about
the interaction of the vehicles including vehicle trajectory information, damage information, vehicle
specifications and scene information.
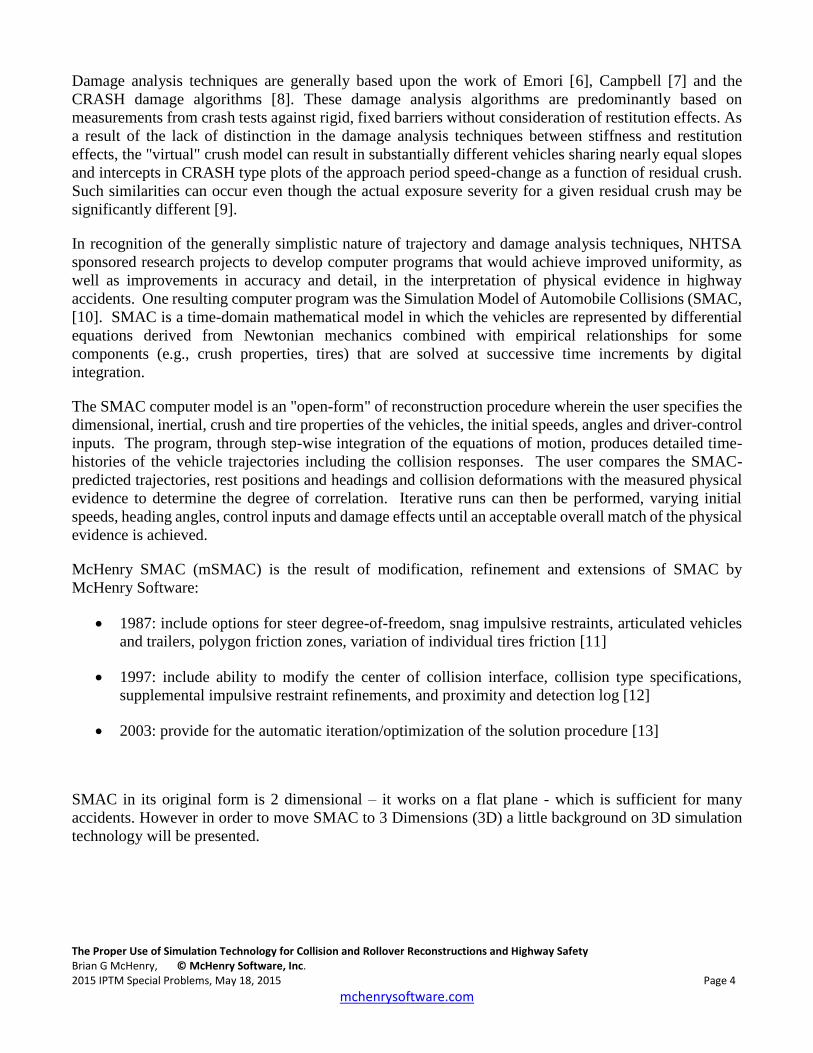
The trajectory information is gathered based upon the police measurements, photographs and scene
evidence documentation (skid marks, gouges, etc.). To characterize the interaction of the vehicles the
approximate location of the area of impact, the measured positions and heading angles at rest and any skid
and gouge marks should be memorialized. Technological advances in survey and measurement equipment
have made equipment available to police and investigators which can quickly, efficiently and accurately
memorialize vehicle accident scenes (e.g., Figure 2). There has been work on standards for the
preservation of evidence like SAE J1674 [2]
Figure 2 Sample scene diagram and vehicle damage measurements
The damage information includes measured dimensions of the damage locations and extents (e.g., Figure
2). The standard procedure by which damage is characterized is the Collision Deformation Classification
(CDC, [3]) and the Equidistant Crush Measurement (ECM, [4]). There have also been advances made in
the detailed measurements of the damage to vehicles through survey or laser measurement techniques.
Next comes collecting vehicle specifications and scene information (roadway layout and topography)
which completes the required data to permit the performance of an accident reconstruction.
Collision reconstruction techniques are then applied to make a preliminary determination of the impact
speeds and impact speed changes (ΔV's). There are two basic reconstruction techniques utilized for
performing a preliminary accident reconstruction: Trajectory analysis techniques and damage analysis
techniques.
Trajectory analysis techniques are based on applications of the principles of Conservation of Linear and
Angular Momentum and they frequently include the simplifying assumptions of instantaneous exchange
of momentum, no consideration for tire-to-ground "external" forces during the collision, and straight line
travel from separation to rest [5, p84-85].
The Proper Use of Simulation Technology for Collision and Rollover Reconstructions and Highway Safety Brian G McHenry, © McHenry Software, Inc. 2015 IPTM Special Problems, May 18, 2015 Page 4
mchenrysoftware.com
Damage analysis techniques are generally based upon the work of Emori [6], Campbell [7] and the
CRASH damage algorithms [8]. These damage analysis algorithms are predominantly based on
measurements from crash tests against rigid, fixed barriers without consideration of restitution effects. As
a result of the lack of distinction in the damage analysis techniques between stiffness and restitution
effects, the "virtual" crush model can result in substantially different vehicles sharing nearly equal slopes
and intercepts in CRASH type plots of the approach period speed-change as a function of residual crush.
Such similarities can occur even though the actual exposure severity for a given residual crush may be
significantly different [9].
In recognition of the generally simplistic nature of trajectory and damage analysis techniques, NHTSA
sponsored research projects to develop computer programs that would achieve improved uniformity, as
well as improvements in accuracy and detail, in the interpretation of physical evidence in highway
accidents. One resulting computer program was the Simulation Model of Automobile Collisions (SMAC,
[10]. SMAC is a time-domain mathematical model in which the vehicles are represented by differential
equations derived from Newtonian mechanics combined with empirical relationships for some
components (e.g., crush properties, tires) that are solved at successive time increments by digital
integration.
The SMAC computer model is an "open-form" of reconstruction procedure wherein the user specifies the
dimensional, inertial, crush and tire properties of the vehicles, the initial speeds, angles and driver-control
inputs. The program, through step-wise integration of the equations of motion, produces detailed time-
histories of the vehicle trajectories including the collision responses. The user compares the SMAC-
predicted trajectories, rest positions and headings and collision deformations with the measured physical
evidence to determine the degree of correlation. Iterative runs can then be performed, varying initial
speeds, heading angles, control inputs and damage effects until an acceptable overall match of the physical
evidence is achieved.
McHenry SMAC (mSMAC) is the result of modification, refinement and extensions of SMAC by
McHenry Software:
1987: include options for steer degree-of-freedom, snag impulsive restraints, articulated vehicles
and trailers, polygon friction zones, variation of individual tires friction [11]
1997: include ability to modify the center of collision interface, collision type specifications,
supplemental impulsive restraint refinements, and proximity and detection log [12]
2003: provide for the automatic iteration/optimization of the solution procedure [13]
SMAC in its original form is 2 dimensional – it works on a flat plane - which is sufficient for many
accidents. However in order to move SMAC to 3 Dimensions (3D) a little background on 3D simulation
technology will be presented.
The Proper Use of Simulation Technology for Collision and Rollover Reconstructions and Highway Safety Brian G McHenry, © McHenry Software, Inc. 2015 IPTM Special Problems, May 18, 2015 Page 5
mchenrysoftware.com
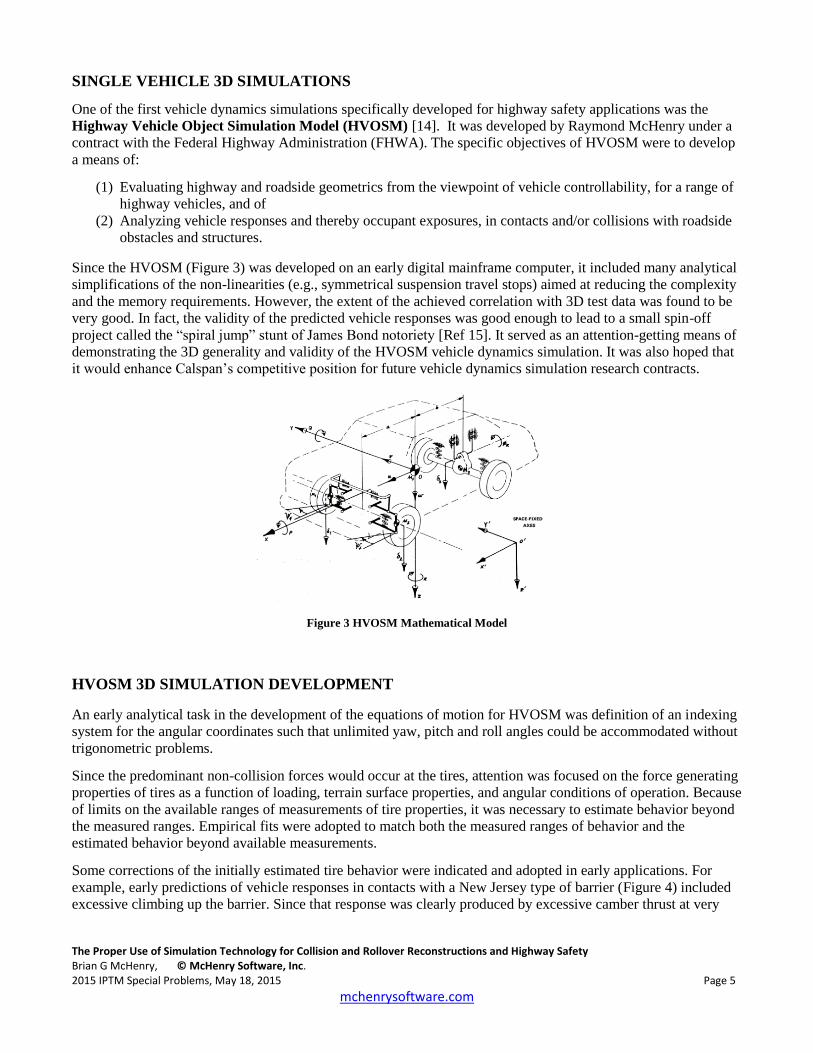
SINGLE VEHICLE 3D SIMULATIONS
One of the first vehicle dynamics simulations specifically developed for highway safety applications was the
Highway Vehicle Object Simulation Model (HVOSM) [14]. It was developed by Raymond McHenry under a
contract with the Federal Highway Administration (FHWA). The specific objectives of HVOSM were to develop
a means of:
(1) Evaluating highway and roadside geometrics from the viewpoint of vehicle controllability, for a range of
highway vehicles, and of
(2) Analyzing vehicle responses and thereby occupant exposures, in contacts and/or collisions with roadside
obstacles and structures.
Since the HVOSM (Figure 3) was developed on an early digital mainframe computer, it included many analytical
simplifications of the non-linearities (e.g., symmetrical suspension travel stops) aimed at reducing the complexity
and the memory requirements. However, the extent of the achieved correlation with 3D test data was found to be
very good. In fact, the validity of the predicted vehicle responses was good enough to lead to a small spin-off
project called the “spiral jump” stunt of James Bond notoriety [Ref 15]. It served as an attention-getting means of
demonstrating the 3D generality and validity of the HVOSM vehicle dynamics simulation. It was also hoped that
it would enhance Calspan’s competitive position for future vehicle dynamics simulation research contracts.
Figure 3 HVOSM Mathematical Model
HVOSM 3D SIMULATION DEVELOPMENT
An early analytical task in the development of the equations of motion for HVOSM was definition of an indexing
system for the angular coordinates such that unlimited yaw, pitch and roll angles could be accommodated without
trigonometric problems.
Since the predominant non-collision forces would occur at the tires, attention was focused on the force generating
properties of tires as a function of loading, terrain surface properties, and angular conditions of operation. Because
of limits on the available ranges of measurements of tire properties, it was necessary to estimate behavior beyond
the measured ranges. Empirical fits were adopted to match both the measured ranges of behavior and the
estimated behavior beyond available measurements.
Some corrections of the initially estimated tire behavior were indicated and adopted in early applications. For
example, early predictions of vehicle responses in contacts with a New Jersey type of barrier (Figure 4) included
excessive climbing up the barrier. Since that response was clearly produced by excessive camber thrust at very
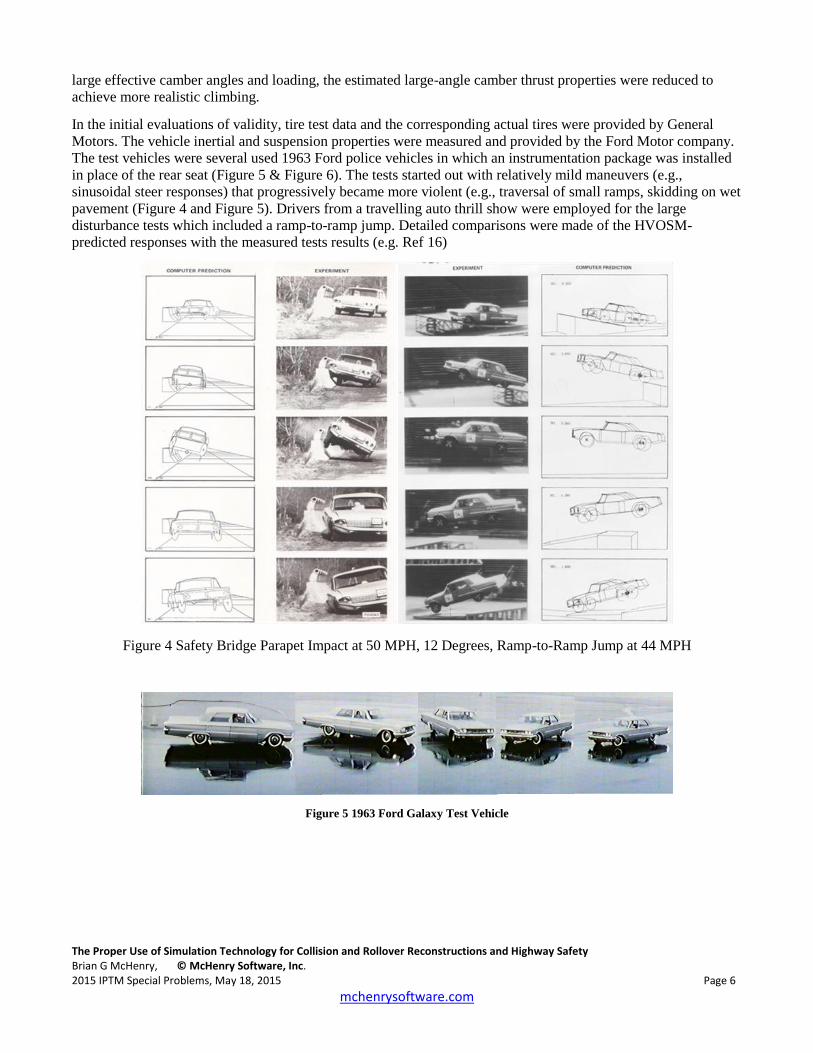
The Proper Use of Simulation Technology for Collision and Rollover Reconstructions and Highway Safety Brian G McHenry, © McHenry Software, Inc. 2015 IPTM Special Problems, May 18, 2015 Page 6
mchenrysoftware.com
large effective camber angles and loading, the estimated large-angle camber thrust properties were reduced to
achieve more realistic climbing.
In the initial evaluations of validity, tire test data and the corresponding actual tires were provided by General
Motors. The vehicle inertial and suspension properties were measured and provided by the Ford Motor company.
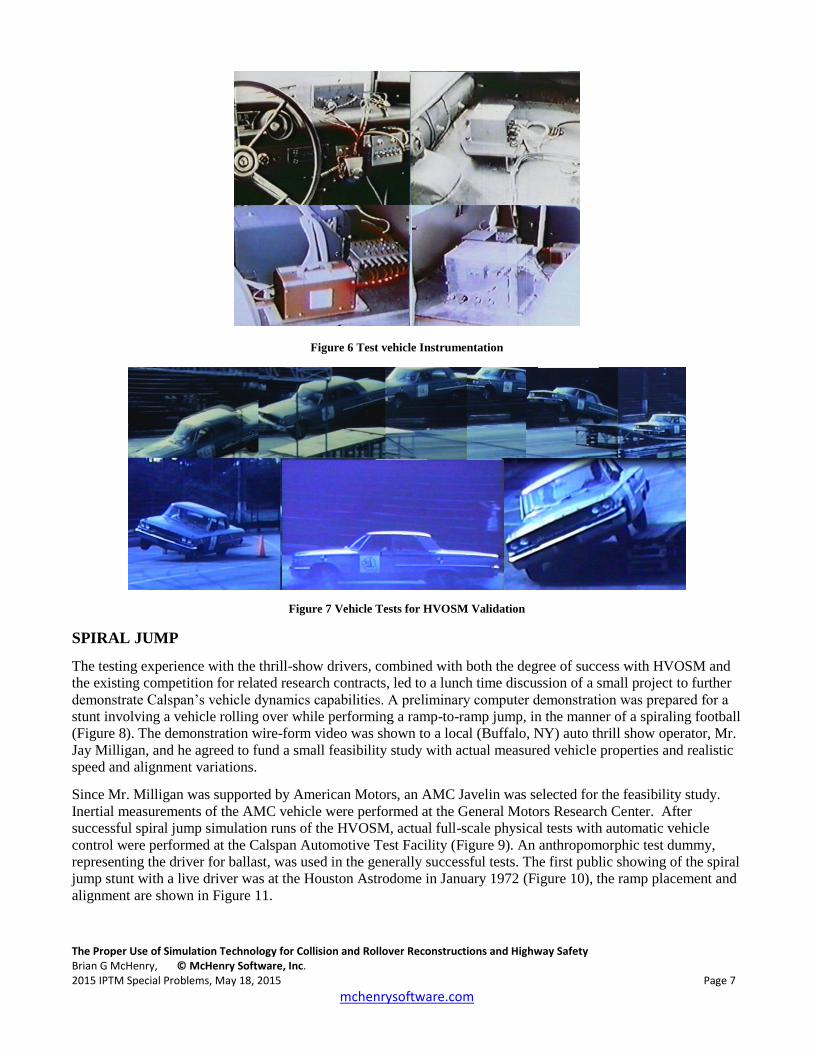
The test vehicles were several used 1963 Ford police vehicles in which an instrumentation package was installed
in place of the rear seat (Figure 5 & Figure 6). The tests started out with relatively mild maneuvers (e.g.,
sinusoidal steer responses) that progressively became more violent (e.g., traversal of small ramps, skidding on wet
pavement (Figure 4 and Figure 5). Drivers from a travelling auto thrill show were employed for the large
disturbance tests which included a ramp-to-ramp jump. Detailed comparisons were made of the HVOSM-
predicted responses with the measured tests results (e.g. Ref 16)
Figure 4 Safety Bridge Parapet Impact at 50 MPH, 12 Degrees, Ramp-to-Ramp Jump at 44 MPH
Figure 5 1963 Ford Galaxy Test Vehicle
The Proper Use of Simulation Technology for Collision and Rollover Reconstructions and Highway Safety Brian G McHenry, © McHenry Software, Inc. 2015 IPTM Special Problems, May 18, 2015 Page 7
mchenrysoftware.com
Figure 6 Test vehicle Instrumentation
Figure 7 Vehicle Tests for HVOSM Validation
SPIRAL JUMP
The testing experience with the thrill-show drivers, combined with both the degree of success with HVOSM and
the existing competition for related research contracts, led to a lunch time discussion of a small project to further
demonstrate Calspan’s vehicle dynamics capabilities. A preliminary computer demonstration was prepared for a
stunt involving a vehicle rolling over while performing a ramp-to-ramp jump, in the manner of a spiraling football
(Figure 8). The demonstration wire-form video was shown to a local (Buffalo, NY) auto thrill show operator, Mr.
Jay Milligan, and he agreed to fund a small feasibility study with actual measured vehicle properties and realistic
speed and alignment variations.
Since Mr. Milligan was supported by American Motors, an AMC Javelin was selected for the feasibility study.
Inertial measurements of the AMC vehicle were performed at the General Motors Research Center. After
successful spiral jump simulation runs of the HVOSM, actual full-scale physical tests with automatic vehicle
control were performed at the Calspan Automotive Test Facility (Figure 9). An anthropomorphic test dummy,
representing the driver for ballast, was used in the generally successful tests. The first public showing of the spiral
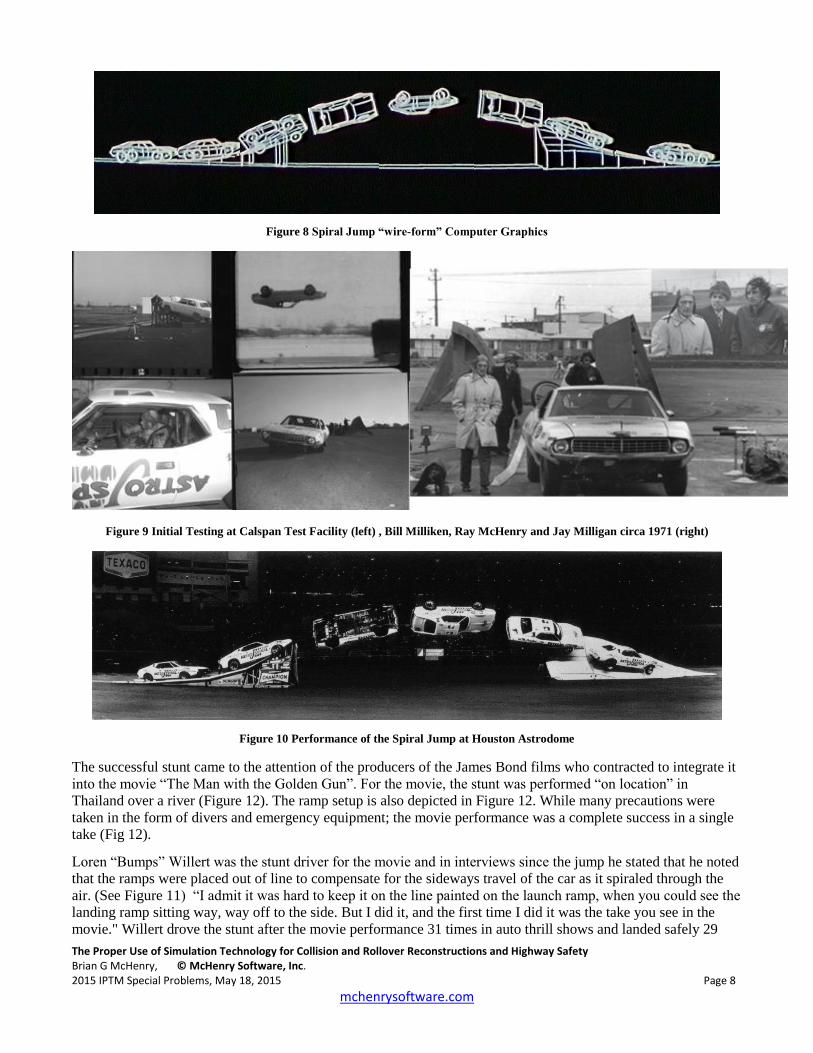
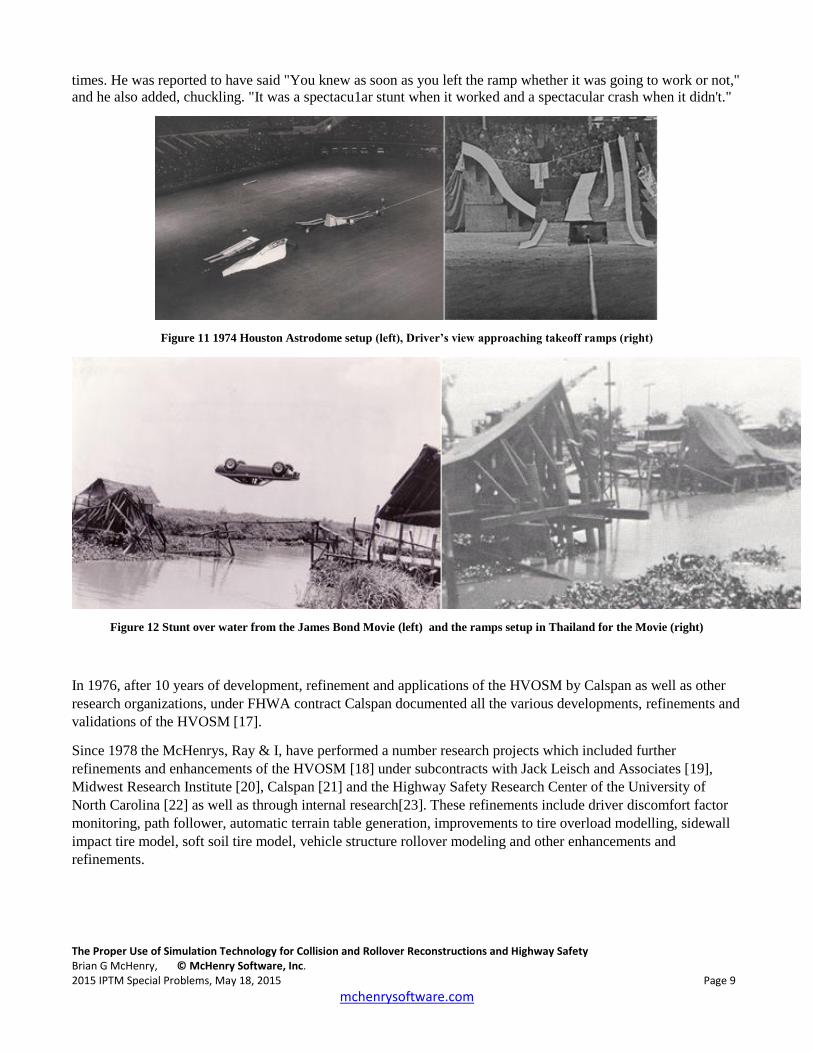
jump stunt with a live driver was at the Houston Astrodome in January 1972 (Figure 10), the ramp placement and
alignment are shown in Figure 11.
The Proper Use of Simulation Technology for Collision and Rollover Reconstructions and Highway Safety Brian G McHenry, © McHenry Software, Inc. 2015 IPTM Special Problems, May 18, 2015 Page 8
mchenrysoftware.com
Figure 8 Spiral Jump “wire-form” Computer Graphics
Figure 9 Initial Testing at Calspan Test Facility (left) , Bill Milliken, Ray McHenry and Jay Milligan circa 1971 (right)
Figure 10 Performance of the Spiral Jump at Houston Astrodome
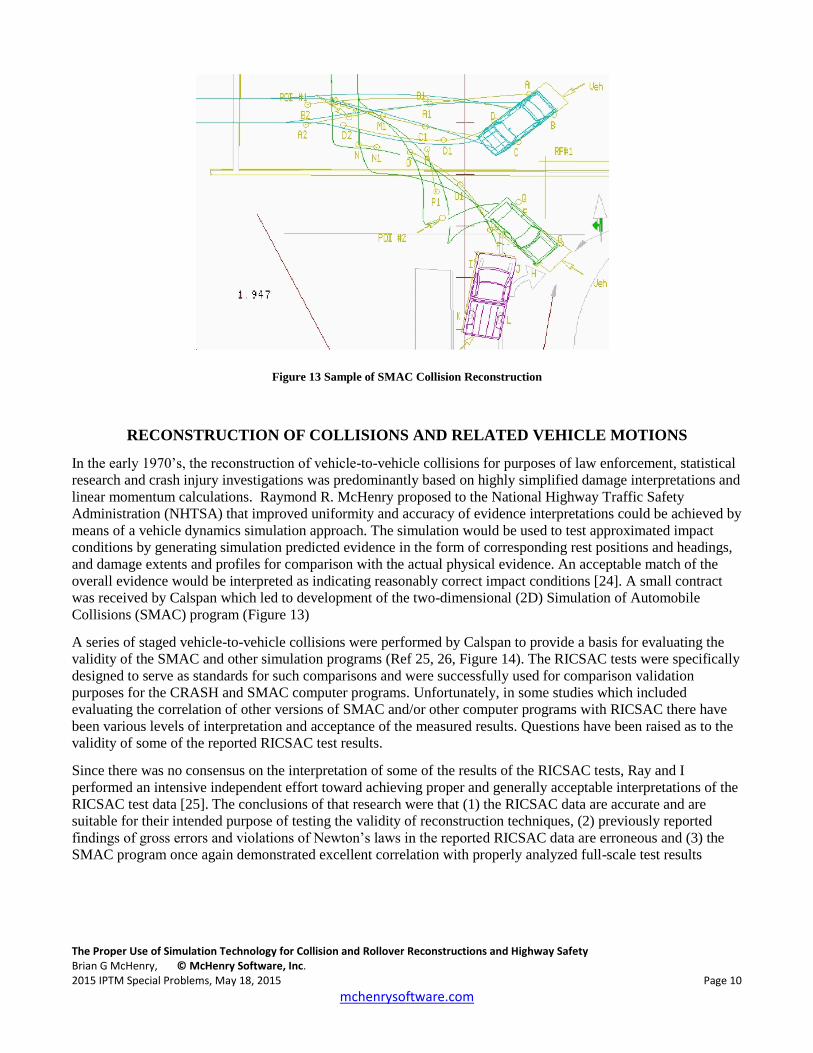
The successful stunt came to the attention of the producers of the James Bond films who contracted to integrate it
into the movie “The Man with the Golden Gun”. For the movie, the stunt was performed “on location” in
Thailand over a river (Figure 12). The ramp setup is also depicted in Figure 12. While many precautions were
taken in the form of divers and emergency equipment; the movie performance was a complete success in a single
take (Fig 12).
Loren “Bumps” Willert was the stunt driver for the movie and in interviews since the jump he stated that he noted
that the ramps were placed out of line to compensate for the sideways travel of the car as it spiraled through the
air. (See Figure 11) “I admit it was hard to keep it on the line painted on the launch ramp, when you could see the
landing ramp sitting way, way off to the side. But I did it, and the first time I did it was the take you see in the
movie." Willert drove the stunt after the movie performance 31 times in auto thrill shows and landed safely 29
The Proper Use of Simulation Technology for Collision and Rollover Reconstructions and Highway Safety Brian G McHenry, © McHenry Software, Inc. 2015 IPTM Special Problems, May 18, 2015 Page 9
mchenrysoftware.com
times. He was reported to have said "You knew as soon as you left the ramp whether it was going to work or not,"
and he also added, chuckling. "It was a spectacu1ar stunt when it worked and a spectacular crash when it didn't."
Figure 11 1974 Houston Astrodome setup (left), Driver’s view approaching takeoff ramps (right)
Figure 12 Stunt over water from the James Bond Movie (left) and the ramps setup in Thailand for the Movie (right)
In 1976, after 10 years of development, refinement and applications of the HVOSM by Calspan as well as other
research organizations, under FHWA contract Calspan documented all the various developments, refinements and
validations of the HVOSM [17].
Since 1978 the McHenrys, Ray & I, have performed a number research projects which included further
refinements and enhancements of the HVOSM [18] under subcontracts with Jack Leisch and Associates [19],
Midwest Research Institute [20], Calspan [21] and the Highway Safety Research Center of the University of
North Carolina [22] as well as through internal research[23]. These refinements include driver discomfort factor
monitoring, path follower, automatic terrain table generation, improvements to tire overload modelling, sidewall
impact tire model, soft soil tire model, vehicle structure rollover modeling and other enhancements and
refinements.
The Proper Use of Simulation Technology for Collision and Rollover Reconstructions and Highway Safety Brian G McHenry, © McHenry Software, Inc. 2015 IPTM Special Problems, May 18, 2015 Page 10
mchenrysoftware.com
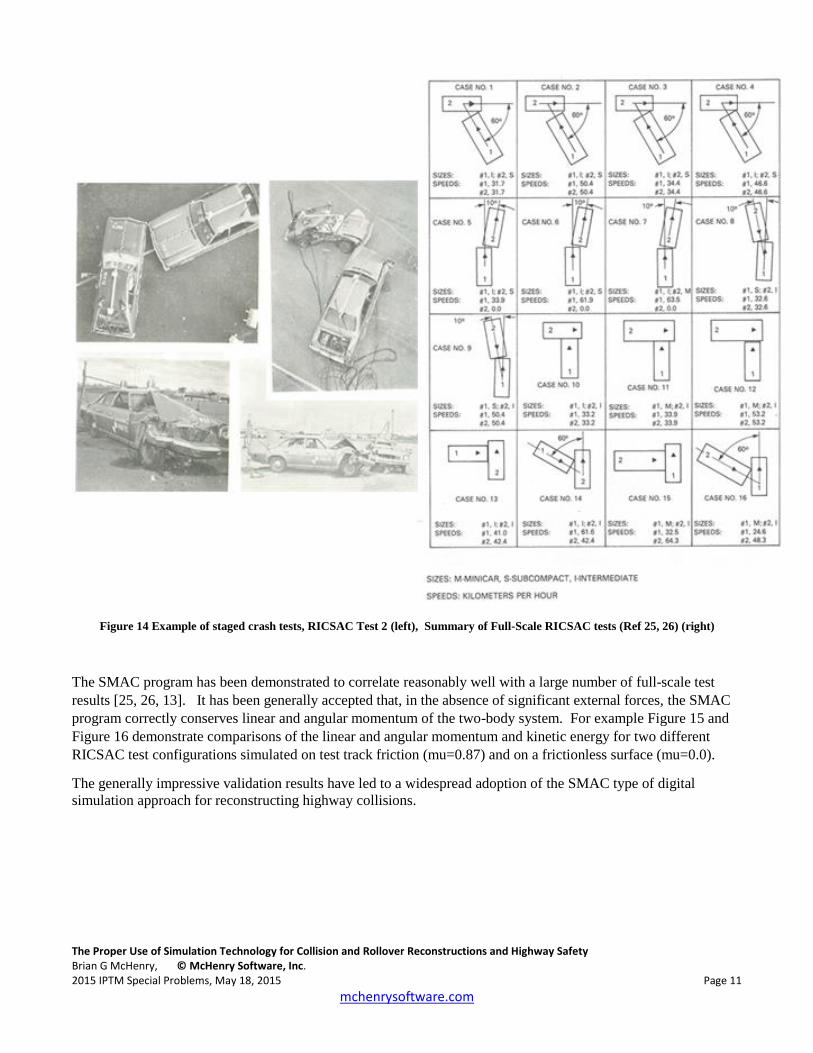
Figure 13 Sample of SMAC Collision Reconstruction
RECONSTRUCTION OF COLLISIONS AND RELATED VEHICLE MOTIONS
In the early 1970’s, the reconstruction of vehicle-to-vehicle collisions for purposes of law enforcement, statistical
research and crash injury investigations was predominantly based on highly simplified damage interpretations and
linear momentum calculations. Raymond R. McHenry proposed to the National Highway Traffic Safety
Administration (NHTSA) that improved uniformity and accuracy of evidence interpretations could be achieved by
means of a vehicle dynamics simulation approach. The simulation would be used to test approximated impact
conditions by generating simulation predicted evidence in the form of corresponding rest positions and headings,
and damage extents and profiles for comparison with the actual physical evidence. An acceptable match of the
overall evidence would be interpreted as indicating reasonably correct impact conditions [24]. A small contract
was received by Calspan which led to development of the two-dimensional (2D) Simulation of Automobile
Collisions (SMAC) program (Figure 13)
A series of staged vehicle-to-vehicle collisions were performed by Calspan to provide a basis for evaluating the
validity of the SMAC and other simulation programs (Ref 25, 26, Figure 14). The RICSAC tests were specifically
designed to serve as standards for such comparisons and were successfully used for comparison validation
purposes for the CRASH and SMAC computer programs. Unfortunately, in some studies which included
evaluating the correlation of other versions of SMAC and/or other computer programs with RICSAC there have
been various levels of interpretation and acceptance of the measured results. Questions have been raised as to the
validity of some of the reported RICSAC test results.
Since there was no consensus on the interpretation of some of the results of the RICSAC tests, Ray and I
performed an intensive independent effort toward achieving proper and generally acceptable interpretations of the
RICSAC test data [25]. The conclusions of that research were that (1) the RICSAC data are accurate and are
suitable for their intended purpose of testing the validity of reconstruction techniques, (2) previously reported
findings of gross errors and violations of Newton’s laws in the reported RICSAC data are erroneous and (3) the
SMAC program once again demonstrated excellent correlation with properly analyzed full-scale test results
The Proper Use of Simulation Technology for Collision and Rollover Reconstructions and Highway Safety Brian G McHenry, © McHenry Software, Inc. 2015 IPTM Special Problems, May 18, 2015 Page 11
mchenrysoftware.com
Figure 14 Example of staged crash tests, RICSAC Test 2 (left), Summary of Full-Scale RICSAC tests (Ref 25, 26) (right)
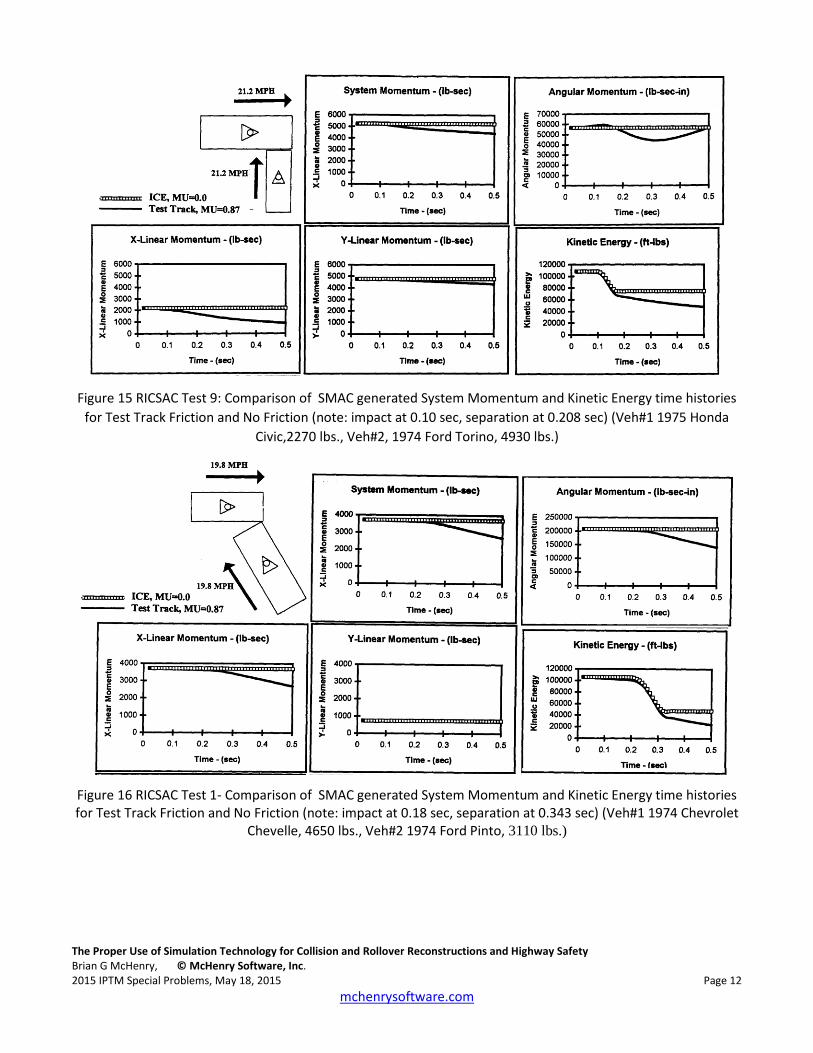
The SMAC program has been demonstrated to correlate reasonably well with a large number of full-scale test
results [25, 26, 13]. It has been generally accepted that, in the absence of significant external forces, the SMAC
program correctly conserves linear and angular momentum of the two-body system. For example Figure 15 and
Figure 16 demonstrate comparisons of the linear and angular momentum and kinetic energy for two different
RICSAC test configurations simulated on test track friction (mu=0.87) and on a frictionless surface (mu=0.0).
The generally impressive validation results have led to a widespread adoption of the SMAC type of digital
simulation approach for reconstructing highway collisions.
The Proper Use of Simulation Technology for Collision and Rollover Reconstructions and Highway Safety Brian G McHenry, © McHenry Software, Inc. 2015 IPTM Special Problems, May 18, 2015 Page 12
mchenrysoftware.com
Figure 15 RICSAC Test 9: Comparison of SMAC generated System Momentum and Kinetic Energy time histories
for Test Track Friction and No Friction (note: impact at 0.10 sec, separation at 0.208 sec) (Veh#1 1975 Honda
Civic,2270 lbs., Veh#2, 1974 Ford Torino, 4930 lbs.)
Figure 16 RICSAC Test 1- Comparison of SMAC generated System Momentum and Kinetic Energy time histories for Test Track Friction and No Friction (note: impact at 0.18 sec, separation at 0.343 sec) (Veh#1 1974 Chevrolet
Chevelle, 4650 lbs., Veh#2 1974 Ford Pinto, 3110 lbs.)
The Proper Use of Simulation Technology for Collision and Rollover Reconstructions and Highway Safety Brian G McHenry, © McHenry Software, Inc. 2015 IPTM Special Problems, May 18, 2015 Page 13
mchenrysoftware.com
MSMAC3D: COMBINING 3D VEHICLE SIMULATION TECHNOLOGY (HVOSM) WITH
COLLISION RECONSTRUCTION (SMAC)
In many vehicle-to-vehicle collisions the terrain is not flat and the vehicle responses may include significant
pitching and/or rolling, including actual rollovers. Since the HVOSM includes unlimited angular responses in
single vehicle accidents, it became attractive to consider the development of a SMAC type of vehicle-to-vehicle
collision simulation using 3D vehicles as defined in HVOSM.
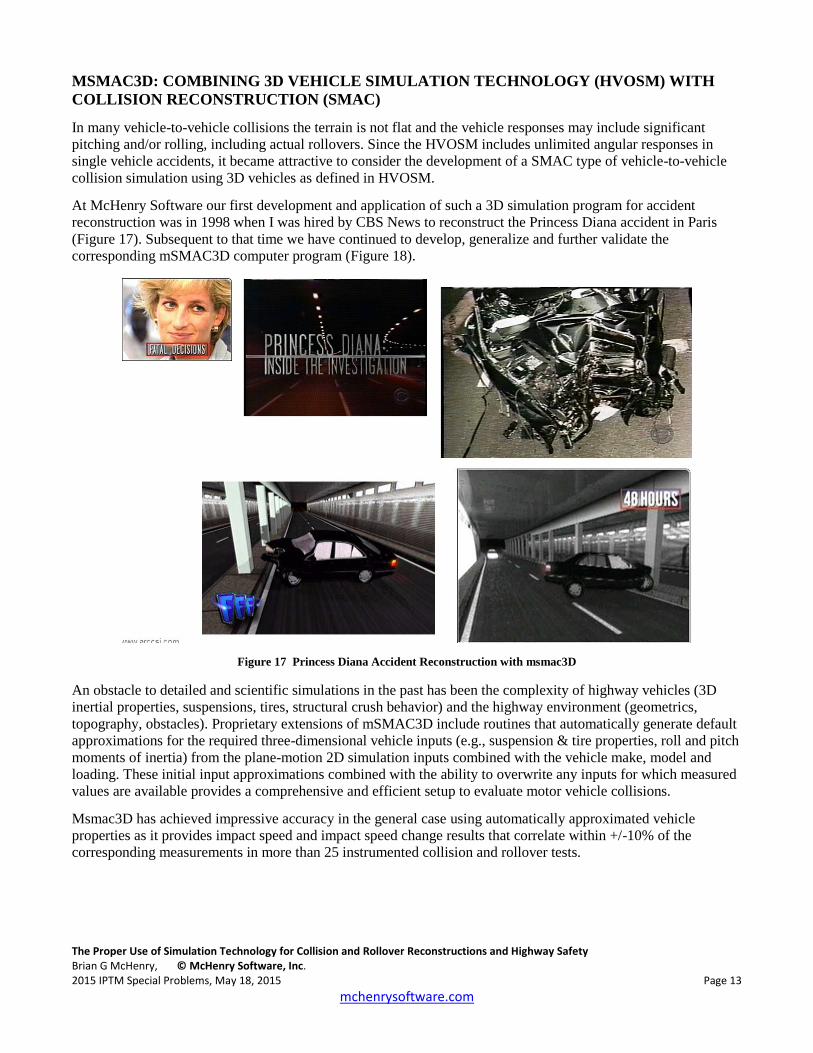
At McHenry Software our first development and application of such a 3D simulation program for accident
reconstruction was in 1998 when I was hired by CBS News to reconstruct the Princess Diana accident in Paris
(Figure 17). Subsequent to that time we have continued to develop, generalize and further validate the
corresponding mSMAC3D computer program (Figure 18).
Figure 17 Princess Diana Accident Reconstruction with msmac3D
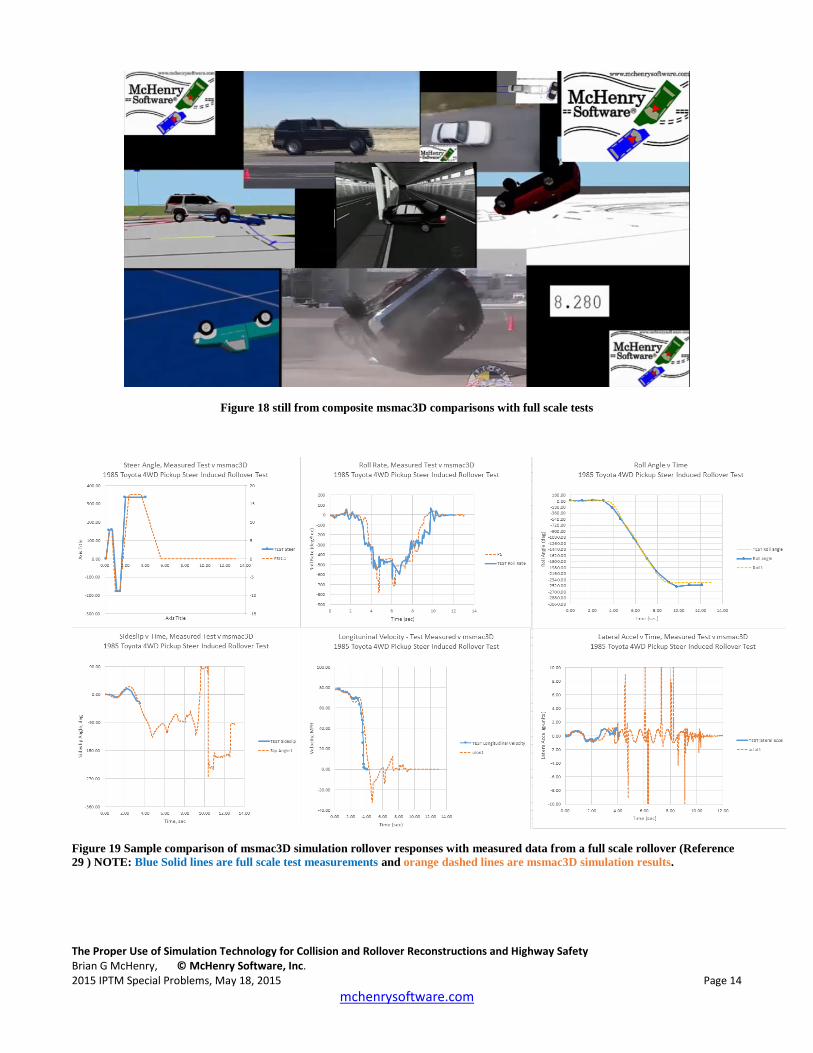
An obstacle to detailed and scientific simulations in the past has been the complexity of highway vehicles (3D
inertial properties, suspensions, tires, structural crush behavior) and the highway environment (geometrics,
topography, obstacles). Proprietary extensions of mSMAC3D include routines that automatically generate default
approximations for the required three-dimensional vehicle inputs (e.g., suspension & tire properties, roll and pitch
moments of inertia) from the plane-motion 2D simulation inputs combined with the vehicle make, model and
loading. These initial input approximations combined with the ability to overwrite any inputs for which measured
values are available provides a comprehensive and efficient setup to evaluate motor vehicle collisions.
Msmac3D has achieved impressive accuracy in the general case using automatically approximated vehicle
properties as it provides impact speed and impact speed change results that correlate within +/-10% of the
corresponding measurements in more than 25 instrumented collision and rollover tests.
The Proper Use of Simulation Technology for Collision and Rollover Reconstructions and Highway Safety Brian G McHenry, © McHenry Software, Inc. 2015 IPTM Special Problems, May 18, 2015 Page 14
mchenrysoftware.com
Figure 18 still from composite msmac3D comparisons with full scale tests
Figure 19 Sample comparison of msmac3D simulation rollover responses with measured data from a full scale rollover (Reference
29 ) NOTE: Blue Solid lines are full scale test measurements and orange dashed lines are msmac3D simulation results.
The Proper Use of Simulation Technology for Collision and Rollover Reconstructions and Highway Safety Brian G McHenry, © McHenry Software, Inc. 2015 IPTM Special Problems, May 18, 2015 Page 15
mchenrysoftware.com
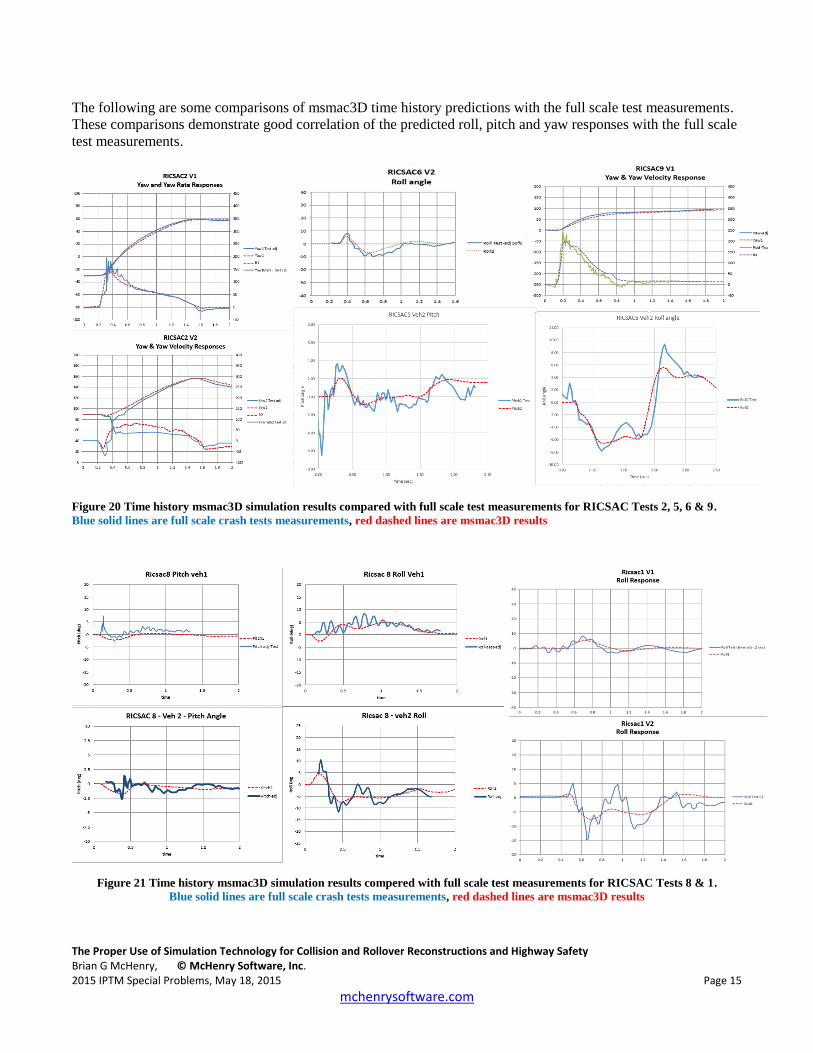
The following are some comparisons of msmac3D time history predictions with the full scale test measurements.
These comparisons demonstrate good correlation of the predicted roll, pitch and yaw responses with the full scale
test measurements.
Figure 20 Time history msmac3D simulation results compared with full scale test measurements for RICSAC Tests 2, 5, 6 & 9.
Blue solid lines are full scale crash tests measurements, red dashed lines are msmac3D results
Figure 21 Time history msmac3D simulation results compered with full scale test measurements for RICSAC Tests 8 & 1.
Blue solid lines are full scale crash tests measurements, red dashed lines are msmac3D results
The Proper Use of Simulation Technology for Collision and Rollover Reconstructions and Highway Safety Brian G McHenry, © McHenry Software, Inc. 2015 IPTM Special Problems, May 18, 2015 Page 16
mchenrysoftware.com
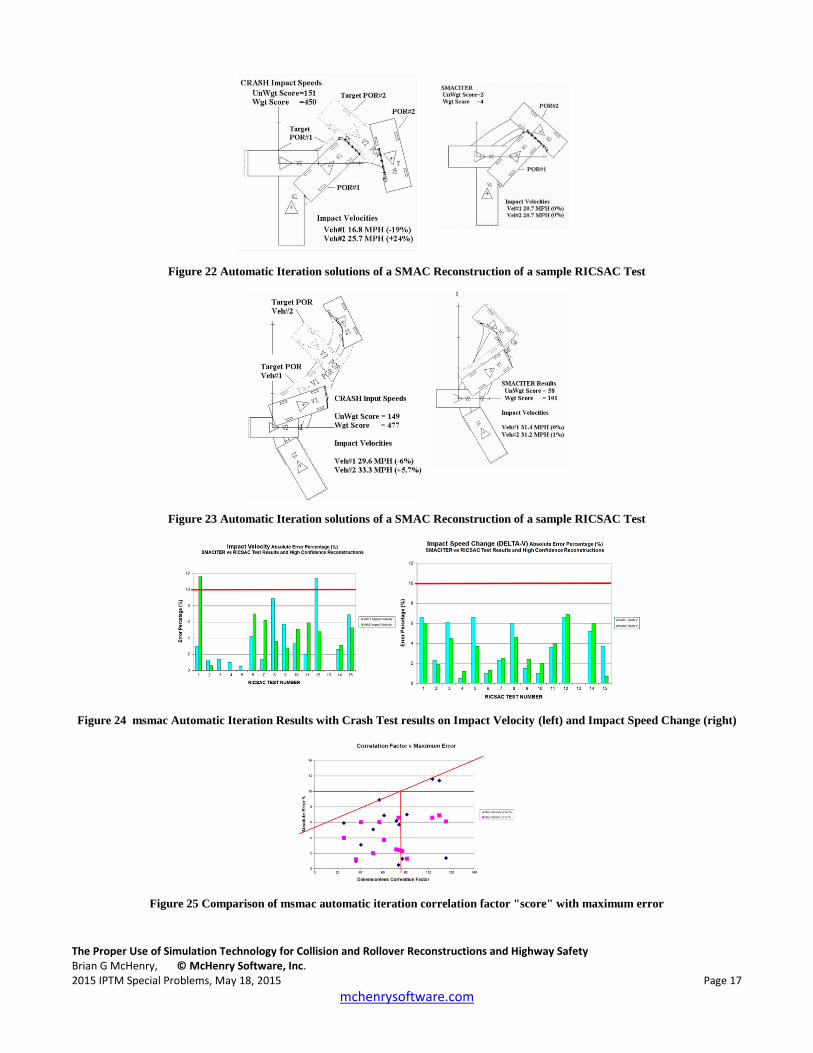
AUTOMATIC ITERATION TO IMPROVE EVIDENCE MATCH AND SIMPLIFY THE
MSMAC3D PROCESS
As any SMAC user is aware, many iterations of the SMAC program may be required to go from an initial
approximation to an acceptable match of the measured trajectory and damage targets. Throughout the iterative
process, the impact speeds and impact speed change results may not change significantly. Also, what constitutes an
acceptable match can vary widely among users. Sometimes the focus is on a detailed match of the positions of rest;
sometimes the focus is on a match of damage locations and extents on the vehicles. There is currently no
standardized measure of the correlation of simulation results with the accident evidence.
Since the initial development of the SMAC program, there has existed a need to simplify the application process.
The ultimate simplification would entail an automatic iteration procedure. Optimization techniques applied to the
evidence match can serve to reduce the required time and effort and, also, can achieve greater uniformity of the
evidence interpretation.
The working hypothesis of the automatic iteration of SMAC is that a unique set of impact conditions is required to
achieve an acceptable match of all of the documented evidence (both damage and trajectory). The use of quantitative
measures of the overall "fit" to the documented evidence and applications to experimental crash tests provided a
means of proving the hypothesis, as well as demonstrating reconstruction accuracy and convergence rates. Note
that successful efforts on automatic iteration in the msmac2D case were reported in Ref 13 (Fig 20-23). That
research proved the feasibility of an automated procedure for achieving a "best match" of measured evidence,
starting with CRASH-type linear momentum/damage analysis initial approximations. Small deviations from a
perfect "match" are, of course, imposed by the existing limitations of the SMAC computer program and by any
inaccuracies in the reported evidence.
In the reported results the automatic iteration/optimization of msmac2D was demonstrated to successfully
converge toward evidence matches in a variety of impact configurations. With measured evidence from full-scale
tests on flat surfaces the automatic iteration procedure of msmac2D produced correlation of impact speeds and
impact speed changes with deviations in individual results of less than approximately ± 10%.
The research confirmed that the initial approximation of the CRASH program, or any proper combination of
linear momentum and damage analysis solution procedures, should provide an adequate initial approximation
from which an automatic iterative/optimization procedure of msmac2D can be used to determine the impact
speeds and impact speed changes within ± 10%.
For 3D simulations the only change required was to add automatic iteration/optimization of msmac3D results is to
simply have the control algorithms use the msmac3D program instead of msmac2D program for
iterating/optimizing towards a unique solution. The msmac3D automatic iteration/optimization program is
currently in testing and will be included in the msmac3D release.
The msmac3D setup automatically generates all required 3D vehicle input definitions based on the vehicle
make/model and any other supplemental information and the user can easily include 3D terrain information if
applicable. Upcoming extensions of the automatic iteration/optimization routine will be to include comparisons
with measured tire mark information and an extension to iterate/optimize on rollover and other single vehicle
accidents.
The Proper Use of Simulation Technology for Collision and Rollover Reconstructions and Highway Safety Brian G McHenry, © McHenry Software, Inc. 2015 IPTM Special Problems, May 18, 2015 Page 17
mchenrysoftware.com
Figure 22 Automatic Iteration solutions of a SMAC Reconstruction of a sample RICSAC Test
Figure 23 Automatic Iteration solutions of a SMAC Reconstruction of a sample RICSAC Test
Figure 24 msmac Automatic Iteration Results with Crash Test results on Impact Velocity (left) and Impact Speed Change (right)
Figure 25 Comparison of msmac automatic iteration correlation factor "score" with maximum error
The Proper Use of Simulation Technology for Collision and Rollover Reconstructions and Highway Safety Brian G McHenry, © McHenry Software, Inc. 2015 IPTM Special Problems, May 18, 2015 Page 18
mchenrysoftware.com
ADVANCED MEASUREMENT TECHNOLOGY
There have been many major advances in the measurement equipment and techniques for documenting highway
accidents. However the benefits in terms of improved accident reconstruction techniques which make use of the
more detailed information have not yet been fully exploited. For example, there is an increased use of detailed
scanning of vehicle damage areas to refine that aspect of the overall results of the reconstruction technique. These
more precise measurements currently can be used only in conjunction with the simplified linear assumptions of
the CRASH type damage analysis techniques. There have been no validated enhancements to the damage analysis
techniques to benefit from the use of more precise damage measurements. Some companies are selling the ability
to have ‘zoned’ crush areas and an ability to specify more than the simplified 6 point damage protocol
measurements however there have been no corresponding demonstrations of any benefits or validations of these
enhancements. All damage analysis techniques are limited by the available crash tests data. The NHTSA crash
test database measurements utilize the protocol of a simple 2, 4 or 6 point measurement of damage areas. And
with the existing crash tests database field tests have shown that simple ruler measurements provide the same
accuracy as more sophisticated measurement techniques due to limitations of the existing damage analysis
techniques and the underlying data.
In the past, attention for accident reconstruction was focused on simplistic, piecemeal, step-by-step calculations
within the overall event. For example the use of linear momentum, planar impact mechanics and damage analysis.
These simplified first approximation techniques can help you get started with your investigation and
reconstruction of an accident, however you should be sure to test and check any results with other more
sophisticated and validated techniques. Wrapping all these simplified piecemeal techniques in a sophisticated
graphics package may make for a good sales pitch however it is merely the equivalence of applying shine or
trying to make a pig fly.
Many of the simplified accident reconstruction techniques are extremely sensitive due to many arbitrary and
subjective inputs. With present day computer capabilities and speeds, 3D computer simulations offer the potential
for detailed and scientific ‘experiments’ with speeds and operating conditions on a given terrain topography to
match the measured evidence as a test of results obtained with any of the simplified techniques.
VALIDATION
Some requirements in validation proofs which should be fully provided to substantiate any validation claims:
Complete inputs for validation accident reconstructions should be published or available. Through
availability of validation input datasets results can be repeated and verified.
For any reconstruction technique, what are ALL the inputs required?
o Complete disclosure of the input file required to reconstruct an accident event for a given
validation
o Do the validation simulation runs follow a protocol for the use of any optional or subjective
inputs? Or are they randomly adjusted (with or without a prior knowledge of the ‘truth’?)
Standardized reporting of errors as a percentage of difference between measured and simulation results
o Some items used and included in validation papers:
Impact speed – for many techniques the impact speed is an input. If you know the answer in a
validation test then using that answer (the impact speed) as an input tells you nothing about
the accuracy of the technique. Our movement towards solution procedures which includes
automatic iteration/optimization of the evidence match is in recognition of this fact and to
take the knowledge of the answer out of the validation process.
The Proper Use of Simulation Technology for Collision and Rollover Reconstructions and Highway Safety Brian G McHenry, © McHenry Software, Inc. 2015 IPTM Special Problems, May 18, 2015 Page 19
mchenrysoftware.com
Combined impact speed: Quoting the accuracy of a technique as a percentage of error of the
combined impact speed is misleading. In most accidents you are trying to determine the speed
that an individual vehicle was travelling in a specific accident. What does any error related to
combining the impact speeds tell you?
o The rationale for this was because some accidents include a vehicle at rest. Errors for
Vehicles are rest can be quoted as MPH or kph difference (see next item)
Error quoted in absolute speed: Except for vehicles known to be at rest the quoting of the
error as a speed difference in mph or kph is misleading. Certainly being within 3 mph of the
truth is great, unless the actual answer is 10 mph (30% error!).
Average error: averaging errors that occur in validation studies is misleading and provides
you no indication of the maximum possible magnitude of error of the program when applied
to your specific accident. For example, if a technique has errors which are +50% and -50% on
a particular case, the average error could be zero. Yet if you are interested in the speed of a
vehicle, you could be off by +/- 50%! The largest possible error must be reported on the basis
of objective validation results.
If a particular reconstruction techniques has better correlation/validation for some impact
types: validation results can be sorted by impact type if any technique performs better in
certain types of impact configurations.
A few additional observations on validation to consider:
1) As part of validation demonstrations and accident reconstructions some programs allow extensive use of
spline fits and elaborate computer graphics to illustrate a pre-existing opinion regarding a given accident
or validation. Clear distinctions should be established between scientific and illustrative computer created
videos. While knowledgeable viewers can clearly distinguish the presence or absence of realism in the
resulting animations, they can be misleading to an unsophisticated viewer (e.g., a juror).
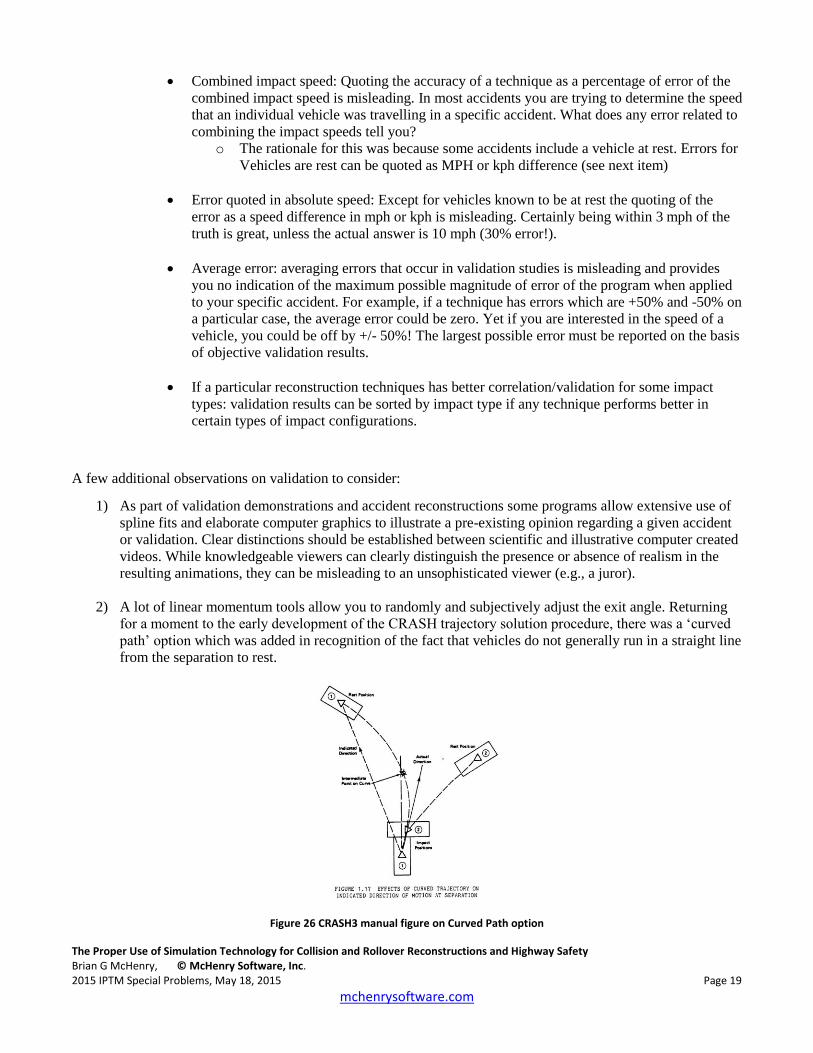
2) A lot of linear momentum tools allow you to randomly and subjectively adjust the exit angle. Returning
for a moment to the early development of the CRASH trajectory solution procedure, there was a ‘curved
path’ option which was added in recognition of the fact that vehicles do not generally run in a straight line
from the separation to rest.
Figure 26 CRASH3 manual figure on Curved Path option
The Proper Use of Simulation Technology for Collision and Rollover Reconstructions and Highway Safety Brian G McHenry, © McHenry Software, Inc. 2015 IPTM Special Problems, May 18, 2015 Page 20
mchenrysoftware.com
Depending on the direction and amount of yaw (heading) rotation the vehicles at separation may head in a
direction to the right or left of the straight line path rest and then curve back to the position of rest. A
precondition to adjusting the amount of variation of the exit angle from the collision in linear momentum
should be based on facts: were there tire marks or other evidence to indicate a path which is other than
straight line from impact to rest? We must be sure that we simply do not adjust the separation angles
because we know the correct answer or know the answer we want. We must base things on sound
scientific evidence and have a protocol so any analyst using the reconstruction tool would choose the
same or close to same exit angle.
3) Several vendors have created commercial versions of the SMAC program. Some vendors have translated
the original SMAC FORTRAN code to other programming languages (BASIC, C++, etc.). For any
translation of the original SMAC program to another language the vendor must first demonstrate that the
translated computer code produces the same results as the original SMAC for the same inputs. This is an
initial step required for ANY computer program if it is translated to any other language: Are the results
the same? If there are any differences then they can be identified and isolated as either a problem with the
translation of the code (is some portion of the internal code not translated properly or not working
properly?) or a difference/error in the input files.
For SMAC an objective measure of a proper translation of the Original SMAC computer code from one
language to another is to compare the simulation results of the translated SMAC code with the results of
the Original SMAC code. The most important test that the SMAC code is working properly and providing
proper results is to compare the Original SMAC with the translated SMAC for the calculated impact
speed changes (DeltaVs)1. Both versions of the Original SMAC programs when performing simulations
with identical input files must produce the same results. Original SMAC code was extensively verified
for compliance with the physical laws by NHTSA and Calspan by tests such as those on zero friction
shown in Figure 15 and Figure 16. So an appropriate test of a proper translation of Original SMAC to
another language is to input the identical published inputs for the 12 RICSAC tests for the specific
weights, impact configurations, friction and control inputs and then compare the results of each program
to verify that the translated code produces identical results as Original SMAC. If the results of the
translated version are different than Original SMAC then the translated version has a problem and is not
in adherence to Newton’s laws.
The Publications from vendors as part of their conversion of SMAC to other computer languages include
tabular summaries of the Impact Speed Change (DeltaV) results for 12 RICSAC Tests. A summary of the
comparison of results is contained in Figure 27. Note that for perfect correlation the comparison blue and
red lines should be horizontal at 0%.
1 The Impact Speed can also be compared however that is a SMAC program input.
The Proper Use of Simulation Technology for Collision and Rollover Reconstructions and Highway Safety Brian G McHenry, © McHenry Software, Inc. 2015 IPTM Special Problems, May 18, 2015 Page 21
mchenrysoftware.com
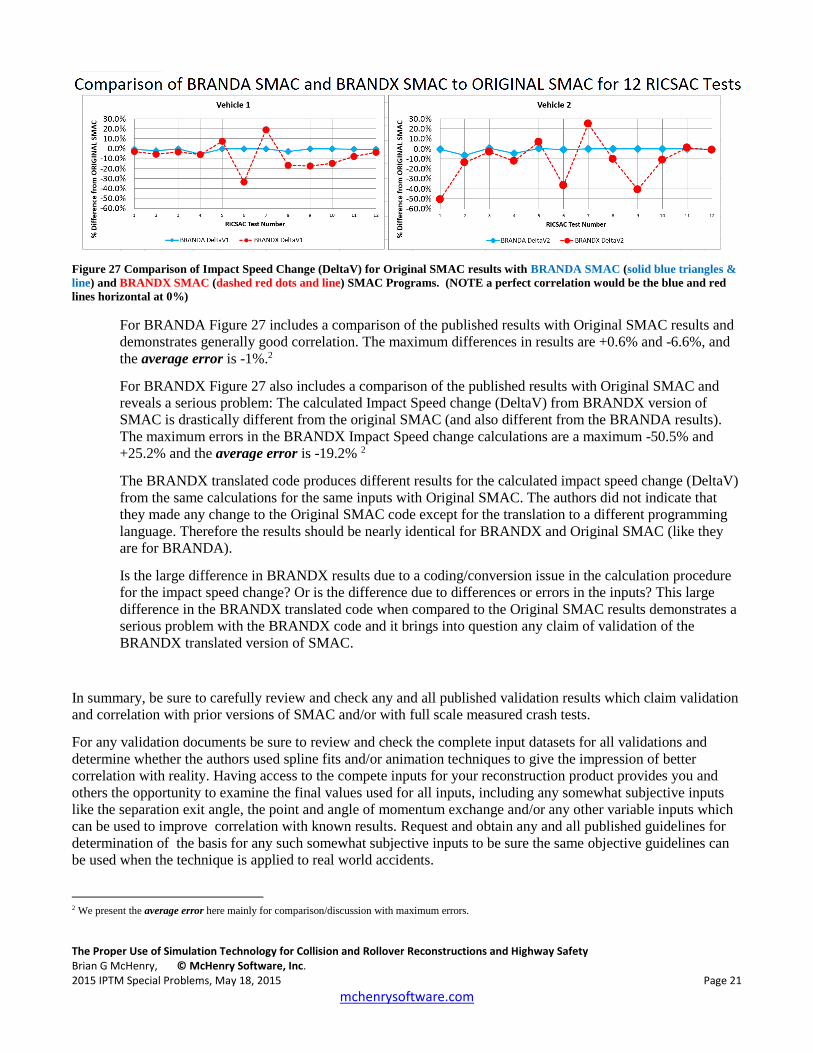
Figure 27 Comparison of Impact Speed Change (DeltaV) for Original SMAC results with BRANDA SMAC (solid blue triangles &
line) and BRANDX SMAC (dashed red dots and line) SMAC Programs. (NOTE a perfect correlation would be the blue and red
lines horizontal at 0%)
For BRANDA Figure 27 includes a comparison of the published results with Original SMAC results and
demonstrates generally good correlation. The maximum differences in results are +0.6% and -6.6%, and
the average error is -1%.2
For BRANDX Figure 27 also includes a comparison of the published results with Original SMAC and
reveals a serious problem: The calculated Impact Speed change (DeltaV) from BRANDX version of
SMAC is drastically different from the original SMAC (and also different from the BRANDA results).
The maximum errors in the BRANDX Impact Speed change calculations are a maximum -50.5% and
+25.2% and the average error is -19.2% 2
The BRANDX translated code produces different results for the calculated impact speed change (DeltaV)
from the same calculations for the same inputs with Original SMAC. The authors did not indicate that
they made any change to the Original SMAC code except for the translation to a different programming
language. Therefore the results should be nearly identical for BRANDX and Original SMAC (like they
are for BRANDA).
Is the large difference in BRANDX results due to a coding/conversion issue in the calculation procedure
for the impact speed change? Or is the difference due to differences or errors in the inputs? This large
difference in the BRANDX translated code when compared to the Original SMAC results demonstrates a
serious problem with the BRANDX code and it brings into question any claim of validation of the
BRANDX translated version of SMAC.
In summary, be sure to carefully review and check any and all published validation results which claim validation
and correlation with prior versions of SMAC and/or with full scale measured crash tests.
For any validation documents be sure to review and check the complete input datasets for all validations and
determine whether the authors used spline fits and/or animation techniques to give the impression of better
correlation with reality. Having access to the compete inputs for your reconstruction product provides you and
others the opportunity to examine the final values used for all inputs, including any somewhat subjective inputs
like the separation exit angle, the point and angle of momentum exchange and/or any other variable inputs which
can be used to improve correlation with known results. Request and obtain any and all published guidelines for
determination of the basis for any such somewhat subjective inputs to be sure the same objective guidelines can
be used when the technique is applied to real world accidents.
2 We present the average error here mainly for comparison/discussion with maximum errors.
The Proper Use of Simulation Technology for Collision and Rollover Reconstructions and Highway Safety Brian G McHenry, © McHenry Software, Inc. 2015 IPTM Special Problems, May 18, 2015 Page 22
mchenrysoftware.com
CLOSING REMARKS
And what does this all mean? First, the utilization of any particular accident reconstruction technique should not
detract from the duty of the reconstructionist to perform a careful and detailed investigation and analysis of an
accident. Accident/collision reconstructionists need to use any and all techniques carefully.
We recommend that you use more than one technique to be sure you are not being led to an improper conclusion
due to any weakness of any particular technique.
Monte Carlo and other optimization techniques are a step in the right direction to provide a way to isolate inputs
which are most sensitive. And you should then use that knowledge to test what that sensitivity means to your
results and conclusions.
McHenry Software is in the business of marketing accident reconstruction and simulation software. We currently
have the msmac2D and msmac3D programs available. We hope you will consider adding our programs to your
accident reconstruction tool chest. Details and pricing are available on our website www.mchenrysoftware and
accident reconstruction forum www.mchenrysoftware.com/board. Please contact us and let us schedule an online
demonstration for you.
And finally, please approach each and every reconstruction and analysis you perform as if a life depended on it
since most accidents include one or more life changing (or ending) events.
And to repeat some important quotes:
“The process of reconstructing a collision must be seen as first collecting evidence from the accident site,
police report and photos, next obtaining from data sources the available vehicle specifications, and then
choosing a collision reconstruction technique to perform the most accurate and reliable reconstruction for
the data collected and time available.”
“Starting with a conclusion is a common way to take a wrong turn in accident reconstruction”.
“The fact that one believes strongly in an opinion is no proof of its validity”
J. Stannard Baker, Traffic Accident Reconstruction, Northwestern University Traffic Institute, 1990
“As scientists, engineers and accident reconstructionists, we should not let the unlimited possibilities of
making anything look real (with animation) obscure our duty to perform a careful and detailed
engineering analysis while also continually testing and evaluating the applied techniques, including
computer programs, to achieve the most accurate reconstruction possible.”
McHenry & McHenry, McHenry Accident Reconstruction, 2008 , McHenry Software
CONTACT INFORMATION
E-mail: [email protected] Postal Service Mail:
Brian G. McHenry McHenry Software, Inc. PO Box 1716 Cary, NC 27512 USA
www.mchenrysoftware.com
The Proper Use of Simulation Technology for Collision and Rollover Reconstructions and Highway Safety Brian G McHenry, © McHenry Software, Inc. 2015 IPTM Special Problems, May 18, 2015 Page 23
mchenrysoftware.com
REFERENCES
1) “Time Warner Cable Commercial "Pigs", animated by la maison, directed by Bruno Aveillan.
2) J1674 AUG2009 Early Acquisition and Preservation of Information in a Motor Vehicle Crash
3) SAE Standard J224 MAR80
4) SAE Standard J2433
5) McHenry, B.G., McHenry, R.R., "CRASH-97 – Refinement of the Trajectory Solution Procedure", SAE Paper
97-0949
6) Emori, R.I., “Analytical Approach to Automobile Collisions”, SAE paper 68-0016
7) Campbell, K.L., "Energy Basis for Collision Severity", SAE Paper 74-0565
8) McHenry, R.R., "The CRASH Program – A simplified Collision Reconstruction Program", Proceedings of the
Motor Vehicle Collision Investigation Symposium, Calspan, 1975
9) McHenry, R.R., McHenry, B.G., "Effects of Restitution in the Application of Crush Coefficients", SAE Paper
97-0960
10) McHenry, Raymond R., "Development of a Computer Program to Aid the Investigation of Highway Accidents",
Calspan Report VJ-2979-V-1
11) McHenry, B.G., McHenry, R.R. “SMAC-87”, SAE Paper 880227
12) McHenry, B.G., McHenry, R.R. “SMAC-97 – Refinement of the Collision Algorithm”, SAE paper 97-0947
13) McHenry B.G., McHenry, R.R., “SMAC2003: The Automatic Iteration of SMAC”, SAE Paper 2003-01-0486,
Detroit, 2003
14) McHenry, R,.R, “An Analysis of the Dynamics of Automobiles During Simultaneous Cornering and Ride
Motions”, The Automobile Division, The Institution of Mechanical Engineers, London 1969
15) McHenry, R. R., “The Astro Spiral Jump – An Automobile Stunt Designed via Simulation”, SAE Paper No.
760339, Detroit 1976
16) McHenry, R.,R.,, Deleys, N.J. “Vehicle Dynamics in Single Vehicle Accidents – Validations and Extensions of
a Computer Simulation, Interim Technical Report, CAL No VJ-2251-V-3, Contract No CPR-11-3988,
December 1968
17) Segal, D. "Highway-Vehicle Object Simulation Model - 1976", "Volume I - User's Manual", (PB-
267401) ,"Volume II - Programmer's Manual" (PB-267402) ,"Volume III - Engineering Manual -
Analysis" (PB-267403) ,"Volume IV - Engineering Manual -Validation" (PB-267404) 18) McHenry, B.G., "Simulation Models of Vehicle Dynamics", presented November 1987, National Conference
on Future Improvements to and Supplemental Guidance for AASHTO Policy on Geometric Design of
Highways and Streets; Published April 1992, Transportation Research Board Circular "Beyond the Green
Book".
19) Glennon, Neuman and Leisch, “Safety and Operational Considerations for Design of Rural Highway Curves,
Contract No. DOT-FH-11-9575, PB-86139 664/AS, December,,1985
20) Glennon, Graham, “Work Zone Design Considerations for Truck Operations and Pavement/Shoulder Drop-
Offs”, Contract No. DTFH61-80-CO0146, Feb. 1984
21) Deleys, Parada, “Rollover Potential of Vehicles on Embankments, Sideslopes and Other Roadside Features”,
DTFH61-83-C-0060, August 1986., Also: SAE paper 870234
22) Council, Reinfurt, Knoblaunch, Stewart & McHenry, Safe Geometric Design for Mini Cars, DTFH61-84-C-
067, November 1986. Also SAE paper 870233
23) McHenry & McHenry , "HVOSM-87", SAE Technical Paper No. 880228, International Congress and
Exposition, Detroit, Michigan
24) McHenry, R,.R., “Approximations of Impact Conditions via Computer Simulation”, NATO Conference on
Accident Investigations, Brussels, Belgium, 1973
25) McHenry, B.G, McHenry, R.R., “RICSAC-97, A Reevaluation of the Reference Set of Full Scale Crash Tests”,
SAE Paper No 97-061, Detroit 1997
26) Smith, R. A., Noga, J. T. "Examples of Staged Collisions in Accident Reconstruction", from Highway Collision
Reconstruction, The American Society of Mechanical Engineers, Nov. 1980
27) McHenry B.G., McHenry, R.R., “SMAC2003: The Automatic Iteration of SMAC”, SAE Paper 2003-01-0486,
Detroit, 2003
28) Jones, I. S., Baum, A. S., "Research Input for Computer Simulation of Automobile Collisions - Volume IV -
Staged Collision Reconstructions", Calspan Report ZQ-6057-V-6, Contract DOT-HS-7-01511, December 1978
29) Larson, Smith, Werner and Fowler, "Vehicle Rollover Testing, Methodologies in Recreating Rollover
Collisions", SAE Paper 2000-01-1641
The Proper Use of Simulation Technology for Collision and Rollover Reconstructions and Highway Safety Brian G McHenry, © McHenry Software, Inc. 2015 IPTM Special Problems, May 18, 2015 Page 24
mchenrysoftware.com
APPENDIX:
WHAT YOU NEED to evaluate a 3-D reconstruction/animation.
If you are faced with someone using one of these tools (or others), what do you need to evaluate
what they have done? These programs cost from ~$3000 up to ~$20,000, so to facilitate the
evaluation of an application of any of these programs, you need to obtain complete
documentation of the analysis procedure.
Request complete inputs and outputs for any and all computer programs used
Printed and in computer form (CD or diskette). (Printed output pages can be saved as text files
and copied to a CD to save paper)
Most of the programs include options for outputs. The outputs should be set with ALL
OPTIONS ON to obtain all the outputs and time history data, etc.
Request the program version, an indication of any add-ons or options used, etc.
If a video was created, request all the files used to create the video: CAD files, Animation files,
spreadsheet files, any and all notes, etc.
Some papers and links written on the subject:
SAE paper number 1999-01-0101 "Computer–Generated Trial Exhibits: A Post- Daubert
Update"
SAE paper number 940920 "Case Studies in Animation Foundation"
SAE paper number 980018, "Documenting Scientific Visualizations and Computer Animations
used in Collision Reconstruction Presentations" which includes as the Summary:
"This paper has presented a proposed standard for documenting computer generated
images, animations, scientific visualizations, etc. The basic standard is that any still
images or videos should be documented such that any qualified analyst can reproduce
them. This is the requirement for the scientific community in general and should be
adopted in the accident reconstruction community. It is important to note that this
standard does not refer to any method of generating these images or videos. There is no
implication that any one method or any one program is superior to others. This standard
addresses only the images and videos and does not address the analysis or opinions being
expressed by an analyst. However, the only way to fully understand the analysis being
presented or discussed is to have the ability to duplicate the images or video being
presented"
Recommended