158 EQUINE VETERINARY JOURNALEquine vet. J. (2006) 38 (2) 158-163
Summary
Reasons for performing study: Fatalities resulting from horsefalls occurring during the cross-country phase of eventingcompetitions initiated epidemiological investigation of therisk factors associated with horse falls.
Objectives: To identify variables that increased or decreasedthe risk of a horse fall during the cross-country phase of aneventing competition.
Methods: Data were collected from randomly selected BritishEventing competitions held in Great Britain during 2001and 2002. Data were obtained for 173 cases (jumping effortsresulting in a fall of the horse-and-rider partnership) and503 matched controls (jumping efforts not resulting in afall). The risk of falling was modelled using conditionallogistic regression.
Results: An increased risk of a horse fall was associated withjumping into or out of water; taking off from good-to-soft, softor heavy ground; fences with a drop landing; nonangled fenceswith a spread ≥2 m; and angled fences. Other risk factorsincluded riders who knew that they were in the lead within thecompetition before the cross-country phase; an inappropriatespeed of approach to the fence (too fast or too slow); horse-and-rider partnerships that had not incurred refusals at earlierfences; and riders who received cross-country tuition.
Conclusions: This study has identified modifiable course- andfence-level risk factors for horse falls during the cross-countryphase of eventing competitions. The risk of horse and riderinjury at eventing competitions should be reduced by 3 simplemeasures; maintaining good to firm take-off surfaces at fences,reducing the base spread of fences to <2 m and reducing the useof fences at which horses are required to jump into or out ofwater. Risk reduction arising from course and fencemodification needs to be confirmed by intervention studies.
Potential relevance: Knowledge of factors that increase ordecrease the risk of a horse fall can be used by UK governingbodies of the sport to reduce the risk of horse falls on thecross-country phase of eventing competitions, and reduce therisk of horse and rider injuries and fatalities. As one in 3 horses that fall injure themselves and one in 100 horse fallsresults in fatality to the horse, we suggest that immediateconsideration is given to these recommendations.
Introduction
Eventing is a high-risk equestrian sport. The prevalence of riderinjury has been reported as 0.88–1.1% (Paix 1999; Whitlock1999), including 2 rider fatalities which resulted from the horsefalling and landing on the rider (Whitlock 1999). In the UK, 5 riders died in 1999 as a result of horse falls (Anon 2001a). Thesedeaths emphasised concerns about the safety of this sport and initiated epidemiological investigations aimed at theidentification of risk factors for horse falls which contribute tohorse and rider injury.
We have previously reported the risk of injury to horses; 32% of horses that fell were injured, with 1.5% being subjected toeuthanasia as a result of the injuries sustained (Murray et al.2004a). Analysis of retrospective data, using a case-control studydesign, suggested an increased risk of falling associated withfences sited on a downhill slope (odds ratio [OR] = 8.4, 95%confidence intervals [CI] 2.5–28.8) or with a ditch in front (OR = 5.8, 95% CI 1.1–30.7) compared with fences sited on flatground and without a ditch in front, respectively (Singer et al.2003). The risk of falling also rose as the number of fences on acourse increased (OR = 1.6, 95% CI 1.2–2.0); however, the riskassociated with each additional jumping effort decreased (OR = 0.8, 95% CI 0.7–1.0). The retrospective study by Singer et al. (2003) was based on a sample of 50 cases and 150 controlsselected from a 3-week period in 1999. In this article, we report a large-scale prospective study conducted to investigate potentialrisk factors for eventing horse falls. The aim of the study was to identify variables associated with an increased or decreased risk of horse falls during the cross-country phase of eventing competitions.
Materials and methods
Eventing consists of 3 stages, dressage, ‘speed and endurance’ andshowjumping, and may be run over one, 2 or 3 days. The stages of aone-day event are run in the order of: dressage, showjumping and‘speed and endurance’. At one-day events the ‘speed and endurance’phase involves completion of a 1600–4000 m length cross-countrycourse that incorporates a wide variety of obstacle types that requirea total of 18–40 jumping efforts from the horse (requirementsvarying with the level of the competition). Two-day events have
The risk of a horse-and-rider partnership falling on the cross-country phase of eventing competitionsJ. K. MURRAY*, E. R. SINGER†, K. L. MORGAN, C. J. PROUDMAN† and N. P. FRENCH
Epidemiology Group, Faculty of Veterinary Science, and †Division of Equine Studies, Department of Veterinary Clinical Science and AnimalHusbandry, University of Liverpool, Leahurst, Chester High Road, Neston, South Wirral CH64 7TE, UK.
Keywords: horse; fall; cross-country; risk factors
*Author to whom correspondence should be addressed. Present address: Division of Companion Animal Studies, University of Bristol,Langford House, Langford, Bristol BS40 5DU, UK.[Paper received for publication 07.04.05; Accepted 20.07.05]
J. K. Murray et al. 159
dressage and showjumping on the first day and ‘speed andendurance’on the second day. Three-day events have dressage on thefirst day, ‘speed and endurance’ on the second day and showjumpingon the final day. The speed and endurance test at 2- and 3-day eventsconsists of 4 phases (Phases A, B, C and D). Phase D is equivalentto the cross-country course at one-day events. During the cross-country phase, the criteria on which competitors are judged includetime, refusals, rider falls and horse falls. There are 5 one-day eventlevels (in ascending order of difficulty): Intro, Pre-novice, Novice,Intermediate and Advanced. Three-day events are also known asConcours Complet Internationale (CCI) competitions, with thedifficulty increasing from 1-star (1*) to 4-star (4*) level.
Study design
A matched, prospective, case-control design with a ratio of 3 controls/case was used to test associations between course andfence-, horse-, rider- and event-related variables and horse falls.The use of a 3:1 control:case ratio was used to maximise thepower of the study for the number of cases that could be identifiedin the 2-year data collection period. Fifty-five one-day and 4 two-day eventing competitions were included in the study followingtheir random selection from 329 one-day event and 10 two-dayeventing competitions that were scheduled during the 2001 and2002 British Eventing (BE) seasons. Eventing competitions wereselected randomly for inclusion in the study by assigning anumber to each eventing competition that was scheduled to takeplace during each 2-week period. Randomly generated numberswere then used to select events for inclusion in the study until nomore competitions could logistically be attended during the 2-week period. Only 16 three-day event competitions werescheduled to take place during the study period and all 16 wereselected for inclusion, to maximise data collection from 3-dayevent competitions. Data were obtained for 180 cases and 540 controls. Controls were matched individually by venue andday of cross-country competition, but not by level of competition.
Case definition and selection
A case was a jumping effort that resulted in a horse fall on thecross-country phase of an event. A jumping effort was defined ashaving occurred if the horse attempted to negotiate the obstacle. Ahorse fall was defined as the horse’s shoulders and quarterstouching either the ground or the obstacle and the ground at thesame time (Anon 2001b). In this study, falls were identified andrecorded by fence judges, who were positioned by each fence torecord penalties incurred by each competitor. All horses that fell atselected events were included as cases.
Control definition and selection
A control was a jumping effort that did not result in a horse fall. Threecontrols were selected randomly from all successful jumping effortsthat took place on the same day and at the same competition fromwhich their case was selected. Cases were eligible to be selected ascontrols for jumping efforts that occurred prior to their horse fall.Matching was used to control for the potentially confounding effectsof month, weather conditions and geographical location.
Data collection
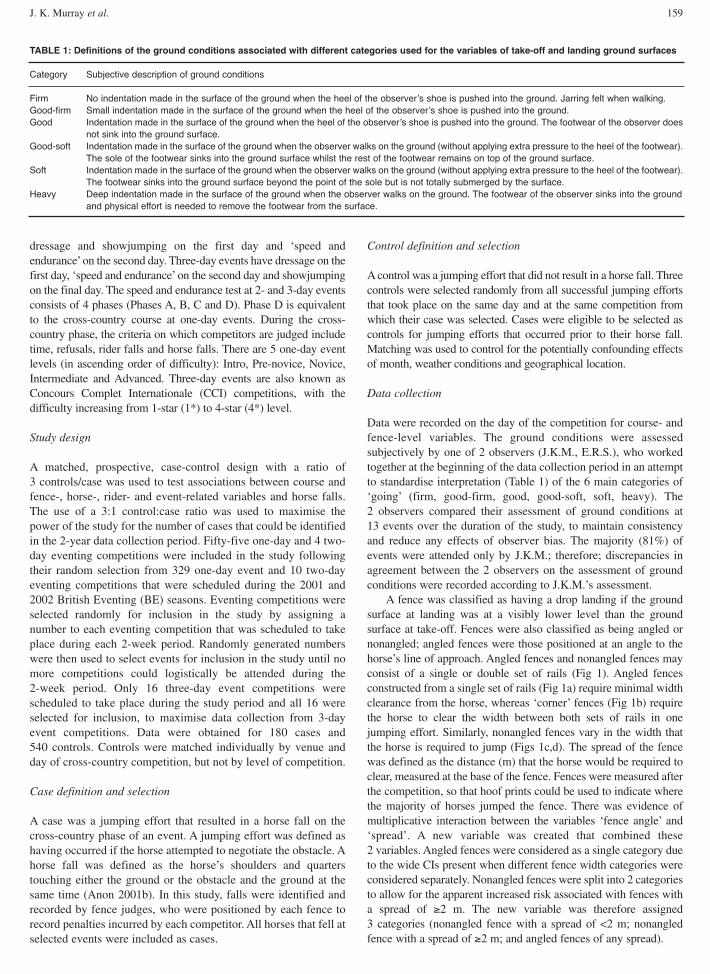
Data were recorded on the day of the competition for course- andfence-level variables. The ground conditions were assessedsubjectively by one of 2 observers (J.K.M., E.R.S.), who workedtogether at the beginning of the data collection period in an attemptto standardise interpretation (Table 1) of the 6 main categories of‘going’ (firm, good-firm, good, good-soft, soft, heavy). The 2 observers compared their assessment of ground conditions at 13 events over the duration of the study, to maintain consistencyand reduce any effects of observer bias. The majority (81%) ofevents were attended only by J.K.M.; therefore; discrepancies inagreement between the 2 observers on the assessment of groundconditions were recorded according to J.K.M.’s assessment.
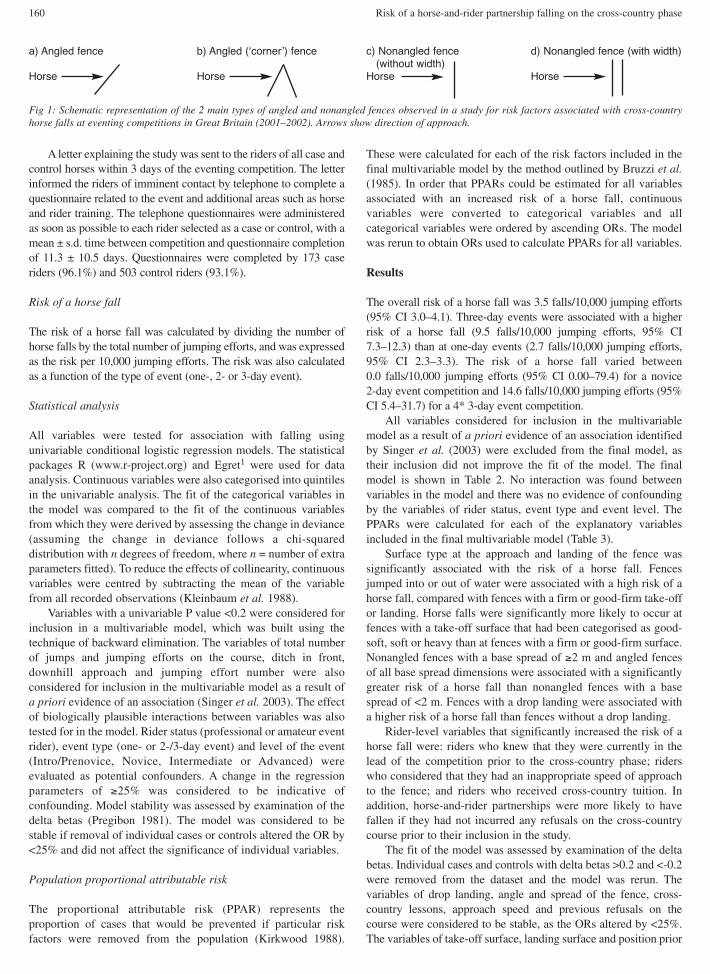
A fence was classified as having a drop landing if the groundsurface at landing was at a visibly lower level than the groundsurface at take-off. Fences were also classified as being angled ornonangled; angled fences were those positioned at an angle to thehorse’s line of approach. Angled fences and nonangled fences mayconsist of a single or double set of rails (Fig 1). Angled fencesconstructed from a single set of rails (Fig 1a) require minimal widthclearance from the horse, whereas ‘corner’ fences (Fig 1b) requirethe horse to clear the width between both sets of rails in onejumping effort. Similarly, nonangled fences vary in the width thatthe horse is required to jump (Figs 1c,d). The spread of the fencewas defined as the distance (m) that the horse would be required toclear, measured at the base of the fence. Fences were measured afterthe competition, so that hoof prints could be used to indicate wherethe majority of horses jumped the fence. There was evidence ofmultiplicative interaction between the variables ‘fence angle’ and‘spread’. A new variable was created that combined these 2 variables. Angled fences were considered as a single category dueto the wide CIs present when different fence width categories wereconsidered separately. Nonangled fences were split into 2 categoriesto allow for the apparent increased risk associated with fences witha spread of ≥2 m. The new variable was therefore assigned 3 categories (nonangled fence with a spread of <2 m; nonangledfence with a spread of ≥2 m; and angled fences of any spread).
TABLE 1: Definitions of the ground conditions associated with different categories used for the variables of take-off and landing ground surfaces
Category Subjective description of ground conditions
Firm No indentation made in the surface of the ground when the heel of the observer’s shoe is pushed into the ground. Jarring felt when walking.Good-firm Small indentation made in the surface of the ground when the heel of the observer’s shoe is pushed into the ground. Good Indentation made in the surface of the ground when the heel of the observer’s shoe is pushed into the ground. The footwear of the observer does
not sink into the ground surface.Good-soft Indentation made in the surface of the ground when the observer walks on the ground (without applying extra pressure to the heel of the footwear).
The sole of the footwear sinks into the ground surface whilst the rest of the footwear remains on top of the ground surface.Soft Indentation made in the surface of the ground when the observer walks on the ground (without applying extra pressure to the heel of the footwear).
The footwear sinks into the ground surface beyond the point of the sole but is not totally submerged by the surface. Heavy Deep indentation made in the surface of the ground when the observer walks on the ground. The footwear of the observer sinks into the ground
and physical effort is needed to remove the footwear from the surface.
160 Risk of a horse-and-rider partnership falling on the cross-country phase
A letter explaining the study was sent to the riders of all case andcontrol horses within 3 days of the eventing competition. The letterinformed the riders of imminent contact by telephone to complete aquestionnaire related to the event and additional areas such as horseand rider training. The telephone questionnaires were administeredas soon as possible to each rider selected as a case or control, with amean ± s.d. time between competition and questionnaire completionof 11.3 ± 10.5 days. Questionnaires were completed by 173 caseriders (96.1%) and 503 control riders (93.1%).
Risk of a horse fall
The risk of a horse fall was calculated by dividing the number ofhorse falls by the total number of jumping efforts, and was expressedas the risk per 10,000 jumping efforts. The risk was also calculatedas a function of the type of event (one-, 2- or 3-day event).
Statistical analysis
All variables were tested for association with falling usingunivariable conditional logistic regression models. The statisticalpackages R (www.r-project.org) and Egret1 were used for dataanalysis. Continuous variables were also categorised into quintilesin the univariable analysis. The fit of the categorical variables inthe model was compared to the fit of the continuous variablesfrom which they were derived by assessing the change in deviance(assuming the change in deviance follows a chi-squareddistribution with n degrees of freedom, where n = number of extraparameters fitted). To reduce the effects of collinearity, continuousvariables were centred by subtracting the mean of the variablefrom all recorded observations (Kleinbaum et al. 1988).
Variables with a univariable P value <0.2 were considered forinclusion in a multivariable model, which was built using thetechnique of backward elimination. The variables of total numberof jumps and jumping efforts on the course, ditch in front,downhill approach and jumping effort number were alsoconsidered for inclusion in the multivariable model as a result ofa priori evidence of an association (Singer et al. 2003). The effectof biologically plausible interactions between variables was alsotested for in the model. Rider status (professional or amateur eventrider), event type (one- or 2-/3-day event) and level of the event(Intro/Prenovice, Novice, Intermediate or Advanced) wereevaluated as potential confounders. A change in the regressionparameters of ≥25% was considered to be indicative ofconfounding. Model stability was assessed by examination of thedelta betas (Pregibon 1981). The model was considered to bestable if removal of individual cases or controls altered the OR by<25% and did not affect the significance of individual variables.
Population proportional attributable risk
The proportional attributable risk (PPAR) represents theproportion of cases that would be prevented if particular riskfactors were removed from the population (Kirkwood 1988).
These were calculated for each of the risk factors included in thefinal multivariable model by the method outlined by Bruzzi et al.(1985). In order that PPARs could be estimated for all variablesassociated with an increased risk of a horse fall, continuousvariables were converted to categorical variables and allcategorical variables were ordered by ascending ORs. The modelwas rerun to obtain ORs used to calculate PPARs for all variables.
Results
The overall risk of a horse fall was 3.5 falls/10,000 jumping efforts(95% CI 3.0–4.1). Three-day events were associated with a higherrisk of a horse fall (9.5 falls/10,000 jumping efforts, 95% CI7.3–12.3) than at one-day events (2.7 falls/10,000 jumping efforts,95% CI 2.3–3.3). The risk of a horse fall varied between 0.0 falls/10,000 jumping efforts (95% CI 0.00–79.4) for a novice 2-day event competition and 14.6 falls/10,000 jumping efforts (95%CI 5.4–31.7) for a 4* 3-day event competition.
All variables considered for inclusion in the multivariablemodel as a result of a priori evidence of an association identifiedby Singer et al. (2003) were excluded from the final model, astheir inclusion did not improve the fit of the model. The finalmodel is shown in Table 2. No interaction was found betweenvariables in the model and there was no evidence of confoundingby the variables of rider status, event type and event level. ThePPARs were calculated for each of the explanatory variablesincluded in the final multivariable model (Table 3).
Surface type at the approach and landing of the fence wassignificantly associated with the risk of a horse fall. Fencesjumped into or out of water were associated with a high risk of ahorse fall, compared with fences with a firm or good-firm take-offor landing. Horse falls were significantly more likely to occur atfences with a take-off surface that had been categorised as good-soft, soft or heavy than at fences with a firm or good-firm surface.Nonangled fences with a base spread of ≥2 m and angled fencesof all base spread dimensions were associated with a significantlygreater risk of a horse fall than nonangled fences with a basespread of <2 m. Fences with a drop landing were associated witha higher risk of a horse fall than fences without a drop landing.
Rider-level variables that significantly increased the risk of ahorse fall were: riders who knew that they were currently in thelead of the competition prior to the cross-country phase; riderswho considered that they had an inappropriate speed of approachto the fence; and riders who received cross-country tuition. Inaddition, horse-and-rider partnerships were more likely to havefallen if they had not incurred any refusals on the cross-countrycourse prior to their inclusion in the study.
The fit of the model was assessed by examination of the deltabetas. Individual cases and controls with delta betas >0.2 and <-0.2were removed from the dataset and the model was rerun. Thevariables of drop landing, angle and spread of the fence, cross-country lessons, approach speed and previous refusals on thecourse were considered to be stable, as the ORs altered by <25%.The variables of take-off surface, landing surface and position prior
Fig 1: Schematic representation of the 2 main types of angled and nonangled fences observed in a study for risk factors associated with cross-countryhorse falls at eventing competitions in Great Britain (2001–2002). Arrows show direction of approach.
a) Angled fence
Horse
b) Angled (‘corner’) fence
Horse
c) Nonangled fence (without width)
Horse
d) Nonangled fence (with width)
Horse

J. K. Murray et al. 161
to the cross-country were less stable as the individual removal of 8 cases and 10 controls altered the OR by >25%. Examination ofthese cases and controls revealed no unusual covariate patterns andthe individuals were therefore left in the dataset.
Discussion
This study identified fences with a take-off and/or landing in waterto be associated with a higher risk of a horse fall than fences sitedon good-firm or good ground. Fences requiring a take-off out ofwater were usually sited so that horses would take at least onestride in water before jumping. Fences rarely had both the take-offand landing in water; only 3% (2/75) of ‘water fences’ included inthis study fitted this description. The increased risk of falling atfences with a take-off in water may have been attributable tomiscalculation of the jump height and take-off point by the horseand/or rider due to the base of the fence being obscured underwater. The increased risk of a horse fall when landing in water maybe due to the drag of the water unbalancing the horse, or may bedue to shadows and reflections on the surface of the water thatmade it difficult for the horse to judge the presence or depth ofwater. Examination of the PPARs associated with the variables oftake-off and landing surfaces suggests that intervention strategiesshould prioritise fences with a landing in water (PPAR = 14%)rather than those with a take-off from water (PPAR = 7%). The
magnitude of the PPAR indicates the impact that reducing exposureto the variable is expected to have on reducing the number of horsefalls; however, the acceptability of an intervention to thepopulation needs to be considered before recommendations aremade. For example, while the high PPAR of 25% associated withgood take-off ground indicates that modifying exposure to thisvariable might be effective in reducing the number of horse falls,interventions aimed at producing firmer going are likely to beunpopular with riders due to the associated increased risk of injuryto the horse (Parkin et al. 2004). Our earlier findings (Murray et al.2004a) showed an increased risk of injury to horses for falls inwater compared to falls on land (OR = 2.1, 95% CI 1.1–3.7). Theevidence from these studies suggests that water fences, particularlythose requiring a landing in water, should be considered animportant area of risk on cross-country courses. However, coursedesigners and riders view water fences as an important test of thehorse’s ability to tackle natural obstacles and these fences are alsopopular with spectators. If the reduced use of fences with a take-offand/or landing in water is unpopular with the organisationsresponsible for rules relating to fence design within the sport ofeventing in Great Britain (BE and the Federation EquestreInternationale), then further research is needed to identify whichfactors associated with these fences, if any, can be modified toreduce the risk of horse falls at fences into and out of water.
It is possible that equine jumping performance might beenhanced and the risk of falling reduced by the provision of good-firm take-off surfaces at cross-country fences. Firm surfaces are nowcommon in human athletic sports where long jump and high jumpathletes use a firm take-off surface and land on a soft surface to help
TABLE 2: Multivariable conditional logistic regression model of oddsratios (ORs), 95% confidence intervals (CI) and P values of risk factorsassociated with cross-country horse falls at eventing competitions inGreat Britain (2001–2002)
Cases (%) Controls (%) Adjusted* ORVariable (n = 166) (n = 470) (95% CI) P value
Take-off surfaceFirm/good-firm† 69 (42) 242 (51) 1.00Good 75 (45) 214 (46) 2.29 (1.09–4.82)Good-soft/soft/heavy 10 (6) 9 (2) 15.56 (2.54–95.45)Water 12 (7) 5 (1) 49.80 (10.38–238.99) <0.001
Landing surfaceFirm/good-firm† 66 (40) 220 (47) 1.00Good 68 (41) 222 (47) 0.63 (0.28–1.38)Good-soft/soft/heavy 6 (4) 11 (2) 0.60 (0.09–3.83)Water 26 (16) 17 (4) 5.72 (2.12–15.45) <0.001
Drop landingNo† 134 (81) 428 (91) 1.00Yes 32 (19) 42 (9) 3.41 (1.60–7.25) 0.001
Angle and spread of fenceNo angle, <2m spread† 112 (67) 390 (83) 1.00No angle, ≥2m spread 36 (22) 54 (11) 3.24 (1.71–6.16)All angled fences 18 (11) 26 (6) 4.83 (2.09–11.16) <0.001
Position before cross-countryDidn’t know† 121 (73) 330 (70) 1.00First 10 (6) 10 (2) 4.39 (1.44–13.43)Second or lower 35 (21) 130 (28) 0.45 (0.22–0.89) 0.001
Approach speedAppropriate† 122 (73) 427 (91) 1.00Too slow 17 (10) 22 (5) 5.00 (1.90–13.14)Too fast 27 (16) 21 (4) 6.30 (2.64–15.02) <0.001
Previous cross-country course refusals incurred by the horse-rider partnershipYes† 1 (1) 56 (12) 1.00No 165 (99) 414 (88) 23.02 (2.98–178.12) 0.003
Rider has cross-country lessonsNo† 71 (43) 266 (57) 1.00Yes 95 (57) 204 (43) 1.94 (1.21–3.09) 0.006
†Reference category. *Adjustment is for all variables shown.
TABLE 3: Population proportional attributable risks (PPARs) forexplanatory variables identified in Table 2 associated with cross-countryhorse falls at eventing competitions in Great Britain (2001–2002)
Explanatory variable PPAR (%)
Take-off surfaceFirm/good-firm 0Good 25Good-soft/soft/heavy 6Water 7
Landing surfaceGood-soft/soft/heavy 0Good 2Firm/Good-firm 16Water 14
Drop landingNo 0Yes 14
Angle and spread of fenceNo angle, <2m spread 0No angle, ≥2 m spread 15All angled fences 9
PositionSecond or lower 0First 5Didn’t know 40
Approach speedAppropriate 0Too slow 8Too fast 14
Cross-country refusalsNo 0Yes 1
Rider had cross-country lessonsNo 0Yes 28
162 Risk of a horse-and-rider partnership falling on the cross-country phase
minimise the risk of injury (Fukuda 1988). Good take-off ground andgood-soft, soft or heavy take-off ground were associated with ahigher risk of a horse fall when compared to firm and good-firmtake-off ground. The condition of the take-off ground might affectthe balance of the horse and thereby contribute to the risk of a fall.Alternatively, riders might consciously or subconsciously adjusttheir style of riding and hence the clarity of the instructions (or‘aids’) that they give to the horse, as their confidence varies inrelation to the ground conditions. Unclear instructions (through theuse of the rider’s legs, hands and weight distribution) might lead toindecision from the horse and thereby increase the risk of a horse fall.Hence, suboptimal ground conditions may influence the horse’sbalance, the rider’s confidence or the confidence and decision-making ability of the horse-and-rider partnership.
Reducing the maximum permitted base spread for fencesmight be an effective intervention strategy to reduce the risk ofhorse falls, as indicated by the PPAR associated with this variable(15%). The width of the fence and angle of approach wereidentified as significant risk factors for horse falls. The increasedrisk of a fall associated with nonangled fences having a basespread of ≥2 m, compared with those with a spread of <2 m, maybe due to insufficient impulsion needed to clear the height andspread of the fence. Further examination of these data revealed norelationship between the risk of falling and the spread of the fenceonce the base spread reached ≥2 m (J.K. Murray et al. unpublisheddata). During the study period, the maximum permitted basespread was 3 m for a fence that required vertical clearance and 4 m for an open ditch (Anon 2001b).
Angled fences include corner fences and those positioned insuch a way that horses were required to jump the fence at an angle.Penalties may be incurred easily at these fences, as a result of thehorse running past the fence. A logical explanation for theincreased risk of falling associated with angled fences is that thehorse needs to make additional adjustments at take-off, to ensurethat both front legs are raised sufficiently in order to clear anangled fence. If the horse fails to raise both legs sufficiently, thisfrequently results in the horse hitting the fence between its kneesand shoulders (J.K. Murray, unpublished data). Researchconducted by the Transport Research Laboratory has shown thatrotational falls (i.e. the horse ‘forward somersaults’ in the airbefore landing on its back) are often associated with the horsehitting the fence between the knees and shoulders (Walcott 2003).The anecdotal association between rider fatalities and rotationalfalls therefore warrants further investigation of the use of angledfences which are associated with an increased risk of a horse falland have the potential to cause rotational falls.
The association between fences with drop landings (i.e. theground level at landing from the fence was lower than the groundlevel at take-off) and an increased risk of a horse fall is a logicalassociation that may be explained by a loss of balance by the horseon landing. In contrast with the findings of Singer et al. (2003) thatfences sited downhill were associated with an increased risk of ahorse fall (OR = 8.4, 95% CI 2.5–28.8), our results showed nosignificant association between fences with a downhill approachand the risk of a horse fall in the univariable analysis (OR = 0.9,95% CI 0.6–1.5) or when the variable was added to themultivariable model. These conflicting findings may be a result ofthe different methods of data collection. Singer et al. (2003)collected data retrospectively, which may have led to inaccuraciesin recall of the gradient of the approach to the fence andmisclassification of some cases. The popularity of drop fences with
course designers is reflected by the magnitude of the PPARestimation (14%) which is based on the proportion of the populationthat were exposed to drop landings (76/653), suggesting that thereduced use of these fences is warranted on cross-country courses.
Singer et al. (2003) found fences with a ditch in front to beassociated with an increased risk of a horse fall (OR = 5.8, 95% CI 1.1–30.7). Although our study found no evidence of anassociation between fences with a ditch in front and the risk of ahorse fall when the variable was included in the multivariablemodel (OR = 0.5, 95% CI 0.2–1.2), the CIs from the 2 studiesoverlap. The contradictory findings may partly be explained bythe different case definitions that were used in the 2 studies.Singer et al. (2003) included falls that resulted from a refusal.These falls were excluded from our study, because the selection ofcontrols did not include attempted jumping efforts that resulted inrefusals. Our study excluded 6 falls that occurred as a result of arefusal, 3 of which were at fences with a ditch in front. Fallsfollowing a refusal may be more likely to occur at fences that havea ditch in front, since the forward momentum of the horse cancarry it into the ditch, causing a fall. The differing case definitionsin the 2 studies may explain the different conclusions drawn as tothe risk associated with fences with a ditch in front.
Riders who had not incurred any refusals on the course prior torecruitment onto the study were at an increased risk of a horse fallcompared with riders that had already been penalised for a refusal.An explanation for this finding is that some riders would ratherattempt to jump a fence and risk a fall than incur a refusal, despitesometimes reaching the fence at a poor take-off point or withinappropriate speed or balance. Competitive and determined ridersmay be very reluctant to allow their horses to refuse and will useall of their resources (i.e. voice, legs, whip and spurs) to avoid arefusal. An obedient horse may attempt to jump the fence, therebyrisking a fall, rather than risking punishment for a refusal.Conversely, some horses rarely refuse and can be seen to jump atspeed with little apparent care for their own safety. In order toexamine this hypothesis, a larger dataset with a greater number ofhorses included in the study more than once would warrant the useof mixed models to investigate the variation in the risk of a fallattributable to the horse. Analysis of the risk of a horse fall insteeplechase races, using mixed models that included variation atthe horse-, jockey-, race- and track-level as random effects,attributed a proportion of the variation in the risk of a horse fall tothe horse and to the race (Pinchbeck et al. 2002). Alternatively, theobserved association may have been due partly to bias that relatedto the number of jumping efforts attempted by horse-and-riderpartnerships with refusals. Riders incurring one or more refusalsmay have failed to complete the cross-country course, as a result ofeither the rider electing to retire from the competition, or the fencejudge eliminating the horse-and-rider partnership for exceeding themaximum permitted number of refusals (Anon 2001b). The effectof these noncompletions may have biased the association betweenno previous refusals and the risk of a horse fall away from the null,therefore overestimating the strength of this association.
Riders who believed that they had approached the selected fenceat an appropriate speed had a lower risk of falling than riders whoreported an approach speed that was too slow or too fast. Thisfinding might provide support for anecdotal reports of speed being acontributory factor to some of the fatal falls that occurred during1999; however, this result should be interpreted with caution, as thecompetitor’s retrospective opinion of their speed may be subject toreporting bias. While we found no case-control bias in the accuracy
J. K. Murray et al. 163
of reporting dressage and cross-country scores (Murray et al. 2004b),more subjective information may be susceptible to reporting bias.Cases may have been more likely than controls to report aninappropriate speed, in an attempt to find an explanation for theirfall. Subjective verification of the speed of a sample of cases andcontrols needs to be conducted to assess whether bias is present.
The rider’s knowledge of their position within the competitionat the start of the cross-country phase was associated with the riskof a horse fall. Riders who knew that they were in the lead prior tostarting the cross-country course were at a higher risk and riderswho knew that they were not in the lead were at a lower risk offalling, compared with riders who were unaware of their positionwithin the competition. Horse-and-rider partnerships that achievedexcellent dressage scores (and were therefore in first place) couldbe less proficient at jumping cross-country fences than partnershipsthat achieved less good dressage scores, therefore placing thehigher placed partnerships at an increased risk of a fall.Alternatively, this finding may be explained by the fact that riderswho knew that they were currently in first position may have beenriding more ‘competitively’ and therefore been more likely to ‘takea risk’ during the cross-country phase than riders in lower placedpositions, in the hope of maintaining their lead in the competition.The theory of risk homeostasis proposed by Wilde (1982) has beenshown to be particularly relevant to people classified as sensation-seekers, such as those who partake in high-risk sports (Freixanet1991; Franques et al. 2003) and are particularly susceptible tomaintaining their level of risk (Assum et al. 1999). Therefore, thelevel of risk-taking behaviour shown by the rider may be related totheir knowledge of their position within the competition.
Our study found that those riders who received cross-countrytuition had an increased risk of falling compared with those thathad none. An explanation may be that those riders that took cross-country lessons were doing so because they were aware that theyneeded tuition to improve their weak performance as a horse-and-rider partnership on the cross-country course. Alternatively, thisfinding might reflect a trend for riders with a ‘competitive’personality to be more likely to seek cross-country tuition thanless ‘competitive’ riders in an effort to perform to the best of theirability in this phase. It is interesting to note that, of the ridersselected for this study, only 46% (322/694) received cross-country lessons, while 94% (651/694) of riders received dressagetuition and 86% (594/694) showjumping lessons. Furtherresearch is recommended to explore the effects of increasing theproportion of riders receiving cross-country tuition in relation tothe risk of a horse fall.
In a retrospective study, the risk of a horse fall increased as thenumber of fences on a cross-country course increased (Singer etal. 2003). As a result of the matching used in the present study, thecases selected from classes with the greatest number of fences(CCI 3* and CCI 4*) were matched to controls competing over thesame courses, as these were the only classes held at theirrespective venues. This could explain the apparent lack ofassociation between number of fences on a course and the risk offalling found here.
Conclusions
This study has identified a number of modifiable risk factors forhorse falls during the cross-country phase of eventingcompetitions that are associated with the course, fence and therider. The mechanisms by which these risk factors affect the
outcome of the jumping effort are currently unknown; however,the risk of horse and rider injury at eventing competitions shouldbe reduced by modifications to course and fence design. Wesuggest that immediate consideration is given to theserecommendations and that the effects of future modifications areconfirmed by intervention studies.
Acknowledgements
The study was funded by The Home of Rest for Horses. The authorswould like to thank all those riders who completed questionnaires forthis study, fence judges for identifying and recording cases, and thestaff at British Eventing for providing access to their database. Inaddition, the authors are most grateful to Jane Barnes for herassistance with telephone questionnaires and data entry. We are alsograteful to the Federation Equestre Internationale for funding thepilot retrospective study.
Manufacturer’s address
1Cytel Software Corporation, Cambridge, Massachusetts, USA.
References
Anon (2001) The International Eventing Safety Committee Reporthttp://www.fei.ch/PDFS/C/05_03/2000%20Safety%20report.pdf [Last accessed20.01.06].
Anon (2001b) British Eventing Rules, British Eventing, Stoneleigh, Warwickshire.
Assum, T., Bjornskau, T., Fosser, S. and Sagberg, F. (1999) Risk compensation - the caseof road lighting. Accid. Anal. Prev. 31, 545-553.
Bruzzi, P., Green, S.B., Byar, D.P., Brinton, L.A. and Schairer, C. (1985) Estimating thepopulation attributable risk for multiple risk factors using case-control data. Am. J.Epidemiol. 122, 904-914.
Franques, P., Auriacombe, M., Pequemal, E., Verger, M., Brisseau-Gimenez, S., Grabot,D. and Tignol, J. (2003) Sensation seeking as a common factor in opioid dependentsubjects and high risk sport practicing subjects. A cross sectional study. DrugAlcohol Depend. 69, 121-126.
Freixanet, M.G. (1991) Personality profile of subjects engaged in high physical risksports. Personal Individual Diff. 12, 1087-1093.
Fukuda, H. (1988) Biomechanical analysis of landing surfaces with different stiffnesses.Biomech. XI-B, 679-684.
Kirkwood, B.R. (1988) Essentials of Medical Statistics, Blackwell Sciences Ltd, Oxford.
Kleinbaum, D.G., Kupper, L.L. and Muller, K.E. (1988) Applied Regression Analysisand Other Multivariable Methods, 2nd edn., PWS-KENT Publishing Co. Boston.
Murray, J.K., Singer, E.R., Saxby, F. and French, N.P. (2004a) Aretrospective study of horsefalls occurring during the cross-country phase of Horse Trials. Vet. Rec. 154, 207-208.
Murray, J.K., Singer, E.R., Morgan, K.L., Proudman, C.J. and French, N.P. (2004b)Memory decay and performance-related information bias in the reporting of scoresby event riders. Prev. vet. Med. 63, 173-182.
Paix, B.R. (1999) Rider injury rates and emergency medical services at equestrianevents. Br. J. Sports Med. 33, 46-48.
Parkin, T.D., Clegg, P.D., French, N.P., Proudman, C.J., Riggs, C.M., Singer, E.R.,Webbon, P.M. and Morgan, K.L. (2004) Race- and course-level risk factors for fataldistal limb fracture in racing Thoroughbreds. Equine vet. J. 6, 521-526.
Pinchbeck, G.L., Clegg, P.D., Proudman, C.J., Morgan, K.L. and French, N.P. (2002)Risk factors and sources of variation in horse falls in steeplechase racing in the UK.Prev. vet. Med. 55, 179-192.
Pregibon, D. (1981) Logistic regression diagnostics. Ann. Stat. 9, 705-724.
Singer, E.R., Saxby, F. and French, N.P. (2003) Aretrospective case-control study of horsefalls in the sport of horse trials and three-day eventing. Equine vet. J. 35, 139-145.
Walcott, K. (2003) Frangible pins: making cross country jumps safer. www.thehorse.comArticle 4424 [Available to subscribers only].
Whitlock, M.R. (1999) Injuries to riders in the cross-country phase of eventing: theimportance of protective equipment. Br. J. Sports Med. 33, 212-216.
Wilde, G.J.S. (1982) The theory of risk homeostasis: implications for safety andhealth. Risk Anal. 2, 209-225.
Recommended