May 19, 2016 • IntraFish Seafood Investor Forum • New York, New York USA
The SIAF APRAS Model A Paradigm Shift in 21st Century Aquaculture!
presented by !
Anthony Ostrowski, Ph.D. Chief ScienDfic Officer, Sino Agro Food, Inc.
SIAF Overview Company History:. Incorporated 1974 in Nevada, USA. Corporate HQ in Guangzhou, China since 2007. Quoted on OTCQX, USA and Merkur Market of Oslo Børs, Norway. 2015 revenues = $429 million.
Divisions: Aquaculture • PlantaDon • Beef Ca[le • Organic FerDlizer & Feed • Corporate
Target Market: Growing middle class in China > ¥60,000 RMB ($9,000) annual income, mainly urban.
Technologies: A-‐Power RecirculaDng Aquaculture System (APRAS), proprietary enzymes for animal feed and ferDlizer.
CompeDDve Edge: Focused niche products and markets; experienced management; verDcally integrated operaDons; sustainable producDon pracDces; year-‐round indoor aquaculture; joint ventures; co-‐operaDve farming business model, good working relaDonships with Chinese authoriDes.
Business Model:. VerDcally integrated primary producer and distributor of natural, sustainable protein and plant foods, animal feed, organic ferDlizer. Value-‐added processor. Scalable, modular faciliDes. CerDfied and traceable. “Farm-‐to-‐Plate” brand objecDves.
Strategy: Maximize economic efficiency in the protein food value chain in China.
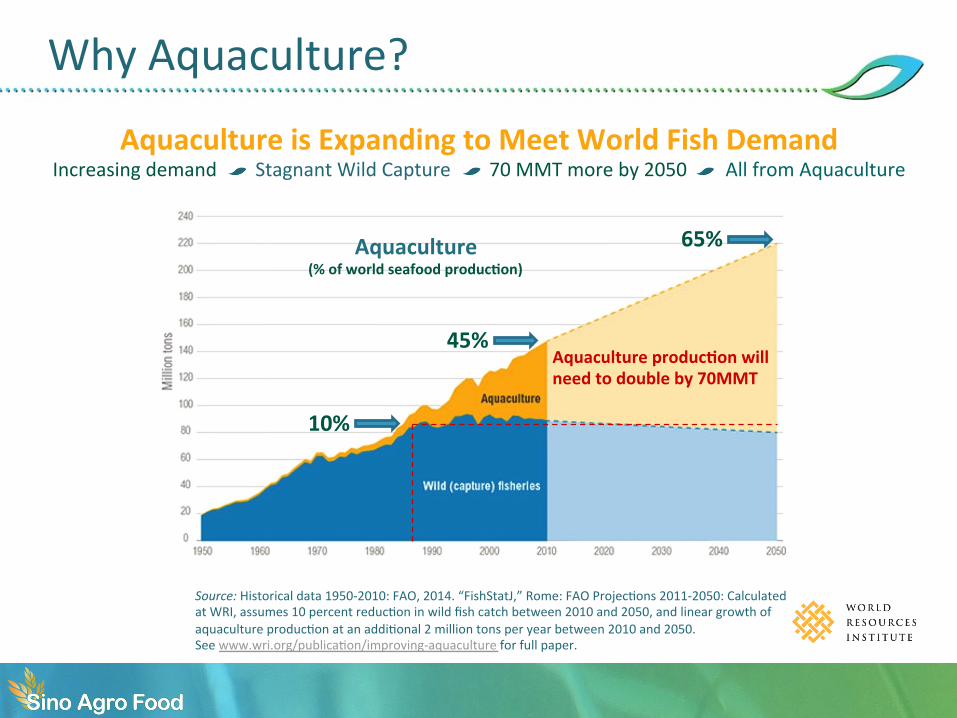
Why Aquaculture?
Aquaculture (% of world seafood producDon)
10%
45%
65%
Aquaculture producDon will need to double by 70MMT
Source: Historical data 1950-‐2010: FAO, 2014. “FishStatJ,” Rome: FAO ProjecDons 2011-‐2050: Calculated at WRI, assumes 10 percent reducDon in wild fish catch between 2010 and 2050, and linear growth of aquaculture producDon at an addiDonal 2 million tons per year between 2010 and 2050. See www.wri.org/publicaDon/improving-‐aquaculture for full paper.
Aquaculture is Expanding to Meet World Fish Demand Increasing demand Stagnant Wild Capture 70 MMT more by 2050 All from Aquaculture
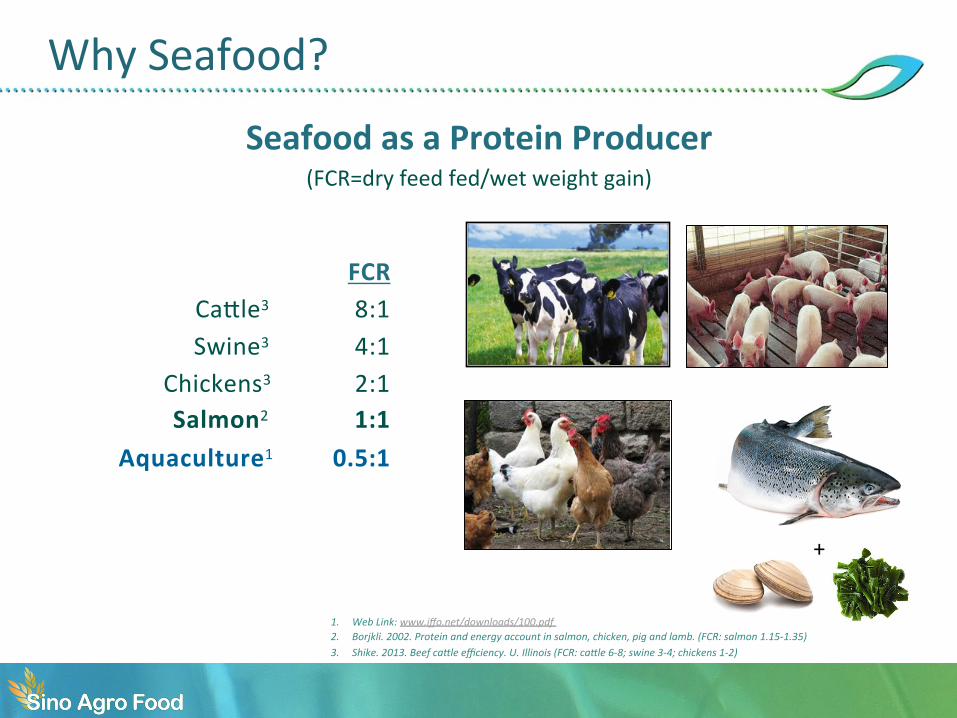
Why Seafood?
Seafood as a Protein Producer (FCR=dry feed fed/wet weight gain)
FCR
Ca[le3 8:1 Swine3 4:1
Chickens3 2:1 Salmon2 1:1
Aquaculture1 0.5:1
1. Web Link: www.iffo.net/downloads/100.pdf 2. Borjkli. 2002. Protein and energy account in salmon, chicken, pig and lamb. (FCR: salmon 1.15-‐1.35) 3. Shike. 2013. Beef caMle efficiency. U. Illinois (FCR: caMle 6-‐8; swine 3-‐4; chickens 1-‐2)
+
Why China?
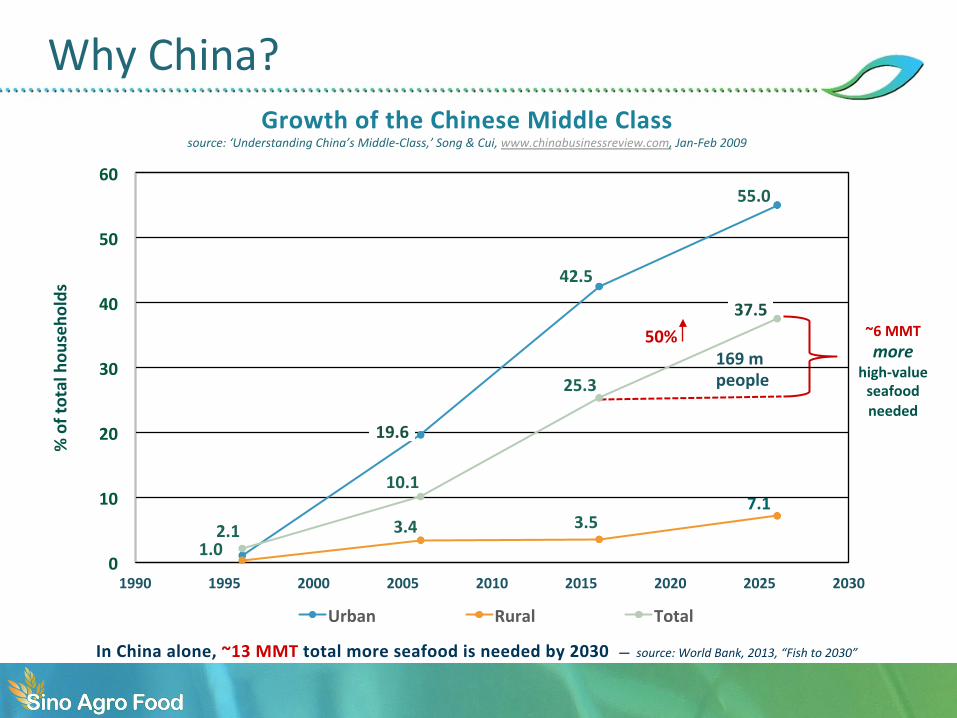
55.0
1.0 2.1
42.5
10.1
25.3
3.4 3.5 7.1
% of total hou
seho
lds
~6 MMT more
high-‐value seafood needed
169 m people
50%
Growth of the Chinese Middle Class source: ‘Understanding China’s Middle-‐Class,’ Song & Cui, www.chinabusinessreview.com, Jan-‐Feb 2009
In China alone, ~13 MMT total more seafood is needed by 2030 — source: World Bank, 2013, “Fish to 2030”
0
10
20
30
40
50
60
1990 1995 2000 2005 2010 2015 2020 2025 2030
Urban Rural Total
19.6
37.5
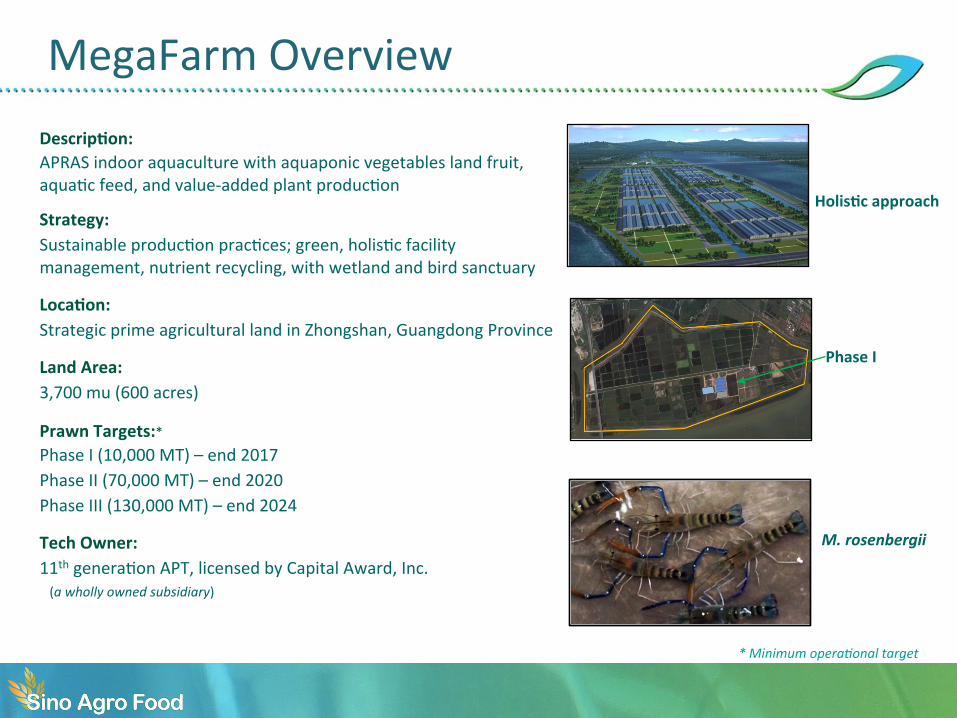
MegaFarm Overview DescripDon: APRAS indoor aquaculture with aquaponic vegetables land fruit, aquaDc feed, and value-‐added plant producDon
Strategy: Sustainable producDon pracDces; green, holisDc facility management, nutrient recycling, with wetland and bird sanctuary
LocaDon: Strategic prime agricultural land in Zhongshan, Guangdong Province
Land Area: 3,700 mu (600 acres)
Prawn Targets:* Phase I (10,000 MT) – end 2017 Phase II (70,000 MT) – end 2020 Phase III (130,000 MT) – end 2024
Tech Owner: 11th generaDon APT, licensed by Capital Award, Inc.
HolisDc approach
Phase I
M. rosenbergii
* Minimum opera_onal target
(a wholly owned subsidiary)
The Paradigm Shift!
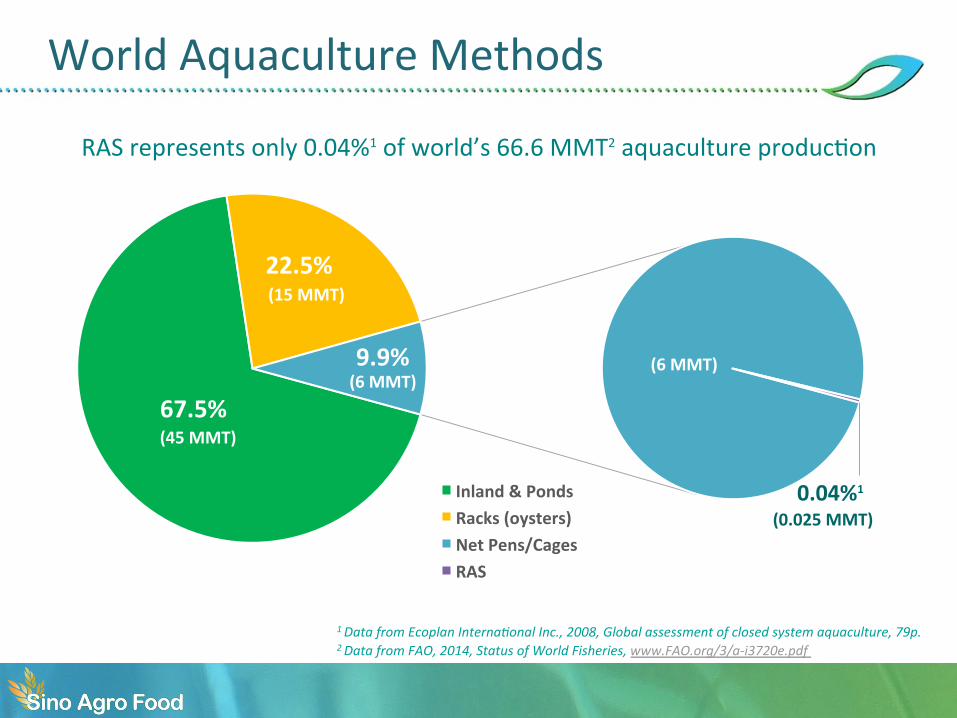
World Aquaculture Methods
67.5%
22.5%
0.04%1
9.9%
Inland & Ponds Racks (oysters) Net Pens/Cages RAS
(45 MMT)
(15 MMT)
(6 MMT) (6 MMT)
(0.025 MMT)
1 Data from Ecoplan Interna_onal Inc., 2008, Global assessment of closed system aquaculture, 79p. 2 Data from FAO, 2014, Status of World Fisheries, www.FAO.org/3/a-‐i3720e.pdf
RAS represents only 0.04%1 of world’s 66.6 MMT2 aquaculture producDon
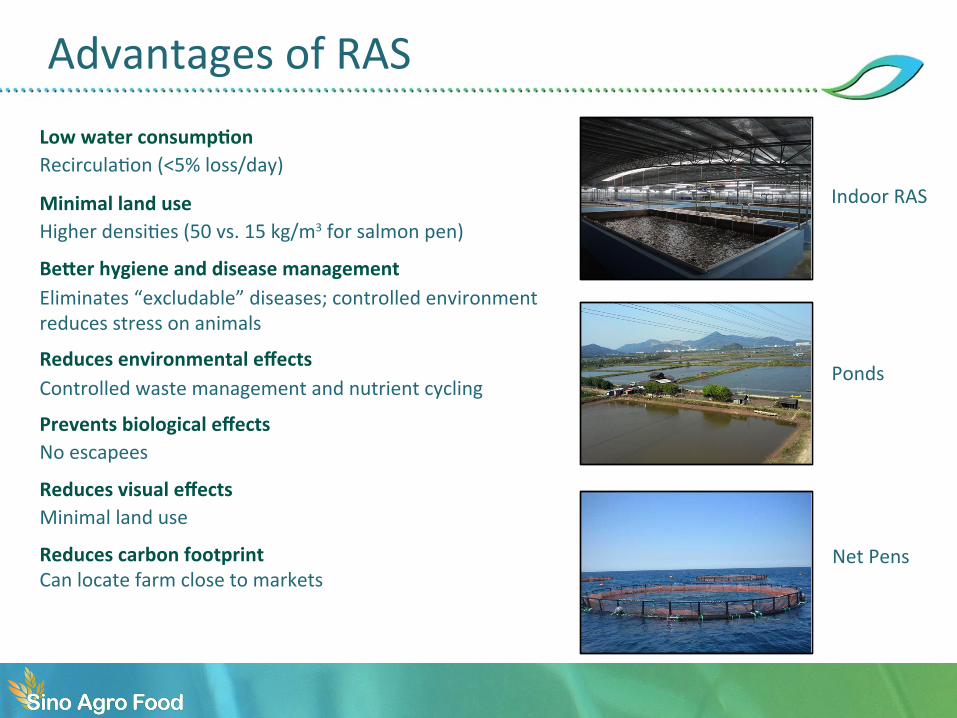
Advantages of RAS Low water consumpDon RecirculaDon (<5% loss/day)
Minimal land use Higher densiDes (50 vs. 15 kg/m3 for salmon pen)
Beber hygiene and disease management Eliminates “excludable” diseases; controlled environment reduces stress on animals
Reduces environmental effects Controlled waste management and nutrient cycling
Prevents biological effects No escapees
Reduces visual effects Minimal land use
Reduces carbon footprint Can locate farm close to markets
Indoor RAS
Ponds
Net Pens
Why Not RAS Everywhere?!
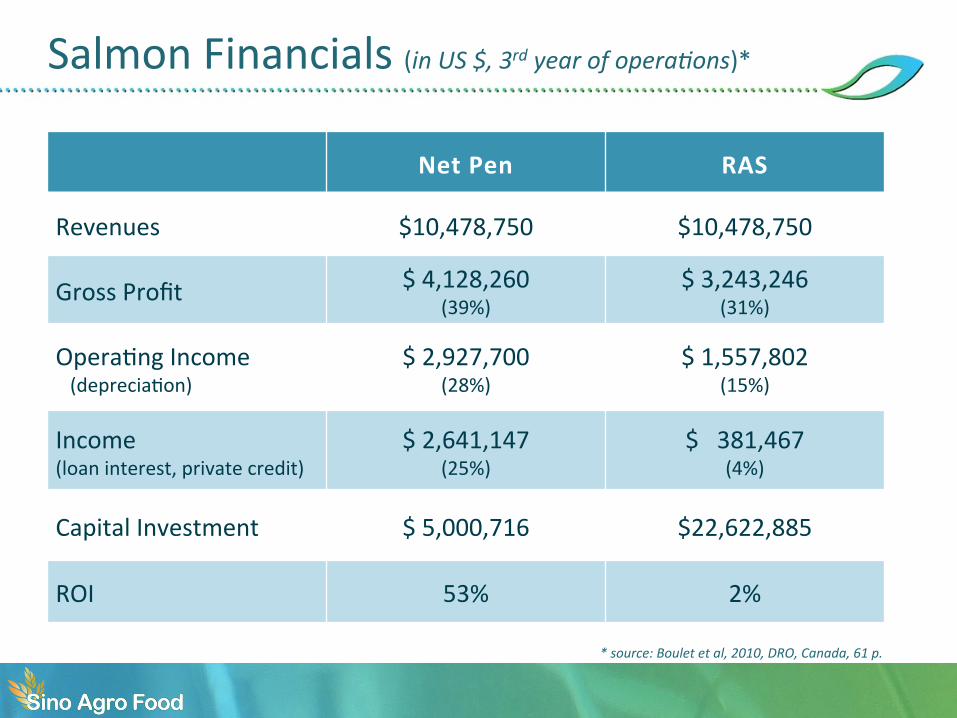
Salmon Financials (in US $, 3rd year of opera_ons)*
Net Pen RAS
Revenues $10,478,750 $10,478,750
Gross Profit $ 4,128,260 (39%)
$ 3,243,246 (31%)
OperaDng Income (depreciaDon)
$ 2,927,700 (28%)
$ 1,557,802 (15%)
Income (loan interest, private credit)
$ 2,641,147 (25%)
$ 381,467 (4%)
Capital Investment $ 5,000,716 $22,622,885
ROI 53% 2%
* source: Boulet et al, 2010, DRO, Canada, 61 p.
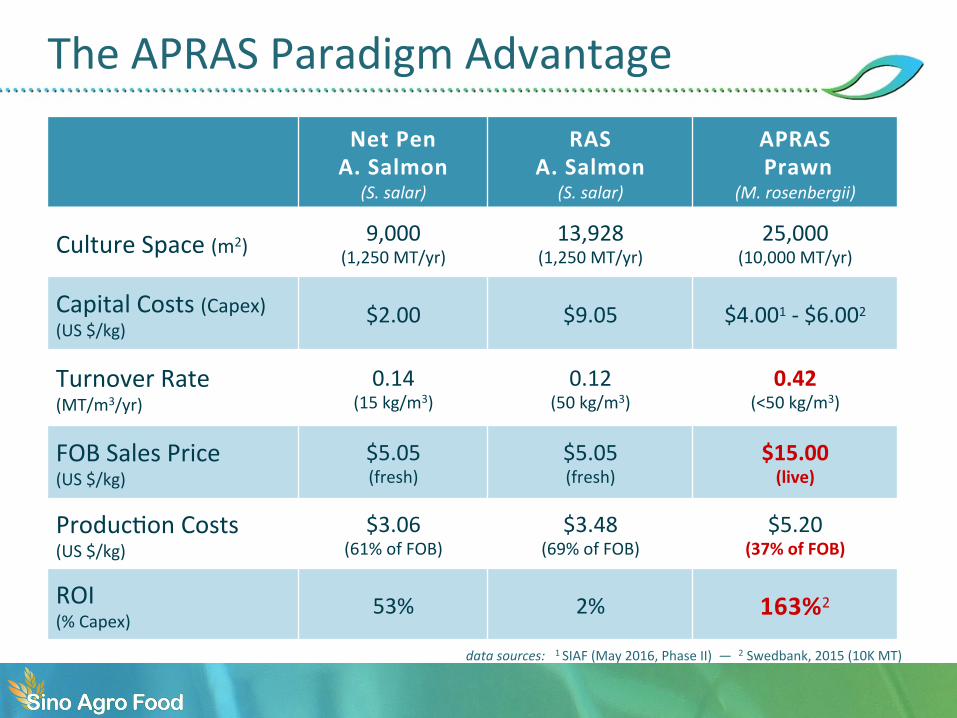
The APRAS Paradigm Advantage
Net Pen A. Salmon
(S. salar)
RAS A. Salmon
(S. salar)
APRAS Prawn
(M. rosenbergii)
Culture Space (m2) 9,000 (1,250 MT/yr)
13,928 (1,250 MT/yr)
25,000 (10,000 MT/yr)
Capital Costs (Capex) (US $/kg)
$2.00 $9.05 $4.001 -‐ $6.002
Turnover Rate (MT/m3/yr)
0.14 (15 kg/m3)
0.12 (50 kg/m3)
0.42 (<50 kg/m3)
FOB Sales Price (US $/kg)
$5.05 (fresh)
$5.05 (fresh)
$15.00 (live)
ProducDon Costs (US $/kg)
$3.06 (61% of FOB)
$3.48 (69% of FOB)
$5.20 (37% of FOB)
ROI (% Capex)
53% 2% 163%2
data sources: 1 SIAF (May 2016, Phase II) — 2 Swedbank, 2015 (10K MT)
The Competitive Edge!
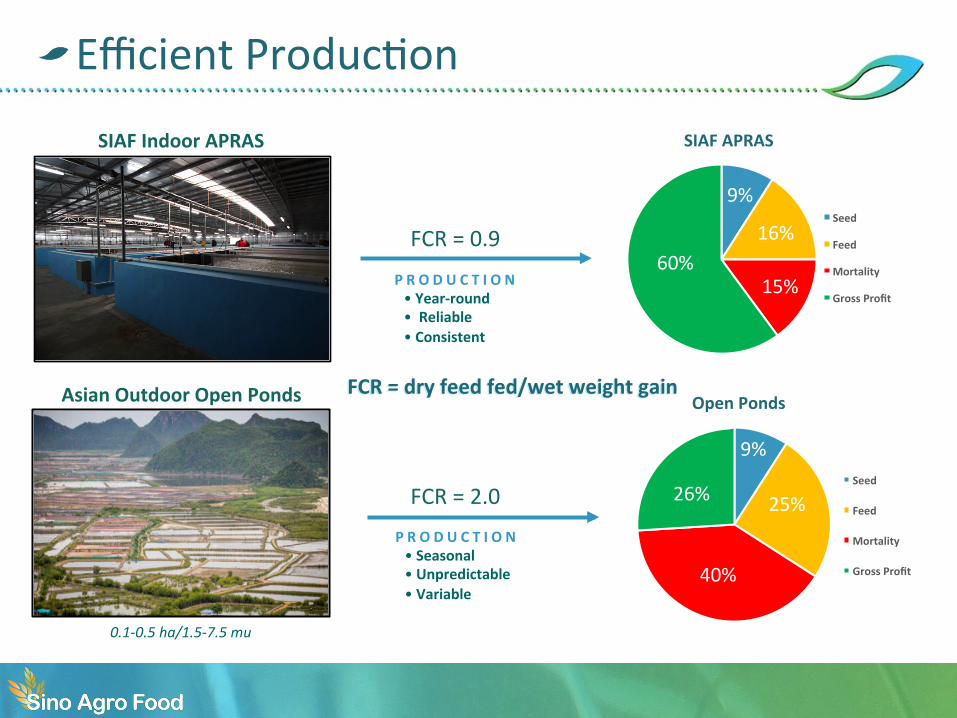
Efficient ProducDon
SIAF APRAS
Seed
Feed
Mortality
Gross Profit 15%
Open Ponds
Seed
Feed
Mortality
Gross Profit
26%
40%
0.1-‐0.5 ha/1.5-‐7.5 mu
Asian Outdoor Open Ponds
SIAF Indoor APRAS
FCR = 0.9
FCR = 2.0
FCR = dry feed fed/wet weight gain
P R O D U C T I O N • Year-‐round • Reliable • Consistent
60%
9%
16%
25%
9%
P R O D U C T I O N • Seasonal • Unpredictable • Variable
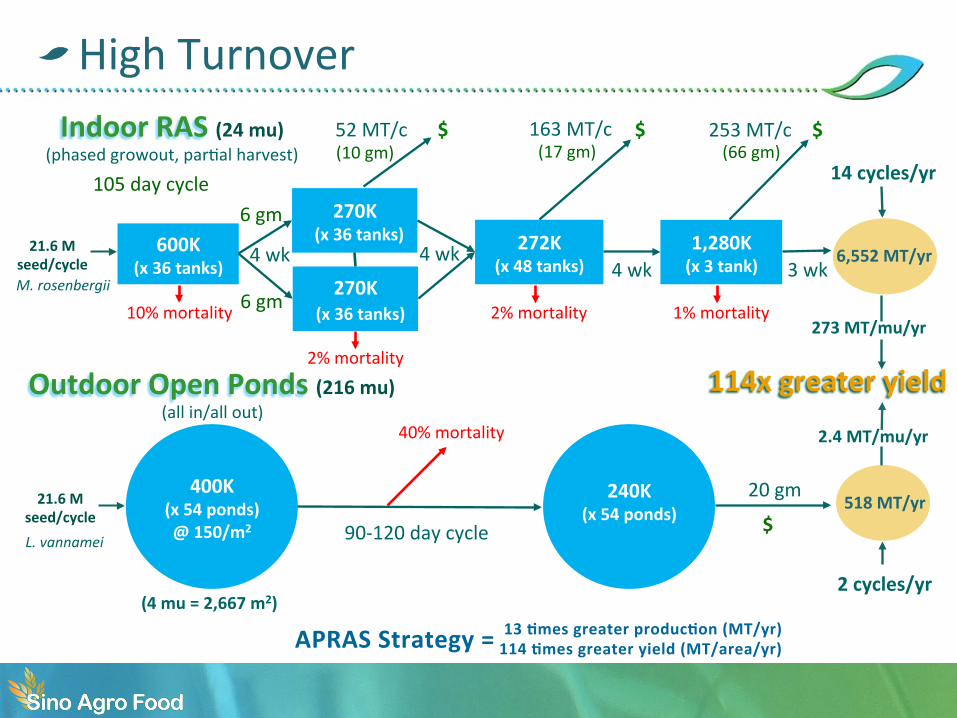
High Turnover
21.6 M seed/cycle
600K (x 36 tanks)
270K (x 36 tanks) 272K
(x 48 tanks) 1,280K (x 3 tank)
Indoor RAS (24 mu) (phased growout, parDal harvest)
Outdoor Open Ponds (216 mu) (all in/all out)
10% mortality
2% mortality
2% mortality 1% mortality
6 gm
(66 gm) (17 gm) (10 gm)
4 wk 4 wk 4 wk 3 wk
114x greater yield
14 cycles/yr
52 MT/c 253 MT/c $ $
273 MT/mu/yr
105 day cycle
M. rosenbergii
400K (x 54 ponds) @ 150/m2
240K (x 54 ponds)
21.6 M seed/cycle
90-‐120 day cycle
40% mortality
20 gm
(4 mu = 2,667 m2) 2 cycles/yr
$
2.4 MT/mu/yr
L. vannamei
163 MT/c
270K (x 36 tanks) 6 gm
$
APRAS Strategy = 13 Dmes greater producDon (MT/yr) 114 Dmes greater yield (MT/area/yr)
518 MT/yr
6,552 MT/yr
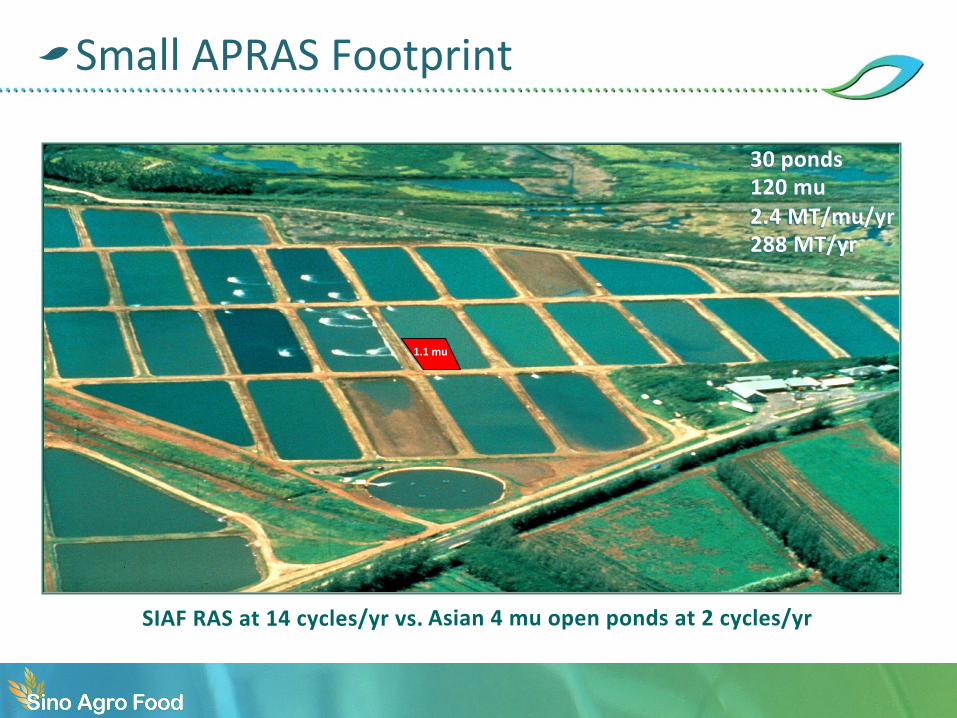
Small APRAS Footprint
30 ponds 120 mu 2.4 MT/mu/yr 288 MT/yr
1.1 mu
Asian 4 mu open ponds at 2 cycles/yr SIAF RAS at 14 cycles/yr vs.
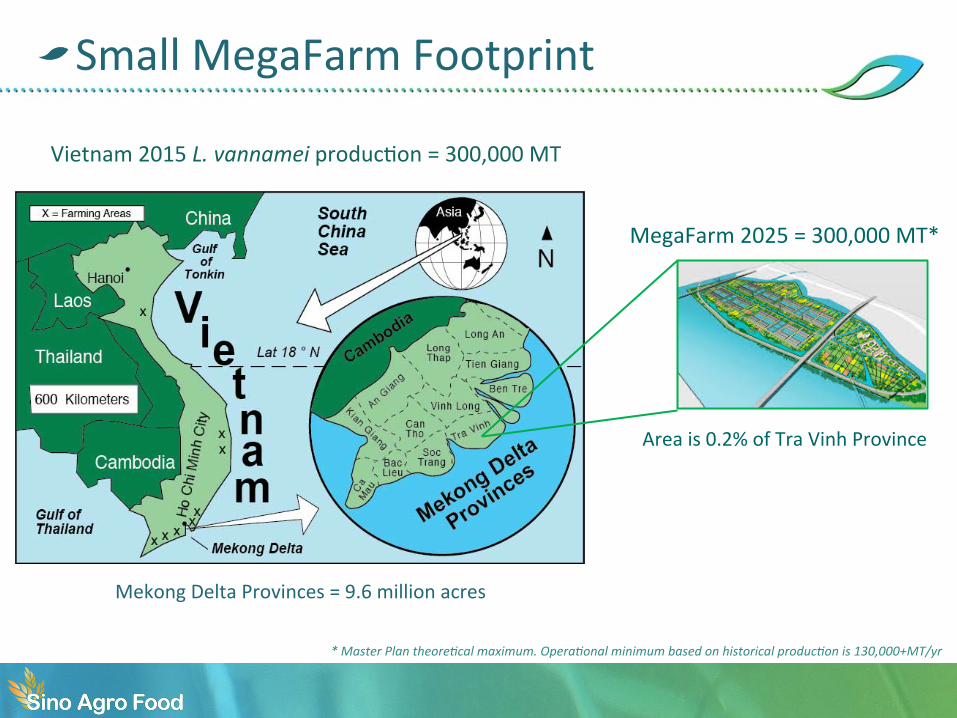
Small MegaFarm Footprint
Vietnam 2015 L. vannamei producDon = 300,000 MT
Area is 0.2% of Tra Vinh Province
MegaFarm 2025 = 300,000 MT*
Mekong Delta Provinces = 9.6 million acres
* Master Plan theore_cal maximum. Opera_onal minimum based on historical produc_on is 130,000+MT/yr
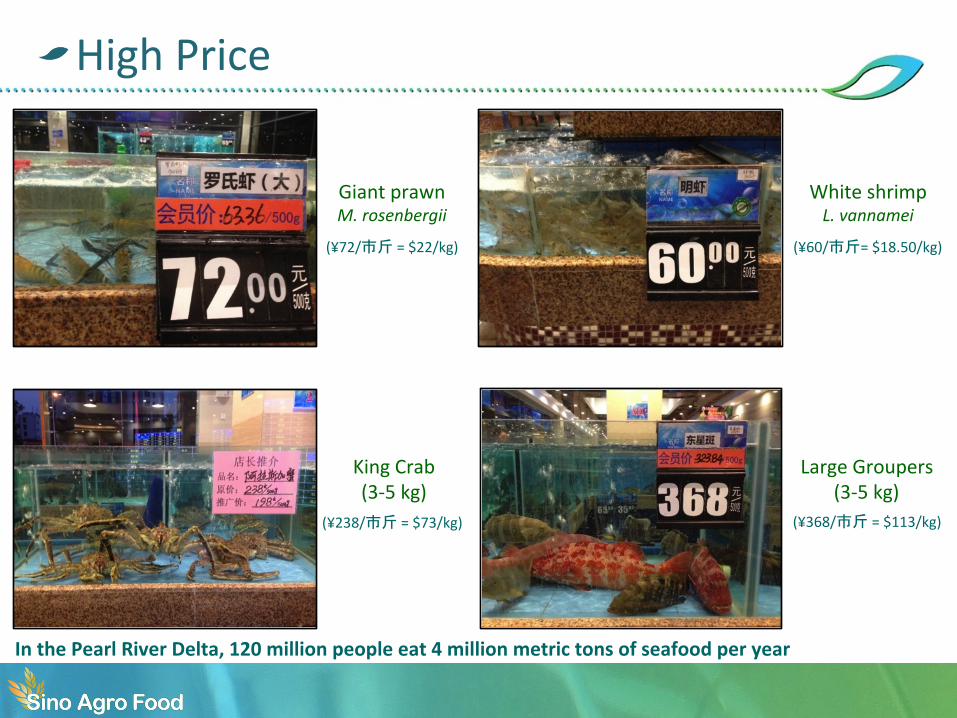
High Price
(¥238/市斤 = $73/kg)
(¥60/市斤= $18.50/kg)
King Crab (3-‐5 kg)
Giant prawn M. rosenbergii
(¥368/市斤 = $113/kg)
(¥72/市斤 = $22/kg)
Large Groupers (3-‐5 kg)
White shrimp L. vannamei
In the Pearl River Delta, 120 million people eat 4 million metric tons of seafood per year
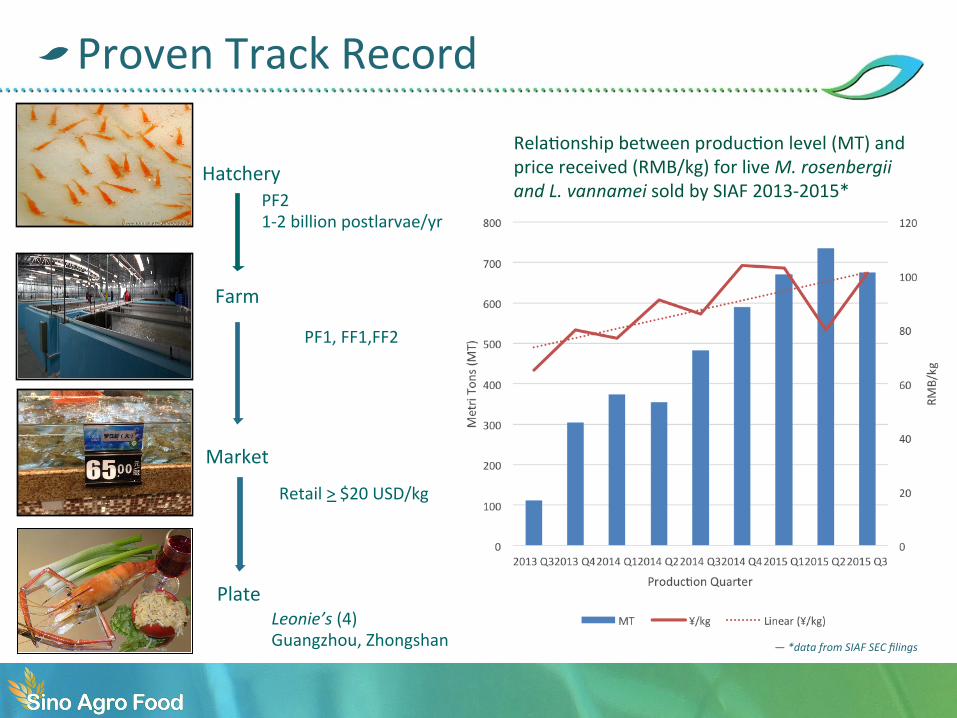
Proven Track Record
RelaDonship between producDon level (MT) and price received (RMB/kg) for live M. rosenbergii and L. vannamei sold by SIAF 2013-‐2015*
Plate
Farm
Hatchery
Market
PF2 1-‐2 billion postlarvae/yr
PF1, FF1,FF2
Retail > $20 USD/kg
Leonie’s (4) Guangzhou, Zhongshan — *data from SIAF SEC filings
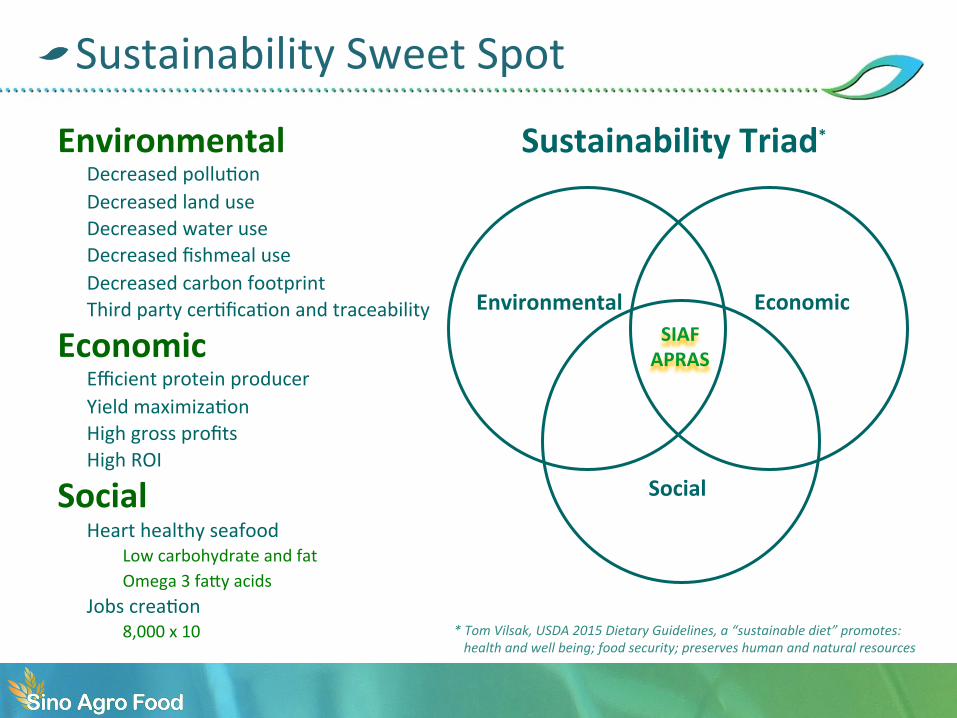
Sustainability Sweet Spot
Environmental Decreased polluDon Decreased land use Decreased water use Decreased fishmeal use Decreased carbon footprint Third party cerDficaDon and traceability
Economic Efficient protein producer Yield maximizaDon High gross profits High ROI
Social Heart healthy seafood
Low carbohydrate and fat Omega 3 fa[y acids
Jobs creaDon 8,000 x 10
SIAF APRAS
Social
Environmental Economic
* Tom Vilsak, USDA 2015 Dietary Guidelines, a “sustainable diet” promotes: health and well being; food security; preserves human and natural resources
Sustainability Triad*
Thank You!!
Sustainable Intelligent Aqua Farming
Disclaimer
General This presentaDon has been prepared by Sino Agro Food, Inc. (“SIAF” or “the Company”) solely for informaDonal purposes. The informaDon contained herein has not been independently verified. No representaDon, warranty or undertaking, express or implied, is made as to, and no reliance should be placed on, the fairness, accuracy, completeness or correctness of the informaDon or the opinions in this presentaDon. SIAF makes no representaDons (expressed or implied) regarding informaDon contained in, or any omissions from, this presentaDon or any other wri[en or oral communicaDons transmi[ed to the recipient. Neither SIAF nor any of its affiliates, advisors or representaDves, will be liable for any loss arising from any connecDon to, or use of, this presentaDon or its contents. This presentaDon does not consDtute an offer to sell or issue or the solicitaDon of an offer to buy or acquire securiDes of the Company in any jurisdicDon or an inducement to enter into investment acDvity, nor may it or any part of it form the basis of or be relied on in connecDon with any contract or commitment whatsoever. The Company undertakes no obligaDon or responsibility to update any of the informaDon contained in this document. Nothing contained in this document shall be relied upon as a promise or representaDon as to the past or future performance of the Company. Forward-‐Looking Statements This presentaDon may contain forward-‐looking statements relaDng to the business of SIAF and its subsidiary companies. All statements other than historical facts are forward-‐looking statements. These include statements about future results of operaDons and capital plans. We cauDon investors that these forward-‐looking statements do not guarantee future performance, and actual results may differ materially. Investors should consider the important risks and uncertainDes, including those described in filings we make with the SEC.
Recommended


![Jantar de final de ano [APRAS]](https://img.pdfslide.net/doc/110x75/5887a38f1a28aba2088b5b99/jantar-de-final-de-ano-apras.jpg)