The Taming of the Shrew: Increasing Performance byAutomatic Parameter Tuning for Java Garbage Collectors
Philipp LengauerChristian Doppler Laboratory MEVSS
Johannes Kepler University Linz, [email protected]
Hanspeter MössenböckInstitute for System Software
Johannes Kepler University Linz, [email protected]
ABSTRACTGarbage collection, if not tuned properly, can considerablyimpact application performance. Unfortunately, configur-ing a garbage collector is a tedious task as only few guide-lines exist and tuning is often done by trial and error. Wepresent what is, to our knowledge, the first published workon automatically tuning Java garbage collectors in a black-box manner considering all available parameters. We pro-pose the use of iterated local search methods to automati-cally compute application-specific garbage collector config-urations. Our experiments show that automatic tuning canreduce garbage collection time by up to 77% for a specificapplication and a specific workload and by 35% on averageacross all benchmarks (compared to the default configura-tion). We evaluated our approach for 3 different garbagecollectors on the DaCapo and SPECjbb benchmarks, as wellas on a real-world industrial application.
Categories and Subject DescriptorsD.3.4 [Programming Languages]: Processors—MemoryManagement (Garbage Collection)
General TermsPerformance, Experimentation, Measurement
KeywordsGarbage Collection, Configuration, Optimization, Java
1. INTRODUCTIONGarbage collection (GC) relieves programmers from re-
claiming unused heap objects manually. This conveniencehas led to a wide-spread use of managed execution environ-ments. Moreover, compacting garbage collectors allow forfaster allocations because allocating an object is as simpleas appending it to the end of the used heap, making expen-sive searches for a fitting memory block unnecessary.
Permission to make digital or hard copies of all or part of this work for personal orclassroom use is granted without fee provided that copies are not made or distributedfor profit or commercial advantage and that copies bear this notice and the full cita-tion on the first page. Copyrights for components of this work owned by others thanACM must be honored. Abstracting with credit is permitted. To copy otherwise, or re-publish, to post on servers or to redistribute to lists, requires prior specific permissionand/or a fee. Request permissions from [email protected]’14, March 22–26, 2014, Dublin, Ireland.Copyright 2014 ACM 978-1-4503-2733-6/14/03 ...$15.00.http://dx.doi.org/10.1145/2568088.2568091.
However, while object allocations produce a direct andeasy to understand performance impact, the costs of garbagecollections are easily overlooked. Programmers are often un-aware of the proportion their application spends on collect-ing garbage. They often also do not know that the lifetimeand the modification patterns of objects can have a big influ-ence on GC behavior. This unawareness may result in badthroughput, long response times, or even in applications thatare completely unresponsive, due to long GC pauses.
Managed environments such as the Java virtual machine(VM), which we used in our research, often provide hundredsof parameters for tuning the garbage collector to the needsof a specific application. Each of these parameters comeswith a default value that has been selected to fit the ‘aver-age application’. However, defining an average applicationis hard considering today’s application diversity. Brecht etal. [8] observed that the default configuration of a garbagecollector is rarely perfect for any given application. As onlya few parameters come with guidelines on how to chooseappropriate values, most operators stick to tuning only thissmall set of parameters, ignoring others which might leadto additional improvements. Due to the lack of documenta-tion, they often exhaustively profile their application withdifferent GC configurations, having only a faint clue of whatthey are doing. This attempt is tedious, and might even befutile, due to the sheer number of parameters, the lack ofknowledge about the GC implementation, and the unknowninfluence of each parameter. Thus, operators have to spenda lot of time for tuning their application, often without find-ing a configuration that provides a significant improvement.
In this paper, we propose to use iterated local search toautomatically find an application-tailored GC configurationin a black-box manner. We also present experiments show-ing that our approach decreases GC time and thus over-all run time significantly on well-known Java benchmarksand on a real-world industrial application. Furthermore, weprovide explanations on why an optimized configuration iswell-suited for the respective application.
Our scientific contributions are a method for automati-cally tuning a Java garbage collector for a specific appli-cation as well as an empirical evaluation for a large set ofbenchmarks and three widely used garbage collectors.
We conducted our research in cooperation with Com-puware Austria GmbH. Compuware develops leading-edgeperformance monitoring tools for multi-tier Java and .NETapplications. In their own applications as well as in applica-tions of their customers, high GC times are a problem thatcurrently cannot be resolved with Compuware’s tools.
111
This paper is structured as follows: Section 2 providesa basic understanding of garbage collection; Section 3 de-scribes the problem we want to address in more detail; Sec-tion 4 illustrates our optimization approach; Section 5 de-scribes our research method and experimental setup as wellas detailed results; Section 6 discusses related work; Sec-tion 7 shows open research questions; and Section 8 con-cludes the paper.
2. GARBAGE COLLECTION IN HOTSPOTThis section provides a basic understanding of the garbage
collectors available in the Java 8 HotspotTM VM.The Serial GC is the oldest of them and was designed
for single-core machines with a small heap. It is a stop-the-world collector, meaning that it suspends the entire VMduring garbage collection. Furthermore, it is a generationalcollector [16, 24], i.e., it divides the heap into a young genera-tion and an old generation of objects. The young generationconsists of a nursery and two survivor spaces, called fromspace and to space. New objects are allocated in the nursery.When the nursery is full, i.e., when there is not enough freespace for a new object, all live objects are marked recur-sively (mark phase) based on the root pointers (i.e., staticvariables, local variables and pointers originating from otherheap spaces). Subsequently, all marked objects in the nurs-ery and in the from space are copied to the to space, andthe two survivor spaces are swapped, resulting in an emptynursery and an empty to space (copy phase). Copying col-lectors waste memory because one survivor space is alwaysempty, but they allow for fast collections because the col-lection time only depends on the number of live objects andnot on the amount of garbage. When an object has surviveda certain number of garbage collections in the young genera-tion, it is tenured, i.e., it is copied into the old generation. Ifthe old generation becomes full, it must be garbage collectedas well. For the old generation, the Serial GC uses a mark-and-compact scheme. First, all live objects are marked; thenall marked objects are moved towards the beginning of theheap, while all pointers to them are adjusted. Mark-and-compact collection is significantly slower than copying col-lection but it does not waste memory for empty semi-spaces.Furthermore, collections of the young generation (minor col-lections) are done much more frequently than collections ofthe old generation (major collections) because most objectsdie young, and thus the old generation does not fill up soquickly.
The Parallel GC uses the same heap layout and the samealgorithms as the Serial GC. However, each phase is done inparallel by multiple threads, decreasing the garbage collec-tion time considerably on multi-core processors.
The Concurrent Mark and Sweep GC is again generationaland is based on the Parallel GC. However, it is not a stop-the-world collector. Rather, it reduces the time of majorcollections by doing parts of its work (e.g., marking) concur-rently in the background while the application (the mutator)runs in the foreground and might even modify references,thus interfering with the collector. Using the ConcurrentMark and Sweep GC increases application responsiveness,especially if all available cores are used by the mutator. Onthe other hand, if the mutator is under heavy load and thusinterferes with the collector heavily, the collector might haveto revisit parts of the heap because references were modifiedby the mutator.
The Garbage First GC [10] is a generational collector. Itdivides the heap into a number of small regions; the younggeneration (i.e., the nursery and the survivor spaces) andthe old generation are logical sets of such regions and arenot contiguous. The marking phase is done concurrently,similar to the Concurrent Mark and Sweep GC, but regionswith only a few live objects are collected first in order tofree as much memory as possible per collection. Thus, thiscollector can deal with large heaps efficiently, because longcollections of many regions arise rarely.
3. PROBLEMThe HotspotTM VM [20] comes with 681 parameters (1338
with a debug build), most of them documented only bysparse comments in the VM’s source code. These param-eters are only exposed with the PrintFlagsFinal VM flag.
To get an overview of this mass of parameters, we cate-gorized them into several groups, e.g., compiler parameters,memory parameters, or threading parameters. As our goalwas to parameterize the garbage collector, we focused onthe memory group. This group was again split into one sub-group for each garbage collector of the HotspotTM VM. Wealso introduced an additional group of parameters affectingall garbage collectors, e.g., parameters setting the field lay-out of an object or the size of allocation buffers. Every groupis stripped from all tracing and debugging flags so that onlyperformance-relevant parameters remain.
Table 1 shows all subgroups of the memory group andtheir respective sizes.
Group ParametersGeneric Memory 17
Parallel GC (Parallel Old GC) 37Garbage First GC (G1) 45
Concurrent Mark and Sweep (CMS) 103Parallel New GC (ParNew) 41
Serial GC 37280
Table 1: Memory parameter groups
Some parameters, such as the preferred heap size and just-in-time compiler, are chosen automatically at startup by thevirtual machine. This mechanism, called Ergonomics [17],takes the underlying hardware (e.g., the number of proces-sors) as well as a pause-time goal into account to choosevalues for a small set of parameters automatically. For ex-ample, the parameter ParallelGCThreads is automaticallyset to the number of available processors when using a paral-lel stop-the-world collector. Unfortunately, this mechanismtakes only static information into account and cannot adjustparameters in response to program characteristics.
Furthermore, parameters are often added or removed fromone VM release to the next, making previous tuning resultsobsolete. If an application is executed on different VMs, theGC parameters might differ entirely. Tuning GC parame-ters automatically counteracts these problems in additionto improving performance.
4. APPROACHOur approach is to use iterated local search for tuning a
garbage collector to the specific needs of a given application.
112
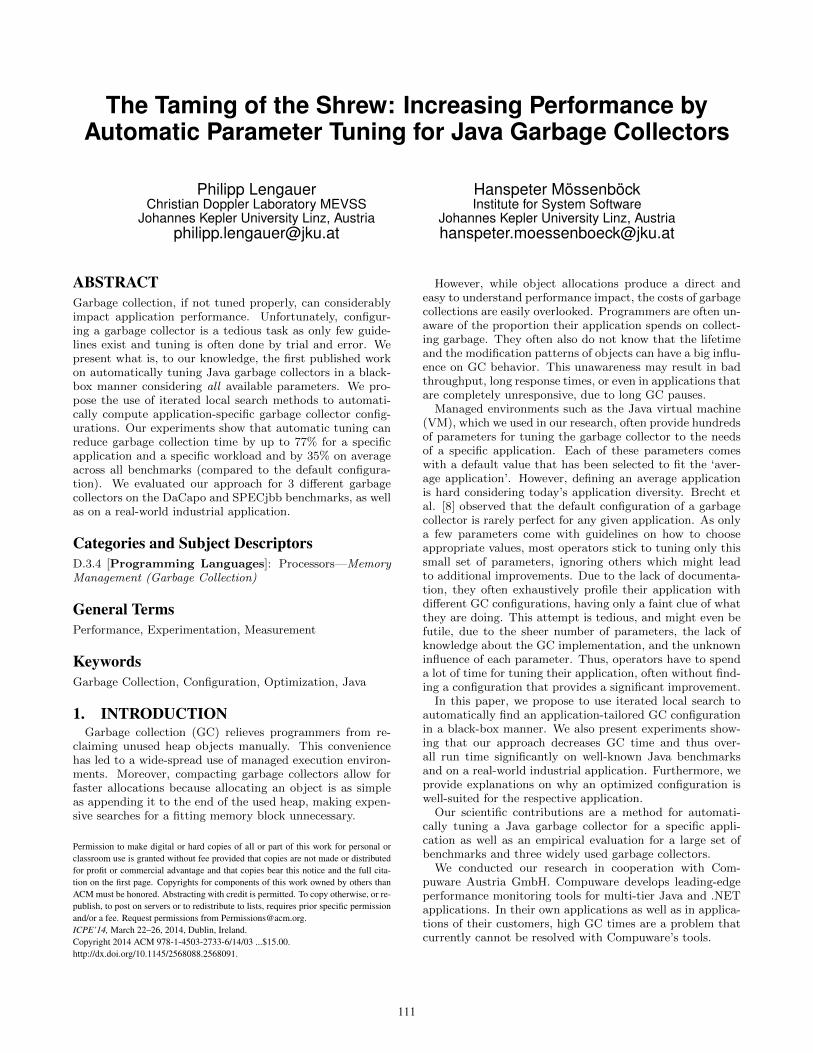
The core of this method is an optimization algorithm thatadjusts parameter values so that the performance is max-imized. For the optimization, we need a parameter modeldescribing the available parameters and their respective le-gal values, as well as an objective function able to evaluatea given configuration by returning a single value describ-ing the induced performance. This function will profile theapplication with the given parameter values because it can-not compute or guess the induced performance in advance.Figure 4 shows the individual elements of our approach.
OptimizationAlgorithm
ParameterModel
Best Configinput output
Application
ObjectiveFunction
profile
parameter values performance
Figure 1: Approach
For the optimization algorithm we decided to useParamILS [14], an existing optimization framework that ispublicly available and easy to use. In the future, however,we also plan to try other optimization frameworks.
4.1 Parameter ModelThe input of the optimization algorithm defines the pa-
rameter model, with the names of all available parameters,their valid values, and their start values. Furthermore, itincludes a description of the relationships between parame-ters, e.g., parameter A must not be set if parameter B hasa certain value. Figure 2 shows a partial model of four GCparameters in ParamILS-specific syntax.
XX:TargetSurvivorRatio {25, 50, 75} [50]XX:? DisableExplicitSystemGC {0, 1} [0]XX:? UseAdaptiveSizePolicy {0, 1} [0]XX:? UseAdaptiveSizePolicyWithSystemGC {0,
1} [0]
Conditionals:XX:? UseAdaptiveSizePolicyWithSystemGC |
XX:? DisableExplicitSystemGC in {0}XX:? UseAdaptiveSizePolicyWithSystemGC |
XX:? UseAdaptiveSizePolicy in {1}
Figure 2: ParamILS input example
The parameter XX:TargetSurvivorRatio is a numeric pa-rameter with the legal values 25, 50, and 75, and a startvalue of 50. The parameters XX:?DisableExplicitSystem-
GC, XX:?UseAdaptiveSizePolicy, and XX:?UseAdaptive-
SizePolicyWithSystemGC are boolean parameters, 0 beingfalse and 1 being true. As the names suggest, UseAdaptive-SizePolicy enables an adaptive heap-resizing policy dur-ing garbage collection. XX:?UseAdaptiveSizePolicyWith-
SystemGC enables this policy also when System.gc() iscalled, whereas System.gc() calls can be disabled by settingXX:?DisableExplicitSystemGC to true. Obviously, allowing
adaptive resizing with System.gc() makes no sense if adap-tive resizing was disabled in the first place. Such constraintsare defined in the last section of the input file, headed bythe Conditionals keyword. Each line in this section de-scribes that the first parameter is only to be set if the valueof the second parameter is within the specified values. Thiscan reduce the search space for the optimization algorithmsignificantly, producing better results faster.
4.2 Objective FunctionIn addition to the parameter model, we need an objective
function translating given parameter values into a perfor-mance metric. In our case, the objective function is im-plemented by a script that starts a Java application severaltimes and extracts its garbage collection time via Java Man-agement Beans and returns the median to the optimizationalgorithm. As we extract the aggregated garbage collectiontime, the optimization algorithm will optimize for overallthroughput. Other optimization goals that could be consid-ered will be briefly discussed in Section 7.
4.3 ParamILSWhen provided with a parameter description (i.e., a pa-
rameter model) and an appropriate problem launcher (i.e.,an objective function), ParamILS can optimize the param-eter settings for any kind of problem. For finding an opti-mum, the solution space (i.e., all sets of parameter values)is searched using an iterated local search plus a heuristic formaking random changes to the configuration from time totime in order to avoid getting stuck in local minima. Todetermine the quality of a configuration, the quality metricvalue returned by the objective function is used. This ap-proach is very similar to hill climbing, i.e., it changes oneparameter at a time until no more improvement is observed,then it repeats the same with the next parameter, and soon. Furthermore, ParamILS introduces a technique calledadaptive capping, which aborts runs as soon as they becomeobvious to not yield any improvement. The optimization al-gorithm and its implementation are explained in more detailin Hutter et al. [14].
5. EXPERIMENTSWe used our approach described in Section 4 to find the
best GC parameter settings for several Java benchmarks us-ing an iterated local search algorithm that tunes parametervalues in order to find the smallest overall GC time for agiven application and a given input. This section describesour experiments and their results for three different GCs.
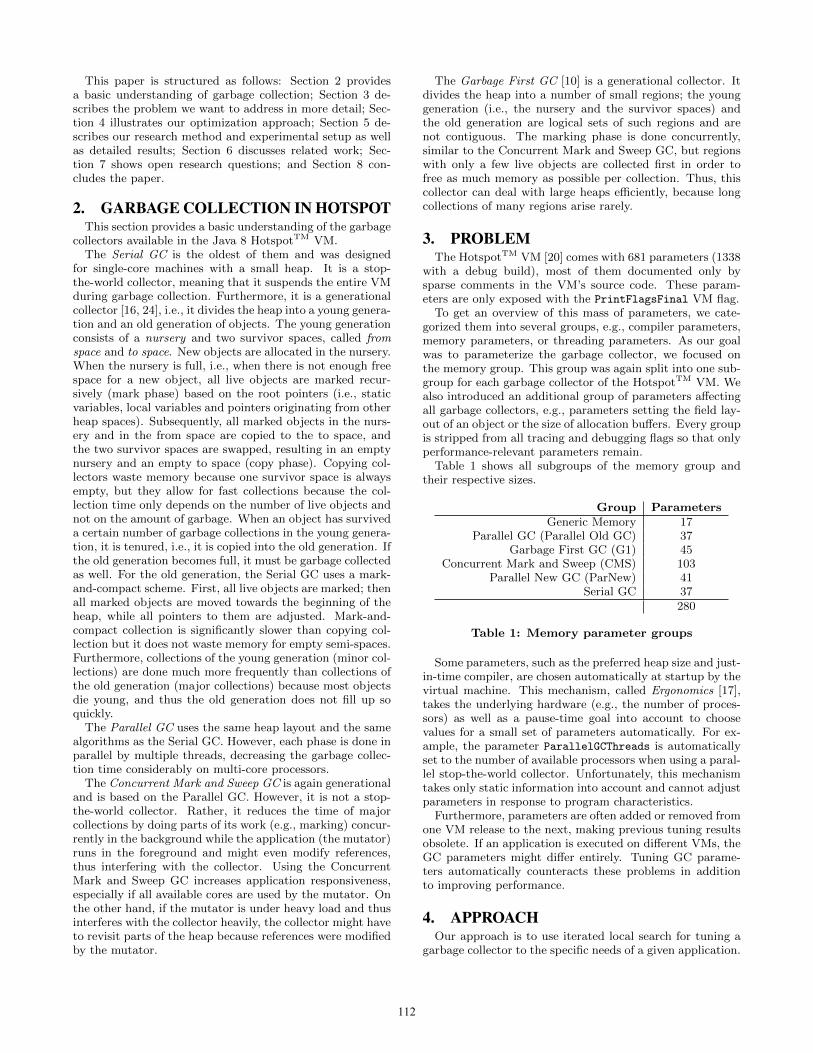
5.1 Setup and Research MethodFigure 3 shows the setup of our experiment. As described
in Section 4, we use ParamILS as a configuration optimizer.The output of the optimizer, i.e., the best configurationfound, is piped to the configuration minimizer, which elimi-nates all parameters that retained their default values. Thisminimum configuration is used by the validator to executeseveral runs, both with the default configuration and withthe minimum configuration, to make more detailed qualitymeasurements.
Since the number of possible parameter configurations ishuge, the optimizer cannot explore them all. So we have tostop after a certain number of runs or after a certain time.We decided to stop the optimization of an application after
113
Configuration OptimizerParamILS
ParameterDescription
Application
Best Configuration
ConfigurationMinimizer
Best MinimalConfiguration
Default Configuration
Validator
Quality Measurements
Figure 3: Experiment setup
4 hours. Experiments showed that not much improvement isto be expected after that time for most of our benchmarks,but of course different termination criteria could be used forother experiments. Our experiments optimize for through-put, i.e., the quality metric to be minimized is the overallGC time in an application. Other optimization objectivesare discussed in Section 7.
The following subsections describe our research method inmore detail, i.e., the selection of benchmarks, the selectionof garbage collectors, and the definition of quality metrics.
5.1.1 BenchmarksTo get a broad set of benchmarks, we used applications
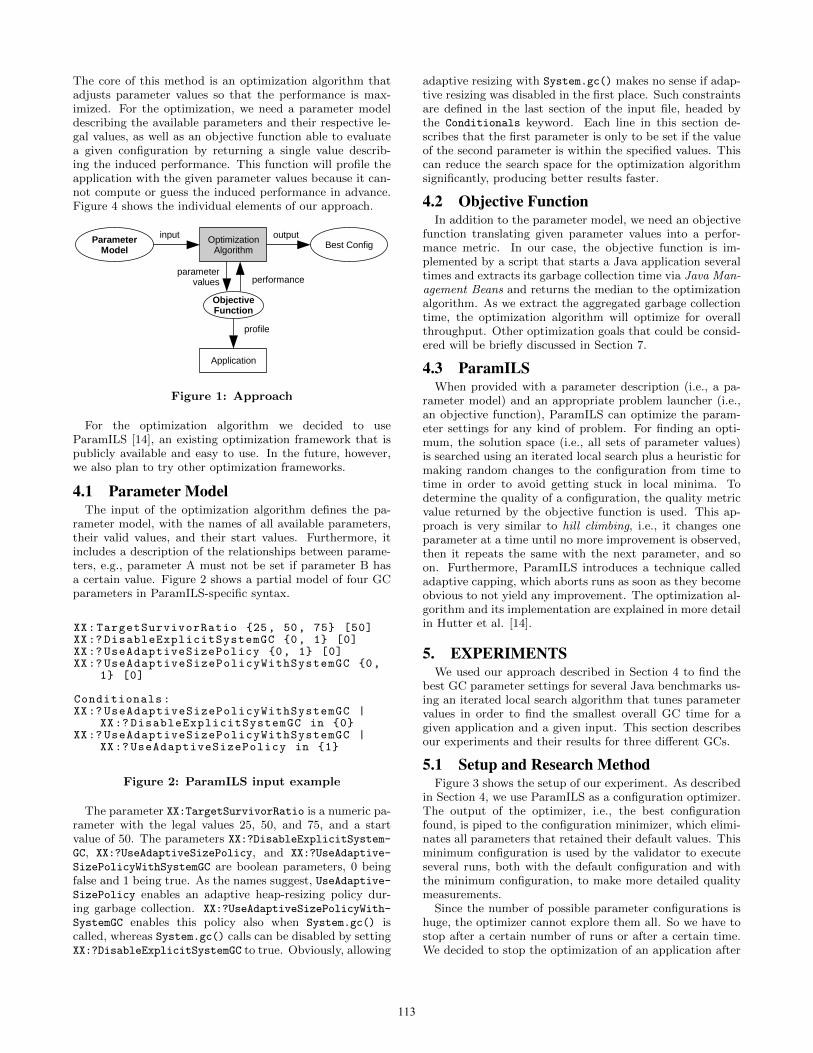
from various sources. We looked at the DaCapo 2009benchmark suite, based on Blackburn et al. [7, 1], andselected seven GC-intensive benchmarks, i.e., eclipse, h2,jython, sunflow, tomcat, tradesoap and xalan. Unfortu-nately, eclipse crashes on Java 8 [20] and was therefore ex-cluded from our selection. In addition to that, we selectedthe SPECjbb 2005 benchmark which puts a lot of pressureon the garbage collector. The DaCapo benchmarks werealways executed with the largest input supported and theSPECjbb benchmark was executed with eight warehouses.For each of these benchmarks, we experimentally determinedthe minimum heap required for execution. Table 2 shows ourbenchmarks as well as their minimum heap sizes and averagerun times when using Java 8 and the Parallel GC.
Benchmark Min. Heap [MB] Run Time [s]DaCapo h2 300 36.89DaCapo jython 40 11.03DaCapo sunflow 10 6.49DaCapo tomcat 75 6.08DaCapo tradesoap 25 18.18DaCapo xalan 10 11.00SPECjbb 300 451.68
Table 2: Benchmarks used for the experiments
5.1.2 Garbage CollectorsTo show that our approach is applicable to any garbage
collector, we conducted our experiments with three differentgarbage collectors and their respective parameters:
• The Parallel GC is the default garbage collector, mak-ing it one of the most frequently used GCs.
• The Concurrent Mark and Sweep GC was selected be-cause the customers of our industrial partner makeheavy use of it.
• The Garbage First GC (also called G1 GC) was in-cluded because is uses a relatively new algorithm, andis therefore quite different from the other garbage col-lectors. Furthermore, it enjoys increasing popularitywith large server applications.
We excluded parameters setting the heap size because thereis ample evidence (e.g., Yang et al. [27], Brecht et al. [8])that the heap size has a significant impact on garbage collec-tor performance. Furthermore, if we enable the optimizer toadjust the heap size as well, it will always choose the biggestallowed value.
5.1.3 Quality MetricsWe defined four quality metrics for determining the qual-
ity of a garbage collector configuration:
• The garbage collection time is the overall time thebenchmark spent on collecting garbage. Minimizingthis metric is the main goal of our optimization.
• The run time or throughput determines the impact ofthe optimized configuration on the overall applicationbehavior. The DaCapo benchmarks process a given in-put and terminate subsequently, making the run timea good performance indicator. The SPECjbb bench-mark, on the other hand, runs for a fixed amount oftime, making the run time a useless metric. In thiscase, we rather measure the throughput.
• The garbage collection frequency describes the numberof garbage collection cycles that occurred during thebenchmark execution. Together with the garbage col-lection time, this metric can be used to estimate theaverage length of garbage collection pauses.
• The peak heap usage indicates the maximum amountof live memory during benchmark execution.
Whenever these metrics were measured, we executed a num-ber of warm-ups first in order to stabilize the caches and toJIT-compile all the hot spots.
We examined all optimized configurations and their in-duced behavior by injecting custom agents into the VM,which extract information such as the GC frequencies andthe GC times. These agents use the Java Virtual MachineTool Interface (JVMTI) to access VM-internal information.
In order to better understand the results and offer detailedinterpretations, we also used the built-in GC logging mech-anism as well as VM instrumentation to collect additionaldata, e.g., the run time of individual GC phases or the av-erage object ages. Our custom VM does not introduce anycostly computations, but rather aggregates and exposes al-ready existing information. For example, the average objectage is computed during the marking phase, because the GChas to traverse all objects anyway. Nevertheless, to reducethe risk of tainted results, all figures in the following sub-sections have been created without GC logging and with anunmodified VM.
114
5.1.4 Hardware and SoftwareWe ran our experiments on an Intel R© CoreTM i7-3770
CPU @ 3.40GHz×4 (8 Threads) on 64-bit with 18GB RAMrunning Ubuntu 12.10 Quantal Quetzal with the KernelLinux 3.5.0-38-generic. All unnecessary services were dis-abled and the experiments were always executed in text-onlymode. We used the OpenJDK 8 Early Access Release b100[20], because significant changes were made to the garbagecollectors compared to Java 7, e.g., the permanent genera-tion was removed.
5.2 ResultsThis subsection provides an overview of the results of our
experiments. A detailed discussion will follow in Section 5.3.Figures 4 - 7 show the measured quality metrics for all
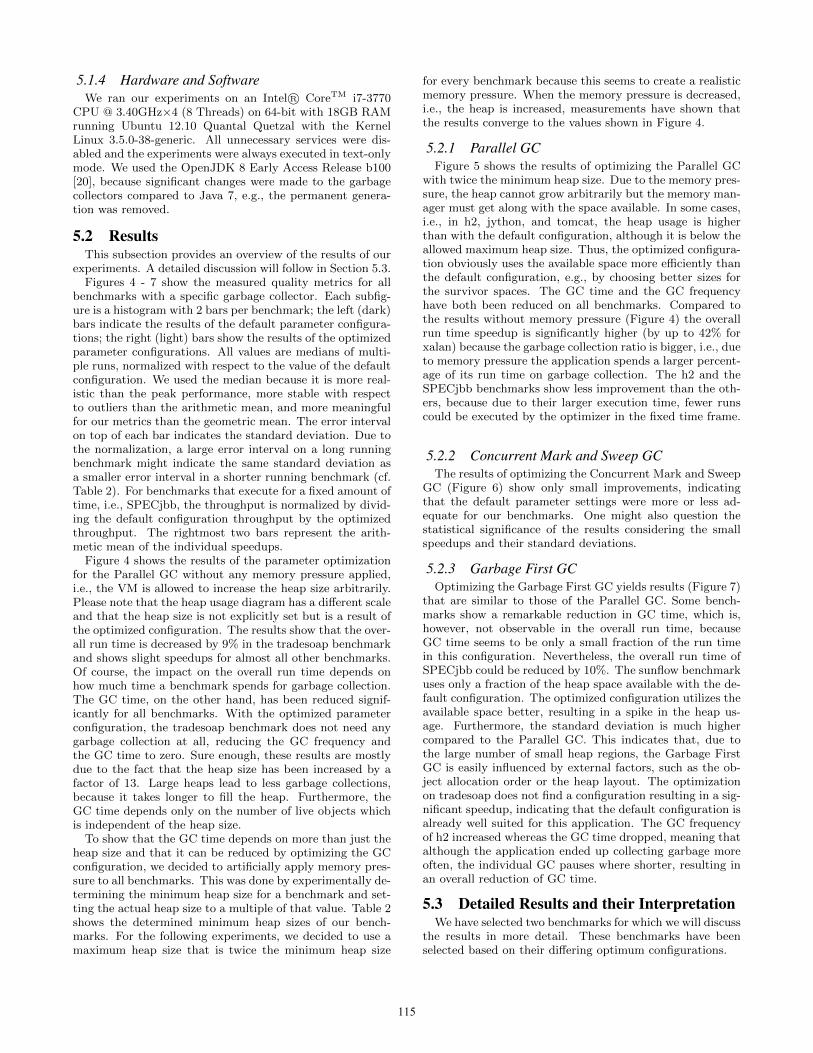
benchmarks with a specific garbage collector. Each subfig-ure is a histogram with 2 bars per benchmark; the left (dark)bars indicate the results of the default parameter configura-tions; the right (light) bars show the results of the optimizedparameter configurations. All values are medians of multi-ple runs, normalized with respect to the value of the defaultconfiguration. We used the median because it is more real-istic than the peak performance, more stable with respectto outliers than the arithmetic mean, and more meaningfulfor our metrics than the geometric mean. The error intervalon top of each bar indicates the standard deviation. Due tothe normalization, a large error interval on a long runningbenchmark might indicate the same standard deviation asa smaller error interval in a shorter running benchmark (cf.Table 2). For benchmarks that execute for a fixed amount oftime, i.e., SPECjbb, the throughput is normalized by divid-ing the default configuration throughput by the optimizedthroughput. The rightmost two bars represent the arith-metic mean of the individual speedups.
Figure 4 shows the results of the parameter optimizationfor the Parallel GC without any memory pressure applied,i.e., the VM is allowed to increase the heap size arbitrarily.Please note that the heap usage diagram has a different scaleand that the heap size is not explicitly set but is a result ofthe optimized configuration. The results show that the over-all run time is decreased by 9% in the tradesoap benchmarkand shows slight speedups for almost all other benchmarks.Of course, the impact on the overall run time depends onhow much time a benchmark spends for garbage collection.The GC time, on the other hand, has been reduced signif-icantly for all benchmarks. With the optimized parameterconfiguration, the tradesoap benchmark does not need anygarbage collection at all, reducing the GC frequency andthe GC time to zero. Sure enough, these results are mostlydue to the fact that the heap size has been increased by afactor of 13. Large heaps lead to less garbage collections,because it takes longer to fill the heap. Furthermore, theGC time depends only on the number of live objects whichis independent of the heap size.
To show that the GC time depends on more than just theheap size and that it can be reduced by optimizing the GCconfiguration, we decided to artificially apply memory pres-sure to all benchmarks. This was done by experimentally de-termining the minimum heap size for a benchmark and set-ting the actual heap size to a multiple of that value. Table 2shows the determined minimum heap sizes of our bench-marks. For the following experiments, we decided to use amaximum heap size that is twice the minimum heap size
for every benchmark because this seems to create a realisticmemory pressure. When the memory pressure is decreased,i.e., the heap is increased, measurements have shown thatthe results converge to the values shown in Figure 4.
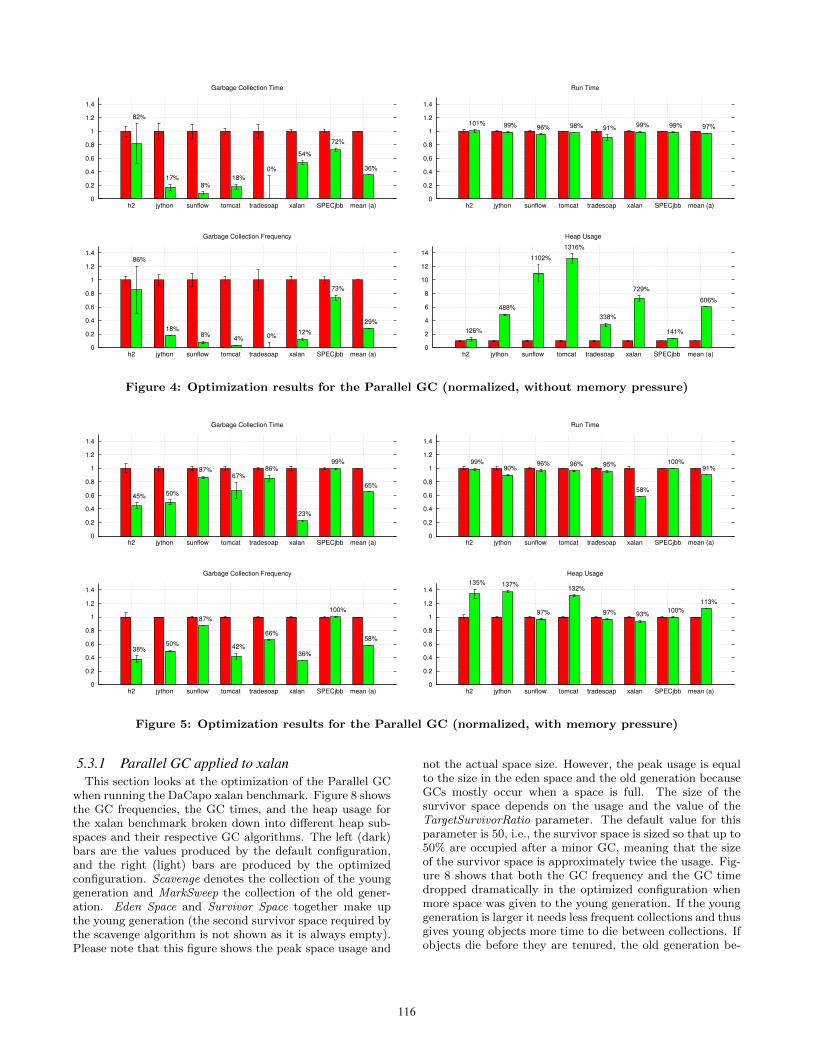
5.2.1 Parallel GCFigure 5 shows the results of optimizing the Parallel GC
with twice the minimum heap size. Due to the memory pres-sure, the heap cannot grow arbitrarily but the memory man-ager must get along with the space available. In some cases,i.e., in h2, jython, and tomcat, the heap usage is higherthan with the default configuration, although it is below theallowed maximum heap size. Thus, the optimized configura-tion obviously uses the available space more efficiently thanthe default configuration, e.g., by choosing better sizes forthe survivor spaces. The GC time and the GC frequencyhave both been reduced on all benchmarks. Compared tothe results without memory pressure (Figure 4) the overallrun time speedup is significantly higher (by up to 42% forxalan) because the garbage collection ratio is bigger, i.e., dueto memory pressure the application spends a larger percent-age of its run time on garbage collection. The h2 and theSPECjbb benchmarks show less improvement than the oth-ers, because due to their larger execution time, fewer runscould be executed by the optimizer in the fixed time frame.
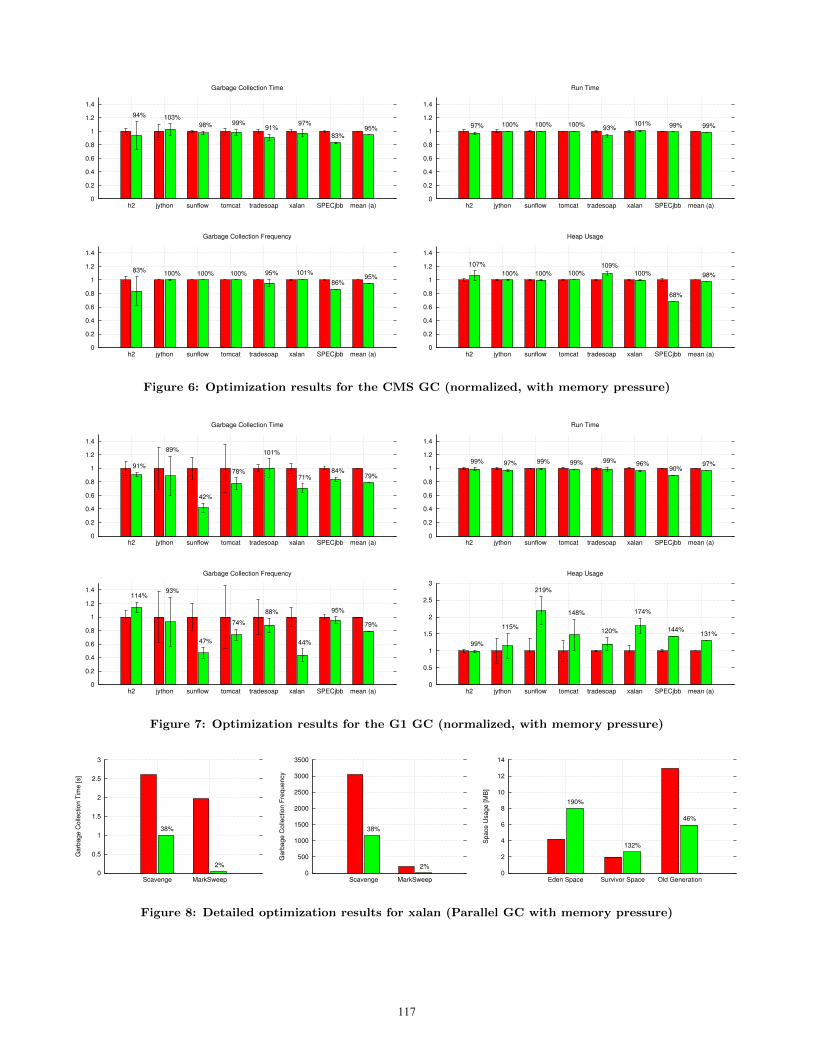
5.2.2 Concurrent Mark and Sweep GCThe results of optimizing the Concurrent Mark and Sweep
GC (Figure 6) show only small improvements, indicatingthat the default parameter settings were more or less ad-equate for our benchmarks. One might also question thestatistical significance of the results considering the smallspeedups and their standard deviations.
5.2.3 Garbage First GCOptimizing the Garbage First GC yields results (Figure 7)
that are similar to those of the Parallel GC. Some bench-marks show a remarkable reduction in GC time, which is,however, not observable in the overall run time, becauseGC time seems to be only a small fraction of the run timein this configuration. Nevertheless, the overall run time ofSPECjbb could be reduced by 10%. The sunflow benchmarkuses only a fraction of the heap space available with the de-fault configuration. The optimized configuration utilizes theavailable space better, resulting in a spike in the heap us-age. Furthermore, the standard deviation is much highercompared to the Parallel GC. This indicates that, due tothe large number of small heap regions, the Garbage FirstGC is easily influenced by external factors, such as the ob-ject allocation order or the heap layout. The optimizationon tradesoap does not find a configuration resulting in a sig-nificant speedup, indicating that the default configuration isalready well suited for this application. The GC frequencyof h2 increased whereas the GC time dropped, meaning thatalthough the application ended up collecting garbage moreoften, the individual GC pauses where shorter, resulting inan overall reduction of GC time.
5.3 Detailed Results and their InterpretationWe have selected two benchmarks for which we will discuss
the results in more detail. These benchmarks have beenselected based on their differing optimum configurations.
115
0
0.2
0.4
0.6
0.8
1
1.2
1.4
h2 jython sunflow tomcat tradesoap xalan SPECjbb mean (a)
Garbage Collection Time
82%
17%8%
18%
0%
54%
72%
36%
0
0.2
0.4
0.6
0.8
1
1.2
1.4
h2 jython sunflow tomcat tradesoap xalan SPECjbb mean (a)
Run Time
101% 99% 96% 98% 91% 99% 99% 97%
0
0.2
0.4
0.6
0.8
1
1.2
1.4
h2 jython sunflow tomcat tradesoap xalan SPECjbb mean (a)
Garbage Collection Frequency
86%
18%8%
4% 0%12%
73%
29%
0
2
4
6
8
10
12
14
h2 jython sunflow tomcat tradesoap xalan SPECjbb mean (a)
Heap Usage
126%
488%
1102%
1316%
338%
729%
141%
606%
Figure 4: Optimization results for the Parallel GC (normalized, without memory pressure)
0
0.2
0.4
0.6
0.8
1
1.2
1.4
h2 jython sunflow tomcat tradesoap xalan SPECjbb mean (a)
Garbage Collection Time
45% 50%
87%67%
86%
23%
99%
65%
0
0.2
0.4
0.6
0.8
1
1.2
1.4
h2 jython sunflow tomcat tradesoap xalan SPECjbb mean (a)
Run Time
99%90%
96% 96% 95%
58%
100%91%
0
0.2
0.4
0.6
0.8
1
1.2
1.4
h2 jython sunflow tomcat tradesoap xalan SPECjbb mean (a)
Garbage Collection Frequency
38%50%
87%
42%
66%
36%
100%
58%
0
0.2
0.4
0.6
0.8
1
1.2
1.4
h2 jython sunflow tomcat tradesoap xalan SPECjbb mean (a)
Heap Usage
135% 137%
97%
132%
97% 93%100%
113%
Figure 5: Optimization results for the Parallel GC (normalized, with memory pressure)
5.3.1 Parallel GC applied to xalanThis section looks at the optimization of the Parallel GC
when running the DaCapo xalan benchmark. Figure 8 showsthe GC frequencies, the GC times, and the heap usage forthe xalan benchmark broken down into different heap sub-spaces and their respective GC algorithms. The left (dark)bars are the values produced by the default configuration,and the right (light) bars are produced by the optimizedconfiguration. Scavenge denotes the collection of the younggeneration and MarkSweep the collection of the old gener-ation. Eden Space and Survivor Space together make upthe young generation (the second survivor space required bythe scavenge algorithm is not shown as it is always empty).Please note that this figure shows the peak space usage and
not the actual space size. However, the peak usage is equalto the size in the eden space and the old generation becauseGCs mostly occur when a space is full. The size of thesurvivor space depends on the usage and the value of theTargetSurvivorRatio parameter. The default value for thisparameter is 50, i.e., the survivor space is sized so that up to50% are occupied after a minor GC, meaning that the sizeof the survivor space is approximately twice the usage. Fig-ure 8 shows that both the GC frequency and the GC timedropped dramatically in the optimized configuration whenmore space was given to the young generation. If the younggeneration is larger it needs less frequent collections and thusgives young objects more time to die between collections. Ifobjects die before they are tenured, the old generation be-
116
0
0.2
0.4
0.6
0.8
1
1.2
1.4
h2 jython sunflow tomcat tradesoap xalan SPECjbb mean (a)
Garbage Collection Time
94% 103%98% 99%
91%97%
83%95%
0
0.2
0.4
0.6
0.8
1
1.2
1.4
h2 jython sunflow tomcat tradesoap xalan SPECjbb mean (a)
Run Time
97% 100% 100% 100%93%
101% 99% 99%
0
0.2
0.4
0.6
0.8
1
1.2
1.4
h2 jython sunflow tomcat tradesoap xalan SPECjbb mean (a)
Garbage Collection Frequency
83%100% 100% 100% 95% 101%
86%95%
0
0.2
0.4
0.6
0.8
1
1.2
1.4
h2 jython sunflow tomcat tradesoap xalan SPECjbb mean (a)
Heap Usage
107%
100% 100% 100%109%
100%
68%
98%
Figure 6: Optimization results for the CMS GC (normalized, with memory pressure)
0
0.2
0.4
0.6
0.8
1
1.2
1.4
h2 jython sunflow tomcat tradesoap xalan SPECjbb mean (a)
Garbage Collection Time
91%
89%
42%
78%
101%
71%84%
79%
0
0.2
0.4
0.6
0.8
1
1.2
1.4
h2 jython sunflow tomcat tradesoap xalan SPECjbb mean (a)
Run Time
99% 97% 99% 99% 99% 96%90%
97%
0
0.2
0.4
0.6
0.8
1
1.2
1.4
h2 jython sunflow tomcat tradesoap xalan SPECjbb mean (a)
Garbage Collection Frequency
114%93%
47%
74%
88%
44%
95%
79%
0
0.5
1
1.5
2
2.5
3
h2 jython sunflow tomcat tradesoap xalan SPECjbb mean (a)
Heap Usage
99%
115%
219%
148%
120%
174%
144%131%
Figure 7: Optimization results for the G1 GC (normalized, with memory pressure)
0
0.5
1
1.5
2
2.5
3
Scavenge MarkSweep
Ga
rba
ge
Co
llectio
n T
ime
[s]
38%
2%
0
500
1000
1500
2000
2500
3000
3500
Scavenge MarkSweep
Ga
rba
ge
Co
llectio
n F
req
ue
ncy
38%
2% 0
2
4
6
8
10
12
14
Eden Space Survivor Space Old Generation
Sp
ace
Usa
ge
[M
B]
190%
132%
46%
Figure 8: Detailed optimization results for xalan (Parallel GC with memory pressure)
117
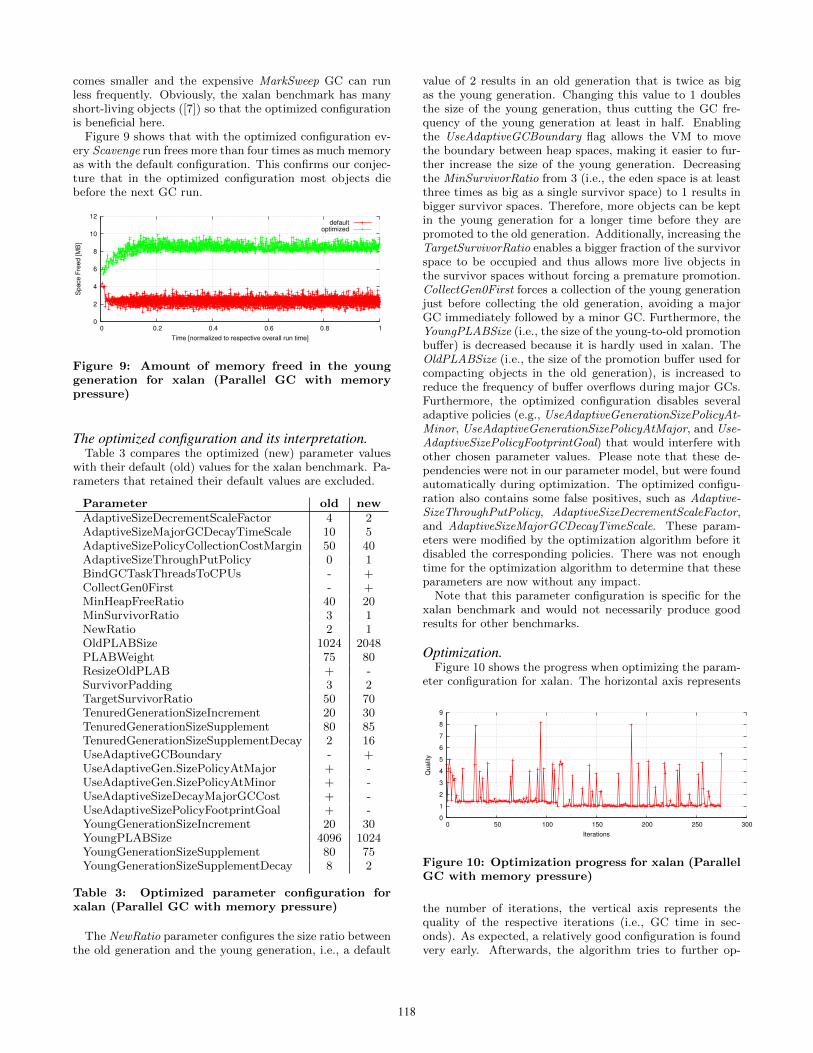
comes smaller and the expensive MarkSweep GC can runless frequently. Obviously, the xalan benchmark has manyshort-living objects ([7]) so that the optimized configurationis beneficial here.
Figure 9 shows that with the optimized configuration ev-ery Scavenge run frees more than four times as much memoryas with the default configuration. This confirms our conjec-ture that in the optimized configuration most objects diebefore the next GC run.
0
2
4
6
8
10
12
0 0.2 0.4 0.6 0.8 1
Sp
ace
Fre
ed
[M
B]
Time [normalized to respective overall run time]
defaultoptimized
Figure 9: Amount of memory freed in the younggeneration for xalan (Parallel GC with memorypressure)
The optimized configuration and its interpretation.Table 3 compares the optimized (new) parameter values
with their default (old) values for the xalan benchmark. Pa-rameters that retained their default values are excluded.
Parameter old newAdaptiveSizeDecrementScaleFactor 4 2AdaptiveSizeMajorGCDecayTimeScale 10 5AdaptiveSizePolicyCollectionCostMargin 50 40AdaptiveSizeThroughPutPolicy 0 1BindGCTaskThreadsToCPUs - +CollectGen0First - +MinHeapFreeRatio 40 20MinSurvivorRatio 3 1NewRatio 2 1OldPLABSize 1024 2048PLABWeight 75 80ResizeOldPLAB + -SurvivorPadding 3 2TargetSurvivorRatio 50 70TenuredGenerationSizeIncrement 20 30TenuredGenerationSizeSupplement 80 85TenuredGenerationSizeSupplementDecay 2 16UseAdaptiveGCBoundary - +UseAdaptiveGen.SizePolicyAtMajor + -UseAdaptiveGen.SizePolicyAtMinor + -UseAdaptiveSizeDecayMajorGCCost + -UseAdaptiveSizePolicyFootprintGoal + -YoungGenerationSizeIncrement 20 30YoungPLABSize 4096 1024YoungGenerationSizeSupplement 80 75YoungGenerationSizeSupplementDecay 8 2
Table 3: Optimized parameter configuration forxalan (Parallel GC with memory pressure)
The NewRatio parameter configures the size ratio betweenthe old generation and the young generation, i.e., a default
value of 2 results in an old generation that is twice as bigas the young generation. Changing this value to 1 doublesthe size of the young generation, thus cutting the GC fre-quency of the young generation at least in half. Enablingthe UseAdaptiveGCBoundary flag allows the VM to movethe boundary between heap spaces, making it easier to fur-ther increase the size of the young generation. Decreasingthe MinSurvivorRatio from 3 (i.e., the eden space is at leastthree times as big as a single survivor space) to 1 results inbigger survivor spaces. Therefore, more objects can be keptin the young generation for a longer time before they arepromoted to the old generation. Additionally, increasing theTargetSurvivorRatio enables a bigger fraction of the survivorspace to be occupied and thus allows more live objects inthe survivor spaces without forcing a premature promotion.CollectGen0First forces a collection of the young generationjust before collecting the old generation, avoiding a majorGC immediately followed by a minor GC. Furthermore, theYoungPLABSize (i.e., the size of the young-to-old promotionbuffer) is decreased because it is hardly used in xalan. TheOldPLABSize (i.e., the size of the promotion buffer used forcompacting objects in the old generation), is increased toreduce the frequency of buffer overflows during major GCs.Furthermore, the optimized configuration disables severaladaptive policies (e.g., UseAdaptiveGenerationSizePolicyAt-Minor, UseAdaptiveGenerationSizePolicyAtMajor, and Use-AdaptiveSizePolicyFootprintGoal) that would interfere withother chosen parameter values. Please note that these de-pendencies were not in our parameter model, but were foundautomatically during optimization. The optimized configu-ration also contains some false positives, such as Adaptive-SizeThroughPutPolicy, AdaptiveSizeDecrementScaleFactor,and AdaptiveSizeMajorGCDecayTimeScale. These param-eters were modified by the optimization algorithm before itdisabled the corresponding policies. There was not enoughtime for the optimization algorithm to determine that theseparameters are now without any impact.
Note that this parameter configuration is specific for thexalan benchmark and would not necessarily produce goodresults for other benchmarks.
Optimization.Figure 10 shows the progress when optimizing the param-
eter configuration for xalan. The horizontal axis represents
0
1
2
3
4
5
6
7
8
9
0 50 100 150 200 250 300
Qu
alit
y
Iterations
Figure 10: Optimization progress for xalan (ParallelGC with memory pressure)
the number of iterations, the vertical axis represents thequality of the respective iterations (i.e., GC time in sec-onds). As expected, a relatively good configuration is foundvery early. Afterwards, the algorithm tries to further op-
118
timize the configuration, occasionally making a bad choiceresulting in spikes, but returning immediately if a changedoes not show an improvement. In all our benchmarks, agood configuration was already found after a few iterations,and no further significant improvements were made after atotal optimization time of 4 hours.
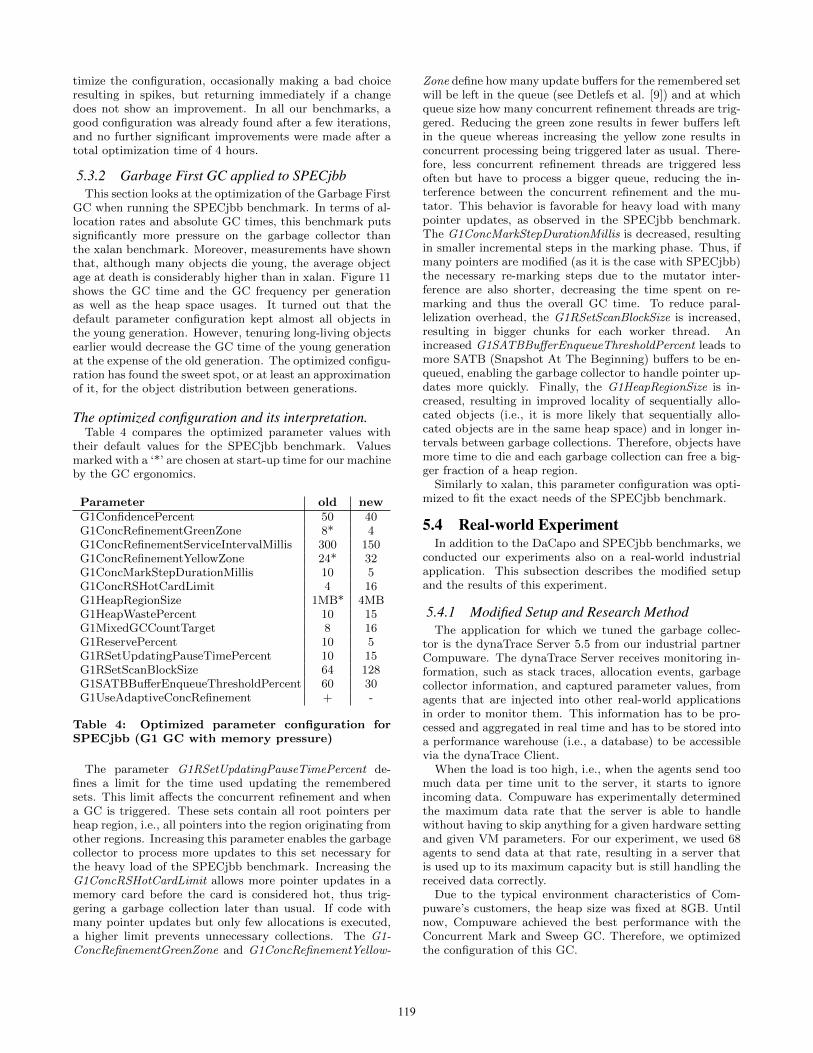
5.3.2 Garbage First GC applied to SPECjbbThis section looks at the optimization of the Garbage First
GC when running the SPECjbb benchmark. In terms of al-location rates and absolute GC times, this benchmark putssignificantly more pressure on the garbage collector thanthe xalan benchmark. Moreover, measurements have shownthat, although many objects die young, the average objectage at death is considerably higher than in xalan. Figure 11shows the GC time and the GC frequency per generationas well as the heap space usages. It turned out that thedefault parameter configuration kept almost all objects inthe young generation. However, tenuring long-living objectsearlier would decrease the GC time of the young generationat the expense of the old generation. The optimized configu-ration has found the sweet spot, or at least an approximationof it, for the object distribution between generations.
The optimized configuration and its interpretation.Table 4 compares the optimized parameter values with
their default values for the SPECjbb benchmark. Valuesmarked with a ‘*’ are chosen at start-up time for our machineby the GC ergonomics.
Parameter old newG1ConfidencePercent 50 40G1ConcRefinementGreenZone 8* 4G1ConcRefinementServiceIntervalMillis 300 150G1ConcRefinementYellowZone 24* 32G1ConcMarkStepDurationMillis 10 5G1ConcRSHotCardLimit 4 16G1HeapRegionSize 1MB* 4MBG1HeapWastePercent 10 15G1MixedGCCountTarget 8 16G1ReservePercent 10 5G1RSetUpdatingPauseTimePercent 10 15G1RSetScanBlockSize 64 128G1SATBBufferEnqueueThresholdPercent 60 30G1UseAdaptiveConcRefinement + -
Table 4: Optimized parameter configuration forSPECjbb (G1 GC with memory pressure)
The parameter G1RSetUpdatingPauseTimePercent de-fines a limit for the time used updating the rememberedsets. This limit affects the concurrent refinement and whena GC is triggered. These sets contain all root pointers perheap region, i.e., all pointers into the region originating fromother regions. Increasing this parameter enables the garbagecollector to process more updates to this set necessary forthe heavy load of the SPECjbb benchmark. Increasing theG1ConcRSHotCardLimit allows more pointer updates in amemory card before the card is considered hot, thus trig-gering a garbage collection later than usual. If code withmany pointer updates but only few allocations is executed,a higher limit prevents unnecessary collections. The G1-ConcRefinementGreenZone and G1ConcRefinementYellow-
Zone define how many update buffers for the remembered setwill be left in the queue (see Detlefs et al. [9]) and at whichqueue size how many concurrent refinement threads are trig-gered. Reducing the green zone results in fewer buffers leftin the queue whereas increasing the yellow zone results inconcurrent processing being triggered later as usual. There-fore, less concurrent refinement threads are triggered lessoften but have to process a bigger queue, reducing the in-terference between the concurrent refinement and the mu-tator. This behavior is favorable for heavy load with manypointer updates, as observed in the SPECjbb benchmark.The G1ConcMarkStepDurationMillis is decreased, resultingin smaller incremental steps in the marking phase. Thus, ifmany pointers are modified (as it is the case with SPECjbb)the necessary re-marking steps due to the mutator inter-ference are also shorter, decreasing the time spent on re-marking and thus the overall GC time. To reduce paral-lelization overhead, the G1RSetScanBlockSize is increased,resulting in bigger chunks for each worker thread. Anincreased G1SATBBufferEnqueueThresholdPercent leads tomore SATB (Snapshot At The Beginning) buffers to be en-queued, enabling the garbage collector to handle pointer up-dates more quickly. Finally, the G1HeapRegionSize is in-creased, resulting in improved locality of sequentially allo-cated objects (i.e., it is more likely that sequentially allo-cated objects are in the same heap space) and in longer in-tervals between garbage collections. Therefore, objects havemore time to die and each garbage collection can free a big-ger fraction of a heap region.
Similarly to xalan, this parameter configuration was opti-mized to fit the exact needs of the SPECjbb benchmark.
5.4 Real-world ExperimentIn addition to the DaCapo and SPECjbb benchmarks, we
conducted our experiments also on a real-world industrialapplication. This subsection describes the modified setupand the results of this experiment.
5.4.1 Modified Setup and Research MethodThe application for which we tuned the garbage collec-
tor is the dynaTrace Server 5.5 from our industrial partnerCompuware. The dynaTrace Server receives monitoring in-formation, such as stack traces, allocation events, garbagecollector information, and captured parameter values, fromagents that are injected into other real-world applicationsin order to monitor them. This information has to be pro-cessed and aggregated in real time and has to be stored intoa performance warehouse (i.e., a database) to be accessiblevia the dynaTrace Client.
When the load is too high, i.e., when the agents send toomuch data per time unit to the server, it starts to ignoreincoming data. Compuware has experimentally determinedthe maximum data rate that the server is able to handlewithout having to skip anything for a given hardware settingand given VM parameters. For our experiment, we used 68agents to send data at that rate, resulting in a server thatis used up to its maximum capacity but is still handling thereceived data correctly.
Due to the typical environment characteristics of Com-puware’s customers, the heap size was fixed at 8GB. Untilnow, Compuware achieved the best performance with theConcurrent Mark and Sweep GC. Therefore, we optimizedthe configuration of this GC.
119
0
5
10
15
20
25
30
35
40
Young Generation Old Generation
Ga
rba
ge
Co
llectio
n T
ime
[s] 83%
3163% 0
500
1000
1500
2000
2500
3000
3500
4000
Young Generation Old Generation
Ga
rba
ge
Co
llectio
n F
req
ue
ncy
97%
150% 0
100
200
300
400
500
600
Eden Regions Survivor Regions Old Generation
Sp
ace
Usa
ge
[M
B]
119%
110%
165%
Figure 11: Detailed optimization results for SPECjbb (G1 GC with memory pressure)
As the server is handling requests continuously, we fixed asingle optimization iteration, i.e., a single run with a givenconfiguration, to 15 minutes. The optimization was con-ducted for 2.5 days, resulting in about 600 iterations.
Similar to the other benchmarks, the objective functionwas defined as the aggregated GC time during 15 minutesunder load. We had to add additional safeguards to the ob-jective function because some configurations, while leadingto an overall GC time improvement, had significantly longerGC pauses. Such configurations resulted in a decreased re-sponsiveness, forcing the server to skip data. Thus, theobjective function continuously reads the server logs andreports a configuration as crashed when the server startsskipping data or when it loses the connection to the agentsdue to long GC pauses. Such effects arise early, which en-ables the optimization algorithm to save time because it canprematurely abort runs with such configurations.
The server ran on 4 × MJ3GK E7540 @ 2.4GHz×6 Intel R©Xeon R© Multi Core Dunnington D0 on 64-bit with 96GBRAM running Linux Ubuntu 10.10 Maverick Meerkat. Theagents creating the load ran on separate machines in thesame network in order to avoid biased results.
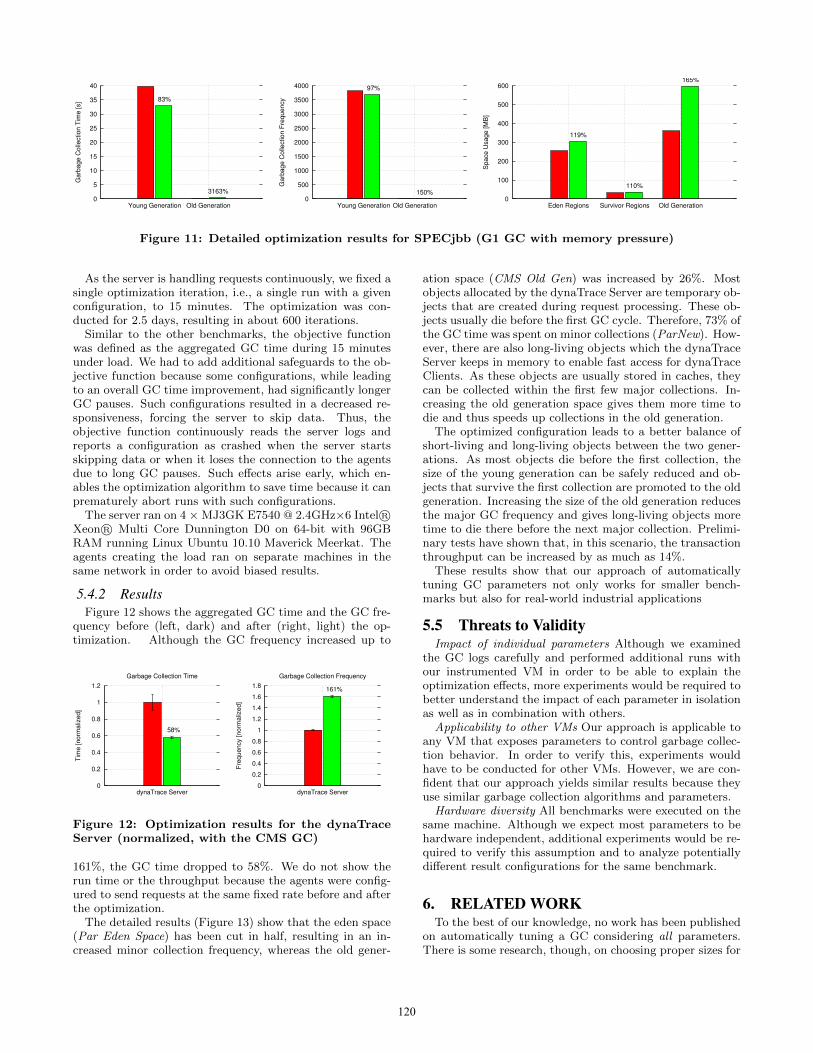
5.4.2 ResultsFigure 12 shows the aggregated GC time and the GC fre-
quency before (left, dark) and after (right, light) the op-timization. Although the GC frequency increased up to
0
0.2
0.4
0.6
0.8
1
1.2
dynaTrace Server
Tim
e [
no
rma
lize
d]
Garbage Collection Time
58%
0
0.2
0.4
0.6
0.8
1
1.2
1.4
1.6
1.8
dynaTrace Server
Fre
qu
en
cy [
no
rma
lize
d]
Garbage Collection Frequency
161%
Figure 12: Optimization results for the dynaTraceServer (normalized, with the CMS GC)
161%, the GC time dropped to 58%. We do not show therun time or the throughput because the agents were config-ured to send requests at the same fixed rate before and afterthe optimization.
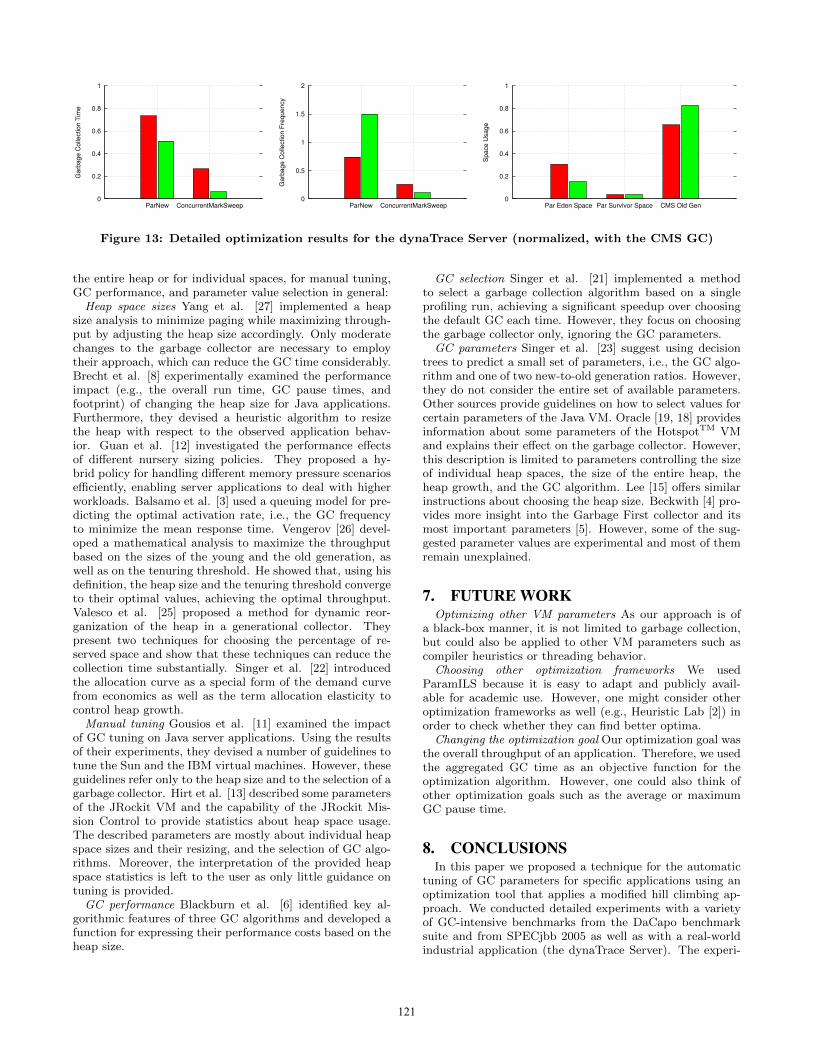
The detailed results (Figure 13) show that the eden space(Par Eden Space) has been cut in half, resulting in an in-creased minor collection frequency, whereas the old gener-
ation space (CMS Old Gen) was increased by 26%. Mostobjects allocated by the dynaTrace Server are temporary ob-jects that are created during request processing. These ob-jects usually die before the first GC cycle. Therefore, 73% ofthe GC time was spent on minor collections (ParNew). How-ever, there are also long-living objects which the dynaTraceServer keeps in memory to enable fast access for dynaTraceClients. As these objects are usually stored in caches, theycan be collected within the first few major collections. In-creasing the old generation space gives them more time todie and thus speeds up collections in the old generation.
The optimized configuration leads to a better balance ofshort-living and long-living objects between the two gener-ations. As most objects die before the first collection, thesize of the young generation can be safely reduced and ob-jects that survive the first collection are promoted to the oldgeneration. Increasing the size of the old generation reducesthe major GC frequency and gives long-living objects moretime to die there before the next major collection. Prelimi-nary tests have shown that, in this scenario, the transactionthroughput can be increased by as much as 14%.
These results show that our approach of automaticallytuning GC parameters not only works for smaller bench-marks but also for real-world industrial applications
5.5 Threats to ValidityImpact of individual parameters Although we examined
the GC logs carefully and performed additional runs withour instrumented VM in order to be able to explain theoptimization effects, more experiments would be required tobetter understand the impact of each parameter in isolationas well as in combination with others.
Applicability to other VMs Our approach is applicable toany VM that exposes parameters to control garbage collec-tion behavior. In order to verify this, experiments wouldhave to be conducted for other VMs. However, we are con-fident that our approach yields similar results because theyuse similar garbage collection algorithms and parameters.
Hardware diversity All benchmarks were executed on thesame machine. Although we expect most parameters to behardware independent, additional experiments would be re-quired to verify this assumption and to analyze potentiallydifferent result configurations for the same benchmark.
6. RELATED WORKTo the best of our knowledge, no work has been published
on automatically tuning a GC considering all parameters.There is some research, though, on choosing proper sizes for
120
0
0.2
0.4
0.6
0.8
1
ParNew ConcurrentMarkSweep
Ga
rba
ge
Co
llectio
n T
ime
0
0.5
1
1.5
2
ParNew ConcurrentMarkSweep
Ga
rba
ge
Co
llectio
n F
req
ue
ncy
0
0.2
0.4
0.6
0.8
1
Par Eden Space Par Survivor Space CMS Old Gen
Sp
ace
Usa
ge
Figure 13: Detailed optimization results for the dynaTrace Server (normalized, with the CMS GC)
the entire heap or for individual spaces, for manual tuning,GC performance, and parameter value selection in general:
Heap space sizes Yang et al. [27] implemented a heapsize analysis to minimize paging while maximizing through-put by adjusting the heap size accordingly. Only moderatechanges to the garbage collector are necessary to employtheir approach, which can reduce the GC time considerably.Brecht et al. [8] experimentally examined the performanceimpact (e.g., the overall run time, GC pause times, andfootprint) of changing the heap size for Java applications.Furthermore, they devised a heuristic algorithm to resizethe heap with respect to the observed application behav-ior. Guan et al. [12] investigated the performance effectsof different nursery sizing policies. They proposed a hy-brid policy for handling different memory pressure scenariosefficiently, enabling server applications to deal with higherworkloads. Balsamo et al. [3] used a queuing model for pre-dicting the optimal activation rate, i.e., the GC frequencyto minimize the mean response time. Vengerov [26] devel-oped a mathematical analysis to maximize the throughputbased on the sizes of the young and the old generation, aswell as on the tenuring threshold. He showed that, using hisdefinition, the heap size and the tenuring threshold convergeto their optimal values, achieving the optimal throughput.Valesco et al. [25] proposed a method for dynamic reor-ganization of the heap in a generational collector. Theypresent two techniques for choosing the percentage of re-served space and show that these techniques can reduce thecollection time substantially. Singer et al. [22] introducedthe allocation curve as a special form of the demand curvefrom economics as well as the term allocation elasticity tocontrol heap growth.
Manual tuning Gousios et al. [11] examined the impactof GC tuning on Java server applications. Using the resultsof their experiments, they devised a number of guidelines totune the Sun and the IBM virtual machines. However, theseguidelines refer only to the heap size and to the selection of agarbage collector. Hirt et al. [13] described some parametersof the JRockit VM and the capability of the JRockit Mis-sion Control to provide statistics about heap space usage.The described parameters are mostly about individual heapspace sizes and their resizing, and the selection of GC algo-rithms. Moreover, the interpretation of the provided heapspace statistics is left to the user as only little guidance ontuning is provided.
GC performance Blackburn et al. [6] identified key al-gorithmic features of three GC algorithms and developed afunction for expressing their performance costs based on theheap size.
GC selection Singer et al. [21] implemented a methodto select a garbage collection algorithm based on a singleprofiling run, achieving a significant speedup over choosingthe default GC each time. However, they focus on choosingthe garbage collector only, ignoring the GC parameters.
GC parameters Singer et al. [23] suggest using decisiontrees to predict a small set of parameters, i.e., the GC algo-rithm and one of two new-to-old generation ratios. However,they do not consider the entire set of available parameters.Other sources provide guidelines on how to select values forcertain parameters of the Java VM. Oracle [19, 18] providesinformation about some parameters of the HotspotTM VMand explains their effect on the garbage collector. However,this description is limited to parameters controlling the sizeof individual heap spaces, the size of the entire heap, theheap growth, and the GC algorithm. Lee [15] offers similarinstructions about choosing the heap size. Beckwith [4] pro-vides more insight into the Garbage First collector and itsmost important parameters [5]. However, some of the sug-gested parameter values are experimental and most of themremain unexplained.
7. FUTURE WORKOptimizing other VM parameters As our approach is of
a black-box manner, it is not limited to garbage collection,but could also be applied to other VM parameters such ascompiler heuristics or threading behavior.
Choosing other optimization frameworks We usedParamILS because it is easy to adapt and publicly avail-able for academic use. However, one might consider otheroptimization frameworks as well (e.g., Heuristic Lab [2]) inorder to check whether they can find better optima.
Changing the optimization goal Our optimization goal wasthe overall throughput of an application. Therefore, we usedthe aggregated GC time as an objective function for theoptimization algorithm. However, one could also think ofother optimization goals such as the average or maximumGC pause time.
8. CONCLUSIONSIn this paper we proposed a technique for the automatic
tuning of GC parameters for specific applications using anoptimization tool that applies a modified hill climbing ap-proach. We conducted detailed experiments with a varietyof GC-intensive benchmarks from the DaCapo benchmarksuite and from SPECjbb 2005 as well as with a real-worldindustrial application (the dynaTrace Server). The experi-
121
ments were performed for 3 widely used garbage collectorsof the HotspotTM VM.
Our measurements show that for some benchmarks, theGC time can be reduced by up to 77% leading to an over-all run-time speedup of up to 42% relative to the defaultconfiguration. The average reduction of GC time across allbenchmarks was 35% and the average speedup on overallrun time was 9% (for the HotspotTM default GC).
With dozens of GC parameters, which are scarcely docu-mented and hard to understand, the manual tuning of ap-plications is a tedious task which is often guided by trialand error. Automatic tuning can be an attractive alterna-tive that exploits otherwise hidden GC potential based onthe characteristics of specific applications.
9. ACKNOWLEDGMENTSThis work was supported by the Christian Doppler
Forschungsgesellschaft, and by Compuware Austria GmbH.
10. REFERENCES[1] DaCapo. http://www.dacapobench.org/, 2013.
[2] M. Affenzeller. Architecture and Design of theHeuristicLab Optimization Environment. In AdvancedMethods and Applications in ComputationalIntelligence, pages 197–261, 2014.
[3] S. Balsamo, G.-L. D. Rossi, and A. Marin.Optimisation of Virtual Machine Garbage CollectionPolicies. In Proc. of the Intl. Conf. on Analytical andStochastic Modeling Techniques and Applications,pages 70–84, 2011.
[4] M. Beckwith. G1: One Garbage Collector to RuleThem All. http://www.infoq.com/articles/G1-One-Garbage-Collector-To-Rule-Them-All,2013.
[5] M. Beckwith. Garbage First Garbage CollectorTuning. http://www.oracle.com/technetwork/articles/java/g1gc-1984535.html, 2013.
[6] S. M. Blackburn, P. Cheng, and K. S. McKinley.Myths and Realities: the Performance Impact ofGarbage Collection. In Proc. of the Joint Intl. Conf.on Measurement and Modeling of Computer Systems,pages 25–36, 2004.
[7] S. M. Blackburn, R. Garner, C. Hoffmann, A. M.Khang, K. S. McKinley, R. Bentzur, A. Diwan,D. Feinberg, D. Frampton, S. Z. Guyer, M. Hirzel,A. Hosking, M. Jump, H. Lee, J. E. B. Moss,A. Phansalkar, D. Stefanovic, T. VanDrunen, D. vonDincklage, and B. Wiedermann. The DaCapoBenchmarks: Java Benchmarking Development andAnalysis. In Proc. of the Annual ACM SIGPLANConf. on Object-oriented Programming Systems,Languages, and Applications, pages 169–190, 2006.
[8] T. Brecht, E. Arjomandi, C. Li, and H. Pham.Controlling Garbage Collection and Heap Growth toReduce the Execution Time of Java Applications.Trans. Program. Lang. Syst., 28(5):908–941, 2006.
[9] D. Detlefs. Concurrent Remembered Set Refinementin Generational Garbage Collection. In USENIX JavaVM Research and Technology Symp., 2002.
[10] D. Detlefs, C. Flood, S. Heller, and T. Printezis.Garbage-First Garbage Collection. In Proc. of the Intl.Symp. on Memory Management, pages 37–48, 2004.
[11] G. Gousios, V. Karakoidas, and D. Spinellis. TuningJava’s Memory Manager for High Performance ServerApplications. In Proc. of the 5th Intl. SystemAdministration and Network Conf., pages 69–83, 2006.
[12] X. Guan, W. Srisa-an, and C. Jia. Investigating theEffects of Using Different Nursery Sizing Policies onPerformance. In Proc. of the Intl. Symp. on MemoryManagement, pages 59–68, New York, NY, USA, 2009.
[13] M. Hirt and M. Lagergren. Oracle JRockit: TheDefinitive Guide. 2010.
[14] F. Hutter, H. H. Hoos, K. Leyton-Brown, andT. Stutzle. ParamILS: An Automatic AlgorithmConfiguration Framework. Journal of ArtificialIntelligence Research, 36:267–306, 2009.
[15] S. Lee. How to Tune Java Garbage Collection.http://www.cubrid.org/blog/textyle/428187, 2012.
[16] H. Lieberman and C. Hewitt. A Real-time GarbageCollector Based on the Lifetimes of Objects. Commun.ACM, 26(6):419–429, 1983.
[17] Oracle. Garbage Collector Ergonomic.http://docs.oracle.com/javase/7/docs/
technotes/guides/vm/gc-ergonomics.html, 2013.
[18] Oracle. Java HotSpot VM Options.http://www.oracle.com/technetwork/java/javase/
tech/vmoptions-jsp-140102.html, 2013.
[19] Oracle. Java SE 6 HotSpot[tm] Virtual MachineGarbage Collection Tuning.http://www.oracle.com/technetwork/java/javase/
gc-tuning-6-140523.html, 2013.
[20] Oracle. OpenJDK 8 Early Access Release b100.http://jdk8.java.net/archive/8-b100.html, 2013.
[21] J. Singer, G. Brown, I. Watson, and J. Cavazos.Intelligent Selection of Application-specific GarbageCollectors. In Proc. of the Intl. Symp. on MemoryManagement, pages 91–102, 2007.
[22] J. Singer, R. E. Jones, G. Brown, and M. Lujan. TheEconomics of Garbage Collection. In Proc. of the Intl.Symp. on Memory Management, pages 103–112, 2010.
[23] J. Singer, G. Kovoor, G. Brown, and M. Lujan.Garbage collection auto-tuning for java mapreduce onmulti-cores. In Proc. of the Intl. Symp. on MemoryManagement, pages 109–118, 2011.
[24] D. Ungar. Generation Scavenging: A Non-disruptiveHigh Performance Storage Reclamation Algorithm. InProc. of the ACM SIGSOFT/SIGPLAN SoftwareEngineering Symp. on Practical Software DevelopmentEnvironments, pages 157–167, 1984.
[25] J. Velasco, A. Ortiz, K. Olcoz, and F. Tirado.Dynamic Management of Nursery Space Organizationin Generational Collection. In INTERACT-8,workshop, pages 33–40, 2004.
[26] D. Vengerov. Modeling, Analysis and ThroughputOptimization of a Generational Garbage Collector. InProc. of the Intl. Symp. on Memory Management,pages 1–9, 2009.
[27] T. Yang, M. Hertz, E. D. Berger, S. F. Kaplan, andJ. E. B. Moss. Automatic Heap Sizing: Taking RealMemory into Account. In Proc. of the Intl. Symp. onMemory Management, pages 61–72, 2004.
122
Recommended