THE TECHNICAL SPECIFICATIONS OF THE US FOREST CARBON INVENTORY: RECENT PAST AND NEAR FUTURE
Christopher W. Woodall, Research Forester, U.S. Forest Service, St. Paul, MN
Co-Authors
Grant Domke James Smith John Coulston Sean Healey Andy Gray

Outline
Why Inventory? Coordination within FIA 2011 Accomplishments
CRM vs Jenkins Standing Dead
2012 and Beyond

Why Inventory?
Accounts for majority of carbon sequestration in U.S.
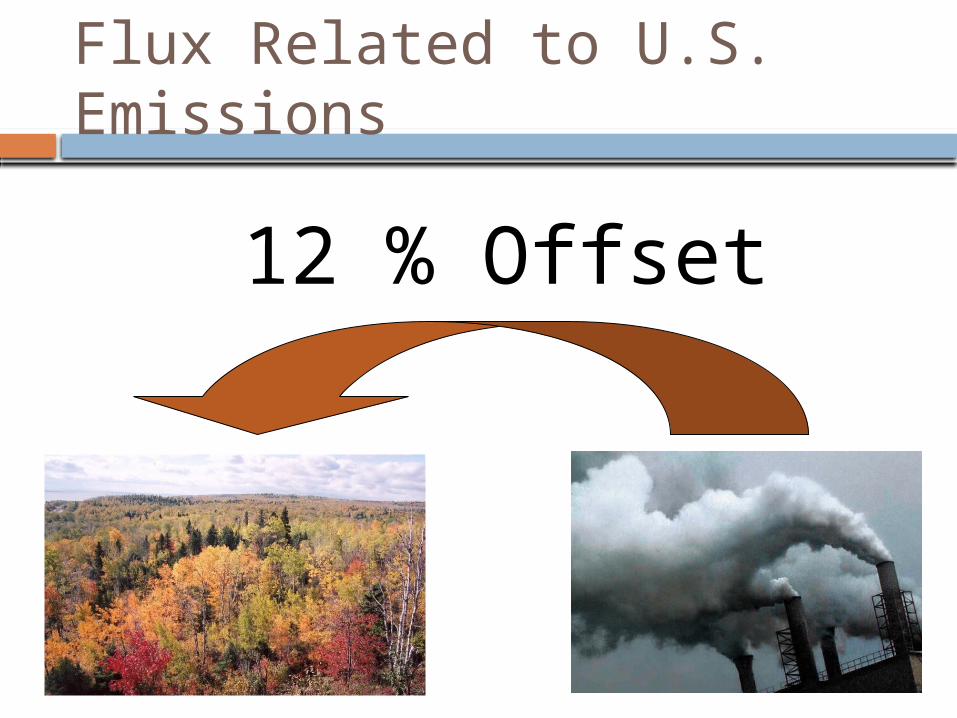
Flux Related to U.S. Emissions
12 % Offset
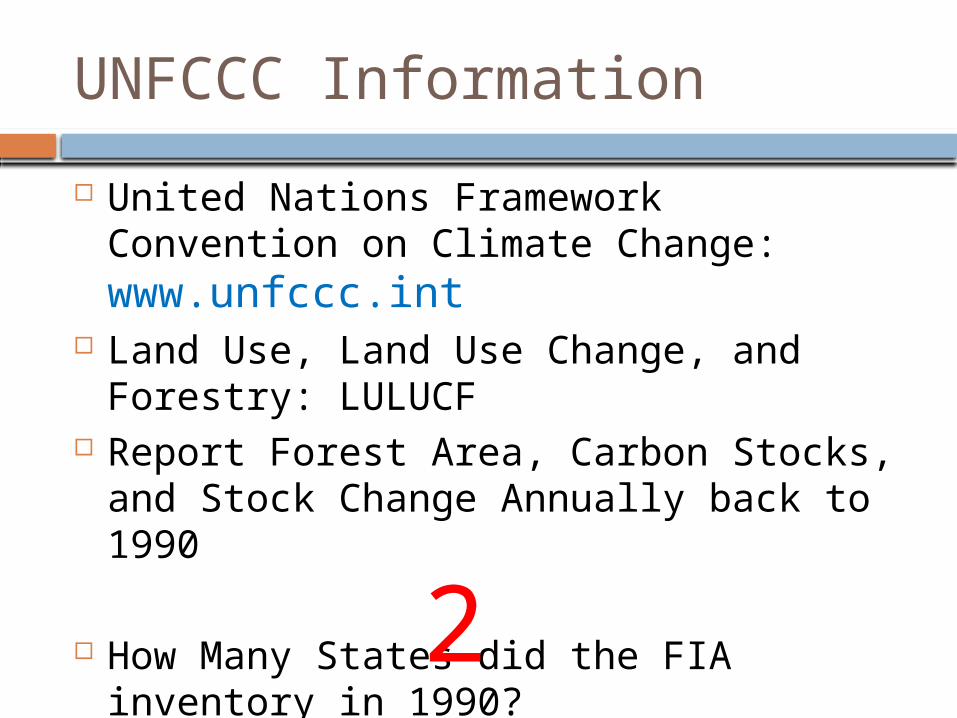
UNFCCC Information
United Nations Framework Convention on Climate Change: www.unfccc.int
Land Use, Land Use Change, and Forestry: LULUCF
Report Forest Area, Carbon Stocks, and Stock Change Annually back to 1990
How Many States did the FIA inventory in 1990? 2
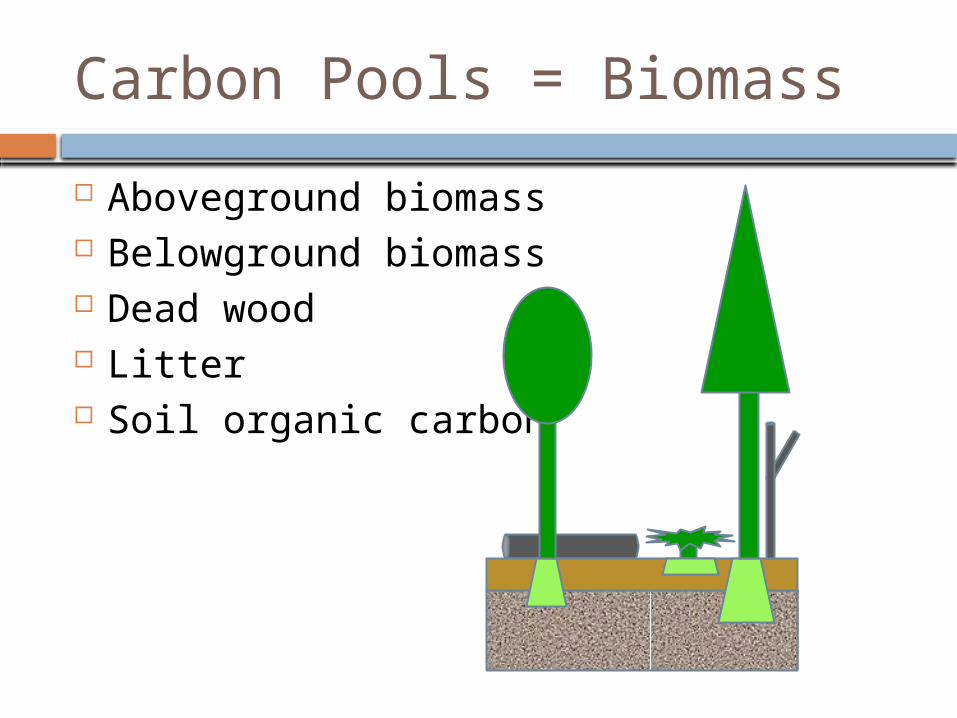
Carbon Pools = Biomass
Aboveground biomass Belowground biomass Dead wood Litter Soil organic carbon
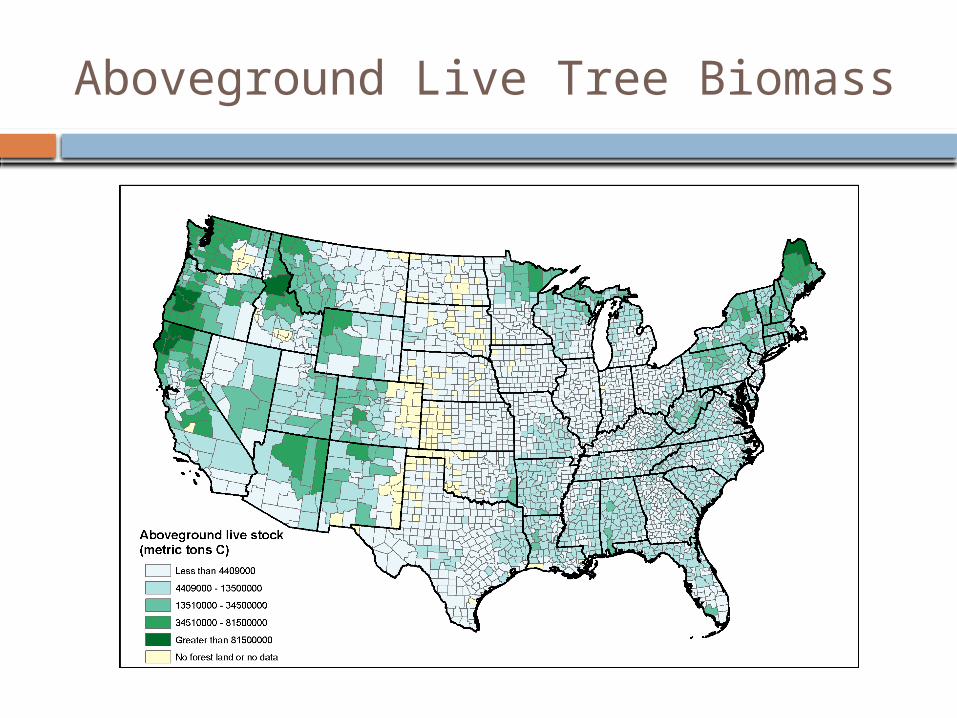
Aboveground Live Tree Biomass
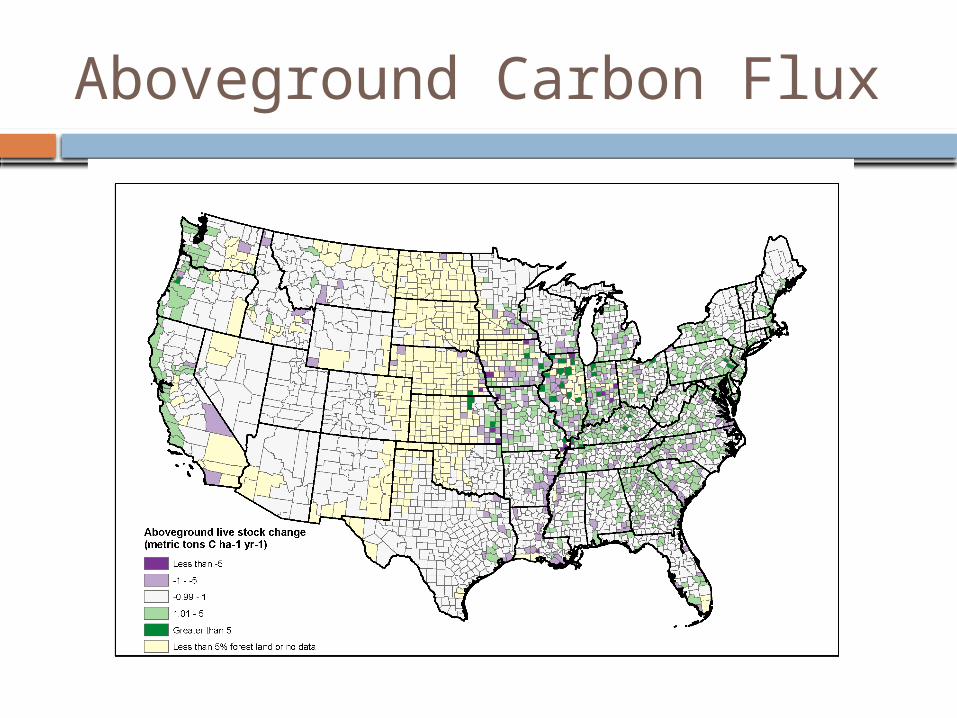
Aboveground Carbon Flux
Organization within FIA
National Carbon Accounting Steering Committee Representatives from each FIA unit Serve as liaisons to their regional units
Northern Research Station Carbon Group
Prepare UNFCCC inventory Facilitate techniques integration into FIA
tools/documentation Leads on accounting research

Brief History of C Accounting Prior to Annual FIA
Almost pure modeling effort No P3 data Missing reserved land information
Now in a period of transition from pure models of past and annual inventory Incorporation of P3 data Refined tree component estimation
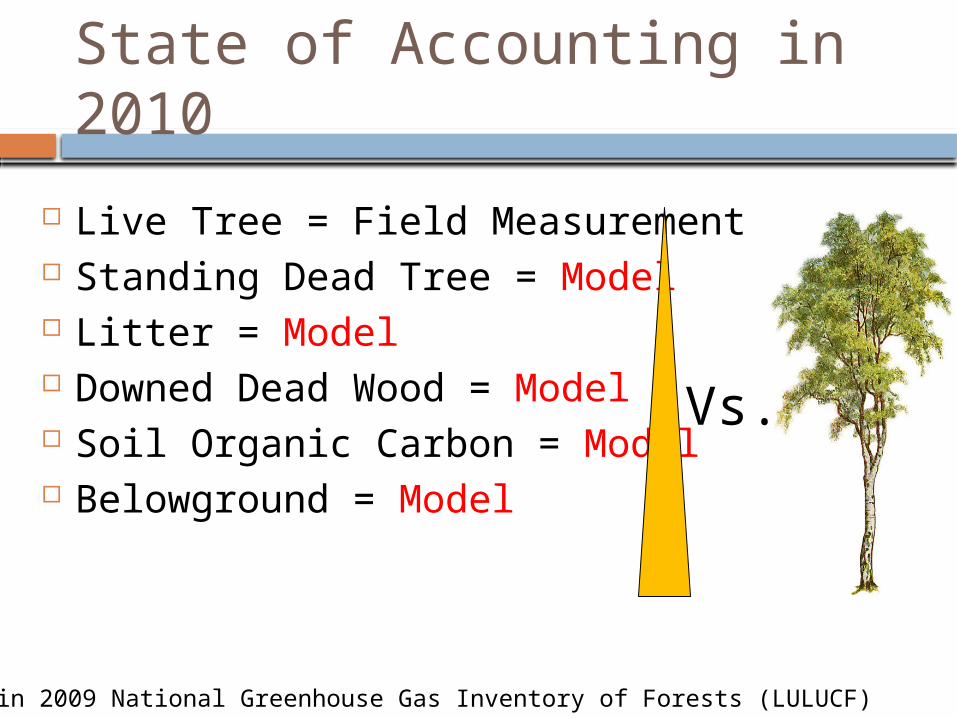
State of Accounting in 2010
Live Tree = Field Measurement Standing Dead Tree = Model Litter = Model Downed Dead Wood = Model Soil Organic Carbon = Model Belowground = Model
Vs.
* Used in 2009 National Greenhouse Gas Inventory of Forests (LULUCF)

Problem with Models
Do trees really grow/die in such a stable manner?
How about invasive earthworms and warming temperature impact on litter depth?
How about western tree mortality and fires?
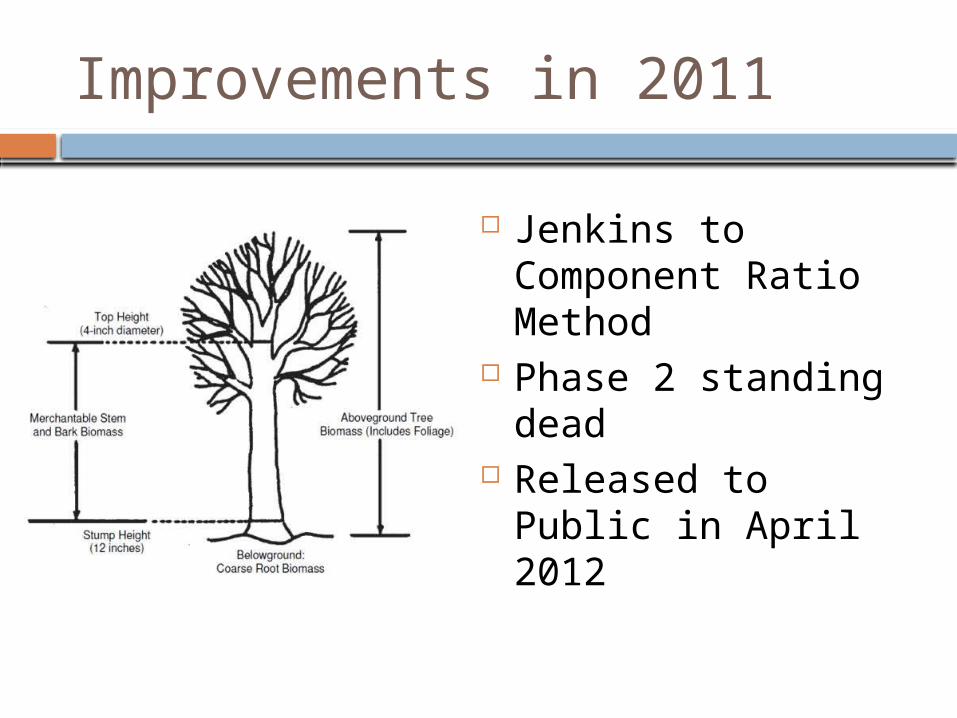
Improvements in 2011
Jenkins to Component Ratio Method
Phase 2 standing dead
Released to Public in April 2012

CRM and Jenkins: 2 Accounting Books
Resource Protection
ActReport to Congress
Volume and Biomass
EPA
National Greenhouse
Gas Inventory
Forest Carbon
x 0.5 ≠
“Gaming the System?”
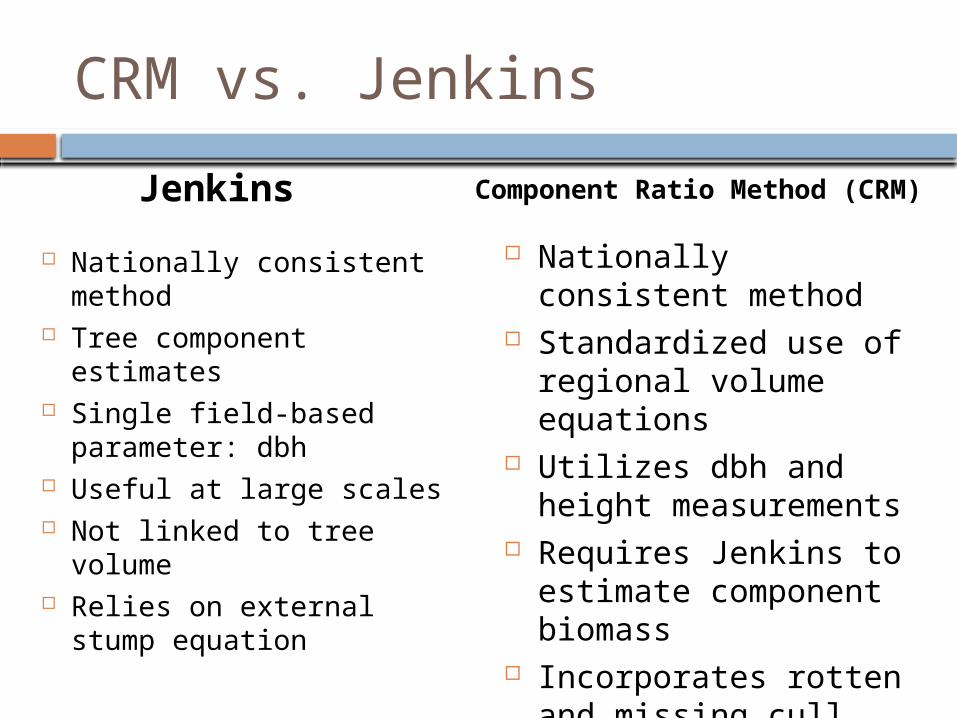
CRM vs. Jenkins
Jenkins
Nationally consistent method
Tree component estimates
Single field-based parameter: dbh
Useful at large scales Not linked to tree
volume Relies on external stump
equation
Component Ratio Method (CRM)
Nationally consistent method
Standardized use of regional volume equations
Utilizes dbh and height measurements
Requires Jenkins to estimate component biomass
Incorporates rotten and missing cull deductions
Relies on external stump equation

CRM vs. Jenkins
MethodJenkins:CRM:
79.5 kg C70.0 kg C
25.0 kg C21.7 kg C
4.9 kg C4.3 kg C
109.4 kg C96.0 kg C
Bole Top and limbs
Stump Total AG carbon

CRM vs. Jenkins
9 inch tree biomass by tree height across United States
Douglas-fir Quaking Aspen

CRM vs. Jenkins
* For 20 most abundant hwd/sftwd species by region

CRM vs. Jenkins
Woodall, C.W., Heath, L.S., Domke, G.M., Nichols, M.C. 2011. Methods and equations for estimating aboveground volume, biomass, and carbon for trees in the U.S. forest inventory, 2010. Gen. Tech. Rep. NRS-88. Newtown Square, PA: U.S. Department of Agriculture, Forest Service, Northern Research Station. 30 p.
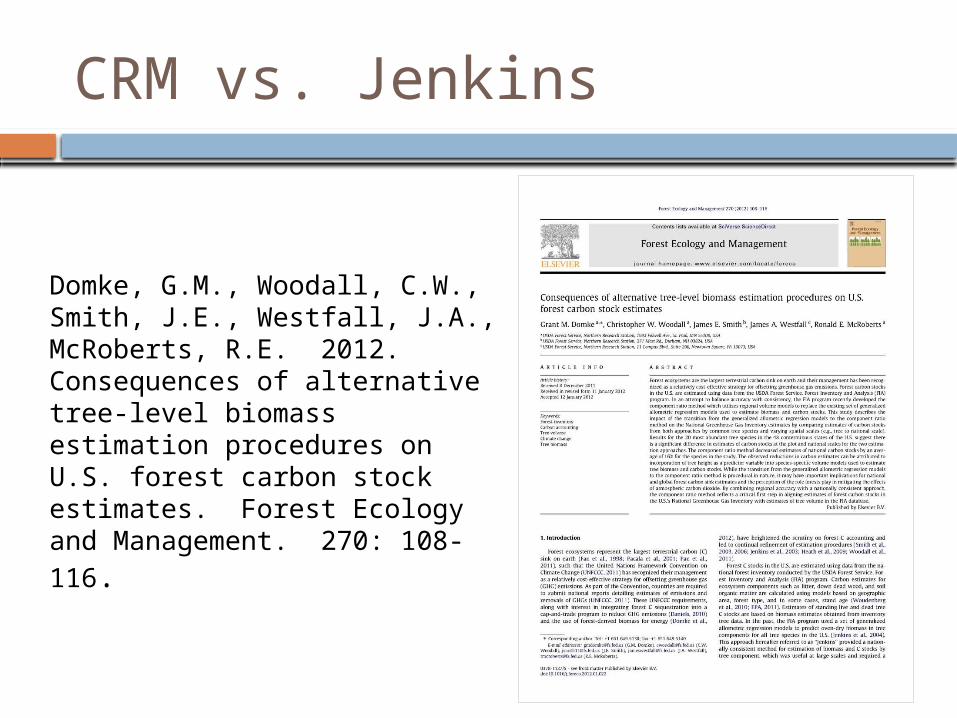
CRM vs. Jenkins
Domke, G.M., Woodall, C.W., Smith, J.E., Westfall, J.A., McRoberts, R.E. 2012. Consequences of alternative tree-level biomass estimation procedures on U.S. forest carbon stock estimates. Forest Ecology and Management. 270: 108-116.
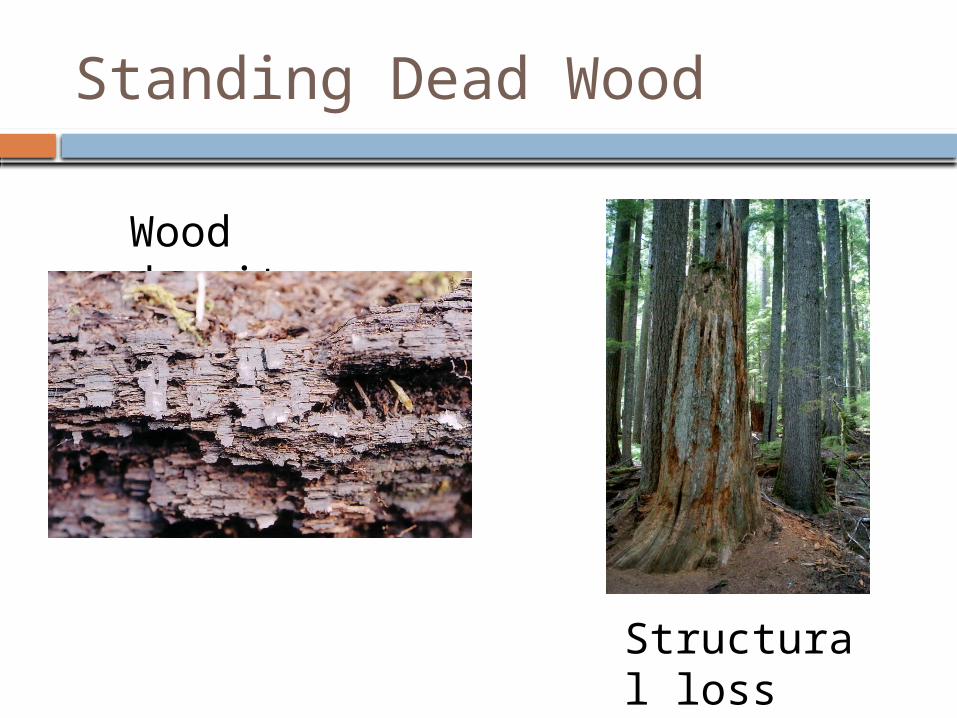
Standing Dead Wood
Wood density
Structural loss
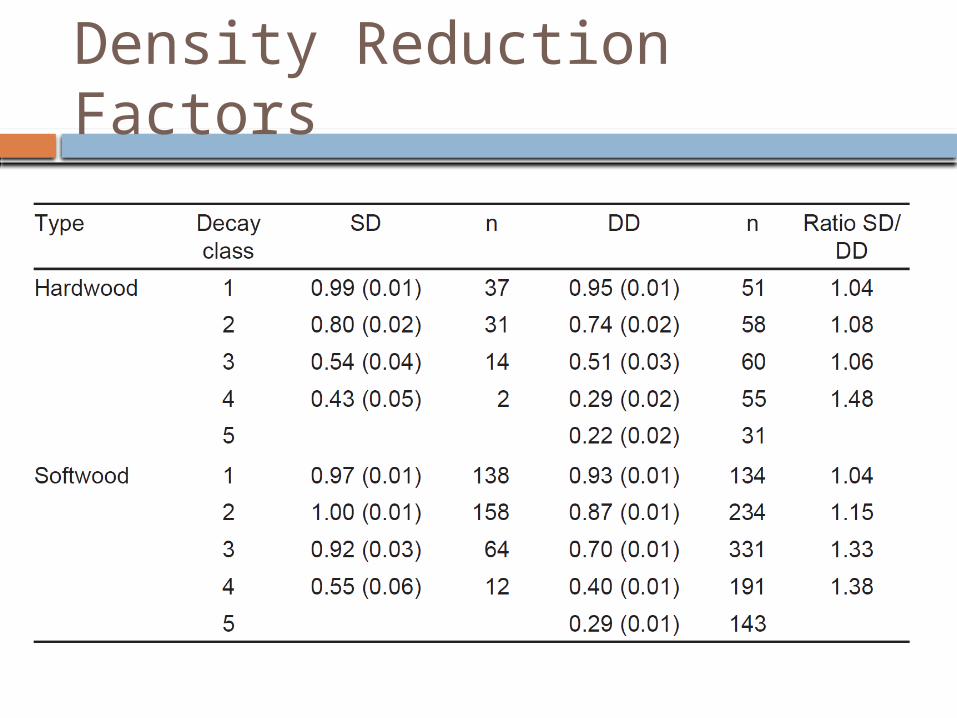
Density Reduction Factors
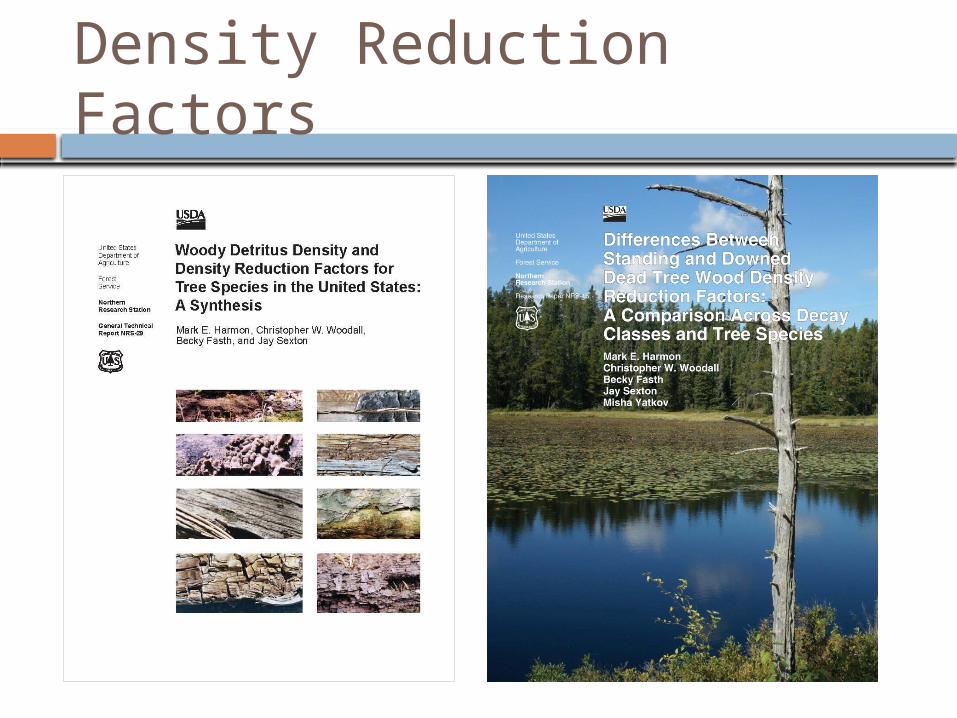
Density Reduction Factors
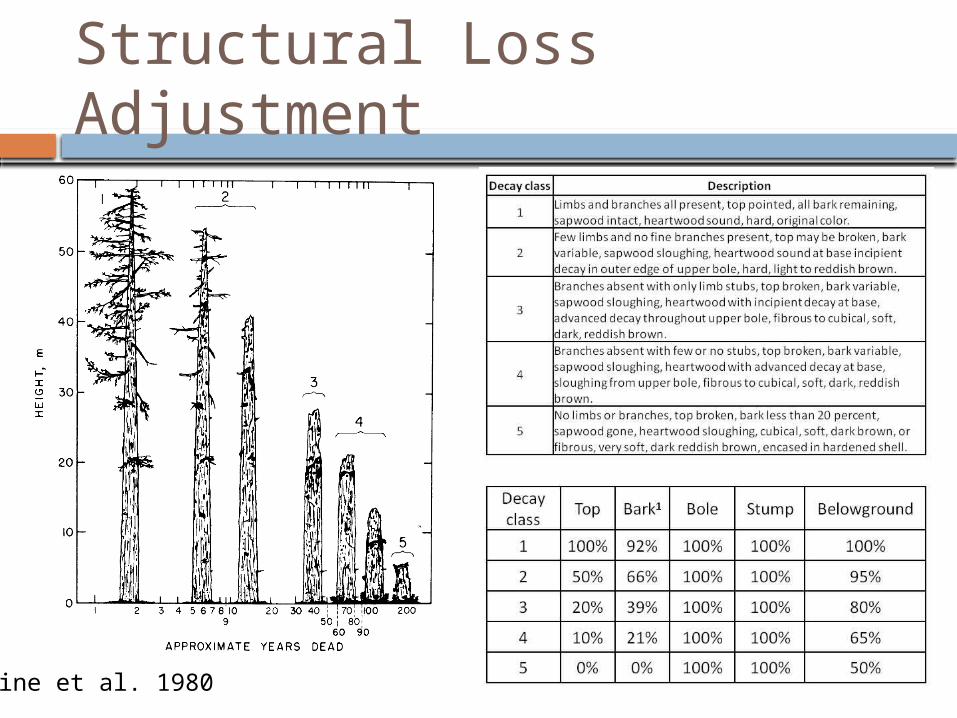
Structural Loss Adjustment
Cline et al. 1980
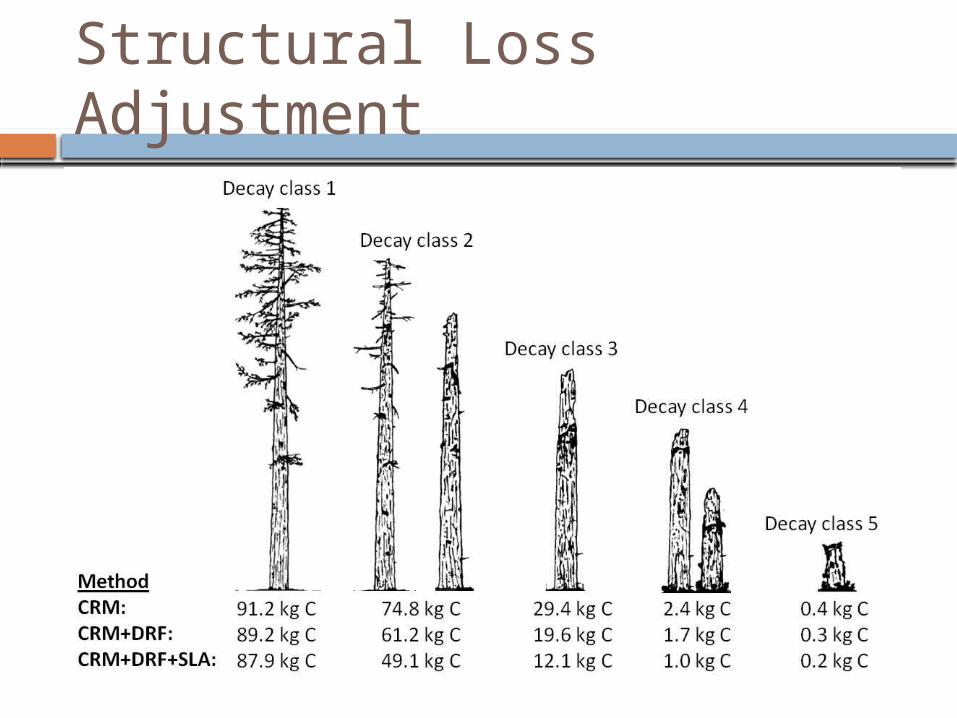
Structural Loss Adjustment

Structural Loss Adjustment
*Paper birch in New Hampshire
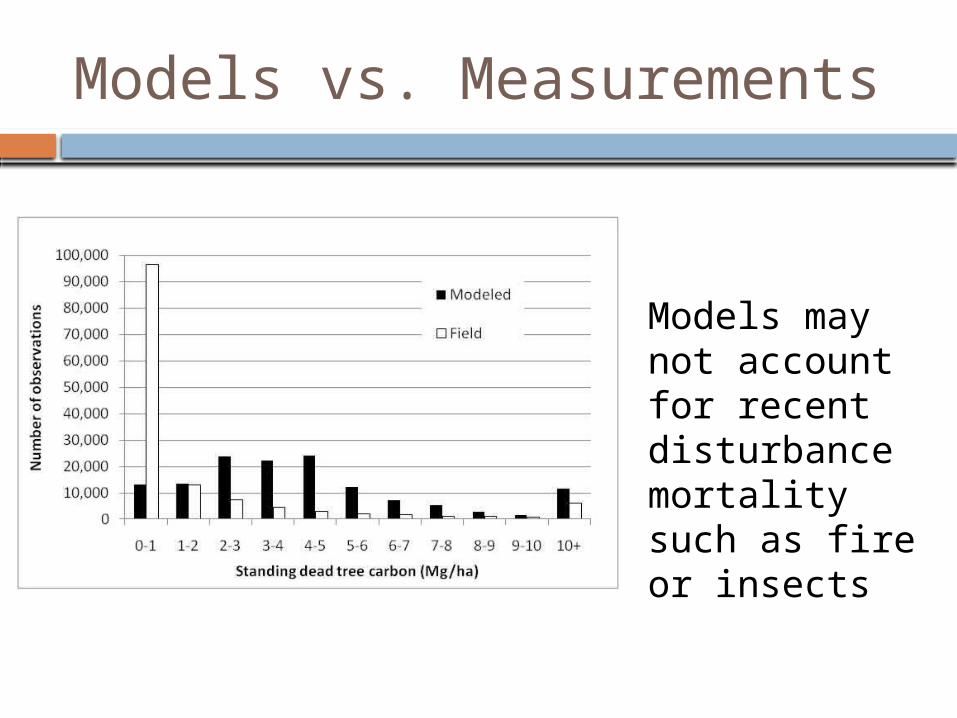
Models vs. Measurements
Models may not account for recent disturbance mortality such as fire or insects

Standing Dead Research
Woodall, C.W., Domke, G.M., MacFarlane, D.W., Oswalt, C.M. 2012. Comparing field- and model-based standing dead tree carbon stock estimates across forests of the United States. Forestry. 85: 125-133.
Domke, G.M., Woodall, C.W., Smith, J.E. 2011. Accounting for density reduction and structural loss in standing dead trees: Implications for forest biomass and carbon stock estimates in the United States. Carbon Balance and Management 6: 14.

Implications of Changes to 2012 US LULUCF
Not all changes are due to the revised estimation procedures for live and standing dead trees (e.g., new inventories).
Reduction in US C stocks by 6.7% (3,232 Tg C) Increase in US C annual sequestration (2009 inventory
year) by 3.5% (8.3 Tg C/yr) CRM adoption was partially responsible for reducing AG
live tree stocks (2010) by 15.2% (2,606 Tg C). However, annual stock change (2009) increased by 0.9% (1.2 Tg C/yr)
Using FIA Phase 2 standing dead trees reduced standing dead tree US stocks (2010) by 14.8% (458 Tg C). However, annual stock change (2009) increased by 122.2% (11.0 Tg C/yr).

Baseline Trend Recalculations
Mid-Term Changes
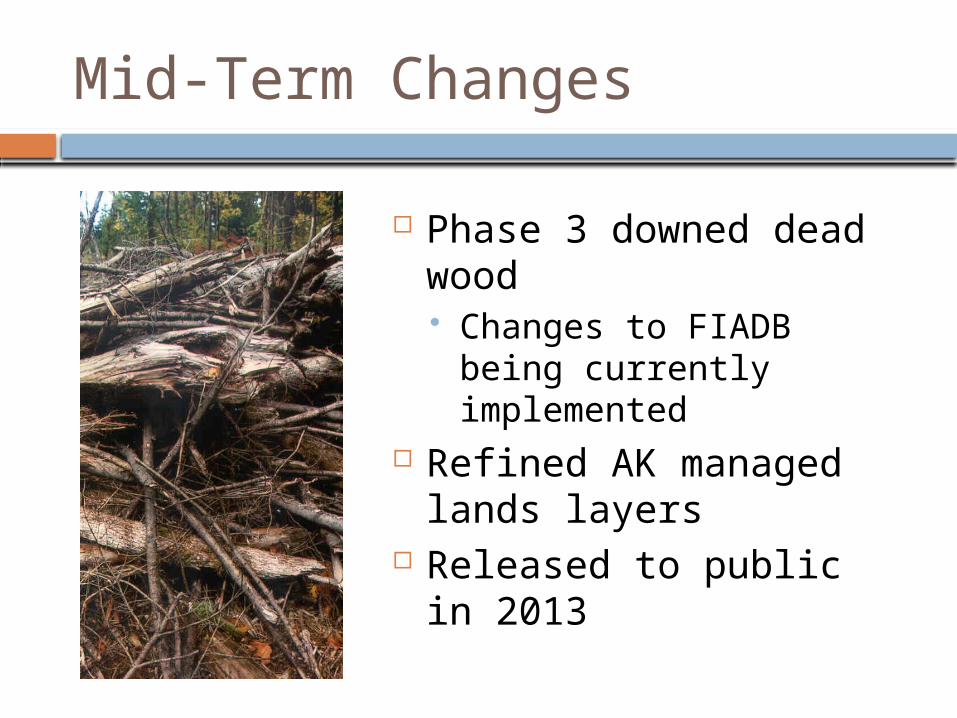
Phase 3 downed dead wood Changes to FIADB being
currently implemented Refined AK managed
lands layers Released to public in
2013

Longer Term Changes
Improved individual tree volume/biomass models
Meshing remotely sensed imagery/models with soil measurements
Belowground and foliage model improvements
Phase 3 forest floor Biomass GRM
Summary
Improving estimation of each pool…step by step
CRM adoption and standing dead refinements first
Dead wood next Continued P3 sampling and success of
volume/biomass study essential

Thank You!!!
Recommended