The thermal macrophysiology of core and marginal
populations of the aphid Myzus persicae in Europe
by
Lucy Alford
A thesis submitted to The University of Birmingham For the degree of DOCTOR OF PHILOSOPHY
School of Biosciences
The University of Birmingham July 2010
University of Birmingham Research Archive
e-theses repository This unpublished thesis/dissertation is copyright of the author and/or third parties. The intellectual property rights of the author or third parties in respect of this work are as defined by The Copyright Designs and Patents Act 1988 or as modified by any successor legislation. Any use made of information contained in this thesis/dissertation must be in accordance with that legislation and must be properly acknowledged. Further distribution or reproduction in any format is prohibited without the permission of the copyright holder.
Abstract
Insects are ectotherms and have limited ability to regulate body temperature above or below
ambient and are consequently greatly affected by temperature. The aphid Myzus persicae has
an extensive distribution throughout Europe from Scandinavia to Southern Spain,
representing three distinct climatic regions: sub-Arctic, temperate and Mediterranean. The
aphid also has genetically distinct clones within its holocyclic (sexual) and anholocyclic
(asexual) life cycles. This raises the possibility that aphids are regionally-adapted to distinct
climatic zones along the latitudinal cline of its European distribution. Genetically distinct
clones of M. persicae were collected from Sweden, UK and Spain. Indices of temperature
tolerance (upper and lower lethal temperature50, coma temperatures and mobility thresholds)
were determined for each aphid clone at different rearing temperatures.
Acclimation at 10°C for one generation increased cold tolerance by depressing lower lethal,
chill movement and chill coma temperatures when compared to 20°C and 25°C and further
enabled mobility to be maintained to lower temperatures. Acclimation at 25°C for one
generation increased heat tolerance by raising upper lethal, heat movement and heat coma
temperatures when compared to 10°C and 20°C. Acclimation at 10°C also acted to raise
upper lethal temperatures, indicating that the physiological processes conferring heat
tolerance are induced at both high and low temperatures. Data did not support
intergenerational acclimation to higher or lower temperatures. Lower thermal limits were
more plastic than upper limits, enabling tolerance ranges to be increased following
acclimation at 10°C, but reduced on acclimation at 25°C. Rates of change varied between
clones, suggesting that certain clones could be more affected by climate change.
A relationship between thermal tolerance range and latitude was not supported by data on
thermal traits investigated with the exception of heat coma temperature. This suggests that
clonal mixing across Europe is extensive and prevents local adaptation, although long term
populations could persist in the Mediterranean allowing increased heat tolerance. Clonal
type, as identified by microsatellite analysis, did show a relationship with thermal tolerance,
suggesting that clonal types could respond independently to climate change, affecting
relative proportions of clones within populations.
Acknowledgments
Firstly I would like to thank NERC for providing the funding for the project and Professors
Jeff Bale and Tim Blackburn for writing the project proposal.
Secondly, a massive thank you to Birmingham University’s Arthropod Ecophysiology
Group. You have all contributed to making my PhD a wonderful three years. I could not
have asked for a better supervisor than Jeff, offering support, Jaffa Cakes and fantastical
stories (involving motorised lawnmowers, deer stalking and members of The Who) when
needed. Also to Gwen Hughes, who is, without doubt, the most selfless and genuine person I
have ever met and a definite friend for life. Thank you to Steve Hazell, the post doc of the
lab, for his advice and assistance throughout and for his patience in putting up with the
continual gossiping from myself and Gwen. I will also never forget the wonderful people of
N110 who have made the office one of the most vibrant and enviable offices in the entire
department: Bolette, Dino, Claire, Adam, Stuart, Bobbie, Ji, Megan & Paul.
I would further like to thank:
Jenny Dryden for help with making equipment. Your sunny disposition always made it a
pleasure to bump into you. I shall miss our ‘natters’ in the corridor.
Brian Fenton and the Scottish Crop Research Institute for providing Myzus persicae clones
and for performing microsatellite analysis on clones used in this study.
Richard Harrington and Rothamsted Research for providing M. persicae clones and for
insecticide resistance testing clones used in this study.
Richard Hopkins for helping me find M. persicae in Sweden and for introducing me to Pytt i
Panna! I really appreciate it.
And finally to my family for all the emotional and financial support and encouragement
throughout. And let’s not forget the Blackman box washing and making!
Table of contents
1 INTRODUCTION ........................................................................................................... 1
1.1 INSECT SURVIVAL STRATEGIES AT LOW TEMPERATURES ................................................ 2
1.1.1 Classification of cold hardiness strategies ............................................................ 2
1.1.2 Survival mechanisms at low temperatures ............................................................ 6
1.1.2.1 Chemical mechanisms....................................................................................... 6
1.1.2.2 Behavioural mechanisms................................................................................. 10
1.2 INSECT SURVIVAL STRATEGIES AT HIGH TEMPERATURES ............................................. 11
1.3 INDICES OF INSECT THERMAL TOLERANCE................................................................... 13
1.3.1 Supercooling point ............................................................................................. 13
1.3.2 Lethal temperatures and times............................................................................ 13
1.3.3 Critical temperatures .......................................................................................... 14
1.3.4. Discriminating temperatures and rapid cold hardening ...................................... 15
1.4 APHIDS AND THE STUDY SPECIES MYZUS PERSICAE ...................................................... 15
1.4.1 Aphid lifecycles ................................................................................................. 15
1.4.2 The study species Myzus persicae ...................................................................... 16
1.5 GEOGRAPHIC VARIATION IN THERMAL TOLERANCE ..................................................... 19
1.6 APPLICATIONS OF INSECT THERMAL BIOLOGY ............................................................. 21
1.6.1 Forecasting pest outbreaks ................................................................................. 21
1.6.2 Species distribution............................................................................................ 25
1.6.3 Alien species...................................................................................................... 26
1.7 STUDY HYPOTHESES AND EXPERIMENTAL CONSIDERATIONS ........................................ 27
1.7.1 Aphid lifecycle................................................................................................... 29
1.7.2 Aphid clonal type............................................................................................... 29
1.7.3 Insecticide resistance.......................................................................................... 30
1.7.4 Colour morphology............................................................................................ 30
1.7.5 Bacterial symbionts............................................................................................ 31
1.8 AIMS, OBJECTIVES AND HYPOTHESES TESTED.............................................................. 31
2 GENERAL MATERIALS AND METHODS............................................................... 33
2.1 APHID CULTURE AND MAINTENANCE .......................................................................... 33
2.2 GENERAL EXPERIMENTAL PROCEDURES ...................................................................... 34
2.2.1 Acclimation to different temperatures ................................................................ 34
2.2.2 Exposure to temperature extremes...................................................................... 35
2.2.3 Recording activity thresholds ............................................................................. 35
3 PRELIMINARY EXPERIMENTS: CHARACTERISATION OF CLONES AND
BIRTH SEQUNECE EFFECTS ON THERMAL TOLERANCE ................................. 37
3.1 DETERMINATION OF APHID CHARACTERISTICS ............................................................ 37
3.1.1 Genetic variability.............................................................................................. 37
3.1.2 Lifecycle type .................................................................................................... 37
3.1.3 Resistance type .................................................................................................. 40
3.2 VARIATION IN THERMAL TOLERANCE ACROSS THE BIRTH SEQUENCE............................ 42
4 EFFECT OF LATITUDE AND ACCLIMATION ON THE LETHAL
TEMPERATURES OF THE PEACH-POTATO APHID MYZUS PERSICAE ............ 47
4.1 SUMMARY ................................................................................................................. 47
4.2 INTRODUCTION .......................................................................................................... 48
4.3 MATERIALS AND METHODS ........................................................................................ 49
4.3.1 Determining the lethal temperature (LLT50 and ULT50)...................................... 50
4.4 RESULTS.................................................................................................................... 53
4.4.1 Clonal differences .............................................................................................. 53
4.4.2 Acclimation ....................................................................................................... 58
4.4.3 Differentials between LLT50 and ULT50 ............................................................. 60
4.5 DISCUSSION............................................................................................................... 61
4.5.1 Plasticity of lethal temperatures.......................................................................... 62
4.5.2 Geographic variation in thermal tolerances......................................................... 64
4.5.3 Relationship between LLT50 and ULT50 ............................................................. 66
5 COMPARISON OF THE THERMAL ACTIVITY THRESHOLDS OF CLONES OF
THE PEACH-POTATO APHID MYZUS PERSICAE COLLECTED ALONG A
LATITUDINAL GRADIENT IN EUROPE.................................................................... 68
5.1 SUMMARY ................................................................................................................. 68
5.2 INTRODUCTION .......................................................................................................... 69
5.3 MATERIALS AND METHODS ........................................................................................ 72
5.3.1 Determination of chill movement threshold (CTmin) and chill coma temperature 72
5.3.2 Determination of heat movement threshold (CTmax) and heat coma temperature. 73
5.3.3 Detection of chill coma recovery........................................................................ 73
5.3.4 Statistical analysis.............................................................................................. 75
5.4 RESULTS.................................................................................................................... 75
5.4.1 Chill movement threshold (CTmin) and chill coma temperature........................... 75
5.4.1.1 Clonal differences in low temperature activity thresholds................................ 75
5.4.1.2 Effect of acclimation on low temperature activity thresholds........................... 80
5.4.2 Heat movement threshold (CTmax) and heat coma temperature ........................... 82
5.4.2.1 Clonal differences in high temperature activity thresholds............................... 82
5.4.2.2 Effect of acclimation on high temperature activity thresholds.......................... 88
5.4.3 Differentials between thermal activity thresholds ............................................... 89
5.4.4 Chill Coma Recovery......................................................................................... 92
5.5 DISCUSSION............................................................................................................... 99
5.5.1 Plasticity of activity thresholds........................................................................... 99
5.5.2 Geographic variation in activity thresholds....................................................... 101
5.5.3 Relationships between activity thresholds ........................................................ 105
6 COMPARISON OF THE RELATIVE WALKING SPEEDS OF CLONES OF THE
PEACH- POTATO APHID MYZUS PERSICAE.......................................................... 108
6.1 SUMMARY ............................................................................................................... 108
6.2 INTRODUCTION ........................................................................................................ 109
6.3 MATERIALS AND METHODS ...................................................................................... 110
6.3.1 Walking speed ................................................................................................. 110
6.3.1 Statistical analysis............................................................................................ 111
6.4 RESULTS.................................................................................................................. 111
6.5 DISCUSSION............................................................................................................. 119
7 GENERAL DISCUSSION .......................................................................................... 123
7.1 PLASTICITY OF THERMAL TOLERANCE TRAITS ........................................................... 123
7.2 RELATIONSHIP BETWEEN INDICES ............................................................................. 125
7.3 LATITUDINAL VARIATION IN THERMAL TOLERANCE .................................................. 126
7.4 FUTURE WORK ......................................................................................................... 129
8 REFERENCES............................................................................................................ 131
List of figures
FIGURE 1. THE BIOCHEMICAL MECHANISMS ADOPTED BY FREEZE TOLERANT AND FREEZE
AVOIDING INSECTS (BALE 1996, 2002). .......................................................................... 4
FIGURE 2. THE ACTIVITY OF ICE NUCLEATING AGENTS ALLOWING FOR PROTECTIVE
EXTRACELLULAR ICE FORMATION AT SUB-ZERO TEMPERATURES (BALE 1996). 1.
HAEMOLYMPH AND CELL FLUIDS ARE IN OSMOTIC EQUILIBRIUM. 2. INAS INITIATE
FREEZING IN THE HAEMOLYMPH AT SUB-ZERO TEMPERATURES. 3. GROWTH IN
EXTRACELLULAR ICE RESULTS IN WATER BEING DRAWN FROM THE CELL INTO THE
HAEMOLYMPH VIA AN OSMOTIC GRADIENT. 4. PROTECTIVE EXTRACELLULAR FREEZING
WITHIN THE HAEMOLYMPH. CELLULAR FLUIDS BECOME CONCENTRATED PREVENTING
DANGEROUS INTRACELLULAR FREEZING AND THUS PROTECTING THE CELL. ..................... 7
FIGURE 3. THE LIFECYCLE OF THE PEACH-POTATO APHID MYZUS PERSICAE. .......................... 17
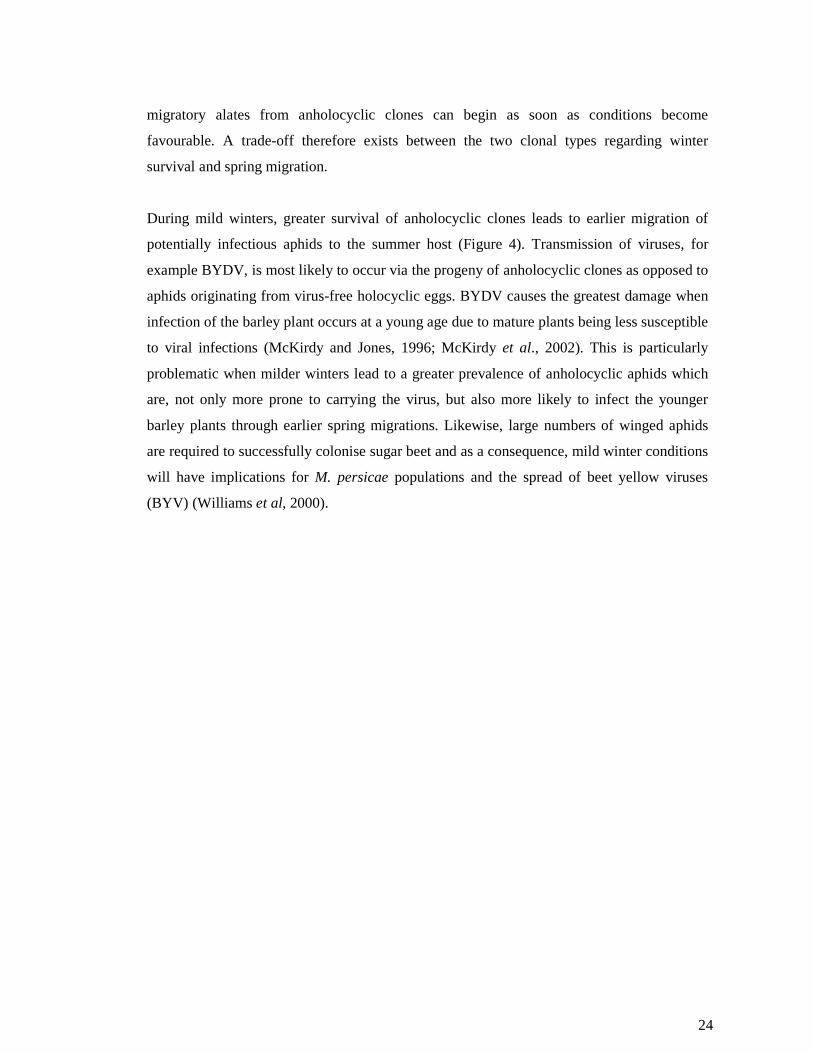
FIGURE 4. THE EFFECTS OF MILD AND SEVERE WINTERS ON SPRING AND SUMMER POPULATIONS
AND RELATED DAMAGE POTENTIAL OF APHIDS OVERWINTERING AS ANHOLOCYCLIC
CLONES (BALE & HAYWARD, 2010). ............................................................................ 25
FIGURE 5. ALUMINIUM BLOCK DESIGN USED TO MEASURE APHID ACTIVITY THRESHOLDS. A.
CHANNEL FOR THE THERMOCOUPLE TO MEASURE ARENA TEMPERATURE; B. APHID ARENA;
C. CHANNEL FOR PUMPING ALCOHOL FLUID TO ENABLE FINE TEMPERATURE CONTROL
OVER THE ARENA (HAZELL ET AL., 2008). ..................................................................... 36
FIGURE 6. THE SUCCESSION OF APHID MORPH PRODUCTION ACROSS GENERATIONS G0 TO G3
FOR MYZUS PERSICAE WHEN HELD UNDER CONDITIONS OF REDUCED DAYLIGHT (LD
12:12H) AND LOWER TEMPERATURE (14.5°C) TO DETERMINE LIFECYCLE TYPE. LIFE
CYCLE TYPE COULD BE CLASSIFIED AS ONE OF FOUR TYPES: HOLOCYCLIC (SEXUAL),
ANHOLOCYCLIC (ASEXUAL) OR AS A TRANSITIONAL LIFE CYCLE TYPE OF ANDROCYCLIC OR
INTERMEDIATE. ALATES OF G2 IN THE HOLOCYCLIC LIFECYCLE WILL BE EXCLUSIVELY
GYNOPARAE. ALATES OF G2 IN THE INTERMEDIATE LIFECYCLE MAY INCLUDE
GYNOPARAE. ............................................................................................................... 39
FIGURE 7. MEAN PROPORTION OF SURVIVAL FOR INDIVIDUAL MYZUS PERSICAE CLONES I. SPAN
1, II. UK 1 AND III. SWED 1 WHEN NYMPHS WERE COLLECTED ON SUCCESSIVE DAYS OF
THE MOTHERS’ REPRODUCTIVE CYCLE AND EXPOSED TO A HIGH TEMPERATURE (41.75°C)
AND A LOW TEMPERATURE (-12°C). ERROR BARS REPRESENT 1 STANDARD ERROR OF THE
MEAN. ......................................................................................................................... 45
FIGURE 8. EXAMPLE GRAPHS ILLUSTRATING PROBIT TRANSFORMATIONS FROM THE RAW
MORTALITY AGAINST EXPOSURE TEMPERATURE DATA SHOWN IN I. TO THE LINEARISED
DATA SHOWN IN II. ...................................................................................................... 52
FIGURE 9. EFFECTS OF ACCLIMATION ON LOWER LETHAL TEMPERATURE FOLLOWING
ACCLIMATION FROM 20°C TO I. 10°C FOR ONE AND THREE GENERATIONS AND II. 25°C
FOR ONE AND THREE GENERATIONS. DATA POINTS REPRESENT LLT50 (±95% FIDUCIAL CI)
FOR MYZUS PERSICAE CLONES COLLECTED FROM SPAIN, UK AND SWEDEN (CODES FOR
CLONES ARE SHOWN IN THE FIGURE)............................................................................. 55
FIGURE 10. EFFECTS OF ACCLIMATION ON UPPER LETHAL TEMPERATURE FOLLOWING
ACCLIMATION FROM 20°C TO I. 10°C FOR ONE AND THREE GENERATIONS AND II. 25°C
FOR ONE AND THREE GENERATIONS. DATA POINTS REPRESENT ULT50 (±95% FIDUCIAL
CI) FOR MYZUS PERSICAE CLONES COLLECTED FROM SPAIN, UK AND SWEDEN (CODES FOR
CLONES ARE SHOWN IN THE FIGURE)............................................................................. 57
FIGURE 11. ULT50 MINUS LLT50 PLOTTED AGAINST REARING TEMPERATURE FOR MYZUS
PERSICAE CLONES COLLECTED FROM SPAIN, UK AND SWEDEN (CODES FOR CLONES ARE
SHOWN IN THE FIGURE). ............................................................................................... 61
FIGURE 12. EFFECTS OF ACCLIMATION ON CHILL MOVEMENT THRESHOLD FOLLOWING
ACCLIMATION FROM 20°C TO I. 10°C FOR ONE AND THREE GENERATIONS AND II. 25°C
FOR ONE AND THREE GENERATIONS. DATA POINTS REPRESENT MEDIAN CHILL MOVEMENT
(±95% CI) FOR MYZUS PERSICAE CLONES COLLECTED FROM SPAIN, UK AND SWEDEN
(CODES FOR CLONES ARE SHOWN IN FIGURE)................................................................. 76
FIGURE 13. EFFECTS OF ACCLIMATION ON CHILL COMA THRESHOLD FOLLOWING ACCLIMATION
FROM 20°C TO I. 10°C FOR ONE AND THREE GENERATIONS AND II. 25°C FOR ONE AND
THREE GENERATIONS. DATA POINTS REPRESENT MEDIAN CHILL COMA (±95% CI) FOR
MYZUS PERSICAE CLONES COLLECTED FROM SPAIN, UK AND SWEDEN (CODES FOR CLONES
ARE SHOWN IN FIGURE). ............................................................................................... 79
FIGURE 14. EFFECTS OF ACCLIMATION ON HEAT MOVEMENT THRESHOLD FOLLOWING
ACCLIMATION FROM 20°C TO I. 10°C FOR ONE AND THREE GENERATIONS AND II. 25°C
FOR ONE AND THREE GENERATIONS. DATA POINTS REPRESENT MEDIAN HEAT MOVEMENT
(±95% CI) FOR MYZUS PERSICAE CLONES COLLECTED FROM SPAIN, UK AND SWEDEN
(CODES FOR CLONES ARE SHOWN IN FIGURE)................................................................. 83
FIGURE 15. EFFECTS OF ACCLIMATION ON HEAT COMA THRESHOLD FOLLOWING ACCLIMATION
FROM 20°C TO I. 10°C FOR ONE AND THREE GENERATIONS AND II. 25°C FOR ONE AND
THREE GENERATIONS. DATA POINTS REPRESENT MEDIAN HEAT COMA (±95% CI) FOR
MYZUS PERSICAE CLONES COLLECTED FROM SPAIN, UK AND SWEDEN (CODES FOR CLONES
ARE SHOWN IN FIGURE). ............................................................................................... 86
FIGURE 16. I. MEDIAN HEAT COMA MINUS MEDIAN CHILL COMA PLOTTED AGAINST REARING
TEMPERATURE AND II. MEDIAN HEAT MOVEMENT THRESHOLD MINUS MEDIAN CHILL
MOVEMENT THRESHOLD PLOTTED AGAINST REARING TEMPERATURE FOR MYZUS PERSICAE
CLONES COLLECTED FROM SPAIN, UK AND SWEDEN (CODES FOR CLONES ARE SHOWN IN
FIGURE)....................................................................................................................... 91
FIGURE 17. TIME DURATION (MIN) FOLLOWING WHICH APHIDS EXITED CHILL COMA ±95% CI
(AS INDICATED BY THE TOP OF THE WHITE BAR) AND SPONTANEOUSLY MOVE ±95% CI (AS
INDICATED BY THE TOP OF THE GREY BAR) FOLLOWING EXPOSURE TO -4°C FOR 30
MINUTES AND THEN RE-WARMED TO ACCLIMATION TEMPERATURE AT A RATE OF 0.1°C
MIN-1
FOR ALL CLONES ACCLIMATED TO 20°C............................................................... 93
FIGURE 18. TIME DURATION (MIN) FOLLOWING WHICH APHIDS EXIST CHILL COMA ±95% CI (AS
INDICATED BY THE TOP OF THE WHITE BAR) AND SPONTANEOUSLY MOVE ±95% CI (AS
INDICATED BY THE TOP OF THE GREY BAR) FOLLOWING EXPOSURE TO -6°C FOR 30
MINUTES AND THEN RE-WARMED TO ACCLIMATION TEMPERATURE AT A RATE OF 0.1°C
MIN-1
FOR ALL CLONES WHEN ACCLIMATED TO I. 10°C FOR ONE GENERATION AND II. 10°C
FOR THREE GENERATIONS. ........................................................................................... 95
FIGURE 19. TIME DURATION (MIN) FOLLOWING WHICH APHIDS EXIST CHILL COMA ±95% CI (AS
INDICATED BY THE TOP OF THE WHITE BAR) AND SPONTANEOUSLY MOVE ±95% CI (AS
INDICATED BY THE TOP OF THE GREY BAR) FOLLOWING EXPOSURE TO -3°C FOR 30
MINUTES AND THEN RE-WARMED TO ACCLIMATION TEMPERATURE AT A RATE OF 0.1°C
MIN-1
FOR ALL CLONES WHEN ACCLIMATED TO I. 25°C FOR ONE GENERATION AND II. 25°C
FOR THREE GENERATIONS. ........................................................................................... 98
FIGURE 20. WALKING SPEED (MEDIAN ± QUARTILES) OF M. PERSICAE NYMPHS AT A RANGE OF
CONSTANT TEMPERATURES WHEN ACCLIMATED TO 20°C. SPANISH CLONES ARE
REPRESENTED BY CLOSED RED SYMBOLS, BRITISH CLONES BY OPEN GREEN SYMBOLS AND
SWEDISH CLONES BY CLOSED BLUE SYMBOLS. ............................................................ 113
FIGURE 21. WALKING SPEED (MEDIAN ± QUARTILES) OF M. PERSICAE NYMPHS AT A RANGE OF
CONSTANT TEMPERATURES WHEN ACCLIMATED TO 10°C FOR I. ONE GENERATION AND II.
THREE GENERATIONS. SPANISH CLONES ARE REPRESENTED BY CLOSED RED SYMBOLS,
BRITISH CLONES BY OPEN GREEN SYMBOLS AND SWEDISH CLONES BY CLOSED BLUE
SYMBOLS................................................................................................................... 115
FIGURE 22. WALKING SPEED (MEDIAN ± QUARTILES) OF M. PERSICAE NYMPHS AT A RANGE OF
CONSTANT TEMPERATURES WHEN ACCLIMATED TO 25°C FOR I. ONE GENERATION AND II.
THREE GENERATIONS. SPANISH CLONES ARE REPRESENTED BY CLOSED RED SYMBOLS,
BRITISH CLONES BY OPEN GREEN SYMBOLS AND SWEDISH CLONES BY CLOSED BLUE
SYMBOLS................................................................................................................... 118
List of tables
TABLE 1. METEOROLOGICAL DATA FOR AREAS OF APHID COLLECTION ALONG A LATITUDINAL
GRADIENT IN EUROPE.. ................................................................................................ 33
TABLE 2. CHARACTERISTICS OF ALL APHID CLONES USED IN EXPERIMENTS INCLUDING APHID
COLLECTION INFORMATION, GENETIC VARIABILITY, LIFECYCLE TYPE, AND INSECTICIDE
RESISTANCE WHERE AVAILABLE. CLONES CLASSIFIED AS UNIQUE ARE THOSE WHICH
PROVED INDIVIDUAL FROM MICROSATELLITE ANALYSIS AND HAVE NOT, AS OF YET, BEEN
ASSIGNED A GENETIC TYPE. .......................................................................................... 41
TABLE 3. RESULTS OF MICROSATELLITE ANALYSIS ON THE NINE EXPERIMENTAL CLONES FROM
WHICH CLONAL TYPES WERE ASSIGNED. UNIQUE CLONES ARE CLONES WHICH HAVE NOT,
AS OF YET, BEEN ASSIGNED A GENETIC TYPE. ................................................................ 42
TABLE 4. THERMAL BEHAVIOURS OBSERVED IN CLONES OF THE APHID MYZUS PERSICAE. ..... 71
1
1 Introduction
Temperature is one of the most important abiotic factors affecting life on earth. Temperature
extremes are a major threat to life, affecting both the distribution and abundance of species.
This is especially true for insects which are ectothermic and have a limited ability to regulate
body temperatures above or below ambient. Ectotherms are consequently greatly influenced
by environmental conditions (Walther et al., 2002), with winter temperatures often
determining the limit to species’ distributions (Bale, 1993b).
Temperature can affect insects in numerous ways, influencing reproduction, longevity, and
development (Parish & Bale, 1993; Hutchinson & Bale, 1994), the latter of which may result
in morphological abnormalities (Bale et al., 1989). At low temperature extremes the
probability of survival is dependent upon the interaction between temperature and duration
of exposure and the cold hardiness of the individual (Bale, 1987). Bale (1987) defines cold
hardiness as the attributes of an individual that prevent deleterious effects when exposed to
low temperatures. However, the survival of the insect is of little ecological importance if the
exposure results in the individual’s failure to reproduce and contribute to the next generation
(Bale, 1987).
Insects are regarded as the most successful taxa, with species distributed from tropical to
polar climates. At present, approximately 106 insect species have been described,
representing over half of all known species, although the total number of insect species on
the Earth is estimated to lie in the region of 107 to 108 (Pimm et al., 1995; Thomas, 2005). A
major factor contributing to insect success is the development of a range of mechanisms to
overcome the problems associated with temperature extremes.
2
1.1 Insect survival strategies at low temperatures
1.1.1 Classification of cold hardiness strategies
Insects survive at low temperatures either by an ability to tolerate the internal freezing of
their body tissues and fluids or alternatively, to avoid such freezing by supercooling (Bale,
2002). Salt (1961) produced a classification scheme that categorized insects depending on
their ability to survive the formation of extracellular ice, categorizing insects as either freeze
tolerant or freeze avoiding (Salt, 1961). To determine the species’ classification, the insect is
cooled at a constant rate, typically 1°C min-1 (Baust, 1986), to the temperature of
crystallization or ‘supercooling point’ (SCP). The SCP is detected by the release of heat that
occurs when water crystallizes to ice. The insects are then warmed and survival assessed,
providing an indication of the cold hardiness of the insect and whether the insect is freeze
tolerant or intolerant.
Freeze tolerant insects are those which can survive extracellular, and possibly intracellular,
ice formation and in doing so are able to survive temperatures below the supercooling point.
The majority of freeze tolerant insects occur in areas where extreme winter conditions are
experienced, for example, the Arctic and sub-Arctic regions of America, Scandinavia, Russia
and China (Bale, 1996). More recent work has suggested that freeze tolerance, in addition to
being a strategy for surviving extreme Arctic conditions, is advantageous to surviving the
milder conditions of the southern hemisphere where unpredictable cold spells can occur
throughout the year (Sinclair et al., 2003; Sinclair & Chown, 2005). Sinclair et al., (2003)
propose that freeze tolerance evolved in parallel in the two hemispheres, allowing survival
during seasonal periods of extreme cold winters in the northern hemisphere and in the
southern hemisphere, survival during unpredictable, intermittent cold spells. Freeze tolerance
is achieved via the production of three main chemical compounds: ice nucleating agents
(INAs), antifreeze proteins (AFPs) and polyhydroxy alcohols (polyols) and sugars, which are
generally accumulated in the autumn and winter months.
3
Freeze intolerant or freeze avoiding insects as they are sometimes described, in contrast to
freeze tolerant insects, are unable to survive extracellular ice formation and must actively
avoid freezing via supercooling. The process of supercooling maintains the body tissues and
fluids at a temperature below which freezing would occur and is achieved using polyols and
AFPs. It is thought that most temperate insect species fall into this category (Bale, 1991).
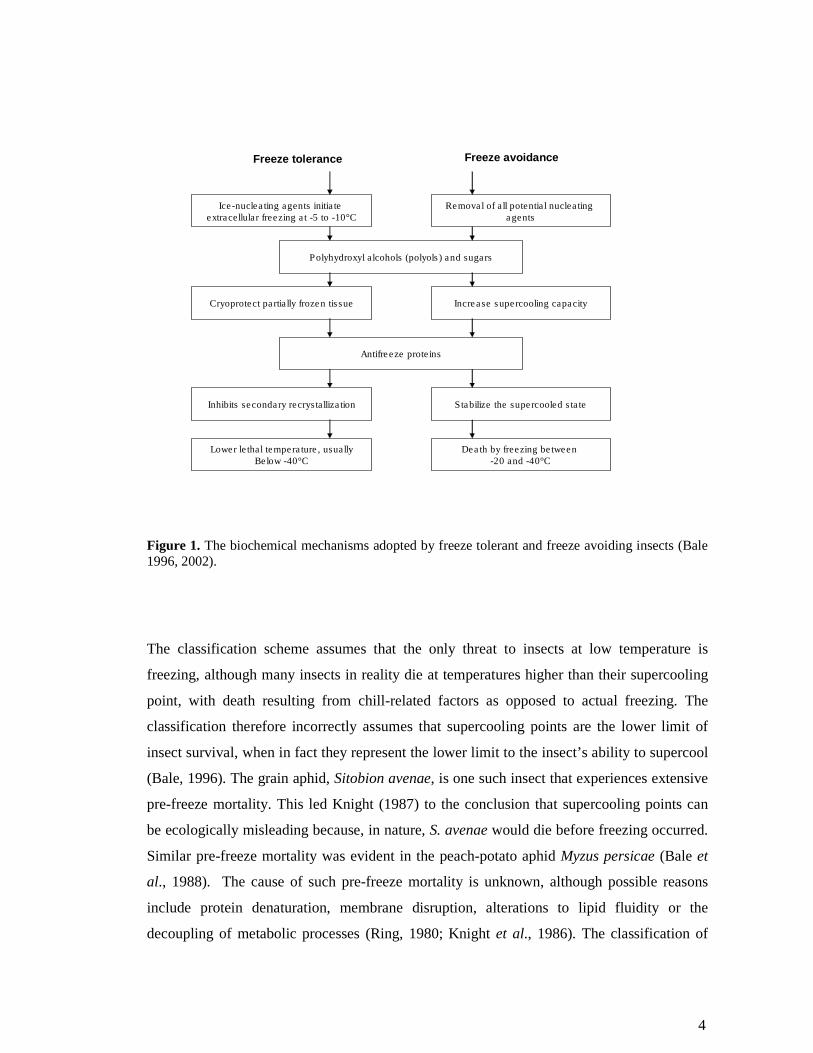
The key difference, therefore, between freeze tolerant and freeze avoiding insects is the role
of INAs. Within freeze tolerant insects INAs are synthesized and activated to allow for
controlled extracellular freezing, whereas the converse is true in freeze avoiding insects
where INAs are removed or masked to prevent freezing (Zachariassen, 1985). Unlike INAs,
both freeze tolerant and freeze avoiding insects contain AFPs, polyols and sugars, although
the role of these chemicals differs between the two strategies (Figure 1). In freeze tolerant
species polyols, such as glucose, increase the insect’s supercooling capacity and aid in the
cryoprotection of tissue before INAs have become fully active and AFPs play a role in the
prevention of recrystallization when body temperatures begin to rise at the end of winter
(Bale, 1996). Polyols, in freeze avoiding insects, also enable insects to supercool to
temperatures below which freezing would normally occur. The AFPs then act to stabilize the
supercooled state (Zachariassen, 1985; Bale 1996).
4
Figure 1. The biochemical mechanisms adopted by freeze tolerant and freeze avoiding insects (Bale 1996, 2002).
The classification scheme assumes that the only threat to insects at low temperature is
freezing, although many insects in reality die at temperatures higher than their supercooling
point, with death resulting from chill-related factors as opposed to actual freezing. The
classification therefore incorrectly assumes that supercooling points are the lower limit of
insect survival, when in fact they represent the lower limit to the insect’s ability to supercool
(Bale, 1996). The grain aphid, Sitobion avenae, is one such insect that experiences extensive
pre-freeze mortality. This led Knight (1987) to the conclusion that supercooling points can
be ecologically misleading because, in nature, S. avenae would die before freezing occurred.
Similar pre-freeze mortality was evident in the peach-potato aphid Myzus persicae (Bale et
al., 1988). The cause of such pre-freeze mortality is unknown, although possible reasons
include protein denaturation, membrane disruption, alterations to lipid fluidity or the
decoupling of metabolic processes (Ring, 1980; Knight et al., 1986). The classification of
Ice-nucleating agents initiate extracellular freezing at -5 to -10°C
Removal of all potential nucleating agents
Cryoprotect partially frozen tissue Increase supercooling capacity
Polyhydroxyl alcohols (polyols) and sugars
Antifreeze proteins
Death by freezing between -20 and -40°C
Stabilize the supercooled state
Lower lethal temperature, usuallyBelow -40°C
Inhibits secondary recrystallization
Freeze tolerance Freeze avoidance
5
insects as freeze intolerant was thus considered inappropriate due to failure of such insects to
survive to temperatures as low as the supercooling point, leading to the production of a new
classification scheme by Bale (1996).
The new classification scheme has retained the categories of freeze tolerance and freeze
avoidance, although the criterion for freeze avoidance has been modified. Modification of
the scheme has enabled incorporation of the knowledge that the effects of low temperature,
i.e. chilling, and freezing are not synonymous, with death occurring as a consequence of
short or prolonged exposure to low temperatures in the absence of freezing in many insects
(Bale, 1991). Freeze tolerant insects are the most cold hardy species and withstand
extracellular freezing initiated by INAs and include the larvae of the hoverfly Syrphus
ribesii, which experiences 70% survival at -35°C (Hart & Bale, 1997, 1998). Under this new
classification, insects are classified as freeze avoiding if low levels of mortality occur in the
absence of freezing. An example of a freeze avoiding insect is the moth Epirrita autumnata,
the eggs of which have a mean supercooling point of -35.5°C and do not die until freezing
occurs (Virtanen et al., 1998). For such freeze avoiding species, SCPs provide a reliable
indicator of cold hardiness.
In addition to freeze tolerant and freeze avoiding, three new categories have been proposed:
chill tolerant, chill susceptible and opportunistic survival. Chill tolerant insects are those that
possess relatively low sub-zero supercooling points, around -20 to -30°C, although
experience some mortality at temperatures above the supercooling point, for example, the
mite Alaskozetes antarticus and the beech weevil Rhynchaenus fagi. Overwintering adults of
R. fagi possess the ability to supercool to low sub-zero temperatures, with a reported mean
SCP of -25°C in mid-winter (Bale, 1991). However, 74% of the overwintering population
were killed following 50 days at -15°C; a temperature 10°C above the mean SCP for the
species (Bale, 1991). The SCP therefore becomes increasingly unreliable as an indicator of
cold hardiness. Chill susceptible insects, including many aphid species such as M. persicae
and S. avenae, also have the ability to supercool to low sub-zero temperatures, although
experience relatively high levels of mortality at temperatures well above the supercooling
point in very brief exposures of a few minutes or hours. For chill susceptible insects,
mortality is unrelated to their SCP and as a consequence SCPs do not provide reliable
6
indicators regarding the cold tolerance of such species. The final category, opportunistic
survival, includes all insects unable to survive below the threshold temperature required for
normal metabolic activity, such as the housefly Musca domestica. In a study population of
M. domestica pupae, 90% were killed within 4 days when held at 0° (Coulson & Bale, 1990).
Such species actively seek out sheltered overwintering sites to avoid unfavourable
conditions. Once again, the cold tolerance of the species is unrelated to their SCP.
More recently, Sinclair (1999) has suggested that the category of freeze tolerance, as with
freeze intolerance, forms a separate continuum and can be subdivided according to insect
SCPs and lower lethal temperatures (LLT). The resultant subcategories include partially
freeze tolerant insects which can survive a small amount of body water freezing but will die
when their body temperature reaches equilibrium with the environment, moderately freeze
tolerant, whereby the insects die less than 10°C below their SCP, strongly freeze tolerant,
whereby insects have LLTs 20°C or more below their SCP and finally, freeze tolerant insects
that possess very low SCPs and can survive below these temperatures (Sinclair, 1999).
1.1.2 Survival mechanisms at low temperatures
Mechanisms to survive at unfavourable low temperatures can include both chemical (briefly
mentioned previously) and behavioural responses. These mechanisms act either to increase
the cold hardiness of the individual or to prevent exposure to the unfavourable conditions.
1.1.2.1 Chemical mechanisms
Chemical mechanisms act to increase the cold hardiness of the insect and include the use of
INAs, polyols and sugars, and AFPs. INAs are proteins produced in the autumn by freeze
tolerant insects in preparation for winter and were first described in the beetle Eleodes
blanchardi by Zachariassen and Hammel (1976) and later purified in the hornet Vespula
maculata (Duman & Patterson, 1978). Containing a high proportion of hydrophilic animo
acids, mainly glutamate and glutamine, INAs are believed to function by their ability to
7
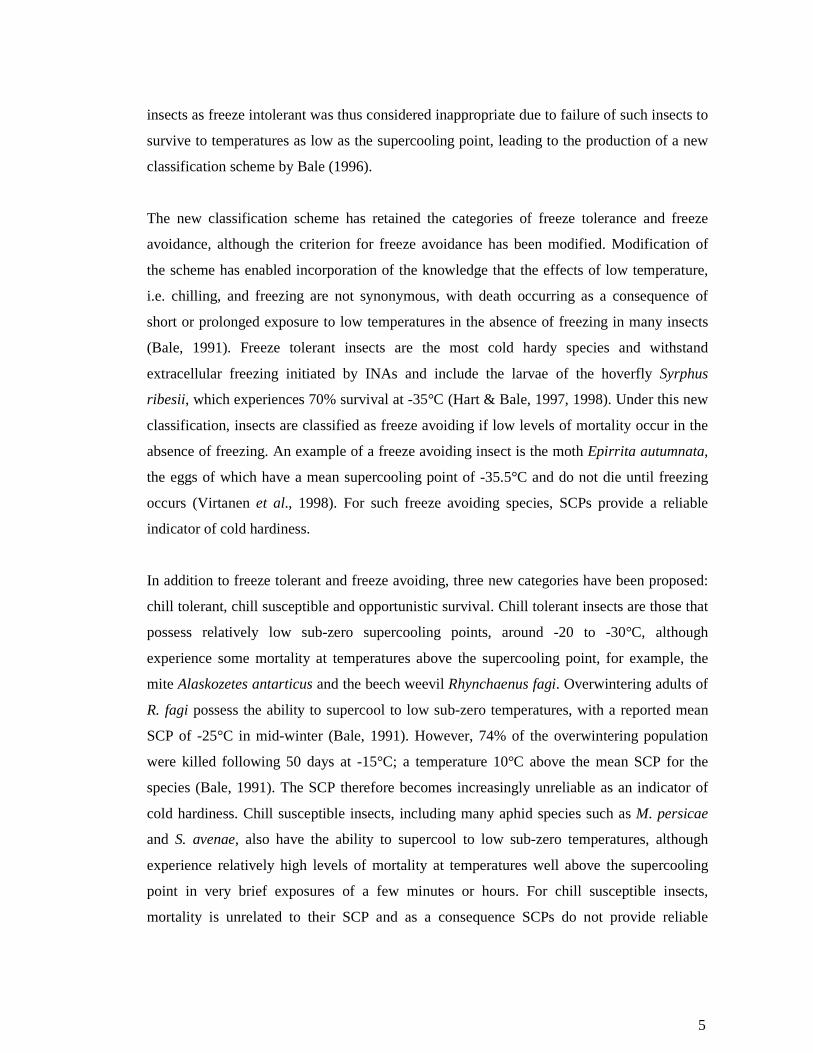
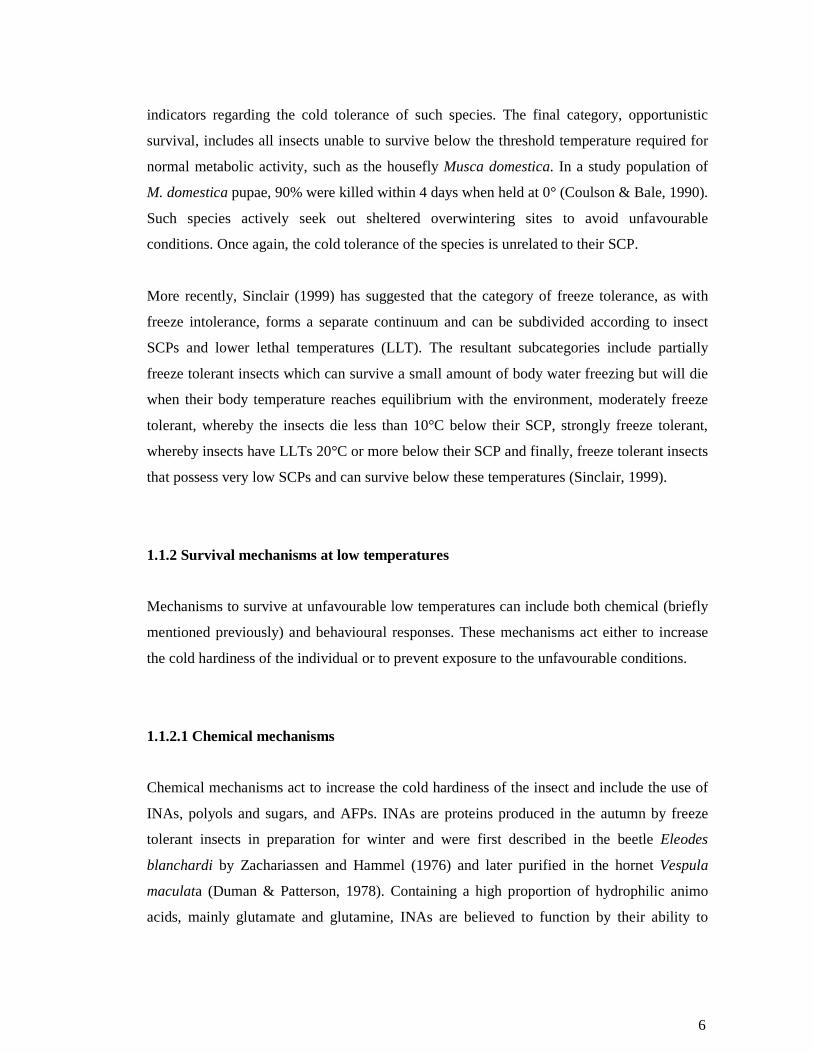
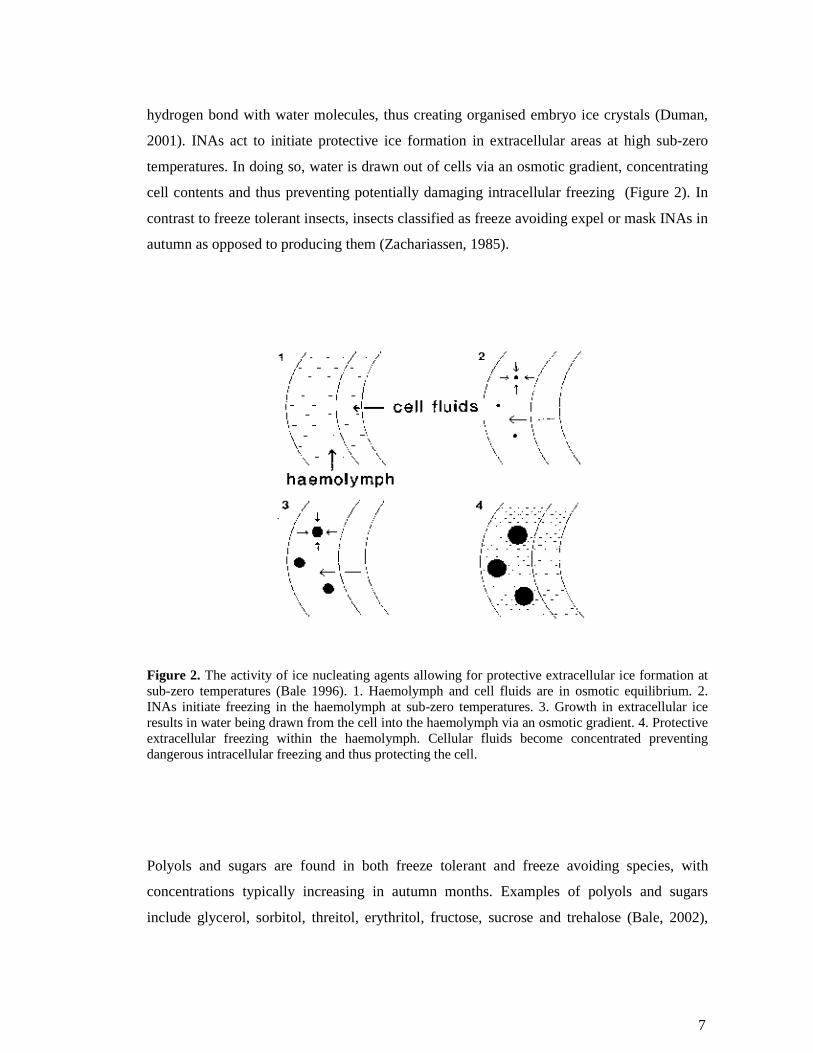
hydrogen bond with water molecules, thus creating organised embryo ice crystals (Duman,
2001). INAs act to initiate protective ice formation in extracellular areas at high sub-zero
temperatures. In doing so, water is drawn out of cells via an osmotic gradient, concentrating
cell contents and thus preventing potentially damaging intracellular freezing (Figure 2). In
contrast to freeze tolerant insects, insects classified as freeze avoiding expel or mask INAs in
autumn as opposed to producing them (Zachariassen, 1985).
Figure 2. The activity of ice nucleating agents allowing for protective extracellular ice formation at sub-zero temperatures (Bale 1996). 1. Haemolymph and cell fluids are in osmotic equilibrium. 2. INAs initiate freezing in the haemolymph at sub-zero temperatures. 3. Growth in extracellular ice results in water being drawn from the cell into the haemolymph via an osmotic gradient. 4. Protective extracellular freezing within the haemolymph. Cellular fluids become concentrated preventing dangerous intracellular freezing and thus protecting the cell.
Polyols and sugars are found in both freeze tolerant and freeze avoiding species, with
concentrations typically increasing in autumn months. Examples of polyols and sugars
include glycerol, sorbitol, threitol, erythritol, fructose, sucrose and trehalose (Bale, 2002),
8
although glycerol is reported to be the most common and effective polyol due to its low
molecular weight, allowing movement readily through cell membranes, its high solubility
and low toxicity (Salt, 1957). In freeze tolerant insects the polyols act to protect partially
frozen tissue and in freeze avoiding insects have an antifreeze function (Duman, 1982).
Tissue protection in freeze tolerant species is brought about by the polyols preventing the
potential causes of freeze damage, for example, mechanical damage, electrolyte imbalance
and recrystallization (Bale, 2002). This is achieved via increasing the binding capacity of
water, which in turn decreases the rate of ice formation, stabilizing protein structure,
buffering electrolytes and decreasing transmembrane water flux (Baust, 1982; Bale, 2002).
Glycerol further acts as a solvent, keeping potentially harmful salts in solution as they
become more concentrated during ice formation (Miller & Smith, 1975).
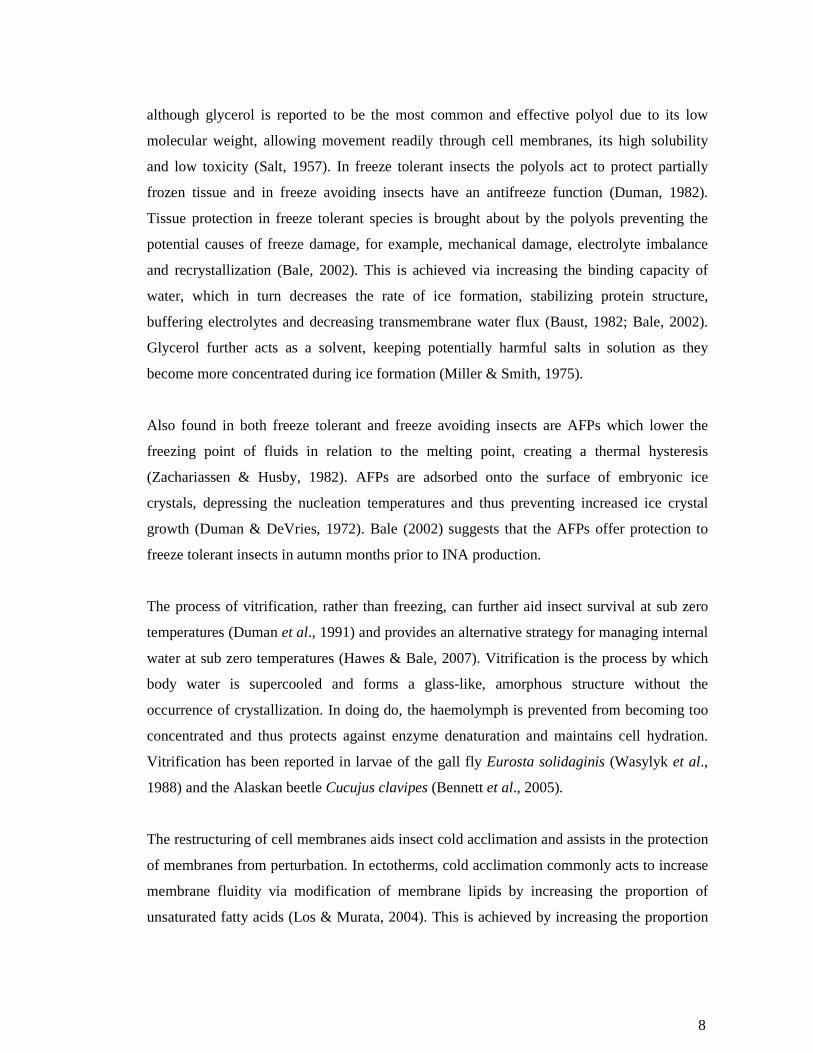
Also found in both freeze tolerant and freeze avoiding insects are AFPs which lower the
freezing point of fluids in relation to the melting point, creating a thermal hysteresis
(Zachariassen & Husby, 1982). AFPs are adsorbed onto the surface of embryonic ice
crystals, depressing the nucleation temperatures and thus preventing increased ice crystal
growth (Duman & DeVries, 1972). Bale (2002) suggests that the AFPs offer protection to
freeze tolerant insects in autumn months prior to INA production.
The process of vitrification, rather than freezing, can further aid insect survival at sub zero
temperatures (Duman et al., 1991) and provides an alternative strategy for managing internal
water at sub zero temperatures (Hawes & Bale, 2007). Vitrification is the process by which
body water is supercooled and forms a glass-like, amorphous structure without the
occurrence of crystallization. In doing do, the haemolymph is prevented from becoming too
concentrated and thus protects against enzyme denaturation and maintains cell hydration.
Vitrification has been reported in larvae of the gall fly Eurosta solidaginis (Wasylyk et al.,
1988) and the Alaskan beetle Cucujus clavipes (Bennett et al., 2005).
The restructuring of cell membranes aids insect cold acclimation and assists in the protection
of membranes from perturbation. In ectotherms, cold acclimation commonly acts to increase
membrane fluidity via modification of membrane lipids by increasing the proportion of
unsaturated fatty acids (Los & Murata, 2004). This is achieved by increasing the proportion
9
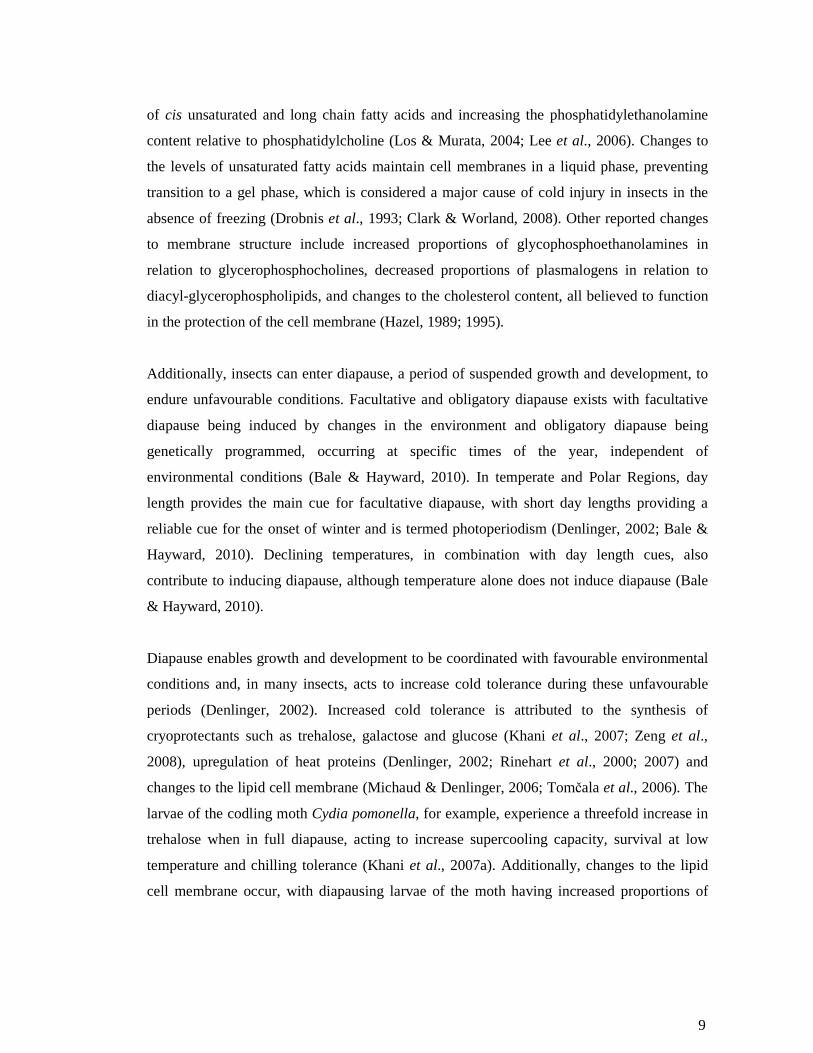
of cis unsaturated and long chain fatty acids and increasing the phosphatidylethanolamine
content relative to phosphatidylcholine (Los & Murata, 2004; Lee et al., 2006). Changes to
the levels of unsaturated fatty acids maintain cell membranes in a liquid phase, preventing
transition to a gel phase, which is considered a major cause of cold injury in insects in the
absence of freezing (Drobnis et al., 1993; Clark & Worland, 2008). Other reported changes
to membrane structure include increased proportions of glycophosphoethanolamines in
relation to glycerophosphocholines, decreased proportions of plasmalogens in relation to
diacyl-glycerophospholipids, and changes to the cholesterol content, all believed to function
in the protection of the cell membrane (Hazel, 1989; 1995).
Additionally, insects can enter diapause, a period of suspended growth and development, to
endure unfavourable conditions. Facultative and obligatory diapause exists with facultative
diapause being induced by changes in the environment and obligatory diapause being
genetically programmed, occurring at specific times of the year, independent of
environmental conditions (Bale & Hayward, 2010). In temperate and Polar Regions, day
length provides the main cue for facultative diapause, with short day lengths providing a
reliable cue for the onset of winter and is termed photoperiodism (Denlinger, 2002; Bale &
Hayward, 2010). Declining temperatures, in combination with day length cues, also
contribute to inducing diapause, although temperature alone does not induce diapause (Bale
& Hayward, 2010).
Diapause enables growth and development to be coordinated with favourable environmental
conditions and, in many insects, acts to increase cold tolerance during these unfavourable
periods (Denlinger, 2002). Increased cold tolerance is attributed to the synthesis of
cryoprotectants such as trehalose, galactose and glucose (Khani et al., 2007; Zeng et al.,
2008), upregulation of heat proteins (Denlinger, 2002; Rinehart et al., 2000; 2007) and
changes to the lipid cell membrane (Michaud & Denlinger, 2006; Tomčala et al., 2006). The
larvae of the codling moth Cydia pomonella, for example, experience a threefold increase in
trehalose when in full diapause, acting to increase supercooling capacity, survival at low
temperature and chilling tolerance (Khani et al., 2007a). Additionally, changes to the lipid
cell membrane occur, with diapausing larvae of the moth having increased proportions of
10
unsaturated fatty acids, acting to increase membrane fluidity at low temperatures (Khani et
al., 2007b).
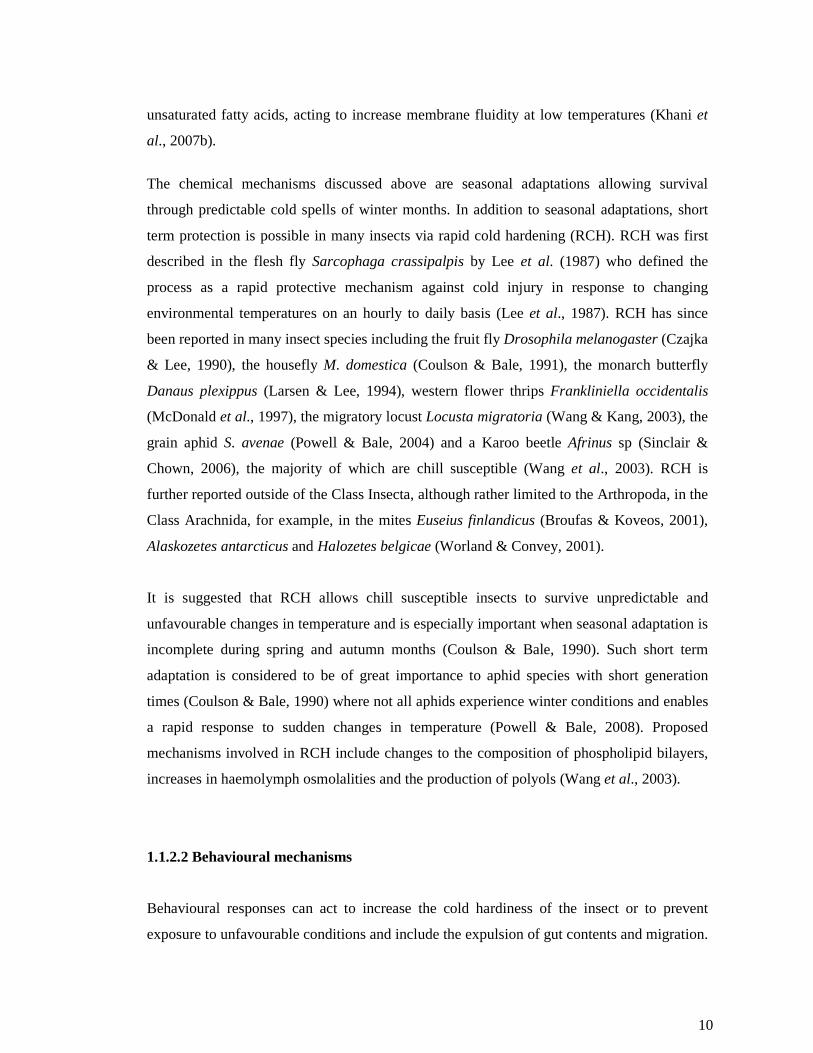
The chemical mechanisms discussed above are seasonal adaptations allowing survival
through predictable cold spells of winter months. In addition to seasonal adaptations, short
term protection is possible in many insects via rapid cold hardening (RCH). RCH was first
described in the flesh fly Sarcophaga crassipalpis by Lee et al. (1987) who defined the
process as a rapid protective mechanism against cold injury in response to changing
environmental temperatures on an hourly to daily basis (Lee et al., 1987). RCH has since
been reported in many insect species including the fruit fly Drosophila melanogaster (Czajka
& Lee, 1990), the housefly M. domestica (Coulson & Bale, 1991), the monarch butterfly
Danaus plexippus (Larsen & Lee, 1994), western flower thrips Frankliniella occidentalis
(McDonald et al., 1997), the migratory locust Locusta migratoria (Wang & Kang, 2003), the
grain aphid S. avenae (Powell & Bale, 2004) and a Karoo beetle Afrinus sp (Sinclair &
Chown, 2006), the majority of which are chill susceptible (Wang et al., 2003). RCH is
further reported outside of the Class Insecta, although rather limited to the Arthropoda, in the
Class Arachnida, for example, in the mites Euseius finlandicus (Broufas & Koveos, 2001),
Alaskozetes antarcticus and Halozetes belgicae (Worland & Convey, 2001).
It is suggested that RCH allows chill susceptible insects to survive unpredictable and
unfavourable changes in temperature and is especially important when seasonal adaptation is
incomplete during spring and autumn months (Coulson & Bale, 1990). Such short term
adaptation is considered to be of great importance to aphid species with short generation
times (Coulson & Bale, 1990) where not all aphids experience winter conditions and enables
a rapid response to sudden changes in temperature (Powell & Bale, 2008). Proposed
mechanisms involved in RCH include changes to the composition of phospholipid bilayers,
increases in haemolymph osmolalities and the production of polyols (Wang et al., 2003).
1.1.2.2 Behavioural mechanisms
Behavioural responses can act to increase the cold hardiness of the insect or to prevent
exposure to unfavourable conditions and include the expulsion of gut contents and migration.
11
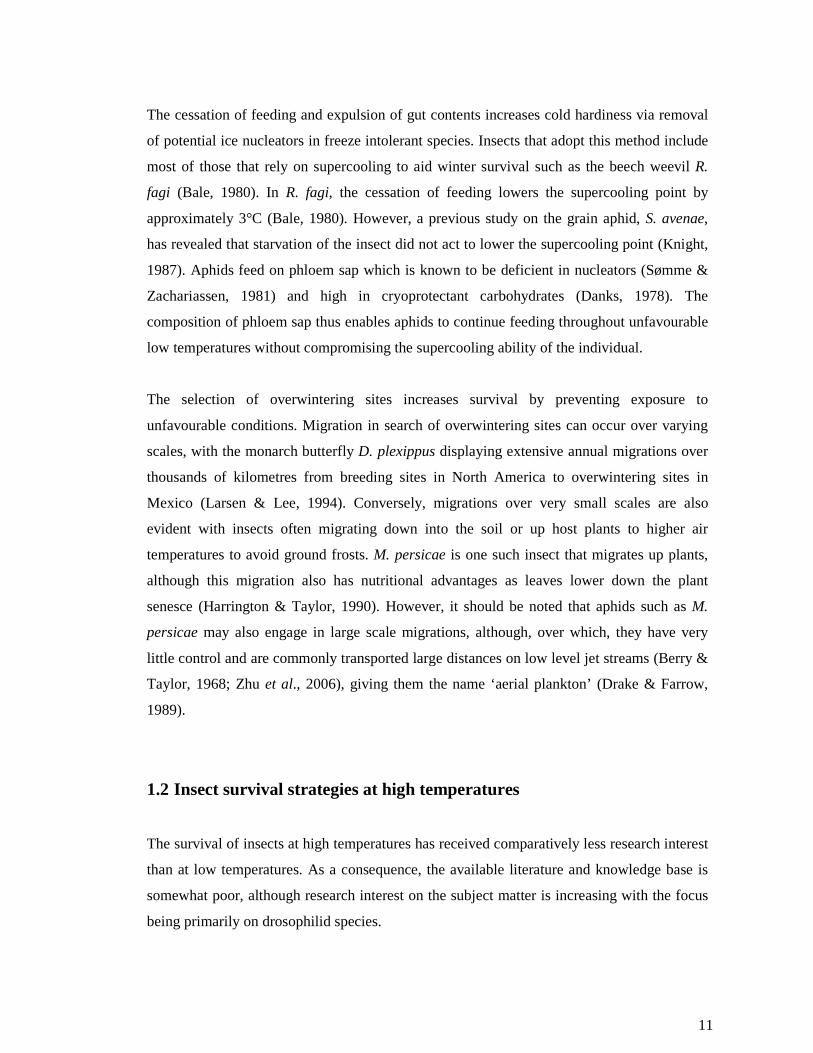
The cessation of feeding and expulsion of gut contents increases cold hardiness via removal
of potential ice nucleators in freeze intolerant species. Insects that adopt this method include
most of those that rely on supercooling to aid winter survival such as the beech weevil R.
fagi (Bale, 1980). In R. fagi, the cessation of feeding lowers the supercooling point by
approximately 3°C (Bale, 1980). However, a previous study on the grain aphid, S. avenae,
has revealed that starvation of the insect did not act to lower the supercooling point (Knight,
1987). Aphids feed on phloem sap which is known to be deficient in nucleators (Sømme &
Zachariassen, 1981) and high in cryoprotectant carbohydrates (Danks, 1978). The
composition of phloem sap thus enables aphids to continue feeding throughout unfavourable
low temperatures without compromising the supercooling ability of the individual.
The selection of overwintering sites increases survival by preventing exposure to
unfavourable conditions. Migration in search of overwintering sites can occur over varying
scales, with the monarch butterfly D. plexippus displaying extensive annual migrations over
thousands of kilometres from breeding sites in North America to overwintering sites in
Mexico (Larsen & Lee, 1994). Conversely, migrations over very small scales are also
evident with insects often migrating down into the soil or up host plants to higher air
temperatures to avoid ground frosts. M. persicae is one such insect that migrates up plants,
although this migration also has nutritional advantages as leaves lower down the plant
senesce (Harrington & Taylor, 1990). However, it should be noted that aphids such as M.
persicae may also engage in large scale migrations, although, over which, they have very
little control and are commonly transported large distances on low level jet streams (Berry &
Taylor, 1968; Zhu et al., 2006), giving them the name ‘aerial plankton’ (Drake & Farrow,
1989).
1.2 Insect survival strategies at high temperatures
The survival of insects at high temperatures has received comparatively less research interest
than at low temperatures. As a consequence, the available literature and knowledge base is
somewhat poor, although research interest on the subject matter is increasing with the focus
being primarily on drosophilid species.
12
Following exposure to a heat stress, death can occur as a result of protein denaturation,
affecting enzyme and substrate binding, and alterations to the fluidity of phospholipid
bilayers (Dahlgaard et al., 1998; Neven, 2000). In addition, structural damage to DNA, RNA
and carbohydrates may arise and critical pH and ion concentrations can become distorted
(Neven, 2000).
Heat shock proteins, synthesized following exposure to a heat stress, play an important role
in survival at unfavourably high temperatures. In addition to extreme high temperatures, heat
shock proteins are induced by a variety of stresses which include low temperature extremes,
depletion of cellular energy, and extreme concentrations of ions, osmolytes, gases and toxic
substances (Feder & Hofmann, 1999). It should be noted that not all heat shock proteins are
induced by stress (Feder & Hofmann, 1999).
Of the heat shock proteins known, proteins belonging to the Hsp70 family are best
characterized. Hsp70 proteins are believed to act as molecular chaperones, aiding in the
transportation of denatured or non-functional proteins to lysosomes for degradation, to
prevent aggregations of denatured proteins by binding with hydrophobic domains (Feder &
Hoffmann, 1999; Bahrndorff et al., 2009b) or to assist the re-folding of proteins on removal
of the heat stress (Sørensen et al., 2003; see Neven 2000 for review). In the flesh fly S.
crassipalpis exposure to a heat stress led to increased thermal tolerance at a previously lethal
exposure regime. The newly acquired heat tolerance was found to decline with time,
although persisted long after the heat shock proteins had degraded, suggesting that additional
mechanisms could be involved in the acquisition of heat tolerance (Yocum & Delinger,
1992).
A trade off exists between the benefits conferred by the upregulation of Hsps enabling
survival at unfavourably high temperatures and the associated costs. These costs include
detrimental affects on rates of growth, development and reproduction, and provide an
explanation as to why cells remove Hsp70 in the absence of stress (Feder et al., 1992;
Sørensen et al., 2003). Such costs associated with the stress response are suggested to be a
consequence of normal cell functions shutting down during the response, toxicity of Hsps70
13
in high concentrations, or due to requiring large amounts of energy (Feder & Hoffmann,
1999).
1.3 Indices of insect thermal tolerance
A number of indices are commonly adopted in the laboratory to measure insect thermal
tolerance. Such indices enable comparisons between species or populations of the same
species and allow the effects of acclimation and experimental treatments on thermal
tolerance to be determined. The focal indices discussed below include the supercooling
point, lethal temperatures and times, critical temperatures and the discriminating temperature
which is used in rapid cold hardening studies.
1.3.1 Supercooling point
The supercooling point or crystallization temperature is the lowest temperature before
spontaneous freezing of body water occurs. It is determined in the laboratory by cooling the
insect at a constant rate until freezing occurs. With careful monitoring of the insect’s body
temperature, the supercooling point can be readily identified as the exotherm caused by the
latent heat of crystallization. Determination of insect supercooling points has previously been
used in the classification of insect cold hardiness into the categories of freeze tolerance and
freeze avoiding depending on whether the insect can survive following exposure at the
supercooling point.
1.3.2 Lethal temperatures and times
The lethal temperature (LT) is the temperature at which a specific percentage of an insect
sample population is killed. The LT50, for example, is the temperature at which an
experimental population experiences 50% mortality. Insects are cooled or heated at a set rate
to a predetermined temperature, held at the temperature for a desired length of time, and then
14
returned to the start temperature, usually at the same rate. Insect survival is assessed
following a recovery period. The LT50 is estimated by exposing samples to a number of
decreasing or increasing temperatures depending on whether cold or heat tolerance is being
assessed. From the acquired data set, a graph of insect survival against exposure temperature
can be produced which follows a typically sigmoidal dosage-mortality curve. Probit analysis
is commonly used to linearise the sigmoidal curve and enables an accurate estimate of the
LT50 value. Following a similar principle, lethal times are determined by exposing an insect
sample to a pre-determined stressful temperature (e.g. 0°C, -5°C, -10°C) for varying lengths
of times before re-warming. Insect survival is then assessed and Probit analysis performed.
1.3.3 Critical temperatures
The ability to move at increasingly higher or lower temperatures also provides an indication
of the thermal tolerance of an insect. Critical temperatures are estimated by cooling or
heating a sample population at a set rate and recording the temperature at which movement
of an individual insect ceases or coma is induced, depending on the critical temperature
being studied. The temperature at which insects lose the ability to walk is known as the
CTmin or CTmax, referring to the movement threshold at low and high temperature
respectively. Additional cooling or heating will eventually result in the insect entering a state
of coma, referred to respectively as the chill or heat coma, and is defined as the last twitch of
an appendage. In the literature critical temperatures can also refer to the temperature at which
an individual insect can no longer right itself after being artificially knocked over. Due to the
numerous characterizations of critical temperature values, it is vital that, when using such
indices, the adopted definition and experimental procedure be stated clearly to avoid
ambiguity. The measurement of critical temperatures perhaps provides more ecologically
relevant information on thermal tolerance since survival is of little importance if the
individual is unable to move to find food, a mate or escape predation.
15
1.3.4. Discriminating temperatures and rapid cold hardening
When assessing an insect’s ability to rapidly cold harden, the discriminating temperature is
an essential measurement that enables the RCH response to be identified and quantified. The
discriminating temperature is the temperature which results in 80-90% mortality in a
population sample when transferred directly from the rearing temperature to a particular sub-
zero temperature. The discriminating temperature is therefore a reference point to determine
changes in mortality following treatment to induce RCH.
1.4 Aphids and the study species Myzus persicae
1.4.1 Aphid lifecycles
The majority of aphid species so far studied are considered chill susceptible species due to
experiencing high mortality at temperatures above the supercooling point. Aphids can be
classified as monoecious or heteroecious, depending on the occurrence of host-alternation
during the lifecycle. Monoecious species, such as S. avenae, remain on the same herbaceous
host species throughout the year, although this life strategy is only possible if the herbaceous
host is present throughout the year. Heteroecious species, such as M. persicae, alternate
between a summer herbaceous host and a winter woody host plant. Aphids that possess the
host-alternating lifecycle have a potential nutritional advantage over species with a
monoecious lifecycle, although they are required to return to the primary woody host to lay
eggs (Shaposhnikov, 1987). Conversely, it could be argued that the monoecious lifecycle is
advantageous because the mortality associated with a migrating stage is avoided. It should,
however, be noted that some species of monoecious aphids such as S. avenae do migrate.
Many aphid species, although not all, can overwinter as one of two lifecycle types that differ
in cold tolerance. The first overwintering strategy used by most aphid species is as a
holocyclic (sexual) egg, produced by the mating of an ovipara and a male. The second
strategy involves overwintering as an anholocyclic or asexual aphid which arises due to a
16
stable genetic mutation affecting the photoperiodic switch leading to a failure to produce
sexual forms in autumn (Moran, 1992; Dixon, 1998). The anholocyclic aphids do not seek
out hibernation sites to overwinter, but instead remain active on the underside of leaves as
they do for the remainder of the year (Harrington & Taylor, 1990). The holocyclic egg is
more cold tolerant than the overwintering anholocyclic aphid (Strathdee et al., 1995), with
aphid eggs supercooling to sub-zero temperatures as low as -35°C (Hutchinson & Bale,
1994). Overwintering as an egg therefore increases the chance of surviving through the
winter under unfavourable conditions. Although less cold hardy, the anholocyclic aphid can
continue to feed and reproduce throughout the winter, albeit at a lower rate than in summer.
The two lifecycles represent a trade off between increased probability of winter survival (the
holocyclic lifecycle) and increased population size through continuous reproduction and thus
greater spring dispersal (the anholocyclic lifecycle).
The proportion of holocyclic and anholocyclic clones in a population is governed by the
severity of winter conditions. Consequently, locations experiencing milder winters would be
predicted to have increased proportions of anholocyclic clones compared to locations
experiencing severe winters (Broadbent & Heathcote, 1955). At more northerly latitudes
where low temperature extremes would be experienced more frequently, the proportion of
holocyclic clones is proposed to increase (Walters & Dewar, 1986). Understanding the
complex interactions between winter severity and overwintering strategy can assist in the
prediction of spring population abundance and aid the production of reliable forecasting
systems for aphid outbreaks (Walters & Dewar, 1986; Harrington et al., 1990; Cocu et al.,
2005).
1.4.2 The study species Myzus persicae
Myzus persicae (Sulzer) (Hemiptera: Aphididae) is a heteroecious aphid host alternating
between the primary peach Prunus persica host in winter and various herbaceous hosts,
belonging to approximately 40 different families, which include brassicas, potatoes and
sugar beet, in summer (Blackman & Eastop, 2000). Due to the primary peach host
originating from Asia, it is believed that M. persicae also originates from the region
17
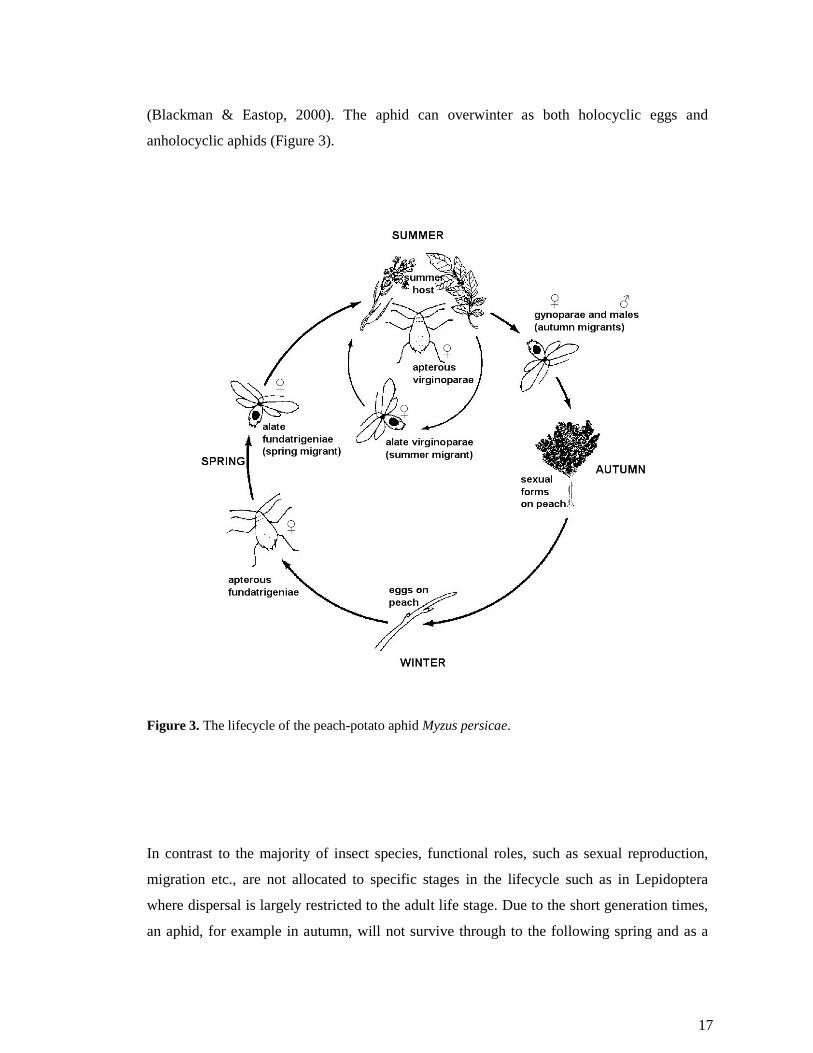
(Blackman & Eastop, 2000). The aphid can overwinter as both holocyclic eggs and
anholocyclic aphids (Figure 3).
Figure 3. The lifecycle of the peach-potato aphid Myzus persicae.
In contrast to the majority of insect species, functional roles, such as sexual reproduction,
migration etc., are not allocated to specific stages in the lifecycle such as in Lepidoptera
where dispersal is largely restricted to the adult life stage. Due to the short generation times,
an aphid, for example in autumn, will not survive through to the following spring and as a
18
consequence specific roles are instead partitioned between generations. Throughout the year
a sequence of morphs are produced. Males and gynoparae migrate in winter to the primary
peach host. Once on the winter host, the gynoparae produce oviparae via parthenogenesis.
The oviparae are sexual, egg laying female forms which mate with the males to produce
overwintering eggs. When conditions become favourable in spring, the eggs hatch into
apterous (wingless) fundatrices. The fundatrices reproduce parthenogenically for several
generations throughout spring, producing apterous fundatrigeniae. Eventually, alate (winged)
fundatrigeniae are produced which migrate to the summer, herbaceous host. Throughout the
summer, aphids reproduce via parthenogenesis, producing both alate and apterous forms,
with the apterous virginoparae producing both males and gynoparae in the autumn in
response to decreasing photoperiod in preparation for migration to the winter host. A
separate annual cycle co-occurs in which apterous virginoparae fail to produce sexual forms
and continue reproducing parthenogenically throughout the year, overwintering as
anholocyclic individuals with intermittent alate generations. In some aphid species, including
M. persicae, a third and fourth lifecycle exists known as the androcyclic and intermediate
lifecycle. With the androcyclic lifecycle, anholocyclic clones produce males in addition to
virginoparae. Males are also produced in addition to virginoparae in the intermediate
lifecycle, although alates have the ability to produce both apterous offspring and sexual
female morphs under winter conditions; this is an intermediate of the anholocyclic lifecycle
in which only apterous offspring are produced and the holocyclic lifecycle in which sexual
female morphs are produced. The third and fourth lifecycle types will not be discussed
hereafter.
Some aphid species, including M. persicae, are distributed widely across the globe. In
Europe, M. persicae can be found from northern Scandinavia to southern Spain. With
knowledge of the lifecycle and physiology of M. persicae, predictions can be made on
interpopulational variation along the latitudinal cline. For example, regional adaptations in
thermal tolerance and changes to the ratio of anholocyclic to holocyclic clones could be
expected. Such knowledge would further allow the level of gene flow between populations to
be deduced. Significant variation in thermal tolerance and lifecycle predominance between
populations would suggest a lack of gene flow, and would provide the basis for future
speciation.
19
1.5 Geographic variation in thermal tolerance
Geographic variation in thermal tolerance has recently been the focus of research in a
number of species from the Phylum Arthropoda, including drosophilid species (Davidson,
1990; Goto & Kimura, 1998; Gibert & Huey, 2001; Gibert et al., 2001ab; Bubliy et al.,
2002; Ayrinhac et al., 2004), the common woodlouse Porcellio laevis (Castañeda et al.,
2004, 2005), the pea leafminer Liriomyza huidobrensis (Chen & Kang, 2004), the springtail
Orchesella cincta (Bahrndorff et al., 2006, 2009a) and European diving beetles (Calosi et al.,
2010).
Studies concerning variation in the thermal tolerance of drosophilid species have primarily
focused on the differences in lower thermal limits between tropical and temperate
populations, both within and between species. In D. melanogaster, temperate populations
were more resistant to cold and desiccation stress than tropical populations (Davidson,
1990). Similarly, in a comparison of 26 temperate drosophilid species and 48 tropical
species, temperate species displayed shorter recovery times following a cold induced coma
(Gibert et al., 2001b). A limited number of comparative studies have been conducted
comparing populations along latitudinal and altitudinal gradients. In Drosophila subobscura,
the temperature inducing chill coma declined with increasing latitude, indicating that
populations from high latitudes were increasingly cold tolerant (Gibert & Huey, 2001). In D.
melanogaster, both mortality and recovery time following a cold shock decreased at
temperate latitudes and mortality decreased and knockdown time increased following a heat
shock at tropical latitudes (Hoffmann et al., 2002; Ayrinhac et al., 2004). Also within the
Order Diptera, cold tolerance of the pea leafminer L. huidobrensis, this time measured by
lower lethal temperature, was again found to increase with latitude (Chen & Kang, 2004).
Literature regarding geographical variation in thermal tolerance for species outside the Order
Diptera is further limited, although research is less biased towards lower thermal limits.
Castañeda et al. (2004) studied the crustacean P. laevis along a 10° latitudinal gradient
through Chile. P. laevis from low latitudes were found to display lower cold tolerance and
higher optimum temperatures and were consequently more adapted towards high
temperatures. P. laevis from high latitudes had greater cold tolerance and lower optimum
20
temperatures. Likewise, recovery time from chill coma revealed an inverse relationship with
latitude (Castañeda et al. 2005), suggesting that populations along a latitudinal gradient
display local adaptations in thermal physiology.
More recently, Bahrndorff et al. (2006, 2009a) studied populations of the springtail O. cincta
collected along a 2000 km latitudinal gradient throughout Europe from Denmark to Southern
Italy. The studies revealed that individuals from high latitudes exhibited the greatest cold
shock resistance, but lowest resistance to heat shock. The reverse was true of O. cincta from
low latitudes, once again suggesting adaptation to local climate. Similar relationships are, in
addition to along latitudinal gradients, also evident in altitudinal gradients. Cold tolerance
increased with increasing altitude, as indicated by declining values of CTmin, in species of
scarab dung beetle along an altitudinal gradient in South Africa; dung beetles from high
altitude populations could remain active to lower temperatures and avoid entering a state of
cold induced torpor for longer (Gaston & Chown, 1999). CTmax was revealed to vary less
with altitude than CTmin, resulting in increased thermal tolerance at high altitude (Gaston &
Chown, 1999).
In the majority of insect species studied, upper thermal limits show much less variation with
regard to genetic variation and phenotypic plasticity than lower lethal limits, indicating that,
in insects, thermal limits are ‘decoupled’ (Addo-Bediako et al., 2000). Put simply, the
relationship between upper and lower thermal limits appears not to be a fixed one, with one
limit not necessarily moving in accordance with the other. Given that upper lethal limits are
generally less variable than lower lethal limits, insects experiencing lower temperatures (i.e.
at high latitude or altitude) are expected to display greater differentials between upper and
lower limits due to lower lethal limits being lowered to a greater extent in relation to the
upper lethal limit. This decoupling of thermal limits has been attributed to the increased
climatic variability associated with increasing latitude, resulting in a need for greater thermal
tolerance (Addo-Bediako et al., 2000).
21
1.6 Applications of insect thermal biology
The limited ability of insects to maintain body temperature above or below the
environmental temperature results in insects being greatly influenced by the environment
(Walther et al., 2002). An understanding of insect thermal biology can thus provide valuable
information for predictive models for the forecasting of pest outbreaks, the establishment of
invasive species, shifts in range patterns, and the potential implications of global climate
change.
Over the past century the Earth’s climate has warmed by approximately 0.6°C (Easterling et
al., 2000; Walther et al., 2002). However, this trend in rising temperature has not been a
steady process and since the mid 1970s parts of the world have experienced a rapid increase
to a rate of warming of 0.2°C per decade (Karl et al., 2000). Using mid range climate
warming scenarios, it is predicted that 15-37% of species and taxa could become extinct by
2050 (Thomas et al., 2004). In addition to warming, climate change can encompass changes
to climatic variability, atmospheric composition, land cover and land use and can occur over
varying temporal and spatial scales (Scherm et al., 2000). The impacts of global change are
likely to have profound effects on distribution patterns and the pest and invasive status of
insect species. It is therefore understandable that knowledge of the variability in insect
thermal tolerance and acclimation ability would provide valuable information for such areas.
1.6.1 Forecasting pest outbreaks
The development of a forecasting system for predicting pest outbreaks is of particular
importance for aphid species. Aphids feed on the phloem sap of host plants using modified
mouthparts known as stylets which penetrate the plant phloem, allowing passive feeding on
phloem sap due to the positive pressure within the phloem. By feeding on host plants, aphids
can result in the stunting of plant growth, the lowering of crop yields and aid the
transmission of viral diseases (Block et al., 1992).
22
Aphids are vectors in the transmission of approximately 275 plant virus species from 19
genera, equating to more than 50% of all insect transmitted plant viruses, many of which are
commercially important (Nault, 1997). The short lifecycles of aphids, in addition to high
rates of population increase and dispersal, contribute to the success of aphids as one of the
main groups of plant disease vectors (Fereres & Moreno, 2009). Aphid-transmitted viruses
can be classified as either stylet-borne or circulative. Stylet-borne viruses, commonly
referred to as non-persistent viruses, are short-lived within the aphid, with the vector often
remaining infectious for less than 24 hours and include sugarcane mosaic virus and maize
dwarf mosaic strain (Slykhuis, 1976). Circulative viruses, referred to as persistent viruses,
are those which are ingested into the aphid gut and pass to the saliva via the haemolymph,
allowing infection of the plant during subsequent aphid feeding. Once infectious, an aphid
can remain so for a long time and such viruses are retained through moulting to later instars
and adults. Circulative viruses include barley yellow dwarf virus, wheat yellow dwarf virus,
maize leaf fleck virus and beet mild yellowing virus (Russell, 1962; Slykhuis, 1976).
Perhaps the most common and widespread of crop viral diseases is barley yellow dwarf
(BYD), caused by barley yellow dwarf viruses (BYDV) belonging to the Luteoviridae family
(Edwards, 2001) and transmitted by over 20 species of aphid (Irwin, 1990). Symptoms of
infected plants include yellowing of the leaves and stunted growth. In addition to yield loss,
BYDV can further be economically damaging through reduction in crop quality. Since the
1970s the disease has become more widespread throughout Britain as a consequence of
increased abundance of a major vector, S. avenae. However, although widespread, large
scale yield losses in Britain are infrequent (Knight et al., 1996). For the subject species M.
persicae, it is the transmission of the potato viruses that are the most damaging. The potato
leaf roll virus (PLRV), also belonging to the Luteoviridae family, is a persistent, circulative
virus and has contributed to declining potato productivity over the last century (Radcliffe &
Ragsdale, 2002; Chatzivassiliou et al., 2008). Perhaps more damaging is the potato virus Y
(PVY) belonging to the Potyviridae family. This non-persistent, stylet-borne virus is
transmitted by mainly winged aphids (Saucke & Döring, 2004) and it is reported to cause
yield losses of up to 80% (Takacs, 2000).
23
In addition to reducing crop yields and transmitting viral diseases, many pest insects cause
extensive damage via defoliation resulting in a direct loss of biomass, but further indirect
loss by leaving the host plant susceptible to fungal infection. The majority of insect
defoliators belong to the Order Lepidoptera, with examples including the Autumnal moth E.
autumnata, a major defoliator of mountain birch in Scandinavia (Virtanen et al., 1998) and
the gypsy moth Lymantria dispar, the main defoliator of broadleaved trees in Eastern North
America (Kegg, 1971; Kenis et al., 2009). Other examples of major insect defoliators outside
the Lepidoptera include the sawflies Neodiprion sertifer (Eklundh et al., 2009), Perga affinis
(Jordan et al., 2002), Diprion pini and Pristiphora abietina (Dajoz, 2000) to name a few, gall
midges of the family Cecidomyiddae (Dajoz, 2000) and a variety of weevils, leaf beetles,
and chafers of the Coleoptera (Dajoz, 2000).
The study species M. persicae gains its pest status due to the efficacy with which it spreads
viral diseases in crop plants. It alone is a vector in the transmission of approximately 100
plant diseases and is consequently a pest of major economic importance (Kennedy et al.,
1962). The development of effective forecasting systems would decrease the need for
prophylactic insecticide spraying, which can result in the death of non-target organisms,
contribute to the pollution of freshwater and can lead to increased insecticide resistance
amongst target organisms (Block et al., 1992).
The lifecycle type prevalent in an aphid population will further have implications for the
severity of potential pest outbreaks. As previously discussed, the overwintering anholocyclic
clones of pest aphids such as M. persicae and S. avenae are less cold hardy than
overwintering holocyclic eggs (Strathdee et al., 1995) and consequently, their proportions
are dependent upon winter (Walters & Dewar, 1986). On arrival of spring conditions,
anholocyclic clones respond more quickly to higher temperatures, resulting in increased
numbers, an earlier production of the migratory alates and consequent earlier spring
migration to the summer host. For M. persicae, almost 80% of the variation in the timing of
first capture in suction traps, a sampling method by which air is continually sampled at
specific heights above ground, can be explained by mean winter temperatures (Harrington et
al., 1990). Holocyclic clones, originating from the overwintering egg, require several
generations before production of migratory alates can commence. In contrast, production of
24
migratory alates from anholocyclic clones can begin as soon as conditions become
favourable. A trade-off therefore exists between the two clonal types regarding winter
survival and spring migration.
During mild winters, greater survival of anholocyclic clones leads to earlier migration of
potentially infectious aphids to the summer host (Figure 4). Transmission of viruses, for
example BYDV, is most likely to occur via the progeny of anholocyclic clones as opposed to
aphids originating from virus-free holocyclic eggs. BYDV causes the greatest damage when
infection of the barley plant occurs at a young age due to mature plants being less susceptible
to viral infections (McKirdy and Jones, 1996; McKirdy et al., 2002). This is particularly
problematic when milder winters lead to a greater prevalence of anholocyclic aphids which
are, not only more prone to carrying the virus, but also more likely to infect the younger
barley plants through earlier spring migrations. Likewise, large numbers of winged aphids
are required to successfully colonise sugar beet and as a consequence, mild winter conditions
will have implications for M. persicae populations and the spread of beet yellow viruses
(BYV) (Williams et al, 2000).
25
Figure 4. The effects of mild and severe winters on spring and summer populations and related damage potential of aphids overwintering as anholocyclic clones (Bale & Hayward, 2010).
Changes in temperature will further impact the number of generations per year, known as
voltinism, with voltinism being positively correlated with temperature (Jonsson et al., 2009;
Sand & Brittain, 2009). Additional generations would lead to greater population growth and
accelerate potential pest outbreaks (Altermatt, 2009). It is therefore understandable that
knowledge of aphid thermal biology is vital to the understanding of how aphids may react to
potential climate change with implications for the prediction of pest outbreaks.
1.6.2 Species distribution
In the face of global change, species are expected to track changing climate, either through
adapting to new conditions or by shifting distribution (Walther et al., 2002), since failure to
26
do so could result in population extinction. Bio-indicator species, such as Lepidoptera,
provide information on alterations to species distribution. In a study of 35 non-migratory
butterfly species, 63% were found to have shifted their range northwards by between 35-
240km over the previous century, which is considered a direct impact of regional warming
(Parmesan et al., 1999). Additionally, the southern green stinkbug Nezara viridula has
extended its range 70km further north in Japan since the 1960s, displacing the closely related
Nezara antennata (Musolin, 2007). Similar range shifts have been reported for bird species,
for example, with the northern margins of British breeding birds having extended northwards
by an average of 18.9km over a 20 year period (Thomas & Lennon, 1999).
Climate tracking is not always achievable and species re-distribution can be prevented when
geographical formations, habitat loss and fragmentation impede movement or when
movement is limited by additional factors, for example, light limitation preventing the re-
distribution of reef building corals (Hoegh-Guldberg, 1999). Failure to reach climatically
favourable habitats is apparent in the forests of Monteverde, Costa Rica, where 20 of 50
species of toads and frogs have become locally extinct and one species, the golden toad Bufo
periglenes, has become globally extinct, as a consequence of cloud bank migration to higher
altitudes (Pounds et al., 1999). In addition to species distribution, climate change is expected
to impact the phenology and physiology of organisms, community interactions, and
ecosystem dynamics (Walther et al., 2002). Information on variation in thermal tolerance of
M. persicae along a latitudinal gradient and the potential differences in acclimation ability
will provide an indication of how the distribution of the species could change in a changing
global climate, with implications for pest management.
1.6.3 Alien species
Species are moved beyond their natural ranges, both deliberately and accidentally, by human
interference and this too is true of aphids. For example, the spotted alfalfa aphid Therioaphis
trifolii was introduced into the USA in the 1950s, the Russian wheat aphid Diuraphis noxia
into South Africa in the 1970s (Blackman & Eastop, 2000), and the rose-grain aphid
Metopolophium dirhodum into New Zealand as recently as the 1980s (Nicol et al., 1997).
27
Fortunately, most invasions fail with successful establishment of alien species being
prevented when new habitats are not climatically matched to the native range. The ‘tens rule’
provides a general rule of thumb to the success of invasions, with invasions progressing
through a series of stages: import to the country, escape into the wild, establishment of a
population and finally development into a pest species. The rule theorizes that only 10% of
invasive species successfully progress to the next stage (Williamson & Brown, 1986;
Williamson, 1996, 2006). Nonetheless, it is estimated that naturalized alien species
constitute approximately 2-33% of the flora of continental areas and 80% of islands
(Vitousek et al., 1997).
Alien species can have detrimental ecological impacts on native species via direct predation,
competition, spreading diseases, hybridization and altering the habitat. Economic impacts
can further be imposed. Introduction of the zebra mussel Dreissena polymorpha into North
America resulted in costs of up to $2 billion annually for the removal of the species from
fouled water pipes and inlets (Lodge et al., 1993; MacIsaac, 1996). Insects, in particular, can
cause great economic losses due to many species being pests of important agricultural crops.
The introduction of the Mexican rice borer Eoreuma loftini into Louisiana, Southern
America, is predicted to cost the rice industry $45 million in lost revenue once all of
Louisiana is infested (Reay-Jones et al., 2008). Global change and shifting temperatures
could alter current patterns of climatic matching, potentially facilitating the successful
establishment of alien species. This highlights once again the importance of understanding
the thermal biology of such a prolific and major agricultural pest as M. persicae, should
global climate change result in expansion outside of its current range.
1.7 Study hypotheses and experimental considerations
Previous research on aphid thermal biology has focused on the variation of cold hardiness
between different life stages and the effects of rapid cold hardening. To date, no study has
focused on variation in thermal biology within a single aphid species along a latitudinal
gradient. Such knowledge is important in the forecasting of how the distribution of pest
species such as M. persicae will be impacted by global climate change and will further
28
provide information regarding the level of gene flow between populations and the potential
for future speciation.
It can be hypothesised that populations of M. persicae will display regional adaptations. At
the northern end of the range, it would be predicted that populations would have greater cold
tolerance (indicated by lower lethal and coma temperatures) and lower developmental
thresholds. At high latitude, populations would further be expected to display a greater
ability to acclimate at lower temperatures, although a lesser ability to acclimate to higher
temperatures, than populations at the range centre and southerly range margin. The reverse
would be predicted for populations from lower latitudes. It would therefore be expected that
a gradient of increasing cold tolerance but decreasing heat tolerance would become apparent
as M. persicae populations progress from Mediterranean, to temperate and then sub-polar
climates. It could also be predicted that a shift from anholocycly to holocycly would occur
from southerly latitudes to more northerly latitudes due to extreme low temperatures
selecting against the anholocyclic lifecycle in sub-polar regions and favourable temperatures
preventing natural climatic control of anholocyclic clones in the Mediterranean.
On careful consideration of the predictions stated above, the reality is perhaps less
straightforward. Mediterranean countries, such as Spain, would be expected to have an
abundance of anholocyclic clones due to a lack of winter stress. However, Spain also has a
plentiful supply of the primary host, the peach tree, with Spain being the fourth largest
producer of peaches in the world after China, Italy and the USA (Llacer et al., 2009).
Availability of the primary host will favour existence of the holocyclic lifecycle, and thus,
anholocyclic and holocyclic lifecycles could both be common in Spain. As a result, extensive
migrations are not required and regionally adapted populations displaying greater heat
tolerance could be expected. At the northerly range margin of M. persicae in Scandinavia,
holocycly would be favoured due to extreme winter temperatures which would select against
the anholocyclic lifecycle. However, peach trees are required to support the holocyclic
lifecycle, and, these are uncommon in Scandinavia. If holocyclic aphids cannot persist due to
a lack of the primary host and likewise anholocyclic aphids due to extreme sub-zero winter
temperatures, it is likely that M. persicae populations cannot reside all year round in
Scandinavia, unless in protected areas such as glasshouses, and an annual influx of aphids
29
must therefore occur in order to build up the populations that are found outdoors in summer.
If annual immigrations into Scandinavia occur from other parts of Europe, aphids collected
in Scandinavia would not be expected to display greater levels of cold tolerance or reduced
heat tolerance.
The current study is designed to determine inter-clonal variation in the thermal biology of M.
persicae in relation to geographical variation. However, aphid clones display variation in
biological characteristics that, although are not the target of the investigation, have the
potential to impact on thermal tolerance. As a consequence, aphid characteristics including
lifecycle type, clonal type, insecticide resistance status, colour morphology and the presence
of symbionts, need to be considered prior to the investigation to ensure that results observed
are a consequence of geographical variation associated with the sites of collection.
1.7.1 Aphid lifecycle
M. persicae exists as two distinct lifecycle types, anholocycly and holocycly, with a further
two intermediate lifecycle types, androcycly and intermediate. It is well recognized that
anholocyclic clones are less cold tolerant than overwintering holocyclic eggs, at least in their
respective overwintering stages (Hutchinson & Bale, 1994). The lifecycle of all clones used
in the current study must be determined because failure to determine the lifecycle of study
clones will prevent any interpopulational variation in temperature tolerance being attributed
to geographical distribution, since disparity in lifecycle type could also account, at least in
part, for observed differences.
1.7.2 Aphid clonal type
The ability of M. persicae to reproduce clonally, both within the anholocyclic and holocyclic
lifecycles, results in the production of genetically distinct aphid clones within a population
(Fenton et al., 1998; Fenton et al., 2005; Kasprowicz et al., 2008). All aphid clones collected
for study will be subjected to microsatellite analysis to determine variation at the chosen loci
30
and to assign a ‘type’. Aphids with identical microsatellite patterns at the loci examined are
classified as the same type and, although this does not indicate that the clones are genetically
identical, it does determine that clones originated from the same stem mother through
asexual propagation (Kasprowicz et al., 2008). Such information will further allow
investigation into whether aphids of the same type are more alike in relation to thermal
tolerance than clones of different types.
1.7.3 Insecticide resistance
Aphids are a major pest worldwide owing to the ease in which they transmit plant viral
diseases and due to resultant structural damage caused to the plant when feeding. The control
of aphid pests using insecticides has led to an increase in insecticide resistant aphid clones.
Recent studies on aphid insecticide resistance suggest a trade off between resistance and
thermal tolerance. In M. persicae, winter survival is inversely related to insecticide
resistance, leading to the conclusion that selection for insecticide resistance is counteracted
by the selection pressures of British winters (Foster et al., 1996). In addition, the mobility of
M. persicae at low temperatures is inversely related to levels of insecticide resistance (Foster
et al., 1997). All study clones will therefore be resistance typed prior to use in experiments.
1.7.4 Colour morphology
Many aphid species exist in distinct and stable colour morphs. Examples include the pea
aphid Acyrthosiphon pisum which has green and red forms (Dixon, 1998), the walnut aphid
Chromaphis juglandicola with yellow and white forms (Hougardy & Mills, 2008) and the
study species M. persicae which also has green and red forms (Blackman, 1987). The colour
of the study clones will be noted in case colour morphology influences thermal tolerance.
31
1.7.5 Bacterial symbionts
All phloem feeding Homoptera possess symbiotic microorganisms (Douglas, 1998). In
aphids, the primary symbiont is the bacterium Buchnera aphidicola. Transmitted maternally
via a process known as transovarial transmission, the bacteria are housed in specialised cells
known as bacteriocytes or mycetocytes and provide the aphids with nutrients and essential
amino acids lacking from the phloem sap diet (Douglas, 1998). This symbiotic relationship is
essential to aphid development, without which growth and reproductive rates are low (Moran
& Dunbar, 2006). Buchnera are sensitive to high temperatures, with relatively short
exposures of a few hours at high temperatures (37°C) being sufficient enough to kill
Buchnera and have detrimental affects on the aphids (Ohtaka & Ishikawa, 1991).
In addition to the Buchnera primary symbiont, aphids are host to a variety of secondary
symbionts. Such secondary symbionts have been found to confer resistance against parasitic
wasps (Oliver et al., 2005) and fungal infections (Scarborough et al., 2005), expand the
number of host plants available for utilization (Tsuchida et al., 2004), and even impact life
history traits such as dispersal and mating habits which would reduce gene flow and
ultimately aid speciation (Leonardo & Mondor, 2006). Additionally, specific symbionts have
been demonstrated to increase heat tolerance (Chen et al., 2000; Montllor et al., 2002;
Russell & Moran, 2006).
1.8 Aims, objectives and hypotheses tested
The main aim of the study is to investigate aspects of the thermal biology of the aphid Myzus
persicae to ascertain how tolerance to extreme temperatures varies between clones collected
from different locations along the aphid’s latitudinal distribution in Europe.
32
Specific objectives include:
• To establish in culture nine clones of M. persicae, three collected from each of three
regions of the aphid’s European distribution: Southern Spain, Britain and
Scandinavia (Sweden).
• To estimate the lower and upper lethal temperatures (LT50 min and LT50 max) of
these clones.
• To determine the movement thresholds and chill and heat coma temperature of the
clones.
• To determine the mobility of the clones at varying temperatures (0°C to 25°C).
• To study the effects of acclimation at 10°C and 25°C for one and three generations on
the above thresholds of all clones.
In meeting these objectives, four main hypotheses will be tested:
• Clones collected from Sweden will be more cold tolerant than those collected from
Britain or Spain.
• Clones collected from Southern Spain will be more heat tolerant than clones collected
from Britain or Sweden.
• No latitudinal trend in thermal tolerance will be evident. Severe winter temperatures
and a lack of the primary host plant in Scandinavia will prevent permanent M.
persicae populations existing and therefore populations will rely on annual
migrations from other parts of Europe to persist. Extensive annual seasonal
migrations results in an annual redistribution of aphid clones that will override any
regional adaptation.
• Aphid clones of the same type, as determined by microsatellite analysis, will be more
similar with respect to thermal tolerance than clones of differing types.
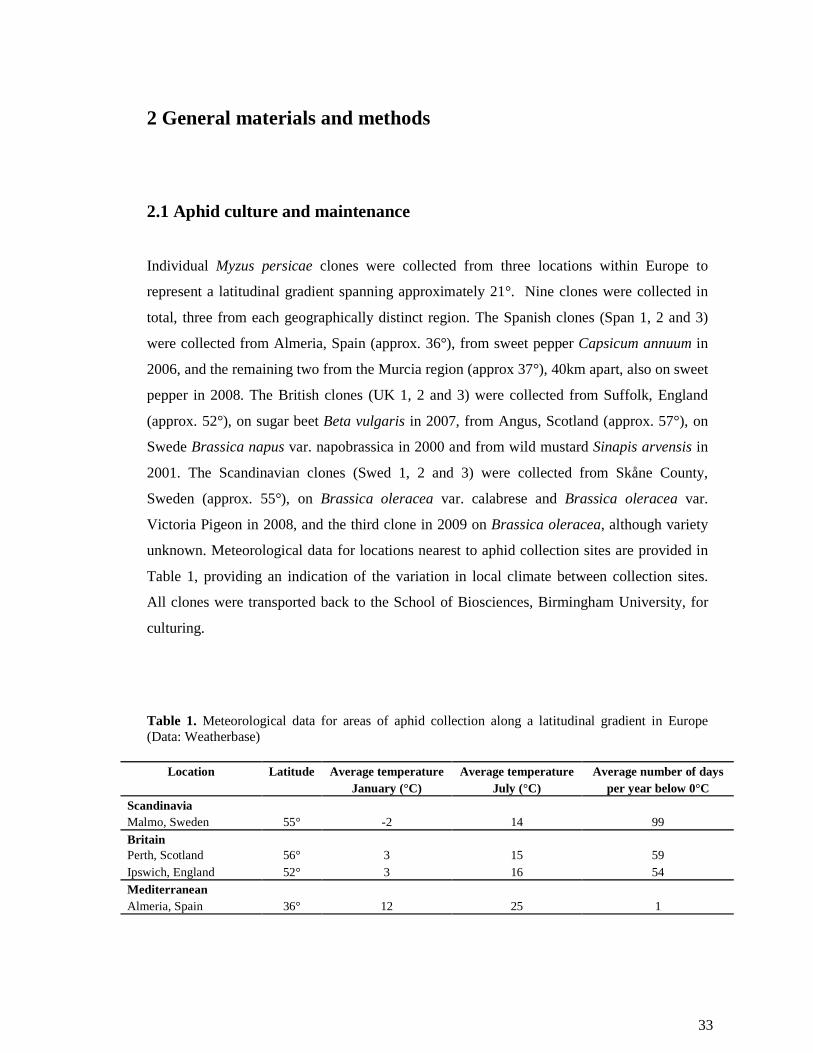
33
2 General materials and methods
2.1 Aphid culture and maintenance
Individual Myzus persicae clones were collected from three locations within Europe to
represent a latitudinal gradient spanning approximately 21°. Nine clones were collected in
total, three from each geographically distinct region. The Spanish clones (Span 1, 2 and 3)
were collected from Almeria, Spain (approx. 36°), from sweet pepper Capsicum annuum in
2006, and the remaining two from the Murcia region (approx 37°), 40km apart, also on sweet
pepper in 2008. The British clones (UK 1, 2 and 3) were collected from Suffolk, England
(approx. 52°), on sugar beet Beta vulgaris in 2007, from Angus, Scotland (approx. 57°), on
Swede Brassica napus var. napobrassica in 2000 and from wild mustard Sinapis arvensis in
2001. The Scandinavian clones (Swed 1, 2 and 3) were collected from Skåne County,
Sweden (approx. 55°), on Brassica oleracea var. calabrese and Brassica oleracea var.
Victoria Pigeon in 2008, and the third clone in 2009 on Brassica oleracea, although variety
unknown. Meteorological data for locations nearest to aphid collection sites are provided in
Table 1, providing an indication of the variation in local climate between collection sites.
All clones were transported back to the School of Biosciences, Birmingham University, for
culturing.
Table 1. Meteorological data for areas of aphid collection along a latitudinal gradient in Europe (Data: Weatherbase)
Location Latitude Average temperature Average temperature Average number of days
January (°C) July (°C) per year below 0°C
Scandinavia
Malmo, Sweden 55° -2 14 99
Britain Perth, Scotland 56° 3 15 59
Ipswich, England 52° 3 16 54
Mediterranean
Almeria, Spain 36° 12 25 1
34
Single monoclonal lineages were established for each of the nine experimental clones and
were maintained in the laboratory at a culture temperature of 20 ± 0.5°C, photoperiod LD
16:8, representing an intermediate temperature for the three locations. Aphid culturing was
carried out in ‘Blackman boxes’ (Blackman, 1988) for which aphids were enclosed within a
ventilated box containing a single leaf of food material. Aphid numbers within Blackman
boxes were kept to five per leaf so as to prevent overcrowding. The food material used
throughout the study was Chinese cabbage (Brassica rapa var. Wingbok) grown by the
School of Biosciences (Horticultural Services) glasshouses from seed in net covered cages.
Fresh plants were supplied once a week to the laboratory. Glasshouse plants were inspected
weekly to prevent contamination with wild aphids. Prior to use in the Blackman boxes,
selected leaves were cut, washed and further inspected under a microscope for the presence
of wild aphids to prevent contamination of the culture populations. Aphids were transferred
with a fine paintbrush to reduce potential handling damage to Blackman boxes containing
newly cut B. rapa leaves every 5-7 days to ensure a fresh food supply.
2.2 General experimental procedures
2.2.1 Acclimation to different temperatures
To study the effects of acclimation on aphid thermal tolerance, first instar nymphs (less than
24h old) were removed from the culture temperature of 20°C and transferred to either 10°C
(low temperature) or 25°C (high temperature). Aphids were left to develop at the selected
temperature for one and three generations, thus allowing distinction between acclimation
within a single generation and intergenerational acclimation. The aphids used in all
experiments were the offspring of individuals reared under these acclimation treatments and
were collected between days 3 and 6 of the adults’ reproductive cycle, since aphids born
earlier in the reproductive life of the adults are reported to differ physiologically (Clough et
al., 1990; Powell & Bale, 2008) (See section 3.2 for more information and preliminary
work). First instar nymphs were thus available for experimentation from five different
acclimation treatments: constant 20°C, 10°C for one generation, 10°C for three generations,
25°C for one generation and 25°C for three generations. Due to the slower development of
35
aphids reared at 10°C, first instar nymphs were left to develop for 48h prior to use in
experiments as opposed to 24h in the other treatment regimes.
2.2.2 Exposure to temperature extremes
First instar nymphs were placed within plastic 0.5ml Eppendorf tubes at densities of ten
nymphs per tube which, in turn, were placed within a glass boiling tube. Pieces of sponge
were used to stopper the boiling tubes to limit air circulation and ensure a more stable
internal temperature within the tubes. The boiling tubes were held within a test tube holder
and lowered into an alcohol bath (Haake Phoenix 11 P2; Thermo Electron Corp., Germany).
The alcohol bath was programmed to cool or heat aphids to a set temperature at a set rate.
The alcohol bath could further be programmed to hold the aphids at a selected maximum or
minimum temperature for a required time period. A thermocouple was placed within an
empty Eppendorf tube, set up in the same way as the tubes containing the aphids, enabling
the temperature the aphids were experiencing to be monitored.
Following exposure, nymphs were transferred to a recovery tray. Recovery trays were
constructed from B. rapa leaf discs (approximately 30mm in diameter) placed on damp
tissue paper. Specially constructed Perspex cages were placed over the leaf discs to prevent
aphid escape. Mortality was assessed 72h after exposure.
2.2.3 Recording activity thresholds
The effect of temperature on activity thresholds was determined using a method described by
Hazell et al. (2008). An aluminium block arena (Figure 5) was created which attached to an
alcohol bath, enabling pumping of heated or cooled alcohol fluid throughout channels drilled
into the block and thus allowing fine control over the temperature experienced within the
arena. The walls of the arena were coated with Fluon (Blades Biological, UK) to prevent
aphids climbing up the arena sides. A thermocouple (Tecpel, Taiwan) was placed within the
arena to accurately monitor the exposure temperature experienced. A camera (Infinity 1-1;
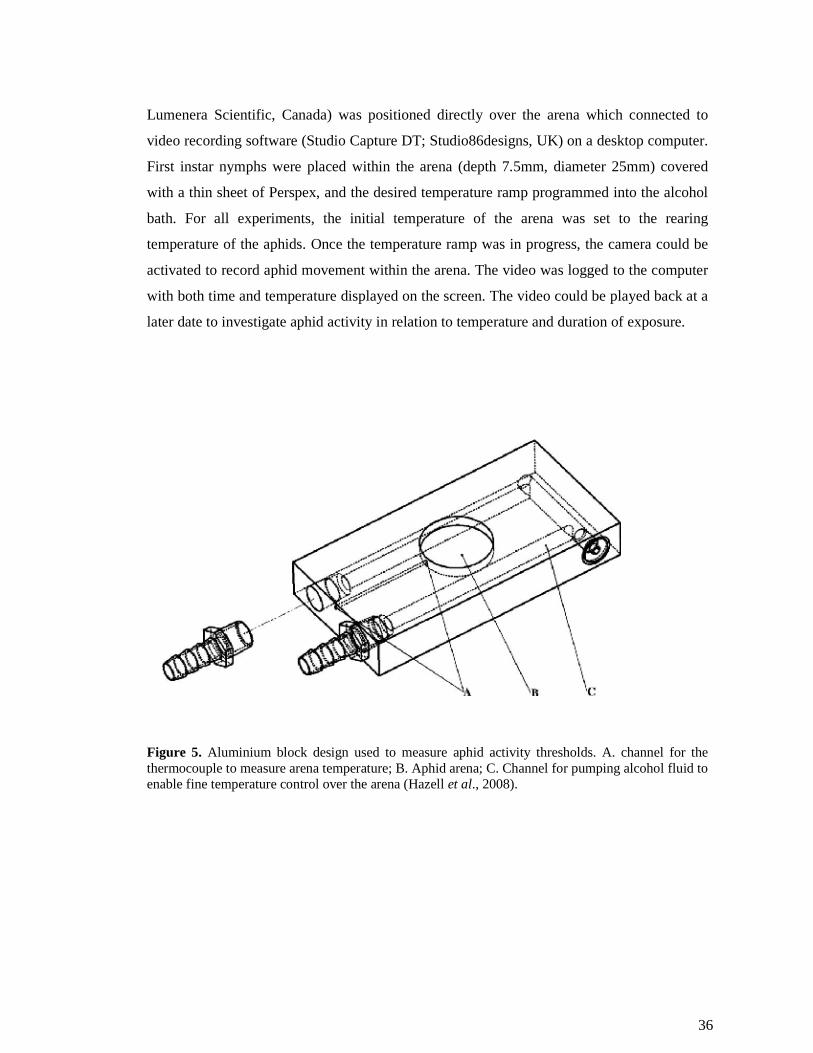
36
Lumenera Scientific, Canada) was positioned directly over the arena which connected to
video recording software (Studio Capture DT; Studio86designs, UK) on a desktop computer.
First instar nymphs were placed within the arena (depth 7.5mm, diameter 25mm) covered
with a thin sheet of Perspex, and the desired temperature ramp programmed into the alcohol
bath. For all experiments, the initial temperature of the arena was set to the rearing
temperature of the aphids. Once the temperature ramp was in progress, the camera could be
activated to record aphid movement within the arena. The video was logged to the computer
with both time and temperature displayed on the screen. The video could be played back at a
later date to investigate aphid activity in relation to temperature and duration of exposure.
Figure 5. Aluminium block design used to measure aphid activity thresholds. A. channel for the thermocouple to measure arena temperature; B. Aphid arena; C. Channel for pumping alcohol fluid to enable fine temperature control over the arena (Hazell et al., 2008).
37
3 Preliminary experiments: characterisation of clones and birth sequence
effects on thermal tolerance
3.1 Determination of aphid characteristics
3.1.1 Genetic variability
The genetic variability of aphid clones was determined using microsatellite DNA analysis
performed at the Scottish Crop Research Institute in Dundee, Scotland. DNA was extracted
and amplified from ethanol preserved aphids. Three microsatellite loci, chosen for resolution,
were selected (M49, M63 and M86) and amplified using fluorichrome primers labelled at the
5’end of the reverse primer and PCR ready to go beads, and then analysed on an automated
sequencer using the method detailed in Kasprowicz et al. (2008)
3.1.2 Lifecycle type
The lifecycle type of all M. persicae clones used in experiments was determined using a
method previously described by Vorburger et al., (2003). Reproducing adults (known as
generation G0) were placed under conditions of short day length (LD 12:12h) and lower
temperature (14.5°C) and allowed to reproduce for 48h within freshly prepared Blackman
boxes. Such conditions are known to induce the production of sexual morphs in M. persicae
if the clone is able to do so i.e. if the clone is holocyclic. Adults were removed after 48h and
nymphs (G1 generation) allowed to develop into wingless parthenogenetic females under
these conditions. On commencing reproduction, 4 adults of the G1 generation were retained
for each clone and allowed to reproduce for a total of 20 days. All nymphs produced (G2)
were retained and allowed to develop until adult ecdysis to determine the morph type. Aphid
morphs were classified as alate (winged) or apterae (wingless) or male. Of the alate forms
produced, all, excluding 4 individuals, were preserved in 70% ethanol following aphid
morph scoring in case further identification was required. The excluded 4 alates were
38
transferred in to separate Blackman boxes and allowed to reproduce for sufficient time to
produce approximately 5 nymphs each. The resultant nymphs (G3) were allowed to develop
until adult ecdysis and the aphid morphs were again classified as apterous parthenogenetic
females or sexual females. Figure 6 displays the different lifecycle types that could have
been identified for M. persicae and details the different morphs that would be expected at
each generation.
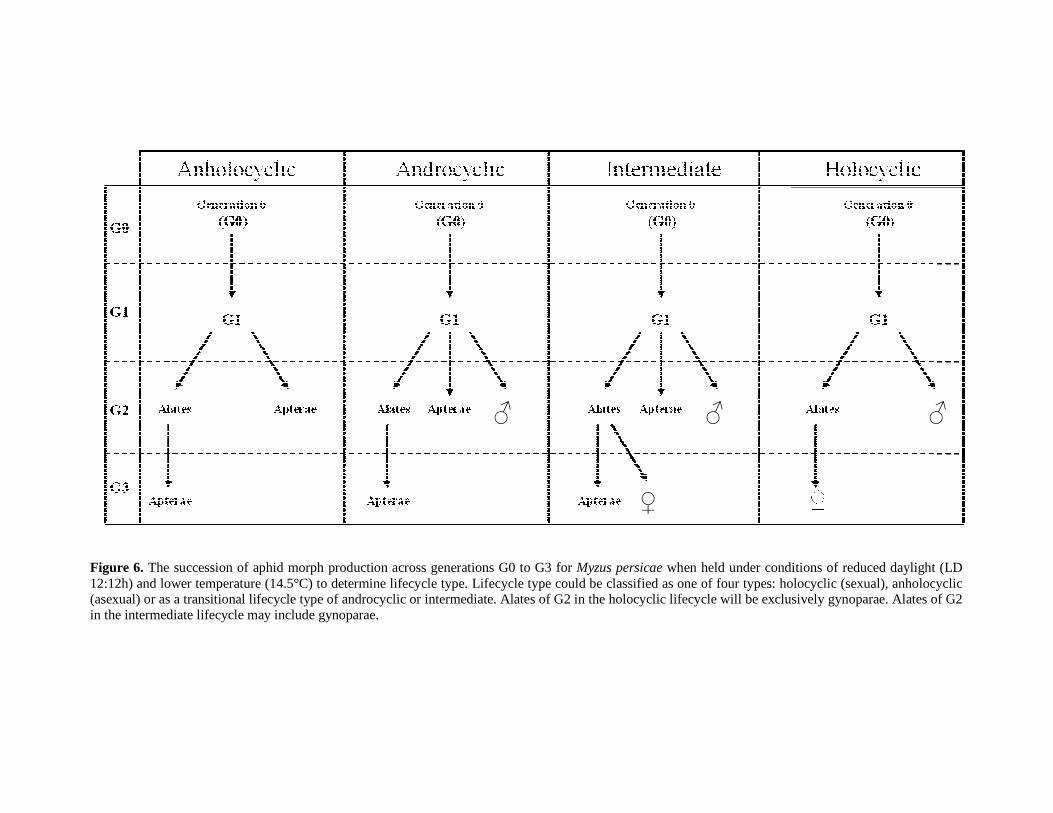
Figure 6. The succession of aphid morph production across generations G0 to G3 for Myzus persicae when held under conditions of reduced daylight (LD 12:12h) and lower temperature (14.5°C) to determine lifecycle type. Lifecycle type could be classified as one of four types: holocyclic (sexual), anholocyclic (asexual) or as a transitional lifecycle type of androcyclic or intermediate. Alates of G2 in the holocyclic lifecycle will be exclusively gynoparae. Alates of G2 in the intermediate lifecycle may include gynoparae.
♂ ♂ ♂
♀
40
3.1.3 Resistance type
All clones used in experiments were characterised for insecticide resistance mechanisms by
Rothamsted Research in Hertfordshire, England, using a method described in van Toor et al.
(2008). The level of carboxylesterase, conferring resistance to organophosphates and
carbamates, was measured using an esterase assay by absorbance at 450nm. Aphid clones
were then categorised as either susceptible (S), with medium resistance (R1), high resistance
(R2) or with extreme levels of resistance (R3). The presence of modified
acetylcholinesterase (MACE) was determined using a kinetic assay and scored as either
Mace or Non-Mace. Resistance to pyrethroids was determined via identification of Kdr and
s-kdr mutations using an allelic discrimination PCR assay on L1014F and M918T in the
voltage gated sodium channel protein (for more detailed information on all resistance typing
experiments see van Toor et al., 2008).
Information regarding genetic variability, lifecycle type and resistance type obtained from
the preliminary experiments discussed above are summarised in Table 2. Also presented is
information detailing location and dates of aphid collection, food plants from which the
aphids were collected and aphid colour morphs. In addition, Table 3 provides the detailed
results of microsatellite analysis from which clonal types were assigned.
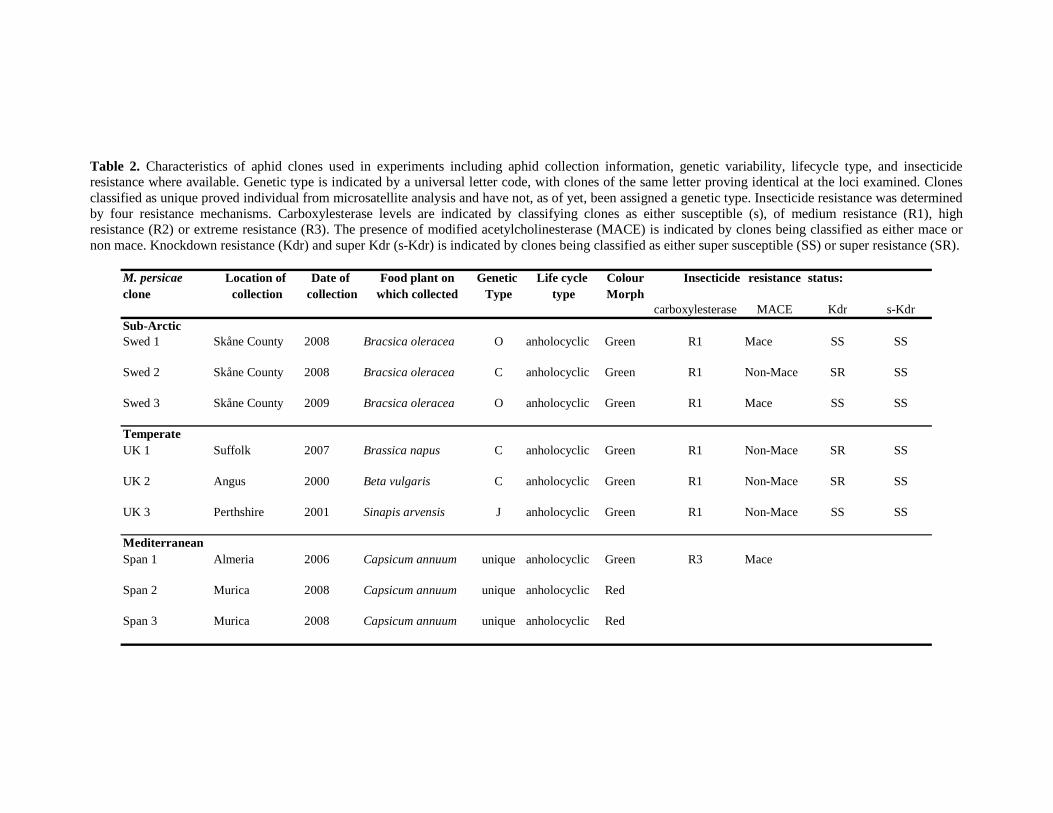
Table 2. Characteristics of aphid clones used in experiments including aphid collection information, genetic variability, lifecycle type, and insecticide resistance where available. Genetic type is indicated by a universal letter code, with clones of the same letter proving identical at the loci examined. Clones classified as unique proved individual from microsatellite analysis and have not, as of yet, been assigned a genetic type. Insecticide resistance was determined by four resistance mechanisms. Carboxylesterase levels are indicated by classifying clones as either susceptible (s), of medium resistance (R1), high resistance (R2) or extreme resistance (R3). The presence of modified acetylcholinesterase (MACE) is indicated by clones being classified as either mace or non mace. Knockdown resistance (Kdr) and super Kdr (s-Kdr) is indicated by clones being classified as either super susceptible (SS) or super resistance (SR).
M. persicae Location of Date of Food plant on Genetic Life cycle Colour Insecticide resistance status:
clone collection collection which collected Type type Morph
carboxylesterase MACE Kdr s-KdrSub-Arctic
Swed 1 Skåne County 2008 Bracsica oleracea O anholocyclic Green R1 Mace SS SS
Swed 2 Skåne County 2008 Bracsica oleracea C anholocyclic Green R1 Non-Mace SR SS
Swed 3 Skåne County 2009 Bracsica oleracea O anholocyclic Green R1 Mace SS SS
Temperate
UK 1 Suffolk 2007 Brassica napus C anholocyclic Green R1 Non-Mace SR SS
UK 2 Angus 2000 Beta vulgaris C anholocyclic Green R1 Non-Mace SR SS
UK 3 Perthshire 2001 Sinapis arvensis J anholocyclic Green R1 Non-Mace SS SS
Mediterranean
Span 1 Almeria 2006 Capsicum annuum unique anholocyclic Green R3 Mace
Span 2 Murica 2008 Capsicum annuum unique anholocyclic Red
Span 3 Murica 2008 Capsicum annuum unique anholocyclic Red
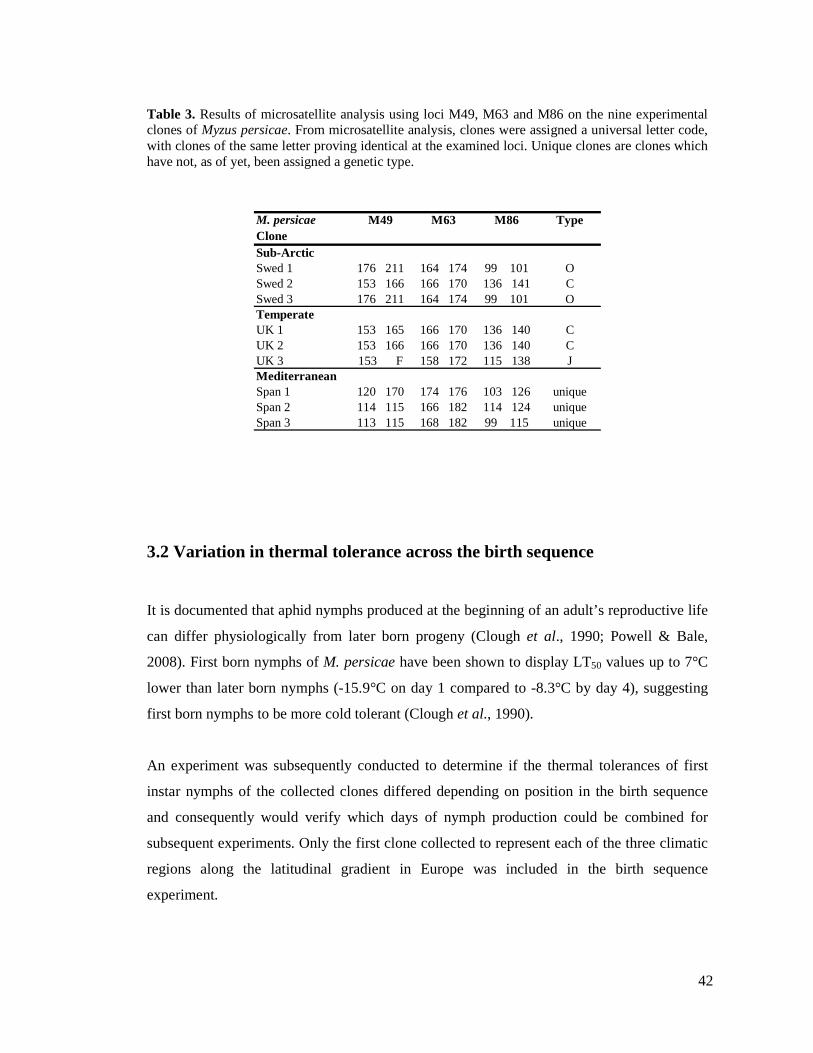
42
Table 3. Results of microsatellite analysis using loci M49, M63 and M86 on the nine experimental clones of Myzus persicae. From microsatellite analysis, clones were assigned a universal letter code, with clones of the same letter proving identical at the examined loci. Unique clones are clones which have not, as of yet, been assigned a genetic type.
M. persicae M49 M63 M86 Type
Clone
Sub-Arctic
Swed 1 176 211 164 174 99 101 OSwed 2 153 166 166 170 136 141 CSwed 3 176 211 164 174 99 101 OTemperate
UK 1 153 165 166 170 136 140 CUK 2 153 166 166 170 136 140 CUK 3 153 F 158 172 115 138 JMediterranean
Span 1 120 170 174 176 103 126 uniqueSpan 2 114 115 166 182 114 124 uniqueSpan 3 113 115 168 182 99 115 unique
3.2 Variation in thermal tolerance across the birth sequence
It is documented that aphid nymphs produced at the beginning of an adult’s reproductive life
can differ physiologically from later born progeny (Clough et al., 1990; Powell & Bale,
2008). First born nymphs of M. persicae have been shown to display LT50 values up to 7°C
lower than later born nymphs (-15.9°C on day 1 compared to -8.3°C by day 4), suggesting
first born nymphs to be more cold tolerant (Clough et al., 1990).
An experiment was subsequently conducted to determine if the thermal tolerances of first
instar nymphs of the collected clones differed depending on position in the birth sequence
and consequently would verify which days of nymph production could be combined for
subsequent experiments. Only the first clone collected to represent each of the three climatic
regions along the latitudinal gradient in Europe was included in the birth sequence
experiment.
43
First instar nymphs born within a 24h period were collected from the constant 20°C culture.
The nymphs were allowed to develop into newly moulted adults at densities of one aphid per
leaf. Harvesting the aphids in such a way synchronised the aphids to within 24h. On
development to adulthood, Blackman boxes were examined daily to determine when
reproduction commenced. Holding the aphids at densities of one per Blackman box enabled
accurate determination of the day in which individual aphids commenced reproduction. At
the onset of reproduction, the resultant nymphs were collected daily for each successive day
of the reproductive cycle and survival at selected temperature extremes determined.
Based on previous studies of M. persicae at Birmingham University, two temperatures were
selected that would result in considerable mortality at high and low temperatures: 41.75°C
and -12°C respectively. First instar nymphs were subjected to the exposure temperature
using an alcohol bath whilst held within Eppendorf tubes at densities of 10 nymphs per tube,
a method previously described in the general materials and methods. Six replicates of 10
aphids were used for each treatment. Nymphs were cooled or warmed to the predetermined
temperature at a rate of 0.5°C min-1 and then held at the selected temperature. At -12°C
nymphs were held for 30 min before being returned to the culture temperature of 20°C at
0.5°C min-1. At 41.75°C the nymphs were held for only 10 sec before returning to 20°C. The
decision to hold nymphs for 10 sec as opposed to 30 min at the high temperature exposures
was based on previous work in the Arthropod Ecophysiology Laboratory at the University of
Birmingham. The studies suggested that a brief exposure of 10 sec to high temperature
extremes was all that was required to achieve mortality values comparable to a longer
exposure duration of 30 min at low temperature (Hazell, unpublished data), based on the
time required for all aphids in the sample to experience the desired exposure temperature
(Piyaphongkul, unpublished data). A handling control was conducted each day for which 6
replicates of 10 aphids within Eppendorf tubes were set up. The control tubes were left at the
culture temperature for the duration of the exposure experiments. Following exposure,
nymphs were placed on recovery trays and mortality assessed after 72h.
Exposure to the high and low temperature plus a handling control was repeated using the
newly born nymphs produced on days 1,2,3,5 and 7 of the reproductive cycle. From this
experiment, fitness variation of newly born nymphs across the birth sequence could be
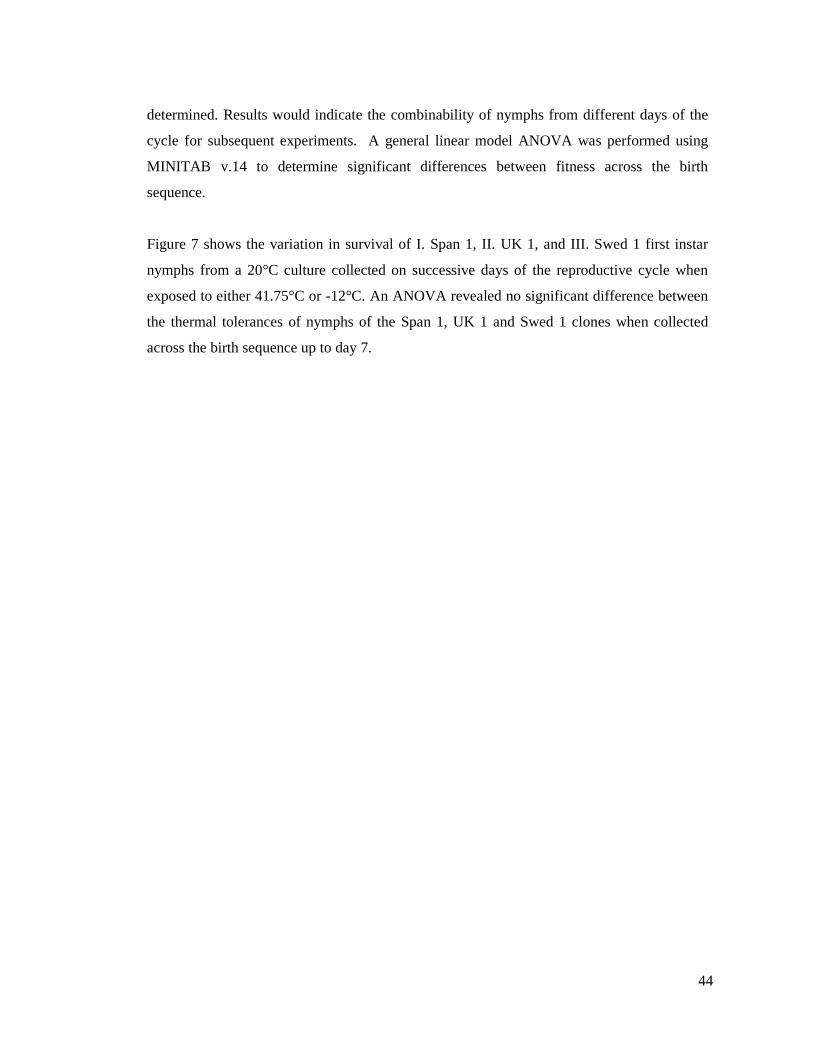
44
determined. Results would indicate the combinability of nymphs from different days of the
cycle for subsequent experiments. A general linear model ANOVA was performed using
MINITAB v.14 to determine significant differences between fitness across the birth
sequence.
Figure 7 shows the variation in survival of I. Span 1, II. UK 1, and III. Swed 1 first instar
nymphs from a 20°C culture collected on successive days of the reproductive cycle when
exposed to either 41.75°C or -12°C. An ANOVA revealed no significant difference between
the thermal tolerances of nymphs of the Span 1, UK 1 and Swed 1 clones when collected
across the birth sequence up to day 7.
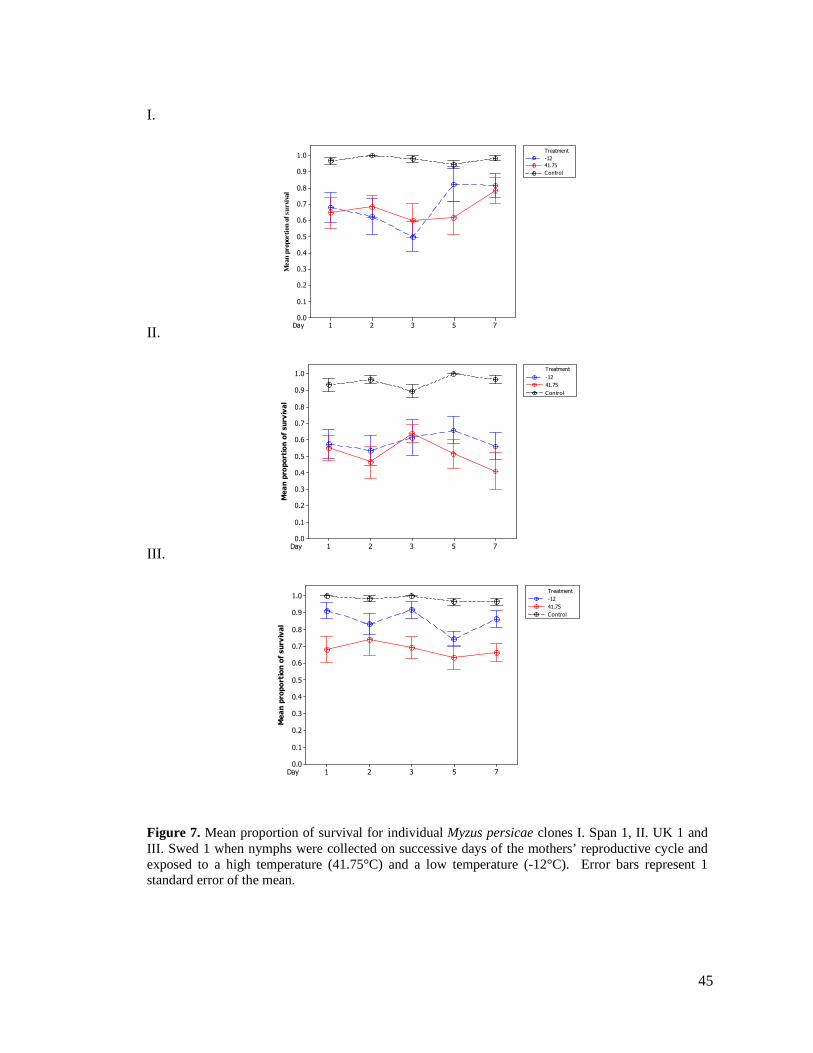
45
I.
II.
Mean
proporti
on
of
su
rvi
val
Day 75321
1.0
0.9
0.8
0.7
0.6
0.5
0.4
0.3
0.2
0.1
0.0
Treatment
Control
-12
41.75
III.
Mean proportion of survival
Day 75321
1.0
0.9
0.8
0.7
0.6
0.5
0.4
0.3
0.2
0.1
0.0
Treatment
Control
-12
41.75
Mean proportion of survival
Day 75321
1.0
0.9
0.8
0.7
0.6
0.5
0.4
0.3
0.2
0.1
0.0
Treatment
Control
-12
41.75
Figure 7. Mean proportion of survival for individual Myzus persicae clones I. Span 1, II. UK 1 and III. Swed 1 when nymphs were collected on successive days of the mothers’ reproductive cycle and exposed to a high temperature (41.75°C) and a low temperature (-12°C). Error bars represent 1 standard error of the mean.
46
The thermal tolerances of nymphs born of adults reared at 20°C did not significantly differ
across the birth sequence up to day 7 for clones Span 1, UK 1 and Swed 1, indicating that
nymphs from different reproductive adults and across different days of the reproductive
cycle could be combined for subsequent experiments. This supports recent studies on S.
avenae which revealed no significant difference between progeny born on differing days of
the birth sequence for adults maintained at 20°C (Powell & Bale, 2008). However,
differences between nymphal cold hardiness in S. avenae became apparent when acclimated
at 10°C, with first born nymphs proving to be significantly more cold tolerant that later born
nymphs (Powell & Bale, 2008). Powell & Bale (2008) suggest that, under winter conditions,
a reproducing aphid is unlikely to live long enough to fulfil its reproductive potential and it is
therefore advantageous to invest greater levels of resources at the beginning of the
reproductive cycle and produce the more cold tolerant progeny first, thus allowing the first
born nymphs to survive at low temperatures that could have killed the parents or later born
siblings (Powell & Bale, 2008). It was consequently decided that nymphs born on days 3-6
of the birth sequence would be used for all experiments to avoid the use of first born nymphs
and those born later in the reproductive cycle.
47
4 Effect of latitude and acclimation on the lethal temperatures of the
peach-potato aphid Myzus persicae
4.1 Summary
When Myzus persicae was acclimated at 10°C for one generation, the lower lethal
temperature was significantly depressed when compared to aphids reared at 20°C (from a
mean of -12.3°C to -14.3°C). Additional acclimation over three generations did not further
increase cold tolerance, with intergenerational acclimation significantly depressing LLT50 in
only three out of the nine clones (Span 1 from -14.8°C to -16.4°C, Span 2 from -12.9°C to
-14.8°C and Swed 1 from -14.1°C to -16.7°C). Cold tolerance was lost following one
generation at 25°C when compared to 20°C rearing, leading to a significant increase in
LLT50 (from a mean of -12.3°C to -11.2°C). Additional acclimation over three generations
did not further decrease cold tolerance with the only significant increase in LLT50 being
observed for Swed 2 (from -11.3°C to -10.9°C).
The ULT50 of M. persicae proved less plastic than LLT50, although could be significantly
increased in all nine clones after one generation at 25°C, resulting in an increase in heat
tolerance (from a mean of 41.8°C to 42.1°C). Low temperature acclimation also significantly
increased heat tolerance, raising the ULT50 of five out of the nine clones following one
generation at 10°C and in seven of the nine clones after three generations at 10°C.
Due to greater plasticity in ULT50, thermal tolerance ranges were expanded following low
temperature acclimation and contracted following high temperature acclimation. This
resulted in aphids reared at 10°C surviving over a temperature range approximately 2°C to
6°C greater than aphids reared at 25°C. There was no clear relationship between lethal
temperature thresholds and latitude.
48
4.2 Introduction
Temperature is the most important abiotic factor affecting aphid physiology. Due to a limited
ability to regulate body temperature above or below ambient, severity of winter conditions
greatly influences aphid survival, with implications for resultant spring populations and
potential pest outbreaks (Walters & Dewar, 1986; Harrington et al., 1990; Cocu et al., 2005).
Furthering our understanding of aphid thermal biology and elucidating the interactions
between their cold tolerance and winter severity with the implications for pest control has
become a primary focus of recent research on aphids.
It is known that aphids including Sitobion avenae, Myzus persicae and Aphis fabae freeze at
low sub-zero temperatures, with supercooling points of around -25°C (Knight et al., 1986;
Bale, 1987; Bale et al., 1988). With the exception of enabling classification of insect cold
tolerance (Salt, 1961; reclassification by Bale, 1993a, 1996; Sinclair, 1999), supercooling
points are somewhat ecologically irrelevant when studying aphid thermal biology due to
aphids experiencing high levels of pre-freeze mortality, and are therefore used more as a
theoretical limit (Knight, 1987). Lethal temperatures such as the LLT50 (the low temperature
which results in 50% mortality of an experimental population) have consequently received
much attention in recent years due to providing, not only more ecologically relevant
information, but enabling a reference point to study variation and plasticity of aphid thermal
tolerance (Powell & Bale, 2008; Hazell et al., 2010a).
Aphid biology contrasts to the majority of insects due to a succession of functionally distinct
morphs being produced throughout the year. As a consequence of short generation times, an
aphid at the onset of winter is unlikely to survive to the following spring. This led Powell &
Bale (2004, 2008) to conclude that seasonal cold hardening is less important in aphids and
that short term acclimation plays a greater role in thermal tolerance. Data concerning a single
clone of S. avenae supported this statement, with the LLT50 declining from -8.5°C when
reared at 20°C to -13.6°C after acclimation to 10°C for one generation and further again to
-16.4°C after acclimation to 10°C for three generations (Powell & Bale, 2008). Due to the
phenomenon known as ‘telescoping of generations’ whereby an aphid begins development
within its grandmother (Kindlmann & Dixon, 1989), an aphid has the potential to begin the
49
acclimation process prior to birth and consequently gain thermal tolerance with each
successive generation.
Lower thermal limits play an important role in determining aphid distribution and
abundance. However, with average temperature increasing, many species are exhibiting
range expansions as low temperature limits are elevated (Cannon, 1998; Parmesan, 1999;
Thomas and Lennon, 1999; Battisti et al., 2005; Musolin, 2007). It is suggested that
increasing temperatures, in conjunction with a rise in heat wave incidence, could lead to an
increase in the importance of upper thermal limits in determining species distribution and
abundance (Hazell et al., 2010b). In addition to increasing the knowledge baseline regarding
upper thermal limits, understanding how thermal biology varies with latitude is also integral
to predicting how insect populations will be affected by climate change and has provided the
focus for a number of recent studies (e.g. Addo-Bediako et al., 2000; Gibert & Huey, 2001;
Chen & Kang, 2004; Bahrndorff et al., 2006, 2009a). For such an agriculturally important
pest species as M. persicae with an extensive worldwide distribution, it is surprising that
research into variation in thermal biology along its latitudinal distribution is lacking.
This study aims to provide a detailed investigation into the lower and upper lethal
temperatures of M. persicae. As highlighted in Hazell et al. (2010b), few studies to date have
considered the effect of extreme high temperatures on insect populations. In this chapter,
experiments designed to investigate the variation in the ULT50 and LLT50 of nine clones
collected along a latitudinal gradient in Europe are detailed. The levels of intra and
intergenerational plasticity following low (10°C) and high (25°C) temperature acclimation
are determined, in addition to geographic variation in aphid thermal tolerance.
4.3 Materials and methods
The nine experimental clones of M. persicae were kept as a stock culture at 20°C. First instar
nymphs (less than 24h old) were taken from the stock culture and acclimated at either 10°C
or 25°C for one or three generations prior to use of their offspring in experiments, as detailed
50
in the general materials and methods chapter. All nymphs used in experiments were first
instars.
4.3.1 Determining the lethal temperature (LLT50 and ULT50)
To determine the lower and upper LT50 , first instar nymphs were exposed to a range of low
temperatures (-9, -10, -11, -12, -13, -14, -15, -16, -17 and -18°C) and a range of high
temperatures (41.25, 41.50, 41.75, 42.00, 42.25, 42.50, 42.75 and 43.00°C). The
temperatures selected to determine the LLT50 increased at intervals of 1°C as opposed to
0.25°C when determining the ULT50 due to the range over which 0 to 100% mortality occurs
at high temperature being relatively compressed.
For each temperature treatment 60 first instar nymphs were collected and placed within
plastic 0.5ml Eppendorf tubes to produce 6 replicates of 10 aphids. The nymphs were placed
within an alcohol bath programmed to the desired temperature as described in the general
materials and methods. Nymphs within the alcohol bath were cooled or heated from their
culture temperature to the pre-determined exposure temperatures at a rate of 0.5°C min-1. On
reaching the desired temperature, nymphs were held at the low exposure temperatures (-9 to
-18°C) for 30 min and at the high exposure temperatures (41.25 to 43.00°C) for 10 sec.
These exposure temperatures were selected on the basis of preliminary experiments that
indicated the times required for all aphids in the sample to experience the desired exposure
temperatures i.e. there is a time lag between the temperature of the circulating fluid in the
alcohol bath and the loss or gain in temperature of the aphids. Following the exposure
duration, nymphs were returned to their culture temperature at a rate of 0.5°C min-1. Nymphs
were subsequently transferred to recovery trays and allowed to recover at their culture
temperature (10°C, 20°C or 25°C). Survival was assessed 72h after exposure. The procedure
was repeated for each exposure temperature. LLT50 and ULT50 values were obtained for all
M. persicae clones held at each of the five acclimation treatments (i.e. constant 20°C and
10°C and 25°C for one and three generations). A handling control was set up for each
treatment/day of experiments as detailed above with the exception of the aphids being kept at
acclimation temperature for the duration of the experiment.
51
On obtaining values for the proportion of aphid survival at each exposure temperature, a
graph of survival against exposure temperature was produced, displaying a typical sigmoidal
dosage-mortality curve. From the resultant data, the temperature resulting in 50% mortality
(the LT50) was determined for the high and low exposure temperatures using Probit analysis
in MINITAB 15. Probit transformations act to linearise sigmoidal curves, allowing more
accurate estimation of the LT50 temperature. Figure 8 displays example graphs illustrating
the probit transformations from the sigmoidal graph of raw data (8I) to the linearised Probit
graph (8II). Handling controls resulted in approximately 99% survival across all treatments.
The natural response rate was therefore assumed to be close to zero and not included in the
model (Hazell et al., 2010a). Significant differences in mortality were identified by non-
overlapping 95% fiducial limits (Hart et al., 2002; Hughes et al., 2009).
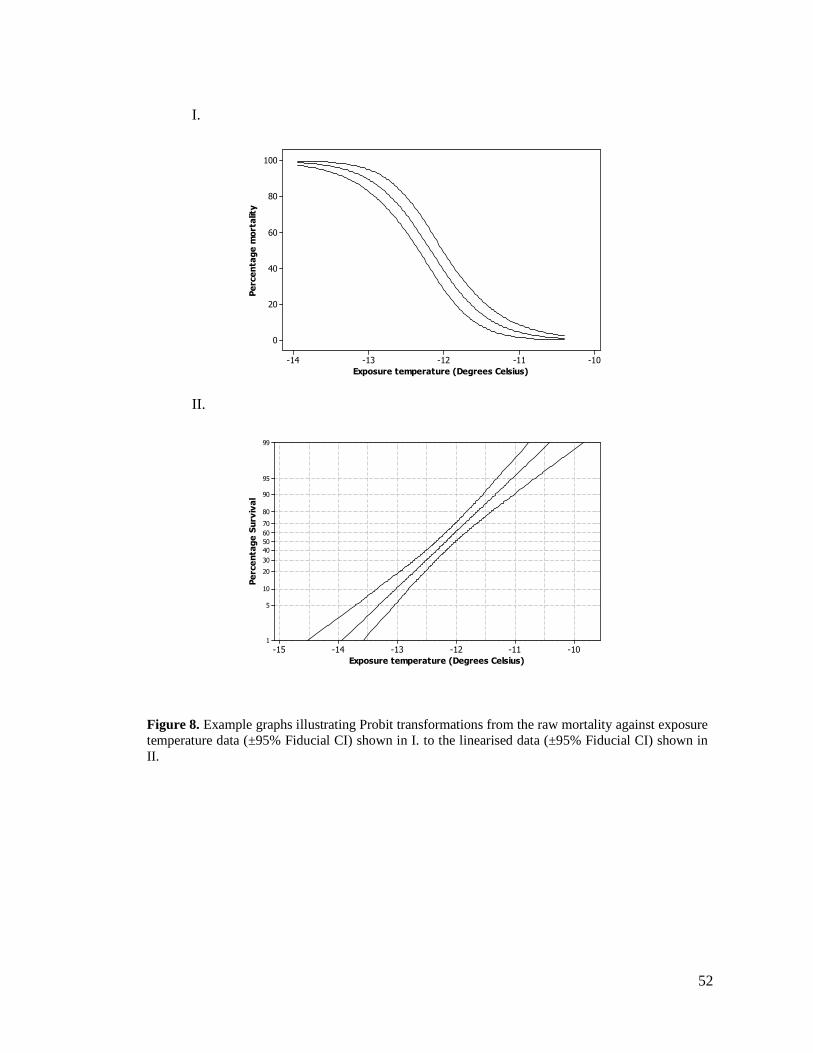
52
I.
Exposure temperature (Degrees Celsius)
Percentage mortality
-10-11-12-13-14
100
80
60
40
20
0
II.
Exposure temperature (Degrees Celsius)
Percentage Survival
-10-11-12-13-14-15
99
95
90
80
70
60
50
40
30
20
10
5
1
Figure 8. Example graphs illustrating Probit transformations from the raw mortality against exposure temperature data (±95% Fiducial CI) shown in I. to the linearised data (±95% Fiducial CI) shown in II.
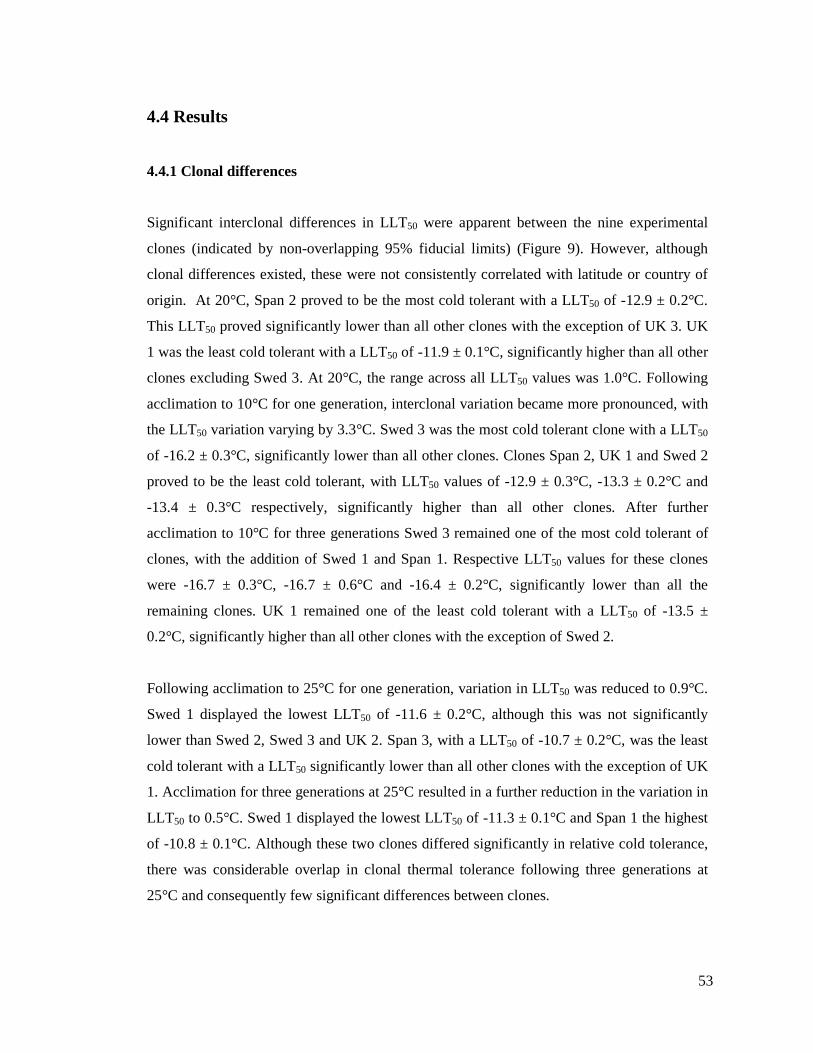
53
4.4 Results
4.4.1 Clonal differences
Significant interclonal differences in LLT50 were apparent between the nine experimental
clones (indicated by non-overlapping 95% fiducial limits) (Figure 9). However, although
clonal differences existed, these were not consistently correlated with latitude or country of
origin. At 20°C, Span 2 proved to be the most cold tolerant with a LLT50 of -12.9 ± 0.2°C.
This LLT50 proved significantly lower than all other clones with the exception of UK 3. UK
1 was the least cold tolerant with a LLT50 of -11.9 ± 0.1°C, significantly higher than all other
clones excluding Swed 3. At 20°C, the range across all LLT50 values was 1.0°C. Following
acclimation to 10°C for one generation, interclonal variation became more pronounced, with
the LLT50 variation varying by 3.3°C. Swed 3 was the most cold tolerant clone with a LLT50
of -16.2 ± 0.3°C, significantly lower than all other clones. Clones Span 2, UK 1 and Swed 2
proved to be the least cold tolerant, with LLT50 values of -12.9 ± 0.3°C, -13.3 ± 0.2°C and
-13.4 ± 0.3°C respectively, significantly higher than all other clones. After further
acclimation to 10°C for three generations Swed 3 remained one of the most cold tolerant of
clones, with the addition of Swed 1 and Span 1. Respective LLT50 values for these clones
were -16.7 ± 0.3°C, -16.7 ± 0.6°C and -16.4 ± 0.2°C, significantly lower than all the
remaining clones. UK 1 remained one of the least cold tolerant with a LLT50 of -13.5 ±
0.2°C, significantly higher than all other clones with the exception of Swed 2.
Following acclimation to 25°C for one generation, variation in LLT50 was reduced to 0.9°C.
Swed 1 displayed the lowest LLT50 of -11.6 ± 0.2°C, although this was not significantly
lower than Swed 2, Swed 3 and UK 2. Span 3, with a LLT50 of -10.7 ± 0.2°C, was the least
cold tolerant with a LLT50 significantly lower than all other clones with the exception of UK
1. Acclimation for three generations at 25°C resulted in a further reduction in the variation in
LLT50 to 0.5°C. Swed 1 displayed the lowest LLT50 of -11.3 ± 0.1°C and Span 1 the highest
of -10.8 ± 0.1°C. Although these two clones differed significantly in relative cold tolerance,
there was considerable overlap in clonal thermal tolerance following three generations at
25°C and consequently few significant differences between clones.
54
No consistent relationship between LLT50 and latitude was evident. However, UK 1 was one
of the least cold tolerant of clones across all treatments. Following low temperature
acclimation to 10°C clones Span 1 and Swed 3 were consistently among some of the most
cold tolerant of clones. Following high temperature acclimation to 25°C Span 3 was
consistently one of the least cold tolerant of clones and Swed 1 one of the most cold tolerant.
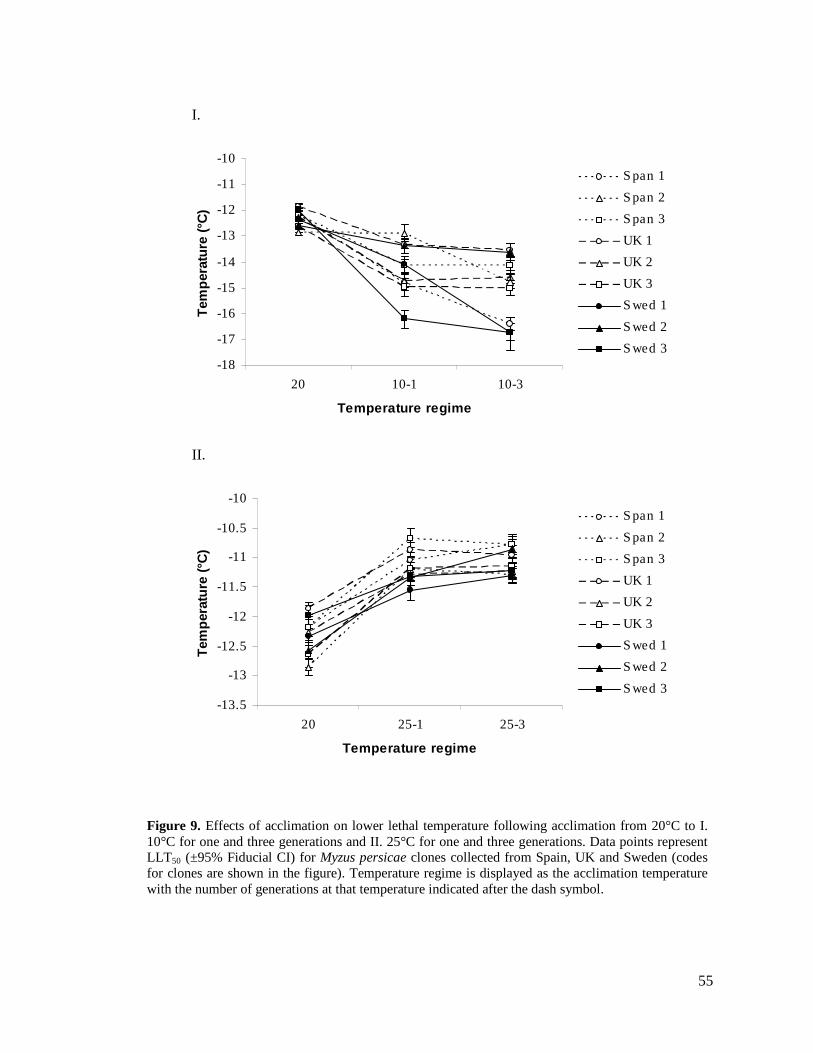
55
I.
-18
-17
-16
-15
-14
-13
-12
-11
-10
20 10-1 10-3
Temperature regime
Tem
pera
ture
(°C
)
Span 1
Span 2
Span 3
UK 1
UK 2
UK 3
Swed 1
Swed 2
Swed 3
II.
-13.5
-13
-12.5
-12
-11.5
-11
-10.5
-10
20 25-1 25-3
Temperature regime
Tem
pera
ture
(°C
)
Span 1
Span 2
Span 3
UK 1
UK 2
UK 3
Swed 1
Swed 2
Swed 3
Figure 9. Effects of acclimation on lower lethal temperature following acclimation from 20°C to I. 10°C for one and three generations and II. 25°C for one and three generations. Data points represent LLT50 (±95% Fiducial CI) for Myzus persicae clones collected from Spain, UK and Sweden (codes for clones are shown in the figure). Temperature regime is displayed as the acclimation temperature with the number of generations at that temperature indicated after the dash symbol.
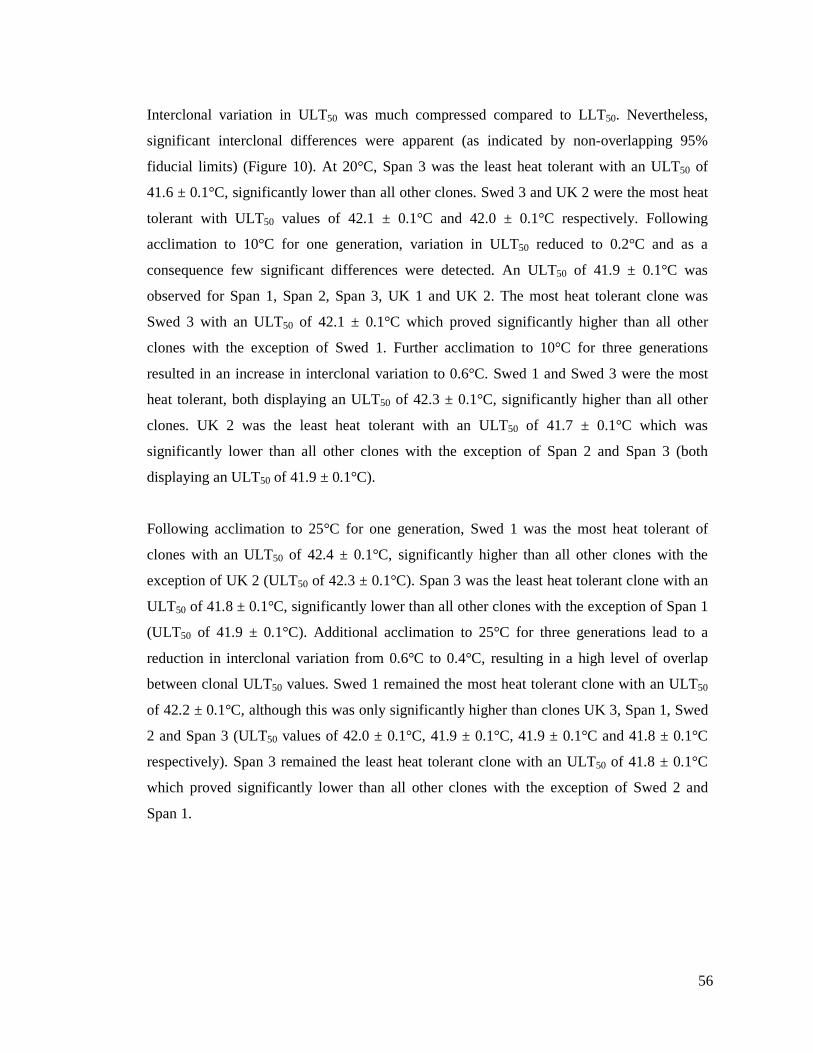
56
Interclonal variation in ULT50 was much compressed compared to LLT50. Nevertheless,
significant interclonal differences were apparent (as indicated by non-overlapping 95%
fiducial limits) (Figure 10). At 20°C, Span 3 was the least heat tolerant with an ULT50 of
41.6 ± 0.1°C, significantly lower than all other clones. Swed 3 and UK 2 were the most heat
tolerant with ULT50 values of 42.1 ± 0.1°C and 42.0 ± 0.1°C respectively. Following
acclimation to 10°C for one generation, variation in ULT50 reduced to 0.2°C and as a
consequence few significant differences were detected. An ULT50 of 41.9 ± 0.1°C was
observed for Span 1, Span 2, Span 3, UK 1 and UK 2. The most heat tolerant clone was
Swed 3 with an ULT50 of 42.1 ± 0.1°C which proved significantly higher than all other
clones with the exception of Swed 1. Further acclimation to 10°C for three generations
resulted in an increase in interclonal variation to 0.6°C. Swed 1 and Swed 3 were the most
heat tolerant, both displaying an ULT50 of 42.3 ± 0.1°C, significantly higher than all other
clones. UK 2 was the least heat tolerant with an ULT50 of 41.7 ± 0.1°C which was
significantly lower than all other clones with the exception of Span 2 and Span 3 (both
displaying an ULT50 of 41.9 ± 0.1°C).
Following acclimation to 25°C for one generation, Swed 1 was the most heat tolerant of
clones with an ULT50 of 42.4 ± 0.1°C, significantly higher than all other clones with the
exception of UK 2 (ULT50 of 42.3 ± 0.1°C). Span 3 was the least heat tolerant clone with an
ULT50 of 41.8 ± 0.1°C, significantly lower than all other clones with the exception of Span 1
(ULT50 of 41.9 ± 0.1°C). Additional acclimation to 25°C for three generations lead to a
reduction in interclonal variation from 0.6°C to 0.4°C, resulting in a high level of overlap
between clonal ULT50 values. Swed 1 remained the most heat tolerant clone with an ULT50
of 42.2 ± 0.1°C, although this was only significantly higher than clones UK 3, Span 1, Swed
2 and Span 3 (ULT50 values of 42.0 ± 0.1°C, 41.9 ± 0.1°C, 41.9 ± 0.1°C and 41.8 ± 0.1°C
respectively). Span 3 remained the least heat tolerant clone with an ULT50 of 41.8 ± 0.1°C
which proved significantly lower than all other clones with the exception of Swed 2 and
Span 1.
57
I.
41.5
41.75
42
42.25
42.5
20 10-1 10-3
Temperature regime
Tem
pera
ture
(°C
)
Span 1
Span 2
Span 3
UK 1
UK 2
UK 3
Swed 1
Swed 2
Swed 3
II.
41.5
41.75
42
42.25
42.5
20 25-1 25-3
Temperature regime
Tem
pera
ture
(°C
)
Span 1
Span 2
Span 3
UK 1
UK 2
UK 3
Swed 1
Swed 2
Swed 3
Figure 10. Effects of acclimation on upper lethal temperature following acclimation from 20°C to I. 10°C for one and three generations and II. 25°C for one and three generations. Data points represent ULT50 (±95% Fiducial CI) for Myzus persicae clones collected from Spain, UK and Sweden (codes for clones are shown in the figure). Temperature regime is displayed as the acclimation temperature with the number of generations at that temperature indicated after the dash symbol.
58
As with LLT50, a consistent relationship between ULT50 and latitude was not apparent.
Following high temperature acclimation to 25°C, clones Span 3 and Span 1 were consistently
the least heat tolerant of clones and Swed 1 and UK 2 the most heat tolerant of clones.
Following low temperature acclimation to 10°C, only Swed 3 displayed a constant trend with
acclimation treatment, proving to be consistently the most heat tolerant.
4.4.2 Acclimation
The LLT50 of M. persicae clones was significantly depressed following acclimation to 10°C
for one generation leading to increased cold tolerance. However, cold tolerance was lost on
acclimation to 25°C causing a significant rise in LLT50 (as indicated by non-overlapping
95% fiducial limits) (Figure 9).
All clones, with the exception of Span 2 where no change was observed, were significantly
more cold hardy following acclimation to 10°C for one generation when compared to the
culture temperature of 20°C. The largest effect of acclimation was observed for Swed 3, with
LLT50 decreasing by 4.2° from -12.0 ± 0.2°C at 20°C to -16.2 ± 0.3°C at 10°C. For the
remaining clones where LLT50 significantly decreased, reductions ranged from 0.8°C (for
Swed 2) to 2.6°C (for Span 1). Further acclimation to 10°C for three generations failed to
further significantly increase cold tolerance in all but three clones. The LLT50 of Span 2,
although the only clone not to display a significant reduction in LLT50 following one
generation at 10°C, did show a significant reduction when acclimated for three generations;
LLT50 decreased by 1.9°C from -12.9 ± 0.3°C to -14.8 ± 0.3°C. Swed 1 and Span 1 displayed
a further decrease in LLT50 taking their respective LLT50 values down to -16.7 ± 0.3°C and
-16.4 ± 0.2°C, corresponding to a reduction of 2.6°C and 1.6°C respectively.
Acclimation to 25°C resulted in a significant loss in cold tolerance for all clones. Increases in
LLT50, when compared to respective values obtained at 20°C, ranged from 0.7°C for Swed 3,
which resulted in a LLT50 of -11.3 ± 0.2°C, to -1.7°C for Span 2, which resulted in an LLT50
of -11.2 ± 0.1°C. Further acclimation to 25°C for three generations failed to reduce cold
tolerance significantly further in all clones excluding Swed 2. Swed 2 experienced a
59
significant increase in LLT50 of 0.4°C, increasing LLT50 from -11.3 ± 0.1°C following one
generation at 25°C to -10.9 ± 0.2°C after generations at 25°C.
The effects of acclimation on ULT50 were much compressed compared to LLT50, with
variation between treatments being less than 1°C. Despite this reduced between-treatment
variation, the ULT50 of M. persicae could still be significantly increased following high
temperature acclimation to 25°C for one generation, leading to an increase in clonal heat
tolerance (as indicated by non-overlapping 95% fiducial limits). Heat tolerance also
significantly increased in 5 of the 9 clones following acclimation to 10°C for one generation,
and in 7 of the 9 clones by three generations at 10°C (Figure 10).
Acclimation to 25°C for one generation resulted in a significant increase in heat tolerance for
all clones with the exception of Swed 3 where no change was recorded. Significant increases
in ULT50 ranged from 0.1°C in Span 1, increasing ULT50 from 41.8 ± 0.1°C to 41.9 ± 0.1°C,
to 0.6°C for Swed 1, increasing ULT50 from 41.8 ± 0.1°C to 42.4 ± 0.1°C. Further
acclimation for three generations at 25°C resulted in a further significant increase in heat
tolerance for UK 1, with ULT50 increasing from 42.1 ± 0.1°C to 42.2 ± 0.1°C. However, for
clones UK 3, Swed 1 and Swed 2, a significant decrease in ULT50 was observed of 0.2°C,
reducing ULT50 to 42.0 ± 0.1°C, 42.2 ± 0.1°C and 41.9 ± 0.1°C respectively following
acclimation over three generations at 25°C.
Low temperature acclimation to 10°C for one generation, rather counter intuitively, acted to
increase heat tolerance in the majority of clones and significantly so in five clones: Span 1,
Span 3, UK 1, Swed 1 and Swed 2. Increases in ULT50 ranged from 0.1°C for Span 1, raising
ULT50 from 41.8 ± 0.1°C to 41.9 ± 0.1°C, to 0.3°C for Swed 1, increasing ULT50 from 41.8
± 0.1°C to 42.1 ± 0.1°C. For the majority of clones, further acclimation for three generations
at 10°C did not significantly alter ULT50. However, for clones UK 1, Swed 1 and Swed 3,
additional acclimation resulted in a further significant increase in ULT50. The ULT50 of UK 1
increased from 41.9 ± 0.1°C to 42.1 ± 0.1°C, the same level of heat tolerance gained after
three generations at 25°C. The ULT50 of clones Swed 1 and Swed 3 increased to 42.3 ±
0.1°C, conferring greater levels of heat tolerance than when acclimated at 25°C.
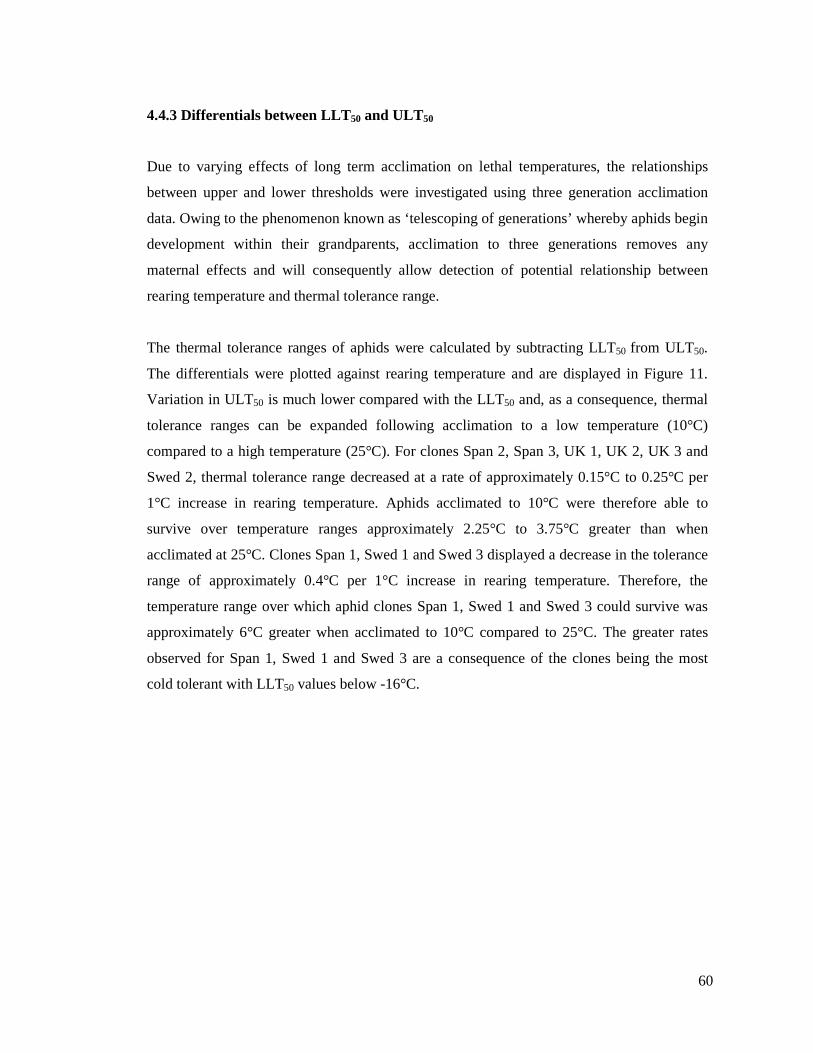
60
4.4.3 Differentials between LLT50 and ULT50
Due to varying effects of long term acclimation on lethal temperatures, the relationships
between upper and lower thresholds were investigated using three generation acclimation
data. Owing to the phenomenon known as ‘telescoping of generations’ whereby aphids begin
development within their grandparents, acclimation to three generations removes any
maternal effects and will consequently allow detection of potential relationship between
rearing temperature and thermal tolerance range.
The thermal tolerance ranges of aphids were calculated by subtracting LLT50 from ULT50.
The differentials were plotted against rearing temperature and are displayed in Figure 11.
Variation in ULT50 is much lower compared with the LLT50 and, as a consequence, thermal
tolerance ranges can be expanded following acclimation to a low temperature (10°C)
compared to a high temperature (25°C). For clones Span 2, Span 3, UK 1, UK 2, UK 3 and
Swed 2, thermal tolerance range decreased at a rate of approximately 0.15°C to 0.25°C per
1°C increase in rearing temperature. Aphids acclimated to 10°C were therefore able to
survive over temperature ranges approximately 2.25°C to 3.75°C greater than when
acclimated at 25°C. Clones Span 1, Swed 1 and Swed 3 displayed a decrease in the tolerance
range of approximately 0.4°C per 1°C increase in rearing temperature. Therefore, the
temperature range over which aphid clones Span 1, Swed 1 and Swed 3 could survive was
approximately 6°C greater when acclimated to 10°C compared to 25°C. The greater rates
observed for Span 1, Swed 1 and Swed 3 are a consequence of the clones being the most
cold tolerant with LLT50 values below -16°C.
61
Rearing temperature (°C)
ULT50 minus LLT50 (°C)
262422201816141210
60
59
58
57
56
55
54
53
52
Clone
Span 3
Swed 1
Swed 2
Swed 3
UK 1
UK 2
UK 3
Span 1
Span 2
Figure 11. ULT50 minus LLT50 plotted against rearing temperature for Myzus persicae clones collected from Spain, UK and Sweden (codes for clones are shown in the figure). Lines were fitted using the regression fitting procedure in Minitab 15.
4.5 Discussion
In this chapter, the results of experiments designed to study the variation and plasticity of
lethal temperatures of Myzus persicae clones from various latitudes in Europe are presented.
The aims of the experiments were to: 1. Determine the level of plasticity in aphid lethal
temperature thresholds and to elucidate how the traits are affected by rearing temperature. 2.
Establish if lethal temperature thresholds are related to latitude. 3. Investigate relationships
between the upper and lower lethal temperatures and variation in the thermal tolerance
ranges with rearing temperature.
62
4.5.1 Plasticity of lethal temperatures
In the event of climate change, the level of plasticity in the lethal temperature thresholds of
M. persicae will have profound implications for how the species will be affected. Failure to
adapt will ultimately result in changes to mortality, impacting species abundance,
distribution and pest status. The current study confirms that lethal temperature thresholds of
M. persicae are not fixed traits and can be altered following acclimation at low (10°C) or
high temperatures (25°C). Cold tolerance could be increased following acclimation at low
temperature, with one generation at 10°C being sufficient to significantly decrease LLT50
(reductions in LLT50 ranged from 0.8°C to 4.2°C), indicating a level of phenotypic plasticity
within a single generation.
Aphids are atypical in the insect world due to having telescoping of generations. This means
that a viviparous, parthenogenetically reproducing female aphid has within her developing
daughters, which in turn have their daughters developing inside them. As a consequence,
aphids begin development within their grandmothers (Kindlmann & Dixon, 1989). For that
reason, an aphid can, in theory, begin acclimation prior to birth and progressively increase
levels of acclimation with each subsequent generation (Hazell et al., 2010a). This was
supported by data collected on S. avenae whereby cold tolerance increased with each
successive generation at 10°C (LLT50 declined from -8.5°C when reared at 20°C to -13.6°C
after one generation at 10°C, to -15.0°C after two generations, and to -16.4°C after three
generations) (Powell & Bale, 2008). Due to the short generation time of aphids, this short
term acclimation, allowing a very rapid response to a change in temperature, was proposed to
be of much greater importance to aphid species than long term acclimation processes. Powell
and Bale (2008) state that the ability to respond rapidly to sudden changes in temperature
(i.e. single generation acclimation) and the capacity to increase cold tolerance throughout
successive generations to track the declining environmental temperatures experienced from
summer to winter (i.e. intergenerational acclimation) are vital to the winter survival of
anholocyclic (asexual) aphids. The current study confirms that M. persicae is capable of
rapid acclimation within a single generation. However, data do not support consistent
intergenerational acclimation. Further acclimation to three generations at 10°C acted to
significantly reduce LLT50 further in only three of the nine experimental clones, emphasising
63
that aphid cold tolerance differs between clones, and also explaining how previous studies on
single clones (Clough et al., 1990; Powell & Bale, 2008) observed changes in cold hardiness
over successive generations when aphids were maintained in an acclimation regime.
M. persicae could rapidly respond to declining temperatures with increasing cold tolerance.
However, cold tolerance was lost following acclimation at high temperatures (25°C). One
generation at 25°C caused a reduction in LLT50 ranging between 0.7°C to 1.7°C when
compared to results obtained at 20°C. A rapid loss of acquired cold tolerance would be
expected given that resource investment in maintaining unnecessary cold tolerance on
cessation of winter temperatures is of little benefit. Detrimental effects have been associated
with mechanisms of heat tolerance, with induced heat shock proteins causing a reduction in
cell growth rate (Feder et al., 1992). It is plausible that investment of resources in
unnecessary low temperature protection could lead to ecological costs in the form of reduced
development, longevity and fecundity. Natural selection is unlikely to favour unnecessary
thermal tolerance and as a consequence, on cessation of winter temperatures, any cold
tolerance acquired should be lost, as is evident in the current study. Additional acclimation
over three generations did not lead to any further significant loss in cold tolerance in all but
one of the nine experimental clones, once again suggesting a lack of intergenerational
acclimation in M. persicae.
In addition to the acquisition of cold tolerance, data suggest that M. persicae can gain heat
tolerance in a similar way following acclimation at high temperatures. Although less
responsive than LLT50, ULT50 could still be significantly raised following one generation at
25°C, leading to increased clonal heat tolerance (increases in ULT50 ranged between 0.1°C
and 0.6°C). Interestingly, heat tolerance was also increased following acclimation at 10°C,
significantly increasing ULT50 in five of the nine experimental clones after one generation
and in seven out of the nine clones by three generations when compared to data collected at
20°C (increases in ULT50 ranged between 0.1°C and 0.5°C). This observation would suggest
that the physiological process involved in conferring heat tolerance is also induced at low
temperatures. Exposure to a heat stress results in the up-regulation of heat shock proteins
(Feder et al., 1992; Sørensen et al., 2003; Bahrndorff et al., 2009b). These heat shock
proteins, the most common of which is Hsp70, aid survival at unfavourably high
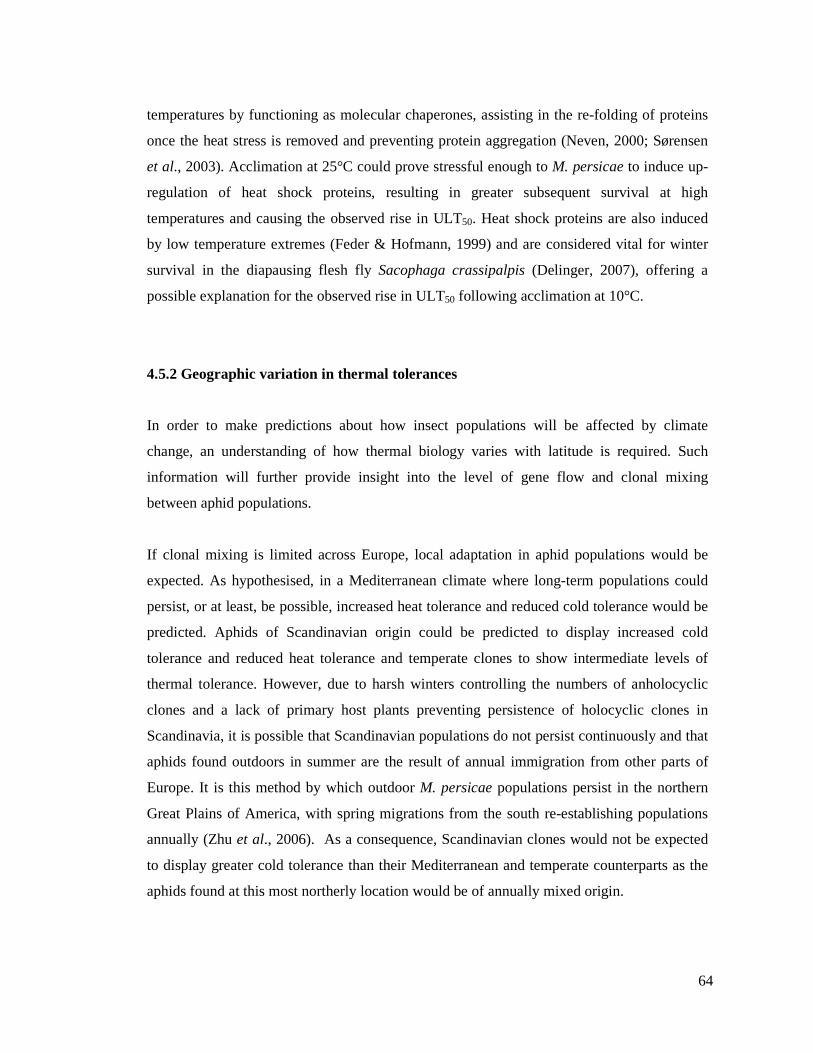
64
temperatures by functioning as molecular chaperones, assisting in the re-folding of proteins
once the heat stress is removed and preventing protein aggregation (Neven, 2000; Sørensen
et al., 2003). Acclimation at 25°C could prove stressful enough to M. persicae to induce up-
regulation of heat shock proteins, resulting in greater subsequent survival at high
temperatures and causing the observed rise in ULT50. Heat shock proteins are also induced
by low temperature extremes (Feder & Hofmann, 1999) and are considered vital for winter
survival in the diapausing flesh fly Sacophaga crassipalpis (Delinger, 2007), offering a
possible explanation for the observed rise in ULT50 following acclimation at 10°C.
4.5.2 Geographic variation in thermal tolerances
In order to make predictions about how insect populations will be affected by climate
change, an understanding of how thermal biology varies with latitude is required. Such
information will further provide insight into the level of gene flow and clonal mixing
between aphid populations.
If clonal mixing is limited across Europe, local adaptation in aphid populations would be
expected. As hypothesised, in a Mediterranean climate where long-term populations could
persist, or at least, be possible, increased heat tolerance and reduced cold tolerance would be
predicted. Aphids of Scandinavian origin could be predicted to display increased cold
tolerance and reduced heat tolerance and temperate clones to show intermediate levels of
thermal tolerance. However, due to harsh winters controlling the numbers of anholocyclic
clones and a lack of primary host plants preventing persistence of holocyclic clones in
Scandinavia, it is possible that Scandinavian populations do not persist continuously and that
aphids found outdoors in summer are the result of annual immigration from other parts of
Europe. It is this method by which outdoor M. persicae populations persist in the northern
Great Plains of America, with spring migrations from the south re-establishing populations
annually (Zhu et al., 2006). As a consequence, Scandinavian clones would not be expected
to display greater cold tolerance than their Mediterranean and temperate counterparts as the
aphids found at this most northerly location would be of annually mixed origin.
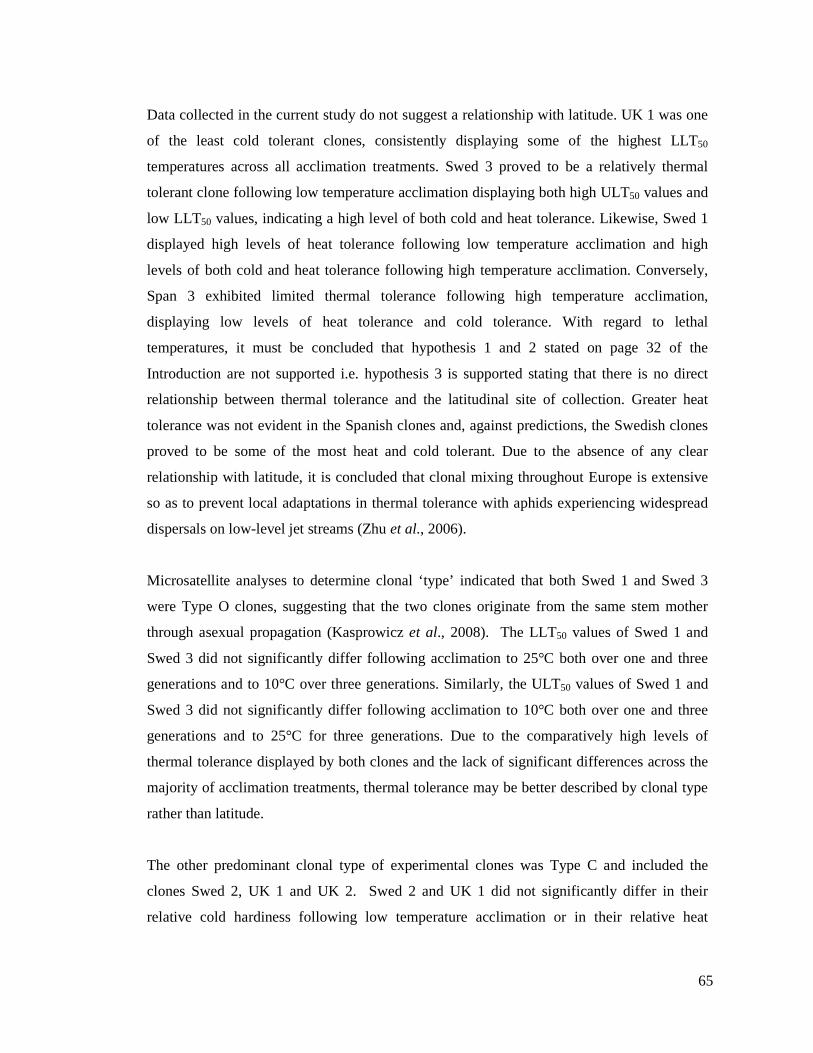
65
Data collected in the current study do not suggest a relationship with latitude. UK 1 was one
of the least cold tolerant clones, consistently displaying some of the highest LLT50
temperatures across all acclimation treatments. Swed 3 proved to be a relatively thermal
tolerant clone following low temperature acclimation displaying both high ULT50 values and
low LLT50 values, indicating a high level of both cold and heat tolerance. Likewise, Swed 1
displayed high levels of heat tolerance following low temperature acclimation and high
levels of both cold and heat tolerance following high temperature acclimation. Conversely,
Span 3 exhibited limited thermal tolerance following high temperature acclimation,
displaying low levels of heat tolerance and cold tolerance. With regard to lethal
temperatures, it must be concluded that hypothesis 1 and 2 stated on page 32 of the
Introduction are not supported i.e. hypothesis 3 is supported stating that there is no direct
relationship between thermal tolerance and the latitudinal site of collection. Greater heat
tolerance was not evident in the Spanish clones and, against predictions, the Swedish clones
proved to be some of the most heat and cold tolerant. Due to the absence of any clear
relationship with latitude, it is concluded that clonal mixing throughout Europe is extensive
so as to prevent local adaptations in thermal tolerance with aphids experiencing widespread
dispersals on low-level jet streams (Zhu et al., 2006).
Microsatellite analyses to determine clonal ‘type’ indicated that both Swed 1 and Swed 3
were Type O clones, suggesting that the two clones originate from the same stem mother
through asexual propagation (Kasprowicz et al., 2008). The LLT50 values of Swed 1 and
Swed 3 did not significantly differ following acclimation to 25°C both over one and three
generations and to 10°C over three generations. Similarly, the ULT50 values of Swed 1 and
Swed 3 did not significantly differ following acclimation to 10°C both over one and three
generations and to 25°C for three generations. Due to the comparatively high levels of
thermal tolerance displayed by both clones and the lack of significant differences across the
majority of acclimation treatments, thermal tolerance may be better described by clonal type
rather than latitude.
The other predominant clonal type of experimental clones was Type C and included the
clones Swed 2, UK 1 and UK 2. Swed 2 and UK 1 did not significantly differ in their
relative cold hardiness following low temperature acclimation or in their relative heat
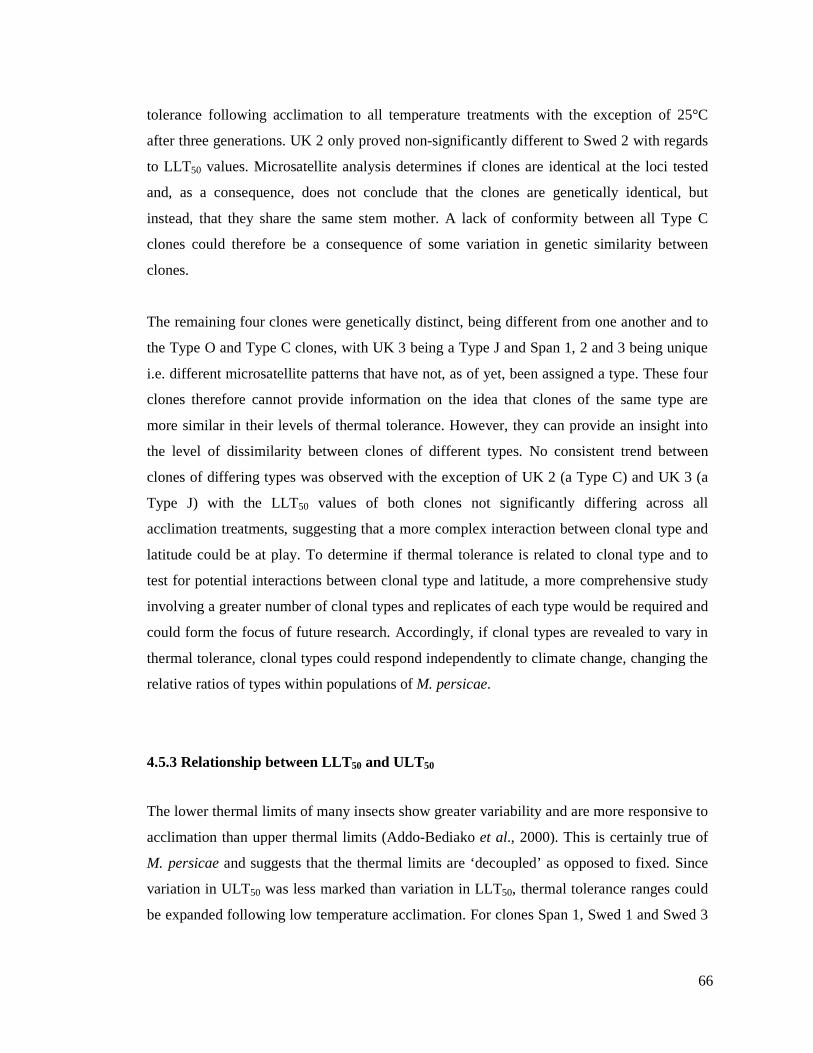
66
tolerance following acclimation to all temperature treatments with the exception of 25°C
after three generations. UK 2 only proved non-significantly different to Swed 2 with regards
to LLT50 values. Microsatellite analysis determines if clones are identical at the loci tested
and, as a consequence, does not conclude that the clones are genetically identical, but
instead, that they share the same stem mother. A lack of conformity between all Type C
clones could therefore be a consequence of some variation in genetic similarity between
clones.
The remaining four clones were genetically distinct, being different from one another and to
the Type O and Type C clones, with UK 3 being a Type J and Span 1, 2 and 3 being unique
i.e. different microsatellite patterns that have not, as of yet, been assigned a type. These four
clones therefore cannot provide information on the idea that clones of the same type are
more similar in their levels of thermal tolerance. However, they can provide an insight into
the level of dissimilarity between clones of different types. No consistent trend between
clones of differing types was observed with the exception of UK 2 (a Type C) and UK 3 (a
Type J) with the LLT50 values of both clones not significantly differing across all
acclimation treatments, suggesting that a more complex interaction between clonal type and
latitude could be at play. To determine if thermal tolerance is related to clonal type and to
test for potential interactions between clonal type and latitude, a more comprehensive study
involving a greater number of clonal types and replicates of each type would be required and
could form the focus of future research. Accordingly, if clonal types are revealed to vary in
thermal tolerance, clonal types could respond independently to climate change, changing the
relative ratios of types within populations of M. persicae.
4.5.3 Relationship between LLT50 and ULT50
The lower thermal limits of many insects show greater variability and are more responsive to
acclimation than upper thermal limits (Addo-Bediako et al., 2000). This is certainly true of
M. persicae and suggests that the thermal limits are ‘decoupled’ as opposed to fixed. Since
variation in ULT50 was less marked than variation in LLT50, thermal tolerance ranges could
be expanded following low temperature acclimation. For clones Span 1, Swed 1 and Swed 3
67
the temperature range over which aphids could survive increased by 0.4°C for every 1°C
decrease in rearing temperature. The remaining clones experienced a reduced rate of 0.15 -
0.25°C increase per 1°C decrease in rearing temperature. Current estimates of climate change
predict that global mean surface air temperatures could increase by between 1°C and 3.5°C
by 2100 in comparison to 1990 temperatures resulting in greater abundance of pest insects
(Cannon, 1998). However, a reduction in the thermal tolerance range of M. persicae could
result in greater susceptibility to unpredictable bouts of extreme weather such as frosts and
heat waves.
The evolution of plasticity is predicted to be more common in environments that are
predictably variable (Deere et al., 2006). Where environmental cues are unreliable, the
evolution of plasticity will not be favoured. The ability to acclimate should therefore be more
common in temperate species where variations in temperature occur on a predictable,
seasonal basis. Should this theory apply to aphid clones, temperate clones should display the
greatest levels of plasticity and Mediterranean clones the least. However, of the nine
experimental clones in the current study, it is Span 1, Swed 1 and Swed 3 that prove to be the
most plastic, displaying greater acclimation responses at low temperatures and consequently
greater tolerance ranges. Current data do not suggest a relationship between plasticity and
environmental predictability, once again supporting the idea that clonal intermixing is
extensive throughout Europe.
In summary, data demonstrate that lethal temperature thresholds are plastic in M. persicae
and can be altered through short term acclimation. ULT50 could be increased through both
high temperature and low temperature acclimation, suggesting that the physiological
processes involved in heat resistance are also induced by low temperature acclimation. Due
to LLT50 being more plastic than ULT50, thermal tolerance ranges are compressed with
increasing rearing temperature, which could have implications for the thermal tolerance of
the species if current trends in global warming continue. Data did not provide evidence for a
relationship between temperature lethality and latitude, suggesting that clonal mixing occurs
over large scales throughout Europe preventing local adaptation. A possible relationship with
clonal type was suggested, although this requires vigorous testing to confirm and could
provide the focus for future work.
68
5 Comparison of the thermal activity thresholds of clones of the peach-
potato aphid Myzus persicae collected along a latitudinal gradient in
Europe
5.1 Summary
Warming of Earth’s temperature, in conjunction with a decline in the frequency of winter
frosts, could put increased importance on sub-lethal activity thresholds over lethal
temperatures in predicting the distribution and abundance of aphids such as M. persicae. For
an aphid to survive at temperatures within the range of potentially lethal temperatures, it is
crucial that their ability to walk and to avoid temperature-induced torpor is not compromised.
Results from the current study demonstrate that low temperature activity thresholds could be
decreased following low temperature (10°C) acclimation as indicated by depressed
movement threshold (e.g. from 8.8°C to 2.5°C for UK 1 and from 6.5°C to 0.7°C for Span 3
after one generation at 10°C) and chill coma temperatures (e.g. from 4.8°C to 2.0°C for UK
2 and from 1.7°C to -0.8°C for Swed 2 after one generation at 10°C). High temperature
activity thresholds could be increased following high temperature (25°C) acclimation, as
indicated by raised heat movement threshold temperatures (e.g. from 40.1°C to 41.1°C for
Swed 1 and from 40.2°C to 40.9°C for Span 2 and Span 3 after one generation at 25°C) and
heat coma temperatures (e.g. from 41.4°C to 42.3°C for Swed 1 and from 41.9°C to 42.6°C
for Span 2 after one generation at 25°C). However, data did not provide any evidence of
intergenerational acclimation in M. persicae.
A relationship between activity thresholds and latitude was not evident with the exception of
data on heat coma where Scandinavian clones Swed 2 and 3 consistently had some of the
lowest heat coma temperatures and Mediterranean clones Span 1, 2 and 3 some of the
highest (e.g. median heat coma values at 20°C were 42.1, 41.9 and 42.5°C respectively for
Span 1, Span 2 and Span 3, and 41.4, 41.3 and 41.3°C for Swed 1, Swed 2 and Swed 3
respectively). Either clonal mixing occurs over large scales across Europe preventing local
adaptation, or local adaptation is limited to the Mediterranean where conditions enable long
69
term persistence of clonal populations and thus adaptation to higher temperatures.
Temperate clones UK 1 and 2 consistently showed some of the highest low temperature
activity thresholds, perhaps suggesting that clonal type more strongly affects aphid thermal
tolerance rather than location of collection.
High temperature activity thresholds were less plastic than low temperature activity
thresholds. Consequently, thermal activity ranges could be expanded following low
temperature acclimation. For the temperature range over which coma was avoided, this
expanded at a rate of approximately 0.2°C per 1°C decrease in rearing temperature.
Consequently aphids reared at 10°C avoided coma over a range 3°C greater than when
reared at 25°C. For the temperature range over which movement was retained, the range at
10°C was 4.5 to 6°C greater than at 25°C.
5.2 Introduction
It is widely recognised that temperature greatly affects insect survival and subsequently
insect populations, with survival being dependent upon the temperature and duration of
exposure (Bale, 1987). With much research focusing on the detection of lethal temperature
values (e.g. Knight et al., 1986; Bale et al., 1988; Powell & Bale, 2008) it must not be
assumed that death is the only threat to insects at temperature extremes and the only index
relevant to understanding aphid thermal biology. This is especially true in Mediterranean and
temperate regions where temperatures are rarely extreme enough to result in direct mortality.
When insects are exposed to extreme temperatures, for example increasingly sub-zero
temperatures, insects pass through a continuum of measurable behavioural traits before death
occurs as a result of physiological damage. Firstly, activity levels decline as indicated by
walking speed, eventually leading to a complete loss of walking ability rendering the insect
immobile. Finally, a state of cold induced coma will occur (chill coma) as indicated by the
last twitch of an appendage. Chill coma is usually a reversible condition from which insects
will make a full recovery if warmed, although if temperatures continue to decrease, death
will occur. A similar continuum, linked to neurophysiological failures, occurs following high
70
temperature exposure with insects first experiencing a loss of control over activities causing
locomotor arrythmicity. Uncontrollable spasms then begin, as defined by CTmax, and finally a
heat induced coma (heat coma) occurs due to complete loss of neuromuscular activity
(Hazell et al., 2010b). Recent work has shown that the upper lethal temperatures and
temperatures of heat coma do not differ significantly in aphids (Hazell et al., 2010b),
suggesting that, unlike chill coma, heat coma is not a reversible process and will result in
insect death.
It is the measurement of these non-lethal thermal thresholds that is perhaps more important
when trying to understand aphid thermal biology since they provide more ecologically
relevant information (Macdonald et al., 2004). Survival at temperature extremes is of little
importance if the surviving insect is rendered inactive since it would be unable to move to
find food, find a mate and thus contribute to the next generation, or to escape from predation
(Mellanby, 1939; Bale, 1987). The measurement of thermal thresholds is further proposed to
be more relevant than lethal temperatures in the determination of insect distribution and
abundance in the event of climate change (Hazell et al., 2010a) as the frequency of winter
frosts decline and mean winter temperatures increase (Easterling, 2002), which will have
implications for the pest and invasive status of many insects.
The majority of research into the onset of temperature induced comas has focused on the
‘righting response’. This involves observation of the temperatures at which subjects lose the
ability to right themselves after being artificially knocked over. The common practice is for
test subjects to be heated or cooled, usually within an alcohol or water bath, and to be
removed at regular intervals to test for the righting response (e.g. Gibert & Huey, 2001; Klok
& Chown, 2001; Castañeda et al., 2005). However, this method is not only labour intensive
and accountable to error, but creates problems via the repeated disturbances of test insects
which can impact body temperature, physiological status and thus the trait being measured
(Hazell et al., 2008). The present study adopts a method described in detail in Hazell et al.
(2008) which, not only allows for mass testing, but reduces disturbance to the test insects and
further allows for continual monitoring of insects to enable the study of hard to define
behavioural traits.
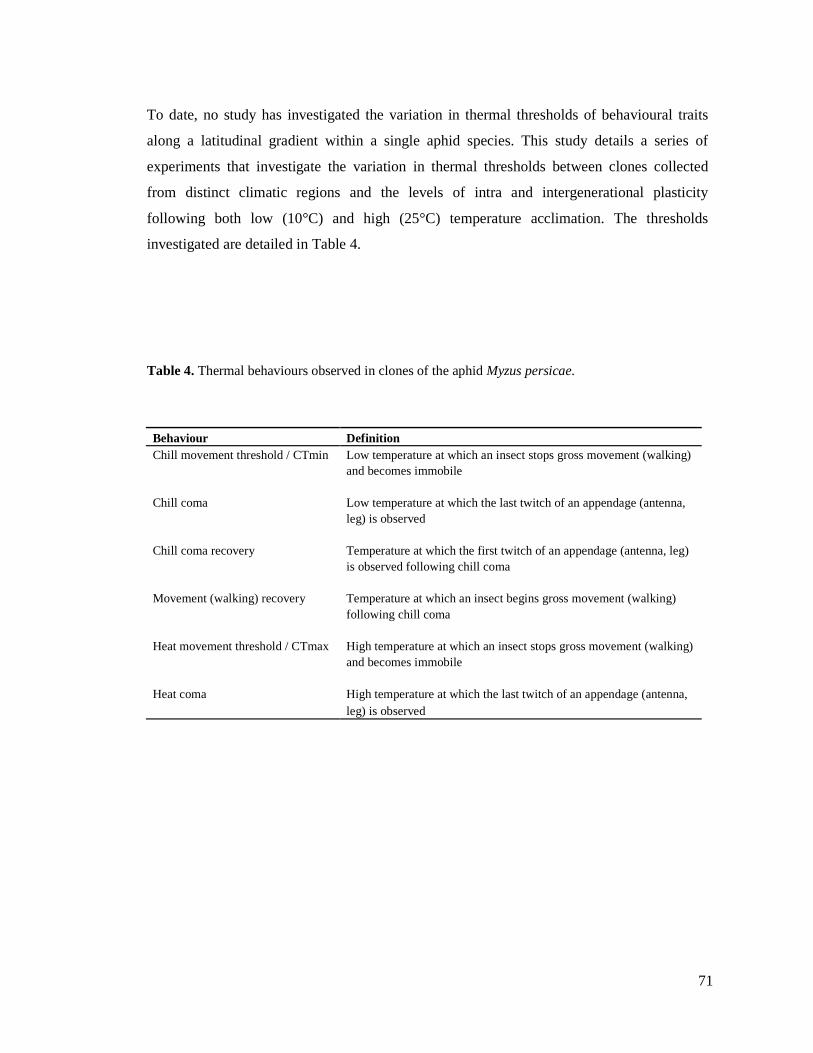
71
To date, no study has investigated the variation in thermal thresholds of behavioural traits
along a latitudinal gradient within a single aphid species. This study details a series of
experiments that investigate the variation in thermal thresholds between clones collected
from distinct climatic regions and the levels of intra and intergenerational plasticity
following both low (10°C) and high (25°C) temperature acclimation. The thresholds
investigated are detailed in Table 4.
Table 4. Thermal behaviours observed in clones of the aphid Myzus persicae.
Behaviour Definition
Chill movement threshold / CTmin Low temperature at which an insect stops gross movement (walking) and becomes immobile Chill coma Low temperature at which the last twitch of an appendage (antenna, leg) is observed Chill coma recovery Temperature at which the first twitch of an appendage (antenna, leg) is observed following chill coma Movement (walking) recovery Temperature at which an insect begins gross movement (walking) following chill coma Heat movement threshold / CTmax High temperature at which an insect stops gross movement (walking) and becomes immobile Heat coma High temperature at which the last twitch of an appendage (antenna,
leg) is observed
72
5.3 Materials and methods
The nine experimental clones of M. persicae were kept as a stock culture at 20°C. First instar
nymphs (less than 24h old) were taken from the culture and acclimated at either 10°C or
25°C for one or three generations prior to use of their offspring in experiments, as detailed in
the general materials and methods chapter. All nymphs used in experiments were first
instars.
5.3.1 Determination of chill movement threshold (CTmin) and chill coma temperature
The temperature of chill movement threshold and chill coma was determined by subjecting
aphids, positioned in an aluminium arena, to a decreasing temperature regime whilst
recording aphid activity using a camera which logged videos to a desktop computer. 40 first
instar nymphs were placed within the aluminium arena pre-set to the culture temperature
from which the nymphs were obtained. An alcohol bath was programmed to decrease the
temperature of the aluminium block from the culture temperature to 10°C at a rate of
0.5°Cmin-1. On reaching 10°C the aluminium block was further cooled to -6°C at a rate of
0.1°Cmin-1. This minimum temperature was selected as it was low enough to guarantee that
all aphids had long since entered chill coma. When using aphids from the 10°C acclimation
regime, the initial cooling to 10°C was not applicable and cooling began at a rate of
0.1°Cmin-1 to -6°C. During the cooling phase a camera positioned over the arena recorded
aphid movement whilst logging the video, along with changing time and arena temperature,
to a desktop computer. Videos were recorded at a rate of one frame per 5 sec.
On completion of the experiment, the video recording was stopped, saved to computer and
the nymphs removed from the arena. The stored videos were saved in reverse format prior to
playback (Using StudioPlayer, Studio86designs, UK). Videos could be played back on a
desktop computer at a later date and the chill movement threshold and the chill coma
temperature of individuals deduced. Videos were viewed in reverse to allow for more precise
identification of the temperature at which walking ceased and chill coma commenced. Once
movement was identified, the video could be paused and the arena temperature at that
73
specific moment in time read from the screen. Thermal thresholds were determined for 30
aphids for each clone by treatment combination.
5.3.2 Determination of heat movement threshold (CTmax) and heat coma temperature
The temperature of heat movement threshold and heat coma was determined by subjecting
aphids positioned in the aluminium arena to an increasing temperature regime whilst, once
again, recording aphid activity. 40 first instar nymphs were placed within the aluminium
arena pre-set to the aphid culture temperature. An alcohol bath was programmed to increase
the temperature of the aluminium block from the culture temperature to 35°C at a rate of
0.5°Cmin-1. On reaching 35°C the aluminium block was further heated to 45°C at a rate of
0.1°Cmin-1. The camera was positioned over the arena to record the movement of nymphs
during the heating phase, at a rate of one frame per 5 sec, with the video being logged to a
desktop computer.
Following heating of the aluminium block, the video recording was stopped, saved to
computer and the nymphs removed from the arena. The video was saved in reverse format
using StudioPlayer and the video subsequently viewed to determine the temperature at which
movement ceased (heat movement threshold) and heat coma was induced. Thermal
thresholds were determined for 30 aphids for each clone by treatment combination.
5.3.3 Detection of chill coma recovery
Following the experiment to determine the chill movement threshold (CTmin) and chill coma
temperature, a new sample of 40 aphids was placed within the arena. The alcohol bath was
pre-programmed to decrease the temperature of the aluminium block from culture
temperature to a pre-determined sub-zero temperature at a rate of 0.5°C min-1. To allow for
comparisons between clones a single sub-zero temperature was selected for each acclimation
regime, across all clones. These temperatures were determined using information obtained
from the chill coma experiments and preliminary chill coma recovery experiments, and were
74
selected so that all clones, originating from the same acclimation temperature, would enter a
non-lethal chill coma following a 30 min exposure to the temperature. The selected
temperatures were -6°C for 10°C cultures, -4°C for 20°C cultures and -3°C for 25°C
cultures.
It was originally thought that individual exposure temperatures should be determined for
each clone at each acclimation treatment to standardise the level of stress experienced by
each aphid. However, it was decided to subject all clones from a specific acclimation
temperature to the same sub-zero temperature. The experiment was conducted in this way,
firstly, to allow for comparisons between clones and, secondly, because in nature, the
temperature to which living organisms are exposed does not discriminate between an
individual’s (or a clone’s) thermal tolerance. Subjecting all clones from a specific
acclimation treatment to the same exposure temperature would therefore provide
ecologically meaningful results with real life implications.
Following the 30 min holding period at the minimum exposure temperature, the aluminium
block was returned to culture temperature at a rate of 0.1°Cmin-1. During the warming phase,
the camera was activated and the video of aphid movement logged to the desktop computer.
On reaching culture temperature the video recording was stopped and the nymphs removed
from the arena.
To determine chill coma recovery, the recorded video was not saved in a reverse format, but
viewed in ‘correct’ chronology. From video playback the temperature at which nymphs
exited chill coma (as determined by the first movement of antenna or a leg) and the
temperature at which they resumed walking was determined. The temperature of chill coma
recovery was determined for 30 aphids for each clone by treatment combination. Unlike chill
coma, heat coma is not a reversible process, resulting in insect death (Hazell et al., 2010b).
As a consequent, investigation of heat coma recovery was not possible.
75
5.3.4 Statistical analysis
Distribution fitting analysis was performed using MINITAB 15 for each thermal threshold
treatment group to determine which distribution best described the data. Data were first
converted from a value of temperature to duration of exposure to make data suitable for the
distribution fitting analysis. Parametric distribution analysis was subsequently performed
using the appropriate distribution, in all cases logistic, to allow for comparison of scale and
location parameters. Individual comparisons were made using Bonferroni 95% confidence
intervals. To investigate how aphid thermal activity ranges are affected by temperature, chill
coma values were subtracted from heat coma, and chill movement threshold values
subtracted from heat movement threshold and residuals were plotted against rearing
temperature.
5.4 Results
5.4.1 Chill movement threshold (CTmin) and chill coma temperature
5.4.1.1 Clonal differences in low temperature activity thresholds
Strongly significant differences between the chill movement threshold of different clones
were observed at 20°C (χ28 = 74.50, p<0.0001) and following acclimation to 10°C (one
generation: χ28 = 100.65, p<0.0001; three generations: χ2
8 = 81.19, p<0.0001) and 25°C (one
generation: χ28 = 108.20, p<0.0001; three generations: χ2
8 = 63.47, p<0.0001) (Figure 12).
Comparison of the Bonferroni corrected 95% confidence intervals indicated that at 20°C, UK
3 retained activity at the lowest temperatures (median 4.0°C), significantly lower than
temperatures obtained for clones Swed 3, Span 1, UK 1 and UK 2. UK 2 had the highest
values of chill movement threshold, with movement ceasing at a median temperature of
9.4°C, significantly higher than the chill movement thresholds for clones Span 2, Swed 2 and
UK 3.
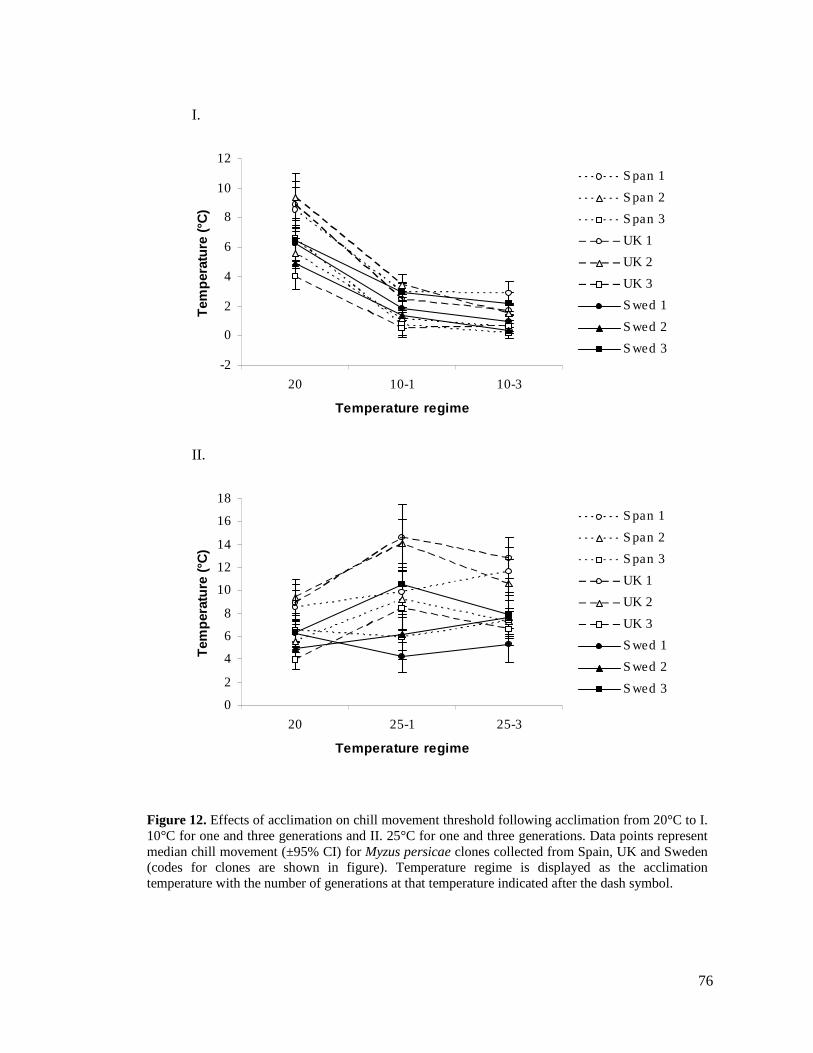
76
I.
-2
0
2
4
6
8
10
12
20 10-1 10-3
Temperature regime
Tem
pera
ture
(°C
)
Span 1
Span 2
Span 3
UK 1
UK 2
UK 3
Swed 1
Swed 2
Swed 3
II.
0
2
4
6
8
10
12
14
16
18
20 25-1 25-3
Temperature regime
Tem
pera
ture
(°C
)
Span 1
Span 2
Span 3
UK 1
UK 2
UK 3
Swed 1
Swed 2
Swed 3
Figure 12. Effects of acclimation on chill movement threshold following acclimation from 20°C to I. 10°C for one and three generations and II. 25°C for one and three generations. Data points represent median chill movement (±95% CI) for Myzus persicae clones collected from Spain, UK and Sweden (codes for clones are shown in figure). Temperature regime is displayed as the acclimation temperature with the number of generations at that temperature indicated after the dash symbol.
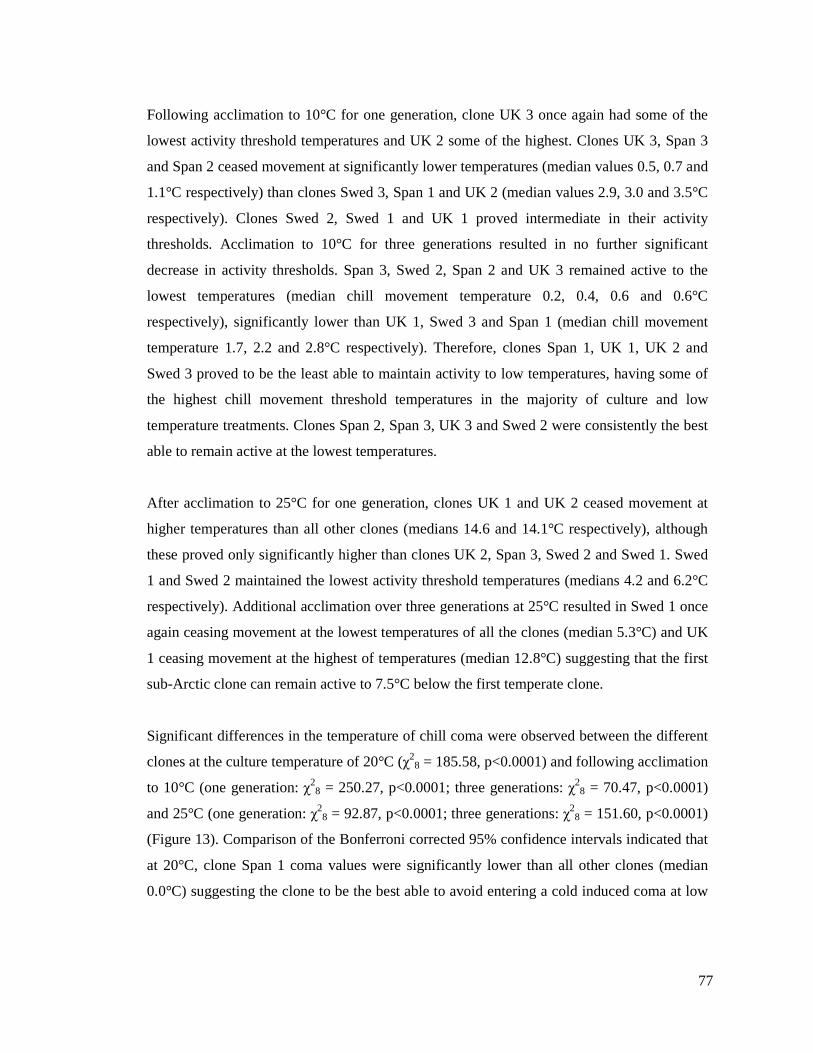
77
Following acclimation to 10°C for one generation, clone UK 3 once again had some of the
lowest activity threshold temperatures and UK 2 some of the highest. Clones UK 3, Span 3
and Span 2 ceased movement at significantly lower temperatures (median values 0.5, 0.7 and
1.1°C respectively) than clones Swed 3, Span 1 and UK 2 (median values 2.9, 3.0 and 3.5°C
respectively). Clones Swed 2, Swed 1 and UK 1 proved intermediate in their activity
thresholds. Acclimation to 10°C for three generations resulted in no further significant
decrease in activity thresholds. Span 3, Swed 2, Span 2 and UK 3 remained active to the
lowest temperatures (median chill movement temperature 0.2, 0.4, 0.6 and 0.6°C
respectively), significantly lower than UK 1, Swed 3 and Span 1 (median chill movement
temperature 1.7, 2.2 and 2.8°C respectively). Therefore, clones Span 1, UK 1, UK 2 and
Swed 3 proved to be the least able to maintain activity to low temperatures, having some of
the highest chill movement threshold temperatures in the majority of culture and low
temperature treatments. Clones Span 2, Span 3, UK 3 and Swed 2 were consistently the best
able to remain active at the lowest temperatures.
After acclimation to 25°C for one generation, clones UK 1 and UK 2 ceased movement at
higher temperatures than all other clones (medians 14.6 and 14.1°C respectively), although
these proved only significantly higher than clones UK 2, Span 3, Swed 2 and Swed 1. Swed
1 and Swed 2 maintained the lowest activity threshold temperatures (medians 4.2 and 6.2°C
respectively). Additional acclimation over three generations at 25°C resulted in Swed 1 once
again ceasing movement at the lowest temperatures of all the clones (median 5.3°C) and UK
1 ceasing movement at the highest of temperatures (median 12.8°C) suggesting that the first
sub-Arctic clone can remain active to 7.5°C below the first temperate clone.
Significant differences in the temperature of chill coma were observed between the different
clones at the culture temperature of 20°C (χ28 = 185.58, p<0.0001) and following acclimation
to 10°C (one generation: χ28 = 250.27, p<0.0001; three generations: χ2
8 = 70.47, p<0.0001)
and 25°C (one generation: χ28 = 92.87, p<0.0001; three generations: χ2
8 = 151.60, p<0.0001)
(Figure 13). Comparison of the Bonferroni corrected 95% confidence intervals indicated that
at 20°C, clone Span 1 coma values were significantly lower than all other clones (median
0.0°C) suggesting the clone to be the best able to avoid entering a cold induced coma at low

78
temperatures. UK 2 was the least able to avoid a cold induced coma (median 4.8°C), entering
chill coma at significantly higher temperatures than all other clones excluding UK 1.
79
I.
-2
0
2
4
6
8
20 10-1 10-3
Temperature regime
Tem
pera
ture
(°C
)
Span 1
Span 2
Span 3
UK 1
UK 2
UK 3
Swed 1
Swed 2
Swed 3
II.
-2
0
2
4
6
8
10
20 25-1 25-3
Temperature regime
Tem
pera
ture
(°C
)
Span 1
Span 2
Span 3
UK 1
UK 2
UK 3
Swed 1
Swed 2
Swed 3
Figure 13. Effects of acclimation on chill coma threshold following acclimation from 20°C to I. 10°C for one and three generations and II. 25°C for one and three generations. Data points represent median chill coma (±95% CI) for Myzus persicae clones collected from Spain, UK and Sweden (codes for clones are shown in figure). Temperature regime is displayed as the acclimation temperature with the number of generations at that temperature indicated after the dash symbol.
80
Following acclimation at 10°C for one generation clones UK 1 and UK 2 were the least
tolerant to low, coma inducing temperatures (respective medians 0.8 and 2.0°C), entering
chill coma at significantly higher temperatures than all other clones (medians ranging
between -0.5°C for Span 2 to -1.3°C for UK 3). Additional acclimation at 10°C over three
generations resulted in clones UK 1 and UK 2 once again having the highest chill coma
temperatures (respective medians of 0.1 and 0.2°C), significantly higher than all other clones
(medians ranging between -0.9°C for Span 3 and UK 3 to -1.5°C for Swed 2). After
acclimation to 25°C for one generation, UK 2 was the least tolerant (median 7.8°C), entering
chill coma at significantly higher temperatures than all other clones excluding UK 1.
Following additional acclimation for three generations at 25°C, chill coma values for both
UK 1 and UK 2 were significantly higher than all other clones (respective medians 7.4 and
6.8°C). Swed 1 had the lowest temperatures of chill coma (median 1.2°C) with chill coma
values significantly lower than all other clones excluding Span 1.
5.4.1.2 Effect of acclimation on low temperature activity thresholds
A relationship of decreasing activity threshold with decreasing acclimation temperature was
evident for chill coma (Figure 13) and, to a lesser extent, for chill movement threshold
(CTmin) (Figure 12). Activity threshold was significantly depressed in all clones following
acclimation to 10°C for one generation. The greatest effect was observed for UK 1, with the
chill movement threshold decreasing from 8.8°C at 20°C to 2.5°C following one generation
at 10°C enabling the clone to maintain the ability to walk to 6.3°C lower. The smallest effect
of acclimation was observed for UK 3 and Swed 3. Activity thresholds were depressed by
3.5°C from 4.0 to 0.5°C for UK 3 and 6.4 to 2.9°C for Swed 3. Acclimation for three
generations at 10°C failed to further depress the activity threshold in all clones with the
exception of UK 2 and Swed 2 for which chill movement threshold was depressed by an
additional 2.0°C and 0.9°C respectively. Data suggest that intergenerational acclimation has
little effect on activity threshold.
The relationship between acclimation temperature and chill movement threshold is less clear
following high temperature acclimation. No significant change in chill movement
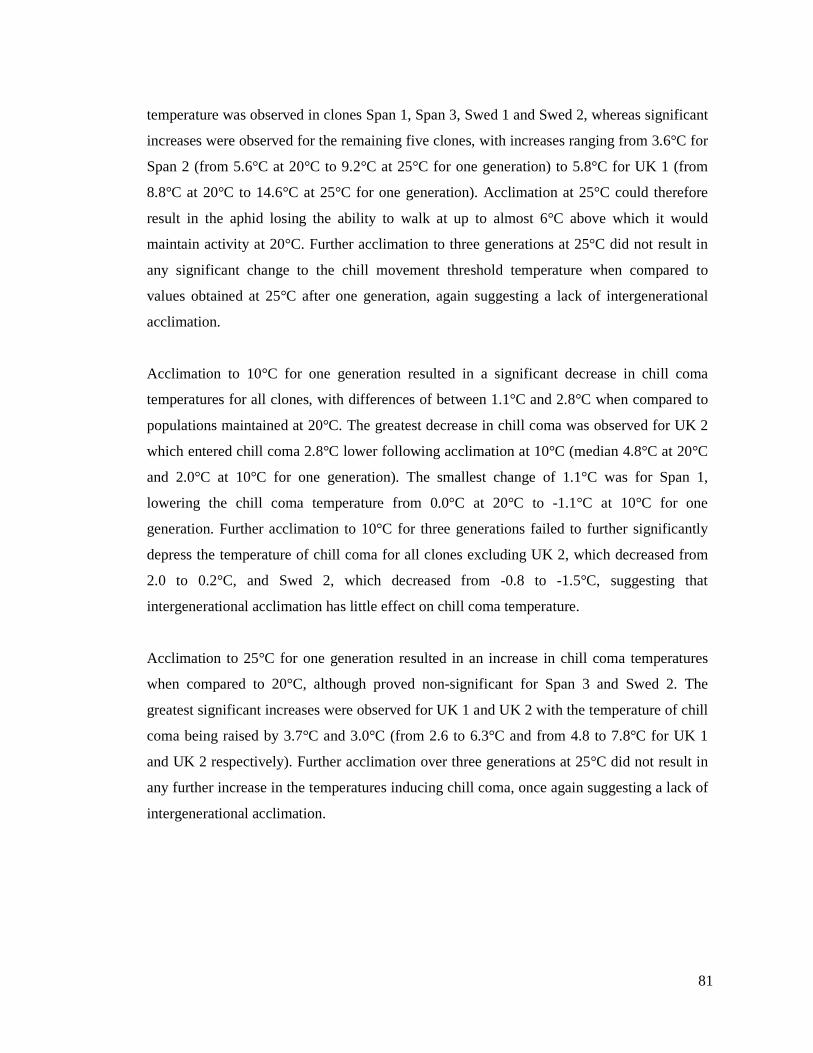
81
temperature was observed in clones Span 1, Span 3, Swed 1 and Swed 2, whereas significant
increases were observed for the remaining five clones, with increases ranging from 3.6°C for
Span 2 (from 5.6°C at 20°C to 9.2°C at 25°C for one generation) to 5.8°C for UK 1 (from
8.8°C at 20°C to 14.6°C at 25°C for one generation). Acclimation at 25°C could therefore
result in the aphid losing the ability to walk at up to almost 6°C above which it would
maintain activity at 20°C. Further acclimation to three generations at 25°C did not result in
any significant change to the chill movement threshold temperature when compared to
values obtained at 25°C after one generation, again suggesting a lack of intergenerational
acclimation.
Acclimation to 10°C for one generation resulted in a significant decrease in chill coma
temperatures for all clones, with differences of between 1.1°C and 2.8°C when compared to
populations maintained at 20°C. The greatest decrease in chill coma was observed for UK 2
which entered chill coma 2.8°C lower following acclimation at 10°C (median 4.8°C at 20°C
and 2.0°C at 10°C for one generation). The smallest change of 1.1°C was for Span 1,
lowering the chill coma temperature from 0.0°C at 20°C to -1.1°C at 10°C for one
generation. Further acclimation to 10°C for three generations failed to further significantly
depress the temperature of chill coma for all clones excluding UK 2, which decreased from
2.0 to 0.2°C, and Swed 2, which decreased from -0.8 to -1.5°C, suggesting that
intergenerational acclimation has little effect on chill coma temperature.
Acclimation to 25°C for one generation resulted in an increase in chill coma temperatures
when compared to 20°C, although proved non-significant for Span 3 and Swed 2. The
greatest significant increases were observed for UK 1 and UK 2 with the temperature of chill
coma being raised by 3.7°C and 3.0°C (from 2.6 to 6.3°C and from 4.8 to 7.8°C for UK 1
and UK 2 respectively). Further acclimation over three generations at 25°C did not result in
any further increase in the temperatures inducing chill coma, once again suggesting a lack of
intergenerational acclimation.
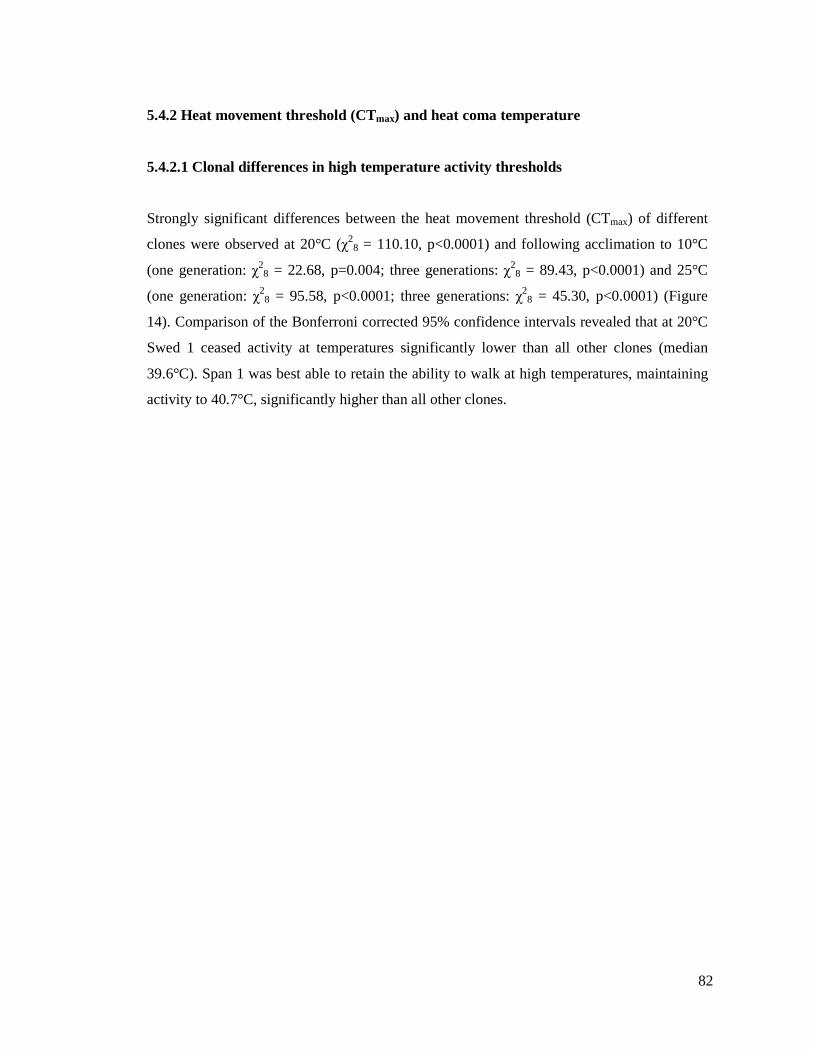
82
5.4.2 Heat movement threshold (CTmax) and heat coma temperature
5.4.2.1 Clonal differences in high temperature activity thresholds
Strongly significant differences between the heat movement threshold (CTmax) of different
clones were observed at 20°C (χ28 = 110.10, p<0.0001) and following acclimation to 10°C
(one generation: χ28 = 22.68, p=0.004; three generations: χ2
8 = 89.43, p<0.0001) and 25°C
(one generation: χ28 = 95.58, p<0.0001; three generations: χ2
8 = 45.30, p<0.0001) (Figure
14). Comparison of the Bonferroni corrected 95% confidence intervals revealed that at 20°C
Swed 1 ceased activity at temperatures significantly lower than all other clones (median
39.6°C). Span 1 was best able to retain the ability to walk at high temperatures, maintaining
activity to 40.7°C, significantly higher than all other clones.
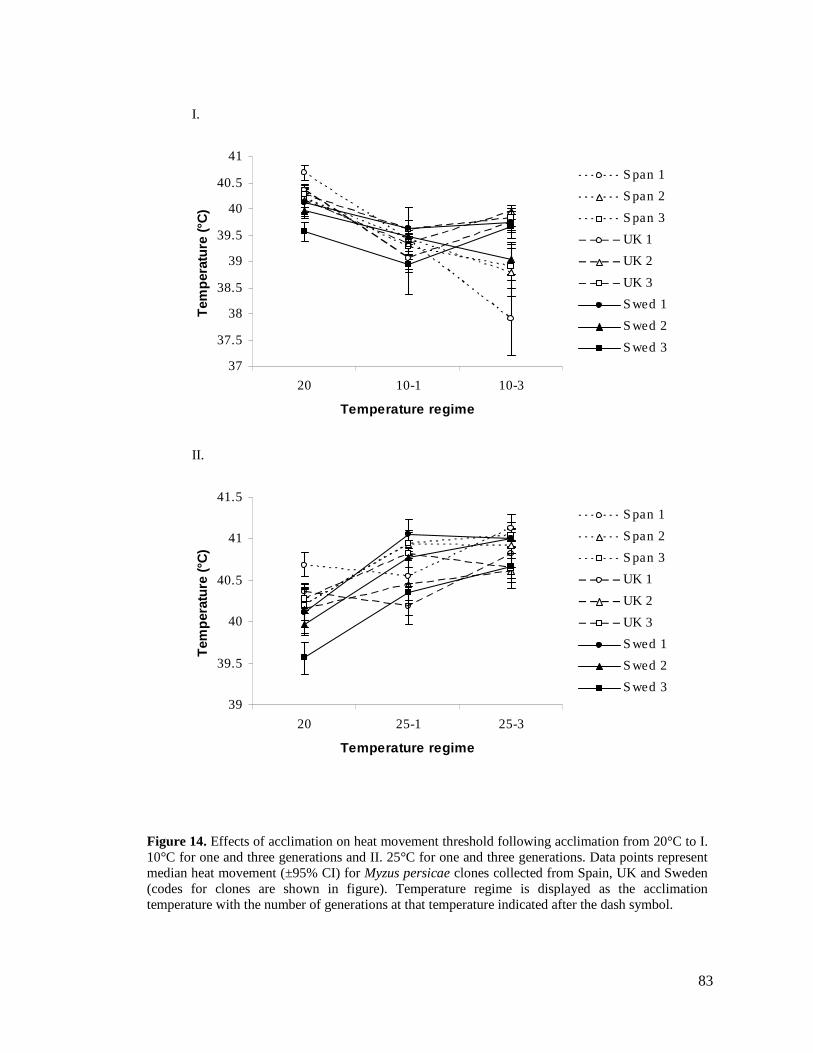
83
I.
37
37.5
38
38.5
39
39.5
40
40.5
41
20 10-1 10-3
Temperature regime
Tem
pera
ture
(°C
)
Span 1
Span 2
Span 3
UK 1
UK 2
UK 3
Swed 1
Swed 2
Swed 3
II.
39
39.5
40
40.5
41
41.5
20 25-1 25-3
Temperature regime
Tem
pera
ture
(°C
)
Span 1
Span 2
Span 3
UK 1
UK 2
UK 3
Swed 1
Swed 2
Swed 3
Figure 14. Effects of acclimation on heat movement threshold following acclimation from 20°C to I. 10°C for one and three generations and II. 25°C for one and three generations. Data points represent median heat movement (±95% CI) for Myzus persicae clones collected from Spain, UK and Sweden (codes for clones are shown in figure). Temperature regime is displayed as the acclimation temperature with the number of generations at that temperature indicated after the dash symbol.
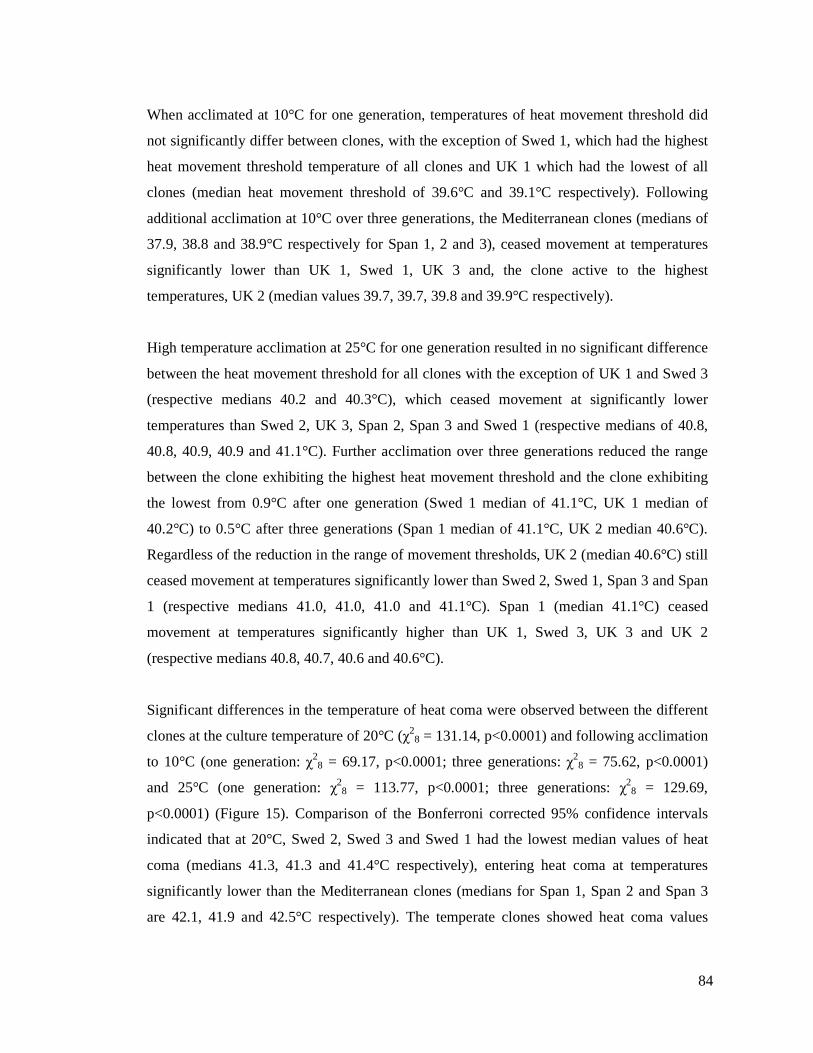
84
When acclimated at 10°C for one generation, temperatures of heat movement threshold did
not significantly differ between clones, with the exception of Swed 1, which had the highest
heat movement threshold temperature of all clones and UK 1 which had the lowest of all
clones (median heat movement threshold of 39.6°C and 39.1°C respectively). Following
additional acclimation at 10°C over three generations, the Mediterranean clones (medians of
37.9, 38.8 and 38.9°C respectively for Span 1, 2 and 3), ceased movement at temperatures
significantly lower than UK 1, Swed 1, UK 3 and, the clone active to the highest
temperatures, UK 2 (median values 39.7, 39.7, 39.8 and 39.9°C respectively).
High temperature acclimation at 25°C for one generation resulted in no significant difference
between the heat movement threshold for all clones with the exception of UK 1 and Swed 3
(respective medians 40.2 and 40.3°C), which ceased movement at significantly lower
temperatures than Swed 2, UK 3, Span 2, Span 3 and Swed 1 (respective medians of 40.8,
40.8, 40.9, 40.9 and 41.1°C). Further acclimation over three generations reduced the range
between the clone exhibiting the highest heat movement threshold and the clone exhibiting
the lowest from 0.9°C after one generation (Swed 1 median of 41.1°C, UK 1 median of
40.2°C) to 0.5°C after three generations (Span 1 median of 41.1°C, UK 2 median 40.6°C).
Regardless of the reduction in the range of movement thresholds, UK 2 (median 40.6°C) still
ceased movement at temperatures significantly lower than Swed 2, Swed 1, Span 3 and Span
1 (respective medians 41.0, 41.0, 41.0 and 41.1°C). Span 1 (median 41.1°C) ceased
movement at temperatures significantly higher than UK 1, Swed 3, UK 3 and UK 2
(respective medians 40.8, 40.7, 40.6 and 40.6°C).
Significant differences in the temperature of heat coma were observed between the different
clones at the culture temperature of 20°C (χ28 = 131.14, p<0.0001) and following acclimation
to 10°C (one generation: χ28 = 69.17, p<0.0001; three generations: χ2
8 = 75.62, p<0.0001)
and 25°C (one generation: χ28 = 113.77, p<0.0001; three generations: χ2
8 = 129.69,
p<0.0001) (Figure 15). Comparison of the Bonferroni corrected 95% confidence intervals
indicated that at 20°C, Swed 2, Swed 3 and Swed 1 had the lowest median values of heat
coma (medians 41.3, 41.3 and 41.4°C respectively), entering heat coma at temperatures
significantly lower than the Mediterranean clones (medians for Span 1, Span 2 and Span 3
are 42.1, 41.9 and 42.5°C respectively). The temperate clones showed heat coma values

85
intermediate of the Mediterranean and Scandinavian clones and only significantly differed
from Span 3, the clone with the highest heat coma temperature and Swed 2, the clone with
the lowest heat coma temperature.
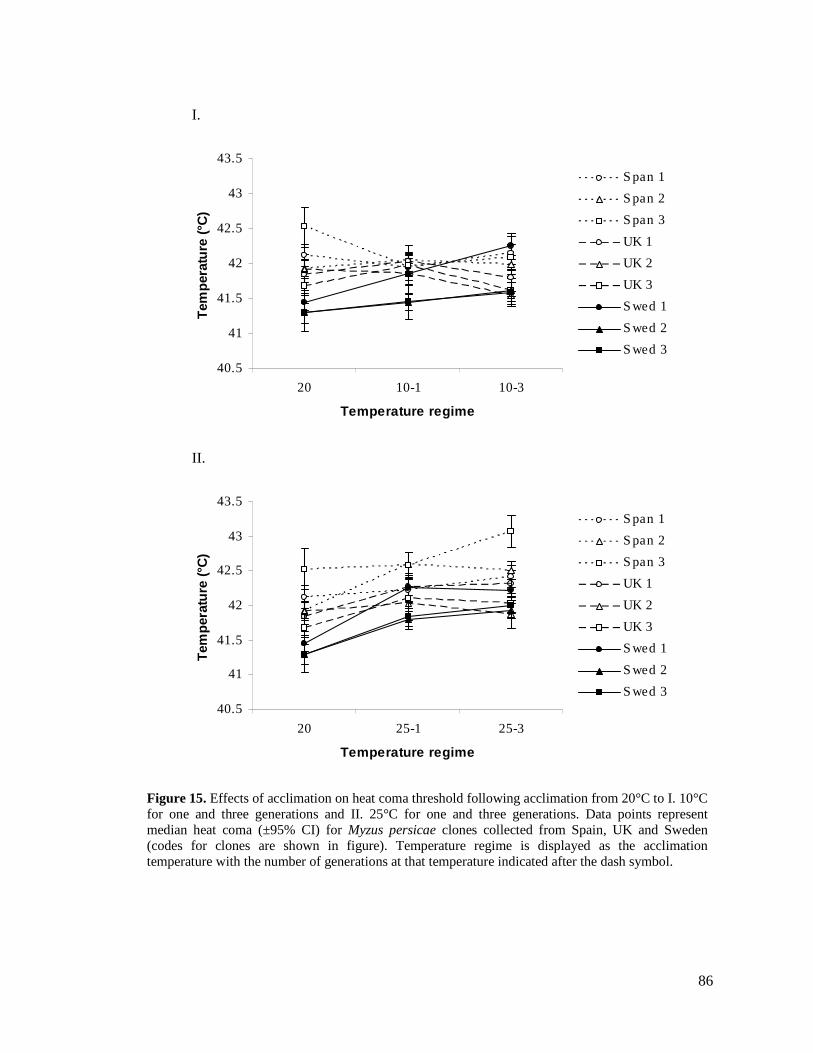
86
I.
40.5
41
41.5
42
42.5
43
43.5
20 10-1 10-3
Temperature regime
Tem
pera
ture
(°C
)
Span 1
Span 2
Span 3
UK 1
UK 2
UK 3
Swed 1
Swed 2
Swed 3
II.
40.5
41
41.5
42
42.5
43
43.5
20 25-1 25-3
Temperature regime
Tem
pera
ture
(°C
)
Span 1
Span 2
Span 3
UK 1
UK 2
UK 3
Swed 1
Swed 2
Swed 3
Figure 15. Effects of acclimation on heat coma threshold following acclimation from 20°C to I. 10°C for one and three generations and II. 25°C for one and three generations. Data points represent median heat coma (±95% CI) for Myzus persicae clones collected from Spain, UK and Sweden (codes for clones are shown in figure). Temperature regime is displayed as the acclimation temperature with the number of generations at that temperature indicated after the dash symbol.
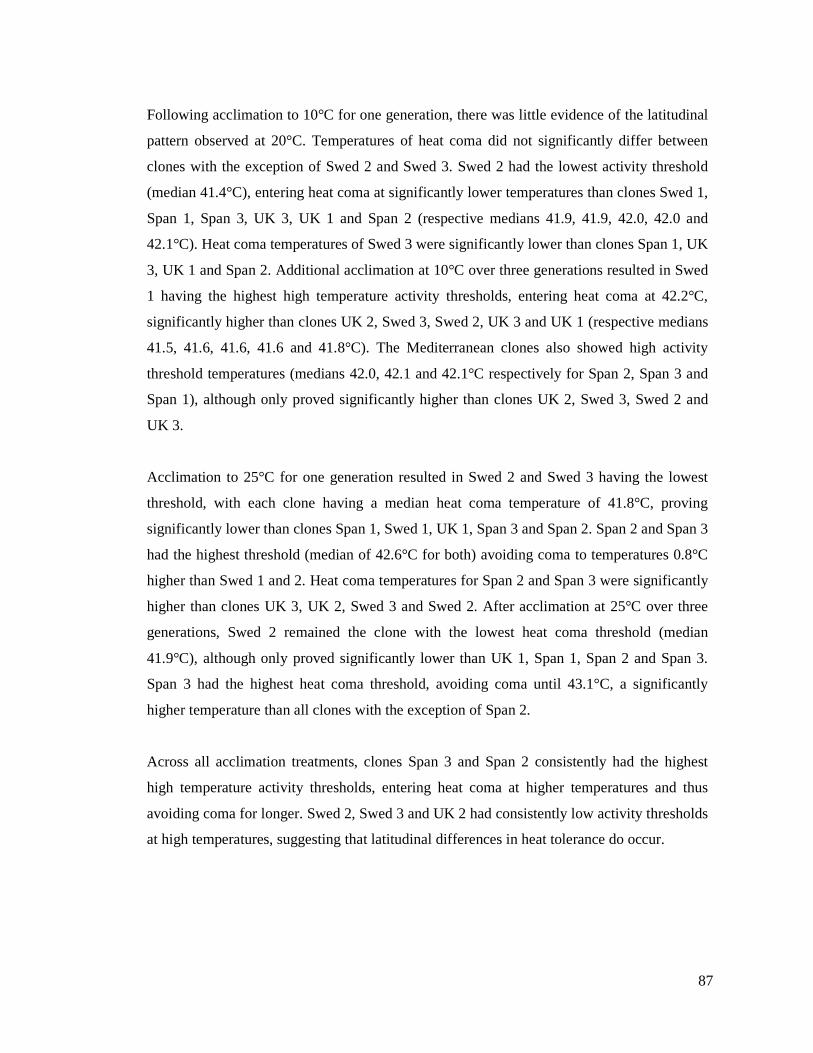
87
Following acclimation to 10°C for one generation, there was little evidence of the latitudinal
pattern observed at 20°C. Temperatures of heat coma did not significantly differ between
clones with the exception of Swed 2 and Swed 3. Swed 2 had the lowest activity threshold
(median 41.4°C), entering heat coma at significantly lower temperatures than clones Swed 1,
Span 1, Span 3, UK 3, UK 1 and Span 2 (respective medians 41.9, 41.9, 42.0, 42.0 and
42.1°C). Heat coma temperatures of Swed 3 were significantly lower than clones Span 1, UK
3, UK 1 and Span 2. Additional acclimation at 10°C over three generations resulted in Swed
1 having the highest high temperature activity thresholds, entering heat coma at 42.2°C,
significantly higher than clones UK 2, Swed 3, Swed 2, UK 3 and UK 1 (respective medians
41.5, 41.6, 41.6, 41.6 and 41.8°C). The Mediterranean clones also showed high activity
threshold temperatures (medians 42.0, 42.1 and 42.1°C respectively for Span 2, Span 3 and
Span 1), although only proved significantly higher than clones UK 2, Swed 3, Swed 2 and
UK 3.
Acclimation to 25°C for one generation resulted in Swed 2 and Swed 3 having the lowest
threshold, with each clone having a median heat coma temperature of 41.8°C, proving
significantly lower than clones Span 1, Swed 1, UK 1, Span 3 and Span 2. Span 2 and Span 3
had the highest threshold (median of 42.6°C for both) avoiding coma to temperatures 0.8°C
higher than Swed 1 and 2. Heat coma temperatures for Span 2 and Span 3 were significantly
higher than clones UK 3, UK 2, Swed 3 and Swed 2. After acclimation at 25°C over three
generations, Swed 2 remained the clone with the lowest heat coma threshold (median
41.9°C), although only proved significantly lower than UK 1, Span 1, Span 2 and Span 3.
Span 3 had the highest heat coma threshold, avoiding coma until 43.1°C, a significantly
higher temperature than all clones with the exception of Span 2.
Across all acclimation treatments, clones Span 3 and Span 2 consistently had the highest
high temperature activity thresholds, entering heat coma at higher temperatures and thus
avoiding coma for longer. Swed 2, Swed 3 and UK 2 had consistently low activity thresholds
at high temperatures, suggesting that latitudinal differences in heat tolerance do occur.
88
5.4.2.2 Effect of acclimation on high temperature activity thresholds
Variation in heat movement threshold and heat coma was much reduced in contrast to
variation in the lower thresholds. In addition, the temperature of heat coma did not appear to
show any clear relationship with rearing temperature (Figure 15), as was observed for the
lower activity thresholds. The high temperature activity threshold (CTmax) appeared more
plastic than heat coma, with acclimation treatment significantly altering the temperature at
which aphids ceased movement (Figure 14). Clear effects of acclimation on heat movement
threshold were evident, with acclimation at 10°C acting to decrease the heat movement
threshold and acclimation at 25°C increasing the threshold when compared to aphid activity
at 20°C in the majority of clones. Acclimation to 10°C significantly reduced the activity
threshold for all clones, excluding Span 2 and Swed 3, resulting in aphid clones ceasing
movement at lower temperatures. The largest reduction of 1.3°C was observed for clones
Span 1 and UK 1, with median heat movement thresholds declining from 40.7 to 39.4°C and
from 40.4 to 39.1°C respectively. Additional acclimation over three generations resulted in
further significant losses in activity thresholds for Span 1 (reduction in median heat
movement threshold from 39.4 to 37.9°C) and for Swed 2 (reduction in median heat
movement threshold from 39.5 to 39.0°C). Conversely, UK 1 and UK 2 experienced an
increase in heat movement threshold following acclimation over three generations at 10°C,
with UK 1 increasing from 39.1 to 39.7°C and UK 2 from 39.3 to 39.9°C.
Movement was maintained to the highest temperatures following acclimation at 25°C.
Acclimation for one generation increased heat movement threshold in all clones, with the
exception of Span 1, UK 1 and UK 2, suggesting that high temperature acclimation increases
high temperature activity thresholds. The greatest increases were observed for clones Swed 1
and Swed 2 with aphids remaining active for 0.8°C to 1.0°C higher when compared to aphids
reared at 20°C (increase in median heat movement threshold from 40.0 to 40.8°C for Swed 2
and from 40.1 to 41.1°C for Swed 1). Additional acclimation for three generations resulted in
further increases in activity threshold for only three clones: Span 1, UK 1 and Swed 3
(increase in median heat coma from 40.6 to 41.1°C, from 40.2 to 40.8°C and from 40.3 to
40.7°C respectively).
89
Heat coma temperature appeared less plastic than heat movement threshold. Acclimation to
10°C failed to significantly alter the temperature of heat coma in all clones with the
exception of Span 3 and Swed 1. In Span 3, acclimation to the lower temperature resulted in
a decrease in activity thresholds, with the temperature inducing heat coma being reduced
from 42.5°C at 20°C to 42.0°C following one generation at 10°C. The reverse was true for
Swed 1, with heat coma temperature actually increasing following low temperature
acclimation (median heat coma 41.4°C at 20°C, increasing to 41.9°C after one generation at
10°C). Additional acclimation over three generations also failed to significantly alter heat
coma temperature in all clones excluding Swed 1 and UK 3. Swed 1 showed a further
increase in activity thresholds, raising the heat coma temperature by an additional 0.3°C to
42.2°C. UK 3 experienced a significant loss in heat coma tolerance, with median
temperatures declining from 42.0°C following one generation to 41.6°C following three
generations.
Acclimation to 25°C had a more directional effect on heat coma, significantly raising heat
coma in clones Span 2, UK 1, UK 3, Swed 1, Swed 2 and Swed 3. The greatest increase of
0.9°C was observed for Swed 1, increasing median heat coma from 41.4°C at 20°C to
42.3°C after one generation at 25°C. Additional acclimation for three generations failed to
further raise heat coma temperatures in all clones with the exception of Span 3, where heat
coma was raised by 0.5°C from 42.6°C to 43.1°C.
5.4.3 Differentials between thermal activity thresholds
Six out of thirty six comparisons of coma temperatures showed an effect of intergenerational
acclimation and nine out of thirty six comparisons of activity threshold. The data for first and
third generation responses were combined to determine possible relationships between the
activity thresholds and to establish any general effect of rearing temperature on aphid
thermal tolerance range.
The activity threshold ranges of aphids were calculated by subtracting the chill coma from
the heat coma temperature, and the chill movement threshold from the heat movement
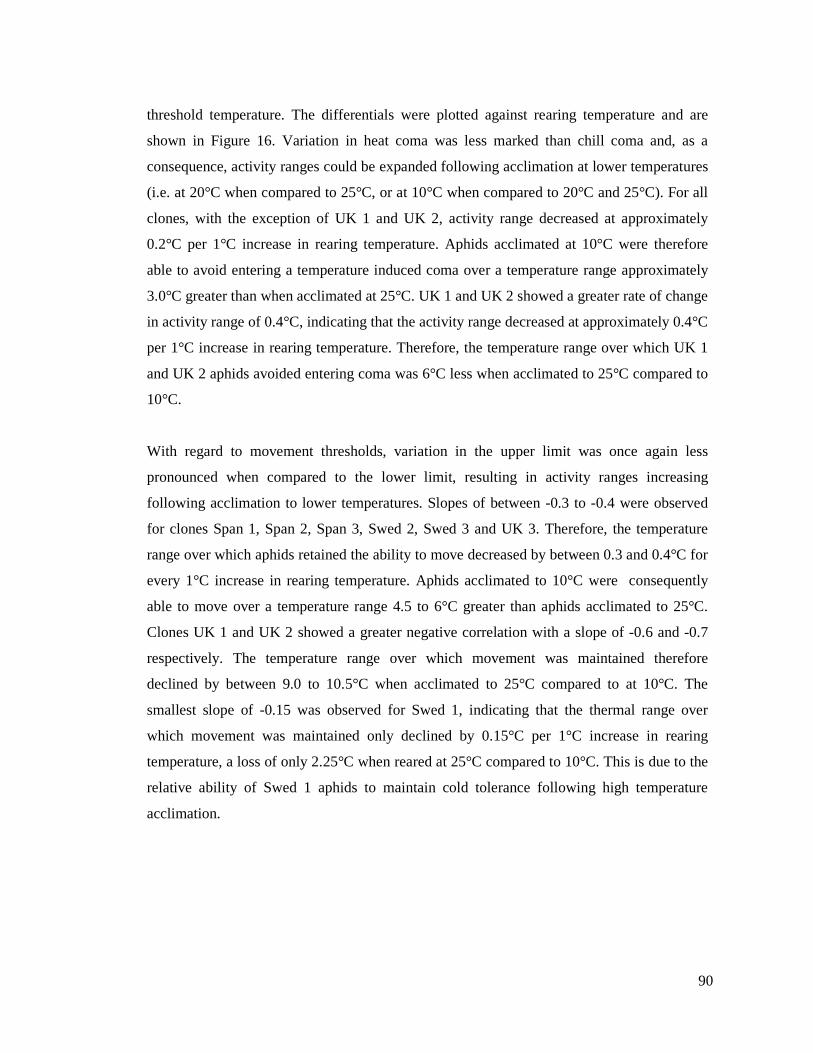
90
threshold temperature. The differentials were plotted against rearing temperature and are
shown in Figure 16. Variation in heat coma was less marked than chill coma and, as a
consequence, activity ranges could be expanded following acclimation at lower temperatures
(i.e. at 20°C when compared to 25°C, or at 10°C when compared to 20°C and 25°C). For all
clones, with the exception of UK 1 and UK 2, activity range decreased at approximately
0.2°C per 1°C increase in rearing temperature. Aphids acclimated at 10°C were therefore
able to avoid entering a temperature induced coma over a temperature range approximately
3.0°C greater than when acclimated at 25°C. UK 1 and UK 2 showed a greater rate of change
in activity range of 0.4°C, indicating that the activity range decreased at approximately 0.4°C
per 1°C increase in rearing temperature. Therefore, the temperature range over which UK 1
and UK 2 aphids avoided entering coma was 6°C less when acclimated to 25°C compared to
10°C.
With regard to movement thresholds, variation in the upper limit was once again less
pronounced when compared to the lower limit, resulting in activity ranges increasing
following acclimation to lower temperatures. Slopes of between -0.3 to -0.4 were observed
for clones Span 1, Span 2, Span 3, Swed 2, Swed 3 and UK 3. Therefore, the temperature
range over which aphids retained the ability to move decreased by between 0.3 and 0.4°C for
every 1°C increase in rearing temperature. Aphids acclimated to 10°C were consequently
able to move over a temperature range 4.5 to 6°C greater than aphids acclimated to 25°C.
Clones UK 1 and UK 2 showed a greater negative correlation with a slope of -0.6 and -0.7
respectively. The temperature range over which movement was maintained therefore
declined by between 9.0 to 10.5°C when acclimated to 25°C compared to at 10°C. The
smallest slope of -0.15 was observed for Swed 1, indicating that the thermal range over
which movement was maintained only declined by 0.15°C per 1°C increase in rearing
temperature, a loss of only 2.25°C when reared at 25°C compared to 10°C. This is due to the
relative ability of Swed 1 aphids to maintain cold tolerance following high temperature
acclimation.
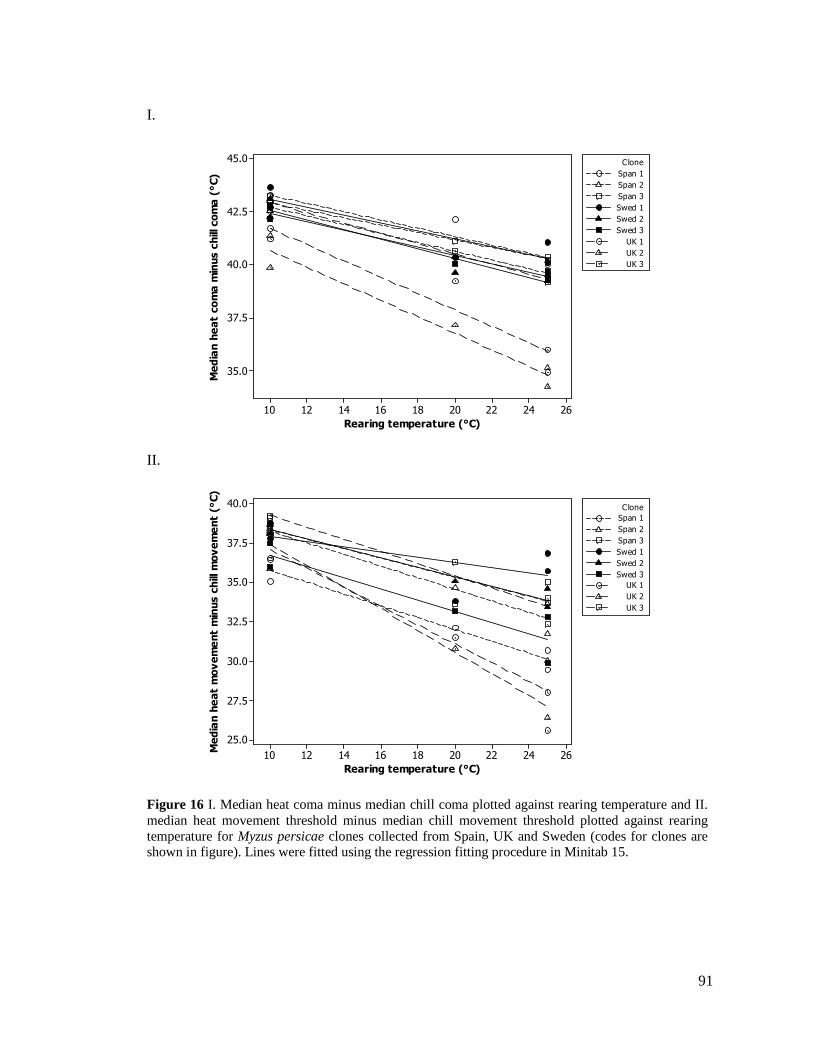
91
I.
Rearing temperature (°C)
Median heat coma minus chill coma (°C)
262422201816141210
45.0
42.5
40.0
37.5
35.0
Clone
Span 3
Swed 1
Swed 2
Swed 3
UK 1
UK 2
UK 3
Span 1
Span 2
II.
Rearing temperature (°C)
Median heat movement minus chill movement (°C)
262422201816141210
40.0
37.5
35.0
32.5
30.0
27.5
25.0
Clone
Span 3
Swed 1
Swed 2
Swed 3
UK 1
UK 2
UK 3
Span 1
Span 2
Figure 16 I. Median heat coma minus median chill coma plotted against rearing temperature and II. median heat movement threshold minus median chill movement threshold plotted against rearing temperature for Myzus persicae clones collected from Spain, UK and Sweden (codes for clones are shown in figure). Lines were fitted using the regression fitting procedure in Minitab 15.
92
5.4.4 Chill Coma Recovery
Significant differences in the time duration before aphids exited a state of chill coma, as
indicated by the first twitch of a leg or antenna, were revealed between clones at the culture
temperature of 20°C (χ28 = 102.92, p<0.0001), following acclimation to 10°C (one
generation χ28 = 63.81, p<0.0001; three generations χ2
8 = 91.95, p<0.0001) and 25°C (one
generation χ28 = 118.93, p<0.0001; three generations χ2
8 = 28.31, p<0.0001). The time
duration before aphids began spontaneous walking following chill coma also revealed
significant differences between clones at the culture temperature of 20°C (χ28 = 81.53,
p<0.0001), following acclimation to 10°C (one generation χ28 = 264.23, p<0.0001; three
generations χ28 = 228.72, p<0.0001) and 25°C (one generation χ2
8 = 171.78, p<0.0001; three
generations χ28 = 151.56, p<0.0001).
At the culture temperature of 20°C, median time duration to exit chill coma ranged from 78.5
to 100.5 min (Figure 17). Following chill coma induction at -4°C, aphids therefore did not
exit chill coma until temperatures between 3.9°C and 6.1°C were reached when warmed at a
rate of 0.1°Cmin-1. Clones Span 2, UK 2, UK 3, Swed 1 and Swed 3 took the longest
duration to recover from chill coma (respective medians of 96.3, 98.4, 97.4, 97.5 and 100.5
min) and did not significantly differ in duration, although took significantly more time to
recover than clones UK 1 (with the exception of Swed 1 and UK 2), Swed 2, UK 1, and Span
3. Swed 1 recovered from chill coma after the shortest duration (median 78.5 min which
approximates to 3.9°C), a significantly shorter duration than the other clones with the
exception of Span 1, Span 3, UK 1 and Swed 2 (respective medians of 83.4, 83.4, 82.4 and
78.5 min).
Spontaneous walking for aphids acclimated to 20°C occurred after a median time duration of
between 124.4 and 155.0 min, approximating temperatures ranging from 8.4°C to 11.5°C
(Figure 17). Clones Span 3 and Swed 2 were the first to regain movement (median time
duration of 124.4 and 125.3 min respectively), significantly less than clones Swed 3, UK 3,
UK 2 and Swed 1. Swed 1 took the greatest time to spontaneously walk following chill coma
with a median time duration of 155.0 min, approximating to 11.5°C, which proved
significantly longer than all clones with the exception of Span 1.
93
0
20
40
60
80
100
120
140
160
180
S pan 1 S pan 2 S pan 3 UK 1 UK 2 UK 3 S wed
1
S wed
2
S wed
3
Clo n e
Tim
e (
min
ute
s)
Figure 17. Time duration (min) following which aphids exited chill coma ±95% CI (as indicated by the top of the white bar) and spontaneously move ±95% CI (as indicated by the top of the grey bar) following exposure to -4°C for 30 min and then re-warmed to acclimation temperature at a rate of 0.1°C min-1 for all clones acclimated to 20°C.
Aphids acclimated to 10°C were subjected to -6°C for 30 min to induce chill coma and re-
warmed to 10°C at a rate of 0.1°Cmin-1. Recovery time from chill coma following
acclimation to 10°C for one generation ranged from a median of 68.8 to 88.5 min,
approximating a temperature of 0.9°C to 2.9°C (Figure 18I). The first clones to exit from
chill coma were Swed 2 and UK 3 (median duration of 68.8 and 69.7 min respectively),
although this proved significantly different only from Span 2 (median duration of 88.5 min)
and, for Swed 2, significantly different from Span 3 (median duration of 85.7). Span 2,
taking 88.5 min to exit chill coma, took significantly longer than clones Swed 2, UK 3, Swed
1, UK 1 and Span 1.
The time taken until aphids spontaneously walked following chill coma ranged from 108.5 to
147.5 min, approximating to 4.9°C to 8.8°C (Figure 18I). UK 1 took the shortest duration of
108.5 min to engage in spontaneous walking, significantly shorter than all clones with the
exception of Span 3 and Span 1. Scandinavian clones Swed 1 and Swed 3 took significantly
longer to spontaneously walk than all clones, with median durations of 144.6 and 147.5 min
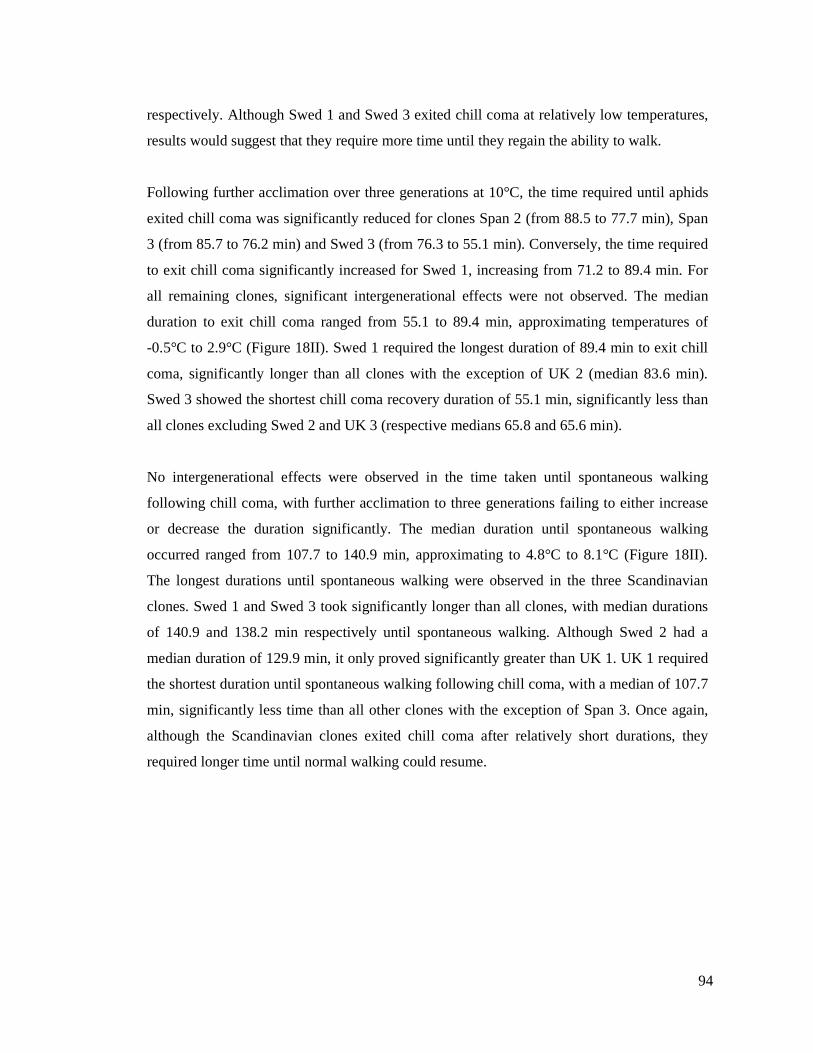
94
respectively. Although Swed 1 and Swed 3 exited chill coma at relatively low temperatures,
results would suggest that they require more time until they regain the ability to walk.
Following further acclimation over three generations at 10°C, the time required until aphids
exited chill coma was significantly reduced for clones Span 2 (from 88.5 to 77.7 min), Span
3 (from 85.7 to 76.2 min) and Swed 3 (from 76.3 to 55.1 min). Conversely, the time required
to exit chill coma significantly increased for Swed 1, increasing from 71.2 to 89.4 min. For
all remaining clones, significant intergenerational effects were not observed. The median
duration to exit chill coma ranged from 55.1 to 89.4 min, approximating temperatures of
-0.5°C to 2.9°C (Figure 18II). Swed 1 required the longest duration of 89.4 min to exit chill
coma, significantly longer than all clones with the exception of UK 2 (median 83.6 min).
Swed 3 showed the shortest chill coma recovery duration of 55.1 min, significantly less than
all clones excluding Swed 2 and UK 3 (respective medians 65.8 and 65.6 min).
No intergenerational effects were observed in the time taken until spontaneous walking
following chill coma, with further acclimation to three generations failing to either increase
or decrease the duration significantly. The median duration until spontaneous walking
occurred ranged from 107.7 to 140.9 min, approximating to 4.8°C to 8.1°C (Figure 18II).
The longest durations until spontaneous walking were observed in the three Scandinavian
clones. Swed 1 and Swed 3 took significantly longer than all clones, with median durations
of 140.9 and 138.2 min respectively until spontaneous walking. Although Swed 2 had a
median duration of 129.9 min, it only proved significantly greater than UK 1. UK 1 required
the shortest duration until spontaneous walking following chill coma, with a median of 107.7
min, significantly less time than all other clones with the exception of Span 3. Once again,
although the Scandinavian clones exited chill coma after relatively short durations, they
required longer time until normal walking could resume.
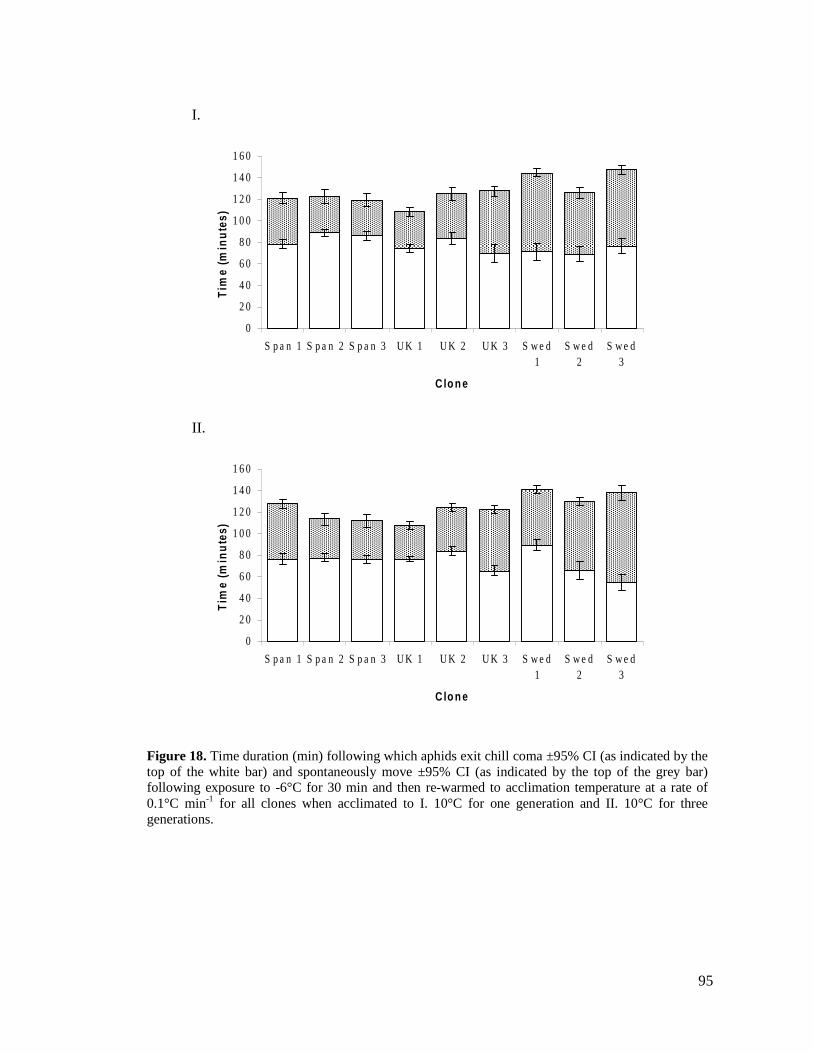
95
I.
0
20
40
60
80
100
120
140
160
S pan 1 S pan 2 S pan 3 UK 1 UK 2 UK 3 S wed
1
S wed
2
S wed
3
Clo n e
Tim
e (
min
ute
s)
II.
0
20
40
60
80
100
120
140
160
S pan 1 S pan 2 S pan 3 UK 1 UK 2 UK 3 S wed
1
S wed
2
S wed
3
Clo n e
Tim
e (
min
ute
s)
Figure 18. Time duration (min) following which aphids exit chill coma ±95% CI (as indicated by the top of the white bar) and spontaneously move ±95% CI (as indicated by the top of the grey bar) following exposure to -6°C for 30 min and then re-warmed to acclimation temperature at a rate of 0.1°C min-1 for all clones when acclimated to I. 10°C for one generation and II. 10°C for three generations.
96
Aphids acclimated to 25°C were subjected to -3°C for 30 min to induce chill coma and re-
warmed to 25°C at a rate of 0.1°Cmin-1. Recovery time from chill coma following
acclimation to 25°C for one generation ranged from a median of 65.2 to 99.7 min,
approximating a temperature of 3.5°C to 7.0°C (Figure 19I). The shortest duration of 65.2
min until chill coma was exited was displayed by UK 1, which proved significantly shorter
than Span 3, UK 2, Swed 1, Swed 2 and UK 3 (respective medians of 81.9, 83.8, 88.3, 94.4
and 99.7 min). UK 3 required the greatest amount of time to recover from chill coma
(median 99.7 min), significantly more time than UK 1, Span 1, Span 2, Swed 3 and Span 3
(respective medians of 65.2, 70.6, 72.0, 79.8 and 81.9 min).
The duration until aphids spontaneously walked following chill coma ranged from 103.5 to
161.5 min, approximating 7.4°C to 13.2°C (Figure 19I). UK 1 took the shortest duration of
103.5 min to spontaneously walk, significantly less than all other clones. Although clones
Span 1 and Swed 1 required the longest duration until spontaneous walking following chill
coma (median value 161.5 and 159.5 min respectively), this proved only significantly longer
than that required by UK 1, Span 2, Swed 2, UK 2 and, for Swed 1, Span 3.
Following further acclimation to 25°C over three generations, no significant
intergenerational effect on the duration required until the aphid exited chill coma or engaged
in spontaneous walking was observed. The duration required for aphids to exit chill coma
ranged from a median value of 74.8 to 92.8 min, approximating 4.5°C to 6.3°C (Figure 19II).
No significant differences were observed between the durations with the exception of Swed
2 (median 92.8 min) taking significantly greater time to exit chill coma than UK 1 and Span
2 (medians 76.6 and 74.8 min respectively).
The duration until aphids, acclimated to 25°C for three generations, spontaneously walked
following chill coma ranged from 114.9 to 166.2 min, approximating 8.5°C to 13.6°C
(Figure 19II). As observed following acclimation for one generation, following acclimation
to three generations, clone UK 1 once again required the shortest duration to spontaneously
walk (median 114.9 min). This proved significantly less than all other clones with the
exception of Span 2 and UK 2. The longest durations were required by Swed 1 and Swed 3
(medians 160.8 and 166.2 min respectively). Swed 3 required a significantly longer duration
97
to exit chill coma than all other clones excluding Swed 1 and UK 3. Swed 1 was shown to
only require significantly greater time to spontaneous walk than UK 1, Span 2 and UK 2.
When comparing across all clones and treatments, clones UK 3 and Swed 2 consistently
exited chill coma after shorter durations following low temperature acclimation (10°C) and
clones UK 1 and Span 2 following high temperature acclimation (25°C). Clones Swed 1,
Swed 2 and UK 2 consistently required longer durations to exit chill coma following
acclimation to high temperatures. With regard to duration until spontaneous walking
occurred following chill coma recovery, UK 1 was consistently one of the quickest clones to
regain the ability to walk following acclimation to both high and low temperatures. Span 3
was consistently one of the quickest clones following low temperature acclimation and Span
2 one of the quickest following high temperature acclimation. After both high and low
temperature acclimation, clones Swed 1 and Swed 3 consistently required the longest
duration to spontaneously walk following chill coma.
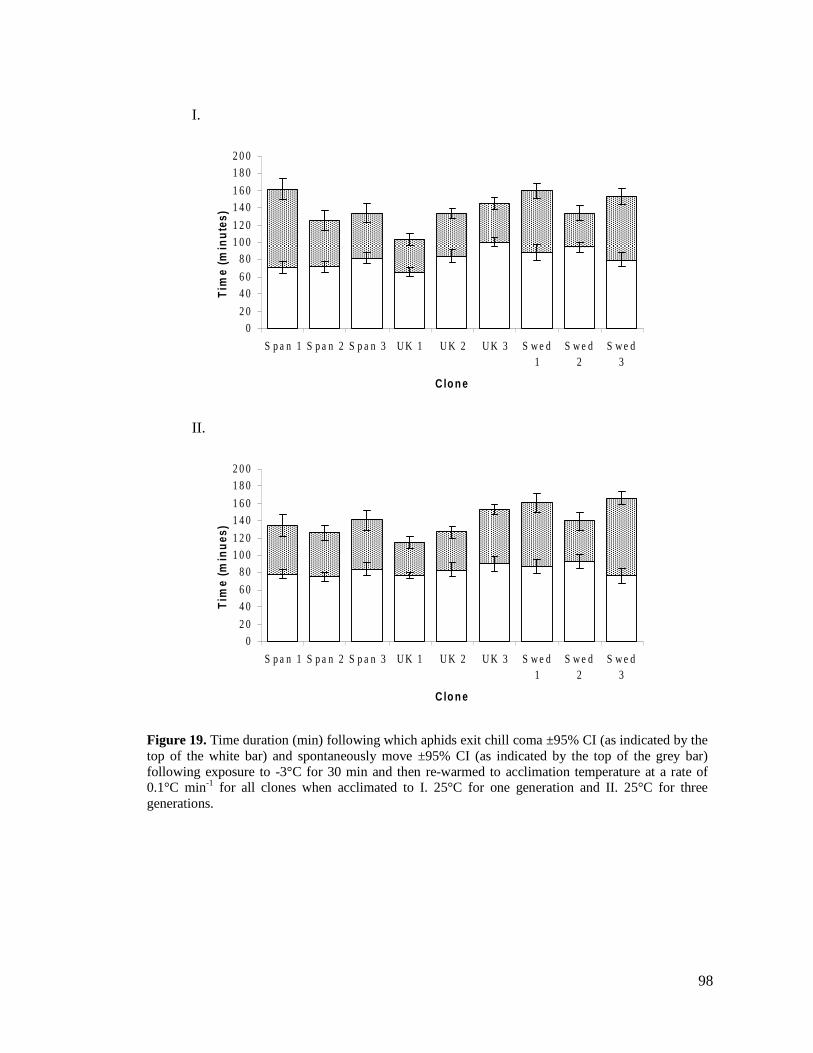
98
I.
0
20
40
60
80
100
120
140
160
180
200
S pan 1 S pan 2 S pan 3 UK 1 UK 2 UK 3 S wed
1
S wed
2
S wed
3
Clo n e
Tim
e (
min
ute
s)
II.
0
20
40
60
80
100
120
140
160
180
200
S pan 1 S pan 2 S pan 3 UK 1 UK 2 UK 3 S wed
1
S wed
2
S wed
3
Clo n e
Tim
e (
min
ue
s)
Figure 19. Time duration (min) following which aphids exit chill coma ±95% CI (as indicated by the top of the white bar) and spontaneously move ±95% CI (as indicated by the top of the grey bar) following exposure to -3°C for 30 min and then re-warmed to acclimation temperature at a rate of 0.1°C min-1 for all clones when acclimated to I. 25°C for one generation and II. 25°C for three generations.
99
5.5 Discussion
In this chapter, the results of experiments designed to investigate the behavioural
ecophysiology of Myzus persicae clones collected along a latitudinal gradient across Europe
have been described. The experiments aimed to: 1. Determine levels of plasticity in activity
thresholds and how these thresholds are affected by rearing temperature. 2. Establish if
clones collected from latitudinally distinct regions differ in their ability to tolerate
temperature extremes. 3. Investigate the relationships between the activity thresholds to
ascertain how temperature tolerance range changes when aphids are acclimated to different
temperatures and if relationships show interclonal variation.
5.5.1 Plasticity of activity threshold
The capacity of aphids to retain the ability to walk and avoid cold induced comas at low
temperatures is crucial to winter survival if aphids are to escape predation and engage in
fine-scale migrations from senescing leaves to fresh food sources (Bale, 1987; Harrington &
Taylor, 1990). In M. persicae, the chill movement threshold was shown to be plastic within a
single generation and could be depressed following acclimation at 10°C, thus allowing the
aphid to remain active to lower temperatures. This ability of aphids to track changing
environmental temperatures is, as previously discussed, of great ecological importance if the
aphids are to remain active throughout cold spells, enabling the continuation of feeding,
avoiding predation and finding suitable mates (applicable to sexual morphs of the holocyclic
lifecycle). No consistent directional effect of high temperature acclimation on chill
movement threshold was evident, although the majority of clones did experience a reduction
in the ability to remain active to low temperatures. Heat movement threshold was shown to
be plastic within a single generation with acclimation at 10°C decreasing heat movement
threshold and acclimation at 25°C increasing heat movement threshold.
Chill coma temperatures were shown to be plastic within a single generation, with the
temperatures inducing chill coma decreasing following acclimation at 10°C and increasing
following acclimation at 25°C relative to the culture temperature of 20°C, as previously
100
demonstrated for chill coma temperatures in Drosophila species (Gibert & Huey, 2001),
aphids of the genus Myzus (Hazell et al., 2010a) and for lower lethal temperatures in S.
avenae (Powell & Bale, 2008) and M. persicae (Chapter 4 of current thesis). In contrast to
chill coma, variation in heat coma was much lower. Although the temperature of heat coma
was not decreased through low temperature acclimation, high temperature acclimation within
a single generation did raise heat coma temperature in the majority of clones and thus
increasing activity thresholds.
In a previous study comparing heat movement and heat coma temperatures in aphids of the
genus Myzus, M. persicae was found to exhibit the highest thresholds and thus greatest levels
of heat tolerance, although had the lowest ability to acclimate at high temperatures (Hazell et
al., 2010b). From this, the authors concluded that M. persicae exist near to their upper
thermal limit (Hazell et al., 2010b), resulting in a trade off between physiological limit and
plasticity (Stillman, 2003). As indicated in the current study, plasticity of upper limits is
much compressed in comparison to lower limits, with acclimation often only acting to
change upper limits by less than 1°C. With current trends of increasing global temperatures
(Karl et al., 2000), should the physiological limit and plasticity trade off apply, upper
thermal limits could play an increasingly important role in limiting populations of M.
persicae.
Aphids begin development within their grandmothers, a phenomenon known as ‘telescoping
of generations’ (Kindlmann & Dixon, 1989). As a result, aphids have the potential to begin
acclimating to environmental conditions prior to birth. Intergenerational acclimation is
described in a study on S. avenae where the LLT50 of a single clone decreased with each
successive generation (LLT50 declined from -13.6°C after one generation at 10°C, to -15.0°C
after two generations and to -16.4°C after three generations) (Powell & Bale, 2008).
However, data concerning lethal temperatures of nine M. persicae clones (presented in
Chapter 4 of the current thesis) failed to provide consistent evidence for a role of
intergenerational acclimation. Likewise, data presented in this chapter did not support
intergenerational acclimation. Acclimation at 10°C over three generations did not
significantly decrease chill coma, chill movement threshold or heat coma in the majority of
clones. Intergenerational acclimation did impact heat movement threshold (4 out of 9
101
comparisons proved significant) although was not consistent in its effect. As with
acclimation at 10°C, acclimation at 25°C for three generations did not significantly increase
chill coma, chill movement or heat coma in the majority of clones. Intergenerational
acclimation resulted in increasing heat movement in only three of the nine clones. The lack
of evidence provided in the current study to suggest an effect of intergenerational
acclimation is supported by previous work on the three aphid species M. persicae, M.
ornatus and M. polaris, for which only one out of thirty long term acclimation tests
suggested the possibility of intergenerational acclimation (Hazell et al., 2010a). It can be
concluded that the majority of aphids of the genus Myzus have little or no ability to continue
the acclimation process over successive generations.
5.5.2 Geographic variation in activity thresholds
Geographic variation in insect thermal tolerance and activity thresholds has provided the
focus for recent research in Coleoptera (Calosi et al., 2010), Collembola (Bahrndorff et al.,
2006; 2009a) and Diptera (Goto & Kimura, 1998; Gibert & Huey, 2001; Gibert et al., 2001b;
Chen & Kang, 2004) with research suggesting that measures of thermal tolerance and
activity levels are related to latitude. An understanding of the relationship between thermal
tolerance and geography in the major pest species M. persicae provides, not only information
on how species distribution and pest outbreaks could alter in a changing climate, but will
also indicate levels of gene flow between geographically separate aphid populations and thus
the potential for speciation.
As previously discussed, aphids inhabiting a region, such as the Mediterranean, where harsh
winter conditions are a rarity would be unlikely to experience sub-zero temperatures and, as
a consequence, tolerance to such temperatures would provide few advantages and could even
prove costly in terms of resources. Investment in heat tolerance and maintaining activity at
high temperatures would be more beneficial to a Mediterranean aphid. Conversely, aphids
inhabiting regions such as Scandinavia and temperate Britain have a greater probability of
experiencing sub-zero temperatures, and thus would be predicted to show greater levels of
low temperature tolerance and a greater ability to maintain activity at low temperatures,
102
especially if there was little or no immigration to resident populations. Due to comparatively
mild summer temperatures, investment in heat tolerance and high temperature activity would
provide few advantages for Scandinavian clones. However, should outdoor Scandinavian
populations rely on annual migrations from other parts of Europe for persistence, it would be
expected that Scandinavian clones would not demonstrate greater levels of cold tolerance or
low temperature activity levels than their temperate and Mediterranean counterparts.
Likewise, should aphid redistribution be extensive throughout Europe, geographic adaptation
in thermal tolerance and activity thresholds would not be expected at all.
In the current study, interclonal variation in the temperature at which movement ceased and
chill coma was induced at low temperatures was apparent, although did not appear to show a
consistent trend with latitude. Temperate clones UK 1 and UK 2 consistently had some of the
highest low temperature activity thresholds, both ceasing movement and entering chill coma
at higher temperatures than the remaining clones following all acclimation treatments. The
clones with consistently low activity threshold temperatures included the Mediterranean
clones Span 2 and 3 and the temperate clone UK 3, with these clones retaining the ability to
walk to lower temperatures. Span 1 and Swed 1 proved the most tolerant with regard to chill
coma, avoiding chill coma to lower temperatures than the remaining clones. The data
therefore do not support the hypothesis that Scandinavian clones are more cold tolerant or
better adapted to low temperatures than temperate or Mediterranean clones. This is most
likely due to an inability of Scandinavian aphid populations to overwinter, unless in
protected areas, owing to a combination of a lack of primary host plants to support the
holocyclic lifecycle and harsh winter temperatures acting on anholocyclic clones. Local
adaptation to harsh winters would not occur if aphids overwinter in protected areas or if
immigrations from other parts of Europe are required to increase or renew post-winter
populations.
No relationship between latitude and the temperature at which aphids ceased to move at high
temperatures was apparent. However, a clear relationship was seen with the temperature of
heat coma. Scandinavian clones Swed 2 and Swed 3 were consistently the least active and
tolerant to high temperatures, entering heat coma at temperatures lower than the remaining
clones. The three Mediterranean clones, Span 1, 2 and 3 had the highest activity thresholds at
103
high temperature, avoiding heat coma to higher temperatures at the majority of acclimation
treatments. Results would suggest latitudinal variation in the temperature inducing heat
coma, with Mediterranean clones having higher thresholds than their temperate and
Scandinavian counterparts, and the Scandinavian clones having lower thresholds than their
temperate and Mediterranean counterparts. This supports the hypothesis that Mediterranean
populations could persist continuously in the more favourable Mediterranean climate without
the need for extensive migrations, allowing opportunity to adapt to local conditions in the
form of increased heat tolerance and activity levels.
In addition to influencing coma temperatures, the literature details studies demonstrating the
effects of rearing temperature and latitude on recovery times from chill coma, with recovery
times being positively related to rearing temperatures and negatively related to latitude,
although with a focus on Drosophila species (David et al., 1998; Gibert et al., 2001b;
Ayrinhac et al., 2004; Macdonald et al., 2004; Rako & Hoffmann, 2006). As previously
stated, the ability to regain movement following cold shock is ecologically important if an
insect is to survive and contribute to the next generation (Bale, 1987). If recovery from chill
coma in M. persicae is related to latitude, it would be predicted that clones collected from
Scandinavia, where harsh winters are a common occurrence, would show quicker recovery
from chill coma than Mediterranean clones. This was not supported by the current study,
with Scandinavian clones Swed 1 and Swed 3 consistently having some of the longest
complete recovery times from chill coma and UK 1 some of the shortest complete recovery
times, disproving the hypothesis stated in the Introduction that Scandinavian clones would be
more cold tolerant than clones collected from other regions, most likely due to the annual
influx of aphids from other parts of Europe.
All clones in the current study were categorized into different clonal types using
microsatellite analysis, with clones of the same type being those genetically identical at the
loci examined. Although clones of the same type can not be confirmed as being genetically
identical, they are classified as having originated from an identical stem mother (Kasprowicz
et al., 2008). This information enabled testing into the hypothesis stated on page 32 of the
Introduction (that clones of the same type are more similar with regard to thermal tolerance
than clones of different types) and therefore, whether aphid thermal tolerance traits could
104
better be explained in relation to clonal type than latitude. In the previous chapter, clones
Swed 1 and Swed 3, both Type O clone, had comparatively high levels of thermal tolerance
with regard to lethal temperatures when compared to other clones of different types. In the
current study Swed 1 and Swed 3 were once again better adapted to low temperatures,
entering chill coma at relatively low temperatures across all acclimation treatments.
However, these two clones required some of the longest recovery times from chill coma.
Likewise, clones UK 1 and UK 2, both Type C clones, displayed similar activity levels with
regard to heat and chill movement and coma temperatures across all acclimation treatments,
most notably with their inability to maintain activity to temperatures as low as all other
clones. The third temperate clone, UK 3, a Type J clone, differed from the Type C temperate
clones, for example, having significantly lower chill movement and chill coma temperatures
after the majority of acclimation treatments. Data therefore suggest that clonal type could be
related to thermal tolerance and activity thresholds. However, Swed 2, also a Type C clone,
did not show similar patterns in activity thresholds as seen for UK 1 and UK 2. Since clones
of the same type are not necessarily genetically identical, only at the loci examined, variation
between clones of the same type could be a result of variation in the level of genetic
similarity between clones.
The three Mediterranean clones were classified as unique indicating that the clones were
different types, although had not previously been assigned a type letter code. If clones of
different types do differ in their thermal tolerances and activity thresholds, it would be
expected that the three Mediterranean clones would show different patterns in movement and
coma threshold temperatures across acclimation treatments. Although different patterns were
often observed, all three Mediterranean clones showed high levels of activity as indicated by
high heat movement and coma temperatures. As discussed above, it is suggested that this is
because Mediterranean clones can persist continuously in the favourable climate, allowing
adaptation to the local climate, with such local adaptation in heat tolerance and activity
thresholds possibly overriding any genetic effect of clonal type.
Due to the increased levels of high temperature activity observed for the Mediterranean
clones of different types and due to Swed 2 proving dissimilar to the temperate clones of the
same type, it is possible that a more complex interaction between clonal type and latitude is
105
at play. To better understand the relationship between thermal tolerance and clonal type, a
more extensive study would be required involving a larger number of clonal types and
replicates and could provide the focus for future work.
5.5.3 Relationships between activity threshold
It is reported in the literature that upper lethal temperatures of insects are less variable than
lower lethal temperatures (Gaston & Chown, 1999; Addo-Bediako et al., 2000; Chown 2001;
Terblanche et al., 2005). This was shown to be the case with lethal temperatures of M.
persicae (presented in Chapter 4) and is also true with respect to coma and movement
threshold temperatures. Both heat movement threshold and heat coma were less responsive
to acclimation treatment than chill movement threshold and chill coma, with variation
occurring over a much condensed temperature range. This is most probably due to the high
association between heat coma and lethality resulting in a reduced capacity for acclimation.
Hazell et al., (2010b) found no significant difference between temperatures of heat coma and
upper lethal limits (LT50) when aphids were reared at 15°C and 20°C, suggesting that heat
coma is not a reversible process like chill coma and results in irreparable physiological
damage, leading to insect death.
Since variation in heat movement threshold and heat coma temperature was less marked than
for chill movement threshold and chill coma temperature, activity ranges could be expanded
following acclimation to low temperatures. For all aphid clones with the exception of UK 1
and UK 2 (which displayed a greater reduction of 0.4°C per 1°C increase in rearing
temperature) the temperature range over which aphids could avoid a temperature-induced
coma decreased at a rate of 0.2°C per 1°C increase in rearing temperature. As a consequence,
aphids reared at 10°C showed an activity range 3°C greater than aphids reared at 25°C. The
greater rate of decline in activity range for UK 1 and UK 2 was also observed with
movement threshold temperatures. As discussed above, UK 1 and UK 2 were both Type C
clones. This provides further evidence in the support of the hypothesis that clones of the
same type are more similar with respect to thermal tolerance and activity thresholds than
clones of different types, acknowledging that a larger sample size would be required to test
106
this hypothesis more fully. With Earth’s climate warming at a rate of approximately 0.2°C
per decade (Karl et al., 2000), there could be a reduction in aphid activity ranges, which
could prove more pronounced for common temperate clones such as type C if the current
results are to be assumed.
In addition to tolerance ranges increasing with acclimation, it is reported that tolerance
ranges increase with latitude (Addo-Bediako et al., 2000) and altitude (in dung beetles:
Gaston & Chown, 1999; in frogs Navas, 1996ab, 1997), although ultimately linked to
temperature. One would expect Scandinavian M. persicae clones to display the largest
activity temperature range, the British clones an intermediate range, and finally the
Mediterranean clones to have the smallest range. However, current data do not indicate any
clear latitudinal relationship with activity range, further supporting the hypothesis that clonal
mixing occurs over such a large scale in Europe that local adaptation is prevented. The
comparatively reduced activity ranges of clones UK 1 and UK 2 are most likely a
consequence of their genetics linked to clonal type rather than latitude or an interaction of
the two factors.
In summary, the data demonstrate that thermal activity thresholds show levels of
intragenerational plasticity (i.e. within one generation), with chill coma and chill movement
threshold temperatures decreasing following low temperature acclimation and heat coma and
heat movement thresholds increasing following high temperature acclimation.
Intergenerational plasticity was not supported by the data. Evidence for latitudinal effects on
these thresholds was lacking with the exception of data concerning heat coma. Data therefore
support the hypothesis that gene flow and clonal mixing between populations occurs over
large scales across Europe preventing any distinct patterns in macrophysiology being
observed. Due to the high levels of heat coma tolerance observed in Spanish clones, the
hypothesis that local adaptation can occur in the Mediterranean because of an ability of
clonal populations to persist and locally adapt is supported. Data also suggest that clonal
type, as determined by microsatellite analysis, could impact activity thresholds, although
more extensive studies are required to confirm this. Furthermore, results demonstrate that
high temperature activity thresholds are less plastic than low temperature activity thresholds,

107
allowing the temperature range over which activity can be maintained to increase following
low temperature acclimation.
108
6 Comparison of the relative walking speeds of clones of the peach-potato
aphid Myzus persicae
6.1 Summary
This study investigated the variation in relative walking speeds of clones of M. persicae
collected along the species’ latitudinal distribution in Europe and the level of plasticity in
walking speeds after acclimation to different temperatures (10°C, 20°C and 25°C). Walking
speeds declined with decreasing temperature, with maximum performance at temperatures
closest to acclimation temperature (fastest median walking speed of 5.8 cm min-1 was
recorded for UK 3 at 25°C after acclimating to 25°C for one generation). Following
acclimation at both 20°C and 25°C aphids became immobile at temperatures as high as 7.5°C
and 12.5°C. However, acclimation at 10°C enabled mobility to occur to temperatures as low
as 0°C, which would have rendered aphids acclimated to 20°C and 25°C immobile. Clonal
variation was revealed with clone UK 3 outperforming the majority of clones across all
temperatures at which mobility was maintained following acclimation at 25°C for one
generation (median walking speeds of 5.8, 3.2, 2.3, 1.0 and 0.7 cm min-1 recorded at
temperatures 25, 22.5, 20, 17.5 and 15°C respectively), at 10°C for one generation (median
walking speeds of 4.6, 3.7, 2.0 and 1.0 cm min-1 recorded at temperatures 10, 7.5, 5, and
2.5°C respectively) and at 10°C over three generations (median walking speeds of 4.1, 2.7,
1.7 and 1.3 cm min-1 recorded at temperatures 10, 7.5, 5, and 2.5°C respectively). Following
acclimation at 25°C for three generations, UK 3 performed poorly, displaying some of the
slowest walking speeds (median walking speeds of 1.3, 0.7 and 0.6 cm min-1 recorded at
temperatures 25, 22.5 and 20°C). The Scandinavian clones, however, consistently
outperformed their temperate and Mediterranean counterparts at the majority of temperatures
following acclimation for three generations at 25°C (e.g. median walking speeds of 4.2, 4.5
and 3.5 cm min-1 recorded at 25°C for Swed 1, Swed 2 and Swed 3 respectively). There was
no relationship between mobility and latitude of origin.
109
6.2 Introduction
Earth’s climate has warmed by approximately 0.6°C over the past century (Easterling et al.,
1997, 2000; Walther et al., 2002), although this warming has not been a steady process and
since the mid 1970s parts of the world have experienced a rapid increase to a rate of
warming of 0.2°C per decade (Karl et al., 2000). Due to aphids, and indeed all insects, being
ectothermic, they possess a limited ability to regulate body temperature above or below
ambient. As a consequence, climate warming is likely to have profound effects on
distribution patterns and the pest and invasive status of insect species (e.g. Williams &
Liebhold, 1995; Parmesan, 1996; Hill et al., 1999; Parmesan et al., 1999; Yamamura &
Yokozawa, 2002; Battisti et al., 2005; Vanhanen et al., 2007; Tougou et al., 2009).
The majority of research into insect thermal biology has focused on the lethal effects of low
temperatures and the ability of insect species to exhibit seasonal and rapid cold hardening
(Bale et al., 1988; McDonald et al., 1997; Kelty & Lee, 1999; Powell & Bale, 2004, 2008).
However, as discussed in the previous chapter, non-lethal thermal thresholds must not be
overlooked in favour of lethal thermal thresholds. Due to the limited ability to regulate body
temperature, an insect’s thermal environment will affect many aspects of their biology and
behaviour. It is the non-lethal thermal tolerance traits such as temperatures of induced coma
and movement thresholds that provide ecologically relevant information since survival is of
little benefit if movement is compromised, resulting in mortality through inability to feed or
escape predation or parasitism.
A new method described in Hazell et al. (2008) has enabled the continuous recording and
measurement of non-lethal thermal tolerance traits in small insects. This method permits
multiple specimens to be cooled or heated within an arena and behavioural traits to be
recorded by video capture technology without disturbance to the specimens. The method has
already proven successful in determining movement and coma thresholds, which can
otherwise be hard to define (Hazell et al., 2010ab). More recently, the method has been
adopted to investigate relative walking speeds of predator and prey species to determine the
potential of a predatory insect to act as a biological control agent (Hughes et al., 2010).
110
This study will adopt this method to investigate relative walking speeds of M. persicae
clones collected along a latitudinal gradient in Europe to determine if locomotor function can
be altered via acclimation and if latitudinal adaptations exist. Due to the recent development
of the method, no study exists whereby latitudinal variation in relative walking speeds of an
insect species has been determined. Such information will be useful in increasing the
baseline knowledge on aphid thermal biology with implications for pest control and the
prediction of how and which clones or populations of M. persicae will be affected by climate
change.
6.3 Materials and methods
The nine experimental clones of M. persicae were kept as a stock culture at 20°C. First instar
nymphs (less than 24h old) were taken from the stock and acclimated at either 10°C or 25°C
for one or three generations prior to use of their offspring in experiments, as detailed in the
general materials and methods chapter. All nymphs used in experiments were first instars.
6.3.1 Walking speed
A sample of 5 aphids was placed within the arena set to the culture temperature. The arena
temperature was lowered from culture temperature at a rate of 0.5°C min-1. At 2.5°C
intervals, cooling was temporarily halted and the arena held at the specific temperature for 5
min, before cooling continued to the next temperature 2.5°C lower. Cooling continued in this
way until 0°C was reached. During the 5 min holding periods the camera (Infinity 1-1;
Lumenera Scientific, Canada) recorded aphid movement within the arena at a rate of 1 frame
per 5 sec and videos logged to a desktop computer. This was repeated with a new sample of
aphids to produce a total of 10 aphids for each clone by treatment combination.
Videos of aphid movement were played back using StudioMeasure (Studio86designs, UK),
frame by frame, with arena temperature and time displayed on the screen. Distance travelled
was measured using the computer mouse to mark the location of the aphid on screen. The
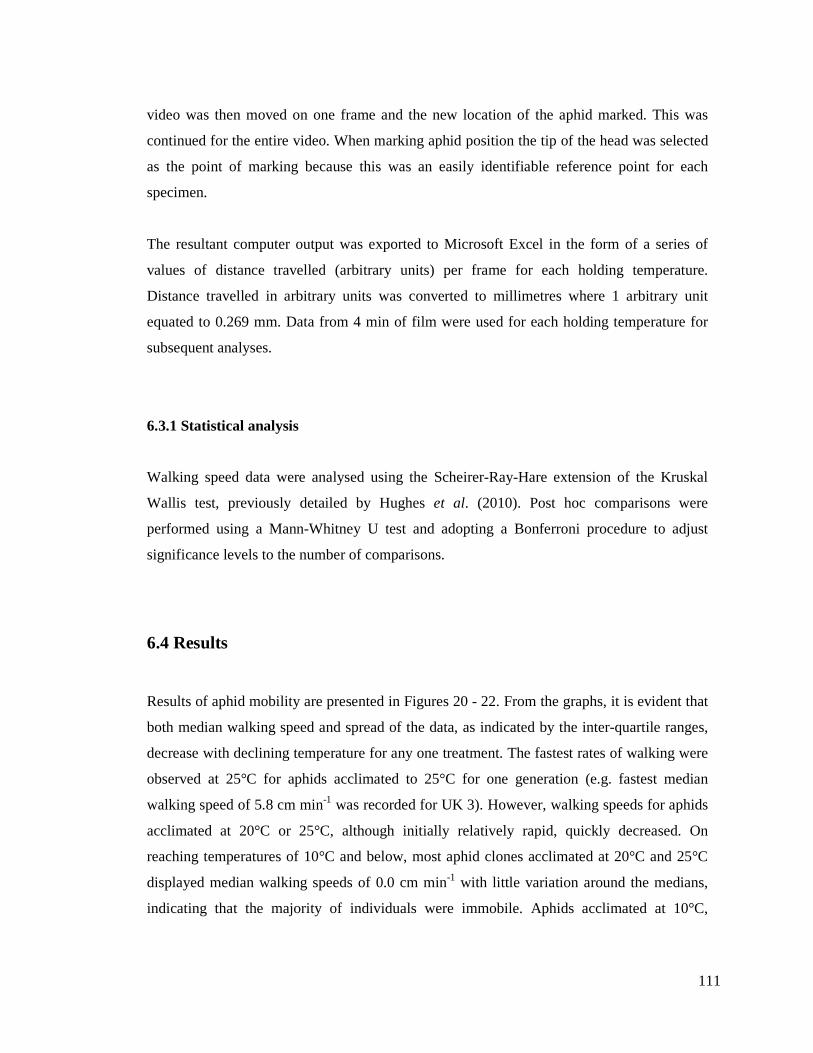
111
video was then moved on one frame and the new location of the aphid marked. This was
continued for the entire video. When marking aphid position the tip of the head was selected
as the point of marking because this was an easily identifiable reference point for each
specimen.
The resultant computer output was exported to Microsoft Excel in the form of a series of
values of distance travelled (arbitrary units) per frame for each holding temperature.
Distance travelled in arbitrary units was converted to millimetres where 1 arbitrary unit
equated to 0.269 mm. Data from 4 min of film were used for each holding temperature for
subsequent analyses.
6.3.1 Statistical analysis
Walking speed data were analysed using the Scheirer-Ray-Hare extension of the Kruskal
Wallis test, previously detailed by Hughes et al. (2010). Post hoc comparisons were
performed using a Mann-Whitney U test and adopting a Bonferroni procedure to adjust
significance levels to the number of comparisons.
6.4 Results
Results of aphid mobility are presented in Figures 20 - 22. From the graphs, it is evident that
both median walking speed and spread of the data, as indicated by the inter-quartile ranges,
decrease with declining temperature for any one treatment. The fastest rates of walking were
observed at 25°C for aphids acclimated to 25°C for one generation (e.g. fastest median
walking speed of 5.8 cm min-1 was recorded for UK 3). However, walking speeds for aphids
acclimated at 20°C or 25°C, although initially relatively rapid, quickly decreased. On
reaching temperatures of 10°C and below, most aphid clones acclimated at 20°C and 25°C
displayed median walking speeds of 0.0 cm min-1 with little variation around the medians,
indicating that the majority of individuals were immobile. Aphids acclimated at 10°C,
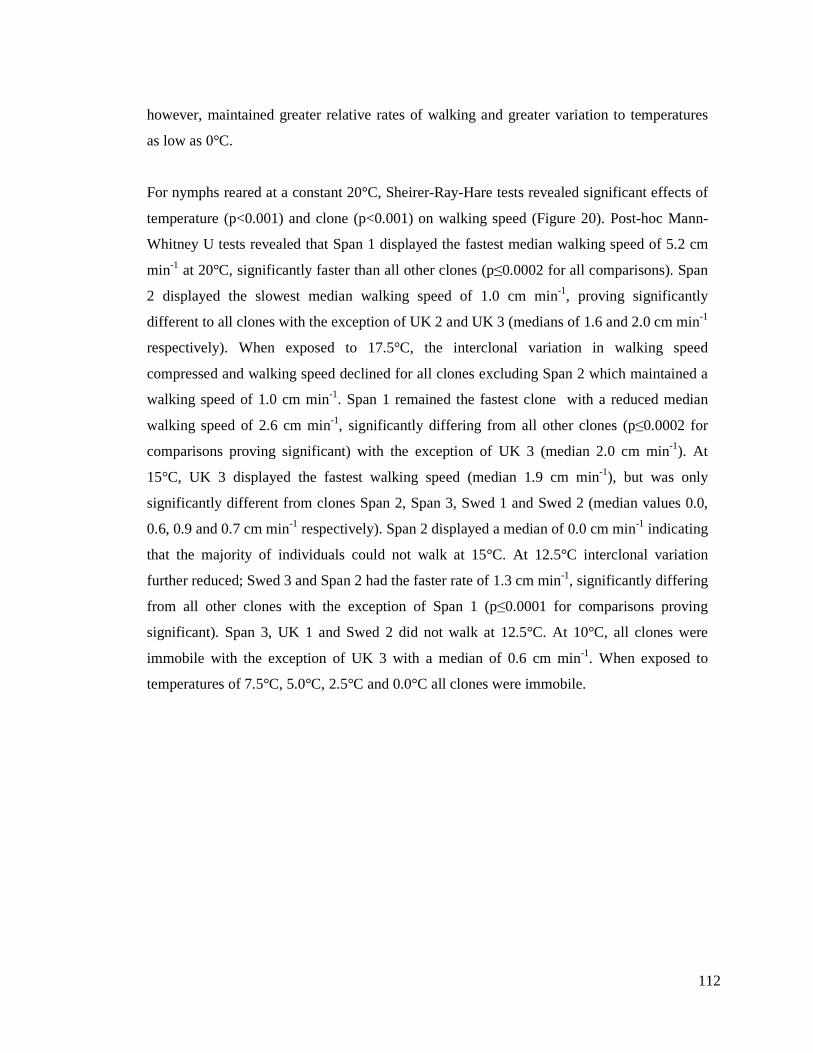
112
however, maintained greater relative rates of walking and greater variation to temperatures
as low as 0°C.
For nymphs reared at a constant 20°C, Sheirer-Ray-Hare tests revealed significant effects of
temperature (p<0.001) and clone (p<0.001) on walking speed (Figure 20). Post-hoc Mann-
Whitney U tests revealed that Span 1 displayed the fastest median walking speed of 5.2 cm
min-1 at 20°C, significantly faster than all other clones (p≤0.0002 for all comparisons). Span
2 displayed the slowest median walking speed of 1.0 cm min-1, proving significantly
different to all clones with the exception of UK 2 and UK 3 (medians of 1.6 and 2.0 cm min-1
respectively). When exposed to 17.5°C, the interclonal variation in walking speed
compressed and walking speed declined for all clones excluding Span 2 which maintained a
walking speed of 1.0 cm min-1. Span 1 remained the fastest clone with a reduced median
walking speed of 2.6 cm min-1, significantly differing from all other clones (p≤0.0002 for
comparisons proving significant) with the exception of UK 3 (median 2.0 cm min-1). At
15°C, UK 3 displayed the fastest walking speed (median 1.9 cm min-1), but was only
significantly different from clones Span 2, Span 3, Swed 1 and Swed 2 (median values 0.0,
0.6, 0.9 and 0.7 cm min-1 respectively). Span 2 displayed a median of 0.0 cm min-1 indicating
that the majority of individuals could not walk at 15°C. At 12.5°C interclonal variation
further reduced; Swed 3 and Span 2 had the faster rate of 1.3 cm min-1, significantly differing
from all other clones with the exception of Span 1 (p≤0.0001 for comparisons proving
significant). Span 3, UK 1 and Swed 2 did not walk at 12.5°C. At 10°C, all clones were
immobile with the exception of UK 3 with a median of 0.6 cm min-1. When exposed to
temperatures of 7.5°C, 5.0°C, 2.5°C and 0.0°C all clones were immobile.
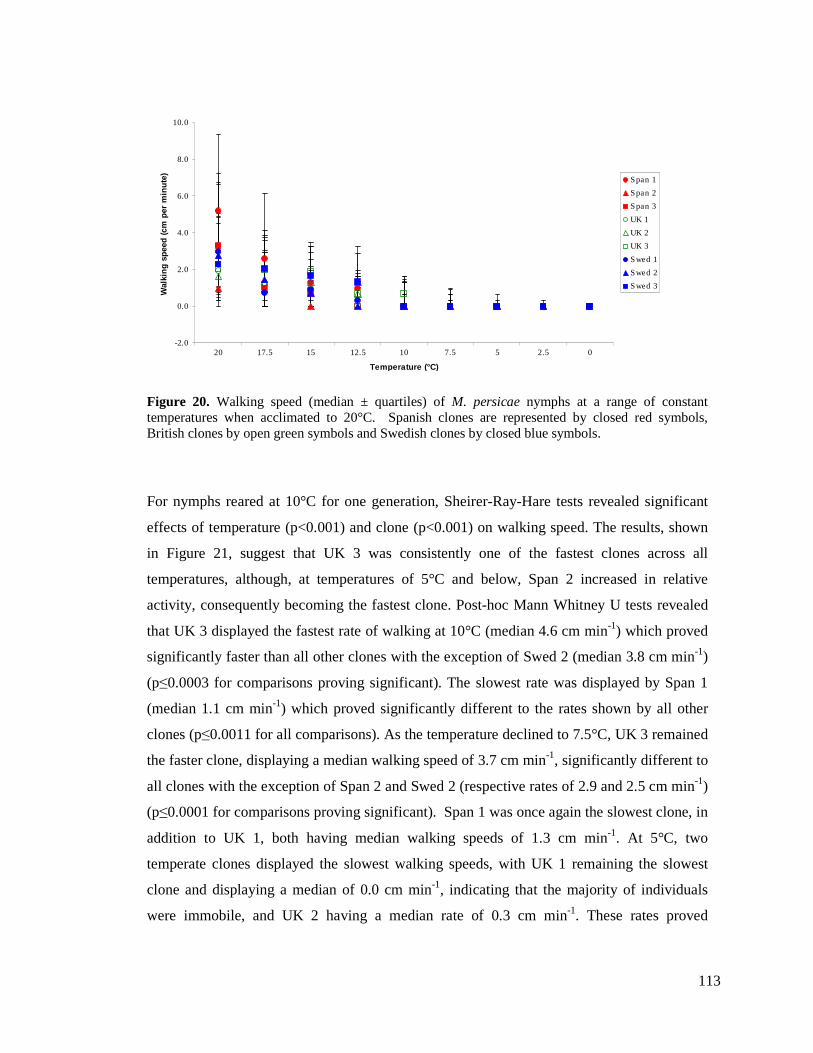
113
-2.0
0.0
2.0
4.0
6.0
8.0
10.0
20 17.5 15 12.5 10 7.5 5 2.5 0
Temperature (°C)
Walk
ing
sp
eed
(cm
per
min
ute
)
Span 1
Span 2
Span 3
UK 1
UK 2
UK 3
Swed 1
Swed 2
Swed 3
Figure 20. Walking speed (median ± quartiles) of M. persicae nymphs at a range of constant temperatures when acclimated to 20°C. Spanish clones are represented by closed red symbols, British clones by open green symbols and Swedish clones by closed blue symbols.
For nymphs reared at 10°C for one generation, Sheirer-Ray-Hare tests revealed significant
effects of temperature (p<0.001) and clone (p<0.001) on walking speed. The results, shown
in Figure 21, suggest that UK 3 was consistently one of the fastest clones across all
temperatures, although, at temperatures of 5°C and below, Span 2 increased in relative
activity, consequently becoming the fastest clone. Post-hoc Mann Whitney U tests revealed
that UK 3 displayed the fastest rate of walking at 10°C (median 4.6 cm min-1) which proved
significantly faster than all other clones with the exception of Swed 2 (median 3.8 cm min-1)
(p≤0.0003 for comparisons proving significant). The slowest rate was displayed by Span 1
(median 1.1 cm min-1) which proved significantly different to the rates shown by all other
clones (p≤0.0011 for all comparisons). As the temperature declined to 7.5°C, UK 3 remained
the faster clone, displaying a median walking speed of 3.7 cm min-1, significantly different to
all clones with the exception of Span 2 and Swed 2 (respective rates of 2.9 and 2.5 cm min-1)
(p≤0.0001 for comparisons proving significant). Span 1 was once again the slowest clone, in
addition to UK 1, both having median walking speeds of 1.3 cm min-1. At 5°C, two
temperate clones displayed the slowest walking speeds, with UK 1 remaining the slowest
clone and displaying a median of 0.0 cm min-1, indicating that the majority of individuals
were immobile, and UK 2 having a median rate of 0.3 cm min-1. These rates proved
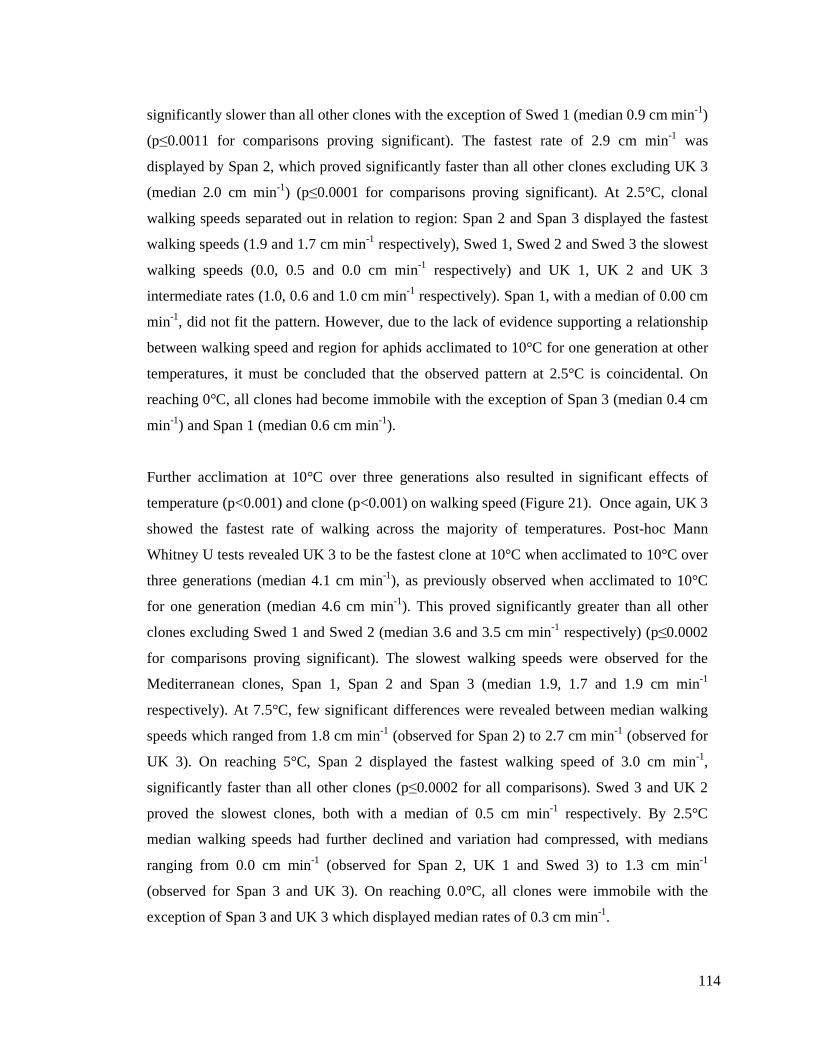
114
significantly slower than all other clones with the exception of Swed 1 (median 0.9 cm min-1)
(p≤0.0011 for comparisons proving significant). The fastest rate of 2.9 cm min-1 was
displayed by Span 2, which proved significantly faster than all other clones excluding UK 3
(median 2.0 cm min-1) (p≤0.0001 for comparisons proving significant). At 2.5°C, clonal
walking speeds separated out in relation to region: Span 2 and Span 3 displayed the fastest
walking speeds (1.9 and 1.7 cm min-1 respectively), Swed 1, Swed 2 and Swed 3 the slowest
walking speeds (0.0, 0.5 and 0.0 cm min-1 respectively) and UK 1, UK 2 and UK 3
intermediate rates (1.0, 0.6 and 1.0 cm min-1 respectively). Span 1, with a median of 0.00 cm
min-1, did not fit the pattern. However, due to the lack of evidence supporting a relationship
between walking speed and region for aphids acclimated to 10°C for one generation at other
temperatures, it must be concluded that the observed pattern at 2.5°C is coincidental. On
reaching 0°C, all clones had become immobile with the exception of Span 3 (median 0.4 cm
min-1) and Span 1 (median 0.6 cm min-1).
Further acclimation at 10°C over three generations also resulted in significant effects of
temperature (p<0.001) and clone (p<0.001) on walking speed (Figure 21). Once again, UK 3
showed the fastest rate of walking across the majority of temperatures. Post-hoc Mann
Whitney U tests revealed UK 3 to be the fastest clone at 10°C when acclimated to 10°C over
three generations (median 4.1 cm min-1), as previously observed when acclimated to 10°C
for one generation (median 4.6 cm min-1). This proved significantly greater than all other
clones excluding Swed 1 and Swed 2 (median 3.6 and 3.5 cm min-1 respectively) (p≤0.0002
for comparisons proving significant). The slowest walking speeds were observed for the
Mediterranean clones, Span 1, Span 2 and Span 3 (median 1.9, 1.7 and 1.9 cm min-1
respectively). At 7.5°C, few significant differences were revealed between median walking
speeds which ranged from 1.8 cm min-1 (observed for Span 2) to 2.7 cm min-1 (observed for
UK 3). On reaching 5°C, Span 2 displayed the fastest walking speed of 3.0 cm min-1,
significantly faster than all other clones (p≤0.0002 for all comparisons). Swed 3 and UK 2
proved the slowest clones, both with a median of 0.5 cm min-1 respectively. By 2.5°C
median walking speeds had further declined and variation had compressed, with medians
ranging from 0.0 cm min-1 (observed for Span 2, UK 1 and Swed 3) to 1.3 cm min-1
(observed for Span 3 and UK 3). On reaching 0.0°C, all clones were immobile with the
exception of Span 3 and UK 3 which displayed median rates of 0.3 cm min-1.
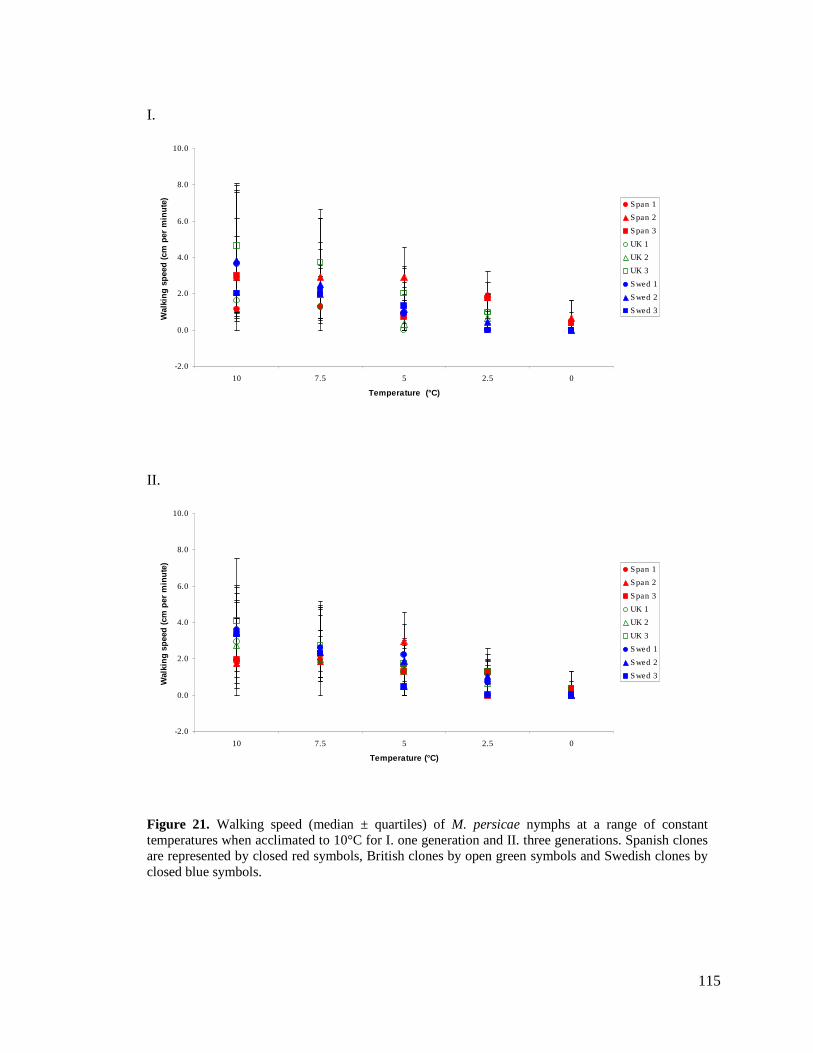
115
I.
-2.0
0.0
2.0
4.0
6.0
8.0
10.0
10 7.5 5 2.5 0
Temperature (°C)
Walk
ing
sp
eed
(cm
per
min
ute
)
Span 1
Span 2
Span 3
UK 1
UK 2
UK 3
Swed 1
Swed 2
Swed 3
II.
-2.0
0.0
2.0
4.0
6.0
8.0
10.0
10 7.5 5 2.5 0
Temperature (°C)
Walk
ing
sp
eed
(cm
per
min
ute
)
Span 1
Span 2
Span 3
UK 1
UK 2
UK 3
Swed 1
Swed 2
Swed 3
Figure 21. Walking speed (median ± quartiles) of M. persicae nymphs at a range of constant temperatures when acclimated to 10°C for I. one generation and II. three generations. Spanish clones are represented by closed red symbols, British clones by open green symbols and Swedish clones by closed blue symbols.
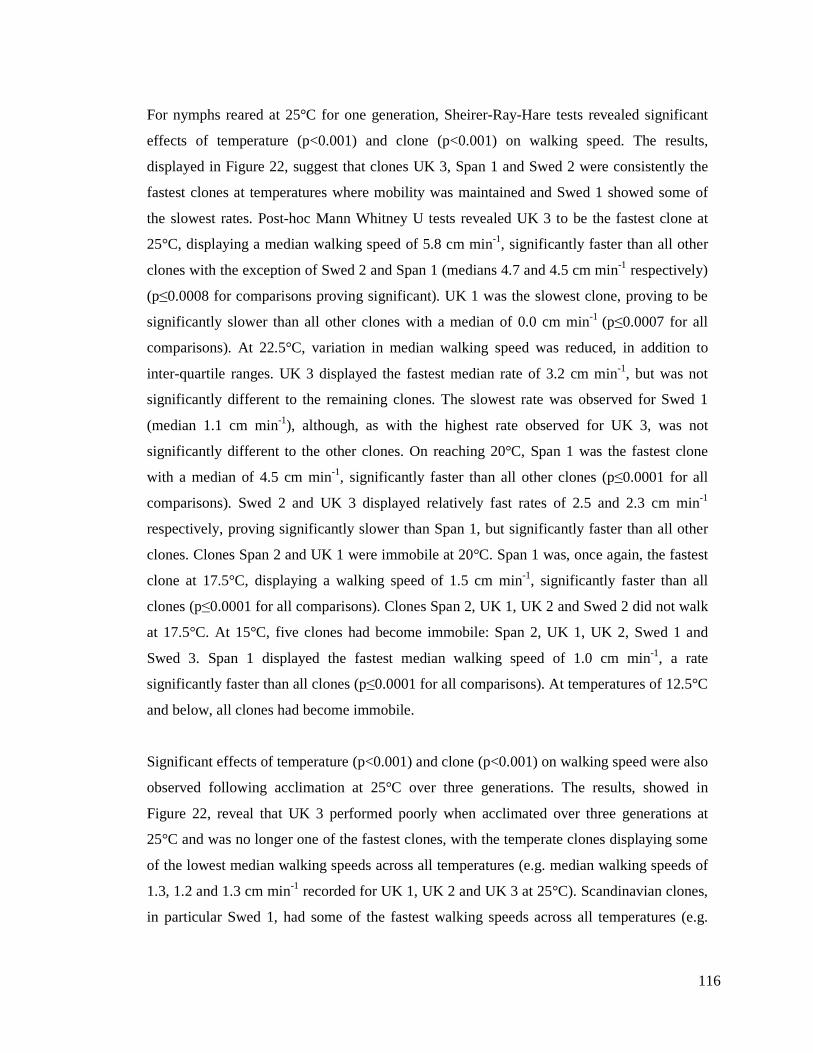
116
For nymphs reared at 25°C for one generation, Sheirer-Ray-Hare tests revealed significant
effects of temperature (p<0.001) and clone (p<0.001) on walking speed. The results,
displayed in Figure 22, suggest that clones UK 3, Span 1 and Swed 2 were consistently the
fastest clones at temperatures where mobility was maintained and Swed 1 showed some of
the slowest rates. Post-hoc Mann Whitney U tests revealed UK 3 to be the fastest clone at
25°C, displaying a median walking speed of 5.8 cm min-1, significantly faster than all other
clones with the exception of Swed 2 and Span 1 (medians 4.7 and 4.5 cm min-1 respectively)
(p≤0.0008 for comparisons proving significant). UK 1 was the slowest clone, proving to be
significantly slower than all other clones with a median of 0.0 cm min-1 (p≤0.0007 for all
comparisons). At 22.5°C, variation in median walking speed was reduced, in addition to
inter-quartile ranges. UK 3 displayed the fastest median rate of 3.2 cm min-1, but was not
significantly different to the remaining clones. The slowest rate was observed for Swed 1
(median 1.1 cm min-1), although, as with the highest rate observed for UK 3, was not
significantly different to the other clones. On reaching 20°C, Span 1 was the fastest clone
with a median of 4.5 cm min-1, significantly faster than all other clones (p≤0.0001 for all
comparisons). Swed 2 and UK 3 displayed relatively fast rates of 2.5 and 2.3 cm min-1
respectively, proving significantly slower than Span 1, but significantly faster than all other
clones. Clones Span 2 and UK 1 were immobile at 20°C. Span 1 was, once again, the fastest
clone at 17.5°C, displaying a walking speed of 1.5 cm min-1, significantly faster than all
clones (p≤0.0001 for all comparisons). Clones Span 2, UK 1, UK 2 and Swed 2 did not walk
at 17.5°C. At 15°C, five clones had become immobile: Span 2, UK 1, UK 2, Swed 1 and
Swed 3. Span 1 displayed the fastest median walking speed of 1.0 cm min-1, a rate
significantly faster than all clones (p≤0.0001 for all comparisons). At temperatures of 12.5°C
and below, all clones had become immobile.
Significant effects of temperature (p<0.001) and clone (p<0.001) on walking speed were also
observed following acclimation at 25°C over three generations. The results, showed in
Figure 22, reveal that UK 3 performed poorly when acclimated over three generations at
25°C and was no longer one of the fastest clones, with the temperate clones displaying some
of the lowest median walking speeds across all temperatures (e.g. median walking speeds of
1.3, 1.2 and 1.3 cm min-1 recorded for UK 1, UK 2 and UK 3 at 25°C). Scandinavian clones,
in particular Swed 1, had some of the fastest walking speeds across all temperatures (e.g.
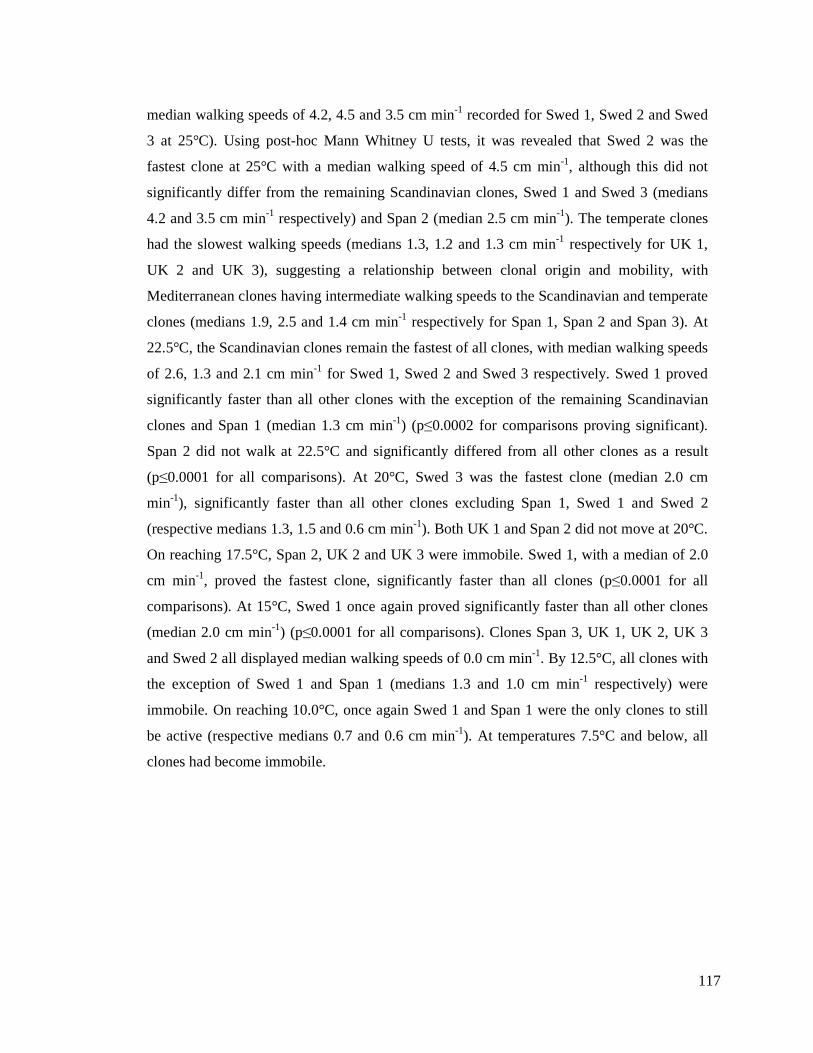
117
median walking speeds of 4.2, 4.5 and 3.5 cm min-1 recorded for Swed 1, Swed 2 and Swed
3 at 25°C). Using post-hoc Mann Whitney U tests, it was revealed that Swed 2 was the
fastest clone at 25°C with a median walking speed of 4.5 cm min-1, although this did not
significantly differ from the remaining Scandinavian clones, Swed 1 and Swed 3 (medians
4.2 and 3.5 cm min-1 respectively) and Span 2 (median 2.5 cm min-1). The temperate clones
had the slowest walking speeds (medians 1.3, 1.2 and 1.3 cm min-1 respectively for UK 1,
UK 2 and UK 3), suggesting a relationship between clonal origin and mobility, with
Mediterranean clones having intermediate walking speeds to the Scandinavian and temperate
clones (medians 1.9, 2.5 and 1.4 cm min-1 respectively for Span 1, Span 2 and Span 3). At
22.5°C, the Scandinavian clones remain the fastest of all clones, with median walking speeds
of 2.6, 1.3 and 2.1 cm min-1 for Swed 1, Swed 2 and Swed 3 respectively. Swed 1 proved
significantly faster than all other clones with the exception of the remaining Scandinavian
clones and Span 1 (median 1.3 cm min-1) (p≤0.0002 for comparisons proving significant).
Span 2 did not walk at 22.5°C and significantly differed from all other clones as a result
(p≤0.0001 for all comparisons). At 20°C, Swed 3 was the fastest clone (median 2.0 cm
min-1), significantly faster than all other clones excluding Span 1, Swed 1 and Swed 2
(respective medians 1.3, 1.5 and 0.6 cm min-1). Both UK 1 and Span 2 did not move at 20°C.
On reaching 17.5°C, Span 2, UK 2 and UK 3 were immobile. Swed 1, with a median of 2.0
cm min-1, proved the fastest clone, significantly faster than all clones (p≤0.0001 for all
comparisons). At 15°C, Swed 1 once again proved significantly faster than all other clones
(median 2.0 cm min-1) (p≤0.0001 for all comparisons). Clones Span 3, UK 1, UK 2, UK 3
and Swed 2 all displayed median walking speeds of 0.0 cm min-1. By 12.5°C, all clones with
the exception of Swed 1 and Span 1 (medians 1.3 and 1.0 cm min-1 respectively) were
immobile. On reaching 10.0°C, once again Swed 1 and Span 1 were the only clones to still
be active (respective medians 0.7 and 0.6 cm min-1). At temperatures 7.5°C and below, all
clones had become immobile.
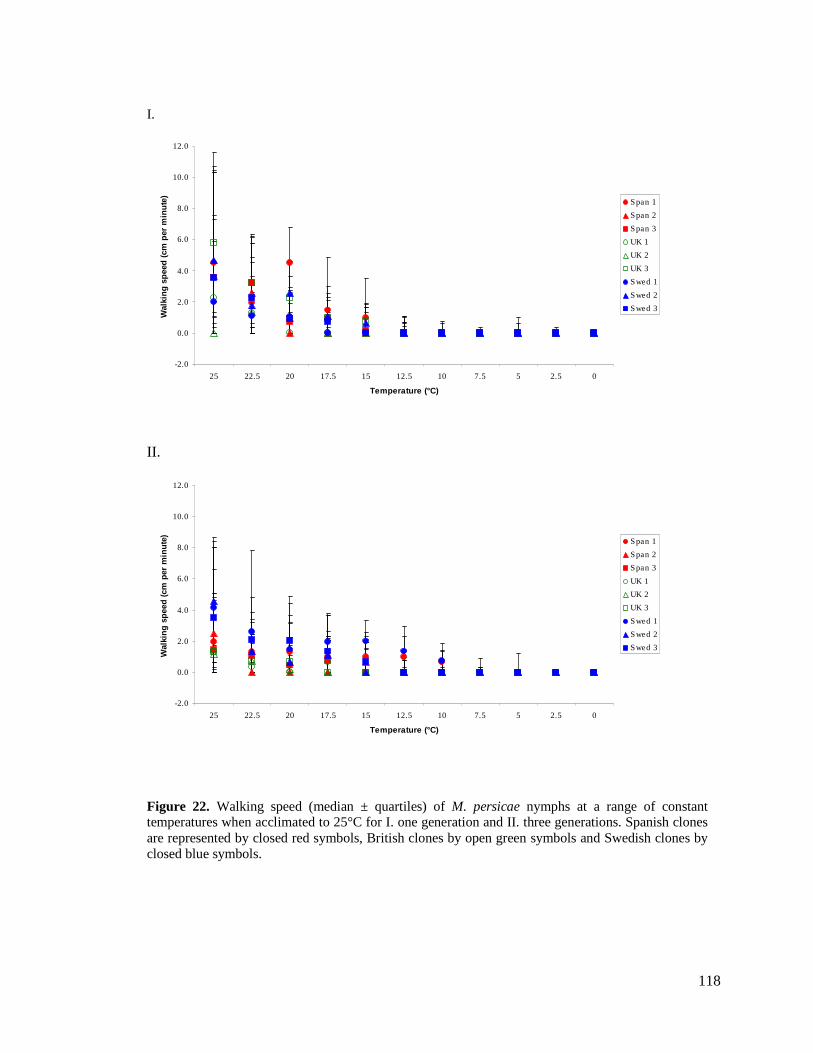
118
I.
-2.0
0.0
2.0
4.0
6.0
8.0
10.0
12.0
25 22.5 20 17.5 15 12.5 10 7.5 5 2.5 0
Temperature (°C)
Walk
ing
sp
eed
(cm
per
min
ute
)
Span 1
Span 2
Span 3
UK 1
UK 2
UK 3
Swed 1
Swed 2
Swed 3
II.
-2.0
0.0
2.0
4.0
6.0
8.0
10.0
12.0
25 22.5 20 17.5 15 12.5 10 7.5 5 2.5 0
Temperature (°C)
Walk
ing
sp
eed
(cm
per
min
ute
)
Span 1
Span 2
Span 3
UK 1
UK 2
UK 3
Swed 1
Swed 2
Swed 3
Figure 22. Walking speed (median ± quartiles) of M. persicae nymphs at a range of constant temperatures when acclimated to 25°C for I. one generation and II. three generations. Spanish clones are represented by closed red symbols, British clones by open green symbols and Swedish clones by closed blue symbols.
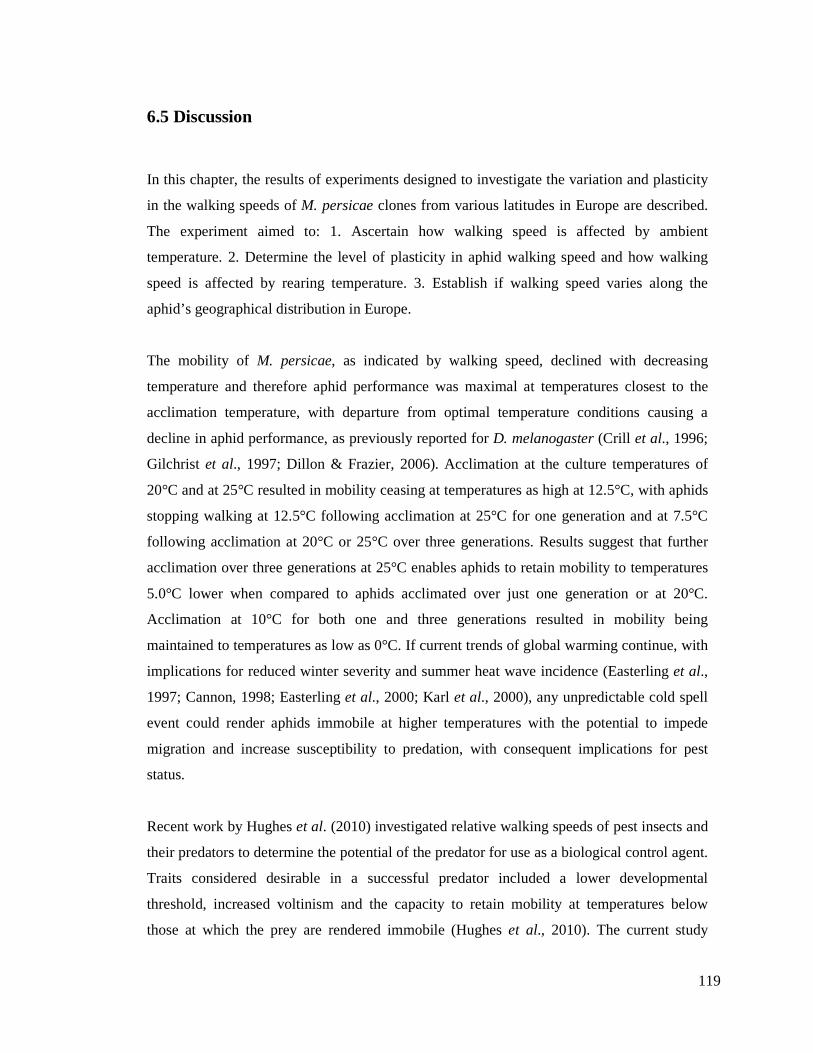
119
6.5 Discussion
In this chapter, the results of experiments designed to investigate the variation and plasticity
in the walking speeds of M. persicae clones from various latitudes in Europe are described.
The experiment aimed to: 1. Ascertain how walking speed is affected by ambient
temperature. 2. Determine the level of plasticity in aphid walking speed and how walking
speed is affected by rearing temperature. 3. Establish if walking speed varies along the
aphid’s geographical distribution in Europe.
The mobility of M. persicae, as indicated by walking speed, declined with decreasing
temperature and therefore aphid performance was maximal at temperatures closest to the
acclimation temperature, with departure from optimal temperature conditions causing a
decline in aphid performance, as previously reported for D. melanogaster (Crill et al., 1996;
Gilchrist et al., 1997; Dillon & Frazier, 2006). Acclimation at the culture temperatures of
20°C and at 25°C resulted in mobility ceasing at temperatures as high at 12.5°C, with aphids
stopping walking at 12.5°C following acclimation at 25°C for one generation and at 7.5°C
following acclimation at 20°C or 25°C over three generations. Results suggest that further
acclimation over three generations at 25°C enables aphids to retain mobility to temperatures
5.0°C lower when compared to aphids acclimated over just one generation or at 20°C.
Acclimation at 10°C for both one and three generations resulted in mobility being
maintained to temperatures as low as 0°C. If current trends of global warming continue, with
implications for reduced winter severity and summer heat wave incidence (Easterling et al.,
1997; Cannon, 1998; Easterling et al., 2000; Karl et al., 2000), any unpredictable cold spell
event could render aphids immobile at higher temperatures with the potential to impede
migration and increase susceptibility to predation, with consequent implications for pest
status.
Recent work by Hughes et al. (2010) investigated relative walking speeds of pest insects and
their predators to determine the potential of the predator for use as a biological control agent.
Traits considered desirable in a successful predator included a lower developmental
threshold, increased voltinism and the capacity to retain mobility at temperatures below
those at which the prey are rendered immobile (Hughes et al., 2010). The current study
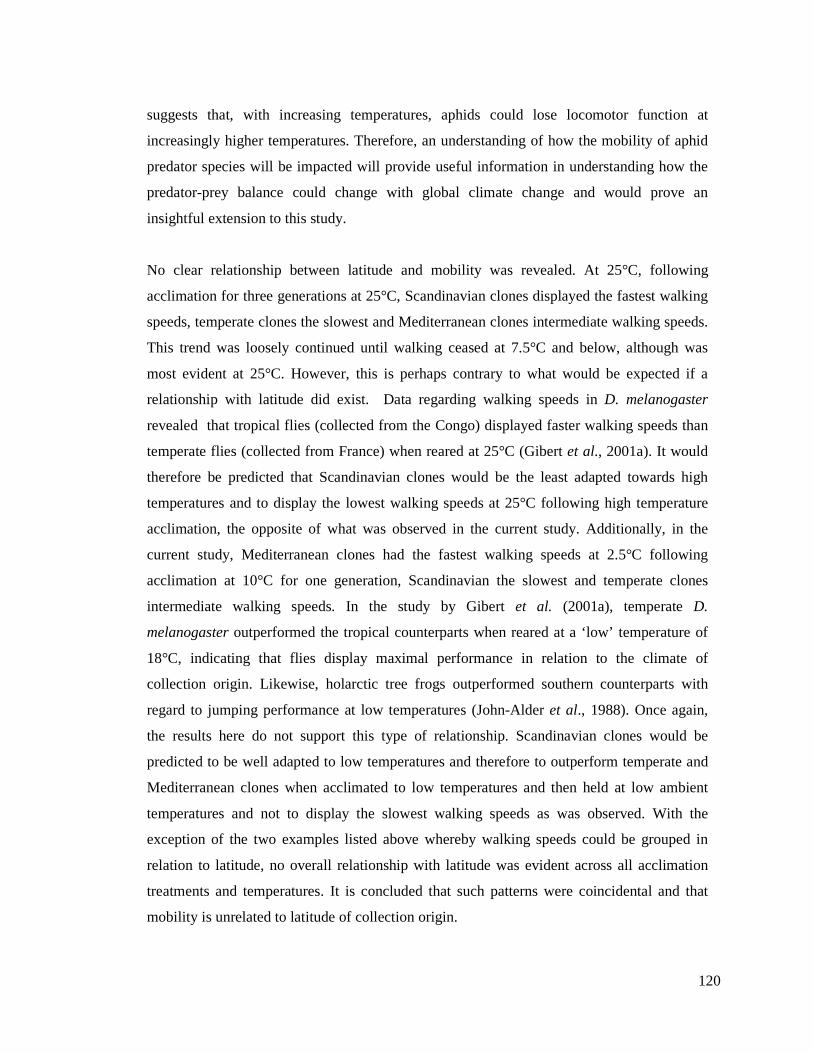
120
suggests that, with increasing temperatures, aphids could lose locomotor function at
increasingly higher temperatures. Therefore, an understanding of how the mobility of aphid
predator species will be impacted will provide useful information in understanding how the
predator-prey balance could change with global climate change and would prove an
insightful extension to this study.
No clear relationship between latitude and mobility was revealed. At 25°C, following
acclimation for three generations at 25°C, Scandinavian clones displayed the fastest walking
speeds, temperate clones the slowest and Mediterranean clones intermediate walking speeds.
This trend was loosely continued until walking ceased at 7.5°C and below, although was
most evident at 25°C. However, this is perhaps contrary to what would be expected if a
relationship with latitude did exist. Data regarding walking speeds in D. melanogaster
revealed that tropical flies (collected from the Congo) displayed faster walking speeds than
temperate flies (collected from France) when reared at 25°C (Gibert et al., 2001a). It would
therefore be predicted that Scandinavian clones would be the least adapted towards high
temperatures and to display the lowest walking speeds at 25°C following high temperature
acclimation, the opposite of what was observed in the current study. Additionally, in the
current study, Mediterranean clones had the fastest walking speeds at 2.5°C following
acclimation at 10°C for one generation, Scandinavian the slowest and temperate clones
intermediate walking speeds. In the study by Gibert et al. (2001a), temperate D.
melanogaster outperformed the tropical counterparts when reared at a ‘low’ temperature of
18°C, indicating that flies display maximal performance in relation to the climate of
collection origin. Likewise, holarctic tree frogs outperformed southern counterparts with
regard to jumping performance at low temperatures (John-Alder et al., 1988). Once again,
the results here do not support this type of relationship. Scandinavian clones would be
predicted to be well adapted to low temperatures and therefore to outperform temperate and
Mediterranean clones when acclimated to low temperatures and then held at low ambient
temperatures and not to display the slowest walking speeds as was observed. With the
exception of the two examples listed above whereby walking speeds could be grouped in
relation to latitude, no overall relationship with latitude was evident across all acclimation
treatments and temperatures. It is concluded that such patterns were coincidental and that
mobility is unrelated to latitude of collection origin.
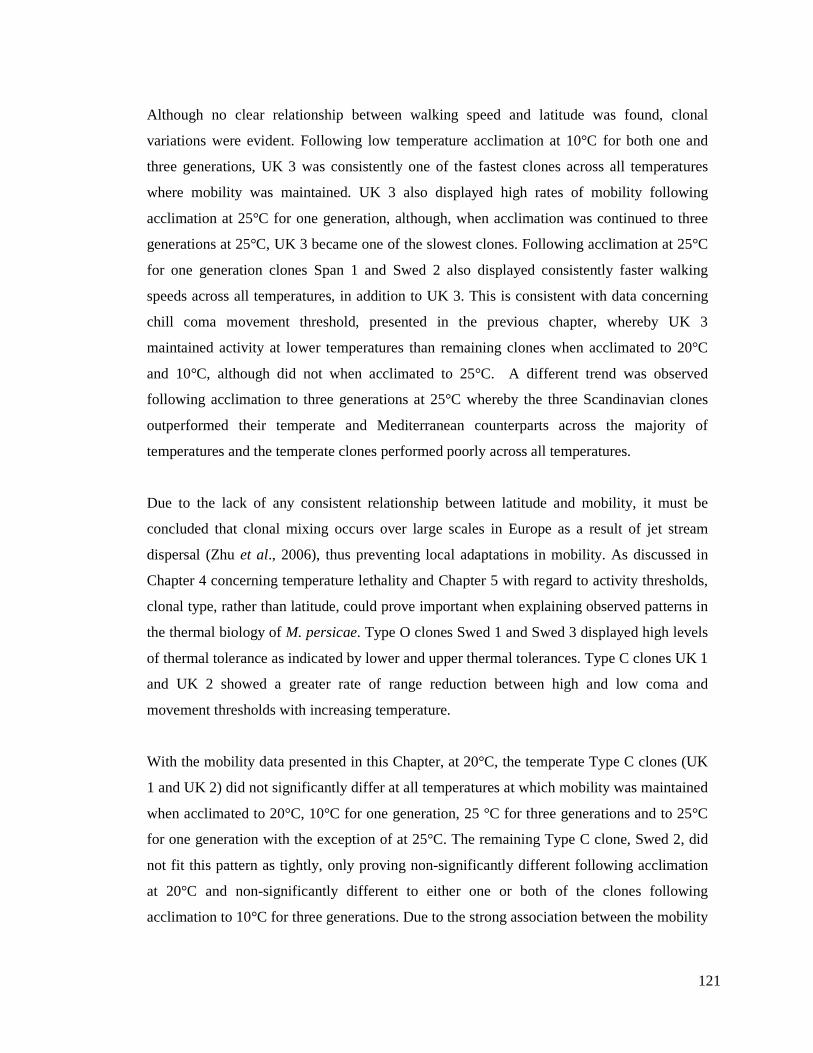
121
Although no clear relationship between walking speed and latitude was found, clonal
variations were evident. Following low temperature acclimation at 10°C for both one and
three generations, UK 3 was consistently one of the fastest clones across all temperatures
where mobility was maintained. UK 3 also displayed high rates of mobility following
acclimation at 25°C for one generation, although, when acclimation was continued to three
generations at 25°C, UK 3 became one of the slowest clones. Following acclimation at 25°C
for one generation clones Span 1 and Swed 2 also displayed consistently faster walking
speeds across all temperatures, in addition to UK 3. This is consistent with data concerning
chill coma movement threshold, presented in the previous chapter, whereby UK 3
maintained activity at lower temperatures than remaining clones when acclimated to 20°C
and 10°C, although did not when acclimated to 25°C. A different trend was observed
following acclimation to three generations at 25°C whereby the three Scandinavian clones
outperformed their temperate and Mediterranean counterparts across the majority of
temperatures and the temperate clones performed poorly across all temperatures.
Due to the lack of any consistent relationship between latitude and mobility, it must be
concluded that clonal mixing occurs over large scales in Europe as a result of jet stream
dispersal (Zhu et al., 2006), thus preventing local adaptations in mobility. As discussed in
Chapter 4 concerning temperature lethality and Chapter 5 with regard to activity thresholds,
clonal type, rather than latitude, could prove important when explaining observed patterns in
the thermal biology of M. persicae. Type O clones Swed 1 and Swed 3 displayed high levels
of thermal tolerance as indicated by lower and upper thermal tolerances. Type C clones UK 1
and UK 2 showed a greater rate of range reduction between high and low coma and
movement thresholds with increasing temperature.
With the mobility data presented in this Chapter, at 20°C, the temperate Type C clones (UK
1 and UK 2) did not significantly differ at all temperatures at which mobility was maintained
when acclimated to 20°C, 10°C for one generation, 25 °C for three generations and to 25°C
for one generation with the exception of at 25°C. The remaining Type C clone, Swed 2, did
not fit this pattern as tightly, only proving non-significantly different following acclimation
at 20°C and non-significantly different to either one or both of the clones following
acclimation to 10°C for three generations. Due to the strong association between the mobility
122
of UK 1 and UK 2, although a weaker association with Swed 2, it is plausible that UK 1 and
UK 2 are more genetically alike than Swed 2, although all originate from a common stem
mother. Likewise, the Type O clones, Swed 1 and Swed 2, showed a level of similarity with
their respective walking speeds, proving not significantly different at the majority of holding
temperatures following acclimation to 10°C and 25°C for both one and three generations.
In addition, UK 3 proved well adapted to retaining activity at low temperatures and to
maintaining fast walking speeds relative to the other experimental clones. Microsatellite
analysis revealed UK 3 to be a Type J clone. If thermal tolerance is related to clonal type, it
is possible that Type J clones are well adapted to maintaining activity levels at low
temperatures. However, only one Type J clone was included in the current study and more
Type J clones would be needed to confirm this. If thermal biology is a factor related to
clonal type as opposed to latitude, distinct clonal types would respond independently to
climate change, thus affecting the relative proportions of M. persicae clonal types within
populations.
In summary, data demonstrate that the mobility of M. persicae, as indicated by walking
speed, declined with decreasing temperature and that maximum performance was reached at
temperatures closest to acclimation temperature with walking speeds declining with
departure from optimum temperatures. Acclimation to lower temperatures further enabled
aphids to maintain mobility at lower temperatures which would have rendered the aphids
acclimated to higher temperatures immobile. Such findings could have implications for pest
status if increasing global temperatures raise aphid activity thresholds, affecting aphid ability
to cope with unpredictable cold spells. Data did not provide consistent evidence for a
relationship between walking speed and latitude, suggesting that large scale migrations occur
between aphid populations in Europe preventing local adaptation. Although a relationship
with latitude was not supported, clonal variation was observed, the most prominent of which
being UK 3 consistently displaying some of the fastest walking speeds following the
majority of acclimation treatments and Scandinavian clones outperforming their temperate
and Mediterranean counterparts following acclimation at 25°C over three generations. A
high level of similarity was observed between clones of the same type, although more
extensive testing is required to confirm if locomotor activity is related to clonal type.
123
7 General discussion
With global climate change already well documented, which in turn will greatly affect the
spatial and temporal distribution of aphid species, it is surprising that a detailed study
investigating the variation in aphid thermal biology along a latitudinal gradient is lacking.
The current study investigated the latitudinal variation in the thermal tolerance of nine clones
of Myzus persicae collected from Sweden, Britain and Spain and the extent to which thermal
tolerance levels can be altered through acclimation. In addition to an extensive, global
distribution, M. persicae has genetically distinct clones in both the sexual and asexual
lifecycles, leading to the possibility of four main outcomes when investigating large scale
variation in thermal tolerance: 1) a relationship between thermal tolerance and latitude exists
and regional adaptation occurs, 2) clonal mixing throughout Europe is extensive and no
relationship between thermal tolerance and latitude is observed, 3) Scandinavian clones are
no more cold tolerant than their temperate and Mediterranean counterparts due to being
unable to reside year round in Scandinavia, but increased heat tolerance is evident in
Mediterranean clones due to year round persistence enabling regional adaptation and 4)
clones differ in thermal tolerance according to their genetic ‘type’ and, as a consequence, any
pattern in thermal tolerance depends on the composition of the population at the time of
collection. In addition, the study further provided investigation into aphid thermal tolerance
at high temperatures and elucidated the relationships between upper and lower limits and
across different indices of thermal tolerance, an area of study also lacking in the literature.
7.1 Plasticity of thermal tolerance traits
Due to the short generation times of aphids, their ability to respond rapidly to sudden
changes in temperature over just one generation is considered to be of much greater
importance than long term acclimation processes (Powell & Bale, 2008). The current study
found that increased cold tolerance could be acquired following just one generation at a low
temperature (10°C), acting to decrease the lower lethal, chill movement (CTmin) and chill
coma temperatures. Low temperature acclimation also enabled aphids to maintain mobile at
lower temperatures. However, the level of cold tolerance was reduced on acclimation to a
124
high temperature (25°C). Likewise, the level of heat tolerance could be increased after one
generation of acclimation at a high temperature, acting to increase upper lethal, heat coma
and heat movement temperatures, although high temperature tolerance proved much less
plastic than lower thermal limits. Interestingly, low temperature acclimation also acted to
raise heat tolerance in the form of elevated upper lethal temperatures, indicating that the
physiological processes involved in conferring heat tolerance are also induced at low
temperatures. This is most likely due to the up-regulation of heat shock proteins through
exposure to both high and low stressful temperatures (Feder et al., 1992; Feder & Hofmann,
1999; Sørensen et al., 2003; Bahrndorff et al., 2009b). Although acclimation over one
generation was evident in M. persicae, further acclimation over three generations was not,
suggesting that the species is unable to increase levels of acclimation with each subsequent
generation. With global temperatures rising, these results suggest that aphids could
experience a reduced level of cold tolerance, making them more susceptible to unpredictable
cold spells. Heat tolerance is likely to increase, but with a limited ability to acclimate, this
cannot occur indefinitely and upper thermal limits could become increasingly important in
governing aphid abundance and distribution, as suggested by Hazell et al. (2010b).
This study further revealed that the upper thermal limits of M. persicae are much less plastic
and variable than the lower limits. A high association between heat coma temperature and
lethality has been reported, indicating that heat coma is not a reversible process like chill
coma and results in irreparable physiological damage and even insect death (Hazell et al.,
2010b). As a consequence of the greater plasticity of lower thermal limits, thermal tolerance
ranges with regard to both lethality and behavioural traits can be increased following
acclimation at low temperatures and reduced following acclimation at high temperatures.
With current estimates of climate change forecasting increased surface and air temperatures
(Cannon, 1998), a reduction in the thermal tolerance range of M. persicae could be expected,
resulting in a greater susceptibly of aphids to unpredictable bouts of extreme weather such as
frosts and heat waves. More interestingly, changes to the thermal tolerance range varied
between clones, with the temperate clones UK 1 and UK 2, both Type C clones, displaying
the greatest rate of range reduction for coma and movement temperatures with increasing
temperature. This finding suggests that climate change is unlikely to have a uniform effect
on all M. persicae clones, with common temperate clones such as Type C being more
125
strongly affected by increasing temperatures. It was hypothesised in the Introduction that
clones of the same type would be more similar with respect to thermal tolerance than clones
of differing types. The finding above (and the similarity between clones of Type O discussed
in section 7.3) supports the hypothesis, although the inference is weak and a more extensive
study involving a greater number of clonal types would be required to accept the hypothesis
and could provide the basis for future work.
7.2 Relationship between indices
Information concerning the relationships between mortality and activity thresholds in pest
aphid species is limited to a small number of studies (Powell & Bale, 2008; Hazell et al.,
2010ab), none of which have encompassed the number of indices of thermal tolerance used
in the current study. A clear relationship between indices of thermal tolerance was reported
for three aphid species of the genus Myzus where positive correlations were observed
between lower lethal and chill coma temperatures (Hazell et al., 2010a). In the study, M.
ornatus was shown to be the least cold tolerant, having higher LLT50 and chill coma
temperatures than M. persicae and M. polaris. Although correlations could be made between
thermal tolerance traits of different aphid species, it is unclear if such correlations are evident
between clones of the same species. The current study, not only provided opportunity to
investigate such relationships within a single species, but enabled correlations to be observed
using a more extensive set of thermal tolerance traits than used in previous studies.
Evidence in favour of a relationship between the different indices within any individual
clone of M. persicae was limited when comparisons were made using 20°C data to remove
any effect of acclimation. Few correlations existed between lethal temperatures and activity
thresholds and, consequently, the clone with the lowest LLT50 temperature, for instance, did
not necessarily have lower activity threshold temperatures. Where correlations were
observed, the correlations were not consistent across all indices. For example, Span 1
showed low temperatures of chill movement threshold and chill coma, and a short chill coma
recovery time, however, this was not coordinated with high levels of cold tolerance in the
form of a low LLT50. Likewise, UK 2 entered chill coma at a high temperature and required
126
a longer recovery period following chill coma. Although this did not correspond with a
reduction in cold tolerance and a high LLT50, UK 2 did have a high ULT50 and level of heat
tolerance.
Direct correlations between indices may be lacking in the literature, but differential effects of
treatments on activity thresholds and mortality can provide information on possible linkages
between traits. Studies on Drosophila melanogaster found that cold hardening could improve
mortality, but had little effect on recovery from chill coma (Rako & Hoffmann, 2006).
Similarly, long term acclimation had little effect on chill coma temperatures, although could
reduce mortality (Powell & Bale, 2008; Hazell et al., 2009, 2010a). Hazell et al. (2010a)
suggest that this indicates that at least two distinct processes determine thermal tolerance and
could offer explanation as to why correlations were evident between indices of activity
thresholds in the current study, yet why so few correlations between lethal temperatures and
activity thresholds existed. This further supports the idea that climate change is unlikely to
affect M. persicae clones uniformly.
7.3 Latitudinal variation in thermal tolerance
Geographic variation in insect thermal tolerance has received great interest in recent years,
with research on the Coleoptera (Calosi et al., 2010), Collembola (Bahrndorff et al., 2006;
2009) and Diptera (Davidson, 1990; Goto & Kimura, 1998; Gibert & Huey, 2001; Gibert et
al., 2001b; Bubliy et al., 2002; Ayrinhac et al., 2004; Chen & Kang, 2004) suggesting that
thermal tolerances are related to latitude. Results concerning geographic variation in M.
persicae thermal tolerance would prove useful, not only in providing information on how
and which populations are most likely to be affected by climate change, but also in
suggesting the level of clonal mixing throughout Europe.
Overall, data support hypothesis 3 that no latitudinal trend in thermal tolerance is evident,
with no observed relationship between the latitude of clone collection and either lethal
temperature, movement thresholds, chill coma and walking speeds. This also disproves
hypothesis 1 which states that Scandinavian clones would be more cold tolerant than their
127
temperate and Mediterranean counterparts and is best explained by the unfavourable
conditions in Scandinavia resulting in the need for annual migrations from other parts of
Europe to maintain populations, thus preventing local adaptation to the Scandinavian
climate. It is by this process of annual migration that outdoor populations of M. persicae are
able to persist in the northern Great Plains of America, with populations being annually re-
established by spring migrations from the south (Zhu et al., 2006). Large scale migrations by
aphids are also supported by data on S. avenae from samples collected in England
(Llewellyn et al., 2004) and the grain aphid Macrosiphum miscanti in Eastern China (Guo et
al., 2005). Conversely, data concerning M. miscanti in Western China (Guo et al., 2005) and
M. persicae in Italy (Angela et al., 2006) suggest a lack of clonal mixing and gene flow in
sexual forms, leading to the production of isolated populations, which could favour
speciation.
Although this study did not find a link between the thermal tolerance traits discussed above
and latitude, it did provide some evidence supporting latitudinal variation with
Mediterranean clones proving to be the most heat tolerant of clones in terms of their heat
coma temperature. This finding supports hypothesis 2 and suggests that Mediterranean
populations can persist in the favourable local climate without the need for extensive
migrations, allowing adaptation in the form of increased heat tolerance.
With the exception of heat coma data, there was no evidence in favour of a relationship with
latitude, indicating that clonal mixing across Europe must be extensive, at least across
Northern Europe, to override or mask any local adaptation. Although a relationship with
latitude was lacking, there was some indication of a relationship with clonal type, offering
support for hypothesis 4. The current study included nine clones of six different clonal types:
Type C (UK 1, UK 2 and Swed 2), Type O (Swed 1 and Swed 3), Type J (UK 3) and three
unique clones (Span 1, Span 2 and Span 3). The Mediterranean clones were unique,
indicating that they were different types, although none of them had been previously
assigned a type letter code. If a relationship between thermal tolerance and clonal type did
exist, clones of the same type would be expected to be more similar in thermal tolerance than
clones of different types. As discussed above, UK 1 and UK 2, both Type C clones,
displayed the greatest rate of reduction in thermal tolerance range with increasing
128
temperature, differing from all other clones. Additionally, a high level of thermal tolerance
was evident in Swed 1 and Swed 3, both Type O clones, in the form of lethal temperatures.
Also, UK 3, a Type J clone, showed high thermal tolerance in the form of low chill coma
temperatures and high rates of mobility across most acclimation treatments which
significantly differed from the Type C temperate clones at the majority of acclimation
temperatures.
Although clones of the same type did display similarities in thermal tolerance, Swed 2, a
Type C clone, was sometimes significantly different to the temperate Type C clones UK 1
and UK 2, notably with regard to the chill movement threshold and chill coma temperature.
Since clones of the same type are not necessarily genetically identical, only at the loci
examined, such variation in thermal tolerance of clones of the same type could be a result of
variation in the level of genetic similarity between clones. In addition, as discussed above,
the Mediterranean clones which proved to be of different types, possessed high levels of heat
tolerance, providing evidence in favour of local adaptation in regions where populations can
persist outside due to favourable conditions even though populations may be of different
clonal types.
The type O clone, a particularly thermal tolerant clone in the current study, is a MACE
carrying genotype new to Britain, first appearing in 2007. Numbers have since increased and
Type O now accounts for almost 95% of the clonal composition found within the UK, with
the clonal type fast displacing the previously common clones Type C, I and J (Fenton et al.,
2010). Part of the reason for the success of Type O is that it lacks the Kdr based resistance
mechanisms thought to be deleterious to aphids, affecting their response to environmental
cues (Fenton et al., 2010). As a consequence, aphids possessing Kdr mechanisms are
believed less fit and could explain the lack of thermal tolerance observed for Type C clones
in the current study. In addition, the Type J clone (UK 3), which displayed high thermal
tolerance with regard to mobility thresholds, also lacks the Kdr resistance mechanism,
further supporting the idea that such mechanisms are detrimental to aphids carrying them.
However, since clones of Type O are fast displacing those of Type J, it would appear that
factors additional to the presence of Kdr mechanisms must also be contributing to the fitness
of Type O clones.
129
As previously discussed, aphids possess the symbiotic bacterium Buchnera aphidicola,
which provides the aphid with nutrients and essential amino acids which are deficient in their
phloem sap diet (Douglas, 1998). Transmitted maternally via transovarial transmission,
genetic lines of Buchnera are therefore likely to be closely associated with distinct aphid
clonal types. It is reported that a mutation in Buchnera of the Pea aphid A. pisum consisting
of a single nucleotide deletion dramatically alters thermal tolerance, conferring fitness
advantages under cool temperature conditions, although proving detrimental following heat
shock (Dunbar et al., 2007). In addition, aphids are host to a variety of secondary symbionts
known to confer fitness advantages (Tsuchida et al., 2004; Oliver et al., 2005; Scarborough
et al., 2005), in particular, altering thermal tolerance (Chen et al., 2000; Montllor et al.,
2002; Russell & Moran, 2006; Burke et al., 2010). If bacterial symbionts form a close
association with specific aphid clonal types, variation in the symbionts specific to clonal
types could offer some explanation towards the variation in aphid thermal biology observed
in the current study.
The relationship between thermal tolerance and clonal type is therefore likely to be a
complex one. Interactions could exist between clonal type and latitude and it is possible that
patterns in clonal thermal tolerance could be masked when local adaptation is supported, as
observed with the Mediterranean clones. More intricately, variation in the thermal biology of
clonal types could be linked to variation in insecticide resistance mechanisms or the genetics
of bacterial symbionts associated with each type. However, should thermal tolerance be
related to clonal type, it could be expected that clonal types would respond independently to
climate change, thus affecting the relative proportions of M. persicae clonal types within
populations.
7.4 Future work
This study investigated variation in the thermal tolerance of M. persicae along a latitudinal
gradient. Although little evidence in support of latitudinal variation and regional adaptation
in thermal tolerance was observed, variation between distinct clonal types was apparent.
Variation between clonal types could be partially explained by differences in insecticide
130
resistance, with Type O clones gaining a fitness advantages through lacking the Kdr
mechanism and the associated costs of the mutation (Fenton et al., 2010). However, this does
not explain why Type O clones are successfully displacing Type J clones in Britain (Fenton
et al., 2010), a clone that proved very thermal tolerant in the current study and one which
also lacks the Kdr mechanism. Since mutations in Buchnera are reported to alter the thermal
biology of the pea aphid (Dunbar et al., 2007), it is plausible that genetic variation in the
Buchnera associated with different clonal types of M. persicae could further offer
explanation into the observed variation in thermal biology. To elucidate whether thermal
tolerance is best explained by clonal type, a more extensive study should be conducted by
selecting clones of the same type along a latitudinal gradient for comparative laboratory
experiments. Data concerning bacterial symbionts and resistance status of experimental
clones would further prove useful in determining the underlying factors that result in clonal
variation. Such information would prove useful in furthering our understanding of why
certain clonal types have increased in fitness in recent years and also enable prediction into
how climate change is likely to impact aphid distribution and clonal composition.
131
8 References
ADDO-BEDIAKO, A., CHOWN, S. L. & GASTON, K. J. (2000). Thermal tolerance,
climatic variability and latitude. Proceedings of the Royal Society of London Series
B: Biological Sciences, 267, 739-745.
ALTERMATT, F. (2010). Climatic warming increases voltinism in European butterflies and
moths. Proceedings of the Royal Society B: Biological Sciences, 277, 1281-1287.
ANGELA, C., MAZZONI, E., PECCHIONI, N., RAU, D., CASSANELLI, S., BIZZARO,
D. & MANICARDI, G. (2006). Genetic variability among different Italian
populations of the aphid Myzus persicae. Caryologia, 59, 326-333.
ASAI, M., YOSHIDA, H., HONDA, K. & TSUMUKI, H. (2002). Cold hardiness of three
aphid species, Acyrthosiphon pisum, Megoura crassicauda and Aulacorthum solani
(Hemiptera : Aphididae). Applied Entomology and Zoology, 37, 341-346.
AYRINHAC, A., DEBAT, V., GIBERT, P., KISTER, A. G., LEGOUT, H., MORETEAU,
B., VERGILINO, R. & DAVID, J. R. (2004). Cold adaptation in geographical
populations of Drosophila melanogaster: phenotypic plasticity is more important
than genetic variability. Functional Ecology, 18, 700-706.
BAHRNDORFF, S., HOLMSTRUP, M., PETERSEN, H. & LOESCHCKE, V. (2006).
Geographic variation for climatic stress resistance traits in the springtail Orchesella
cincta. Journal of Insect Physiology, 52, 951-959.
BAHRNDORFF, S., LOESCHCKE, V., PERTOLDI, C., BEIER, C. & HOLMSTRUP, M.
(2009a). The rapid cold hardening response of Collembola is influenced by thermal
variability of the habitat. Functional Ecology, 23, 340-347.
132
BAHRNDORFF, S., MAIEN, J., LOESCHCKE, V. & ELLERS, J. (2009b). Dynamics of
heat-induced thermal stress resistance and Hsp70 expression in the springtail,
Orchesella cincta. Functional Ecology, 23, 233-239.
BALE, J. S. (1980). Seasonal-variation in cold hardiness of the adult beech leaf mining
weevil Rhynchaenus-Fagi L in Great-Britain. Cryo-Letters, 1, 372-383.
BALE, J. S. (1987). Insect cold hardiness - freezing and supercooling - an ecophysiological
perspective. Journal of Insect Physiology, 33, 899-908.
BALE, J. S. (1991). Insects at low-temperature - a predictable relationship. Functional
Ecology, 5, 291-298.
BALE, J. S. (1993a). Classes of insect cold-hardiness. Functional Ecology, 7, 751-753.
BALE, J. S. (1993b). Insects in the cold. Endeavour, 17, 132-137.
BALE, J. S. (1996). Insect cold hardiness: a matter of life and death. European Journal of
Entomology, 93, 369-382.
BALE, J. S. (2002). Insects and low temperatures: from molecular biology to distributions
and abundance. Philosophical Transactions of the Royal Society of London Series B:
Biological Sciences, 357, 849-861.
BALE, J. S., HANSEN, T. N., NISHINO, M. & BAUST, J. G. (1989). Effect of cooling rate
on the survival of larvae, pupariation, and adult emergence of the gallfly Eurosta-
Solidaginis. Cryobiology, 26, 285-289.
BALE, J. S., HARRINGTON, R. & CLOUGH, M. S. (1988). Low-temperature mortality of
the peach-potato aphid Myzus-Persicae. Ecological Entomology, 13, 121-129.
133
BALE, J. S. & HAYWARD, S. A. L. (2010). Insect overwintering in a changing climate.
Journal of Experimental Biology, 213, 980-994.
BATTISTI, A., STASTNY, M., NETHERER, S., ROBINET, C., SCHOPF, A., ROQUES,
A. & LARSSON, S. (2005). Expansion of geographic range in the pine processionary
moth caused by increased winter temperatures. Ecological Applications, 15, 2084-
2096.
BAUST, J. G. (1982). Environmental triggers to cold hardening. Comparative Biochemistry
and Physiology Part A: Physiology, 73, 563-570.
BAUST, J. G. (1986). Supercooling and insect cold hardiness - appropriateness of a standard
cooling rate. Cryo-Letters, 7, 339-340.
BENNETT, V. A., SFORMO, T., WALTERS, K., TOIEN, O., JEANNET, K.,
HOCHSTRASSER, R., PAN, Q. F., SERIANNI, A. S., BARNES, B. M. &
DUMAN, J. G. (2005). Comparative overwintering physiology of Alaska and Indiana
populations of the beetle Cucujus clavipes (Fabricius): roles of antifreeze proteins,
polyols, dehydration and diapause. Journal of Experimental Biology, 208, 4467-4477.
BERRY, R. E. & TAYLOR, L. R. (1968). High-altitude migration of aphids in maritime and
continental climates. Journal of Animal Ecology, 37, 713-722.
BLACKMAN, R. L. (1987). Morphological discrimination of a tobacco-feeding form from
Myzus persicae (Sulzer) (Hemiptera, Aphididae), and a key to new world Myzus
(Nectarosiphon) species. Bulletin of Entomological Research, 77, 713-730.
BLACKMAN, R. L. (1988). Rearing and handling aphids. In MINKS, A. K. &
HARREWIJN, P. (Eds.) World crop pests, 2B, Aphids, their biology, natural enemies
and control. Elsevier, Amsterdam.
134
BLACKMAN, R. L. & EASTOP, V. F. (2000). Aphids on the world’s crops: An
identification and information guide. John Wiley & Sons Ltd., Chichester.
BLOCK, W., DAVENPORT, J. & BALE, J. (1992). Animals at low-temperatures. Journal of
Zoology, 226, 345-350.
BROADBENT, L. & HEATHCOTE, G. D. (1955). Sources of overwintering Myzus
persicae (Sulzer) in England. Plant Pathology, 4, 135-137.
BROUFAS, G. D. & KOVEOS, D. S. (2001). Rapid cold hardening in the predatory mite
Euseius (Amblyseius) finlandicus (Acari : Phytoseiidae). Journal of Insect
Physiology, 47, 699-708.
BUBLIY, O. A., RIIHIMAA, A., NORRY, F. M. & LOESCHCKE, V. (2002). Variation in
resistance and acclimation to low-temperature stress among three geographical
strains of Drosophila melanogaster. Journal of Thermal Biology, 27, 337-344.
BURKE, G., FIEHN, O. & MORAN, N. (2010). Effects of facultative symbionts and heat
stress on the metabolome of pea aphids. Isme Journal, 4, 242-252.
CALOSI, P., BILTON, D. T., SPICER, J. I., VOTIER, S. C. & ATFIELD, A. (2010). What
determines a species' geographical range? Thermal biology and latitudinal range size
relationships in European diving beetles (Coleoptera : Dytiscidae). Journal of Animal
Ecology, 79, 194-204.
CANNON, R. J. C. (1998). The implications of predicted climate change for insect pests in
the UK, with emphasis on non-indigenous species. Global Change Biology, 4, 785-
796.
CASTAÑEDA, L. E., LARDIES, M. A. & BOZINOVIC, F. (2004). Adaptive latitudinal
shifts in the thermal physiology of a terrestrial isopod. Evolutionary Ecology
Research, 6, 579-593.
135
CASTAÑEDA, L. E., LARDIES, M. A. & BOZINOVIC, F. (2005). Interpopulational
variation in recovery time from chill coma along a geographic gradient: A study in
the common woodlouse, Porcellio laevis. Journal of Insect Physiology, 51, 1346-
1351.
CHATZIVASSILIOU, E. K., MOSCHOS, E., GAZI, S., KOUTRETSIS, P. & TSOUKAKI,
M. (2008). Infection of potato crops and seeds with potato virus Y and potato leafroll
virus in Greece. Journal of Plant Pathology, 90, 253-261.
CHEN, B. & KANG, L. (2004). Variation in cold hardiness of Liriomyza huidobrensis
(Diptera : Agromyzidae) along latitudinal gradients. Environmental Entomology, 33,
155-164.
CHEN, D. Q., MONTLLOR, C. B. & PURCELL, A. H. (2000). Fitness effects of two
facultative endosymbiotic bacteria on the pea aphid, Acyrthosiphon pisum, and the
blue alfalfa aphid, A kondoi. Entomologia Experimentalis Et Applicata, 95, 315-323.
CHOWN, S. L. (2001). Physiological variation in insects: hierarchical levels and
implications. Journal of Insect Physiology, 47, 649-660.
CLARK, M. S. & WORLAND, M. R. (2008). How insects survive the cold: molecular
mechanisms-a review. Journal of Comparative Physiology B: Biochemical Systemic
and Environmental Physiology, 178, 917-933.
CLOUGH, M. S., BALE, J. S. & HARRINGTON, R. (1990). Differential cold hardiness in
adults and nymphs of the peach-potato aphid Myzus-Persicae. Annals of Applied
Biology, 116, 1-9.
COCU, N., HARRINGTON, R., ROUNSEVELL, M. D. A., WORNER, S. P. & HULLE, M.
(2005). Geographical location, climate and land use influences on the phenology and
numbers of the aphid, Myzus persicae, in Europe. Journal of Biogeography, 32, 615-
632.
136
COULSON, S. J. & BALE, J. S. (1990). Characterization and limitations of the rapid cold-
hardening response in the housefly Musca-Domestica (Diptera, Muscidae). Journal of
Insect Physiology, 36, 207-211.
COULSON, S. J. & BALE, J. S. (1991). Anoxia induces rapid cold hardening in the housefly
Musca-Domestica (Diptera, Muscidae). Journal of Insect Physiology, 37, 497-501.
CRILL, W. D., HUEY, R. B. & GILCHRIST, G. W. (1996). Within and between generation
effects of temperature on the morphology and physiology of Drosophila
melanogaster. Evolution, 50, 1205-1218.
CZAJKA, M. C. & LEE, R. E. (1990). A rapid cold-hardening response protecting against
cold shock injury in Drosophila-Melanogaster. Journal of Experimental Biology,
148, 245-254.
DAHLGAARD, J., LOESCHCKE, V., MICHALAK, P. & JUSTESEN, J. (1998). Induced
thermotolerance and associated expression of the heat-shock protein Hsp70 in adult
Drosophila melanogaster. Functional Ecology, 12, 786-793.
DAJOZ, R. (2000). Insects and forests: The role and diversity of insects in the forest
environment. Intercept Ltd., Paris.
DANKS, H. V. (1978). Modes of seasonal adaptation in insects .1. Winter survival.
Canadian Entomologist, 110, 1167-1205.
DAVID, R. J., GIBERT, P., PLA, E., PETAVY, G., KARAN, D. & MORETEAU, B.
(1998). Cold stress tolerance in Drosophila: Analysis of chill coma recovery in D-
melanogaster. Journal of Thermal Biology, 23, 291-299.
DAVIDSON, J. K. (1990). Nonparallel geographic patterns for tolerance to cold and
desiccation in Drosophila-Melanogaster and Drosophila-Simulans. Australian
Journal of Zoology, 38, 155-161.
137
DEERE, J. A., SINCLAIR, B. J., MARSHALL, D. J. & CHOWN, S. L. (2006). Phenotypic
plasticity of thermal tolerances in five oribatid mite species from sub-Antarctic
Marion Island. Journal of Insect Physiology, 52, 693-700.
DENLINGER, D. L. (2002). Regulation of diapause. Annual Review of Entomology, 47, 93-
122.
DENLINGER, D., LI, A. & RINEHART, J. (2007). Heat shock proteins are critical for
insect winter survival. Comparative Biochemistry and Physiology A: Molecular and
Integrative Physiology, 146, S151-S152.
DILLON, M. E. & FRAZIER, M. R. (2006). Drosophila melanogaster locomotion in cold
thin air. Journal of Experimental Biology, 209, 364-371.
DIXON, A. F. G. (1998). Aphid ecology: An optimization approach. Chapman and Hall,
London.
DOUGLAS, A. E. (1998). Nutritional interactions in insect-microbial symbioses: Aphids and
their symbiotic bacteria Buchnera. Annual Review of Entomology, 43, 17-37.
DRAKE, V. A. & FARROW, R. A. (1989). The aerial plankton and atmospheric
convergence. Trends in Ecology and Evolution, 4, 381-385.
DROBNIS, E. Z., CROWE, L. M., BERGER, T., ANCHORDOGUY, T. J., OVERSTREET,
J. W. & CROWE, J. H. (1993). Cold shock damage is due to lipid phase-transition in
cell membranes – a demonstration using sperm as a model. Journal of Experimental
Zoology, 265, 432-437.
DUMAN, J. G. (1982). Insect antifreezes and ice-nucleating agents. Cryobiology, 19, 613-
627.
138
DUMAN, J. G. (2001). Antifreeze and ice nucleator proteins in terrestrial arthropods.
Annual Review of Physiology, 63, 327-357.
DUMAN, J. G. & DEVRIES, A. L. (1972). Freezing behavior of aqueous-solutions of
glycoproteins from blood of an Antarctic fish. Cryobiology, 9, 469-472.
DUMAN, J. G. & PATTERSON, J. L. (1978). Role of ice nucleators in frost tolerance of
overwintering queens of the bald faced hornet. Comparative Biochemistry and
Physiology A: Physiology, 59, 69-72.
DUMAN, J. G., WU, D. W., XU, L., TURSMAN, D. & OLSEN, T. M. (1991). Adaptations
of insects to subzero temperatures. Quarterly Review of Biology, 66, 387-410.
DUNBAR, H. E., WILSON, A. C. C., FERGUSON, N. R. & MORAN, N. A. (2007). Aphid
thermal tolerance is governed by a point mutation in bacterial symbionts. Plos
Biology, 5, 1006-1015.
EASTERLING, D. R. (2002). Recent changes in frost days and the frost-free season in the
United States. Bulletin of the American Meteorological Society, 83, 1327-1332.
EASTERLING, D. R., HORTON, B., JONES, P. D., PETERSON, T. C., KARL, T. R.,
PARKER, D. E., SALINGER, M. J., RAZUVAYEV, V., PLUMMER, N.,
JAMASON, P. & FOLLAND, C. K. (1997). Maximum and minimum temperature
trends for the globe. Science, 277, 364-367.
EASTERLING, D. R., EVANS, J. L., GROISMAN, P. Y., KARL, T. R., KUNKEL, K. E. &
AMBENJE, P. (2000). Observed variability and trends in extreme climate events: A
brief review. Bulletin of the American Meteorological Society, 81, 417-425.
EDWARDS, M. C., FETCH, T. G., SCHWARZ, P. B. & STEFFENSON, B. J. (2001).
Effect of barley yellow dwarf virus infection on yield and malting quality of barley.
Plant Disease, 85, 202-207.
139
EKLUNDH, L., JOHANSSON, T. & SOLBERG, S. (2009). Mapping insect defoliation in
Scots pine with MODIS time-series data. Remote Sensing of Environment, 113,
1566-1573.
FEDER, J. H., ROSSI, J. M., SOLOMON, J., SOLOMON, N. & LINDQUIST, S. (1992).
The consequence of expressing Hsp70 in Drosophila cells at normal temperatures.
Genes and Development, 6, 1402-1413.
FEDER, M. E. & HOFMANN, G. E. (1999). Heat-shock proteins, molecular chaperones,
and the stress response: Evolutionary and ecological physiology. Annual Review of
Physiology, 61, 243-282.
FENTON, B., MALLOCH, G., WOODFORD, J. A. T., FOSTER, S. P., ANSTEAD, J.,
DENHOLM, I., KING, L. & PICKUP, J. (2005). The attack of the clones: tracking
the movement of insecticide-resistant peach-potato aphids Myzus persicae
(Hemiptera : Aphididae). Bulletin of Entomological Research, 95, 483-494.
FENTON, B., MARGARITOPOULOS, J. T., MALLOCH, G. L. & FOSTER, S. P. (2010).
Micro evolutionary change in relation to insecticide resistance in the peach-potato
aphid, Myzus persicae. Ecological Entomology, 35, 131-146.
FENTON, B., WOODFORD, J. A. T. & MALLOCH, G. (1998). Analysis of clonal diversity
of the peach-potato aphid, Myzus persicae (Sulzer), in Scotland, UK and evidence for
the existence of a predominant clone. Molecular Ecology, 7, 1475-1487.
FERERES, A. & MORENO, A. (2009). Behavioural aspects influencing plant virus
transmission by homopteran insects. Virus Research, 141, 158-168.
140
FOSTER, S. P., HARRINGTON, R., DEVONSHIRE, A. L., DENHOLM, I., CLARK, S. J.
& MUGGLESTONE, M. A. (1997). Evidence for a possible fitness trade-off between
insecticide resistance and the low temperature movement that is essential for survival
of UK populations of Myzus persicae (Hemiptera: Aphididae). Bulletin of
Entomological Research, 87, 573-579.
FOSTER, S. P., HARRINGTON, R., DEVONSHIRE, A. L., DENHOLM, I., DEVINE, G.
J., KENWARD, M. G. & BALE, J. S. (1996). Comparative survival of insecticide-
susceptible and resistant peach-potato aphids, Myzus persicae (Sulzer) (Hemiptera:
Aphididae), in low temperature field trials. Bulletin of Entomological Research, 86,
17-27.
GASTON, K. J. & CHOWN, S. L. (1999). Elevation and climatic tolerance: a test using
dung beetles. Oikos, 86, 584-590.
GIBERT, P. & HUEY, R. B. (2001). Chill-coma temperature in Drosophila: Effects of
developmental temperature, latitude, and phylogeny. Physiological and Biochemical
Zoology, 74, 429-434.
GIBERT, P., HUEY, R. B. & GILCHRIST, G. W. (2001a). Locomotor performance of
Drosophila melanogaster: Interactions among developmental and adult temperatures,
age, and geography. Evolution, 55, 205-209.
GIBERT, P., MORETEAU, B., PETAVY, G., KARAN, D. & DAVID, J. R. (2001b). Chill-
coma tolerance, a major climatic adaptation among Drosophila species. Evolution,
55, 1063-1068.
GILCHRIST, G. W., HUEY, R. B. & PARTRIDGE, L. (1997). Thermal sensitivity of
Drosophila melanogaster: Evolutionary responses of adults and eggs to laboratory
natural selection at different temperatures. Physiological Zoology, 70, 403-414.
141
GOTO, S. G. & KIMURA, M. T. (1998). Heat and cold-shock responses and temperature
adaptations in subtropical and temperate species of Drosophila. Journal of Insect
Physiology, 44, 1233-1239.
GUO, W., SHEN, Z. R., LI, Z. H. & GAO, L. W. (2005). Migration and population genetics
of the grain aphid Macrosiphum miscanti (Takahashi) in relation to the geographic
distance and gene flow. Progress in Natural Science, 15, 1000-1004.
HARRINGTON, R., TATCHELL, G. M. & BALE, J. S. (1990). Weather, life-cycle strategy
and spring populations of aphids. Acta Phytopathologica Et Entomologica Hungarica,
25, 423-432.
HARRINGTON, R. & TAYLOR, L. R. (1990). Migration for survival - fine-scale
population redistribution in an aphid, Myzus-Persicae. Journal of Animal Ecology,
59, 1177-1193.
HART, A. J. & BALE, J. S. (1997). Evidence for the first strongly freeze-tolerant insect
found in the UK. Ecological Entomology, 22, 242-245.
HART, A. J. & BALE, J. S. (1998). Factors affecting the freeze tolerance of the hoverfly
Syrphus ribesii (Diptera : Syrphidae). Journal of Insect Physiology, 44, 21-29.
HART, A. J., TULLETT, A. G., BALE, J. S. & WALTERS, K. F. A. (2002). Effects of
temperature on the establishment potential in the UK of the non-native glasshouse
biocontrol agent Macrolophus caliginosus. Physiological Entomology, 27, 112-123.
HAWES, T. C. & BALE, J. S. (2007). Plasticity in arthropod cryotypes. Journal of
Experimental Biology, 210, 2585-2592.
HAZEL, J. R. (1989). Cold adaptation in ectotherms: regulation of membrane function and
cellular metabolism. Advances in Comparative and Environmental Physiology, 4, 1-
50.
142
HAZEL, J. R. (1995). Thermal adaptation in biological-membranes - is homeoviscous
adaptation the explanation. Annual Review of Physiology, 57, 19-42.
HAZELL, S. P., PEDERSEN, B. P., WORLAND, M. R., BLACKBURN, T. M. & BALE, J.
S. (2008). A method for the rapid measurement of thermal tolerance traits in studies
of small insects. Physiological Entomology, 33, 389-394.
HAZELL, S. P., GROUTIDES, C., NEVE, B. P., BLACKBURN, T. M. & BALE, J. S.
(2010a). A comparison of low temperature tolerance traits between closely related
aphids from the tropics, temperate zone, and Arctic. Journal of Insect Physiology, 56,
115-122.
HAZELL, S. P., NEVE, B. P., GROUTIDES, C., DOUGLAS, A. E., BLACKBURN, T. M.
& BALE, J. S. (2010b). Hyperthermic aphids: Insights into behaviour and mortality.
Journal of Insect Physiology, 56, 123-131.
HILL, J. K., THOMAS, C. D. & HUNTLEY, B. (1999). Climate and habitat availability
determine 20th century changes in a butterfly's range margin. Proceedings of the
Royal Society of London Series B: Biological Sciences, 266, 1197-1206.
HOEGH-GULDBERG, O. (1999). Climate change, coral bleaching and the future of the
world's coral reefs. Marine and Freshwater Research, 50, 839-866.
HOFFMANN, A. A., ANDERSON, A. & HALLAS, R. (2002). Opposing clines for high and
low temperature resistance in Drosophila melanogaster. Ecology Letters, 5, 614-618.
HOUGARDY, E. & MILLS, N. J. (2008). Comparative life history and parasitism of a new
colour morph of the walnut aphid in California. Agricultural and Forest Entomology,
10, 137-146.
143
HUGHES, G. E., ALFORD, L., BALE, J. S. & STERK, G. (2010). Thermal activity
thresholds of the predatory mirid Nesidiocoris tenuis: implications for its efficacy as
a biological control agent. Biocontrol, 55, 493-501.
HUGHES, G. E., BALE, J. S. & STERK, G. (2009). Thermal biology and establishment
potential in temperate climates of the predatory mirid Nesidiocoris tenuis. Biocontrol,
54, 785-795.
HUTCHINSON, L. A. & BALE, J. S. (1994). Effects of sublethal cold stress on the aphid
Rhopalosiphum-Padi. Journal of Applied Ecology, 31, 102-108.
IRWIN, M. E. & THRESH, J. M. (1990). Epidemiology of barley yellow dwarf - a study in
ecological complexity. Annual Review of Phytopathology, 28, 393-424.
JOHN-ALDER, H. B., MORIN, P. J. & LAWLER, S. (1988). Thermal physiology,
phenology and distribution of tree frogs. American Naturalist, 132, 506-520.
JONSSON, A. M., APPELBERG, G., HARDING, S. & BARRING, L. (2009). Spatio-
temporal impact of climate change on the activity and voltinism of the spruce bark
beetle, Ips typographus. Global Change Biology, 15, 486-499.
JORDAN, G. J., POTTS, B. M. & CLARKE, A. R. (2002). Susceptibility of Eucalyptus
globulus ssp globulus to sawfly (Perga affinis ssp insularis) attack and its potential
impact on plantation productivity. Forest Ecology and Management, 160, 189-199.
KARL, T. R., KNIGHT, R. W. & BAKER, B. (2000). The record breaking global
temperatures of 1997 and 1998: Evidence for an increase in the rate of global
warming? Geophysical Research Letters, 27, 719-722.
KASPROWICZ, L., MALLOCH, G., PICKUP, J. & FENTON, B. (2008). Spatial and
temporal dynamics of Myzus persicae clones in fields and suction traps. Agricultural
and Forest Entomology, 10, 91-100.
144
KEGG, J. D. (1971). Impact of gypsy moth - repeated defoliation of oak in New-Jersey.
Journal of Forestry, 69, 852-854.
KELTY, J. D. & LEE, R. E. (1999). Induction of rapid cold hardening by cooling at
ecologically relevant rates in Drosophila melanogaster. Journal of Insect Physiology,
45, 719-726.
KENIS, M., AUGER-ROZENBERG, M. A., ROQUES, A., TIMMS, L., PERE, C., COCK,
M., SETTELE, J., AUGUSTIN, S. & LOPEZ-VAAMONDE, C. (2009). Ecological
effects of invasive alien insects. Biological Invasions, 11, 21-45.
KENNEDY, J. S., DAY, M. F. & EASTOP, V. F. (1962). A conspectus of aphids as vectors
of plant viruses., London, Commonwealth Institute of Entomology.
KHANI, A., MOHARRAMIPOUR, S. & BARZEGAR, M. (2007a). Cold tolerance and
trehalose accumulation in overwintering larvae of the codling moth, Cydia pomonella
(Lepidoptera : Tortricidae). European Journal of Entomology, 104, 385-392.
KHANI, A., MOHARRAMIPOUR, S., BARZEGAR, M. & NADERI-MANESH, H.
(2007b). Comparison of fatty acid composition in total lipid of diapause and non-
diapause larvae of Cydia pomonella (Lepidoptera : Tortricidae). Insect Science, 14,
125-131.
KINDLMANN, P. & DIXON, A. F. G. (1989). Developmental constraints in the evolution
of reproductive strategies – telescoping of generations in parthenogenetic aphids.
Functional Ecology, 3, 531-37.
KLOK, C. J. & CHOWN, S. L. (2001). Critical thermal limits, temperature tolerance and
water balance of a sub-Antarctic kelp fly, Paractora dreuxi (Diptera :
Helcomyzidae). Journal of Insect Physiology, 47, 95-109.
145
KNIGHT, J. D. (1987). Cold hardening and overwintering survival of the grain aphid
Sitobion avenae in Northern England. PhD Thesis, University of Leeds.
KNIGHT, J. D., BALE, J. S., FRANKS, F., MATHIAS, S. F. & BAUST, J. G. (1986). Insect
cold hardiness - supercooling points and prefreeze mortality. Cryo-Letters, 7, 194-
203.
KNIGHT, J. D., TATCHELL, G. M. & NORTON, G. A. (1996). A structured workshop
approach for problem analysis and solution finding: An example using the problems
of barley yellow dwarf virus in the UK. Agricultural Systems, 52, 113-131.
LARSEN, K. J. & LEE, R. E. (1994). Cold tolerance including rapid cold-hardening and
inoculative freezing of fall migrant monarch butterflies in Ohio. Journal of Insect
Physiology, 40, 859-864.
LEE, R. E., CHEN, C. P. & DENLINGER, D. L. (1987). A rapid cold-hardening process in
insects. Science, 238, 1415-1417.
LEE, R. E., DAMODARAN, K., YI, S. X. & LORIGAN, G. A. (2006). Rapid cold-
hardening increases membrane fluidity and cold tolerance of insect cells.
Cryobiology, 52, 459-463.
LEONARDO, T. E. & MONDOR, E. B. (2006). Symbiont modifies host life-history traits
that affect gene flow. Proceedings of the Royal Society B: Biological Sciences, 273,
1079-1084.
LLACER, G., ALONSO, J. M., RUBIO-CABETAS, M. J., BATLLE, I., IGLESIAS, I.,
VARGAS, F. J., GARCIA-BRUNTON, J. & BADENES, M. L. (2009). Peach
industry in Spain. Journal of the American Pomological Society, 63, 128-133.
146
LLEWELLYN, K. S., LOXDALE, H. D., HARRINGTON, R., CLARK, S. J. &
SUNNUCKS, P. (2004). Evidence for gene flow and local clonal selection in field
populations of the grain aphid (Sitobion avenae) in Britain revealed using
microsatellites. Heredity, 93, 143-153.
LODGE, D. M., LAMBERTI, G. A., HARDING, J. M. & HORVATH, T. G. (1993). Book
review: Zebra mussels: biology, impacts and control. Journal of the North American
Benthological Society, 12, 302-304.
LOS, D. A. & MURATA, N. (2004). Membrane fluidity and its roles in the perception of
environmental signals. Biochimica Et Biophysica Acta-Biomembranes, 1666, 142-
157.
MACDONALD, G. M. (2010). Global warming and the Arctic: a new world beyond the
reach of the Grinnellian niche? Journal of Experimental Biology, 213, 855-861.
MACDONALD, S. S., RAKO, L., BATTERHAM, P. & HOFFMANN, A. A. (2004).
Dissecting chill coma recovery as a measure of cold resistance: evidence for a
biphasic response in Drosophila melanogaster. Journal of Insect Physiology, 50, 695-
700.
MACISAAC, H. J. (1996). Potential abiotic and biotic impacts of zebra mussels on the
inland waters of North America. American Zoologist, 36, 287-299.
MCDONALD, J. R., BALE, J. S. & WALTERS, K. F. A. (1997). Rapid cold hardening in
the western flower thrips Frankliniella occidentalis. Journal of Insect Physiology, 43,
759-766.
MCKIRDY, S. J. & JONES, R. A. C. (1996). Use of imidacloprid and newer generation
synthetic pyrethroids to control the spread of barley yellow dwarf luteovirus in
cereals. Plant Disease, 80, 895-901.
147
MCKIRDY, S. J., JONES, R. A. C. & NUTTER, F. W. (2002). Quantification of yield losses
caused by barley yellow dwarf virus in wheat and oats. Plant Disease, 86, 769-773.
MELLANBY, K. (1939). Low temperature and insect activity. Proceedings of the Royal
Society of London Series B: Biological Sciences, 127, 473-487.
MICHAUD, M. R. & DENLINGER, D. L. (2006). Oleic acid is elevated in cell membranes
during rapid cold-hardening and pupal diapause in the flesh fly, Sarcophaga
crassipalpis. Journal of Insect Physiology, 52, 1073-1082.
MILLER, L. K. & SMITH, J. S. (1975). Production of threitol and sorbitol by an adult insect
– association with freezing tolerance. Nature, 258, 519-520.
MONTLLOR, C. B., MAXMEN, A. & PURCELL, A. H. (2002). Facultative bacterial
endosymbionts benefit pea aphids Acyrthosiphon pisum under heat stress. Ecological
Entomology, 27, 189-195.
MORAN, N. A. (1992). The evolution of aphid life-cycles. Annual Review of Entomology,
37, 321-348.
MORAN, N. A. & DUNBAR, H. E. (2006). Sexual acquisition of beneficial symbionts in
aphids. Proceedings of the National Academy of Sciences of the United States of
America, 103, 12803-12806.
MUSOLIN, D. L. (2007). Insects in a warmer world: Ecological, physiological and life-
history responses of true bugs (Heteroptera) to climate change. Global Change
Biology, 13, 1565-1585.
NAULT, L. R. (1997). Arthropod transmission of plant viruses: A new synthesis. Annals of
the Entomological Society of America, 90, 521-541.
148
NAVAS, C. A. (1996a). The effect of temperature on the vocal activity of tropical anurans:
A comparison of high and low-elevation species. Journal of Herpetology, 30, 488-
497.
NAVAS, C. A. (1996b). Thermal dependency of field locomotor and vocal performance of
high-elevation anurans in the tropical Andes. Journal of Herpetology, 30, 478-487.
NAVAS, C. A. (1997). Thermal extremes at high elevations in the Andes: Physiological
ecology of frogs. Journal of Thermal Biology, 22, 467-477.
NEVEN, L. G. (2000). Physiological responses of insects to heat. Postharvest Biology and
Technology, 21, 103-111.
NICOL, D., ARMSTRONG, K. F., WRATTEN, S. D., CAMERON, C. M., FRAMPTON,
C. & FENTON, B. (1997). Genetic variation in an introduced aphid pest
(Metopolophium dirhodum) in New Zealand and relation to individuals from Europe.
Molecular Ecology, 6, 255-265.
OHTAKA, C. & ISHIKAWA, H. (1991). Effects of heat-treatment on the symbiotic system
of an aphid mycetocyte. Symbiosis, 11, 19-30.
OLIVER, K. M., MORAN, N. A. & HUNTER, M. S. (2005). Variation in resistance to
parasitism in aphids is due to symbionts not host genotype. Proceedings of the
National Academy of Sciences of the United States of America, 102, 12795-12800.
PARISH, W. E. G. & BALE, J. S. (1993). Effects of brief exposures to low-temperature on
development, longevity and fecundity in the grain aphid Sitobion Avenae (Hemiptera,
Aphididae). Annals of Applied Biology, 122, 9-21.
PARMESAN, C. (1996). Climate and species' range. Nature, 382, 765-766.
149
PARMESAN, C., RYRHOLM, N., STEFANESCU, C., HILL, J. K., THOMAS, C. D.,
DESCIMON, H., HUNTLEY, B., KAILA, L., KULLBERG, J., TAMMARU, T.,
TENNENT, W. J., THOMAS, J. A. & WARREN, M. (1999). Poleward shifts in
geographical ranges of butterfly species associated with regional warming. Nature,
399, 579-583.
PIMM, S. L., RUSSELL, G. J., GITTLEMAN, J. L. & BROOKS, T. M. (1995). The Future
of biodiversity. Science, 269, 347-350.
POUNDS, J. A., FOGDEN, M. P. L. & CAMPBELL, J. H. (1999). Biological response to
climate change on a tropical mountain. Nature, 398, 611-615.
POWELL, S. J. & BALE, J. S. (2004). Cold shock injury and ecological costs of rapid cold
hardening in the grain aphid Sitobion avenae (Hemiptera : Aphididae). Journal of
Insect Physiology, 50, 277-284.
POWELL, S. J. & BALE, J. S. (2005). Low temperature acclimated populations of the grain
aphid Sitobion avenae retain ability to rapidly cold harden with enhanced fitness.
Journal of Experimental Biology, 208, 2615-2620.
POWELL, S. J. & BALE, J. S. (2006). Effect of long-term and rapid cold hardening on the
cold torpor temperature of an aphid. Physiological Entomology, 31, 348-352.
POWELL, S. J. & BALE, J. S. (2008). Intergenerational acclimation in aphid overwintering.
Ecological Entomology, 33, 95-100.
RADCLIFFE, E. B. & RAGSDALE, D. W. (2002). Aphid-transmitted potato viruses: The
importance of understanding vector biology. American Journal of Potato Research,
79, 353-386.
RAKO, L. & HOFFMANN, A. A. (2006). Complexity of the cold acclimation response in
Drosophila melanogaster. Journal of Insect Physiology, 52, 94-104.
150
REAY-JONES, F. P. F., WILSON, L. T., REAGAN, T. E., LEGENDRE, B. L. & WAY, M.
O. (2008). Predicting economic losses from the continued spread of the Mexican rice
borer (Lepidoptera : Crambidae). Journal of Economic Entomology, 101, 237-250.
RINEHART, J. P., LI, A., YOCUM, G. D., ROBICH, R. M., HAYWARD, S. A. L. &
DENLINGER, D. L. (2007). Up-regulation of heat shock proteins is essential for cold
survival during insect diapause. Proceedings of the National Academy of Sciences of
the United States of America, 104, 11130-11137.
RINEHART, J. P., YOCUM, G. D. & DENINGER, D. L. (2000). Developmental
upregulation of inducible hsp70 transcripts, but not the cognate form, during pupal
diapause in the flesh fly, Sarcophaga crassipalpis. Insect Biochemistry and
Molecular Biology, 30, 515-521.
RING, R. A. (1980). Insects and their cells. In ASHWOOD SMITH, M. J. & FARRANT, J.
(Eds.) Low temperature preservation in medicine and biology. Pitman Medical Ltd.,
London.
RUSSELL, G. E. (1962). Sugar beet mild yellowing virus – a persistent aphid transmitted
virus. Nature, 195, 1231.
RUSSELL, J. A. & MORAN, N. A. (2006). Costs and benefits of symbiont infection in
aphids: variation among symbionts and across temperatures. Proceedings of the
Royal Society B: Biological Sciences, 273, 603-610.
SALT, R. W. (1957). Natural occurrence of glycerol in insects and its relation to their ability
to survive freezing. Canadian Entomologist, 89, 491.
SALT, R. W. (1961). Principles of insect cold-hardiness. Annual Review of Entomology, 6,
55-74.
151
SAND, K. & BRITTAIN, J. E. (2009). Life cycle shifts in Baetis rhodani (Ephemeroptera)
in the Norwegian mountains. Aquatic Insects, 31, 283-291.
SAUCKE, H. & DORING, T. F. (2004). Potato virus Y reduction by straw mulch in organic
potatoes. Annals of Applied Biology, 144, 347-355.
SCARBOROUGH, C. L., FERRARI, J. & GODFRAY, H. C. J. (2005). Aphid protected
from pathogen by endosymbiont. Science, 310, 1781-1781.
SCHERM, H., SUTHERST, R. W., HARRINGTON, R. & INGRAM, J. S. I. (2000). Global
networking for assessment of impacts of global change on plant pests. Environmental
Pollution, 108, 333-341.
SHAPOSHNIKOV, G. C. (1987). Evolution of aphids in relation to evolution of plants. In
MINKS, A. K. & HARREWIJN, P. (Eds.) World crop pests, 2A, Aphids, their
biology, natural enemies and control. Elsevier, Amsterdam.
SINCLAIR, B. J. (1999). Insect cold tolerance: How many kinds of frozen? European
Journal of Entomology, 96, 157-164.
SINCLAIR, B. J., ADDO-BEDIAKO, A. & CHOWN, S. L. (2003). Climatic variability and
the evolution of insect freeze tolerance. Biological Reviews, 78, 181-195.
SINCLAIR, B. J. & CHOWN, S. L. (2005). Climatic variability and hemispheric differences
in insect cold tolerance: support from southern Africa. Functional Ecology, 19, 214-
221.
SINCLAIR, B. J. & CHOWN, S. L. (2006). Rapid cold-hardening in a Karoo beetle, Afrinus
sp. Physiological Entomology, 31, 98-101.
SLYKHUIS, J. T. (1976). Virus and virus-like diseases of cereal crops. Annual Review of
Phytopathology, 14, 189-210.
152
SØMME, L. & ZACHARIASSEN, K. E. (1981). Adaptations to low-temperature in high-
altitude insects from Mount Kenya. Ecological Entomology, 6, 199-204.
SØRENSEN, J. G., KRISTENSEN, T. N. & LOESCHCKE, V. (2003). The evolutionary and
ecological role of heat shock proteins. Ecology Letters, 6, 1025-1037.
STILLMAN, J. H. (2003). Acclimation capacity underlies susceptibility to climate change.
Science, 301, 65-65.
STRATHDEE, A. T., HOWLING, G. G. & BALE, J. S. (1995). Cold-hardiness of
overwintering aphid eggs. Journal of Insect Physiology, 41, 653-657.
TAKACS, A. (2000). Ways of controlling potato Y potyvirus and sources of resistance.
Novenytermeles, 49, 413-419.
TERBLANCHE, J. S., SINCLAIR, B. J., KLOK, C. J., MCFARLANE, M. L. & CHOWN,
S. L. (2005). The effects of acclimation on thermal tolerance, desiccation resistance
and metabolic rate in Chirodica chalcoptera (Coleoptera : Chrysomelidae). Journal
of Insect Physiology, 51, 1013-1023.
THOMAS, C. D., CAMERON, A., GREEN, R. E., BAKKENES, M., BEAUMONT, L. J.,
COLLINGHAM, Y. C., ERASMUS, B. F. N., DE SIQUEIRA, M. F., GRAINGER,
A., HANNAH, L., HUGHES, L., HUNTLEY, B., VAN JAARSVELD, A. S.,
MIDGLEY, G. F., MILES, L., ORTEGA-HUERTA, M. A., PETERSON, A. T.,
PHILLIPS, O. L. & WILLIAMS, S. E. (2004). Extinction risk from climate change.
Nature, 427, 145-148.
THOMAS, C. D. & LENNON, J. J. (1999). Birds extend their ranges northwards. Nature,
399, 213-213.
153
THOMAS, J. A. (2005). Monitoring change in the abundance and distribution of insects
using butterflies and other indicator groups. Philosophical Transactions of the Royal
Society B: Biological Sciences, 360, 339-357.
TOMCALA, A., TOLLAROVA, M., OVERGAARD, J., SIMEK, P. & KOSTAL, V. (2006).
Seasonal acquisition of chill tolerance and restructuring of membrane
glycerophospholipids in an overwintering insect: triggering by low temperature,
desiccation and diapause progression. Journal of Experimental Biology, 209, 4102-
4114.
TOUGOU, D., MUSOLIN, D. L. & FUJISAKI, K. (2009). Some like it hot! Rapid climate
change promotes changes in distribution ranges of Nezara viridula and Nezara
antennata in Japan. Entomologia Experimentalis Et Applicata, 130, 249-258.
TSUCHIDA, T., KOGA, R. & FUKATSU, T. (2004). Host plant specialization governed by
facultative symbiont. Science, 303, 1989-1989.
VANHANEN, H., VELELI, T. O., PAIVINEN, S., KELLOMAKI, S. & NIEMELA, P.
(2007). Climate change and range shifts in two insect defoliators: Gypsy moth and
nun moth - A model study. Silva Fennica, 41, 621-638.
VAN TOOR, R. F., FOSTER, S. P., ANSTEAD, J. A., MITCHINSON, S., FENTONC, B. &
KASPROWICZ, L. (2008). Insecticide resistance and genetic composition of Myzus
persicae (Hemiptera : Aphididae) on field potatoes in New Zealand. Crop Protection,
27, 236-247.
VIRTANEN, T., NEUVONEN, S. & NIKULA, A. (1998). Modelling topoclimatic patterns
of egg mortality of Epirrita autumnata (Lepidoptera : Geometridae) with a
geographical information system: Predictions for current climate and warmer climate
scenarios. Journal of Applied Ecology, 35, 311-322.
154
VITOUSEK, P. M., DANTONIO, C. M., LOOPE, L. L., REJMANEK, M. &
WESTBROOKS, R. (1997). Introduced species: A significant component of human-
caused global change. New Zealand Journal of Ecology, 21, 1-16.
VORBURGER, C., LANCASTER, M. & SUNNUCKS, P. (2003). Environmentally related
patterns of reproductive modes in the aphid Myzus persicae and the predominance of
two 'superclones' in Victoria, Australia. Molecular Ecology, 12, 3493-3504.
WALTERS, K. F. A. & DEWAR, A. M. (1986). Overwintering strategy and the timing of
the spring migration of the cereal aphids Sitobion-Avenae and Sitobion-Fragariae.
Journal of Applied Ecology, 23, 905-915.
WALTHER, G. R., POST, E., CONVEY, P., MENZEL, A., PARMESAN, C., BEEBEE, T.
J. C., FROMENTIN, J. M., HOEGH-GULDBERG, O. & BAIRLEIN, F. (2002).
Ecological responses to recent climate change. Nature, 416, 389-395.
WANG, X. H. & KANG, L. (2003). Rapid cold hardening in young hoppers of the migratory
locust Locusta migratoria L. (Orthoptera : Acridiidae). Cryoletters, 24, 331-340.
WANG, X. H., QI, X. L. & KANG, L. (2003). Rapid cold hardening process of insects and
its ecologically adaptive significance. Progress in Natural Science, 13, 641-647.
WASYLYK, J. M., TICE, A. R. & BAUST, J. G. (1988). Partial glass formation – a novel
mechanism of insect cryoptotection. Cryobiology, 25, 451-458.
WILLIAMS, D. W. & LIEBHOLD, A. M. (1995). Herbivorous insects and global change:
Potential changes in the spatial distribution of forest defoliator outbreaks. Journal of
Biogeography, 22, 665-671.
WILLIAMS, I. S., DEWAR, A. M., DIXON, A. F. G. & THORNHILL, W. A. (2000). Alate
production by aphids on sugar beet: how likely is the evolution of sugar beet-specific
biotypes? Journal of Applied Ecology, 37, 40-51.
155
WILLIAMSON, M. (1996). Biological Invasions. Chapman & Hall, London.
WILLIAMSON, M. (2006). Explaining and predicting the success of invading species at
different stages of invasion. Biological Invasions, 8, 1561-1568.
WILLIAMSON, M. H. & BROWN, K. C. (1986). The analysis and modeling of British
invasions. Philosophical Transactions of the Royal Society of London Series B:
Biological Sciences, 314, 505-522.
WORLAND, M. R. & CONVEY, P. (2001). Rapid cold hardening in Antarctic
microarthropods. Functional Ecology, 15, 515-524.
YAMAMURA, K. & YOKOZAWA, M. (2002). Prediction of a geographical shift in the
prevalence of rice stripe virus disease transmitted by the small brown planthopper,
Laodelphax striatellus (Fallen) (Hemiptera : Delphacidae), under global warming.
Applied Entomology and Zoology, 37, 181-190.
YOCUM, G. D. & DENLINGER, D. L. (1992). Prolonged thermotolerance in the flesh fly,
Sarcophaga-Crassipalpis, does not require continuous expression or persistence of
the 72 Kda heat-shock protein. Journal of Insect Physiology, 38, 603-609.
ZACHARIASSEN, K. E. (1985). Physiology of cold tolerance in insects. Physiological
Reviews, 65, 799-832.
ZACHARIASSEN, K. E. & HAMMEL, H. T. (1976). Nucleating-agents in hemolymph of
insects tolerant to freezing. Nature, 262, 285-287.
ZACHARIASSEN, K. E. & HUSBY, J. A. (1982). Antifreeze effect of thermal hysteresis
agents protects highly supercooled insects. Nature, 298, 865-867.
156
ZENG, J. P., GE, F., SU, J. W. & WANG, Y. (2008). The effect of temperature on the
diapause and cold hardiness of Dendrolimus tabulaeformis (Lepidoptera:
Lasiocampidae). European Journal of Entomology, 105, 599-606.
ZHU, M., RADCLIFFE, E. B., RAGSDALE, D. W., MACRAE, I. V. & SEELEY, M. W.
(2006). Low-level jet streams associated with spring aphid migration and current
season spread of potato viruses in the US northern Great Plains. Agricultural and
Forest Meteorology, 138, 192-202.
Recommended