The Thermodynamic Properties of the f-Elements and their Compounds. Part 2. TheLanthanide and Actinide OxidesRudy J. M. Konings, Ondrej Beneš, Attila Kovács, Dario Manara, David Sedmidubský, Lev Gorokhov,
Vladimir S. Iorish, Vladimir Yungman, E. Shenyavskaya, and E. Osina
Citation: Journal of Physical and Chemical Reference Data 43, 013101 (2014); doi: 10.1063/1.4825256 View online: http://dx.doi.org/10.1063/1.4825256 View Table of Contents: http://scitation.aip.org/content/aip/journal/jpcrd/43/1?ver=pdfcov Published by the AIP Publishing
This article is copyrighted as indicated in the article. Reuse of AIP content is subject to the terms at: http://scitation.aip.org/termsconditions. Downloaded to IP:
78.131.95.159 On: Sun, 27 Apr 2014 17:09:58

This a
The Lanthanide an
TheThermodynamicPropertiesof the f-Elementsand theirCompounds.Part 2.d Actinide Oxides
Rudy J. M. Konings, a) Ondrej Beneš, Attila Kovács, Dario Manara, and David Sedmidubský b)
European Commission, Joint Research Centre, Institute for Transuranium Elements, P.O. Box 2340, 76125 Karlsruhe, Germany
Lev Gorokhov, Vladimir S. Iorish, c) Vladimir Yungman, E. Shenyavskaya, and E. OsinaJoint Institute for High Temperatures, Russian Academy of Sciences, 13-2 Izhorskaya Street, Moscow 125412, Russia
(Received 24 August 2012; accepted 4 March 2013; published online 10 January 2014)
a)Electronic mail: rudyb)Permanent address: In
Praha 6, Czech Republc)Deceased on May 20
� 2014 Euratom.
0047-2689/2014/43(1rticle is copyrighted a
A comprehensive review of the thermodynamic properties of the oxide compounds of
the lanthanide and actinide elements is presented. The available literature data for the solid,
liquid, and gaseous state have been analysed and recommended values are presented. In
case experimental data are missing, estimates have been made based on the trends in the
two series, which are extensively discussed. � 2014 Euratom. [http://dx.doi.org/10.1063/
1.4825256]
CONTENTS
1. Introduction . . . . . . . . . . . . . . . . . . . . . . . . . . . . .
stitute of Chemical Technology, Technickáic.
12.
)/013101/95/$47.00s indicated in the article. Reuse of AIP co
78.131.95.1
6
2. Approach . . . . . . . . . . . . . . . . . . . . . . . . . . . . . . .
62.1. Thermal functions of condensed phases . . .
62.2. Enthalpies of formation of condensed phases
72.3. Thermal functions of gases . . . . . . . . . . . . . . .
72.4. Enthalpies of formation of gases . . . . . . . . . .
82.5. Consistency and completeness . . . . . . . . . . . .
93. The Lanthanide Oxides in Solid and Liquid State
93.1. La2O3(cr,l) . . . . . . . . . . . . . . . . . . . . . . . . . . . . . . .
93.1.1. Polymorphism and melting point . . . .
93.1.2. Heat capacity and entropy . . . . . . . . . .
93.1.3. Enthalpy of formation . . . . . . . . . . . . . .
103.2. CeO2(cr,l) . . . . . . . . . . . . . . . . . . . . . . . . . . . . . . . .
113.2.1. Melting point. . . . . . . . . . . . . . . . . . . . . . .
113.2.2. Heat capacity and entropy . . . . . . . . . .
113.2.3. Enthalpy of formation . . . . . . . . . . . . . .
113.3. Ce2O3(cr,l) . . . . . . . . . . . . . . . . . . . . . . . . . . . . . . .
123.3.1. Polymorphism and melting point . . . .
123.3.2. Heat capacity and entropy . . . . . . . . . .
123.3.3. Enthalpy of formation . . . . . . . . . . . . . .
133.4. PrO2(cr,l) . . . . . . . . . . . . . . . . . . . . . . . . . . . . . . . .
133.4.1. Structure . . . . . . . . . . . . . . . . . . . . . . . . . . .
133.4.2. Heat capacity and entropy . . . . . . . . . .
133.4.3. Enthalpy of formation . . . . . . . . . . . . . .
143.5. PrO1.833(cr,l) . . . . . . . . . . . . . . . . . . . . . . . . . . . . .
143.5.1. Melting point. . . . . . . . . . . . . . . . . . . . . . .
143.5.2. Heat capacity and entropy . . . . . . . . . .
143.5.3. Enthalpy of formation . . . . . . . . . . . . . .
143.6. Pr2O3(cr,l) . . . . . . . . . . . . . . . . . . . . . . . . . . . . . . .
155, 16626
013101-1ntent is subject to the te
59 On: Sun, 27 Apr 201
3.6.1. Polymorphism and melting point . . . .
J. Phys. Chem. Ref. Data, Vol. 43, No.rms at: http://scitation.aip.org/termsconditions. Do
4 17:09:58
15
3.6.2. Heat capacity and entropy . . . . . . . . . .
153.6.3. Enthalpy of formation . . . . . . . . . . . . . .
153.7. Nd2O3(cr,l). . . . . . . . . . . . . . . . . . . . . . . . . . . . . . .
163.7.1. Polymorphism and melting point . . . .
163.7.2. Heat capacity and entropy . . . . . . . . . .
163.7.3. Enthalpy of formation . . . . . . . . . . . . . .
173.8. Pm2O3(cr,l) . . . . . . . . . . . . . . . . . . . . . . . . . . . . . .
173.8.1. Polymorphism and melting point . . . .
173.8.2. Heat capacity and entropy . . . . . . . . . .
173.8.3. Enthalpy of formation . . . . . . . . . . . . . .
183.9. Sm2O3(cr,l) . . . . . . . . . . . . . . . . . . . . . . . . . . . . . .
183.9.1. Polymorphism and melting point . . . .
183.9.2. Heat capacity and entropy . . . . . . . . . .
183.9.3. Enthalpy of formation . . . . . . . . . . . . . .
193.10. Eu2O3(cr,l). . . . . . . . . . . . . . . . . . . . . . . . . . . . . .
203.10.1. Polymorphism and melting point. . .
203.10.2. Heat capacity and entropy . . . . . . . . .
203.10.3. Enthalpy of formation . . . . . . . . . . . . .
213.11. Eu3O4(cr) . . . . . . . . . . . . . . . . . . . . . . . . . . . . . . .
223.11.1. Polymorphism and melting point. . .
223.11.2. Heat capacity and entropy . . . . . . . . .
223.11.3. Enthalpy of formation . . . . . . . . . . . . .
223.12. EuO(cr). . . . . . . . . . . . . . . . . . . . . . . . . . . . . . . . .
223.12.1. Polymorphism and melting point. . .
223.12.2. Heat capacity and entropy . . . . . . . . .
223.12.3. Enthalpy of formation . . . . . . . . . . . . .
223.13. Gd2O3(cr,l) . . . . . . . . . . . . . . . . . . . . . . . . . . . . .
233.13.1. Polymorphism and melting point. . .
233.13.2. Heat capacity and entropy . . . . . . . . .
233.13.3. Enthalpy of formation . . . . . . . . . . . . .
243.14. TbO2(cr) . . . . . . . . . . . . . . . . . . . . . . . . . . . . . . . .
243.14.1. Structure . . . . . . . . . . . . . . . . . . . . . . . . . .
243.14.2. Heat capacity and entropy . . . . . . . . .
243.14.3. Enthalpy of formation . . . . . . . . . . . . .
243.15. Tb6O11(cr),Tb11O20(cr),Tb4O7(cr),
Tb7O12(cr) . . . . . . . . . . . . . . . . . . . . . . . . . . . . . .
251, 2014wnloaded to IP:

013101-2 KONINGS ET AL.
J. Phys. C This article is cop
3.15.1. Structure . . . . . . . . . . . . . . . . . . . . . . . . . .
hem. Ref. Data, Vol. 43, No. 1, 2014yrighted as indicated in the article. Reuse of AIP co
78.131.95.1
25
3.15.2. Heat capacity and entropy . . . . . . . . .
253.15.3. Enthalpy of formation . . . . . . . . . . . . .
253.16. Tb2O3(cr,l). . . . . . . . . . . . . . . . . . . . . . . . . . . . . .
253.16.1. Polymorphism and melting point. . .
253.16.2. Heat capacity and entropy . . . . . . . . .
253.16.3. Enthalpy of formation . . . . . . . . . . . . .
263.17. Dy2O3(cr,l) . . . . . . . . . . . . . . . . . . . . . . . . . . . . .
263.17.1. Polymorphism and melting point. . .
263.17.2. Heat capacity and entropy . . . . . . . . .
263.17.3. Enthalpy of formation . . . . . . . . . . . . .
273.18. Ho2O3(cr,l) . . . . . . . . . . . . . . . . . . . . . . . . . . . . .
273.18.1. Polymorphism and melting point. . .
273.18.2. Heat capacity and entropy . . . . . . . . .
273.18.3. Enthalpy of formation . . . . . . . . . . . . .
283.19. Er2O3(cr,l) . . . . . . . . . . . . . . . . . . . . . . . . . . . . . .
293.19.1. Polymorphism and melting point. . .
293.19.2. Heat capacity and entropy . . . . . . . . .
293.19.3. Enthalpy of formation . . . . . . . . . . . . .
293.20. Tm2O3(cr,l) . . . . . . . . . . . . . . . . . . . . . . . . . . . . .
303.20.1. Polymorphism and melting point. . .
303.20.2. Heat capacity and entropy . . . . . . . . .
303.20.3. Enthalpy of formation . . . . . . . . . . . . .
313.21. Yb2O3(cr,l) . . . . . . . . . . . . . . . . . . . . . . . . . . . . .
313.21.1. Polymorphism and melting point. . .
313.21.2. Heat capacity and entropy . . . . . . . . .
313.21.3. Enthalpy of formation . . . . . . . . . . . . .
313.22. Lu2O3(cr,l). . . . . . . . . . . . . . . . . . . . . . . . . . . . . .
313.22.1. Melting point . . . . . . . . . . . . . . . . . . . . .
313.22.2. Heat capacity and entropy . . . . . . . . .
323.22.3. Enthalpy of formation . . . . . . . . . . . . .
324. The Gaseous Lanthanide Oxides . . . . . . . . . . . . .
324.1. LaO(g). . . . . . . . . . . . . . . . . . . . . . . . . . . . . . . . . . .
324.1.1. Heat capacity and entropy . . . . . . . . . .
324.1.2. Enthalpy of formation . . . . . . . . . . . . . .
334.2. CeO2(g). . . . . . . . . . . . . . . . . . . . . . . . . . . . . . . . . .
344.2.1. Heat capacity and entropy . . . . . . . . . .
344.2.2. Enthalpy of formation . . . . . . . . . . . . . .
344.3. CeO(g). . . . . . . . . . . . . . . . . . . . . . . . . . . . . . . . . . .
354.3.1. Heat capacity and entropy . . . . . . . . . .
354.3.2. Enthalpy of formation . . . . . . . . . . . . . .
354.4. PrO(g) . . . . . . . . . . . . . . . . . . . . . . . . . . . . . . . . . . .
364.4.1. Heat capacity and entropy . . . . . . . . . .
364.4.2. Enthalpy of formation . . . . . . . . . . . . . .
374.5. NdO(g) . . . . . . . . . . . . . . . . . . . . . . . . . . . . . . . . . .
374.5.1. Heat capacity and entropy . . . . . . . . . .
374.5.2. Enthalpy of formation . . . . . . . . . . . . . .
394.6. PmO(g) . . . . . . . . . . . . . . . . . . . . . . . . . . . . . . . . . .
394.6.1. Heat capacity and entropy . . . . . . . . . .
394.6.2. Enthalpy of formation . . . . . . . . . . . . . .
404.7. SmO(g) . . . . . . . . . . . . . . . . . . . . . . . . . . . . . . . . . .
404.7.1. Heat capacity and entropy . . . . . . . . . .
404.7.2. Enthalpy of formation . . . . . . . . . . . . . .
414.8. EuO(g). . . . . . . . . . . . . . . . . . . . . . . . . . . . . . . . . . .
424.8.1. Heat capacity and entropy . . . . . . . . . .
424.8.2. Enthalpy of formation . . . . . . . . . . . . . .
424.9. GdO(g) . . . . . . . . . . . . . . . . . . . . . . . . . . . . . . . . . .
434.9.1. Heat capacity and entropy . . . . . . . . . .
43ntent is subject to the te
59 On: Sun, 27 Apr 201
4.9.2. Enthalpy of formation . . . . . . . . . . . . . .
rms at: http://scitation.aip.org/termsconditions. Do
4 17:09:58
44
4.10. TbO(g) . . . . . . . . . . . . . . . . . . . . . . . . . . . . . . . . .
444.10.1. Heat capacity and entropy . . . . . . . . .
444.10.2. Enthalpy of formation . . . . . . . . . . . . .
454.11. DyO(g) . . . . . . . . . . . . . . . . . . . . . . . . . . . . . . . . .
454.11.1. Heat capacity and entropy . . . . . . . . .
454.11.2. Enthalpy of formation . . . . . . . . . . . . .
464.12. HoO(g) . . . . . . . . . . . . . . . . . . . . . . . . . . . . . . . . .
464.12.1. Heat capacity and entropy . . . . . . . . .
464.12.2. Enthalpy of formation . . . . . . . . . . . . .
474.13. ErO(g) . . . . . . . . . . . . . . . . . . . . . . . . . . . . . . . . . .
484.13.1. Heat capacity and entropy . . . . . . . . .
484.13.2. Enthalpy of formation . . . . . . . . . . . . .
494.14. TmO(g). . . . . . . . . . . . . . . . . . . . . . . . . . . . . . . . .
494.14.1. Heat capacity and entropy . . . . . . . . .
494.14.2. Enthalpy of formation . . . . . . . . . . . . .
504.15. YbO(g) . . . . . . . . . . . . . . . . . . . . . . . . . . . . . . . . .
504.15.1. Heat capacity and entropy . . . . . . . . .
504.15.2. Enthalpy of formation . . . . . . . . . . . . .
514.16. LuO(g) . . . . . . . . . . . . . . . . . . . . . . . . . . . . . . . . .
524.16.1. Heat capacity and entropy . . . . . . . . .
524.16.2. Enthalpy of formation . . . . . . . . . . . . .
525. The Actinide Oxides in Solid
and Liquid State . . . . . . . . . . . . . . . . . . . . . . . . . .
535.1. Ac2O3(cr,l). . . . . . . . . . . . . . . . . . . . . . . . . . . . . . .
535.1.1. Polymorphism and melting point . . . .
535.1.2. Heat capacity and entropy . . . . . . . . . .
535.1.3. Enthalpy of formation . . . . . . . . . . . . . .
535.2. ThO2(cr,l) . . . . . . . . . . . . . . . . . . . . . . . . . . . . . . . .
535.2.1. Melting point. . . . . . . . . . . . . . . . . . . . . . .
535.2.2. Heat capacity and entropy . . . . . . . . . .
535.2.3. Enthalpy of formation . . . . . . . . . . . . . .
545.3. PaO2(cr,l) . . . . . . . . . . . . . . . . . . . . . . . . . . . . . . . .
545.3.1. Melting point. . . . . . . . . . . . . . . . . . . . . . .
545.3.2. Heat capacity and entropy . . . . . . . . . .
545.3.3. Enthalpy of formation . . . . . . . . . . . . . .
545.4. γ-UO3. . . . . . . . . . . . . . . . . . . . . . . . . . . . . . . . . . . .
545.4.1. Polymorphism. . . . . . . . . . . . . . . . . . . . . .
545.4.2. Heat capacity and entropy . . . . . . . . . .
555.4.3. Enthalpy of formation . . . . . . . . . . . . . .
555.5. U3O8(cr) . . . . . . . . . . . . . . . . . . . . . . . . . . . . . . . . .
555.5.1. Polymorphism and melting point . . . .
555.5.2. Heat capacity and entropy . . . . . . . . . .
555.5.3. Enthalpy of formation . . . . . . . . . . . . . .
565.6. U4O9(cr) . . . . . . . . . . . . . . . . . . . . . . . . . . . . . . . . .
565.6.1. Polymorphism. . . . . . . . . . . . . . . . . . . . . .
565.6.2. Heat capacity and entropy . . . . . . . . . .
565.6.3. Enthalpy of formation . . . . . . . . . . . . . .
565.7. UO2(cr,l). . . . . . . . . . . . . . . . . . . . . . . . . . . . . . . . .
565.7.1. Melting point. . . . . . . . . . . . . . . . . . . . . . .
565.7.2. Heat capacity and entropy . . . . . . . . . .
575.7.3. Enthalpy of formation . . . . . . . . . . . . . .
585.8. Np2O5(cr,l). . . . . . . . . . . . . . . . . . . . . . . . . . . . . . .
585.8.1. Crystal structure . . . . . . . . . . . . . . . . . . . .
585.8.2. Heat capacity and entropy . . . . . . . . . .
585.8.3. Enthalpy of formation . . . . . . . . . . . . . .
585.9. NpO2(cr,l) . . . . . . . . . . . . . . . . . . . . . . . . . . . . . . .
585.9.1. Melting point. . . . . . . . . . . . . . . . . . . . . . .
58wnloaded to IP:

THERMODYNAMIC PROPERTIES OF LANTHANIDE AND ACTINIDE OXIDE COMPOUNDS 013101-3
This article is cop
5.9.2. Heat capacity and entropy . . . . . . . . . .
yrighted as indicated in the article. Reuse of AIP co
78.131.95.1
58
5.9.3. Enthalpy of formation . . . . . . . . . . . . . .
595.10. PuO2(cr,l). . . . . . . . . . . . . . . . . . . . . . . . . . . . . . .
595.10.1. Melting point . . . . . . . . . . . . . . . . . . . . .
595.10.2. Heat capacity and entropy . . . . . . . . .
595.10.3. Enthalpy of formation . . . . . . . . . . . . .
605.11. Pu2O3(cr,l) . . . . . . . . . . . . . . . . . . . . . . . . . . . . . .
605.11.1. Polymorphism and melting point. . .
605.11.2. Heat capacity and entropy . . . . . . . . .
605.11.3. Enthalpy of formation . . . . . . . . . . . . .
615.12. AmO2(cr,l). . . . . . . . . . . . . . . . . . . . . . . . . . . . . .
615.12.1. Melting point . . . . . . . . . . . . . . . . . . . . .
615.12.2. Heat capacity and entropy . . . . . . . . .
615.12.3. Enthalpy of formation . . . . . . . . . . . . .
615.13. Am2O3(cr,l). . . . . . . . . . . . . . . . . . . . . . . . . . . . .
625.13.1. Polymorphism and melting point. . .
625.13.2. Heat capacity and entropy . . . . . . . . .
625.13.3. Enthalpy of formation . . . . . . . . . . . . .
625.14. Cm2O3(cr) . . . . . . . . . . . . . . . . . . . . . . . . . . . . . .
625.14.1. Polymorphism and melting point. . .
625.14.2. Heat capacity and entropy . . . . . . . . .
635.14.3. Enthalpy of formation . . . . . . . . . . . . .
635.15. BkO2(cr) and Bk2O3(cr) . . . . . . . . . . . . . . . . .
635.15.1. Polymorphism and melting point. . .
635.15.2. Heat capacity and entropy . . . . . . . . .
635.15.3. Enthalpy of formation . . . . . . . . . . . . .
635.16. CfO2(cr) and Cf2O3(cr) . . . . . . . . . . . . . . . . . .
635.16.1. Polymorphism and melting point. . .
635.16.2. Heat capacity and entropy . . . . . . . . .
645.16.3. Enthalpy of formation . . . . . . . . . . . . .
646. The Gaseous Actinide Oxides . . . . . . . . . . . . . . .
646.1. AcO(g) . . . . . . . . . . . . . . . . . . . . . . . . . . . . . . . . . .
646.1.1. Heat capacity and entropy . . . . . . . . . .
646.1.2. Enthalpy of formation . . . . . . . . . . . . . .
646.2. ThO2(g). . . . . . . . . . . . . . . . . . . . . . . . . . . . . . . . . .
646.2.1. Heat capacity and entropy . . . . . . . . . .
646.2.2. Enthalpy of formation . . . . . . . . . . . . . .
656.3. ThO(g). . . . . . . . . . . . . . . . . . . . . . . . . . . . . . . . . . .
666.3.1. Heat capacity and entropy . . . . . . . . . .
666.3.2. Enthalpy of formation . . . . . . . . . . . . . .
676.4. PaO2(g) . . . . . . . . . . . . . . . . . . . . . . . . . . . . . . . . . .
676.4.1. Heat capacity and entropy . . . . . . . . . .
676.4.2. Enthalpy of formation . . . . . . . . . . . . . .
686.5. PaO(g) . . . . . . . . . . . . . . . . . . . . . . . . . . . . . . . . . . .
686.5.1. Heat capacity and entropy . . . . . . . . . .
686.5.2. Enthalpy of formation . . . . . . . . . . . . . .
696.6. UO3(g). . . . . . . . . . . . . . . . . . . . . . . . . . . . . . . . . . .
696.6.1. Heat capacity and entropy . . . . . . . . . .
696.6.2. Enthalpy of formation . . . . . . . . . . . . . .
706.7. UO2(g). . . . . . . . . . . . . . . . . . . . . . . . . . . . . . . . . . .
706.7.1. Heat capacity and entropy . . . . . . . . . .
706.7.2. Enthalpy of formation . . . . . . . . . . . . . .
716.8. UO(g). . . . . . . . . . . . . . . . . . . . . . . . . . . . . . . . . . . .
726.8.1. Heat capacity and entropy . . . . . . . . . .
726.8.2. Enthalpy of formation . . . . . . . . . . . . . .
736.9. NpO2(g) . . . . . . . . . . . . . . . . . . . . . . . . . . . . . . . . .
736.9.1. Heat capacity and entropy . . . . . . . . . .
73ntent is subject to the te
59 On: Sun, 27 Apr 201
6.9.2. Enthalpy of formation . . . . . . . . . . . . . .
J. Phys. Chem. Ref. Data, Vol. 43, No.rms at: http://scitation.aip.org/termsconditions. Do
4 17:09:58
74
6.10. NpO(g) . . . . . . . . . . . . . . . . . . . . . . . . . . . . . . . . .
756.10.1. Heat capacity and entropy . . . . . . . . .
756.10.2. Enthalpy of formation . . . . . . . . . . . . .
756.11. PuO3(g). . . . . . . . . . . . . . . . . . . . . . . . . . . . . . . . .
756.11.1. Heat capacity and entropy . . . . . . . . .
756.11.2. Enthalpy of formation . . . . . . . . . . . . .
766.12. PuO2(g). . . . . . . . . . . . . . . . . . . . . . . . . . . . . . . . .
766.12.1. Heat capacity and entropy . . . . . . . . .
766.12.2. Enthalpy of formation . . . . . . . . . . . . .
776.13. PuO(g). . . . . . . . . . . . . . . . . . . . . . . . . . . . . . . . . .
786.13.1. Heat capacity and entropy . . . . . . . . .
786.13.2. Enthalpy of formation . . . . . . . . . . . . .
796.14. AmO2(g). . . . . . . . . . . . . . . . . . . . . . . . . . . . . . . .
796.14.1. Heat capacity and entropy . . . . . . . . .
796.14.2. Enthalpy of formation . . . . . . . . . . . . .
796.15. AmO(g) . . . . . . . . . . . . . . . . . . . . . . . . . . . . . . . .
796.15.1. Heat capacity and entropy . . . . . . . . .
796.15.2. Enthalpy of formation . . . . . . . . . . . . .
806.16. CmO(g). . . . . . . . . . . . . . . . . . . . . . . . . . . . . . . . .
806.16.1. Heat capacity and entropy . . . . . . . . .
806.16.2. Enthalpy of formation . . . . . . . . . . . . .
816.17. Computed data for AnO(g) and AnO2(g)
(An ¼ Bk–Lr) . . . . . . . . . . . . . . . . . . . . . . . . . .
817. Discussion and Conclusions. . . . . . . . . . . . . . . . .
827.1. Comparison to existing reviews . . . . . . . . . . .
827.2. Trends . . . . . . . . . . . . . . . . . . . . . . . . . . . . . . . . . . .
827.2.1. The crystalline sesquioxides . . . . . . . .
827.2.2. The crystalline dioxides. . . . . . . . . . . . .
847.2.3. The gaseous monoxides. . . . . . . . . . . . .
867.3. Recommendations for further research . . . .
87Acknowledgments . . . . . . . . . . . . . . . . . . . . . . . .
888. References . . . . . . . . . . . . . . . . . . . . . . . . . . . . . .
88List of Tables
1. Nomenclature of the molecular properties for the
di- and polyatomic species . . . . . . . . . . . . . . . . . . . .
82. Temperature of melting of lanthanum sesquioxide
(after Coutures and Rand15) . . . . . . . . . . . . . . . . . . .
93. The enthalpy of formation of La2O3(cr) at 298.15
K; DH�1 is the enthalpy of solution of La(cr), DH�
2
of La2O3(cr) in HCl(aq), respectively (after Cord-
funke and Konings34) . . . . . . . . . . . . . . . . . . . . . . . . .
104. Temperature of melting of cerium dioxide . . . . .
115. Temperature of melting of cerium sesquioxide
(after Coutures and Rand15) . . . . . . . . . . . . . . . . . . .
126. The enthalpy of formation of Ce2O3(cr) at 298.15
K; DH�1 and DH�
2 are the enthalpies of solution of
Ce(cr) and Ce2O3(cr) in HCl(aq), respectively
(after Cordfunke and Konings34) . . . . . . . . . . . . . .
137. The enthalpy of formation of PrO1.833 and
Pr2O3(cr) at 298.15 K; DH�1 and DH�
2 are the
enthalpies of solution of Pr(cr) and PrO1.833(cr)
in HNO3(aq), Pr(cr) and Pr2O3(cr) in HCl(aq),
respectively (after Cordfunke and Konings34) . .
141, 2014wnloaded to IP:

013101-4 KONINGS ET AL.
This a
8. The enthalpy of formation of phases in the PrO2-
PrO1.5 system . . . . . . . . . . . . . . . . . . . . . . . . . . . . . . . . .
J. Phys. Chem. Ref. Data, Vol. 43, No. 1, 2014rticle is copyrighted as indicated in the article. Reuse of AIP co
78.131.95.1
15
9. Temperature of melting of praseodymium
sesquioxide . . . . . . . . . . . . . . . . . . . . . . . . . . . . . . . . . . .
1510. Temperature of melting of neodymium sesqui-
oxide (after Coutures and Rand15) . . . . . . . . . . . . .
1611. The enthalpy of formation of Nd2O3(cr) at 298.15
K; DH�1 and DH�
2 are the enthalpies of solution of
Nd(cr) and Nd2O3(cr) in HCl(aq), respectively
(after Cordfunke and Konings34) . . . . . . . . . . . . . .
1712. Temperature of melting of samarium sesquioxide
(after Coutures and Rand15) . . . . . . . . . . . . . . . . . . .
1813. The enthalpy of formation of Sm2O3(cr) at 298.15
K; DH�1 and DH�
2 are the enthalpies of solution of
Sm(cr) and Sm2O3(cr) in HCl(aq), respectively
(after Cordfunke and Konings34) . . . . . . . . . . . . . .
1914. Temperature of melting of europium sesquioxide
(after Coutures and Rand15) . . . . . . . . . . . . . . . . . . .
2015. The enthalpy of formation of monoclinic
Eu2O3(cr) at 298.15 K; DH�1 and DH�
2 are the
enthalpies of solution of Eu(cr) and Eu2O3(cr) in
HCl(aq), respectively . . . . . . . . . . . . . . . . . . . . . . . . .
2116. Temperature of melting of gadolinium sesquiox-
ide (after Coutures and Rand15) . . . . . . . . . . . . . . .
2317. The enthalpy of formation of Gd2O3(cr) at 298.15
K; DH�1 and DH�
2 are the enthalpies of solution of
Gd(cr) and Gd2O3(cr) in HCl(aq), respectively
(after Cordfunke and Konings34) . . . . . . . . . . . . . .
2418. The enthalpy of formation of phases in the TbO2-
TbO1.5 system . . . . . . . . . . . . . . . . . . . . . . . . . . . . . . . .
2519. Temperature of melting of terbium sesquioxide
(after Coutures and Rand15) . . . . . . . . . . . . . . . . . . .
2520. The enthalpy of formation of Tb2O3(cr) at 298.15
K; DH�1 and DH�
2 are the enthalpies of solution of
Tb(cr) and Tb2O3(cr) in HCl(aq), respectively
(after Cordfunke and Konings34) . . . . . . . . . . . . . .
2621. Temperature of melting of dysprosium sesqui-
oxide (after Coutures and Rand15) . . . . . . . . . . . . .
2722. The enthalpy of formation of Dy2O3(cr) at 298.15
K; DH�1 and DH�
2 are the enthalpies of solution of
Dy(cr) and Dy2O3(cr) in HCl(aq), respectively
(after Cordfunke and Konings34) . . . . . . . . . . . . . .
2723. Temperature of melting of holmium sesquioxide
(after Coutures and Rand15) . . . . . . . . . . . . . . . . . . .
2824. The enthalpy of formation of Ho2O3(cr) at 298.15
K; DH�1 and DH�
2 are the enthalpies of solution of
Ho(cr) and Ho2O3(cr) in HCl(aq), respectively
(after Cordfunke and Konings34) . . . . . . . . . . . . . .
2825. Temperature of melting of erbium sesquioxide
(after Coutures and Rand15) . . . . . . . . . . . . . . . . . . .
2926. The enthalpy of formation of Er2O3(cr) at 298.15
K; DH�1 and DH�
2 are the enthalpies of solution of
Er(cr) and Er2O3(cr) in HCl(aq), respectively
(after Cordfunke and Konings34) . . . . . . . . . . . . . .
3027. Temperature of melting of ytterbium sesquioxide
(after Coutures and Rand15) . . . . . . . . . . . . . . . . . . .
3128. Temperature of melting of lutetium sesquioxide
(after Coutures and Rand15) . . . . . . . . . . . . . . . . . . .
32ntent is sub
59 On: Sun,
29. Molecular constants of LaO(g) . . . . . . . . . . . . . . . .
ject to the terms at: http://scitation.aip.org/termsconditions. Do
27 Apr 2014 17:09:58
33
30. The enthalpy of formation of LaO(g), in kJ mol�1
3431. The molecular parameters for CeO2(g). . . . . . . . .
3432. The enthalpy of formation of CeO2(g) at 298.15 K
3533. Molecular constants of CeO(g) . . . . . . . . . . . . . . . .
3634. The enthalpy of formation of CeO(g), in kJ mol�1
3635. Molecular constants of 141Pr16O(g) . . . . . . . . . . . .
3736. The enthalpy of formation of PrO(g), in kJ mol�1
3837. Molecular constants of 142Nd16O(g) . . . . . . . . . . .
3838. The enthalpy of formation of NdO(g), in kJ mol�1
3939. Molecular constants of 145Pm16O(g) . . . . . . . . . . .
4040. Molecular constants of 152Sm16O(g) . . . . . . . . . . .
4141. The enthalpy of formation of SmO(g), in kJ mol�1
4142. Molecular constants of 153Eu16O(g). . . . . . . . . . . .
4243. The enthalpy of formation of EuO(g), in kJ mol�1
4344. Molecular constants of 158Gd16O(g) . . . . . . . . . . .
4345. The enthalpy of formation of GdO(g), in kJ mol�1
4446. Molecular constants of 159Tb16O(g). . . . . . . . . . . .
4547. Molecular constants of 159Dy16O(g) . . . . . . . . . . .
4648. Molecular constants of 165Ho16O(g) . . . . . . . . . . .
4749. The enthalpy of formation of HoO(g), in kJ mol�1
4850. Molecular constants of 166Er16O(g) . . . . . . . . . . . .
4851. The enthalpy of formation of ErO(g), in kJ mol�1
4952. Molecular constants of 169Tm16O(g) . . . . . . . . . . .
4953. The enthalpy of formation of TmO(g), in kJ mol�1
5054. Molecular constants of 174Yb16O(g) . . . . . . . . . . .
5155. The enthalpy of formation of YbO(g), in kJ mol�1
5156. Molecular constants of 175Lu16O(g). . . . . . . . . . . .
5257. The enthalpy of formation of LuO(g), in kJ mol�1
5258. Temperature of melting of thorium dioxide . . . .
5359. Temperature of melting of uranium dioxide . . . .
5760. The melting point of PuO2(cr) . . . . . . . . . . . . . . . . .
5961. The enthalpy of formation of plutonium dioxide
6062. Temperature of melting of plutonium sesquioxide
6063. The melting point of Cm2O3(cr) . . . . . . . . . . . . . . .
6264. Molecular constants of AcO(g) . . . . . . . . . . . . . . . .
6465. The molecular parameters for ThO2(g). . . . . . . . .
6566. The enthalpy of sublimation of ThO2(g), in kJ
mol�1 . . . . . . . . . . . . . . . . . . . . . . . . . . . . . . . . . . . . . . . .
6567. Molecular constants of 232Th16O(g). . . . . . . . . . . .
6668. The enthalpy of formation of ThO(g), in kJ mol�1
6769. The molecular parameters for PaO2(g) . . . . . . . . .
6870. Molecular constants of 231Pa16O(g) . . . . . . . . . . . .
6871. The molecular parameters for UO3(g). . . . . . . . . .
6972. The enthalpy of formation of UO3(g), in kJ mol�1
7073. The molecular parameters for UO2(g). . . . . . . . . .
7174. The enthalpy of sublimation of UO2(g), in kJ
mol�1 . . . . . . . . . . . . . . . . . . . . . . . . . . . . . . . . . . . . . . . .
7275. Molecular constants of 238U16O(g). . . . . . . . . . . . .
7276. The enthalpy of formation of UO(g), in kJ mol�1
7377. The molecular parameters for NpO2(g) . . . . . . . .
7478. Molecular constants of 237Np16O(g) . . . . . . . . . . .
7579. The enthalpy of formation of NpO(g), in kJ mol�1
7580. The molecular parameters for PuO3(g) . . . . . . . . .
7681. The molecular parameters for PuO2(g) . . . . . . . . .
7782. Molecular constants of 239Pu16O(g) . . . . . . . . . . . .
7883. The molecular parameters for AmO2(g). . . . . . . .
7984. Molecular constants of 243Am16O(g). . . . . . . . . . .
80wnloaded to IP:
THERMODYNAMIC PROPERTIES OF LANTHANIDE AND ACTINIDE OXIDE COMPOUNDS 013101-5
This a
85. Molecular constants of 247Cm16O(g) . . . . . . . . . . .
rticle is copyrighted as indicated in the article. Reuse of AIP co
78.131.95.1
80
86. Molecular constants and enthalpies of formation
for AnO(g) (An ¼ Bk–Lr). . . . . . . . . . . . . . . . . . . . .
8187. Molecular constants and enthalpies of formation
for AnO2(g) (An = Bk–Lr) . . . . . . . . . . . . . . . . . . . .
8188. Selected thermodynamic data of the solid and
liquid phases of the lanthanide and actinide oxides
8389. Selected thermodynamic data of the gaseous
lanthanide and actinide oxides. . . . . . . . . . . . . . . . .
85List of Figures
1. The temperature corrections according to varioustemperature scales. . . . . . . . . . . . . . . . . . . . . . . . . . . . .
72. The reduced enthalpy increment (in J K�1 mol�1)of La2O3; ○, Blomeke and Ziegler29; △, Yashvili
et al.30;~, King et al.27;^, Sedmidubský et al.31;�, value derived from the low-temperature mea-surements by Justice and Westrum, Jr.;28 the curveshows the recommended equation. . . . . . . . . . . . . .
93. The reduced enthalpy increment (in J K�1 mol�1)of CeO2; ○, Kuznetsov et al.57; &, King et al.27;
~, Mezaki et al.59; 5, Yashvili et al.60; ◊, Pearset al.58; �, value derived from the low-temperaturemeasurements byWestrum, Jr. and Beale, Jr.;56 thecurve shows the recommended equation. . . . . . . .
114. The polymorphism in the Ln2O3 series as a func-tion of temperature. . . . . . . . . . . . . . . . . . . . . . . . . . . .
125. The enthalpy of formation of compositions in thePrO2-PrO1.5 (&) and TbO2-TbO1.5 (&) systems.
156. The reduced enthalpy increment (in J K�1 mol�1)of Nd2O3; ○, Blomeke and Ziegler29; &, King
et al.27; �, value derived from the low-temperature
measurements by Justice and Westrum, Jr.;28 the
curve shows the recommended equation.. . . . . . .
167. The reduced enthalpy increment (in J K�1 mol�1)of B-Sm2O3; ○, Gvelesiani et al.
115; &, Pankratz
et al.114; ~, Curtis and Johnson112; �, value
derived from the low-temperature measurements
by Justice andWestrum Jr.113; the curve shows the
recommended equation. . . . . . . . . . . . . . . . . . . . . . . .
198. The reduced enthalpy increment (in J K�1 mol�1)of B-Eu2O3 (top) and C-Eu2O3 (bottom); ○, Gve-lesiani et al.115;&, Pankratz andKing128;~;130 �,value derived from the low-temperature measure-
ments by Lyutsareva et al.126; the curves show the
recommended equations. . . . . . . . . . . . . . . . . . . . . . .
219. The reduced enthalpy increment (in J K�1 mol�1)of B-Gd2O3 (top) and C-Gd2O3 (bottom); ○, Pank-ratz and King128; &, Tsagareishvili et al.155; ~Curtis and Johnson112; �, value derived from the
low-temperature measurements by Justice and
Westrum Jr.113 for C-Gd2O3 and Konings
et al.127 for B-Gd2O3; the curves show the recom-
mended equations. . . . . . . . . . . . . . . . . . . . . . . . . . . . .
2310. The reduced enthalpy increment (in J K�1 mol�1)of Ho2O3; ○, Tsagareishvili and Gvelesiani
164;&,
28ntent is sub
59 On: Sun,
Pankratz et al.90; �, value derived from the low-
temperature measurements by Justice and Wes-
trum Jr.113; the curve shows the recommended
equation. . . . . . . . . . . . . . . . . . . . . . . . . . . . . . . . . . . . . .
11. The reduced enthalpy increment (in J K�1 mol�1)of Er2O3; ○, Tsagareishvili and Gvelesiani169; &,
Pankratz et al.90; �, value derived from the low-
temperature measurements by Justice and Wes-
trum Jr.161; the curve shows the recommended
equation. . . . . . . . . . . . . . . . . . . . . . . . . . . . . . . . . . . . . .
J. Phys. Chem. Ref. Data, Vol. 43, No.ject to the terms at: http://scitation.aip.org/termsconditions. Do
27 Apr 2014 17:09:58
29
12. The reduced enthalpy increment (in J K�1 mol�1)of Tm2O3; ○, Tsagareishvili and Gvelesiani
129;&,
Pankratz et al.90; �, value derived from the low-
temperature measurements by Justice et al.174; the
curve shows the recommended equation.. . . . . . .
3013. The reduced enthalpy increment (in J K�1 mol�1)of Yb2O3; ○, Tsagareishvili and Gvelesiani
129;&,
Pankratz et al.90; �, value derived from the low-
temperature measurements by Justice et al.174; the
curve shows the recommended equation.. . . . . . .
3114. The reduced enthalpy increment (in J K�1 mol�1)of Lu2O3; ○, Yashvili et al.
30; &, Pankratz and
Kelly65; �, value derived from the low-tempera-
ture measurements by Justice et al.174; the curve
shows the recommended equation.. . . . . . . . . . . . .
3215. The reduced enthalpy increment (in J K�1 mol�1)of ThO2; �, Jaeger and Veenstra317; ~, South-ard318;&, Hoch and Johnston319;* Pears et al.58;
^, Victor and Douglas320; �, Springer et al.321;
5, Fischer et al.323; (, Agarwal et al.324; � Dash
et al.325; �, Osborne andWestrum Jr.314; the curve
shows the recommended equation.. . . . . . . . . . . . .
5316. The heat capacity (in J K�1 mol�1) of ThO2; �,Ronchi and Hiernaut307; & Dash et al.325; the
curve shows the recommended equation. Note that
the data of Ronchi andHiernaut307 indicate a value
of about 600 J K�1 mol�1 (not shown in the graph)at the maximum of the anomalie. . . . . . . . . . . . . . .
5417. The heat capacity of UO2.667; &, Inaba et al.340;&, Westrum Jr. and Grønvold342;~, Girdhar andWestrum Jr.339 . . . . . . . . . . . . . . . . . . . . . . . . . . . . . . . .
5518. The reduced enthalpy increment (in J K�1 mol�1)of UO2;○, Moore and Kelley336; &, Ogard and
Leary374; ~ Fredrickson and Chasanov375; 5,
Hein and Flagella376; ◊, Leibowitz et al.377;(,378; �, Mills et al.379; �, value derived from thelow-temperature measurements by Hunzicker andWestrum Jr.373; the curve shows the recommendedequation.. . . . . . . . . . . . . . . . . . . . . . . . . . . . . . . . . . . . . .
5719. The heat capacity of UO2; ○, Ronchi et al.380; &,
Grønvold et al.349; ~ Amaya et al.381; 5, Popovet al.335;◊, Hunzicker andWestrum Jr.373;(, Inabaet al.382; the curve shows the recommendedequation.. . . . . . . . . . . . . . . . . . . . . . . . . . . . . . . . . . . . . .
5720. The reduced enthalpy increment (in J K�1 mol�1)of NpO2;&, Arkhipov et al.406; ◊, Nishi et al.407;○, Beneš et al.408; �, value derived from the low-temperature measurements by Westrum Jr.
581, 2014wnloaded to IP:

013101-6 KONINGS ET AL.
This a
et al.405; the dashed curve shows the recommendedequation based on the estimates of Serizawaet al.410. . . . . . . . . . . . . . . . . . . . . . . . . . . . . . . . . . . . . . .
21. The reduced enthalpy increment (in J K�1 mol�1)of PuO2; ○, Ogard
421; &, Kruger and Savage419;
5, Oetting422; �, value derived from the low-
temperature measurements by Flotow et al.420;
the curve shows the recommended equation. . . .
J. Phys. Chem. Ref. Data, Vol. 43, No. 1, 2014rticle is copyrighted as indicated in the article. Reuse of AIP co
78.131.95.1
59
22. The reduced enthalpy increment (in J K�1 mol�1)of AmO2 (&) and AmO1.5 (○) by Nishi et al.439;the solid curve shows the recommended equations,the dashed curves the estimates based on compar-ison with other lanthanide and actinide dioxidesand sesquioxides. . . . . . . . . . . . . . . . . . . . . . . . . . . . . .
6123. The polymorphism of Ln2O3 (open symbols) andAn2O3 (closed symbols) compounds expressedas ionic radius versus temperature. The lines arebased on the transition temperatures in thelanthanide series (see Fig. 4). . . . . . . . . . . . . . . . . .
8624. The standard entropy S°(298.15 K) of the lantha-nide sesquioxides; ■ the lattice entropies derivedfrom experimental studies; & values calculated
from the lattice, represented by the dashed lines,
and excess entropy as explained in the text; ○ and� the experimental values from the hexagonal/monoclinic and cubic compounds, respectively..
8625. The standard entropy S°(298.15 K) of the actinidesesquioxides; ■ the lattice entropies derived fromexperimental studies; & experimental value for
Pu2O3; ( estimated values from the lattice and
excess entropy as explained in the text. . . . . . . . .
8626. The enthalpy of the hypothetical solution reactionfor the lanthanide (open symbols) and actinide(closed symbols) sesquioxides, indicating the dif-ferent structures (A-type, &; B-type, ~; C-type,
○).. . . . . . . . . . . . . . . . . . . . . . . . . . . . . . . . . . . . . . . . . . . .
8627. The enthalpy of the hypothetical solution reac-tion for the lanthanide (open symbols) and acti-nide (closed symbols) sesquioxides as a functionof the molar volume, indicating the differentstructures (A-type, &; B-type, ~; C-type, ○)..
8728. The melting temperature (&, ■) and the enthalpiesof sublimation (○,�) of the actinide (open symbols)and lanthanide (closed symbols) dioxides. . . . . . .
8729. The standard entropy S°(298.15 K) of the actinidedioxides; ■ the lattice entropies derived fromexperimental studies. The experimental value ofCeO2 is also shown (�). . . . . . . . . . . . . . . . . . . . . . . .
8730. The enthalpy of formation of the lanthanide(■) andactinide (&) dioxides.. . . . . . . . . . . . . . . . . . . . . . . . .
8731. The enthalpy of formation of the actinide dioxidesas a function of molar volume.. . . . . . . . . . . . . . . . .
8832. The interatomic bond distance of the lanthanide (�)and actinide (○) gaseous monoxides.. . . . . . . . . . .
8833. The dissociation enthalpy of the lanthanide (○) andactinide (&) gaseous monoxides. . . . . . . . . . . . . . .
88ntent is sub
59 On: Sun,
1. Introduction
The thermodynamic properties of the 4f (lanthanides) and
5f (actinides) elements and their compounds have been
subject of many studies since the SecondWorld War, strongly
stimulated by the demands of the nuclear technology. The
development of nuclear reactor fuels based on uranium,
thorium or plutonium and the understanding of the effects
of fission product accumulation in the fuel, a significant
fraction of which belongs to the lanthanide group, required
such fundamental data. At the same time, many studies of the
(thermodynamic) properties of the f-elements were stimu-
lated by the scientific interest in the role of the f-elements in
the chemical bonding, and particularly the differences
between the 4f and 5f series.
Pioneering work on the major actinides has been performed
during the Manhattan Project in the USA. The researchers in
this project started many systematic studies of uranium and
plutonium and its compounds, the results of which became
available in literature in the 1950s. At the meetings organised
in the frame of the Peaceful Uses of Atomic Energy initiative
and also at the early Symposia on Thermodynamics of Nuclear
Materials organised by the International Atomic Energy
Agency a rapid expansion of the knowledge of the thermo-
dynamic properties of the actinide elements and their com-
pounds was presented. During the same period, the separation
methods for the lanthanides, which are difficult due to their
chemical similarity, improved significantly to yield these
elements in sufficient pure form that was needed for accurate
thermochemical and thermophysical measurements.1,2
In the 1960s and 1970s a wealth of scientific information on
the f-elements has been published, the lanthanides as well as
uranium and thorium being available in pure form to many
researchers, and the other actinides being produced in sig-
nificant quantities for studies at nuclear research laboratories.
As a result, the understanding of the trends and systematics of
their properties has improved considerably, revealing the
differences between the localised 4f electrons in the lantha-
nides and the heavy actinides (Am-Lr) and the itinerant 5f
electrons of the light actinides (Th-Np).
In this work, we will present a comprehensive review of the
thermodynamic properties of the oxides of the lanthanides and
actinides, based on critical review of the available literature
according to procedures described in Secs. 2.1–2.5.
2. Approach
2.1. Thermal functions of condensed phases
The approach adopted in this review is based on a critical
evaluation of the thermal functions (heat capacity, entropy,
enthalpy increment) and enthalpies of formation of the lantha-
nide and actinide oxides using, when possible, the primary
experimental data as reported in literature. To describe these as
a function of temperature it is necessary to include the data on
the structural transformations (including melting point).
ject to the terms at: http://scitation.aip.org/termsconditions. Downloaded to IP:
27 Apr 2014 17:09:58

THERMODYNAMIC PROPERTIES OF LANTHANIDE AND ACTINIDE OXIDE COMPOUNDS 013101-7
This a
The reported transition and melting temperatures have been
corrected to the International Temperature Scale ITS-90.
Though generally no detailed information is given about the
standards used and it is not specifically stated to which earlier
temperature scales the data refer, it is assumed that the results
between 1948 and 1968 refer to IPTS-48 and between 1969
and 1990 to IPTS-68. Especially in the transition years this
may not always be correct. The differences between ITS-90
and IPTS-68 and IPTS-68 and IPTS-48 are shown in Fig. 1.
The low-temperature heat capacity data and the resulting
entropies have not been corrected nor refitted. First, the
changes in the temperature scales in the range T ¼ (0 to
300) K are small, and, second, refitting would only marginally
change the results. In case ofmore than one set of experimental
data covering the temperature range from close to 0 K to room
temperature, often amotivated choice for one of them is made,
based on sample purity and/or calorimetric accuracy. In other
cases a joint treatment has been made using overlapping
polynomial equations.
The high-temperature heat capacity of the solid phases has
been obtained by refitting of the experimental data reported.
The following polynomial equation for the enthalpy increment
fH�ðTÞ � H�ð298:15 KÞg has been adopted
fH�ðTÞ � H�ð298:15 KÞg ¼X
AnðT=KÞn ð1Þwith n¼�1 to 2, but in case of anomalous behavior of the heat
capacity with n up to 4. This corresponds to a heat capacity
equation of the type
CpðTÞ ¼ a�2ðT=KÞ�2 þX
anðT=KÞn: ð2ÞAdifficult question to be answered is that of the temperature
correction of high-temperature heat capacity and enthalpy
data. As can be seen in Fig. 1 the temperature corrections
become significant (>2 K) above 2000 K. For heat capacity
data, which are rare above this temperature, the correction is
straightforward, and has been made. However, for enthalpy
increment data the corrections are not trivial as they depend on
the type of device used and the condition of the sample. In case
of the device was calibrated with a known standard (for
example, sapphire) the temperature correction should also be
made for the standard, and hence not only the temperature but
also the enthalpy conversion factor is affected. Also in case of
encapsulated samples the temperature correction should lead
to an enthalpy correction, as the contribution of the encapsula-
tion material would change. Since the required details are
0 1000 2000 3000 4000
T/K
-5
0
5
10
ΔT/K
T68
-T48
T90
-T68
FIG. 1. The temperature corrections according to various temperature scales.
rticle is copyrighted as indicated in the article. Reuse of AIP content is sub
78.131.95.159 On: Sun,
generally lacking to make the corrections properly, the experi-
mental enthalpy data have not been corrected.
All literature data starting from 1945 have been collected
systematically. When no experimental data were given in the
papers, they have been extracted from digitalized graphs.
2.2. Enthalpies of formation of condensed phases
The derivation of the enthalpies of formation from calori-
metric data was done by recalculation of the thermochemical
reaction schemes (Hess cycles) using a consistent set of
auxiliary data, and has been partially reported in earlier work3
that was updated where necessary. For the solution calori-
metric studies the partial molar enthalpy of formation of an
acid solution (sln) at the concentration given, has been calcu-
lated from the enthalpy of formation of the infinitely dilute
acid,4 the enthalpy of formation of the HX solutions5 and the
densities of the HX solutions at 298.15 K,6 neglecting the
influence of the dissolved ions. Uncertainty limits of the
measurements, as listed in the tables or text, are always the
values given in the original paper, because in many cases they
could not be recalculated due to lack of information. As a
consequence they might refer to one standard deviation of the
mean, twice the standard deviation of the mean, or the 95%confidence interval, which is not always clear. When combin-
ing data from different sources to a selected value, a weighted
mean is therefore considered not justified and the uncertainty
limit of the selected (mean) value has been estimated. Aux-
iliary data recommended by CODATA or values consistent
with the CODATA selection4 have been employed.
2.3. Thermal functions of gases
Thermal functions of the diatomic molecules were calcu-
lated in the present work using the approach developed by
Gurvich et al.7 The vibrational-rotational partition functions
were calculated by direct summation over vibrational levels
and by integration with respect to rotational levels. The upper
limit of integration was assumed linearly decreasing with
vibrational quantum number.
The electronic partition functions were calculated taking
into account all experimentally known and estimated data on
excited states. The value of Qint and its derivatives were
evaluated assuming thatQðiÞvib;rot ¼ ðpi=pXÞðXÞvib;rot. This approach
is well justified in the case of the molecules under considera-
tion though the most of these molecules have numerous low-
lying states, which contribute considerably to the thermal
functions. The point is that these states as a rule belong to
the same electron configuration as the ground state. It is well
known that the states of the same configuration have close
values of vibrational and rotational constants. Therefore, the
tables of molecular constants present the vibrational and
rotational constants only for the ground state. The only excep-
tion is the YbO molecule for which the ground state config-
uration gives only one state, namely, the X1Σ state, while the
low-lying states belong to the other configurations with quite
different molecular constants. The excited states are presented
J. Phys. Chem. Ref. Data, Vol. 43, No. 1, 2014ject to the terms at: http://scitation.aip.org/termsconditions. Downloaded to IP:
27 Apr 2014 17:09:58

013101-8 KONINGS ET AL.
This a
in the tables in two blocks for experimentally known and
estimated states with corresponding statistical weights. The
uncertainties in the energies of experimental states are usually
small, but for estimated states they can amount to 10%–20% of
the listed values.
For simplification of introducing a huge number of high-
energy excited electronic states for molecules under consid-
eration, containing f and d open shells, in the present work the
approach of the density of states estimationwas applied. In this
approach, a group of high-energy states with close energies are
united in one state with fixed (mostly rounded) energy and
average statistical weight. This division into groups of states is
being done in away that does not interfere with the accuracy of
the thermal functions calculation. Errors of the calculated
thermal functions depend mostly on the accuracy of the data
on molecular constants. At room temperature, the uncertain-
ties in heat capacity as a rule do not exceed 0.3–0.5 J K�1
mol�1. At higher temperatures, the uncertainties become
larger because of the increasing contribution of excited states
and errors of these estimations. In heat capacity the uncertain-
ties can reach 3–5 J K�1 mol�1 at 4000 K, or even larger for
molecules that entirely lack experimental data, such as PaO,
NpO, AmO, CmO, or PuO.
The thermal function of the polyatomic molecules were
calculated using the rigid-rotor harmonic oscillator appro-
ach,7,8 that includes general approximations for the transla-
tional, rotation and vibrational contributions, and a direct
summation of the electronic partition function.
The heat capacity values were approximated by two con-
jugated equations of the form:
C�pðTÞ ¼ a�2ðT=KÞ�2 þ
XanðT=KÞn: ð3Þ
The accuracy of the approximation is around 0.1 J K�1 mol�1
over full temperature range from 298.15 to 4000 K.
The nomenclature used in the tables of molecular properties
of the gaseous species is summarized in Table 1. The funda-
mental constants as recommended by CODATA are used in
this work.
2.4. Enthalpies of formation of gases
The aim of this review is to select the most reliable
enthalpies of formation for MO, MO2, and MO3 molecules
TABLE 1. Nomenclature of the molecular properties for the di- and polyatomic
species
Symbol Name Symbol Name
Te Electronic energy level σ Symmetry number
p Degeneracy (of Te) IAIBIC Product of moments
of inertia
ωe Fundamental harmonic
vibrational frequency
ni Fundamental
vibrational frequency
ωexe Anharmonicity correction
be Rotational constant
ae Rotational-vibration
interaction constant
De Centrifugal distortion
constant
J. Phys. Chem. Ref. Data, Vol. 43, No. 1, 2014rticle is copyrighted as indicated in the article. Reuse of AIP content is sub
78.131.95.159 On: Sun,
based on calculations with new thermal functions of these
molecules, and to take into consideration new experimental
data and quantum chemical calculations not included in pre-
vious assessments.
The recommended enthalpies of formation at the standard
temperature T ¼ 298.15 K have been selected in this review
after critical analysis of all accessible published experimen-
tal data on high-temperature equilibriums for reactions in
the gas phase or in condensed and gas phases. The enthalpies
of reactions were calculated from the equilibrium constants
by the “second-law” and the “third-law” methods.7,9 By the
former, the enthalpy of reaction at the mean temperature of
experiments Tmean is obtained from the temperature depen-
dence of equilibrium constant, Kp, measured in some tem-
perature interval:
DrH�ðTmeanÞR
¼ � dðln KpÞdð1=TÞ : ð4Þ
The value Tmean is calculated using equation Tmean
¼ ðn�1P
T�1i Þ�1
, where n is the number of experimental
points. The ΔrH°(Tmean) value so obtained is reduced to the
reference temperature 298.15 K:
DrH�ð298:15 KÞ ¼ DrH
�ðTmeanÞ � DrfDTmean298:15H
�g: ð5Þ
In the “third-law”method,ΔrH°(298.15 K) is obtained fromevery experimental Kp value
DrH�ð298:15KÞ ¼ TDrf� RT lnKp; ð6Þ
using the free energy functions (or reduced Gibbs energies) f,which is defined as
f ¼ �fG�ðTÞ � H�ð298:15 KÞg=T; ð7Þ
¼ S�ðTÞ � DT298:15H
�
T; ð8Þ
for each reactant. The enthalpy of formation for the molecule
under study,ΔfH°(298.15K) is calculated from the enthalpy of
a reaction using known enthalpies of formation for all other
reactants.
The uncertainties ascribed to selected ΔfH°(298.15 K)
values reflect statistical errors, uncertainties in the thermal
functions, and uncertainties in enthalpies of formation for all
other reaction participants. Most experimental measure-
ments for equilibriums involving the considered molecules
were carried out by Knudsen effusion (KE) and mass
spectrometric methods (MS), or by combination of both.
In the case of MS measurements, the term RT ln(1.5) was
added to reflect uncertainties of equilibrium constants cal-
culated from ion currents, due to uncertainties in ionization
cross sections. Agreement of the second- and third-law
values was regarded as an indication of reliability of experi-
mental data.
ject to the terms at: http://scitation.aip.org/termsconditions. Downloaded to IP:
27 Apr 2014 17:09:58

TABLE 2. Temperature ofmelting of lanthanumsesquioxide (afterCoutures and
Rand15)
Tfus/K
Authors Reported ITS-90
Wartenberg and Reusch16 2588 2581
Lambertson and Gunzel17 2483 � 20 2489 � 20
Sata and Kiyoura18 2577 � 2 2583 � 2
Foex19 2573 2587
Mordovin et al.20 2493 � 30 2496 � 30
Noguchi and Mizuno21 2530 � 20 2532 � 20
Treswjatskii et al.22a 2583 � 20 2582 � 20
Coutures et al.23 2593 � 10 2592 � 10
Wehner et al.12 2563 � 3024
THERMODYNAMIC PROPERTIES OF LANTHANIDE AND ACTINIDE OXIDE COMPOUNDS 013101-9
This a
2.5. Consistency and completeness
We have tried to maintain the internal consistency of the
recommended data as much as possible, but in view of the
complex interrelationships in some of the analysed systems
(e.g., Ce-O, U-O or Pu-O) and the fact that data from
other sources have been used this cannot be fully guaranteed.
The review has been performed progressively during a period
of several years. New information that became available
during and just after this period has been incorporated as far
as possible, but in some cases the implications of adopting new
(more accurate) values were too far-reaching to be implemen-
ted. These cases are clearly identified in the text.
Mizuno et al. 2569 � 20 2555 � 20Yoshimura et al.25 2573 � 5 2576 � 5
Shevthenko and Lopato13 2583 2582
Ushakov and Navrotsky14 2574 � 10
Selected value: 2577 � 15
aAlso reported by Lopato et al.11
100
125
150
o (T
)-H
o (29
8.15
K)
(T -
298
.15)
3. The Lanthanide Oxides in Solid andLiquid State
3.1. La2O3(cr,l)
3.1.1. Polymorphism and melting point
Lanthanum(III) oxide has a A-type hexagonal sesquiox-
ide structure (space group P3m1) at room temperature. It
transforms to a H-type hexagonal structure upon heating.
Foex and Traverse10 suggest that this transformation is a
simple displacement rearrangement of the lattice,10 as in a→b quartz. Foex and Traverse,10 Lopato et al.11 and Wehner
et al.12 all reported the A → H transition at T ¼ 2313 K,
Shevthenko and Lopato13 at T¼ 2303 K, and14 at (2319� 5)
K. The H phase subsequently transforms into a cubic X-type
structure (space group Im3m) and the transformation tem-
peratureswere reported as T¼ 2383, 2413, 2363, and 2373K,
(2383 � 5) K, respectively. Except for the recent work by
Ushakov and Navrotsky,14 all other measurements must
be converted to ITS-90. The measurements of Foex and
Traverse10 must be corrected by +14 K, following the pro-
cedure outlined by Coutures and Rand.15 Lopato et al.,11
Wehner et al.,12 and Shevthenko and Lopato13 reported no
(detailed) information on the calibration of their measure-
ments, but assuming the data refer to IPTS-68, a correction
of�1 K needs to be applied. We select Ttrs ¼ (2313� 30) K
for the A → H transformation, Ttrs ¼ (2383 � 30) K for the
H → X transformation.
Various measurements of the melting temperature of solid
La2O3 have been reported as summarized in Table 2, which
is based on the IUPAC review by Coutures and Rand;15
the results being corrected to ITS-90. The recent value for
the melting by temperature by Ushakov and Navrotsky14
is in excellent agreement with the selected values by Cou-
tures and Rand,15 and the latter is retained, Tfus ¼ (2577
� 15) K.
0 500 1000 1500 2000
T/K
75
H
FIG. 2. The reduced enthalpy increment (in J K�1 mol�1) of La2O3; ○,Blomeke and Ziegler29; △, Yashvili et al.30; ~, King et al.27; ^,
Sedmidubský et al.31; �, value derived from the low-temperaturemeasurements by Justice and Westrum, Jr.;28 the curve shows therecommended equation.
3.1.2. Heat capacity and entropy
Low-temperature heat capacity measurements for La2O3
have been reported by three different research groups:
Goldstein et al.26 from 16 to 300 K, King et al.27 from 50 to
300 K, and Justice and Westrum, Jr.28 from 5 to 350 K. The
measurements reasonably agree to about T¼ 200K; above this
rticle is copyrighted as indicated in the article. Reuse of AIP content is sub
78.131.95.159 On: Sun,
temperature the differences significantly increase. The
selected standard entropy of La2O3 has been derived from the
measurement by Justice and Westrum, Jr.,28 which is con-
sidered to be the most accurate
S�ð298:15 KÞ ¼ ð127:32� 0:84Þ J K�1 mol�1:
The high-temperature enthalpy increment of La2O3(cr)
has been measured by Blomeke and Ziegler29 from 380 to
1170 K, King et al.27 from 399 K to 1797 K, Yashvili et al.30
from 380 to 1650 K and Sedmidubský et al.31 from 689 to
1291 K, which are in perfect agreement, as shown in Fig. 2.
The measurements smoothly join the low-temperature heat
capacity measurements by Justice and Westrum, Jr.28 Basili
et al.32 measured the heat capacity of La2O3 from 400 to
850 K. Their results, only presented in graphical form,
reasonably agree with the enthalpy measurements to about
550 K. The heat capacity above 298.15 K for A-type La2O3
can be represented by the equation (298.15 to 1800 K):
C�pðTÞ=J K�1 mol�1 ¼ 120:6805þ 13:42414 10�3ðT=KÞ
� 14:13668 105ðT=KÞ�2
J. Phys. Chem. Ref. Data, Vol. 43, No. 1, 2014ject to the terms at: http://scitation.aip.org/termsconditions. Downloaded to IP:
27 Apr 2014 17:09:58
013101-10 KONINGS ET AL.
This a
derived from a fit of the combined enthalpy results of Blo-
meke and Ziegler,29 King et al.27 and Yashvili et al.,30 which
are considered the most accurate. The boundary condition
C�p(298.15) = 108.78 J K�1 mol�1 was applied, as derived
from the low-temperature heat capacity measurements.28
Heat-capacity or enthalpy measurements have not been
reported for the H, X, and liquid phases of La2O3 and we
estimate
C�pðH;TÞ ¼ C�
pðX;TÞ ¼ 150 JK�1 mol�1;
C�pðliq;TÞ ¼ 162 JK�1 mol�1:
The transition enthalpies of La2O3 have been measured by
Ushakov and Navrotsky14 recently, using high temperature
thermal analysis
DtrsH�ðA ! HÞ ¼ ð23� 5Þ kJmol�1;
DtrsH�ðH ! XÞ ¼ ð17� 5Þ kJmol�1;
DfusH� ¼ ð78� 10Þ kJmol�1:
These values have been selected here. They are only partially
corresponding to the observation by Foex and Traverse10 who
noted a moderate thermal effect for the A→ H transformation
byDTA (differential thermal analysis), and a significant one for
the H → X. Wu and Pelton33 concluded from the fact that the
liquidus at the La2O3 side of the phase La2O3–Al2O3 phase
diagram does not show clear discontinuities, that the entropy
changes of the A → H and H → X transformations are very
small. They also concluded that the limiting slope of the liquid
line in this phase diagram suggests an entropy of fusion
TABLE 3. The enthalpy of formation of La2O3(cr) at 298.15K;DH�1 is the enthalpy of
and Konings34)
Authors Methoda D
Muthmann and Weis40 C
Matignon41 S
Kremers and Stevens42 C
Moose and Parr43 C
Beck44 S
Roth et al.45 C
Huber, Jr. and Holley, Jr.35 C
von Wartenberg46 S (0.1)
Montgomery and Hubert36 S (0.51) [�Fitzgibbon et al.37 S (1.0) �
[�S(1.0) �
[�Gvelesiani and Yashvili38 S (1.0) �
[�S (1.5) �
[�Oppermann et al.47 S (4.0) [�Selected value:
aC: combustion calorimetry; S: solution calorimetry; values in parentheses give tbEstimated/interpolated from the results of Merli et al.39
cMerli et al.39
J. Phys. Chem. Ref. Data, Vol. 43, No. 1, 2014rticle is copyrighted as indicated in the article. Reuse of AIP content is sub
78.131.95.159 On: Sun,
of 25.1 J K�1 mol�1, in fair agreement with the value found
by Ushakov and Navrotsky,14 30.3 J K�1 mol�1.
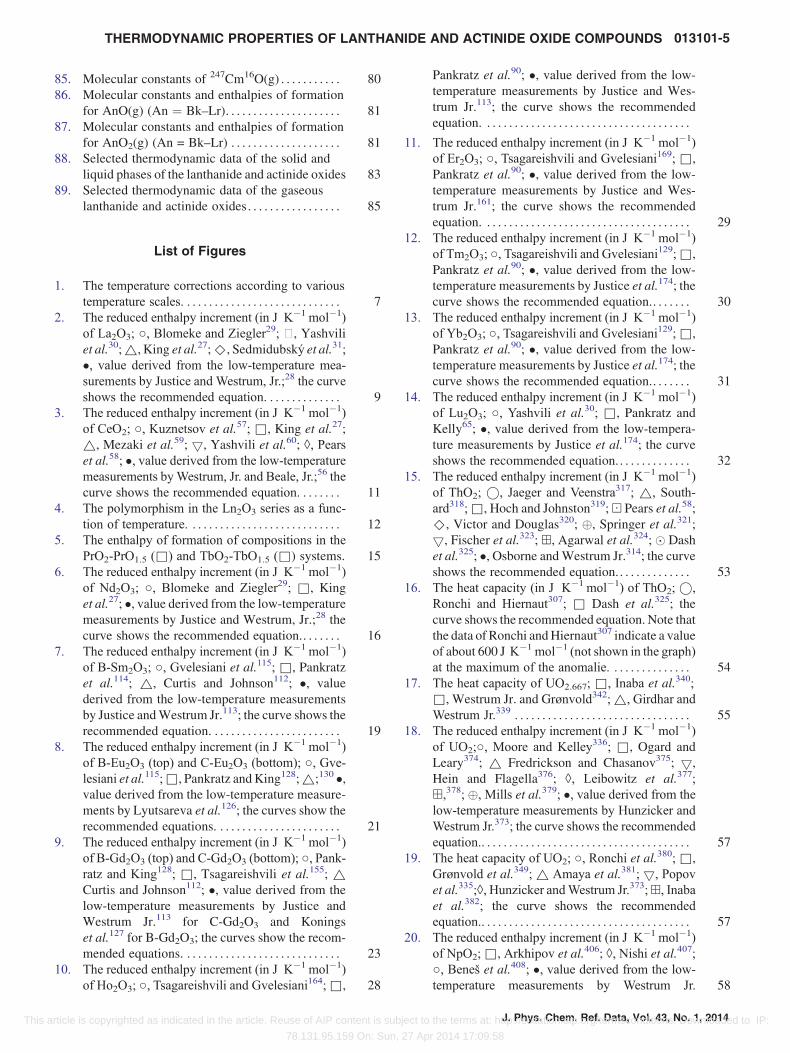
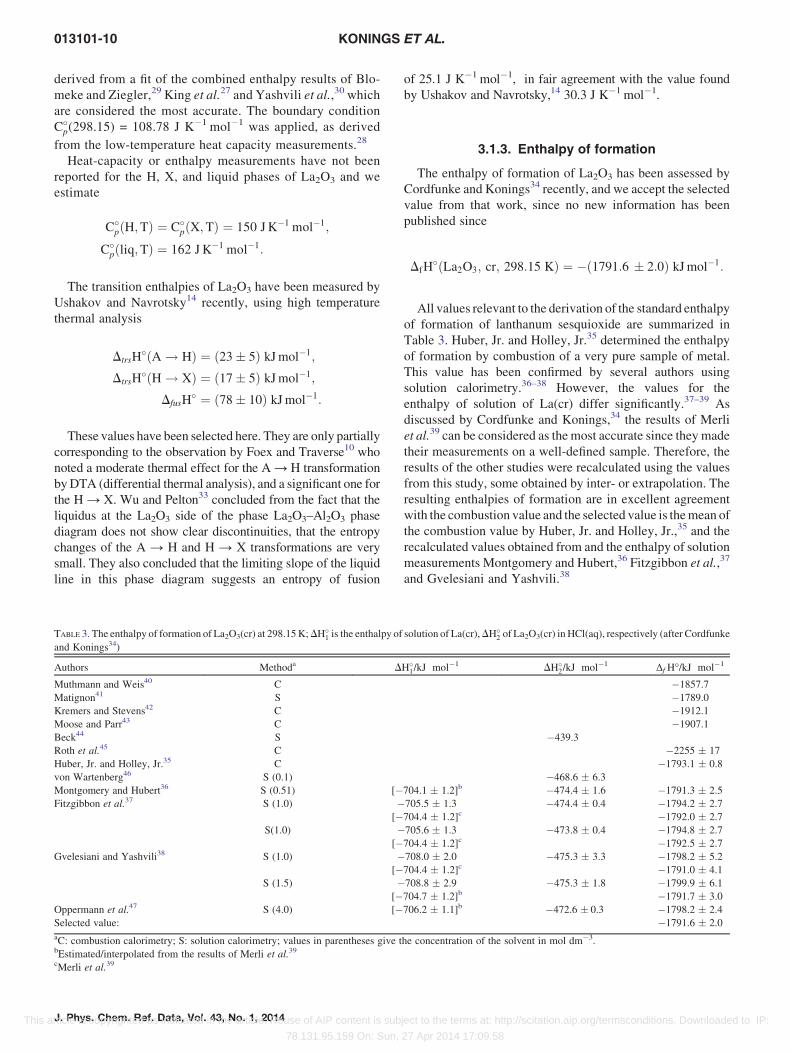
3.1.3. Enthalpy of formation
The enthalpy of formation of La2O3 has been assessed by
Cordfunke and Konings34 recently, and we accept the selected
value from that work, since no new information has been
published since
DfH�ðLa2O3; cr; 298:15 KÞ ¼ �ð1791:6 � 2:0Þ kJmol�1:
All values relevant to the derivation of the standard enthalpy
of formation of lanthanum sesquioxide are summarized in
Table 3. Huber, Jr. and Holley, Jr.35 determined the enthalpy
of formation by combustion of a very pure sample of metal.
This value has been confirmed by several authors using
solution calorimetry.36–38 However, the values for the
enthalpy of solution of La(cr) differ significantly.37–39 As
discussed by Cordfunke and Konings,34 the results of Merli
et al.39 can be considered as the most accurate since they made
their measurements on a well-defined sample. Therefore, the
results of the other studies were recalculated using the values
from this study, some obtained by inter- or extrapolation. The
resulting enthalpies of formation are in excellent agreement
with the combustion value and the selected value is themean of
the combustion value by Huber, Jr. and Holley, Jr.,35 and the
recalculated values obtained from and the enthalpy of solution
measurements Montgomery and Hubert,36 Fitzgibbon et al.,37
and Gvelesiani and Yashvili.38
solution of La(cr),DH�2 of La2O3(cr) in HCl(aq), respectively (after Cordfunke
H�1/kJ mol�1 DH�
2/kJ mol�1 ΔfH°/kJ mol�1
�1857.7
�1789.0
�1912.1
�1907.1
�439.3
�2255 � 17
�1793.1 � 0.8
�468.6 � 6.3
704.1 � 1.2]b �474.4 � 1.6 �1791.3 � 2.5
705.5 � 1.3 �474.4 � 0.4 �1794.2 � 2.7
704.4 � 1.2]c �1792.0 � 2.7
705.6 � 1.3 �473.8 � 0.4 �1794.8 � 2.7
704.4 � 1.2]c �1792.5 � 2.7
708.0 � 2.0 �475.3 � 3.3 �1798.2 � 5.2
704.4 � 1.2]c �1791.0 � 4.1
708.8 � 2.9 �475.3 � 1.8 �1799.9 � 6.1
704.7 � 1.2]b �1791.7 � 3.0
706.2 � 1.1]b �472.6 � 0.3 �1798.2 � 2.4
�1791.6 � 2.0
he concentration of the solvent in mol dm�3.
ject to the terms at: http://scitation.aip.org/termsconditions. Downloaded to IP:
27 Apr 2014 17:09:58

FIG. 3. The reduced enthalpy increment (in J K�1 mol�1) of CeO2; ○,Kuznetsov et al.57; &, King et al.27; ~, Mezaki et al.59; 5, Yashvili
et al.60; ◊, Pears et al.58; �, value derived from the low-temperaturemeasurements by Westrum, Jr. and Beale, Jr.;56 the curve shows therecommended equation.
THERMODYNAMIC PROPERTIES OF LANTHANIDE AND ACTINIDE OXIDE COMPOUNDS 013101-11
This a
3.2. CeO2(cr,l)
3.2.1. Melting point
Cerium dioxide has a cubic fluorite structure (space group
Fm3m) up to the melting point. The reported values for the
temperature of melting are very dissimilar (Table 4), which
is due to the fact that this compound starts to lose oxy-
gen at elevated temperatures to form a substiochiometric
CeO2�x phase. The melting point for CeO2 strongly depends
on the atmosphere under which the liquid phase is produced.48
For example, Mordovin et al.20 detected the liquid phase
already at 2670 K, when heating ceria in an argon atmosphere.
On the other hand many other authors10,49–51 observed higher
values of the melting point while heating CeO2 under a
strongly oxidising atmosphere (pure pressurised O2, air, or
amixture of oxygen and an inert gas at high pressure): between
2753 and 3073K.AlsoManara et al.,52 in a recent unpublished
investigation of the melting behavior of CeO2, performed
measurements both under oxidising and reducing atmo-
spheres, obtaining 2743 and 2675 K, respectively. In this last
study, however, heating under high oxygen pressures could not
be realised. Since the highest values are the most likely
to correspond to quasistoichiometric CeO2, we select Tfus ¼(3083 � 50) K as the best melting point for stoichiometric
cerium dioxide, the uncertainty being assigned by us. This is in
line with the the suggestion of Du et al.53 that themelting point
of CeO2 must be between those of the group IVB dioxides and
the actinide dioxides.
3.2.2. Heat capacity and entropy
The low-temperature heat capacity of CeO2 has been mea-
sured by Westrum, Jr. and Beale, Jr.56 from 5 to 300 K. The
entropy, as derived from these measurements, is adopted here
as
S�ð298:15 KÞ ¼ ð62:29� 0:07Þ J K�1 mol�1:
High-temperature enthalpy increments have been reported
by Kuznetsov et al.57 in the temperature range from 608 to
1172 K, King et al.27 from 400 to 1800 K (only smoothed
values are given in the paper), Pears et al.58 from 640 to 2044
K, Mezaki et al.59 from 490 to 1140 K, and Yashvili et al.60
TABLE 4. Temperature of melting of cerium dioxide
Tfus/K
Authors Reported ITS-90
Ruff54 2246
von Wartenberg and Gurr55 2873
Trombe50a 3073 3077
Tshieryepanov and
Trjesvyatsky49b3083 3087
Foex and Traverse10 2753 2768
Mordovin et al.20 2670 � 30 2673 � 30
Watson51 2873 2872
Selected value: 3083 � 50
aPaper not available to us, cited from Noguchi and Mizuno.21
bPaper not available to us, cited from Du et al.53
rticle is copyrighted as indicated in the article. Reuse of AIP content is sub
78.131.95.159 On: Sun,
from391 to 1624K. These data are in reasonable agreement, as
shown in Fig. 3.
High-temperature heat capacities have been measured by
Riess et al.61 by adiabatic scanning calorimetry (350
–900 K). The results, presented as an equation only, are in
excellent agreement with the values derived from the
enthalpy increment measurements. Gallagher and Dwor-
zak62 determined the heat capacity between 418 and
758 K by DSC (differential scanning calorimetry). These
data are, however, much too low to join the low-temperature
data by Westrum, Jr. and Beale, Jr.56
The enthalpy data have been combined, and constrained
C�p(298.15 K) = 61.63 J K�1 mol�1from the low temperature
data,56 resulting in the following heat capacity equation:
C�p=ðJ K�1 mol�1Þ ¼ 74:4814þ 5:83682 10�3ðT=KÞ
� 1:29710 106ðT=KÞ�2:
This equation is extrapolated to the melting point, which
might neglect possible anomalous increase in the heat
capacity as observed in other fcc dioxides of f-elements
such as ThO2 and UO2. The heat capacity of the liquid has
been estimated as
C�pðCeO2; liq;TÞ ¼ 120 JK�1 mol�1:
The entropy of fusion is assumed to be the same as
that of the isostructural UO2 phase (22.4 J K�1 mol�1), which
is the only fcc dioxide for which this quantity is well defined.
We thus obtain for the enthalpy of fusion
DfusH�ðCeO2Þ ¼ ð69� 5Þ kJmol�1:
3.2.3. Enthalpy of formation
The standard molar enthalpy of formation of CeO2(cr)
has been determined by Huber, Jr. and Holley, Jr.35 by
oxygen-bomb combustion calorimetry using awell-analyzed
sample of ceriummetal, giving ΔfH°(298.15 K)¼�(1088.6
� 1.4) kJ mol�1. This value, which was carefully corrected
for impurities, is in excellent agreement with the result by
Baker et al.63 of a later oxygen-bomb combustion calori-
metric investigation carried out in the same laboratory,
J. Phys. Chem. Ref. Data, Vol. 43, No. 1, 2014ject to the terms at: http://scitation.aip.org/termsconditions. Downloaded to IP:
27 Apr 2014 17:09:58

TABLE 5. Temperature of melting of cerium sesquioxide (after Coutures and
Rand15)
Tfus/K
Authors Reported ITS-90
Sata and Kiyoura18 2483 � 10 2489 � 2
Mordovin et al.20 2415 � 30 2429 � 30
Treswjatskii et al.22 2513 � 20 2512 � 20
Shevthenko and Lopato13 2513 2512
Selected value: 2512 � 15
013101-12 KONINGS ET AL.
This a
ΔfH°(298.15 K) ¼ �(1090.4 � 0.8) kJ mol�1. We have
selected the latter value because it is based on a cerium
metal sample of significantly higher purity
DfH�ðCeO2; cr; 298:15KÞ ¼ �ð1090:4 � 1:0Þ kJmol�1:
The results of early investigations40,43,64 are mainly of his-
torical interest due to a poor quality of materials and experi-
mental techniques available at that time.
3.3. Ce2O3(cr,l)
3.3.1. Polymorphism and melting point
At room temperature, cerium sesquioxide has a hexa-
gonal A-type structure (space group P3m1). Pankratz and
Kelly65 observed a transition at 1050 K from the A-type
sesquioxide to a high-temperature modification but it
should be noted that their sample had the hyperstoichio-
metric composition (Ce2O3.33). This transition has not
been reported by other investigators, and does not fit into
the general structure diagram on the lanthanide sesqui-
oxides (Fig. 4). We therefore attribute it to this specific
composition and not to the sesquioxide phase, and accord-
ing to the phase diagram of the Ce-O system it could
represent the phase boundary of the {Ce2O3þCe6O10}
two-phase field.
Lopato et al.11 and Shevthenko and Lopato13 reported that A-
typeCe2O3 transforms toahexagonalH-type structureat 2393K.
They also found that the H-type phase transforms to a cubic X-
type structure at 2407 K. No information on the calibration of
these measurements has been found, but assuming the data refer
to IPTS-68, a correction of�1K needs to be applied for ITS-90.
WeselectTtrs¼ (2392�30)Kfor theA→Htransformation,Ttrs
¼ (2406 � 30) K for the H → X transformation.
The various data for the melting temperature have been
summarized in Table 5, which is based on the IUPAC review
by Coutures and Rand;15 the results being corrected to ITS-90.
The selected melting point is (2512 � 50) K.
La Ce Pr Nd PmSm Eu Gd Tb Dy Ho Er Tm Yb Lu800
1200
1600
2000
2400
2800
T/K A B C
HX
Liquid
FIG. 4. The polymorphism in the Ln2O3 series as a function of temperature.
J. Phys. Chem. Ref. Data, Vol. 43, No. 1, 2014rticle is copyrighted as indicated in the article. Reuse of AIP content is sub
78.131.95.159 On: Sun,
3.3.2. Heat capacity and entropy
Low-temperature heat capacity measurements on cerium
sesquioxide have been reported by Weller and King66 in the
range from 53 to –296 K, Justice and Westrum, Jr.67 in the
range from 5 to 345 K, and Huntelaar et al.68 from 5 to 400 K.
The data by Weller and King cover a smaller temperature
range and, moreover, were obtained using a sample with
composition Ce2O3.33. The sample of Justice and Westrum,
Jr.67 was reported to refer to the composition (Ce2O3.02)
but this was later doubted by the authors69 who suggested
that the true composition was likely Ce2O3.33 also. For that
reason the data by Huntelaar et al.68 are preferred. Hence, the
standard entropy, as derived by the latter authors, has been
adopted here as
S�ð298:15 KÞ ¼ ð148:1� 0:4Þ J K�1 mol�1:
High-temperature enthalpy increment measurements have
been reported by Pankratz and Kelly65 from 398 to 1501 K,
Kuznetsov et al.70 from 578 to 1116 K and Huntelaar et al.68
from 473 to 883 K. The data of Pankratz and Kelly65 refer to
the nonstoichiometric composition (Ce2O3.33). The authors
corrected them for the presence of CeO2, but in view of the
unexplained phase transition observed in the results (see
above), the correctness of this approach may be doubted. The
results of Kuznetsov et al.70 and Huntelaar et al.68 are in
reasonable agreement and fit the low-temperature data. How-
ever, the former results also indicate an anomalous increase
near 1000K,whichmight indicate that their sample had not the
stoichiometric composition and that the agreement is fortui-
tous. For that reason our selected heat capacity equation is
based on the results of Huntelaar et al.68 only, which was
constrained to C�p(298.15) ¼ 115.0, as derived from the low-
temperature heat capacity measurements by the same authors,
C�p=ðJ K�1 mol�1Þ ¼ 113:736þ 28:4344 10�3ðT=KÞ
� 0:641205 106ðT=KÞ�2:
Basili et al.32 determined the heat capacity of Ce2O3
between 440 and 1100 K by means of a plane temperature
waves method. Venkata Krishnan and Nagarajan71 measured
the heat capacity from 280 to 820 K by DSC. Their data, read
from a graph, are in reasonable agreement with the heat
capacity derived from the enthalpy increments.
The enthalpies of transition between the high-temperature
modifications have been estimated, in absence of experimental
ject to the terms at: http://scitation.aip.org/termsconditions. Downloaded to IP:
27 Apr 2014 17:09:58

THERMODYNAMIC PROPERTIES OF LANTHANIDE AND ACTINIDE OXIDE COMPOUNDS 013101-13
This a
data. For the (A → H) we have assumed that the entropy of
transition varies regularly between the known values for
La2O3 and Gd2O3. For the (H → X) and (X → liquid)
transitions we have assumed the entropies to be the same as
for La2O3:
DtrsH�ðA ! HÞ ¼ ð28� 8Þ kJmol�1;
DtrsH�ðH ! XÞ ¼ ð19� 5Þ kJmol�1;
DfusH� ¼ ð85� 10Þ kJmol�1:
For the heat capacity of the high temperature phases we
estimate
C�pðH;TÞ ¼ C�
pðX;TÞ ¼ 145 JK�1 mol�1;
C�pðliq;TÞ ¼ 157 JK�1 mol�1:
3.3.3. Enthalpy of formation
Several combustion calorimetric studies have been reported
for the reaction
Ce2O3ðcrÞ þ 1
2O2ðgÞ ¼ 2CeO2ðcrÞ:
The results for the enthalpy of reaction are discordant, as
summarized in Table 6. As suggested by Cordfunke and
Konings,34 this variation may be due to (i) differences in the
O/M ratio of the starting material Ce2O3(cr), (ii) impurities in
Ce2O3(cr) resulting from the fabrication by reduction of the
dioxide (e.g., residual carbon has a big impact on the combus-
tion values), and (iii) differences in the final state of the
reaction product CeO2 that is known to have a large range of
substoichiometric compositions.
Huntelaar et al.68 measured the enthalpy of solution of a
well-defined sample of Ce2O3(cr) in 0.25 mol dm�3 HCl(aq)
from which the enthalpy of formation is derived as ΔfH°(298.15 K) ¼ �(1813.1 � 0.8) kJ mol�1. Putnam et al.74
measured the enthalpy of formation by high-temperature
TABLE 6. The enthalpy of formation of Ce2O3(cr) at 298.15 K
and Ce2O3(cr) in HCl(aq), respectively (after Cordfunke an
Authors Methoda DH�1/kJ m
Kuznetsov et al.57 C
Mah72 C
Baker and Holley, Jr.73 C
Huntelaar et al.68 S (0.25) [�699.2 �
Putnam et al.74 H
Selected value:
aC: combustion calorimetry; S: solution calorimetry; values
mol dm�3; H = high temperature oxide melt solution calorbFor the enthalpy of the reaction Ce2O3(cr) +
12O2(g) = 2Ce
mol�1.cidem, �390.6 � 0.4 kJ mol�1.didem, �381.0 � 0.7 kJ mol�1.eSpedding and Miller.75
fCycle based on CeCl3.
rticle is copyrighted as indicated in the article. Reuse of AIP content is sub
78.131.95.159 On: Sun,
oxide-melt solution calorimetry. Recalculating their mea-
surements with the selected value for the enthalpy of for-
mation of CeO2, gives ΔfH°(298.15 K) ¼ �(1809.2 � 5.2)
kJ mol�1. As noted by Morss and Konings76 these results
give an anomalous value for the hypothetical solution
enthalpy of the reaction,
LnO1:5 þ 3HþðaqÞ ¼ Ln3þðaqÞ þ 3
2H2OðlÞ;
compared to the other lanthanide sesquioxides. For that
reason we select the enthalpy of formation from the combus-
tion study by Baker and Holley, Jr.73 that was performedwith
CeO1.5+x samples that were carefully analysed and were
extrapolated to CeO1.500:
DfH�ðCe2O3; cr; 298:15 KÞ ¼ �ð1799:8 � 1:8Þ kJmol�1:
This value is different from the one selected by Cordfunke
and Konings.34
3.4. PrO2(cr,l)
3.4.1. Structure
PrO2 has a face-centered cubic structure (space group
Fm3m). Hyde et al.77 showed that PrO2 is stable up to 587
K and Ushakov and Navtrosky78 up to 663 K in oxygen gas.
Above this temperature it decomposes to Pr6O11.
3.4.2. Heat capacity and entropy
The heat capacity of PrO2 has been measured by Gardiner
et al.79 from 2.4 to 23 K, showing a lambda anomaly due to the
antiferromagnetic ordering at 13.5 K. No measurements of
the heat capacity of PrO2 in a wider temperature range have
been made from which the standard entropy could be derived.
For that reason the standard entropy has been estimated from
the systematics in the lanthanide and actinide oxides as
S�ð298:15 KÞ ¼ ð80:8� 2:0Þ J K�1 mol�1:
; DH�1 and DH
�2 are the enthalpies of solution of Ce(cr)
d Konings34)
ol�1 DH�2/kJ mol�1 ΔfH°/kJ mol�1
�1823.4 � 1.8b
�1790.2 � 1.5c
�1799.8 � 1.8d
0.2]e �442.7 � 0.6 �1813.1 � 0.8
�1813.2 � 3.2f
�1809.2 � 5.2
�1813.0 � 2.0
in parentheses give the concentration of the solvent in
imetry.
O2(cr) the following value was used: �357.4 � 1.1 kJ
J. Phys. Chem. Ref. Data, Vol. 43, No. 1, 2014ject to the terms at: http://scitation.aip.org/termsconditions. Downloaded to IP:
27 Apr 2014 17:09:58

013101-14 KONINGS ET AL.
This a
In a similar manner the high temperature heat capacity for the
temperature range from 298.15 to 600 K was estimated as
C�p=ðJ K�1 mol�1Þ ¼ 72:981þ 16:628 10�3ðT=KÞ
� 0:9990 106ðT=KÞ�2:
3.4.3. Enthalpy of formation
The enthalpy of formation of PrO2 was determined by
Eyring et al.80 and Gramsch and Morss81 using solution
calorimetry in nitric acid. Recalculation of the results yields
�(949.3 � 4.3) kJ mol�1 and �(959.1 � 2.3) kJ mol�1,
respectively, being significantly different, entirely due to
differences in the solution enthalpies. The selected enthalpy
of formation is derived from the work by Gramsch and
Morss,81 as it is based on an excellently characterised sample
DfH�ðPrO2; cr; 298:15 KÞ ¼ �ð959:1 � 2:3Þ kJmol�1:
Ushakov and Navtrosky78 measured the enthalpy of the
reaction
PrO2 ¼ 1
6Pr6O11ðcrÞ þ 1
12O2ðgÞ
by DSC obtaining ΔrH°(298.15 K) = (10 � 2) kJ mol�1 at
663K.Using the enthalpies of formationof PrO2 andPrO1.833
selected in this work, we calculate ΔrH°(298.15 K) ¼ (9.6
� 5.8) kJ mol�1, in excellent agreement.
3.5. PrO1.833(cr,l)
3.5.1. Melting point
PrO1.833 (also designated as Pr6O11) has a triclinic crystal
structure (space group P1). Pankratz82 found a phase transi-
tion around 760 K. However, it can be concluded from the
PrO1.5–PrO2 phase diagram proposed by Turcotte et al.83 that
the upper limit of stability of PrO1.833 is about 750 K; above
this temperature the PrO2�x phase is stable in equilibrium
with O2(g).
Mordovin et al.20 reported the melting point of PrO1.833 as
T ¼ (2315 � 30) K in Ar atmosphere, but mentioned that
TABLE 7. The enthalpy of formation of PrO1.833 and Pr2O3(cr) at 298.15K;DH�1 andD
and Pr2O3(cr) in HCl(aq) or HNO3(aq), respectively (after Cordfunke and Konin
Authors Methoda DH�1/k
PrO1.833
Stubblefield et al.84 S (6.0)
Fitzgibbon et al.85 S (6.0)
S (6.0)
C
Selected value:
Pr2O3
Stubblefield et al.84 S (6.0)b [�1020
Fitzgibbon et al.85 S (2.0) �692
Selected value:
aC: combustion calorimetry; S: solution calorimetry; values in parentheses give tbThe enthalpy of solution in HNO3(aq).cThe enthalpy of solution of Pr in 6.0 mol dm�3 HNO3(aq) is from Ref. 86.
J. Phys. Chem. Ref. Data, Vol. 43, No. 1, 2014rticle is copyrighted as indicated in the article. Reuse of AIP content is sub
78.131.95.159 On: Sun,
substantial dissociation of the sample occurred. The relevance
of this measurement must thus be doubted.
3.5.2. Heat capacity and entropy
The low-temperature heat capacity of PrO1.833 has not been
measured. The selected standard entropy is interpolated
between PrO2(cr) and PrO1.5:
S�ð298:15 KÞ ¼ ð79:2� 2:0Þ J K�1 mol�1
The high-temperature enthalpy increment of PrO1.833 was
measured by Pankratz82 from 398 to 1052 K and by Blo-
meke and Ziegler29 from 383 to 1172 K. The data are in
good agreement at low temperatures, but the difference
increases steadily up to 1033 K where Pankratz82 observed
a phase transformation, whereas Blomeke and Ziegler29 did
not. As discussed above this phase transformation is very
likely the peritectic decomposition. Since the sample of
Blomeke and Ziegler29 was heated in a capsule above this
temperature before the measurement, (partial) decomposi-
tion probably has occurred, and their results might refer to
the PrO2�x phase. For that reason the data of Pankratz82
below 760 K have been fitted to a polynomial equation,
yielding for the heat capacity:
C�p=ðJ K�1 mol�1Þ ¼ 68:4932þ 15:9207 10�3ðT=KÞ
� 0:80968 106ðT=KÞ�2:
3.5.3. Enthalpy of formation
The enthalpy of formation of PrO1.833 was measured by
Stubblefield et al.84 by solution calorimetry and by Fitzgibbon
et al.85 using both solution and combustion calorimetry. The
recalculated values are summarized inTable 7, based on aHess
cycle with Pr2O3. The results are in reasonable agreement and
we select
DfH�ðPrO1:833; cr; 298:15 KÞ ¼ �ð944:6 � 2:5Þ kJmol�1:
H�2 are the enthalpies of solution of Pr(cr) and PrO1.833(cr) inHNO3(aq), Pr(cr)
gs34)
J mol�1 DH�2/kJ mol�1 ΔfH°/kJ mol�1
�183.3 � 0.4 �943.5 � 2.1
�179.6 � 2.0 �947.0 � 2.3
�179.9 � 2.0 �947.0 � 3.2
�943.2 � 0.8
�944.6 � 2.5
.9 � 3.4]c �447.7 � 0.8 �1831.6 � 3.5
.2 � 1.3 �432.0 � 1.4 �1809.9 � 3.0
�1809.9 � 3.0
he concentration of the solvent in mol dm�3
ject to the terms at: http://scitation.aip.org/termsconditions. Downloaded to IP:
27 Apr 2014 17:09:58

TABLE 9. Temperature of melting of praseodymium sesquioxide
Tfus/K
Authors Reported ITS-90
Foex19 2668 2582
Mordovin et al.20 2390 � 30 2493 � 30
Treswjatskii et al.22 2533 � 20 2532 � 20
Coutures et al.23 2585 � 10 2584 � 10
Kravchonskaya et al.87 2573a
Mizuno et al.24 2549 � 20 2535 � 20
Shevthenko and Lopato13 2553 2552
Selected value: 2583 � 25
aDerived digitally from the graph for the HfO2-Pr2O3 diagram.
TABLE 8. The enthalpy of formation of phases in the PrO2-PrO1.5 system
Compound ΔfH°(298.15 K)/kJ mol�1 Authors
PrO1.703 �(926.3 � 2.2) Stubblefield et al.84
PrO1.717 �(928.4 � 2.6) Fitzgibbon et al.85
PrO1.804 �(938.9 � 2.0) Fitzgibbon et al.85
THERMODYNAMIC PROPERTIES OF LANTHANIDE AND ACTINIDE OXIDE COMPOUNDS 013101-15
This a
The enthalpies of formation of several other PrO2�x compo-
sitions were measured by Stubblefield et al.84 and Fitzgibbon
et al.85 by solution calorimetry, the recalculated results are
given in Table 8. These values show a regular trend between
PrO1.5 and PrO2, as shown in Fig. 5.
3.6. Pr2O3(cr,l)
3.6.1. Polymorphism and melting point
At room temperature praseodymium sesquioxide has the
rare earth hexagonal A-type structure (space group P3m1).
Lopato et al.11 reported that A-type Pr2O3 transforms to a
hexagonal H-type structure at T ¼ 2318 K, and Shevthenko
and Lopato13 at T ¼ 2303 K. They also found that the H-type
phase transforms to a cubic X-type structure at T ¼ 2393 K11
and T ¼ 2403 K.13 No information on the calibration of these
measurements has been found, but assuming the data refer to
IPTS-68, a correction of�1 K needs to be applied for ITS-90.
The results by Kravchonskaya et al.87 are in agreement, but
these authors only presented them in graphical form (A→H at
about 2314 K and H → X at about 2417 K, as extracted
from digitized graphs). We select Ttrs¼ (2310� 30) K for the
A → H transformation, Ttrs ¼ (2397 � 30) K for the H → X
transformation.
The measurements of the melting temperature of Pr2O3
have been summarized in Table 9, which is based on the
IUPAC review by Coutures and Rand;15 the results being
corrected to ITS-90. The selected melting point is (2583 �25) K.
3.6.2. Heat capacity and entropy
The low-temperature heat capacity of A-Pr2O3 has been
measured by Lyutsareva et al., unpublished results as cited by
1.50 1.60 1.70 1.80 1.90 2.00
O/M
-980
-960
-940
-920
-900
Δ fHo (
298.
15 K
)/kJ
mol
-1
M = Tb
M = Pr
FIG. 5. The enthalpy of formation of compositions in the PrO2-PrO1.5 (&) and
TbO2-TbO1.5 (&) systems.
rticle is copyrighted as indicated in the article. Reuse of AIP content is sub
78.131.95.159 On: Sun,
Gruber et al.69 Their results are somewhat high near room
temperature, and were smoothed together with the high-tem-
perature data by Gruber et al.69 giving no weight to the results
above 185 K. The derived standard entropy at T¼ 298.15 K is
selected here
S�ð298:15 KÞ ¼ ð152:7� 0:3Þ J K�1 mol�1:
The high-temperature enthalpy increment of A-Pr2O3 has
beenmeasured by Pankratz82 andKuznetsov andRezukhina.88
The former study covers the temperature range from 298.15 to
1800 K. The latter the temperature range from 293 to 1200 K
and have only been reported in the form of an equation. Our
recommended heat capacity equation is solely based on the
results of Pankratz,82 constrained to C�p(298.15 K) ¼ 118.15
J K�1 mol�1 from the low-temperature measurements:
C�p=ðJ K�1 mol�1Þ ¼ 121:6594þ 25:5611 10�3ðT=KÞ
� 0:98942 106ðT=KÞ�2:
This equation is extrapolated to the transition temperature. No
heat-capacity or enthalpy measurements have been reported
for theH,X, and liquid phases of Pr2O3. The properties of these
modifications have been estimated in a similar way as for
La2O3 and Ce2O3. We thus obtain for the transition enthalpies
DtrsH�ðA ! HÞ ¼ ð28� 8Þ kJmol�1;
DtrsH�ðH ! XÞ ¼ ð19� 5Þ kJmol�1;
DfusH� ¼ ð88� 10Þ kJmol�1:
For the heat capacity of the high temperature modifications
of Pr2O3 we estimate
C�pðH;TÞ ¼ C�
pðX;TÞ ¼ 145 JK�1 mol�1;
C�pðliq;TÞ ¼ 157 JK�1 mol�1:
3.6.3. Enthalpy of formation
The enthalpy of formation of Pr2O3 has been assessed by
Cordfunke and Konings34 recently, and we accept the selected
value from that work, since no new information has been
published since
DfH�ðPr2O3; cr; 298:15 KÞ ¼ �ð1809:9 � 3:0Þ kJmol�1:
J. Phys. Chem. Ref. Data, Vol. 43, No. 1, 2014ject to the terms at: http://scitation.aip.org/termsconditions. Downloaded to IP:
27 Apr 2014 17:09:58

TABLE 10. Temperature of melting of neodymium sesquioxide (after Coutures
and Rand15)
Tfus/K
Authors Reported ITS-90
Lambertson and Gunzel17 2545 � 20 2551 � 20
Foex19 2583 2598
Mordovin et al.20 2486 � 30 2489 � 30
Noguchi and Mizuno21 2506 � 20 2510 � 2092
013101-16 KONINGS ET AL.
This a
This value is based on the solution calorimetric study by
Fitzgibbon et al.,85 who measured the enthalpy of solution of
both Pr(cr) and Pr2O3(cr) in 2.0 mol dm�3 HCl(aq) (see
Table 7). Stubblefield et al.84 determined the enthalpy of
reaction of Pr2O3(cr) with 6.0 mol dm�3 HNO3(aq), but this
approach is considered less reliable since some of the hydro-
gen that is produced during dissolution of the metal, might
reduce the nitric acid.
Gibby et al. 2573 � 25 2572 � 25Treswjatskii et al.22 2593 � 20 2592 � 20
Coutures et al.23 2598 � 10 2597 � 10
Bober et al.93 2540 � 40 2539 � 40
Mizuno et al.24 2563 � 20 2550 � 20
Shevthenko and Lopato13 2573 2572
Coutures94 2613 � 10 2612 � 10
Salikhov and Kan95 2564 � 10
Selected value: 2577 � 15
150
3.7. Nd2O3(cr,l)
3.7.1. Polymorphism and melting point
Nd2O3 has a peculiar place in the lanthanide sequioxide
series. It commonly has a A-type hexagonal sesquioxide
structure (space group P3m1) at room temperature, but also
the C-type structure occurs at room temperature. Systematic
studies89 suggest that the C-form is the thermodynamically
stable modification from room temperature to about T¼ 873–
923 K. Impurities may affect this phase stability, but it is now
generally accepted that the boundary between the A and C rare
earth structures occurs near or at Nd2O3 (see Fig. 4). However,
as most of the thermodynamic measurements reported in
literature have been made for the A-type phase, our recom-
mended values refer to this phase.
Pankratz et al.90 found a small thermal anomaly at1345 K
by drop calorimetry whose origin is unknown (see below).
At high temperatures Nd2O3 exhibits the common complex
polymorphism of the light rare earth oxides. The phase transi-
tion to a H-type hexagonal structure (space group P63/mmc) is
observed at T¼ 2375K (Refs. 10,11 and 91) andT¼ 2333K.13
This phase subsequently transforms to a cubic structure (space
group Im3m) at T¼ 2473 K.10,11,91 These measurements must
all be converted to ITS-90. The measurements of Foex and
Traverse10 must be corrected by +14 K, following the proce-
dure outlined byCoutures and Rand.15 Lopato et al.,11Wehner
et al.,12 and Shevthenko and Lopato13 reported no (detailed)
information on the calibration of their measurements, but
assuming the data refer to IPTS-68, a correction of �1 K
needs to be applied. We select Ttrs ¼ (2379 � 30) K for the
A → H transformation, Ttrs ¼ (2477 � 30) K for the H → X
transformation.
The measurements of the melting temperature of Nd2O3
have been summarized in Table 10, which is based on the
IUPAC review by Coutures and Rand.15 The selected melting
point is (2577 � 15) K.
0 500 1000 1500 2000
T/K
75
100
125
Ho (
T)-
Ho (
298.
15 K
)
(T -
298
.15)
FIG. 6. The reduced enthalpy increment (in J K�1 mol�1) of Nd2O3; ○,Blomeke and Ziegler29; &, King et al.27; �, value derived from the low-
temperature measurements by Justice andWestrum, Jr.;28 the curve shows the
3.7.2. Heat capacity and entropy
The low-temperature heat capacity of A-type Nd2O3 has
been measured by Goldstein et al.26 from 16 to 300 K, and by
Justice and Westrum Jr.28 from 5 to 350 K. Above 100 K both
data sets agree within 0.5%, below 100 K the deviations
significantly increase. The recommended standard entropy of
Nd2O3 is derived from the low-temperature heat capacity data
of Justice and Westrum Jr.28 who obtained S°(298.15 K)� S°(5 K)¼ 146.65 J K�1 mol�1. Justice andWestrum estimated S
°(5 K)� S°(0 K)¼ 11.80 J K�1 mol�1, accounting for the 2R
J. Phys. Chem. Ref. Data, Vol. 43, No. 1, 2014rticle is copyrighted as indicated in the article. Reuse of AIP content is sub
78.131.95.159 On: Sun,
ln (2) contribution of the ground state doublet of the 4I9/2multiplet, resulting in
S�ð298:15 KÞ ¼ ð158:7� 1:0Þ J K�1 mol�1:
The high-temperature enthalpy increment has been mea-
sured by Blomeke and Ziegler29 from 384 to 1172 K and
Pankratz et al.90 from 400 to 1795 K. The data of the two
studies are in excellent agreement and smoothly join the low-
temperature data (Fig. 6). Pankratz et al.90 observed a minor
thermal anomaly near 1395K.We think this is an experimental
artefact, as high temperature X-ray diffraction studies10,96 do
not reveal any evidence for such a transformation. Our recom-
mended heat capacity equation is based on a polynomial
fit of the results of both studies. The equation is constrained
to C�p ¼ 111.34 J K�1 mol�1 from the low-temperature mea-
surements.28 We thus obtain
C�p=ðJ K�1 mol�1Þ ¼ 117:1079þ 28:13655 10�3ðT=KÞ
� 1:25845 106ðT=KÞ�2:
This equation is extrapolated to the transition temperature. No
heat-capacity or enthalpy measurements have been reported
for the H, X, and liquid phases of Nd2O3. The properties of
thesemodifications have been estimated in a similar way as for
La2O3 and La2O3. We thus obtain for the transition enthalpies
recommended equation.
ject to the terms at: http://scitation.aip.org/termsconditions. Downloaded to IP:
27 Apr 2014 17:09:58

THERMODYNAMIC PROPERTIES OF LANTHANIDE AND ACTINIDE OXIDE COMPOUNDS 013101-17
This a
DtrsH�ðA ! HÞ ¼ ð29� 8Þ kJmol�1;
DtrsH�ðH ! XÞ ¼ ð20� 5Þ kJmol�1;
DfusH� ¼ ð88� 10Þ kJmol�1:
For the heat capacity of the high temperature modifications
of Nd2O3 we estimate
C�pðH;TÞ ¼ C�
pðX;TÞ ¼ 145 JK�1 mol�1;
C�pðliq;TÞ ¼ 160 JK�1 mol�1:
3.7.3. Enthalpy of formation
The enthalpy of formation of hexagonal Nd2O3 has been
assessed by Cordfunke and Konings34 recently, and we accept
the selected value from that work, because no new information
has been published since
DfH�ðNd2O3; cr; 298:15 KÞ ¼ �ð1806:9 � 3:0Þ kJmol�1:
This value has been derived from the studies listed in Table 11
(corrected for someerrors), that havebeen employing solution as
well as combustion calorimetry. The three combustion calori-
metricmeasurements40,98,99 are in reasonable agreement, but the
value byHuber Jr. andHolley Jr.,98ΔfH°(298.15K)¼�(1808.1
� 1.0) kJmol�1,was considered tobe farmore accurate since the
starting materials were of rather high purity and the combustion
was complete. The solution calorimetric studies heavily rely on
thevalue for theenthalpyof solutionofNdmetal used in theHess
cycle to derive the enthalpy of formation of Nd2O3. Cordfunke
and Konings34 therefore used the enthalpy of solution of Nd(cr)
in HCl(aq) by Merli et al.,39 Tiflova,106 and Stuve,105 which are
consistent with each other and measured on high-purity Nd(cr)
samples, to recalculate the reportedmeasurements in a systema-
ticmanner. The selected enthalpy of formation is themeanof the
results of Huber Jr. and Holley Jr.98 and the values derived from
the results of Fitzgibbon et al.100 and Popova and
Monaenkova.103
TABLE 11. The enthalpy of formation of Nd2O3(cr) at 298.15 K;DH�1 andDH
�2 are th
Cordfunke and Konings34)
Authors Methoda D
Muthmann and Weis40 C
Matignon97 S (0.5)
Huber, Jr. and Holley, Jr.98 C
Spedding et al.99 C
Fitzgibbon et al.100 S (2.0) [�S (4.0) [�
Yashvili and Gvelesiani101 S (1.0) [�Morss et al.102 S (6.0) [�Popova and Monaenkova103 S (2.19) �
[�[�
Hennig and Oppermann104 S (4.0) [�Selected value:
aC: combustion calorimetry; S: solution calorimetry; values in parentheses give tbEstimated from the data of Merli et al.39
cStuve105
dMerli et al.39
eTiflova.106
rticle is copyrighted as indicated in the article. Reuse of AIP content is sub
78.131.95.159 On: Sun,
3.8. Pm2O3(cr,l)
3.8.1. Polymorphism and melting point
Themonoclinic B-type (space groupC2/m) and the cubic C-
type (space group Fm3m) rare earth sesquioxides structure of
Pm2O3 have been found at room temperature, like is the case
for its neighboring sesquioxides. According to the generally
accepted stability diagram of the lanthanide sesquioxides, the
C-type structure is probably the thermodynamic stable mod-
ification at room temperature. Chikalla et al.107 found that the
B-type form is stable above about T ¼ 1073 K, which is in
reasonable agreement with the trend in the lanthanide sesqui-
oxides as shown in Fig. 4, but claimed that this transition
is irreversible. They determined the transition temperatures
and the melting point, which we select here after a correction
of�1 K, assuming the data refer to IPTS-68: T¼ (2013� 20)
K for the B → A transformation, T ¼ (2407 � 20) K for the
A→H transformation, and T¼ (2497� 20) K for the H→X
transformation.
The melting point of Pm2O3 was measured by Gibby
et al.108 as T ¼ (2408 � 30) K, and by Chikalla et al.107 as
T ¼ (2593 � 30) K. The former value is significantly lower
than those of the neighboring Nd2O3 and Sm2O3, and must be
in error. We therefore select the value of Chikalla et al.107
which becomes T ¼ (2592 � 30) K on ITS-90.
3.8.2. Heat capacity and entropy
Konings109 estimated the standard entropy of Pm2O3 from a
systematic analysis of the trend in the lanthanide sesquioxides,
describing the entropy as the sum of the lattice and excess
components. The lattice component was obtained by inter-
polation of the values for La2O3, Gd2O3, andLu2O3, the excess
component from the ground state degeneracy of the 2F7/2multiplet. This value is selected here
S�ð298:15 KÞ ¼ ð158:0� 5:0Þ J K�1 mol�1:
e enthalpies of solution of Nd(cr) and Nd2O3(cr) in HCl(aq), respectively (after
H�1/kJ mol�1 DH�
2/kJ mol�1 ΔfH°/kJ mol�1
�1820
�441.4
�1808.1 � 1.0
�1798.2
�1789.2
691.7 � 1.5]b �434.0 � 0.6 �1807.1 � 3.1
693.6 � 1.5]c �438.3 � 1.3 �1807.3 � 2.2
689.6 � 2.0]d �434.7 � 2.1 �1799.6 � 4.5
695.7 � 1.8]c �419.6 � 6.0 �1831.7 � 7.0
686.8 � 1.0 �434.2 � 0.7 �1797.1 � 2.1
690.8 � 1.6]e �1805.1 � 3.3
691.9 � 2.0]d �1807.3 � 4.1
691.7 � 1.5]b �419.5 � 0.4 �1816.1 � 1.9
�1806.9 � 3.0
he concentration of the solvent in mol dm�3;
J. Phys. Chem. Ref. Data, Vol. 43, No. 1, 2014ject to the terms at: http://scitation.aip.org/termsconditions. Downloaded to IP:
27 Apr 2014 17:09:58

TABLE 12. Temperature of melting of samarium sesquioxide (after Coutures
and Rand15)
Tfus/K
Authors Reported ITS-90
Wisnyi and Pijanowski111 2573 � 50 2590 � 50
Curtis and Johnson112 2623 � 50 2626 � 50
Foex19 2593 2607
Mordovin et al.20 2536 � 30 2539 � 30
Noguchi and Mizuno21 2506 � 20 2509 � 20
Gibby et al.92 2623 � 25 2622 � 25
Treswjatskii et al.22 2613 � 20 2612 � 20
Coutures et al.23 2598 � 10 2598 � 10
Mizuno et al.24 2583 2570
Shevthenko and Lopato13 2583 2582
Selected value: 2613 � 15
013101-18 KONINGS ET AL.
This a
The high temperature heat capacity equations for C-Pm2O3
(298–1073 K) and B-Pm2O3 (1073–2013 K) have been esti-
mated from the values for the other lanthanide sesquioxides as
C�pðC;TÞ=ðJ K�1 mol�1Þ¼ 122:9493þ 30:0141 10�3ðT=KÞ� 1:85217 106ðT=KÞ�2
C�pðB;TÞ=ðJ K�1 mol�1Þ¼ 129:454þ 19:960 10�3ðT=KÞ:
For the heat capacity high temperature modifications we have
assumed the same values as estimated for Sm2O3 (see below)
C�pðH;TÞ ¼ C�
pðX;TÞ ¼ 165 JK�1 mol�1;
C�pðliq;TÞ ¼ 179 J � K�1 mol�1:
The transition enthalpies have been estimated as outlined for
Ce2O3:
DtrsH�ðC ! BÞ ¼ ð7� 3Þ kJmol�1;
DtrsH�ðB ! AÞ ¼ ð6� 3Þ kJmol�1;
DtrsH�ðA ! HÞ ¼ ð31� 8Þ kJmol�1;
DtrsH�ðH ! XÞ ¼ ð20� 5Þ kJmol�1;
DfusH� ¼ ð88� 10Þ mol�1:
3.8.3. Enthalpy of formation
Experimental values for the standard molar enthalpy of
formation of promethium sesquioxide are not available in
the literature. The selected ΔfH°(298.15 K) value has been
estimated by Cordfunke and Konings34 using the dependence
of ΔfH°(Ln2O3, cr) � 2ΔfH°(Ln3+, aq) on the atomic radii
of the trivalent lanthanides and the enthalpy of formation of
Pm3+(aq). Pm2O3(cr) is a boundary compound of the domains
of existence of the hexagonal and monoclinic rare earth
sesquioxides, both crystal structures are acceptable for pro-
methium sesquioxide with equal degree of probability.110
Assuming the hexagonal crystal structure of Pm2O3(cr) to be
the stable form, the enthalpy of formation was calculated as
DfH�ðPm2O3; crÞ ¼ �ð1811 � 21Þ kJmol�1:
3.9. Sm2O3(cr,l)
3.9.1. Polymorphism and melting point
The monoclinic B-type (space group C2/m) as well as the
cubic C-type (space group Fm3m) structures of samarium
sesquioxide have been reported to be stable at room tempera-
ture. According to the generally accepted stability diagram of
the lanthanide sesquioxides (see Fig. 4), the C-type structure is
probably the thermodynamic stable modification from room
temperature to about 900 K. However, the energetics of the
two modifications are probably very close and the transforma-
tion kinetics very sluggish. Since most of the thermodynamic
measurements have been made for the B modification, our
recommended values refer to this phase only.
J. Phys. Chem. Ref. Data, Vol. 43, No. 1, 2014rticle is copyrighted as indicated in the article. Reuse of AIP content is sub
78.131.95.159 On: Sun,
Foex and Traverse10 reported that B-type Sm2O3 transforms
to theA-type Ln2O3 structure at2173K.They also found that
the A → H and H → X transformation occurs at 2373 and
2473–2523K, respectively. These valuesmust be converted to
ITS-90 using the procedure outlined by Coutures and Rand,15
leading to a correction of +14 K. Lopato et al.11 reported
the B→ A transformation at T ¼ 2193 K and the A→ H and
H → X transformations at T ¼ 2403 K and T ¼ 2553 K,
respectively. Shevthenko and Lopato13 reported the B → A
transformation at T¼ 2143 K, the A→ H at T¼ 2343 K, and
the H→ X transformations at T¼ 2498 K. No information on
the calibration of these measurements has been found, but
assuming the data refer to IPTS-68, a correction of�1K needs
to be applied to convert to ITS-90. We select Ttrs ¼ (2190
� 20) K for the B → A transformation, Ttrs ¼ (2395 � 20) K
for the A→H transformation and Ttrs¼ (2533� 30) K for the
H → X transformation.
The measurements of the melting temperature of Sm2O3
have been summarized in Table 12, which is based on the
IUPAC review by Coutures and Rand.15 The selected melting
point is (2613 � 15) K.
3.9.2. Heat capacity and entropy
The low-temperature heat capacity of B-type Sm2O3 has
beenmeasured by Justice andWestrum Jr.113 from10 to 350K.
They obtained S°(298.15 K) � S°(10 K) ¼ 138.99 J K�1
mol�1. Extrapolation of these results to T¼ 0 K, and account-
ing for the 2Rln (2) contribution of the ground state doublet of
the split 6H7/2 multiplet, gives for the entropy at T¼ 298.15 K:
S�ð298:15 KÞ ¼ ð150:6� 0:3Þ J K�1 mol�1:
The high-temperature enthalpy increment of Sm2O3 has
been measured by Curtis and Johnson,112 Pankratz et al.,114
and Gvelesiani et al.115. The latter two groupsmeasured the B-
type hexagonal and the C-type cubic modifications, the results
being in good agreement (Fig. 7). Curtis and Johnson112
reported data on a sample consisting of a mixture of B and
C, their results being in poor agreement with the other results.
Pankratz et al.114 reported a transition (at about 1195 K) with a
small enthalpy effect (1.045 kJ mol�1) for B-type Sm2O3 that
was not observed byGvelesiani et al.115.AlsoDTAanalysis by
Curtis and Johnson112 did not reveal phase transformations up
ject to the terms at: http://scitation.aip.org/termsconditions. Downloaded to IP:
27 Apr 2014 17:09:58

0 500 1000 1500 2000
T/K
75
100
125
150
Ho (
T)-
Ho (
298.
15 K
)
(T -
298
.15)
FIG. 7. The reduced enthalpy increment (in J K�1 mol�1) of B-Sm2O3; ○,Gvelesiani et al.115;&, Pankratz et al.114;~, Curtis and Johnson112; �, valuederived from the low-temperature measurements by Justice and Westrum
Jr.113; the curve shows the recommended equation.
THERMODYNAMIC PROPERTIES OF LANTHANIDE AND ACTINIDE OXIDE COMPOUNDS 013101-19
This a
to 1403 K. Since there is no additional confirmation of this
effect, we have neglected it in our analysis. Our recommended
heat capacity equation for B-Sm2O3 is based on the combined
results of Pankratz et al.114 and Gvelesiani et al.115:
C�p=ðJ K�1 mol�1Þ ¼ 129:7953þ 19:03114 10�3ðT=KÞ
� 1:86227 106ðT=KÞ�2:
This equation is constrained to C�p(298.15 K)¼ 114.52 J K�1
mol�1, as derived from the low-temperature measurements
Justice and Westrum Jr.113 For C-Sm2O3 we obtain (without
constraint)
C�p=ðJ � K�1 mol�1Þ ¼ 132:4358þ 18:7799 10�3ðT=KÞ
� 2:40860 106ðT=KÞ�2:
The entropy change of the C → B transformation in the
lanthanide sesquioxides was estimated from high pressure
studies by Hoekstra116 as 6.3 J K�1 mol�1 using the Clau-
sius-Clapeyron equation, which is selected here. This quantity
can also be estimated from the differences of the enthalpy
equations at the transition temperature (�0.3 kJ mol�1 at
900 K), plus the difference in the enthalpies of formation at
298.15 K (3.8 � 6.2 kJ mol�1), giving ΔtrsH° ¼ (3.5 � 6.2)
kJ mol�1 corresponding to ΔtrsS° ¼ 3.9 J K�1 mol�1, in fair
agreement with Hoekstra’s estimate.116
TABLE 13. The enthalpy of formation of Sm2O3(cr) at 298.15
and Sm2O3(cr) in HCl(aq), respectively (after Cordfunke a
Authors Methoda DH�1/kJ m
Huber Jr. et al.117 C
Montgomery and
Hubert36S (0.48)
Spedding et al.99 C
Gvelesiani and
Yashvili38S (0.7) �683.7 �
S (1.0) �682.6 �Baker et al.118 C
S (2.0) �690.1 �S (3.99) �689.5 �
Hennig and
Oppermann119S (4.0)
Selected value:
aC: combustion calorimetry; S: solution calorimetry; values
mol dm�3
bUsing DH�1 from Baker et al.118
rticle is copyrighted as indicated in the article. Reuse of AIP content is sub
78.131.95.159 On: Sun,
No heat-capacity or enthalpy measurements have been
reported for the H, X, and liquid phases of Sm2O3. The
properties of these modifications have been estimated in a
similar way as for La2O3 and Ce2O3. We thus obtain for the
transition enthalpies
DtrsH�ðC ! BÞ ¼ ð6� 3Þ kJmol�1
DtrsH�ðB ! AÞ ¼ ð7� 3Þ kJmol�1
DtrsH�ðA ! HÞ ¼ ð32� 8Þ kJmol�1
DtrsH�ðH ! XÞ ¼ ð20� 5Þ kJmol�1
DfusH� ¼ ð89� 10Þ kJmol�1
For the heat capacity of the high temperature modifications of
Sm2O3 we estimate
C�pðA;TÞ ¼ 140 JK�1 mol�1
C�pðH;TÞ ¼ C�
pðX;TÞ ¼ 165 JK�1 mol�1
C�pðliq;TÞ ¼ 179 J K�1 mol�1:
3.9.3. Enthalpy of formation
The enthalpy of formation of monoclinic and cubic Sm2O3
have been assessed by Cordfunke and Konings34 recently, and
we accept the selected value from that work, since no new
information has been published since
DfH�ðSm2O3;monoclinic; 298:15KÞ¼�ð1823:0� 4:0Þ kJmol�1
DfH�ðSm2O3; cubic; 298:15 KÞ ¼ �ð1826:8 � 4:8Þ kJmol�1:
The values for the enthalpy of formation of monoclinic
Sm2O3 obtained by Huber Jr. et al.117 and Baker et al.118 by
oxygen-bomb combustion calorimetry and by Baker et al.118
using solution calorimetry are in reasonable agreement (see
Table 13), and are the basis for the selected value. Later results
by Gvelesiani and Yashvili38 significantly deviate from this
value, but the nonmetallic impurities in their samples are not
reported, which could be an explanation for the difference. The
measurements byHennig andOppermann119 of the enthalpy of
solution of Sm2O3 in HCl(aq) is in good agreement with the
K;DH�1 andDH
�2 are the enthalpies of solution of Sm(cr)
nd Konings34)
ol�1 DH�2/kJ mol�1 ΔfH°/kJ mol�1
�1815.4 � 2.0
�408.8 � 1.4
�1777.3
5.4 �389.5 � 0.4 �1835.4 � 10.8
2.2 �391.2 � 3.6 �1831.5 � 5.7
�1824.2 � 2.6
1.3 �417.1 � 1.2 �1820.8 � 2.9
3.8 �406.7 � 4.6 �1830.7 � 8.9
�412.8 � 0.5 �1824.6 � 7.6b
�1823.0 � 4.0
in parentheses give the concentration of the solvent in
J. Phys. Chem. Ref. Data, Vol. 43, No. 1, 2014ject to the terms at: http://scitation.aip.org/termsconditions. Downloaded to IP:
27 Apr 2014 17:09:58

TABLE 14. Temperature of melting of europium sesquioxide (after Coutures
and Rand15)
Tfus/K
Authors Reported ITS-90
Wisnyi and Pijanowski111 2323 � 30 2339 � 30
Schneider125 2513 � 10 2519 � 10
Foex19 2603 2617
Mordovin et al.20 2276 � 30 2278 � 30
Noguchi and Mizuno21 2564 � 20 2567 � 20
Coutures et al.23 2633 � 10 2632 � 10
Mizuno et al.24 2618 � 20 2605 � 20
Selected value: 2622 � 20
013101-20 KONINGS ET AL.
This a
results by Baker et al.118 However, because of the poor
characterisation of the Sm2O3 sample and the fact that the
measurements by Hennig and Opperman deviate significantly
for most of the lanthanide sesquioxides (see La2O3, Nd2O3,
andEu2O3) this valuewas not taken into account byCordfunke
and Konings.34
The enthalpy of formation of cubic Sm2O3 was also derived
from thework of Baker et al.118 andGvelesiani andYashvili,38
who both determined the value for ΔtrsH°(monoclinic/cubic)
by solution calorimetric measurements of the two crystal-
lographic modifications. As discussed by Cordfunke and
Konings34 the results are in reasonable agreement, �(3.7 �2.6) kJ mol�1 and ¼ �(5.5 � 4.0) kJ mol�1, respectively, but
the value of Baker et al.118 is preferred for reasons given in the
preceding paragraph.
3.10. Eu2O3(cr,l)
3.10.1. Polymorphism and melting point
Europium sesquioxide has a complex polymorphism: both
the monoclinic (B-structure) and the cubic (C-structure) are
found to coexist at room temperature. At standard pressure
conditions the C form is the most stable form, the B form thus
beingmetastable. The C-Eu2O3 phase has a fluorite-type cubic
structure (space group Fm3m). The B-Eu2O3 form is the
monoclinic modification of europium sesquioxide (space
group C2/m).The C → B transformation has been studied extensively.
Stecura120 reported that this transition is irreversible, but most
other studies have found that the transformation kinetics are
sluggish but reversible. The temperature was found at 1348 K
(Ref. 121) and 1373 K.89 Ainscough et al.122 observed sig-
nificant differences in the transformation temperature and rate
for air and hydrogen atmospheres, the transformation taking
place faster and at lower temperature (75 K) in air. This was
confirmed by Suzuki et al.123 for air and vacuum. More
recently Sukhushina et al.124 measured the oxygen potential
of stoichiometric B-Eu2O3 and C–Eu2O3 between 1150 and
1450 K. From the results they derive Ttrs¼ 1350.6 K from the
intersection of the curves. The phase transformations at high
temperatures have been studied by Foex and Traverse.10 They
reported the B→A transformation at T¼ 2313 K, the A→H
transformation at T¼ 2413K, and theH→X transformation at
T¼ 2543 K. These results must be converted to ITS-90 by +14K, following the procedure outlined by Coutures and Rand.15
We select Ttrs ¼ (1350 � 15) K for the C → B transfor-
mation, Ttrs ¼ (2327 � 30) K for the B → A transforma-
tion, Ttrs ¼ (2427 � 30) K for the A→ H transformation, and
Ttrs ¼ (2557 � 30) K for the H → X transformation.
Themeasurements of themelting temperatureofEu2O3have
been summarized in Table 14, which is based on the IUPAC
review by Coutures and Rand15; the results being corrected to
ITS-90. The selected melting point is (2622 � 20) K.
3.10.2. Heat capacity and entropy
The low-temperature heat capacity of C-Eu2O3 has been
measured by Lyutsareva et al.126 from 7 to 319 K and these
J. Phys. Chem. Ref. Data, Vol. 43, No. 1, 2014rticle is copyrighted as indicated in the article. Reuse of AIP content is sub
78.131.95.159 On: Sun,
authors alsomeasured the low-temperature heat capacity of B-
Eu2O3 from 8 to 311K. The heat capacity and standard entropy
values for B-Eu2O3 are consistent with the results for the other
A- and B-type Ln2O3 compounds considering the lattice and
excess electronic components.127 For that reason we recom-
mend the entropy value for B-Eu2O3 from this work, with an
increased uncertainty:
S�ð298:15 KÞ ¼ ð143:5� 0:5Þ J K�1 mol�1:
The heat capacity and entropy values for C-Eu2O3, on the
other hand, only poorly agree with the results for the C-type
Ln2O3 compounds, giving a too high lattice component above
200 K after subtraction of the excess heat capacity using
crystal field data for Eu3+ in a cubic (C) environment. A
similar observation was made for Pr2O3 measured by the same
authors (see above). We therefore reject the standard entropy
S°(298.15K)¼ (142.24� 0.14) JK�1 mol�1 derived from that
work, and estimate for C-Eu2O3:
S�ð298:15 KÞ ¼ ð136:4� 2:0Þ J K�1 mol�1:
The high-temperature enthalpy increment of C-Eu2O3 has
been reported by Pankratz and King,128 and Tsagareishvili and
Gvelesiani.129 The two data sets are in reasonable agreement.
These results also show a slight misfit with the low-tempera-
ture data (see Fig. 8), confirming these are probably too high.
The combined results have been fitted to the polynomial
equation, to yield for the heat capacity
C�p=ðJ K�1 mol�1Þ ¼ 136:2978þ 14:9877 10�3ðT=KÞ
� 1:4993 106ðT=KÞ�2:
This equation is constrained to C�p(298.15K)¼ 123.9 J K�1
mol�1 as estimated by us, and not to C�p(298.15 K) ¼
127.09 J K�1 mol�1 as derived from the low-temperature heat
capacity measurements.
The high-temperature enthalpy increment of B-Eu2O3 has
also been determined by Curtis and Tharp,130 Pankratz and
King,128 andGvelesiani et al.115; the latter article also includes
some numerical results from previously reported measure-
ments by Tsagareishvili and Gvelesiani.129 The results of
Pankratz and King128 and Gvelesiani et al.115 are in poorer
agreement, the former being up to 2.5% lower, in contrast to
the results for C-Eu2O3. An unexplained transition at 900 K
ject to the terms at: http://scitation.aip.org/termsconditions. Downloaded to IP:
27 Apr 2014 17:09:58

0 500 1000 1500 2000
T/K
80
100
120
140
160H
o (T
)-H
o (29
8.15
K)
(T -
298
.15)
0 500 1000 1500 2000
T/K
80
100
120
140
160
Ho (
T)-
Ho (
298.
15 K
)
(T -
298
.15)
FIG. 8. The reduced enthalpy increment (in J K�1 mol�1) of B-Eu2O3 (top) andC-Eu2O3 (bottom); ○, Gvelesiani et al.115;&, Pankratz and King128;~;130 �,value derived from the low-temperaturemeasurements byLyutsareva et al.126;
the curves show the recommended equations.
THERMODYNAMIC PROPERTIES OF LANTHANIDE AND ACTINIDE OXIDE COMPOUNDS 013101-21
This a
was observed by Pankratz and King128 which was not present
in the results of Gvelesiani et al.,115 nor found in high
temperature dilatometry studies.130,131 The recommended
value is derived from the polynomial fit of the data by Pankratz
and King128 and Gvelesiani et al.,115 constrained to
C�p(298.15 K) ¼ 122.33 J K�1 mol�1,126 yielding for the heat
capacity:
C�p=ðJ K�1 mol�1Þ ¼ 133:3906þ 16:6443 10�3ðT=KÞ
� 1:42435 106ðT=KÞ�2:
The enthalpy of the C→ B transition can be approximated
from the differences of the enthalpy equations at the transi-
tion temperature (�1.2 kJ mol�1 at 1300 K), plus the
difference in the enthalpies of formation at 298.15 K
(þ12.1 kJ mol�1), yielding ΔtrsS° ¼ 8.1 J K�1 mol�1, in
TABLE 15.The enthalpyof formationofmonoclinicEu2O3(cr
of Eu(cr) and Eu2O3(cr) in HCl(aq), respectively
Authors Methoda DH�1
Huber Jr. et al.132 C
Yashvili and Gvelesiani101 S (1.0) �63
[�6
Fitzgibbon et al.133 C
S (4.0) �60
S (6.0) [�58
[�6
Hennig et al.134 S (4.0) [�58
selected value:
aC: combustion calorimetry; S: solution calorimetry; values
mol dm�3;bEstimated by Cordfunke and Konings34 from studies for var
(aq) by Merli et al.39;cStuve135
dUsing DH�1 from Fitzgibbon et al.133
rticle is copyrighted as indicated in the article. Reuse of AIP content is sub
78.131.95.159 On: Sun,
fair agreement with Hoekstra´s estimate, ΔtrsS° ¼ 6.3 J K�1
mol�1 from high pressure studies.116 We select the latter
value, giving
DtrsH�ðC ! BÞ ¼ ð9� 3Þ kJmol�1
Heat-capacity or enthalpy measurements have not been
reported for the H, X, and liquid phases of Eu2O3. Foex and
Traverse10 found that the thermal effects of the B → A
transformation are average compared to the other transfor-
mations. The properties of these modifications have been
estimated in a similar way as for Ce2O3. We thus obtain for
the transition enthalpies
DtrsH�ðB ! AÞ ¼ ð7� 2Þ kJmol�1;
DtrsH�ðA ! HÞ ¼ ð33� 8Þ kJmol�1;
DtrsH�ðH ! XÞ ¼ ð21� 5Þ kJmol�1;
DfusH� ¼ ð89� 10Þ kJmol�1:
For the heat capacity of the high temperaturemodifications of
Eu2O3 we estimate
C�pðA;TÞ ¼ 141 JK�1 mol�1
C�pðH;TÞ ¼ C�
pðX;TÞ ¼ 144 JK�1 mol�1
C�pðliq;TÞ ¼ 156 JK�1 mol�1
3.10.3. Enthalpy of formation
The enthalpy of formation of monoclinic as well as cubic
Eu2O3 has been assessed by Cordfunke and Konings34
recently, and we accept the selected values from that work,
since no new information has been published since
DfH�ðEu2O3;monoclinic; 298:15 KÞ¼ �ð1650:4 � 4:0Þ kJmol�1;
DfH�ðEu2O3; cubic; 298:15 KÞ ¼ �ð1662:5 � 6:0Þ kJ �mol�1:
The value for monoclinic europium sesquioxide is based
on an analysis of combustion as well as solution calorimetry
studies, as shown in Table 15. The selected value is the mean
of the results by Holley and coworkers.132,133 Their results
) at 298.15K;DH�1 andDH
�2 are the enthalpies of solution
/kJ mol�1 DH�2/kJ mol�1 ΔfH°/kJ mol�1
�1648.1 � 3.8
2.6 � 3.8 �397.5 � 3.8 �1725.5 � 8.5
07 � 4]b �1674.0 � 8.9
�1651.0 � 3.8
5.2 � 2.9 �416.8 � 1.5 �1652.0 � 6.0
9.9 � 2.9]c �415.2 � 2.7 �1624.5 � 6.4
03 � 4]b �1650.7 � 8.0
3.0 � 2.5]c �338.3 � 0.3 �1686.2 � 5.0
�1730.6 � 5.8d
�1650.4 � 4.0
in parentheses give the concentration of the solvent in
ious lanthanidemetals at 1.0, 3.0 and 6.0mol dm�3 HCl
J. Phys. Chem. Ref. Data, Vol. 43, No. 1, 2014ject to the terms at: http://scitation.aip.org/termsconditions. Downloaded to IP:
27 Apr 2014 17:09:58
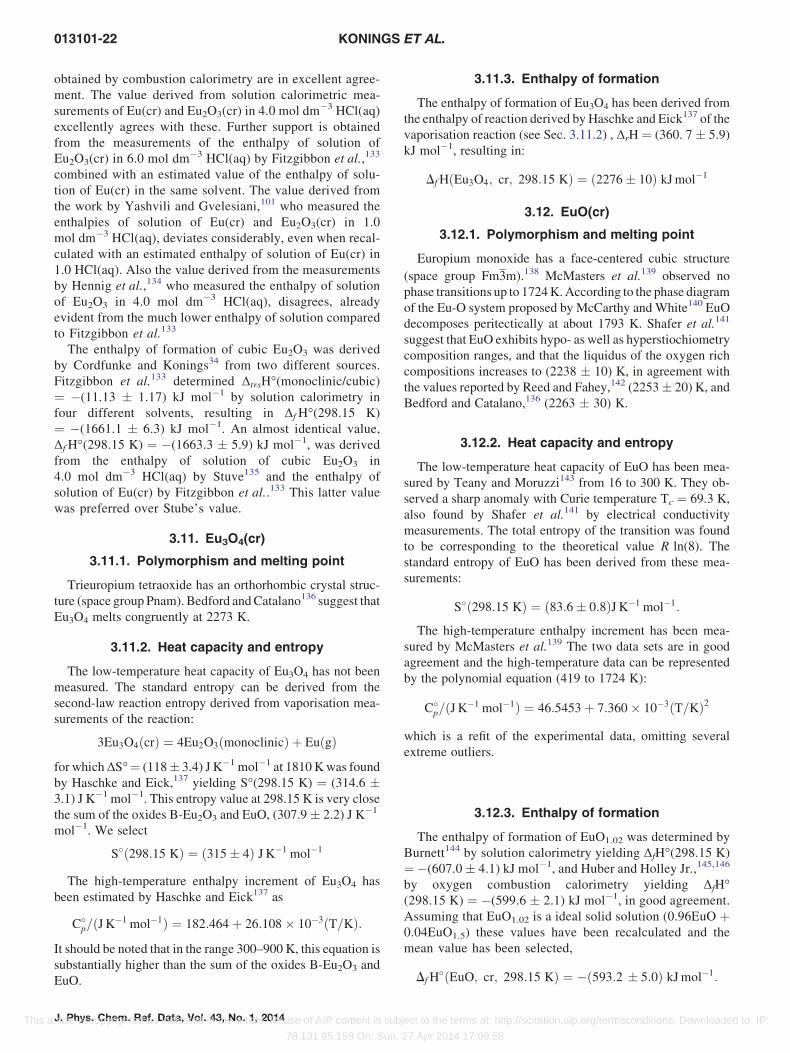
013101-22 KONINGS ET AL.
This a
obtained by combustion calorimetry are in excellent agree-
ment. The value derived from solution calorimetric mea-
surements of Eu(cr) and Eu2O3(cr) in 4.0 mol dm�3 HCl(aq)
excellently agrees with these. Further support is obtained
from the measurements of the enthalpy of solution of
Eu2O3(cr) in 6.0 mol dm�3 HCl(aq) by Fitzgibbon et al.,133
combined with an estimated value of the enthalpy of solu-
tion of Eu(cr) in the same solvent. The value derived from
the work by Yashvili and Gvelesiani,101 who measured the
enthalpies of solution of Eu(cr) and Eu2O3(cr) in 1.0
mol dm�3 HCl(aq), deviates considerably, even when recal-
culated with an estimated enthalpy of solution of Eu(cr) in
1.0 HCl(aq). Also the value derived from the measurements
by Hennig et al.,134 who measured the enthalpy of solution
of Eu2O3 in 4.0 mol dm�3 HCl(aq), disagrees, already
evident from the much lower enthalpy of solution compared
to Fitzgibbon et al.133
The enthalpy of formation of cubic Eu2O3 was derived
by Cordfunke and Konings34 from two different sources.
Fitzgibbon et al.133 determined ΔtrsH°(monoclinic/cubic)
¼ �(11.13 � 1.17) kJ mol�1 by solution calorimetry in
four different solvents, resulting in ΔfH°(298.15 K)
¼ �(1661.1 � 6.3) kJ mol�1. An almost identical value,
ΔfH°(298.15 K) ¼ �(1663.3 � 5.9) kJ mol�1, was derived
from the enthalpy of solution of cubic Eu2O3 in
4.0 mol dm�3 HCl(aq) by Stuve135 and the enthalpy of
solution of Eu(cr) by Fitzgibbon et al..133 This latter value
was preferred over Stube’s value.
3.11. Eu3O4(cr)
3.11.1. Polymorphism and melting point
Trieuropium tetraoxide has an orthorhombic crystal struc-
ture (space group Pnam). Bedford andCatalano136 suggest that
Eu3O4 melts congruently at 2273 K.
3.11.2. Heat capacity and entropy
The low-temperature heat capacity of Eu3O4 has not been
measured. The standard entropy can be derived from the
second-law reaction entropy derived from vaporisation mea-
surements of the reaction:
3Eu3O4ðcrÞ ¼ 4Eu2O3ðmonoclinicÞ þ EuðgÞfor whichΔS°¼ (118� 3.4) J K�1 mol�1 at 1810Kwas found
by Haschke and Eick,137 yielding S°(298.15 K) ¼ (314.6 �3.1) J K�1 mol�1. This entropy value at 298.15 K is very close
the sum of the oxides B-Eu2O3 and EuO, (307.9� 2.2) J K�1
mol�1. We select
S�ð298:15 KÞ ¼ ð315� 4Þ J K�1 mol�1
The high-temperature enthalpy increment of Eu3O4 has
been estimated by Haschke and Eick137 as
C�p=ðJ K�1 mol�1Þ ¼ 182:464þ 26:108 10�3ðT=KÞ:
It should be noted that in the range 300–900 K, this equation is
substantially higher than the sum of the oxides B-Eu2O3 and
EuO.
J. Phys. Chem. Ref. Data, Vol. 43, No. 1, 2014rticle is copyrighted as indicated in the article. Reuse of AIP content is sub
78.131.95.159 On: Sun,
3.11.3. Enthalpy of formation
The enthalpy of formation of Eu3O4 has been derived from
the enthalpy of reaction derived by Haschke and Eick137 of the
vaporisation reaction (see Sec. 3.11.2) , ΔrH ¼ (360. 7 � 5.9)
kJ mol�1, resulting in:
DfHðEu3O4; cr; 298:15 KÞ ¼ ð2276� 10Þ kJmol�1
3.12. EuO(cr)
3.12.1. Polymorphism and melting point
Europium monoxide has a face-centered cubic structure
(space group Fm3m).138 McMasters et al.139 observed no
phase transitions up to 1724K.According to the phase diagram
of the Eu-O system proposed by McCarthy and White140 EuO
decomposes peritectically at about 1793 K. Shafer et al.141
suggest that EuO exhibits hypo- as well as hyperstiochiometry
composition ranges, and that the liquidus of the oxygen rich
compositions increases to (2238 � 10) K, in agreement with
the values reported by Reed and Fahey,142 (2253� 20) K, and
Bedford and Catalano,136 (2263 � 30) K.
3.12.2. Heat capacity and entropy
The low-temperature heat capacity of EuO has been mea-
sured by Teany and Moruzzi143 from 16 to 300 K. They ob-
served a sharp anomaly with Curie temperature Tc ¼ 69.3 K,
also found by Shafer et al.141 by electrical conductivity
measurements. The total entropy of the transition was found
to be corresponding to the theoretical value R ln(8). The
standard entropy of EuO has been derived from these mea-
surements:
S�ð298:15 KÞ ¼ ð83:6� 0:8ÞJ K�1 mol�1:
The high-temperature enthalpy increment has been mea-
sured by McMasters et al.139 The two data sets are in good
agreement and the high-temperature data can be represented
by the polynomial equation (419 to 1724 K):
C�p=ðJ K�1 mol�1Þ ¼ 46:5453þ 7:360 10�3ðT=KÞ2
which is a refit of the experimental data, omitting several
extreme outliers.
3.12.3. Enthalpy of formation
The enthalpy of formation of EuO1.02 was determined by
Burnett144 by solution calorimetry yielding ΔfH°(298.15 K)
¼�(607.0 � 4.1) kJ mol�1, and Huber and Holley Jr.,145,146
by oxygen combustion calorimetry yielding ΔfH°(298.15 K) ¼ �(599.6 � 2.1) kJ mol�1, in good agreement.
Assuming that EuO1.02 is a ideal solid solution (0.96EuO þ0.04EuO1.5) these values have been recalculated and the
mean value has been selected,
DfH�ðEuO; cr; 298:15 KÞ ¼ �ð593:2 � 5:0Þ kJmol�1:
ject to the terms at: http://scitation.aip.org/termsconditions. Downloaded to IP:
27 Apr 2014 17:09:58

150
5 K
)
THERMODYNAMIC PROPERTIES OF LANTHANIDE AND ACTINIDE OXIDE COMPOUNDS 013101-23
This a
3.13. Gd2O3(cr,l)
3.13.1. Polymorphism and melting point
At room temperature, gadolinium sesquioxide has the rare
earth cubic C-type structure (space group Ia3), though the
monoclinic B-type structure can also be maintained to room
temperature. The C→B transformation, which is sluggish but
reversible, was found at 1298 K by Shafer and Roy,147 1523 K
by Roth and Schneider121 and 1473 K byWarshaw and Roy,89
the latter being selected here because of the careful analysis
made in that work. In view of the approximate nature, no
attempt has been made to correct these values to ITS-90.
Foex and Traverse10 determined the temperatures of the B
→A, A→H and H→X transformations by thermal analysis,
without giving numerical results. From the thermogram we
deduce the values 2403, 2423, and 2623 K. They also
determined the transformation of H-type Gd2O3 to the X-type
Ln2O3 structure at2623 K using XRD. These values must be
converted to ITS-90 using the procedure outlined by Coutures
and Rand,15 leading to a correction of +15 K. Lopato et al.11
reported that the transformations B→ A and A→ H occur in
the temperature range 2443-2473 K and that H → X trans-
formation occurs close to the melting point (2633–2653 K).
Barkhatov et al.148 reported the transformation temperature
for B → A and A → H as (2443 � 10) K and (2481 � 10) K
from drop calorimetric measurements and (2436 � 10) K and
(2470 � 15) K from electrical conductivity measurements,
respectively. No information on the calibration of these mea-
surements has been found, but assuming the data refer to IPTS-
68, a correction of�1 K needs to be applied to convert to ITS-
90. We select Ttrs¼ (2430� 30) K for the B→A transforma-
tion, Ttrs ¼ (2470 � 30) K for the A → H transformation and
Ttrs ¼ (2538 � 20) K for the H → X transformation. The
measurements of the melting temperature of Gd2O3 have been
summarized in Table 16, which is based on the IUPAC review
by Coutures and Rand.15 The selected melting point is (2693
� 15) K.
TABLE 16. Temperature of melting of gadolinium sesquioxide (after Coutures
and Rand15)
Tfus/K
Authors Reported ITS-90
Wisnyi and Pijanowski111 2603 � 20 2620 � 20
Curtis and Johnson112 2623 � 50 2626 � 50
Foex19 2668 2683
Mordovin et al.20 2597 � 30 2599 � 30
Noguchi and Mizuno21 2603 � 20 2606 � 20
Spiridonov et al.149 2573 2576
Treswjatskii et al.22 2653 � 20 2652 � 20
Coutures et al.23 2713 � 10 2712 � 10
Mizuno et al.24 2667 2655
Yoshimura et al.25 2666 2672 � 15
Mizuno et al.150 2686 � 25
Shevthenko and Lopato13 2683 2682
Salikhov and Kan95 2666 � 10
Kang et al.151 2701 � 20
Selected value: 2693 � 15
rticle is copyrighted as indicated in the article. Reuse of AIP content is sub
78.131.95.159 On: Sun,
3.13.2. Heat capacity and entropy
The low-temperature heat capacity of C-Gd2O3 has been
measured by Justice andWestrum Jr.113 from T¼ (7 to 346) K
and Stewart et al.152 fromT¼ (1.4 to 18) K, the results being in
acceptable agreement in the overlapping temperature range.
The results show a thermal anomaly, which is related to the
removal of the ground state degeneracy. Stewart et al.152
concluded from the relatively large crystal field splitting
needed to reproduce the peak and from EPR measurements
that the anomaly in the cubic form is not a Schottky-type
transition, as suggested by Miller et al.,153 but is related to a
magnetic ordering. The entropy of the transition is, however,
close to 2Rln (2J + 1)¼ 2Rln (8) expected for the contribution
of the ground state 8F7/2 multiplet. The results give for the
entropy of C-Gd2O3 at T ¼ 298.15 K:
S�ðGd2O3; cubic; 298:15 KÞ ¼ ð150:6� 0:2Þ J K�1 mol�1:
The low-temperature heat capacity of B-Gd2O3 was mea-
sured by Konings et al.127 from 5 to 400 K and by Rosenblum
et al.154 from 1.6 to 12.5 K. The latter authors found a lambda-
type transition with a maximum at T ¼ 3.80 K. The transition
entropy is almost identical to the theoretical value 2Rln (8) ¼4.16R. The absolute entropy at T ¼ 298.15 K is
S�ðGd2O3; monoclinic; 298:15 KÞ¼ ð157:1� 0:2Þ J K�1 mol�1:
The high-temperature enthalpy increment of C-Gd2O3 has
been determined by Curtis and Johnson,112 Pankratz and
King,128 and Tsagareishvili et al.155 The results are in good
agreement, as shown in Fig. 9. Our recommended heat capa-
city equation for C-Gd2O3 is based on the combined results of
0 500 1000 1500 2000
T/K
75
100
125
Ho (
T)-
Ho (
298.
1
(T -
298
.15)
0 500 1000 1500 2000
T/K
75
100
125
150
Ho (
T)-
Ho (
298.
15 K
)
(T -
298
.15)
FIG. 9. The reduced enthalpy increment (in J K�1 mol�1) of B-Gd2O3 (top)andC-Gd2O3 (bottom);○, Pankratz andKing128;&, Tsagareishvili et al.155;~Curtis and Johnson112; �, value derived from the low-temperature
measurements by Justice and Westrum Jr.113 for C-Gd2O3 and Konings
et al.127 for B-Gd2O3; the curves show the recommended equations.
J. Phys. Chem. Ref. Data, Vol. 43, No. 1, 2014ject to the terms at: http://scitation.aip.org/termsconditions. Downloaded to IP:
27 Apr 2014 17:09:58

TABLE 17. The enthalpy of formation of Gd2O3(cr) at 298.15 K; DH�1 and DH
�2
are the enthalpies of solution of Gd(cr) andGd2O3(cr) in HCl(aq), respectively
(after Cordfunke and Konings34)
Authors Methoda DH�1/kJ mol�1 DH�
2/kJ mol�1 ΔfH°/kJ mol�1
Huber Jr. and
Holley Jr.156C �1819.7 � 3.6
Spedding et al.99 C �1786.2
Yashvili and
Gvelesiani101S (6.0) �694.5 � 1.7 �422.6 � 1.3 �1826.3 � 3.7
[�694.9 � 1.0]b �1829.5 � 2.6
�1828.2 � 3.6c
Selected value: �1819.7 � 3.6
aC: combustion calorimetry; S: solution calorimetry; values in parentheses
give the concentration of the solvent in mol dm�3.bMerli et al.39
cCycle based on GdCl3.39
013101-24 KONINGS ET AL.
This a
the latter two studies, constrained to C�p ¼ 105.52 J K�1 mol�1
from the low-temperature measurements:113
C�p=ðJ K�1 mol�1Þ ¼ 114:8086þ 17:2911 10�3ðT=KÞ
� 1:28397 106ðT=KÞ�2:
The results of Pankratz and King128 and Tsagareishvili
et al.155 for B-Gd2O3 differ significantly at the lowest tem-
peratures. We have fitted the combined results into a poly-
nomial fit, constrained to C�p ¼ 105.1 J K�1 mol�1 from the
low-temperaturemeasurements113 to give for the heat capacity
of B-Gd2O3:
C�p=ðJ K�1 mol�1Þ ¼ 114:6104þ 15:2344 10�3ðT=KÞ
� 1:24917 106ðT=KÞ�2:
The entropy of the C → B transition was estimated from
high-pressure studies by Hoekstra116 as 6.3 J K�1 mol�1 using
the Clausius-Clapeyron equation. This value is confirmed by
the difference in the entropies of the B- and C-modifications of
Gd2O3 at 298.15 K (see above), 6.5 J K�1 mol�1. Unlike
Sm2O3 and Eu2O3 the transition enthalpy cannot be derived
from experimental enthalpy data, as the difference in the
enthalpies of formation at 298.15 K is not known. Barkhatov
et al.148 reported enthalpy increment measurements for Gd2O3
from which the enthalpies of the B → A and A → H
transformations were derived as (6.3 � 3.3) kJ mol�1 and
(34.7 � 3.3) kJ mol�1. Heat-capacity or enthalpy measure-
ments have not been reported for the X and liquid phases of
Gd2O3. The properties of these modifications have been
estimated in a similar way as for La2O3 and Ce2O3. We thus
obtain for the transition enthalpies
DtrsH�ðC ! BÞ ¼ ð9� 2Þ kJmol�1;
DtrsH�ðB ! AÞ ¼ ð6:3� 3:3Þ kJmol�1;
DtrsH�ðA ! HÞ ¼ ð34:7� 3:3Þ kJmol�1;
DtrsH�ðH ! XÞ ¼ ð20� 5Þ kJmol�1;
DfusH� ¼ ð92� 10Þ kJmol�1:
For the heat capacity of the high temperature A, H, and X
modifications and liquid Gd2O3 we estimate
C�pðA;TÞ ¼ 142 J K�1 mol�1;
C�pðH;TÞ ¼ C�
pðX;TÞ ¼ 130; J K�1 mol�1;
C�pðliq;TÞ ¼ 140; J K�1 mol�1;
3.13.3. Enthalpy of formation
The enthalpy of formation of monoclinic Gd2O3 has been
assessed by Cordfunke and Konings34 recently, and we accept
the selected values from that work, since no new information
has been published since
DfH�ðGd2O3; cr; 298:15 KÞ ¼ �ð1819:7 � 3:6Þ kJmol�1:
This value is solely based on the combustion calorimetric
study by Huber, Jr. and Holley, Jr.,156 who used 97.05 mass%
J. Phys. Chem. Ref. Data, Vol. 43, No. 1, 2014rticle is copyrighted as indicated in the article. Reuse of AIP content is sub
78.131.95.159 On: Sun,
pure gadolinium metal (Table 17). The combustion value by
Spedding et al.99 is much less accurate due to incomplete
combustion and lack of analytical characterization of the
sample of Gd(cr). The values derived from the solution
calorimetric study by Yashvili and Gvelesiani,101 who deter-
mined the enthalpies of solution ofGd(cr) andGd2O3(cr) in 6.0
mol dm�3 HCl(aq), are in reasonable agreement, but as dis-
cussed by Cordfunke and Konings,34 they are considered
significantly less accurate, especially in view of the difficulties
of the slow dissolution of Gd2O3(cr) in HCl(aq).
3.14. TbO2(cr)
3.14.1. Structure
TbO2 has a face-centered cubic structure (space group
Fm3m) at room temperature. The upper stability of this phase
has not been studied in detail. The phase diagram suggested by
Lowe and Eyring157 indicates that the TbO2�x is stable up to
about 1400 K.
3.14.2. Heat capacity and entropy
No measurements of the heat capacity of TbO2 have been
made. The standard entropy has been estimated as
S�ð298:15 KÞ ¼ ð86:9� 3:0Þ J K�1 mol�1
from the systematics in the lanthanide and actinide oxides. In a
similar manner the high temperature heat capacity was esti-
mated as
C�p=ðJ K�1 mol�1Þ ¼ 73:259þ 13:2023 10�3ðT=KÞ
� 1:0424 106ðT=KÞ�2:
3.14.3. Enthalpy of formation
The enthalpy of formation of TbO2 was determined by
Stubblefield et al.84 and Fitzgibbon and Holley Jr.158 using
solution calorimetry. Both research groups reported results for
samples with varying O/Tb ratios. After recalculation and
extrapolation to O/Tb¼ 2.0, as shown in Fig. 5, we obtain for
the selected enthalpy of formation:
DfH�ðTbO2; cr; 298:15 KÞ ¼ �ð972:2 � 5:0Þ kJmol�1:
ject to the terms at: http://scitation.aip.org/termsconditions. Downloaded to IP:
27 Apr 2014 17:09:58

TABLE 19. Temperature of melting of terbium sesquioxide (after Coutures and
Rand15)
TfusK
Authors Reported ITS-90
Foex19 2663 2678
Mordovin et al.20 2566 � 30 2569 � 30
Noguchi and Mizuno21 2577 � 20 2580 � 20
Treswjatskii et al.22 2643 � 20 2642 � 20
Coutures et al.23 2683 � 10 2682 � 10
Shevthenko and Lopato13 2673 2672
Selected value: 2682 � 15
TABLE 18. The enthalpy of formation of phases in the TbO2-TbO1.5 system
Composition ΔfH°(298.15 K) Authors
kJ mol�1
TbO1.510 �(933.4 � 3.6) Fitzgibbon and Holley, Jr.158
TbO1.709 �(952.3 � 3.4) Fitzgibbon and Holley, Jr.158
TbO1.710 �(953.1 � 3.9) Stubblefield et al.84
TbO1.800 �(966.1 � 3.3) Stubblefield et al.84
TbO1.817 �(961.9 � 3.5) Fitzgibbon and Holley, Jr.158
TbO1.975 �(970.5 � 2.8) Fitzgibbon and Holley, Jr.158
THERMODYNAMIC PROPERTIES OF LANTHANIDE AND ACTINIDE OXIDE COMPOUNDS 013101-25
This a
The enthalpies of formation (recalculated) of the composi-
tions with various O/Tb ratios used for this calculation are
given in Table 18.
3.15. Tb6O11(cr),Tb11O20(cr),Tb4O7(cr), Tb7O12(cr)
3.15.1. Structure
In addition to the TbO2�x phase, a number of defined
stoichiometric TbnOm phases were reported to exist: TbO1.833
(Tb6O11) as well as TbO1.818 (Tb11O20) have a triclinic crystal
structure (P1), TbO1.75 (Tb4O7) has a cubic crystal structure
(Fm3m), and TbO1.714 (Tb7O12) has a trigonal crystal structure
(R3).
3.15.2. Heat capacity and entropy
Heat capacity data for the stoichiometric TbnOm phases are
limited to themeasurement for Tb4O7 byHill159 from 0.5 to 22
K, revealing an antiferromagnetic transition at and 7.85 K. For
that reason we recommend that the standard entropies and the
high temperature heat capacity are interpolated between TbO2
and Tb2O3.
3.15.3. Enthalpy of formation
The enthalpies of formation of a number of phases with
varying O/Tb ratios have been measured by Stubblefield
et al.84 and Fitzgibbon and Holley Jr.158 and the recalculated
values are listed in Table 18. As shown in Fig. 5, the experi-
mental enthalpies of formation of the TbnOm phases are in
good agreement and fit to a regular trend, slightly more non-
linear compared to the Pr-O system. We have interpolated the
enthalpies of formation of the TbnOm phases from this trend as
DfH�ðTbO1:833; cr; 298:15 KÞ ¼ �ð945:8 � 5:0Þ kJmol�1;
DfH�ðTbO1:818; cr; 298:15 KÞ ¼ �ð957:8 � 5:0Þ kJmol�1;
DfH�ðTbO1:750; cr; 298:15 KÞ ¼ �ð962:9 � 5:0Þ kJmol�1;
DfH�ðTbO1:714; cr; 298:15 KÞ ¼ �ð963:8 � 5:0Þ kJmol�1:
3.16. Tb2O3(cr,l)
3.16.1. Polymorphism and melting point
At room temperature, terbium sesquioxide has the rare earth
cubic C-type structure (space group Ia3). Warshaw and Roy89
found the C → B transformation at 2148 K. Foex and Tra-
verse10 determined this transformation temperature as 1823K.
rticle is copyrighted as indicated in the article. Reuse of AIP content is sub
78.131.95.159 On: Sun,
The B → H transformation was also determined by Foex and
Traverse10 using thermal analysis at 2473 K. These values
must be converted to ITS-90 using the procedure outlined by
Coutures and Rand,15 leading to a correction of +15 K. Lopatoet al.11 reported that the B → H transformation occurs at
2448 K and the H → X transformation close to the melting
point (2613–2643 K). No information on the calibration of
these measurements has been found, but assuming the data
refer to IPTS-68, a correction of �1 K needs to be applied to
convert to ITS-90.We select Ttrs¼ (1823� 30) K for the C→B transformation and Ttrs ¼ (2488 � 30) K for the B → H
transformation, solely based on the work of Foex and
Traverse.10
The measurements of the melting temperature of Tb2O3
have been summarized in Table 19, which is based on the
IUPAC review by Coutures and Rand.15 The selected melting
point is (2682 � 15) K.
3.16.2. Heat capacity and entropy
The low-temperature heat capacity of Tb2O3 has been
measured by Hill159 from 0.5 to 22 K, revealing an antiferro-
magnetic transition at 2.42 K. These results are too limited to
derive the standard entropy and the selected value for this
quantity is the value estimated by Konings109 from the trend in
the lattice component in the lanthanide sesquioxides and the
calculated excess contribution calculated from the crystal field
energies:
S�ð298:15 KÞ ¼ ð159:2� 3:0Þ J K�1 mol�1:
The high-temperature enthalpy increment of C-Tb2O3 has
been determined by Pankratz et al.114 from 414 to 1599 K. The
results have been fitted to a polynomial equation constrained to
C�p(298.15K)¼ 116.0 J K�1 mol�1, estimated in a similar way
as the entropy value. We thus derive for the heat capacity,
C�p=ðJ K�1 mol�1Þ ¼ 120:6682þ 22:17194 10�3ðT=KÞ
� 1:00261 106ðT=KÞ�2:
For the estimation of the enthalpy change of the C → B
phase transformationwe accept theHoekstra’s estimate for the
entropy of transition (6.3 J K�1 mol�1),116 to give
DtrsH�ðC ! BÞ ¼ ð12� 4Þ kJmol�1:
J. Phys. Chem. Ref. Data, Vol. 43, No. 1, 2014ject to the terms at: http://scitation.aip.org/termsconditions. Downloaded to IP:
27 Apr 2014 17:09:58

013101-26 KONINGS ET AL.
This a
For the heat capacity of B-Tb2O3 we estimate
C�pðB;TÞ ¼ 152 JK�1 mol�1:
Foex and Traverse10 found that the B → H transformation
corresponds to a strong peak in the DTA analysis. Wu and
Pelton33 argued that the B → H transformation has the same
entropy change as the C→H (see under Er2O3) for which they
suggested ΔtrsS°(B→ H) ¼ 7.2 J K�1 mol�1 from analysis of
Ln2O3-Al2O3 phase diagrams. For the entropy of fusion in
these systems they derived ΔtrsS°(H → liquid) ¼ 17.9 J K�1
mol�1 in a similar manner. These numbers would suggest an
appreciably lower sum for the entropies of the transformation
from C to liquid compared to Gd2O3, whereas an almost
constant value could be expected, based on the known data
for the lanthanide trifluorides.160 The selected values are
consistent with the latter assumption:
DtrsH�ðB ! HÞ ¼ ð55� 8Þ kJmol�1;
DfusH� ¼ ð83� 8Þ kJmol�1:
For the heat capacity of the high temperature modification H
and the liquid phase of Tb2O3 we estimate
C�pðH;TÞ ¼ 170 JK�1 mol�1;
C�pðliq;TÞ ¼ 182 JK�1 mol�1:
3.16.3. Enthalpy of formation
The enthalpy of formation of monoclinic cubic Tb2O3 has
been assessed by Cordfunke and Konings34 recently, and we
accept the selected values from that work, since no new
information has been published since
DfH�ðTb2O3; cr; 298:15 KÞ ¼ �ð1865:2 � 6:0Þ kJmol�1:
This value is based on an analysis of two solution calori-
metry studies, as shown in Table 20. Stubblefield et al.84
measured the enthalpy of solution of Tb2O3(cr) in 6.0
mol dm�3 HNO3(aq). However, the thermochemical reaction
cycle was considered to be not highly reliable, since not all the
auxiliary thermodynamic data important for that calculation
are known with sufficient accuracy. Fitzgibbon and Holley,
Jr.158 measured the enthalpy of formation of TbO1.510(cr)
using a thermochemical cycle which involves the solution of
terbium metal and the oxide in 1.0 mol dm�3 HCl(aq) and
TABLE 20. The enthalpy of formation of Tb2O3(cr) at 298.15 K; DH�1 andDH
�2 are th
Cordfunke and Konings34)
Authors Methoda D
Stubblefield et al.84 S (1.0)b
Fitzgibbon and Holley, Jr.158 S (1.0)b
Selected value:
aC: combustion calorimetry; S: solution calorimetry; values in parentheses give tbSolvent was HNO3(aq).
J. Phys. Chem. Ref. Data, Vol. 43, No. 1, 2014rticle is copyrighted as indicated in the article. Reuse of AIP content is sub
78.131.95.159 On: Sun,
6.0 mol dm�3 HNO3(aq), respectively. Different solvents
were used to avoid reduction of HNO3(aq) by terbium metal
and oxidation of some of the HCl by the oxide. In order to
combine the results in the two solvents, the enthalpy of
solution of terbium carbonate was measured in both solvents.
The enthalpy of formation of TbO1.50 was obtained by extra-
polation (Fig. 5), being in excellent agreement with the value
by Stubblefield et al.84
3.17. Dy2O3(cr,l)
3.17.1. Polymorphism and melting point
At room temperature, dysprosium sesquioxide has the rare
earth cubic C-type structure (space group Ia3). Warshaw and
Roy89 found the C → B transformation at 2423 K. Foex and
Traverse10 and Lopato et al.11 determined this transformation
temperature as 2223 K. In view of the approximate nature, no
attempt has beenmade to correct these values to ITS-90. TheB
→ H transformation was determined by Foex and Traverse10
using thermal analysis at T ¼ 2473 K. This values must be
converted to ITS-90 using the procedure outlined by Coutures
and Rand,15 leading to a correction of +15 K. Lopato et al.11
reported that the B→ H transformation occurs at 2463 K. No
information on the calibration of thesemeasurements has been
found, but assuming the data refer to IPTS-68, a correction of
�1Kneeds to be applied to convert to ITS-90.We select Ttrs¼(2223� 30) K for the C→ B transformation and Ttrs ¼ (2488
� 30) K for the B → H transformation, solely based on the
work of Foex and Traverse.10
The measurements of the melting temperature of Dy2O3
have been summarized in Table 21, which is based on
the IUPAC review by Coutures and Rand15; the results
being corrected to ITS-90. The selected melting point is
(2680 � 15) K.
3.17.2. Heat capacity and entropy
The low-temperature heat capacity of Dy2O3 has been
measured by Justice and Westrum, Jr.161 from 10 to 350 K.
At the lower temperature range, the tail of a thermal anomaly
was observed, which is related to the removal of the ground
state degeneracy. Extrapolation of these results to T¼ 0K, and
accounting for the 2Rln (2) contribution of the lowest level of
the 6H15/2 ground state multiplet, gives for the entropy at
e enthalpies of solution of Tb(cr) and Tb2O3(cr) in HCl(aq), respectively (after
H�1/kJ mol�1 DH�
2/kJ mol�1 ΔfH°/kJ mol�1
�395.0 � 2.5 �1864.5 � 8.4
�392.5 � 5.0 �1865.2 � 6.0
�1865.2 � 6.0
he concentration of the solvent in mol dm�3.
ject to the terms at: http://scitation.aip.org/termsconditions. Downloaded to IP:
27 Apr 2014 17:09:58

TABLE 21. Temperature of melting of dysprosium sesquioxide (after Coutures
and Rand15)
Tfus/K
Authors Reported ITS-90
Wisnyi and Pijanowski111 2613 � 20 2629 � 20
Foex19 2663 2678
Mordovin et al.20 2566 � 30 2569 � 30
Noguchi and Mizuno21 2501 � 20 2504 � 20
Treswjatskii et al.22 2633 � 20 2632 � 20
Coutures et al.23 2683 � 10 2682 � 10
Mizuno et al.24 2628 � 20 2615 � 20
Shevthenko and Lopato13 2673 2672
Selected value: 2680 � 15
THERMODYNAMIC PROPERTIES OF LANTHANIDE AND ACTINIDE OXIDE COMPOUNDS 013101-27
This a
T ¼ 298.15 K:
S�ð298:15 KÞ ¼ ð149:8� 0:15Þ J K�1 mol�1:
The high-temperature enthalpy increment of Dy2O3 has
been measured by Pankratz and Kelly65 from 417 to 1801
K. The results are in good agreement with the low temperature
heat capacity data. Pankratz and Kelly65 observed a minor
thermal anomaly between 1823 and 1863 K, whose origin is
not clear. Since the enthalpy effect is very small (<1 kJ mol�1)
and has not yet been confirmedbyother techniques, and similar
unconfirmed transitions have been reported by this group of
researchers for other rare-earth sesquioxides, we have
neglected it. The data have been fitted to a polynomial equa-
tion, constrained to C�p ¼ 116.27 J K�1 mol�1 from the low-
temperature measurements,161 yielding for the heat capacity:
C�p=ðJ K�1 mol�1Þ ¼ 121:2302þ 15:27609 10�3ðT=KÞ
� 0:84580 106ðT=KÞ�2:
For the heat capacity of B-Dy2O3 we estimate
C�pðB;TÞ ¼ 155 JK�1 mol�1:
For transition and fusion entropies we assume the same values
as for the iso-structural changes in Tb2O3, yielding
DtrsH�ðC ! BÞ ¼ ð14� 5Þ kJmol�1;
DtrsH�ðB ! HÞ ¼ ð55� 8Þ kJmol�1;
DfusH� ¼ ð83� 8Þ kJmol�1:
TABLE 22. The enthalpy of formation of Dy2O3(cr) a
solution of Dy(cr) and Dy2O3(cr) in HCl(aq), respect
Authors Methoda DH�1/kJ m
Huber, Jr. et al.163 C
Huber, Jr. et al.162 C
S (4.0)b �695.3 �Selected value:
a C: combustion calorimetry; S: solution calorimetry; v
solvent in mol dm�3.bsolvent was HNO3(aq).
rticle is copyrighted as indicated in the article. Reuse of AIP content is sub
78.131.95.159 On: Sun,
For the heat capacity of the high temperature H modification
and liquid phase of Dy2O3 we estimate
C�pðH;TÞ ¼ 173 JK�1 mol�1
C�pðliq;TÞ ¼ 188 JK�1 mol�1:
3.17.3. Enthalpy of formation
The enthalpy of formation of cubicDy2O3 has been assessed
by Cordfunke and Konings34 recently, and we accept the
selected values from that work, since no new information has
been published since
DfH�ðDy2O3; cr; 298:15KÞ ¼ �ð1863:4 � 5:0Þ kJmol�1:
The selected value is based on the study by Huber, Jr.
et al.162 who used both solution calorimetry and oxygen bomb
combustion calorimetry (Table 22). The results from the ear-
lier publication by the same group163 based on the combustion
calorimetric measurements, seems to be less accurate, since
the sample of dysprosiummetal was less pure than that used in
the later investigation.
3.18. Ho2O3(cr,l)
3.18.1. Polymorphism and melting point
At room temperature, holmium sesquioxide has the rare earth
cubic C-type structure (space group Ia3). Foex and Traverse10
found the C → B transformation at 2523 K and Lopato et al.11
between 2463 K and 2493 K. The B → H transformation was
only determined by Foex and Traverse10 using thermal analysis
near 2573 K. The values of Foex and Traverse10 values must be
converted to ITS-90 using the procedure outlined by Coutures
and Rand,15 leading to a correction of +15 K. We select Ttrs
¼ (2538� 30) K for the C→B transformation and Ttrs¼ (2588
� 30) K for the B → H transformation.
The measurements of the melting temperature of Ho2O3
have been summarized in Table 23, which is based on
the IUPAC review by Coutures and Rand15; the results
being corrected to ITS-90. The selected melting point is
(2686 � 15) K.
3.18.2. Heat capacity and entropy
The low-temperature heat capacity of Ho2O3 has been
measured by Justice and Westrum Jr.161 from 10 to 350 K.
t 298.15 K; DH�1 and DH�
2 are the enthalpies of
ively (after Cordfunke and Konings34)
ol�1 DH�2/kJ mol�1 ΔfH°/kJ mol�1
�1865.2 � 3.8
�1862.9 � 4.2
2.9 �385.1 � 3.4 �1863.9 � 6.7
�1863.4 � 5.0
alues in parentheses give the concentration of the
J. Phys. Chem. Ref. Data, Vol. 43, No. 1, 2014ject to the terms at: http://scitation.aip.org/termsconditions. Downloaded to IP:
27 Apr 2014 17:09:58

0 500 1000 1500 2000
T/K
75
100
125
150
Ho (
T)-
Ho (
298.
15 K
)
(T -
298
.15)
FIG. 10. The reduced enthalpy increment (in J K�1 mol�1) of Ho2O3; ○,Tsagareishvili and Gvelesiani164; &, Pankratz et al.90; �, value derived from
the low-temperature measurements by Justice and Westrum Jr.113; the curve
shows the recommended equation.
TABLE 23. Temperature ofmelting of holmium sesquioxide (after Coutures and
Rand15)
Tfus/K
Authors Reported ITS-90
Foex19 2668 2683
Mordovin et al.20 2626 � 30 2629 � 30
Noguchi and Mizuno21 2603 � 20 2606 � 20
Treswjatskii et al.22 2643 � 20 2642 � 20
Coutures et al.23 2693 � 10 2692 � 10
Mizuno et al.24 2638 � 20 2625 � 20
Shevthenko and Lopato13 2673 2672
Salikhov and Kan95 2664 � 10
Selected value: 2686 � 15
013101-28 KONINGS ET AL.
This a
Extrapolation of these results to T ¼ 0 K, and accounting for
the contribution of the lowest level of the 5I15/2 ground state
multiplet, gives for the entropy at T ¼ 298.15 K:
S�ð298:15 KÞ ¼ ð156:38� 0:15Þ J K�1 mol�1
The high-temperature enthalpy increment of Ho2O3 has
been measured by Pankratz et al.90 from 400 to 1799 K and by
Tsagareishvili and Gvelesiani164 from 397 to 1621 K. The
results of Pankratz et al.90 tend to be somewhat lower at the
lowest temperatures and moreover, do not agree particularly
well with the low-temperature heat capacity data (Fig. 10). Our
recommended heat-capacity equation is based on a polynomial
fit of the results of both studies. The equation is constrained to
C�p ¼ 114.98 J K�1 mol�1 from the low-temperature measure-
ments,113 thus agreeing betterwith the results of Tsagareishvili
and Gvelesiani164 in the low temperature range. We thus
obtain
C�p=ðJ K�1 mol�1Þ ¼ 121:9340þ 10:11623 10�3ðT=KÞ
� 0:886280 106ðT=KÞ�2:
For transition and fusion entropies we assume the same
values as for the isostructural changes in Tb2O3, yielding
DtrsH�ðC ! BÞ ¼ ð16� 5Þ kJmol�1;
DtrsH�ðB ! HÞ ¼ ð57� 8Þ kJmol�1;
DfusH� ¼ ð83� 8Þ kJmol�1:
TABLE 24. The enthalpy of formation of Ho2O3(cr) a
solution of Ho(cr) and Ho2O3(cr) in HCl(aq), respect
Authors Methoda DH�1/kJ m
Huber Jr. et al.165 C
Morss et al.166 S (4.0)
[�710.5 �
Selected value:
aC: combustion calorimetry; S: solution calorimetry; v
solvent in mol dm�3;buncertainty recalculated.cusing DH�
1 = �704 � 4 as suggested by Morss et al.dcycle based on HoCl3 as explained in the text.
J. Phys. Chem. Ref. Data, Vol. 43, No. 1, 2014rticle is copyrighted as indicated in the article. Reuse of AIP content is sub
78.131.95.159 On: Sun,
For the heat capacity of the high temperature B and H
modifications and of liquid Ho2O3 we estimate
C�pðHo2O3;B;TÞ ¼ 135 JK�1 mol�1;
C�pðHo2O3;H;TÞ ¼ 149 JK�1 mol�1;
C�pðHo2O3; liq;TÞ ¼ 162 JK�1 mol�1:
3.18.3. Enthalpy of formation
The enthalpy of formation of cubicHo2O3 has been assessed
by Cordfunke and Konings34 recently, and we accept the
selected values from that work, since no new information has
been published since
DfH�ðHo2O3; cr; 298:15 KÞ ¼ �ð1883:3 � 8:2Þ kJmol�1:
This value is based on the oxygen-bomb combustion calori-
metric measurements by Huber Jr. et al.165 and the solution
calorimetric measurements of Ho2O3(cr) in 4.0 mol dm�3 HCl
(aq) by Morss et al.166 For the analysis of the latter study,
Morss et al.166 used an estimated enthalpy of solution ofHo(cr)
in the same medium, as the measurement of the latter quantity
by Stuve167 was considered not reliable. Cordfunke and
Konings34 combined the enthalpy of solution of Ho2O3(cr)
in 4.0 mol dm�3 HCl(aq) with the enthalpy of solution of
HoCl3(cr) in the same medium by Stuve,167 obtaining a value
in good agreement with the combustion value (see Table 24).
t 298.15 K; DH�1 and DH�
2 are the enthalpies of
ively (after Cordfunke and Konings34)
ol�1 DH�2/kJ mol�1 ΔfH°/kJ mol�1
�1881.0 � 5.0
�379.1 � 5.2b �1887.3 � 9.5c
7.1]c �1900.3 � 15.1
�1885.7 � 7.3d
�1883.3 � 8.2
alues in parentheses give the concentration of the
166
ject to the terms at: http://scitation.aip.org/termsconditions. Downloaded to IP:
27 Apr 2014 17:09:58

0 500 1000 1500 2000
T/K
75
100
125
150
Ho (
T)-
Ho (
298.
15 K
)
(T -
298
.15)
FIG. 11. The reduced enthalpy increment (in J K�1 mol�1) of Er2O3; ○,Tsagareishvili and Gvelesiani169; &, Pankratz et al.90; �, value derived from
the low-temperature measurements by Justice and Westrum Jr.161; the curve
shows the recommended equation.
TABLE 25. Temperature of melting of erbium sesquioxide (after Coutures and
Rand15)
Tfus/K
Authors Reported ITS-90
Foex19 2673 2688
Mordovin et al.20 2661 � 30 2664 � 30
Noguchi and Mizuno21 2618 � 20 2621 � 20
Treswjatskii et al.22 2663 � 20 2662 � 20
Coutures et al.23 2693 � 10 2692 � 10
Mizuno et al.24 2648 � 20 2636 � 20
Shevthenko and Lopato13 2693 2692
Salikhov and Kan95 2686 � 10
Selected value: 2690 � 15
THERMODYNAMIC PROPERTIES OF LANTHANIDE AND ACTINIDE OXIDE COMPOUNDS 013101-29
This a
3.19. Er2O3(cr,l)
3.19.1. Polymorphism and melting point
At room temperature, erbium sesquioxide has the rare earth
cubic C-type structure (space group Ia3). Foex and Traverse10
found the C → H transformation near T ¼ 2523 K using
thermal analysis. This valuemust be converted to ITS-90 using
the procedure outlined by Coutures and Rand,15 leading to a
correction of+15K. Lopato et al.11 found the transformation at
2593 K. No information on the calibration of these measure-
ments has been found, but assuming the data refer to IPTS-68,
a correction of�1 K needs to be applied to convert to ITS-90.
We select Ttrs ¼ (2538� 30) K, solely based on the results of
Foex and Traverse.10
The measurements of the melting temperature of Er2O3
have been summarized in Table 25, which is based on the
IUPAC review by Coutures and Rand15; the results being
corrected to ITS-90. The selected melting point is (2690 �15) K.
3.19.2. Heat capacity and entropy
The low-temperature heat capacity of Er2O3 has been
measured by Justice and Westrum Jr.161 from 10 to 350 K.
Extrapolation of these results to T ¼ 0 K, and accounting for
the 2Rln(2) contribution of the lowest level of the 5I15/2 ground
state multiplet. Tang et al.168 found by calorimetric measure-
ments in the temperature range 1.5 to 15 K that Er2O3 orders
antiferromagnetically with Néel temperature of 3.3 K. The
entropy associated with the measured peak is close to 3/4 of
2Rln(2). Since there are two nonequivalent Er3+ sites in Er2O3,
occurring in the ratio 3:1, the observed anomaly corresponds
to the ordering of one of the sites, the ordering of the
other occurring at lower temperature. The total entropy at
T ¼ 298.15 K derived from these results is
S�ð298:15 KÞ ¼ ð153:13� 0:15Þ J K�1 mol�1:
The high-temperature enthalpy increment of Er2O3 has been
measured by Pankratz et al.90 from 399 to 1797 K and by
Tsagareishvili and Gvelesiani169 from 387 to 1625 K. The
results of Pankratz et al.90 tend to be somewhat lower at the
lowest temperatures (Fig. 11). Our recommended heat-capa-
city equation is based on a polynomial fit of the results of both
studies. The equation is constrained to C�p ¼ 108.49 J K�1
rticle is copyrighted as indicated in the article. Reuse of AIP content is sub
78.131.95.159 On: Sun,
mol�1 from the low-temperature measurements.161 We thus
obtain
C�p=ðJ K�1 mol�1Þ ¼ 123:2921þ 8:62245 10�3ðT=KÞ
� 1:54433 106ðT=KÞ�2:
Wuand Pelton33 argued that the C→H transformation has a
significant entropy effect, as changes in the liquidus slopes can
be observed in the Er2O3–Al2O3 and Ho2O3–Al2O3 phase
diagrams. From the limiting slope at the Ln2O3 side and the
change in slope at the transformation temperatures they
derived ΔtrsS°(C → H) ¼ 7.2 J K�1 mol�1, and ΔtrsS°(H →liquid)¼ 17.9 J K�1 mol�1. These numbers would suggest an
appreciable lower sum for the entropies of the transformation
from theC form to the liquid phase compared to the other cubic
lanthanides, whereas an almost constant value could be
expected, based on the known data for the lanthanide trifluor-
ides.160 Our selected values are based on the assumption that
the entropy changes for the C→ H transformation and fusion
are identical to those of Y2O3 as measured by Shpil’rain
et al.170 using drop calorimetry:
DtrsH�ðC ! HÞ ¼ ð25� 5Þ kJmol�1
DfusH� ¼ ð83� 5Þ kJmol�1
For the heat capacity of the high temperature modification H
and liquid Er2O3 we estimate
C�pðEr2O3;H;TÞ ¼ 162 JK�1 mol�1;
C�pðEr2O3; liq;TÞ ¼ 176 JK�1 mol�1:
3.19.3. Enthalpy of formation
The enthalpy of formation of cubic Er2O3 has been assessed
by Cordfunke and Konings34 recently, and we accept the
selected values from that work, since no new information has
been published since
DfH�ðEr2O3; cr; 298:15 KÞ ¼ �ð1900:1 � 6:5Þ kJmol�1:
This value is based on an analysis of the calorimetric studies
listed in Table 26. Huber Jr. et al.171 and Spedding et al.99
determined the enthalpy of formation of Er2O3(cr) by oxygen
bomb calorimery. The derived values differ considerable, but
J. Phys. Chem. Ref. Data, Vol. 43, No. 1, 2014ject to the terms at: http://scitation.aip.org/termsconditions. Downloaded to IP:
27 Apr 2014 17:09:58

TABLE 26. The enthalpy of formation of Er2O3(cr) at 298.15 K; DH�1 and DH�
2 are the enthalpies of solution of Er(cr) and
Er2O3(cr) in HCl(aq), respectively (after Cordfunke and Konings34)
Authors Methoda DH�1/kJ mol�1 DH�
2/kJ mol�1 ΔfH°/kJ mol�1
Huber Jr. et al.171 C �1897.8 � 3.8
Spedding et al.99 C �1762.8
Montgomery and
Stuve172S (1.40) [�705.6 � 1.4]b �370.6 � 3.7 �1898.2 � 4.6
Morss et al.166 S (1.40) �364.6 � 1.9c �1904.2 � 3.4
Selected value: �1900.1 � 6.5
aC: combustion calorimetry; S: solution calorimetry; values in parentheses give the concentration of the solvent in mol dm�3.bFuger and Morrs.173
cUncertainty recalculated.
013101-30 KONINGS ET AL.
This a
the work of the former authors is considered to be much more
reliable due to the fact that the erbium metal used was well
characterised. This is supported by the good agreement with
the enthalpy of formation values derived from solution calori-
metry 1.4 mol dm�3 HCl(aq) by Montgomery and Stuve172
and Morss et al.166 These values were combined with the
enathlpy of solution of Er(cr) by Fuger et al.173
3.20. Tm2O3(cr,l)
3.20.1. Polymorphism and melting point
At room temperature, thulium sesquioxide has the rare earth
cubic C-type structure (space group Ia3). Foex and Traverse10
found the B → H transformation near T ¼ 2573 K using
thermal analysis. This valuemust be converted to ITS-90 using
the procedure outlined by Coutures and Rand,15 leading to a
correction of +15 K. We thus select Ttrs ¼ (2588 � 30) K.
The melting temperature of Tm2O3 has been measured by
Treswjatskii et al.22 to be (2653� 20)K.However, themelting
temperature determinations of the lanthanide sesquioxides by
these authors are systematically low by 30–50 K compared to
our selected values. Shevthenko and Lopato13 measured the
melting point to beT¼ 2683K,whichwould be T¼ 2682Kon
ITS-90. Coutures et al.23 estimated the melting temperature as
(2698 � 20) K from the trend in the lanthanide sesquioxides.
We select Tfus ¼ (2682 � 30) K.
0 500 1000 1500 2000
T/K
75
100
125
150
Ho (
T)-
Ho (
298.
15 K
)
(T -
298
.15)
FIG. 12. The reduced enthalpy increment (in J K�1 mol�1) of Tm2O3; ○,Tsagareishvili and Gvelesiani129; &, Pankratz et al.90; �, value derived from
the low-temperature measurements by Justice et al.174; the curve shows the
recommended equation.
3.20.2. Heat capacity and entropy
The low-temperature heat capacity of Tm2O3 has been
measured by Justice et al.174 from 6 to 350 K. They obtained
S°(298.15 K) � S°(10 K) ¼ 138.70 J K�1 mol�1, and extra-
polated the results to T ¼ 0 K using lattice and electronic
contributions. This gives
S�ð298:15 KÞ ¼ ð139:7� 0:4Þ J K�1 mol�1:
The high-temperature enthalpy increment of Tm2O3 has
been measured by Pankratz et al.90 from 397 to 1801 K and
Tsagareishvili and Gvelesiani129 from 397 to 1607 K. These
data are in fair agreement, but both are somewhat low at the
lowest temperatures compared to the low-temperature data
J. Phys. Chem. Ref. Data, Vol. 43, No. 1, 2014rticle is copyrighted as indicated in the article. Reuse of AIP content is sub
78.131.95.159 On: Sun,
(Fig. 12). At high temperatures the results tend to diverge, the
results of Tsagareishvili and Gvelesiani129 being significantly
higher. Moreover, the results of Pankratz et al.90 indicate a
minor thermal anomaly near 1680 K, whose origin is not clear.
Since the enthalpy effect is very small ( 1.3 kJ mol�1), and
similar unconfirmed transitions have been reported by this
group for other rare-earth sesquioxides, we have neglected it.
Our recommended heat-capacity equation is based on a poly-
nomial fit of the results of both studies, but since the results of
Pankratz et al.90 cover a wider temperature range, they dom-
inate the high temperature part of the curve. The equation is
constrained to C�p ¼ 116.73 J K�1 mol�1 from the low-tem-
perature measurements.161 We thus obtain
C�p=ðJ K�1 mol�1Þ ¼ 128:4322þ 5:23209 10�3ðT=KÞ
� 1:17891 106ðT=KÞ�2:
The entropies of the C→H transformation and melting are
assumed to be the same as for Er2O3. This yields
DtrsH�ðC ! HÞ ¼ ð26� 5Þ kJmol�1;
DfusH� ¼ ð83� 8Þ kJmol�1:
For the heat capacity of the high temperature modification
H and liquid Tm2O3 we estimate
C�pðTm2O3;H;TÞ ¼ 155 JK�1 mol�1;
C�pðTm2O3; liq;TÞ ¼ 168 JK�1 mol�1:
ject to the terms at: http://scitation.aip.org/termsconditions. Downloaded to IP:
27 Apr 2014 17:09:58

0 500 1000 1500 2000
T/K
70
95
120
145
Ho (
T)-
Ho (
298.
15 K
)
(T -
298
.15)
FIG. 13. The reduced enthalpy increment (in J K�1 mol�1) of Yb2O3; ○,Tsagareishvili and Gvelesiani129; &, Pankratz et al.90; �, value derived from
the low-temperature measurements by Justice et al.174; the curve shows the
recommended equation.
THERMODYNAMIC PROPERTIES OF LANTHANIDE AND ACTINIDE OXIDE COMPOUNDS 013101-31
This a
3.20.3. Enthalpy of formation
There is only one determination of the standard molar
enthalpy of formation of cubic thulium sesquioxide, which
was performed by Huber Jr. et al.175 using oxygen-bomb
combustion calorimetry, and this value was selected by Cord-
funke and Konings34:
DfH�ðTm2O3; cr; 298:15 KÞ ¼ �ð1889:3 � 5:7Þ kJmol�1:
It is theweightedmean of the results for two samples of Tm(cr)
containing significantly different amounts of impurities. Also
the extent of combustion varied significantly (88.67% to
99.67% of completion). After correction, Huber Jr. et al.175
obtained the values ΔfH°(298.15 K) ¼ �(1894.8 � 8.3)
kJ mol�1 and ΔfH°(298.15 K) ¼ �(1884.3 � 7.9) kJ mol�1,
respectively.
3.21. Yb2O3(cr,l)
3.21.1. Polymorphism and melting point
At room temperature, ytterbium sesquioxide has the rare
earth cubic C-type structure (space group Ia3). Foex and
Traverse10 found the B → H transformation very close to the
melting point. Lopato et al.11 reported this transformation 20K
below the melting point. We thus select Ttrs¼ (2687� 20) K.
The measurements of the melting temperature of Yb2O3
have been summarized in Table 27, which is based on
the IUPAC review by Coutures and Rand15; the results
being corrected to ITS-90. The selected melting point is
(2707 � 15) K.
3.21.2. Heat capacity and entropy
The low-temperature heat capacity of Yb2O3 has been
measured by Justice and Westrum Jr.113 from 10 to 350 K.
They obtained S°(298.15 K) � S°(10 K) ¼ 121.42 J K�1
mol�1. They extrapolated the results to T ¼ 0 K, and added
2R ln (2) for the contribution of the ground state doublet of the
split 2F7/2multiplet. Li et al.176 confirmed this by calorimetric
measurements in the temperature range 1.5–15 K. These
measurements reveal that Yb2O3 orders antiferromagneti-
cally with Néel temperature of 2.3 K, with an entropy close to
TABLE 27. Temperature of melting of ytterbium sesquioxide (after Coutures
and Rand15)
Tfus/K
Authors Reported ITS-90
Foex19 2693 2708
Mordovin et al.20 2646 � 30 2649 � 30
Noguchi and Mizuno21 2628 � 20 2631 � 20
Treswjatskii et al.22 2673 � 20 2672 � 20
Coutures et al.23 2708 � 10 2707 � 10
Mizuno et al.24 2660 � 20 2648 � 20
Shevthenko and Lopato13 2723 2722
Selected value: 2707 � 15
rticle is copyrighted as indicated in the article. Reuse of AIP content is sub
78.131.95.159 On: Sun,
2R ln (2). Thus, we obtain for the entropy at T ¼ 298.15 K:
S�ð298:15 KÞ ¼ ð133:1� 0:3Þ J K�1 mol�1:
The high-temperature enthalpy increment of Yb2O3 has been
measured by Pankratz et al.90 from 400 to 1798 K and Tsagar-
eishvili and Gvelesiani129 from 384 to 1588 K. These data are in
good agreement, and fit the low-temperature heat capacity data
very well (Fig. 13). Our recommended heat-capacity equation is
based on a polynomial fit of the results of both studies, which is
constrained to C�p ¼ 115.35 J K�1 mol�1 from the low-tempera-
ture measurements.113 We thus obtain
C�p=ðJ K�1 mol�1Þ ¼ 130:6438þ 3:34628 10�3ðT=KÞ
� 1:44820 106ðT=KÞ�2:
The entropies of the C→ H transformation and melting are
assumed to be the same as for Er2O3. This yields
DtrsH�ðC ! HÞ ¼ ð27� 5Þ kJmol�1;
DfusH� ¼ ð84� 8Þ kJmol�1:
For the heat capacity of the high temperature modification H
and liquid Yb2O3 we estimate
C�pðYb2O3;H;TÞ ¼ 134 JK�1 mol�1;
C�pðYb2O3; liq;TÞ ¼ 146 JK�1 mol�1:
3.21.3. Enthalpy of formation
The only experimental value has been reported by Huber Jr.
et al.,163 based on the results of oxygen-bomb combustion
calorimetric measurements of 97.2 mass % pure Yb(cr) sam-
ple. This value, which includes a careful correction for impu-
rities, was adopted by Cordfunke and Konings34 with an
increased uncertainty, and is also selected here
DfH�ðYb2O3; cr; 298:15 KÞ ¼ �ð1814:5 � 6:0Þ kJmol�1:
3.22. Lu2O3(cr,l)
3.22.1. Melting point
At room temperature, lutetium sesquioxide has the rare
earth cubic C-type structure (space group Ia3), which is stable
J. Phys. Chem. Ref. Data, Vol. 43, No. 1, 2014ject to the terms at: http://scitation.aip.org/termsconditions. Downloaded to IP:
27 Apr 2014 17:09:58

0 500 1000 1500 2000
T/K
75
100
125
150
Ho (
T)-
Ho (
298.
15 K
)
(T -
298
.15)
FIG. 14. The reduced enthalpy increment (in J K�1 mol�1) of Lu2O3; ○,Yashvili et al.30; &, Pankratz and Kelly65; �, value derived from the low-
temperature measurements by Justice et al.174; the curve shows the
recommended equation.
TABLE 28. Temperature of melting of lutetium sesquioxide (after Coutures and
Rand15)
Tfus/K
Authors Reported ITS-90
Mordovin et al.20 2741 � 30 2744 � 30
Noguchi and Mizuno21 2700 � 10 2704 � 10
Coutures et al.23 2763 � 10 2762 � 10
Shirvinskaya and Popova177 2643 2642
Mizuno et al.24 2733 � 20 2722 � 20
Shevthenko and Lopato13 2783 2782
Selected value: 2762 � 15
013101-32 KONINGS ET AL.
This a
up to the melting point. The measurements of the melting
temperature of Lu2O3 have been summarized in Table 28,
which is based on the review by Coutures and Rand15; the
results being corrected to ITS-90. The selectedmelting point is
(2762 � 15) K.
3.22.2. Heat capacity and entropy
The low-temperature heat capacity of Lu2O3 has been
measured by Justice et al.174 from 6 to 350 K. The standard
entropy derived from these data is
S�ð298:15 KÞ ¼ ð109:96� 0:13Þ J K�1 mol�1:
The high-temperature heat capacity is derived from the
enthalpy drop calorimetric measurements by Pankratz and
Kelly65 and Yashvili et al.,30 which are in excellent agree-
ment (Fig. 14). The experimental data have been fitted to
a polynomial equation, with boundary condition C�p(298.15)
¼ 101.75 J K�1 mol�1 from the low-temperature measure-
ments:174
C�p=ðJ K�1 mol�1Þ ¼ 122:4593þ 7:29001 10�3ðT=KÞ
� 2:03414 106ðT=KÞ�2:
This equation is extrapolated to the melting point. Neither the
heat capacity of the liquid phase nor the enthalpy of fusion are
known. Our estimates for these quantities are approximate
values obtained from the trend in the lanthanide sesquioxide
series and comparison to the lanthanide trifluorides:
C�pðLu2O3; liq;TÞ ¼ 152 JK�1 mol�1:
DfusH�ðLu2O3Þ ¼ ð113� 10Þ kJmol�1:
3.22.3. Enthalpy of formation
The standard enthalpy of formation of cubic Lu2O3(cr) is
based on the oxygen-bomb combustion calorimetric study by
Huber Jr. et al.178 These authors used two well-analysed
samples of lutetium metal, and obtained for the enthalpy of
formation the values ΔfH°(298.15 K) ¼ �(1891.8 � 14.2)
kJ mol�1 and ΔfH°(298.15 K) ¼ �(1870.9 � 9.1) kJ mol�1,
J. Phys. Chem. Ref. Data, Vol. 43, No. 1, 2014rticle is copyrighted as indicated in the article. Reuse of AIP content is sub
78.131.95.159 On: Sun,
after correction for impurities. As suggested byCordfunke and
Konings34 the weighted mean of the two results is selected
DfH�ðLu2O3; cr; 298:15 KÞ ¼ �ð1877:0 � 7:7Þ kJmol�1:
4. The Gaseous Lanthanide Oxides
4.1. LaO(g)
4.1.1. Heat capacity and entropy
Thermal functions of LaO(g) in the standard state have been
calculated using the molecular constants given in Table 29.
The molecule of LaO is well investigated. Seven electronic
states X2Σ+, A′2Δ, A2Π, B2Σ+, C2Π, D2Σ+, and F2Σ+ were
observed and analyzed in emission and absorption spectra.
The comprehensive reviews of spectral data published before
1975 were given by Huber and Herzberg179 and up to 1980 by
Gurvich et al.180 Later numerous works were done to improve
the molecular constants of LaO by Bernard and Sibai,181
Suarez,182 Carette,183 Bernard and Vergès,184 and Steimle
and Virgo185 using traditional methods of investigation; by
Bernard et al.186 and Childs et al.187 applying the laser induced
fluorescence method; by Suenram et al.188 and Törringet al.,189 who studied the microwave rotational spectrum
of LaO. The fundamental frequencies for La16O and La18O
were observed in Ar-matrix by Andrews et al.190 (796.7
and 756.1 cm�1 for, respectively), and by Zhang et al.191
(796.7 and 756.8 cm�1 , respectively) Taking into account the
matrix shift the fundamental frequencies obtained in matrices
are in agreement with the gas phase data.
Ab initio results for the ground state of LaO by Hong
et al.,192 Dolg and Stoll,193 Dolg et al.,194 and Cao et al.195
show remarkable agreement with the experimental data. Ab
initio calculations for excited states predicted also the exis-
tence of the unobserved doublet states 2Φ, 2Δ, 2Π, 2Σ by
Marquez et al.196 and Kotzian et al.197 and quartet states14Π,14Φ, 14Δ and 24Π by Schampsand et al.198 The Ligand field
calculations by Kaledin et al.199 and Schampsand et al.198
resulted in the configuration assignment of the experimentally
known states. The existence of the quartet state at the energy
17200� 800 cm�1 was confirmed by Klingeler et al.200 when
studying the photoelectron spectra of LaO�. All the theoretical
ject to the terms at: http://scitation.aip.org/termsconditions. Downloaded to IP:
27 Apr 2014 17:09:58

TABLE 29. Molecular constants of LaO(g)
Te ωe ωexe Be ae103 De10
7
reNo. State cm�1 pm pi
0a X2Σ+ 0 817.026 2.1292b 0.3525201 1.424c 2.63 182.5 2
1a A′ 2Δ3/2 7493.4 2
2a A′ 2Δ5/2 8191.2 2
3a A2Π 13094.53 4
4a B2Σ 17878.73 2
5a C2Π 22740.38 4
6a D2Σ 26958.96 2
7a F2Σ 28 015 4
8d 17 200 8
9d 18 500 8
10d 21 200 8
11d 24 000 20
12d 25 900 8
13d 30 200 12
14d 35 000 30
15d 40 000 36
aExperimental state.bωeye = �3.15 10�3 cm�1.cα210
6 = �2.97 cm�1.dEstimated state.
THERMODYNAMIC PROPERTIES OF LANTHANIDE AND ACTINIDE OXIDE COMPOUNDS 013101-33
This a
data with some corrections were used in the present work to
estimate unobserved electronic states (see Table 29).
The accepted constants for the 2Σ+ state (see Table 29) wereobtained from the analysis of the high-resolution laser excited
fluorescence B2Σ+ - X2Σ+ transition (v0 � 4; v00 � 5) by
Bernard et al.186 In their treatment the authors fixed rota-
tional constants at the very precise values derived by Törringet al.189 from the microwave spectrum for the levels v ¼ 0-2.
The selected vibrational constants quite well describe the
extensive but less accurate data given by Schoonveld and
Sundaram201 for v00 � 11.
The derived standard entropy at room temperature is
S�ð298:15 KÞ ¼ ð239:594� 0:03Þ J K�1 mol�1:
and the coefficients of the equations for the heat capacity are
C�p=ðJ K�1 mol�1Þ ¼ 28:0550þ 21:9688 10�3ðT=KÞ
� 19:25691 10�6ðT=KÞ2 þ 6:083418
10�9ðT=KÞ3 � 1:145313
105ðT=KÞ�2
for the 298.15 –1200 K range, and
C�p=ð J K�1 mol�1Þ ¼ 41:7593� 6:82858 10�3ðT=KÞ
þ 3:529957 10�6ðT=KÞ2� 0:281197 10�9ðT=KÞ3� 1:500459 106ðT=KÞ�2
for the 1200–4000 K range.
4.1.2. Enthalpy of formation
Results of determination of LaO(g) enthalpy of formation
are presented in Table 30. The experimental data considered in
the calculations consist mainly of Knudsen effusion, mass
rticle is copyrighted as indicated in the article. Reuse of AIP content is sub
78.131.95.159 On: Sun,
spectrometric, and combinedmeasurements. In an early inves-
tigation of lanthanum sesquioxide vaporization behavior202
using Knudsen effusion method, the principal mode of vapor-
ization from tungsten cell was found to be
La2O3ðcrÞ ¼ 2LaOðgÞ þ OðgÞ;with the steady-state condition corresponding to slightly sub-
stoichiometric composition La2O2.96, and thermochemical
assessment of the mass-loss data was made according to this
equation. In a later detailed study by Ackermann and Rauh203
it was found, however, that evaporation from tungsten results
in LaO partial pressures higher than in the case of evaporation
from rhenium cell, due to significant decrease of oxygen
pressure for substoichiometric lanthanum sesquioxide. In the
case of a rhenium cell, a substantially lower reducing effect of
the cell material was found. From the data obtained by Ack-
ermann and Rauh203 it follows that Knudsen effusion data
assessed under assumption of congruent lanthanum sesqui-
oxide vaporization will lead to overestimated LnO stability.
The only exception is the set of experimental data for lantha-
num sesquioxide vaporization203 from the rhenium effusion
cell, corrected for slight deviation of the sample composition
from exact stoichiometry.
The first mass spectrometric determination of the enthalpy
of formation ofLaO(g) has been carried out byChupka et al.204
who investigated the La2O3(cr) þ La(l) system. Later,
Ackermann and Rauh203 investigated the same system inmore
detail using a combination of Knudsen effusion and mass
spectrometry. It was shown that the vapor pressure of La in the
system is slightly lower than over pure lanthanum but tends to
that at decreasing temperatures. In general, the measurements
performed in both investigations can be used in selecting of
recommended value for the enthalpy of formation of LaO(g),
with more weight to more precise and reliable data of
Ackermann and Rauh.203
J. Phys. Chem. Ref. Data, Vol. 43, No. 1, 2014ject to the terms at: http://scitation.aip.org/termsconditions. Downloaded to IP:
27 Apr 2014 17:09:58

TABLE 30. The enthalpy of formation of LaO(g), in kJ mol�1
Authors T/K Methoda Reaction ΔrH°(298.15 K) ΔfH°(298.15 K)
Chupka et al.204 M 1775–1865 13La(g) þ 1
3La2O3(cr) ¼ LaO(g) 348.8 � 19 �105.1 � 20
Goldstein et al.202 K 2234–2441 La2O3(cr) ¼ 2LaO(g) þ O(g) 1774.2 � 8.3 �133.3 � 10
Smoes et al.205 M 1810–2220 ScO(g) þ La(g) ¼ Sc(g) þ LaO(g) �119.3 � 6.8 �122.7 � 8
M 1890–2270 YO(g) þ La(g) ¼ Y(g) þ LaO(g) �81.0 � 7.2 �120.6 � 8
Ames et al.206 M 1890–2220 Y(g) þ LaO(g) ¼ YO(g) þ La(g) 77.0 � 7.1 �116.6 � 8
M 1870–2080 Sc(g) þ LaO(g) ¼ ScO(g) þ La(g) 111.8 � 6.7 �115.2 � 8
Coppens et al.207 M 1877–2088 SiO(g) þ La(g) ¼ Si(g) þ LaO(g) �2.0 � 7.8 �120.8 � 9
Coppens et al.208 M 2146–2270 B(g) þ LaO(g) ¼ BO(g) þ La(g) �11.5 � 13 �113.7 � 15
Ackermann and Rauh203 K (W cell) 2258–2427 La2O3(cr) ¼ 2LaO(g) þ O(g) 1785.6 � 6.8 �127.6 � 8
M/K (Re cell) 1800–2300 La2O3(cr) ¼ 2LaO(g) þ O(g) 1801.9 � 12 �119.4 � 8
M/K 1516–1904 La2O3(cr) þ La(l) ¼ 3LaO(g) 1435.7 � 5.8 �118.6 � 4
M 1783–2184 La(g) þ YO(g) ¼ LaO(g) þ Y(g) �82.4 � 6.7 �122.0 � 8
Parr210 M/P D0(LaO) ¼ 793.7 � 3.0 �118.7 � 4
Gole and Chalek209 C D0(LaO) 790.1 � 4.2 ��115.1 � 5
Selected value: D0(LaO) ¼ 796.1 � 8 �119.0 � 8
aK = Knudsen effusion; M = mass spectrometry; P = photoionization; C = beam-gas chemiluminescence.
013101-34 KONINGS ET AL.
This a
Several mass spectrometric works deal with the LaO(g) þM(g) oxygen exchange reactions.203,205–208 Only reactions
without other lanthanides were taken into consideration. All
MOmolecules involved are characterized by reliable values of
enthalpy of formation, taken from the reference book “Ther-
modynamic Properties of Individual Substances.”7,180
The selected value
DfH�ðLaO; g; 298:15KÞ ¼ �ð119 � 8Þ kJmol�1
is taken as rounded average of the third-law values calculated
from allmentionedworks except data ofGoldstein et al.202 and
Ackermann and Rauh203 on evaporation of lanthanum sesqui-
oxide from tungsten cells. The data on chemiluminescence209
and photoionization of LaO molecules210 confirm the selected
value. The selected enthalpy of formation corresponds to a
dissociation energy of LaO molecule D0(LaO) ¼ (796 � 8)
kJ mol�1.
TABLE 31. The molecular parameters for CeO2(g)
Parameter Value
Ground electronic state 1A1
Symmetry group C2v
Symmetry number, σ 2
IAIBIC (g3 cm6)a 6.984 10�115
Vibrational frequencies (cm�1) 757.0, 264, 736.8
Electronic states (cm�1)b 0(1), 18000(2), 19000(2),
22000(2), 24000(2), 25000(2)
aProduct of moments of inertia.bNumbers in parentheses represent the statistical weights.
4.2. CeO2(g)
4.2.1. Heat capacity and entropy
The infrared spectrumof the CeO2molecule isolated in inert
gas matrices has been determined by DeKock and Weltner
Jr.,211 Gabelnick et al.212 and Willson and Andrews.213 The
results indicate that the molecule has a bent structure (C2v), an
approximate bond distance of 188 pm was derived.212 This
geometry was confirmed by quantum chemical calculations by
Heinemaan et al.,214 H€ulsen et al.,215 and Todorova et al.216
We have selected the bond distance (182 pm) and bond angle
(126°) from the CASPT2 computations by Todorova et al.216
The experimental values for the stretching frequencies,
ν1 ¼ 757 cm�1 and ν3 ¼ 737 cm�1 have been adopted here.
The experimental bending frequency, ν2 ¼ 262 cm�1 that is
selected for the calculations of the thermal functions, is
significantly higher than the value derived from the CASPT2
calculations, ν2 ¼ 102 cm�1.216 DeKock and Weltner, Jr.211
studied the electronic spectrum of CeO2 and found no elec-
tronic levels below 15 000 cm�1. In our calculations we have
included some estimated higher energy levels (Table 31). The
J. Phys. Chem. Ref. Data, Vol. 43, No. 1, 2014rticle is copyrighted as indicated in the article. Reuse of AIP content is sub
78.131.95.159 On: Sun,
derived entropy at room temperature is
S�ð298:15 KÞ ¼ ð274:417� 3:0Þ J K�1 mol�1
and the coefficients of the equations for the heat capacity are
C�p=ðJ K�1 mol�1Þ ¼ 37:7646þ 55:1209 10�3ðT=KÞ
� 57:1816 10�6ðT=KÞ2 þ 21:2692
10�9ðT=KÞ3 � 2:6077
105ðT=KÞ�2
for the 298.15–900 K range, and
C�p=ðJ K�1 mol�1Þ ¼ 55:9864þ 2:90431 10�3ðT=KÞ
� 1:4361 10�6ðT=KÞ2 þ 0:25254
10�9ðT=KÞ3 � 1:11908
106ðT=KÞ�2
for the 900–4000 K range.
4.2.2. Enthalpy of formation
Vapor pressure measurements of CeO2 have been reported
by Shukarev and Semenov,217Benezech and Foex,218 Piacente
et al.,219 and Ackermann and Rauh.220 The results by
Shchukarev and Semenov (transpiration method) and
Benezech and Foëx (mass spectrometry) are very different
from those obtained by Ackermann and Rauh220 and by
ject to the terms at: http://scitation.aip.org/termsconditions. Downloaded to IP:
27 Apr 2014 17:09:58

TABLE 32. The enthalpy of formation of CeO2(g) at 298.15 K
Authors Methoda T/K reaction ΔfH°(298.15 K)/kJ mol�1
Ackermann and Rauh220 ME 1846–2318 Ce2O3+x(cr) ¼ (1�x)CeO(g)þ(1þx) CeO2(g)b �542.8 � 8.2
Piacente et al.219 K/M 1736–2067 CeO2(cr) ¼ CeO2(g) �532.4 � 2.0
K/M 1933–2134 Ce(g)þCeO2(g) ¼ 2CeO(g) �573.8 � 16.3
Staley and Norman222 K/M 1845–1975 CeO2(g) ¼ CeO(g)þ0.5O2(g) �415.7 � 8.0c
K/M 1845–1975 CeO(g)þCaO(g) ¼ CeO2(g)þCa(g) �511.5 � 22.5c
Younés et al.221 K/M 1720–2040 Ce(g)þCeO2(g) ¼ 2CeO(g) �599.3 � 9.6c
K/M 1720–2040 La(g)þCeO2(g) ¼ LaO(g)þCeO(g) �593.8 � 12.3c
K/M 1720–2040 CeO(g)þUO3(g) ¼ CeO2(g)þ UO2(g) �489.4 � 17.9c
K/M 1720–2040 CeO2(g)þUO(g) ¼ CeO(g)þUO2(g) �565.7 � 17.7c
Selected value: �538 � 20
aME = mass effusion; K/M = Knudsen-cell mass spectrometry.bPartial vapor pressures of CeO(g) and CeO2(g) measured over the congruently vaporizing composition (cvc).cDerived from second-law values given by the authors.
THERMODYNAMIC PROPERTIES OF LANTHANIDE AND ACTINIDE OXIDE COMPOUNDS 013101-35
This a
Piacente et al.219 Moreover, the results have been presented in
graphical form only.
Ackermann and Rauh220 measured the vapor pressure of
the congruently vaporizing composition and of Ce2O3.03(cr),
corresponding to the reaction:
Ce2O3þxðcrÞ ¼ ð1� xÞCeOðgÞ þ ð1þ xÞCeO2ðgÞ:
The enthalpy of formation derived from this study are
summarized in Table 32. Piacente et al.219 studied the equili-
brium between solid and gaseous CeO2 by means of Knudsen
effusion mass spectrometry, and have been interpreted as
congruent vaporisation. In addition, these authors have studied
the isomolecular exchange reaction:
CeðgÞ þ CeO2ðgÞ ¼ 2CeOðgÞ:This reaction has also been studied by Younés et al.,221 whoreported, however, only second-law enthalpies of reaction.
Younés et al.221 also reported results for isomolecular reac-
tions with La, UO, and UO2, again giving only the second-law
enthalpies of reaction (see Table 32). Staley and Norman222
studied the isomolecular exchange reaction involving CeO(g)
and CeO2(g), as well as the isomolecular exchange reaction
with CaO(g), but also in this work only second-law enthalpies
of reaction have been given (Table 32).
The variation in the values obtained is large, particularly
among those derived from the second-law analysis, and the
selected value for ΔfH° of CeO2(g) is the average of the
(third-law) values derived from the work of Ackermann and
Rauh220 and Piacente et al.,219 whichwe considered themost
reliable
DfH�ð298:15 KÞ ¼ �ð538� 20Þ kJmol�1:
4.3. CeO(g)
4.3.1. Heat capacity and entropy
The thermal functions of CeO(g) in the standard state have
been calculated using the molecular constants presented in
Table 33.
rticle is copyrighted as indicated in the article. Reuse of AIP content is sub
78.131.95.159 On: Sun,
The analyses of 34 electronic transitions of CeO was
performed by Barrow et al.,223 Linton et al.,224 Linton
et al.,225 Linton and Dulick,226 Linton et al.,227 Kaledin
et al.199 and Todorova et al.216 As a result, all 16 lower
electronic states belonging to the lowest 4f6s electron config-
uration of CeO were identified (see Table 33). The configura-
tion assignment for the lower states of these transitions was
shown to be doubtless.197,199,228–232 On the other hand, the
configuration assignments for the upper states of these transi-
tions were shown to be contradictory.197,199,232–234 Certainly
these upper states should belong to the 4f6p, 4f5d, and 4f2
superconfigurations or to the mixed configurations. The esti-
mated statistical weights are presented at fixed energies in
Table 33, which are calculated assuming the energy intervals
for 4f6p, 4f5d, and 4f2 states to be 7000–36 000 cm�1, 12 000–
25 000 cm�1, and 17 000–45 000 cm�1, respectively. The 6s2,
5d6s, 6s6p, 6p2, 5d2, and 4f6s states are taken into account in
the interval 30 000–45 000 cm�1.
The derived standard entropy at room temperature is
S�ð298:15 KÞ ¼ ð246:099� 0:10Þ J K�1 mol�1
and the coefficients of the equations for the heat capacity are
C�p=ðJ K�1 mol�1Þ ¼ 22:01944þ 55:5050 10�3ðT=KÞ
� 43:14095 10�6ðT=KÞ2 þ 10:89494
10�9ðT=KÞ3 � 4:23189
104ðT=KÞ�2
for the 298.15–1300 K range, and
C�p=ðJ K�1 mol�1Þ ¼ 62:79967� 17:53953 10�3ðT=KÞ
þ 5:431417 10�6ðT=KÞ2 � 0:487485
10�9ðT=KÞ3 � 4:947446
106ðT=KÞ�2
for the 1300–4000 K range.
4.3.2. Enthalpy of formation
The results of the determination of the enthalpy of formation
of CeO(g) are presented in Table 34. Several mass spectro-
metric measurements of isomolecular oxygen exchange
J. Phys. Chem. Ref. Data, Vol. 43, No. 1, 2014ject to the terms at: http://scitation.aip.org/termsconditions. Downloaded to IP:
27 Apr 2014 17:09:58

TABLE 33. Molecular constants of CeO(g)
Te ωe ωexe Be αe103 De10
7
reNo. State cm�1 pm pi
0a X(1)2 0 829.5 2.6b 0.3553 1.6c 2.46d 181.198 2
1a (1)3 82 2
2a (1)1 812.7 2
3a (2)2 911.8 2
4a (1)0 1678.6 1
5a (2)1 1875.3 2
6a (2)0 1925.3 1
7a (1)4 2042.6 2
8a (2)3 2142.6 2
9a (2)4 2618.4 2
10a (3)3 2771.3 2
11a (3)4 3462.2 2
12a (3)1 3435.0 2
13a (3)0 3818.8 1
14a (4)1 4134.1 2
15a (4)0 4458.0 1
16e 7000 7
17e 10 000 22
18e 15 000 58
19e 20 000 72
20e 25 000 56
21e 30 000 45
22e 35 000 92
23e 40 000 112
aExperimental (4f6s) state.bCalculated using ΔG1/2 ¼ 824.3 cm�1 from Linton et al.224 and the dissociation energy adopted in this work.cCalculated using B0 = 0.35454 cm�1 from Barrow et al.223 and the Pekeris relation.dD0.eEstimated state.
013101-36 KONINGS ET AL.
This a
reactions have been carried out.207,220,221,235 Results of all
measurements are in remarkable agreement. The selected
value for the enthalpy of formation of CeO(g)
DfH�ðCeO; g; 298:15 KÞ ¼ �ð132 � 8Þ kJmol�1
is taken as a rounded average of the third-law values calculated
from all mentioned works. To the selected enthalpy of for-
mation corresponds the value of dissociation energy of CeO
molecule D0(CeO) ¼ (794.3 � 8) kJ mol�1.
4.4. PrO(g)
4.4.1. Heat capacity and entropy
The thermal functions of PrO(g) in the standard state have
been calculated using the molecular constants presented in
Table 35.
TABLE 34. The enthalpy of formation of CeO(g), in kJ mol�1
Authors Methoda T/K
Walsh et al.235b M 1700–2040 Ce(g
Coppens et al.207 M 2146–2270 CeO
Ackermann and Rauh203 M 1580–1920 Ce(g
M 1760–2160 Ce(
Younés et al.221 M 1490–2030 Ce(g
Selected value:
aM = mass spectrometry.bRecalculated by Ames et al.206
J. Phys. Chem. Ref. Data, Vol. 43, No. 1, 2014rticle is copyrighted as indicated in the article. Reuse of AIP content is sub
78.131.95.159 On: Sun,
The analysis of 34 electronic transitions of PrO in emission,
absorption, and laser fluorescence spectra was carried out by
Shenyavskaya et al.,236 Delaval et al.,237 Beaufils et al.,238
Dulick et al.,239 Dulick et al.,240 Dulick et al.,241 Shenyavs-
kaya and Kaledin,242 Dulick and Field,243 and Childs et al.244
As a result, information about 12 low-lying electronic states
belonging to the lowest electron configuration 4f26s was
obtained (see Table 35). The infrared spectrum of PrO was
observed in solid Ar and Kr matrices at 4 K byWeltner and De
Kock245 and Willson et al.246 The values of the fundamental
frequency of PrO obtained in matrices are in agreement with
the electronic spectra results. The 4f26s electron configuration
of PrO contains 91Hund case “c”molecular states, and each of
them is doubly degenerate. Dulick234 calculated all these states
using the crystal field theory and adjusting parameters to
reproduce experimental data. The low-lying states of PrO
belonging to the 4f26s configuration were calculated also by
Reaction ΔrH°(298.15 K) ΔfH°(298.15 K)
) þ LaO(g) ¼ CeO(g) þ La(g) 2.26 �131.6
(g) þ La(g) ¼ Ce(g) þ LaO(g)
) þ LaO(g) ¼ CeO(g) þ La(g) 3.34 �130.5
g) þ YO(g) ¼ CeO(g) þ Y(g) �81.05 �133.5
) þ LaO(g) ¼ CeO(g) þ La(g) 2.05 �131.8
D0(CeO) ¼ 794.8 � 8 �132.0 � 8
ject to the terms at: http://scitation.aip.org/termsconditions. Downloaded to IP:
27 Apr 2014 17:09:58

TABLE 35. Molecular constants of 141Pr16O(g)
Te ωe ωexe Be αe103 De10
7
reNo. State cm�1 pm pi
0a X(1)3.5 0 835.8b 2.22b 0.36175b 1.5b 2.6b 180.115 2
1a (1)4.5 217 2
2a (2)3.5 2064 2
3a (1)5.5 2099 2
4a (2)4.5 2154 2
5a (3)4.5 3718 2
6a (3)3.5 3887 2
7a (1)6.5 3953 2
8a (2)5.5 4225 2
9a (3)5.5 5541 2
10a (4)5.5 5938 2
11c 1870 2
12c 2880 2
13c 3170 8
14c 4950 10
15c 5247 4
16c 7000 5
17c 10 000 90
18c 15 000 150
19c 20 000 175
20c 25 000 185
21c 30 000 195
22c 35 000 200
23c 40 000 205
aExperimental (4f 26s) state.bFrom Shenyavskaya et al.236
cEstimated state.
THERMODYNAMIC PROPERTIES OF LANTHANIDE AND ACTINIDE OXIDE COMPOUNDS 013101-37
This a
Dulick et al.247 and Carrete and Hocquet230 in Ligand field
approximation and by Kotzian and Roesch248 applying the
theoretical Intermediate Neglect of Differential Overlap
(INDO) MO procedure augmented with a double-group CI
technique which includes spin-orbit interactions. Kotzian and
Roesch232 predicted also the lowest states below 40 000 cm�1
belonging to the 4f25d and 4f3 configurations. The upper states
of the transitions observed in the visible apparently are the p�s
transitions, so the 4f26p states were taken into account in the
interval 130 00–63 000 cm�1.
The derived standard entropy at room temperature is
S�ð298:15 KÞ ¼ ð244:367� 0:05Þ J K�1 mol�1
and the coefficients of the equations for the heat capacity are
C�p=ðJ K�1 mol�1Þ ¼ 22:98903þ 20:3103 10�3ðT=KÞ
þ 20:2961 10�6ðT=KÞ2 � 14:6500
10�9ðT=KÞ3 þ 2:72239
105ðT=KÞ�2
for the 298.15–1200 K range, and
C�p=ðJ K�1 mol�1Þ ¼ 84:67666� 28:5857 10�3ðT=KÞ
þ 8:73036 10�6ðT=KÞ2 � 0:84566
10�9ðT=KÞ3 � 1:44324
107ðT=KÞ�2
for the 1200–4000 K range.
rticle is copyrighted as indicated in the article. Reuse of AIP content is sub
78.131.95.159 On: Sun,
4.4.2. Enthalpy of formation
The results for the enthalpy of formation of PrO(g) are
presented in Table 36. Experimental data used in calculations
consist of Knudsen effusion and mass spectrometric measure-
ments. Several mass spectrometric measurements of isomo-
lecular oxygen exchange reactions have been carried
out.235,249,250 The selected value
DfH�ðPrO; g; 298:15 KÞ ¼ �ð145:5� 8Þ kJmol�1
is taken as a rounded average of the third-law values calculated
from all mentioned works. To the selected enthalpy of for-
mation corresponds the value of dissociation energy of PrO
molecule D0(PrO) ¼ (747.1 � 8) kJ mol�1.
4.5. NdO(g)
4.5.1. Heat capacity and entropy
The thermal functions of NdO(g) in the standard state have
been calculated using the molecular constants presented in
Table 37.
The analysis ofNdO spectra in emission, absorption, and laser
fluorescence was carried out by Linton et al.,251 Shenyavskaya
et al.,252 Kulikov,253 Kaledin and Shenyavskaya,254 and Kale-
din.255 As a result, nine low-lying electronic states with close
values of molecular constants were revealed including the
ground X4 state, and numerous more or less perturbed excited
states with energies 10 000–23 000 cm�1. The IR spectrum of
J. Phys. Chem. Ref. Data, Vol. 43, No. 1, 2014ject to the terms at: http://scitation.aip.org/termsconditions. Downloaded to IP:
27 Apr 2014 17:09:58

TABLE 36. The enthalpy of formation of PrO(g), in kJ mol�1
Authors Methoda T/K Reaction ΔrH°(298.15 K) ΔfH°(298.15 K)
Walsh et al.235b M 1750–2070 Pr(g)þ LaO(g)¼ PrO(g)þ La(g) 46.45 �148.7
Fries and Cater249 M 2053–2191 PrO(g) þ Y(g) ¼ Pr(g) þ YO(g) 31.4 �145.1
Murad250 M Pr(g) þ TiO(g) ¼ PrO(g) þ Ti(g) �71.4 �142.6
Selected value: D0(PrO) ¼ 747.1 � 8 �145.5 � 8
aM = mass spectrometry.bRecalcualted by Ames et al.206
013101-38 KONINGS ET AL.
This a
NdOwas observed in solidAr andKrmatrices at 4K byWeltner
and De Kock245 and Willson et al.246 The values of the funda-
mental frequency of NdO obtained in electronic and matrix IR
spectra are in agreement.
The theoretical calculations by Dolg and Stoll193 dealt with
the molecular constants of lanthanide monoxides in their
ground states. Boudreaux and Baxter256 calculated and com-
pared electronic structures of NdO and UO.
The low-lying electronic states of NdOwere assigned to the
4f36s electron configuration which gives rise to the electronic
states with the total statistical weight 728. The states belonging
to the subconfiguration 4f 3(4I)6s were calculated using the
crystal field theory by Kulikov253 and Carrete and Hocquet230
(56 states with Σp ¼ 104), and by Dulick et al.247 (up to 1000
cm�1, Σp ¼ 98). The best agreement with experimental data
was shown by Kulikov253 who used adjusted parameters to
reproduce experimental data known at that time (4 low-lying
states). Krauss and Stevens257 confirmed above mentioned
TABLE 37. Molecular constants of 142Nd16O(g)
Te ωe ωexe
No. State
0a X(1)4 0 834.083b 2.2855b
1a (1)5 474
2a (1)3 1156
3a (1)2 1351
4a (2)4 1587
5a (2)3 1793
6a (2)2 1914
7a (1)6 2124
8a (2)5 2153
9c 1470
10c 1914
11c 3180
12c 3987
13c 5600
14c 7200
15c 7920
16c 10 000
17c 15 000
18c 20 000
19c 25 000
20c 30 000
21c 35 000
22c 40 000
aExperimental (4f36s) state.bFrom Shenyavskaya et al.252
cEstimated state.
J. Phys. Chem. Ref. Data, Vol. 43, No. 1, 2014rticle is copyrighted as indicated in the article. Reuse of AIP content is sub
78.131.95.159 On: Sun,
crystal field results by ab initio calculations and predicted also
the low-lying 4f 35d and 4f 2s2 states (the lower limits are
3390 cm�1 and 4267 cm�1, respectively). Shenyavskaya
et al.252 tentatively assigned the [12.171]4 state to the lowest
state of the 4f 2s2 configuration. The strong bands observed in
visible spectral region apparently are the p�s or d�s transi-
tions. This implies that the 4f 35d and 4f 36p states should be
taken into account when calculating the thermal functions. In
Table 37 estimates are presented of the unobserved states
belonging to the 4f 36s, 4f 35d, 4f 35p, and 4f 36s2 configura-
tions. The states of the 4f3(4I)6s subconfiguration are taken
from the work by Kulikov.253 The lower limits for the 4f 3(4I)
5d and 4f 3(4I)5p states are assumed to be equal to 6000 and
13 500 cm�1, respectively. The lower limits for the states
belonging to the subconfigurations 4f 3(4F)nl are estimated
based on the spectrum NdIV: lower state 4I(4f 3) is separated
from the others by12 000 cm�1, and addition of one electron
does not change considerably the interval between centers of
Be αe103 De10
7
recm�1 pm pi
0.362346b 1.4291b 2.7296b 179.91 2
2
2
2
2
2
2
2
2
3
3
22
2
28
17
20
30
80
250
320
400
450
520
ject to the terms at: http://scitation.aip.org/termsconditions. Downloaded to IP:
27 Apr 2014 17:09:58

THERMODYNAMIC PROPERTIES OF LANTHANIDE AND ACTINIDE OXIDE COMPOUNDS 013101-39
This a
gravity of 4f 3(4F)nl and 4f 3(4I)nl configurations, and these
limits are assumed to be lower for all remaining states of
corresponding configurations.
Our estimates of the positions of the excited configurations
are based on the experimental data by Shenyavskaya et al.252
for f2s2 configuration and on comparison with the positions of
the analogous states of CeO and PrO (for f3d, f3p, and f4
configurations). The energy ranges for the states included in
the configurations were taken equal to those for UO (see
Kaledin et al.258)
The derived standard entropy at room temperature is
S�ð298:15 KÞ ¼ ð242:817� 0:05Þ J K�1 mol�1
and the coefficients of the equations for the heat capacity are
C�p=ð J K�1 mol�1Þ ¼ �9:80368þ 188:146 10�3ðT=KÞ
� 190:285 10�6ðT=KÞ2 þ 62:3079
10�9ðT=KÞ3 þ 5:70945
105ðT=KÞ�2
for the 298.15–1100 K range, and
C�p=ðJ K�1 mol�1Þ ¼ 57:65812� 9:78465 10�3ðT=KÞ
þ 2:76479 10�6ðT=KÞ2 � 0:218778
10�9ðT=KÞ3 þ 4:42849105ðT=KÞ�2
for the 1100–4000 K range.
4.5.2. Enthalpy of formation
The results of the determination of the enthalpy of formation
of NdO(g) are presented in Table 38. Experimental data have
been obtained by Knudsen effusion, transpiration, and mass-
spectrometric measurements. Ames et al.206 carried out Knud-
sen effusion measurement of the weight loss for Nd2O3(cr).
Results of these measurements were treated in this work under
assumption of congruent vaporization of Nd2O3(cr) according
to reaction
Nd2O3ðcrÞ ¼ 2NdOðgÞ þ OðgÞ;neglecting the possibility of formation of Nd(g) atoms in
the vapor [see text on LaO(g)]. The enthalpy of formation
of NdO(g) thus calculated can be more negative than the
correct value, the degree of deviation being dependent on the
amount of Nd atoms in vapors. Comparison with the results
of Tetenbaum259 andMurad and Hildenbrand260 confirms this
conclusion. Results of transpiration measurements259 have
TABLE 38. The enthalpy of formation of NdO(g), in kJ mol�1
Authors Methoda T/K
Goldstein et al.202 K 2255–2408 N
Tetenbaum259 T 2155–2485 N
Murad250 M 1933 Nd(g
M 1999 Nd(g
Selected value: D0(N
aK ¼ Knudsen effusion; M ¼ mass spectrometry; T ¼ transpiration.
rticle is copyrighted as indicated in the article. Reuse of AIP content is sub
78.131.95.159 On: Sun,
significant advantage in comparison to the Knudsen effusion
measurements, due to well-defined oxygen pressure, making
interpretation of results more certain. The measurements
of Murad250 for two oxygen exchange reactions result in
practically coinciding values of the enthalpy of formation of
NdO(g). The selected value
DfH�ðNdO; g; 298:15KÞ ¼ �ð120� 8Þ kJmol�1
is taken as the rounded average of the third-law values
calculated from the works of Tetenbaum259 and Murad.250
The selected enthalpy of formation corresponds to D0(NdO)
¼ (692.8 � 8) kJ mol�1.
4.6. PmO(g)
4.6.1. Heat capacity and entropy
The thermal functions of PmO(g) in the standard state have
been calculated using the molecular constants given in
Table 39.
Experimental data on the PmOmolecular spectra are absent.
The constants presented in Table 39 are estimated. Dolg and
Stoll193 showed that the molecular constants of the lanthanide
monoxides in the electronic states of the same electron con-
figuration change regularly. Thus the constants can be esti-
mated by interpolation. Field233 predicted the ground state
X3.5 belonging to the 4f4(5I)6s subconfiguration. Dulick
et al.247 carried out a Ligand field calculation of this sub-
configuration and obtained for the ground state Ω ¼ 0.5. For
the calculation of the thermal functions this difference in Ω is
of little importance because all the states of PmO belonging
to this subconfiguration have statistical weight 2.
In the present work, the molecular constants of PmO are
adopted (see Table 39) from the results of calculations by
Dulick and Field243 up to 10 000 cm�1 and on the basis of
rough estimates of statistical weights for the 4f46s, 4f46p, and
4f45d states at T 10 000 cm�1.
The derived standard entropy at room temperature is
S�ð298:15 KÞ ¼ ð246:519� 2:0Þ J K�1 mol�1
and the coefficients of the equations for the heat capacity are
C�p=ð J K�1 mol�1Þ ¼ 31:64170þ 38:6653 10�3ðT=KÞ
� 30:3021 10�6ðT=KÞ2 þ 8:45852
10�9ðT=KÞ3 � 2:08747
105ðT=KÞ�2
for the 298.15–1100 K range, and
Reaction ΔrH°(298.15 K) ΔfH°(298.15 K)
d2O3 ¼ 2NdO(g) þ O(g) 1790.3 �133.6
d2O3 ¼ 2NdO(g) þ O(g) 1576.6 �115.8
) þ ScO(g) ¼ PrO(g) þ Sc(g) �16.4 �122.1
) þ TiO(g) ¼ PrO(g) þ Ti(g) �26.5 �122.9
dO) ¼ 692.8 � 8 �120.0 � 8
J. Phys. Chem. Ref. Data, Vol. 43, No. 1, 2014ject to the terms at: http://scitation.aip.org/termsconditions. Downloaded to IP:
27 Apr 2014 17:09:58

TABLE 39. Molecular constants of 145Pm16O(g)
Te ωe ωexe Be αe103 De10
7
reNo. State cm�1 pm pi
0a X0.5 0 832 2.9b 0.358c 1.7c 2.65d 180.7 2
1a 225 2
2a 660 2
3a 820 2
4a 1240 6
5a 2280 14
6a 2890 4
7a 3565 12
8a 4340 12
9a 5065 10
10a 5470 6
11a 6155 12
12a 6950 20
13a 8130 16
14a 9070 6
15a 10 000 35
16a 15 000 60
17a 20 000 180
18a 25 000 400
19a 30 000 800
20a 35 000 1000
21a 40 000 1300
aExperimental (4f46s) state.bEstimated state.cFrom Shenyavskaya et al.252
d.....
013101-40 KONINGS ET AL.
This a
C�p=ðJ K�1 mol�1Þ ¼ 50:95780þ 1:31663 10�3ðT=KÞ
� 1:57622 10�6ðT=KÞ2 þ 0:282026
10�9ðT=KÞ3 � 2:75930
106ðT=KÞ�2
for the 1100–4000 K range.
4.6.2. Enthalpy of formation
No experimental data are available for the enthalpy of
formation of promethium monoxide PmO(g). The quantum-
mechanical calculations for the lanthanide monoxides per-
formed till now do not have a thermochemical quality neces-
sary for inclusion in the thermodynamic evaluations. Instead, a
model based on the conception of promotion of a free atom into
a “valence state”was used for evaluation of the PmOmolecule
stability. For the lanthanidemonoxide molecules, the idea was
for the first time expressed by Ames et al.206 It was shown that
variations in the dissociation energies of the lanthanide mon-
oxide series correspond to the magnitude of the 4fn→ 4f n�15d
transitions of the Ln2+ ions. Murad and Hildenbrand,260 using
more reliable and more broad experimental basis, came to
analogous conclusion that the 4f n → 4f n�15d excitation
energy plays a major role in determining the energetics of
most of the lanthanide monoxide bonds.
The model was further developed by Gibson,261 who came
to conclusion that the Ln–O and Ln–O+ bonds “are evidently
formed using two 5d electrons, rather than one 5d and one 6s
electron”. Using estimated excitation energies for the forma-
tion of atomic Pm in the 5d6s and 5d26s configurations, 115
J. Phys. Chem. Ref. Data, Vol. 43, No. 1, 2014rticle is copyrighted as indicated in the article. Reuse of AIP content is sub
78.131.95.159 On: Sun,
and 129 kJ mol�1, Gibson obtained two values for the dis-
sociation energy of PmO(g): 712 kJ mol�1 and 698 kJ mol�1.
Taking into account the monotonous decrease of D0(LnO)
values going from LaO to EuO, those values seem to be too
high. A lower valueD0(PmO) 630 kJ mol�1 can be obtained
as a mean value between D0(NdO) and D0(SmO). In the
present assessment a compromise between the two ways of
estimation is selected: D0(PmO)¼ (650� 50) kJ mol�1. This
value corresponds to
DfH�ðPmO; g; 298:15 KÞ ¼ �ð145� 50Þ kJmol�1:
4.7. SmO(g)
4.7.1. Heat capacity and entropy
The thermal functions of SmO(g) in the standard state have
been calculated using the molecular constants given in
Table 40.
Analysis of electronic transitions of SmObyLinton et al.,262
Bujin and Linton,263 Bujin and Linton,264 Linton et al.,265
Linton et al.,266 and Hannigan267 revealed 15 low-lying states
including the ground X0� state. The vibrational structure of
the observed transitions was not developed. The ΔG1/2 values
were detected by Linton et al.265 only for four low-lying states,
but not for the ground state. The infrared spectrum of SmOwas
observed in solid Ar and Kr matrices by Weltner and De
Kock,245 Willson and Andrews,213 and Willson et al.246 Tak-
ing into account the matrix shift, the obtained values of the
fundamental frequency are in agreement with the ΔG1/2 value
for the first excited state of SmO in gas phase. That permits us
to estimate the vibrational constant ωe with an accuracy of
2 cm�1. Ab initio calculations by Dolg and Stoll193 dealt with
the ground state of the molecule and resulted in theoretical
spectroscopic constants.
The electron configuration assignments for the lower states
of the transitions to the ground state configuration 4f 56s are
doubtless. The 4f 5(6H)6s states were calculated using Ligand
field theory byCarrete andHocquet230 andDulick et al.247 The
configuration assignments for the upper states of the transi-
tions were not considered. Table 40 gives the experimental
4f 5(6H)6s states according to Bujin and Linton263 and the
estimated statistical weights of the 4f 56s, 4f 56p, and 4f 55d
superconfigurations at fixed energies up to 40 000 cm�1.
The derived standard entropy at room temperature is
S�ð298:15 KÞ ¼ ð246:592� 0:10Þ J K�1 mol�1:
and the coefficients of the equations for the heat capacity are
C�p=ð J K�1 mol�1Þ ¼ 28:65158þ 45:8171 10�3ðT=KÞ
� 34:4081 10�6ðT=KÞ2 þ 7:99213
10�9ðT=KÞ3 � 4:99673
104ðT=KÞ�2
for the 298.15–1400 K range, and
ject to the terms at: http://scitation.aip.org/termsconditions. Downloaded to IP:
27 Apr 2014 17:09:58

TABLE 40. Molecular constants of 152Sm16O(g)
Te ωe ωexe Be αe103 De10
7
reNo. State cm�1 pm pi
0a X(1)0� 0 829.5b 3.58 0.353952c 2.0 2.58d 181.415 1
1a (1)1 147 2
2a (1)2 567 2
3a (2)0+ 582 1
4a (2)1 879 2
5a (1)3 1280 2
6a (3)0+ 1546 1
7a (2)2 1604 2
8a (4)0+ 1661 1
9a (3)1 1661 2
10a (4)1 2014 2
11a (3)2 2240 2
12a (1)4 2287 2
13a (5)0+ 2520 2
14a (5)1 2867 2
15e 2710 2
16e 3040 4
17e 3450 4
18e 3860 12
19e 4490 8
20e 5000 4
21e 10 000 25
22e 15 000 60
23e 20 000 290
24e 25 000 380
25e 30 000 400
26e 35 000 1200
27e 40 000 2350
aExperimental (4f56s) state.bEstimated, see text.cCalculated from B0 = 0.352952 cm�1 according to Bujin and Linton264 and the αe value calculated from the Pekeris relation.dCalculated from the Kratzer relation.eEstimated state.
THERMODYNAMIC PROPERTIES OF LANTHANIDE AND ACTINIDE OXIDE COMPOUNDS 013101-41
This a
C�p=ð J K�1 mol�1Þ ¼ 70:58620� 20:2158 10�3ðT=KÞ
þ 4:68050 10�6ðT=KÞ2 � 0:243006
10�9ðT=KÞ3 � 6:91999
106ðT=KÞ�2
for the 1400–4000 K range.
4.7.2. Enthalpy of formation
The results for the enthalpy of formation of SmO(g) are
presented in Table 41. Ames et al.206 carried out Knudsen
effusion measurement of the weight loss for Sm2O3(cr). The
results of these measurements were treated in this work under
assumption of congruent vaporization of Sm2O3(cr) according
TABLE 41. The enthalpy of formation of SmO(g), in kJ mol�1
Authors Methoda T/K
Ames et al.206 K 2333–2499 S
M 2360–2500 Sm(g
Dickson and Zare269 B 2155–2485 Sm(g
Hildenbrand268 M 2087–2298 Al(g)
M 2110–2295 Al(g)
Selected value: D0(S
aK = Knudsen effusion; M = mass spectrometry; B = beam-gas chemiluminescenbRecalculated by Ames et al.206
rticle is copyrighted as indicated in the article. Reuse of AIP content is sub
78.131.95.159 On: Sun,
to reaction
Sm2O3ðcrÞ ¼ 2SmOðgÞ þ OðgÞ;
neglecting the possibility of formation of Sm(g) atoms in the
vapor (see Sec. 4.1). The enthalpy of formation of SmO(g) thus
calculated is slightly more negative in comparison with results
of mass-spectrometric measurements for Al(g) þ SmO(g)
oxygen exchange reaction.268 Results of the latter work can
be regarded as highly reliable, due to large number of mea-
surements carried out using both vibrating-reed electrometer
and pulse counting detection. It needs to be mentioned, how-
ever, that our treatment of data from that paper resulted in a
considerable difference between second- and third-law values
for the enthalpy of formation of SmO(g).
Reaction ΔrH°(298.15 K) ΔfH°(298.15 K)
m2O3 ¼ 2SmO(g) þ O(g) 1839.1 �113.6
) þ YO(g) ¼ SmO(g) þ Y(g) 135.2 �170.9
) þ NO2 ¼ SmO(g) þ NO(g) ��116.6
þ SmO(g) ¼ AlO(g) þ Sm(g) 3.5 �109.0
þ SmO(g) ¼ AlO(g) þ Sm(g) 2.6 �101.6
mO) ¼ 555.6 � 8 �105.3� 8
ce.
J. Phys. Chem. Ref. Data, Vol. 43, No. 1, 2014ject to the terms at: http://scitation.aip.org/termsconditions. Downloaded to IP:
27 Apr 2014 17:09:58

013101-42 KONINGS ET AL.
This a
From the short wavelength cutoff of the Smmolecular beam
and NO2(g) chemiluminescent spectra, the following lower
boundary value to the ground state dissociation energy was
obtained in the work of Dickson and Zare269: D0(SmO) (566.9 � 2.9) kJ mol�1. Comparison with both Knuden
effusion206 and mass spectrometry268 results reveals that this
lower bound value is overestimated. The mass-spectrometric
results of Ames et al.206 seem to be erroneous.
The selected value
DfH�ðSmO; g; 298:15KÞ ¼ �ð105:3 � 8Þ kJmol�1
is taken as a rounded average of two third-law values calcu-
lated from the data ofHildenbrand.268 The selected enthalpy of
formation corresponds to D0(SmO) ¼ (555.6 � 8) kJ mol�1.
4.8. EuO(g)
4.8.1. Heat capacity and entropy
The thermal functions of EuO(g) in the standard state have
been calculated using the molecular constants presented in
Table 42.
The electronic spectrum of EuO (single electronic transi-
tion) was investigated by McDonald,270 but the data were not
published. Some of the results for the ground state (ωe ≈688 cm�1 and B0 ¼ 0.32624 cm�1 for 153EuO) were cited
by Dolg et al.271 The values of the fundamental frequency of
EuO were measured also in solid Ar and Kr matrices by
Gabelnick et al.212 (668 cm�1), Willson and Andrews213
(667.8 cm�1 and 633.5 cm�1 for Eu16O and Eu18O, respec-
tively), and Willson et al.246 (668 cm�1). Taking into account
the matrix shift, the obtained values are in agreement with the
ωe value for EuO from gas phase. That permits to estimate the
uncertainty of selected value of ωe to be within 2 cm�1.
The electronic structure of EuOwas investigated by Carrete
and Hocquet230 and Dulick et al.247 using Ligand field calcu-
lation and by Dolg et al.271 by ab initio calculation. All
calculations revealed the X8Σ (4f7) ground state and the first
TABLE 42. Molecular constants of 153Eu16O(g)
Te ωe ωexe Be αe103 De10
7
reNo. State cm�1 pm pi
0a X8Σ 0 688 3 0.3272b 1.9 2.96c 188.63 2
1d A8Σ 6000 8
2d 7000 16
3d 8000 18
4d 9000 28
5d 13 200 28
6d 15 000 10
7d 20 000 35
8d 25 000 340
9d 30 000 670
10d 35 000 3300
11d 40 000 3600
aExperimental (4f66s) state.bCalculated from B0 ¼ 0.32624 cm�1 and the αe value calculated from the
Pekeris relation.cCalculated from the Kratzer relation.dEstimated state.
J. Phys. Chem. Ref. Data, Vol. 43, No. 1, 2014rticle is copyrighted as indicated in the article. Reuse of AIP content is sub
78.131.95.159 On: Sun,
excited state A8Σ (4f66s). However the energy of the A8Σ state
is not well defined (from 3300 up to 7937 cm�1). The
theoretical calculations resulted also in relative energies for
the other low-lying states of the 4f66s configuration. In the
present work we select the data obtained by Carrete and
Hocquet230 (all states of the 4f6(7F)6s subconfiguration with
correctionof theA8Σ energy (assumed6000cm�1). InTable 42
are also presented roughly estimated statistical weights (for
4f66s, 4f66d, and 4f66p states) at fixed energies in the 15 000–
40 000 cm�1 interval.
The derived standard entropy at room temperature is
S�ð298:15 KÞ ¼ ð253:419� 0:10Þ J K�1 mol�1
and the coefficients of the equations for the heat capacity are:
C�p=ðJ K�1 mol�1Þ ¼ 33:8838þ 7:70507 10�3ðT=KÞ
� 7:38219 10�6ðT=KÞ2 þ 3:41476
10�9ðT=KÞ3 � 2:52934
105ðT=KÞ�2
for the 298.15–1700 K range, and
C�p=ð J K�1 mol�1Þ ¼ �79:4911þ 93:4647 10�3ðT=KÞ
� 22:3194 10�6ðT=KÞ2 þ 1:86990
10�9ðT=KÞ3 þ 5:27560
107ðT=KÞ�2
for the 1700–4000 K range.
4.8.2. Enthalpy of formation
The results for enthalpy of formation of EuO(g) are pre-
sented inTable 43.Ames et al.206 carried outKnudsen effusion
weight-loss measurements for Eu2O3(cr). Formal treatment of
their data under the assumption of congruent evaporation with
formation of EuO(g) and O(g) demonstrates the inadequacy of
this approach due to high degree of EuO dissociation and the
predominance of Eu(g) in the vapor phase. In this case, the
results of the calculations of the enthalpy of formation are to be
regarded as a lower boundary of the enthalpy of formation.
Dickson and Zare269 studied the chemiluminescence result-
ing from the reaction of an europium molecular beam with
NO2, N2O, and O3 under single-collision conditions. From the
short wavelength cutoff of the chemiluminescent spectra, the
following lower boundary to the ground state dissociation
energy was obtained from the Eu(g)þNO2 study:D0(EuO)¼(549.8� 2.9) kJ mol�1. This value was discarded in the paper
by Murad and Hildenbrand,272 in which a detailed discussion
of the stability of EuO(g) was presented. The following values
were calculated by Murad and Hildenbrand from the graph in
the Dickson and Zare269: EuþN2O,D0(EuO) > 423 kJ mol�1;
Eu þ O3, D0(EuO) > 457 kJ mol�1 (not shown in Table 43).
Both values are in agreement with mass-spectrometric data.
Mass spectrometric measurements of isomolecular oxygen
exchange reactions have been carried out by Murad and
Hildenbrand,272 and Balducci et al.273 All results of these
works are in reasonable agreement.
ject to the terms at: http://scitation.aip.org/termsconditions. Downloaded to IP:
27 Apr 2014 17:09:58

TABLE 43. The enthalpy of formation of EuO(g), in kJ mol�1
Authors Methoda T/K Reaction ΔrH°(298.15 K) ΔfH°(298.15 K)
Ames et al.206 K 1984–2188 Eu2O3 ¼ 2EuO(g) þ O(g) 1621.7 �142.7
Dickson and Zare269 B Eu(g) þ NO2 ¼ EuO(g) þ NO(g) <128.4Murad and Hildenbrand272 M 2026–2255 Eu(g) þ AlO(g) ¼ EuO(g) þ Al(g) 39.1 �47.4
M 2009–2237 Eu(g) þ BaO(g) ¼ EuO(g) þ Ba(g) 66.3 �60.5
M 2044–2237 Eu(g) þ TiO(g) ¼ EuO(g) þ Ti(g) 184.5 �62.9
Balducci et al.273 M 1920–2220 Eu(g) þ WO3(g) ¼ EuO(g) þ WO2(g) 118.2 �54.4
Selected value: D0(EuO) ¼ 477.9 � 8 �56.5 � 8
aK = Knudsen effusion; M = mass spectrometry; B = beam-gas chemiluminescence.
THERMODYNAMIC PROPERTIES OF LANTHANIDE AND ACTINIDE OXIDE COMPOUNDS 013101-43
This a
The selected value
DfH�ðEuO; g; 298:15KÞ ¼ �ð56:5 � 8Þ kJmol�1
is taken as weighted average of the third-law values calculated
from all mass-spectrometric works, with the weight of
WO3 þ Eu result of 0.5, due to less accurate reference values.
The selected enthalpy of formation corresponds to D0(EuO)
¼ 477.9 kJ mol�1.
4.9. GdO(g)
4.9.1. Heat capacity and entropy
The thermal functions of GdO(g) in the standard state have
been calculated using the molecular constants presented in
Table 44.
The first studies of the electronic spectrum of GdO were
carried out at the low and moderate resolution and dealt with
the vibrational structure of the spectrum (see Huber and
Herzberg179), Yadav et al.,274,275 Suarez and Grinfeld,276 and
the literature cited therein). The investigations revealed the
highly complex structure of the spectrum, and the proposed
vibrational analysis was doubtful. The values of the funda-
mental frequency of GdO were observed in solid inert gas
matrices by Weltner and De Kock245 in Ne and Ar (824 and
813 cm�1, respectively), by Willson and Andrews213 in Ar
(812.7 and 770.9 cm�1 for Gd16O and Gd18O, respectively),
and by Willson et al.246 in Ar (812.8 cm�1).
TABLE 44. Molecular constants of 158Gd16O(g)
Te ωe ωexe
No State
0a X9Σ�c 0 831.19 2.619
1a a7Σ�c 1834.64 837.11 2.62
2a A9Δ? 11 300
3a 17 500
4a 20 000
5a 9Σ� 21 693b
6a 7Σ� 22 307b
7c 25 000
8c 30 000
9c 35 000
10c 40 000
aExperimental state.bAll the constants for these state from Dmitriev et al.279 and Dmitriev.280
cEstimated state.
rticle is copyrighted as indicated in the article. Reuse of AIP content is sub
78.131.95.159 On: Sun,
Van Zee et al.277 found bymeans of ESR spectroscopy in an
Ar matrix at 4 K that the GdO ground state is 9Σ�, and its
vibrational quantum ΔG1/2 ¼ 824 cm�1. Taking into account
the matrix shift, the values of the fundamental frequency
observed in matrices are in agreement with the value ΔG1/2
¼ 828.19 cm�1 measured by Yadav et al.274 for the lower state
of the A system with multiple heads. Dmitriev et al.278 ana-
lyzed the rotational spectrum of the transition connected with
the ground state (9Π1-X9Σ�). Later Dmitriev et al.279 and
Dmitriev280 investigated the fluorescence spectra excited by
the Ar+ laser lines in the region of the 9Σ�-X9Σ� and 7Σ�-a7Σ�
systems, obtained the data on the v¼ 0-8 levels of the ground
state and for the v¼ 0-3 levels of the a7Σ� state, and found the
excitation energy of the a7Σ� state from the intercombination
transitions 9Σ�-a7Σ� and 7Σ�- X9Σ�. Till now the vibrational
and rotational constants for these low-lying states and the
energy of a7Σ� state are the most precise. The molecular
constants for the X9Σ� and a7Σ� states (see Table 44) were
reported byGurvich et al.7,281. The studies of the laser induced
fluorescence spectra by Carette et al.282 and by Kaledin
et al.258 revealed new components [18.4]4 and [19.0]0� of
the 9, 7Π states. Kaledin et al.258 showed thatΩ-assignment for
the components of the 9Π state made by Dmitriev et al.278 was
not correct. At the same time the interpretation of the f7(8S)p
states proposed byKaledin et al.258 was not convincing. In any
case it shows that the 9Π5 ([17.6]5) and9Π4 ([18.4]4) compo-
nents known experimentally belong to the states of different
multiplicity.
Be αe103 De10
7
recm�1 pm pi
0.35561 1.48 2.56 180.66 9
0.35678 1.47 2.59 180.37 7
18
50
28
9
7
16
200
440
1050
J. Phys. Chem. Ref. Data, Vol. 43, No. 1, 2014ject to the terms at: http://scitation.aip.org/termsconditions. Downloaded to IP:
27 Apr 2014 17:09:58

013101-44 KONINGS ET AL.
This a
Ab initio calculations ofGdObyDolg et al.,271,283 dealt with
well-known electronic states X9Σ� and a7Σ� and resulted in
theoretical constants in good agreement with the experiment.
Ligand field calculation by Carrete and Hocquet,230 Dulick
et al.247 and ab initio calculations by Kotzian et al.197 and
Sakai et al.284 considered the electronic structure of the
molecule. All calculations gave the X9Σ� f7(8S)s ground state
and the a7Σ� f7(8S)s first excited state. The half filled 4f shell
along with the ground 8S state and the other states of the Gd
atom lying much higher (>30 000 cm�1) explain the simple
structure of the GdO molecule: only 12 states of the f7(8S)s,
f7(8S)d, and f7(8S)p subconfigurations are expected up to
30000 cm�1. All the calculations except that by Dulick
et al.,247 who calculated only the f7(8S)s states, are in agree-
ment that the first excited configuration of GdO is f7(8S)d.
However the energy of the A9Δ state differs considerably
(from 8500 to 16700 cm�1). The study of the GdO� photo-
electron spectrum by Klingeler et al.285 revealed the group of
states near 11300 � 400 cm�1 which positions coincide with
the A9Δ state calculated by Carrete and Hocquet.230 The
estimated energies and statistical weights of the unobserved
states of the configuration mentioned above are presented in
Table 44. It gives also the estimated statistical weights in the
30000–40000 cm�1 region (the f7s and f7d states).
The derived standard entropy at room temperature is:
S�ð298:15 KÞ ¼ ð253:495� 0:03Þ J K�1 mol�1
and the coefficients of the equations for the heat capacity are:
C�p=ð J K�1 mol�1Þ ¼ 21:26451þ 40:9137 10�3ðT=KÞ
� 30:1655 10�6ðT=KÞ2 þ 7:50616
10�9ðT=KÞ3 þ 6:83276
104ðT=KÞ�2
for the 298.15–1300 K range, and
C�p=ðJ K�1 mol�1Þ ¼ 51:77714� 10:0325 10�3ðT=KÞ
þ 2:57810 10�6ðT=KÞ2 � 0:111668
10�9ðT=KÞ3 � 4:80380
106ðT=KÞ�2
for the 1300–4000 K range.
4.9.2. Enthalpy of formation
The results for the enthalpy of formation of GdO(g) are
presented in Table 45. Experimental data used in the analysis
are based on Knudsen effusion206 and mass spectrometric
TABLE 45. The enthalpy of formation of GdO(g), in kJ mol�1
Authors Methoda T/K
Ames et al.206 K 2408–2546 G
Murad and Hildenbrand260 M 1957–2024 Gd(g
M 1908–1977 Gd(g
Selected value: D0(G
aK = Knudsen effusion; M = mass spectrometry.
J. Phys. Chem. Ref. Data, Vol. 43, No. 1, 2014rticle is copyrighted as indicated in the article. Reuse of AIP content is sub
78.131.95.159 On: Sun,
measurements,260 the results being in satisfactory agreement.
At the same time, the mass-spectrometric results deserve more
weight, because interpretation of Knudsen effusion data is not
unambiguous due to possible formation of free gadolinium
atoms in the vapors (see text onLaO(g) enthalpy of formation).
The selected value
DfH�ðGdO; g; 298:15 KÞ ¼ �ð68:0 � 8Þ kJmol�1
is taken as a rounded average of the third-law values calculated
from twomentioned works, with a lowweight for the Knudsen
effusion results. The selected enthalpy of formation corre-
sponds to D0(GdO) ¼ (710.2 � 8) kJ mol�1.
4.10. TbO(g)
4.10.1. Heat capacity and entropy
The thermal functions of TbO(g) in the standard state have
been calculated using the molecular constants given in
Table 46.
The electronic spectrum of TbO was investigated in emis-
sion and absorption by Kaledin and Shenyavskaya286,287 (see
Huber and Herzberg179 for earlier works) and in the fluores-
cence by Kulikov et al.288,289, and Gurvich et al.281 The
fundamental frequency of TbO was observed in solid inert
gas matrices by Weltner and De Kock245 in Ne and Ar
(824 cm�1), by Willson and Andrews213 in Ar at 10 K
(823.9 and 781.4 cm�1 for Tb16O and Tb18O, respectively),
and by Willson et al.246 in Ar (823.9 cm�1). Taking into
account the matrix shift the values of fundamental frequency
obtained in matrices are in agreement with those from gas
phase data. Ab initio calculations by Dolg and Stoll193 dealt
with the ground state of the TbO molecule and resulted in the
theoretical spectroscopic constants.
The studies of the TbO electronic spectra revealed 14 low-
lying states (including the X6.5 ground state), assigned to the
f 8(7F)s subconfiguration, and 11 excited states with energies
14 899–22 300 cm�1, mostly ascribed to the f 8(7F)d and
f 8(7F)p subconfigurations. Ligand field calculation by Carrete
and Hocquet230 and Dulick et al.247 showed that up to 10 000
cm�1 all the states belonged to the f 8(7F)s subconfiguration.
The estimated energies and statistical weights of the unob-
served states of the f 8(7F)s subconfiguration, presented in
Table 46, are selected from Carrete and Hocquet.230 Table 46
gives also the estimated statistical weights of the f 8(7F)d and
f 8(7F)p states assuming the energies of the lowest states at
12 000 and 18 000 cm�1, respectively, and placing the other
states of the f 8nl configurations higher than the corresponding
f 8(7F)l states by approximately 15 000–20 000 cm�1.
Reaction ΔrH°(298.15 K) ΔfH°(298.15 K)
d2O3 ¼ 2GdO(g) þ O(g) 1935.6 �78.5
) þ TiO(g) ¼ GdO(g) þ Ti(g) �43.5 �68.5
) þ YO(g) ¼ GdO(g) þ Y(g) 5.7 �65.4
dO) ¼ 710.2 � 8 �68.0 � 8
ject to the terms at: http://scitation.aip.org/termsconditions. Downloaded to IP:
27 Apr 2014 17:09:58

TABLE 46. Molecular constants of 159Tb16O(g)
Te ωe ωexe Be αe103 De10
7
reNo. State cm�1 pm pi
0a X(1)6.5 0 843.1b 3.04b 0.35325 1.50 2.48c 181.213 2
1a (1)5.5 355 2
2a (1)4.5 750 2
3a (1)3.5 1183 2
4a (2)5.5 1624 2
5a (1)2.5 1654 2
6a (2)4.5 2101 2
7a (1)1.5 2160 2
8a (2)3.5 2610 2
9a (3)5.5 2900 2
10a (2)2.5 3119 2
11a (3)4.5 3188 2
12a (3)3.5 3506 2
13a (3)2.5 3830 2
14d 4000 4
15d 4500 8
16d 5100 8
17d 6100 16
18d 7050 8
19d 7950 10
20d 9050 8
21d 10 100 9
22d 15 000 25
23d 20 000 80
24d 25 000 125
25d 30 000 170
26d 35 000 600
27d 40 000 900
aExperimental state.bCalculated from ΔG1/2 = 837.1 cm�1 given by Kulikov et al.288 and the assumed dissociation limit.cCalculated from the Kratzer relation.dEstimated state.
THERMODYNAMIC PROPERTIES OF LANTHANIDE AND ACTINIDE OXIDE COMPOUNDS 013101-45
This a
The derived standard entropy at room temperature is
S�ð298:15 KÞ ¼ ð245:758� 0:10Þ J K�1 mol�1
and the coefficients of the equations for the heat capacity are
C�p=ð J K�1 mol�1Þ ¼ 30:97785þ 32:5225 10�3ðT=KÞ
� 19:6568 10�6ðT=KÞ2 þ 4:14576
10�9ðT=KÞ3 � 1:18135
104ðT=KÞ�2
for the 298.15–1400 K range, and
C�p=ðJ K�1 mol�1Þ ¼ 64:48191� 8:31957 10�3ðT=KÞ
þ 0:883659 10�6ðT=KÞ2þ 0:0270508 10�9ðT=KÞ3 � 10:4723
106ðT=KÞ�2
for the 1400–4000 K range.
4.10.2. Enthalpy of formation
There is only one study of the determination of the enthalpy
of formation of TbO(g). Ames et al.206 have performed
mass spectrometric measurements of isomolecular oxygen
rticle is copyrighted as indicated in the article. Reuse of AIP content is sub
78.131.95.159 On: Sun,
exchange reaction (1830–2040 K)
Tbþ LaOðgÞ ¼ TbOðgÞ þ LaðgÞfor which we obtainΔrH°(298.15K)¼ 80.2 kJmol�1 by third-
law analysis. This results in the following selected enthalpy of
formation:
DfH�ðTbO; g; 298:15 KÞ ¼ �ð84:7� 10Þ kJmol�1
This value corresponds to D0(TbO) ¼ (715.5 � 10) kJ mol�1.
4.11. DyO(g)
4.11.1. Heat capacity and entropy
The thermal functions of DyO(g) in the standard state have
been calculated using the molecular constants given in
Table 47.
The electronic spectrum of DyO was investigated in emis-
sion and absorption by Kaledin and Shenyavskaya286 and
Yadav et al.290 (see Huber and Herzberg179 for earlier works)
and in the fluorescence by Linton et al.291 and Cheng.292 The
values of the fundamental frequency of DyO were observed in
solid inert gas matrices by Weltner and De Kock245 in Ar
(829 cm�1), Willson and Andrews213 in Ar at 10 K (829.0 and
J. Phys. Chem. Ref. Data, Vol. 43, No. 1, 2014ject to the terms at: http://scitation.aip.org/termsconditions. Downloaded to IP:
27 Apr 2014 17:09:58

TABLE 47. Molecular constants of 159Dy16O(g)
Te ωe ωexe Be αe103 De10
7
reNo. State cm�1 pm pi
0a X(1)8 0 849b 3.5b 0.3593c 2.0 2.57d 179.4 2
1a (1)7 770 2
2a (1)6 1630 2
3a (2)7 1683 2
4a (2)6 2420 2
5e 2180 2
6e 3280 11
7e 4400 10
8e 5100 7
9e 6100 8
10e 7130 14
11e 8565 14
12e 9830 20
13e 11 775 20
14e 14 070 20
15e 15 000 40
16e 20 000 130
17e 25 000 350
18e 30 000 370
19e 35 000 1500
20e 40 000 1900
aExperimental state.bCalculated from ΔG1/2 = 842 cm�1 given by Linton et al.291 and the assumed
dissociation limit.cCalculated from B0 = 0.358413 cm�1 given by Linton et al.291) and
αe ¼ 0.0020 cm�1 found by Kaledin and Shenyavskaya.286
dCalculated from the Kratzer relation.eEstimated state.
013101-46 KONINGS ET AL.
This a
786.1 cm�1 for Dy16O) and Dy18O, respectively), andWillson
et al.246 in Ar (828.7 cm�1). Taking into account the matrix
shift, the values of the fundamental frequency obtained in
matrices are in agreement with those from gas phase data. Ab
initio calculations by Dolg and Stoll193 dealt with the ground
state of the molecule and resulted in theoretical spectroscopic
constants.
The studies of the DyO electronic spectra by Kaledin and
Shenyavskaya286 and Linton et al.291 revealed 5 low-lying
states (including the X8 ground state,) which were assigned to
the f9(6H)s subconfiguration, and 6 excited stateswith energies
17 070–19 000 cm�1, most of which could be assigned to the
f9(6H)d and f9(6H)p configurations.
Carrete and Hocquet230 and Dulick et al.247 carried out
Ligand field calculations of the DyO states belonging to the
f9(6H)s subconfiguration. Carrete and Hocquet230 obtained all
the f9(6H)s states (total statistical weight 132), while Dulick
et al.247 obtained only states up to 10 000 cm�1 with Σp¼ 74.
The data obtained byDulick et al.247 are closer to experimental
data because of using the other parameter G3 ¼ 300 cm�1
as compared with G3 ¼ 150 cm�1 used by Carrete and
Hocquet.230 The deviations between the results are the largest
for lower states. For that reason the estimated energies and
statistical weights of the unobserved states of the f9(6H)s
subconfiguration up to 10 000 cm�1 are selected from the
Dulick et al.247 and those in the interval 10 000–15 000 cm�1
are selected from Carrete and Hocquet230 with corrections to
mean deviation. In Table 47 also the estimated statistical
weights for the f9(6FP)s states (>15 000 cm�1) are given, for
J. Phys. Chem. Ref. Data, Vol. 43, No. 1, 2014rticle is copyrighted as indicated in the article. Reuse of AIP content is sub
78.131.95.159 On: Sun,
the remaining f 9s states corresponding to the low multiplicity
terms of the f9-core (>21 000 cm�1), for the f9(6H)d and f8(6H)
p states assuming the energies of the lowest states at 12 500 and
18 500 cm�1, respectively, and for the other states of the f9nl
configurations as in case of the f9s configuration. The upper
limit for all configurations is assumed to beD0þ IP, so all the
estimated states are considered stable.
The derived standard entropy at room temperature is
S�ð298:15 KÞ ¼ ð242:208� 0:10Þ J K�1 mol�1
and the coefficients of the equations for the heat capacity are
C�p=ð J K�1 mol�1Þ ¼ 19:08366þ 61:7856 10�3ðT=KÞ
� 37:4790 10�6ðT=KÞ2 þ 7:29509
10�9ðT=KÞ3 þ 2:19805
104ðT=KÞ�2
for the 298.15–1300 K range, and
C�p=ð J K�1 mol�1Þ ¼ 68:49712� 11:3191 10�3ðT=KÞ
þ 1:99999 10�6ðT=KÞ2� 0:0418797 10�9ðT=KÞ3� 8:39005 106ðT=KÞ�2
for the 1300–4000 K range.
4.11.2. Enthalpy of formation
Ames et al.206 carried out Knudsen effusion measurements
of theweight loss of Dy2O3(cr) in the temperature range 2440–
2637 K. The results of these measurements were treated in this
work under the assumption of congruent vaporization of
Dy2O3(cr) according to reaction
Dy2O3ðcrÞ ¼ 2DyOðgÞ þ OðgÞ;neglecting possible formation of Dy(g) atoms in the vapor (see
Sec. 4.1). The DyO(g) enthalpy of formation thus calculated
must be more negative than the correct value, the degree of
deviation being dependent on amount of Dy atoms in the
vapor. The third-law enthalpy of reaction ΔrH°(298.15 K) ¼1953.4 kJ mol�1, yields ΔfH°(DyO, g, 298.15 K) ¼ �79.2
kJ mol�1, which corresponds to D0(DyO) ¼ 609.8 kJ mol�1.
Dulick et al.247 have estimated the DyO dissociation energy
using the crystal field model applied to diatomic molecules as
D0(DyO) ¼ (602 � 1) kJ mol�1. In absence of additional
information, this value is selected in this work for the enthalpy
of formation of DyO(g):
DfH�ðDyO; g; 298:15 KÞ ¼ �ð71 � 20Þ kJmol�1:
4.12. HoO(g)
4.12.1. Heat capacity and entropy
The thermal functions of HoO(g) in the standard state have
been calculated using the molecular constants given in
Table 48.
ject to the terms at: http://scitation.aip.org/termsconditions. Downloaded to IP:
27 Apr 2014 17:09:58

TABLE 48. Molecular constants of 165Ho16O(g)
Te ωe ωexe Be αe103 De10
7
reNo. State cm�1 pm pi
0a X8.5 0 848b 3.5b 0.358477 1.50 2.56c 179.59 2
1a (1)7.5 603 2
2a (2)7.5 1130 2
3a (1)6.5 1853 2
4d 1165 14
5d 2275 12
6d 6300 22
7d 7100 8
8d 10 050 26
9d 13 500 26
10d 15 000 50
11d 20 000 90
12d 25 000 200
13d 30 000 250
14d 35 000 700
15d 40 000 1150
aExperimental state.bCalculated from ΔG1/2 = 841.252 cm�1 given by Linton and Liu294 and the assumed dissociation limit.cCalculated from the Kratzer relation.dEstimated state.
THERMODYNAMIC PROPERTIES OF LANTHANIDE AND ACTINIDE OXIDE COMPOUNDS 013101-47
This a
The electronic spectrum of HoO was investigated in emis-
sion and absorption by Kaledin and Shenyavskaya286 (see
Huber and Herzberg179 for earlier works), and in fluorescence
byLiu et al.,293 Linton andLiu,294 andCheng.292 The values of
fundamental frequency of HoO were measured in solid inert
gas matrices by Weltner and De Kock245 in Ar (829 cm�1),
Willson and Andrews213 in Ar at 10 K (828.1 and 785.2 cm�1
for Ho16O and Ho18O, respectively), and Willson et al.246 in
Ar (828.0 cm�1). Taking into account the matrix shift, the
values of fundamental frequency obtained in matrices are in
agreement with those from the gas phase data. Ab initio
calculations by Dolg and Stoll193 dealt with the ground state
of the molecule and gave its constants in good agreement
with experiment.
The studies of the HoO electronic spectra revealed 4 low-
lying states (including the X8.5 ground state) which were
assigned to the f10(5I)s subconfiguration and 6 excited states
with energies 17 600–22 400 cm�1 most of which could be
assigned to the f10(5I)d and f10(5I)p superconfigurations.
The Ligand field calculations were carried out by Carrete
and Hocquet,230 who considered all the f10(5I)s states with
the total statistical weight 130, and by Dulick et al.,247 who
did only the f10(5I)s states up to 10 000 cm�1 with Σp ¼ 74.
The results obtained by Dulick et al.247 were closer to
experimental data because of using the parameter G3 ¼300 cm�1 as compared with G3 ¼ 150 cm�1 used by Carrete
and Hocquet.230 The deviations were the largest for lower
states. That is why in Table 48 the estimated energies and
statistical weights for the unobserved states of the f10(5I)s
subconfiguration up to 10 000 cm�1 are taken from Dulick
et al.,247 and the data in the interval 10 000–15 000 cm�1 are
taken from Carrete and Hocquet,230 with corrections for
mean deviation. In Table 48 also the estimated statistical
weights for the f10(5SDFG)s states from 15 000 cm�1 are
given, for the remaining f10s states higher than 21 500 cm�1,
and for the f10](5I)d and f10(5I)p states assuming the energies
rticle is copyrighted as indicated in the article. Reuse of AIP content is sub
78.131.95.159 On: Sun,
of the lowest states at 12 500 and 18 500 cm�1, respectively,
and placing the other states of the f10nl configurations as in
case of the f10s configuration. The upper limit for all
configurations is assumed to be a sum of the dissociation
energy and the ionization potential, so that all the estimated
states are considered stable.
The derived standard entropy at room temperature is
S�ð298:15 KÞ ¼ ð244:590� 0:10Þ J K�1 mol�1
and the coefficients of the equations for the heat capacity are
C�p=ð J K�1 mol�1Þ ¼ 48:31232þ 76:8332 10�3ðT=KÞ
� 155:715 10�6ðT=KÞ2 þ 76:9567
10�9ðT=KÞ3 � 1:57926
106ðT=KÞ�2
for the 298.15–900 K range, and
C�p=ðJ K�1 mol�1Þ ¼ 43:11154� 5:49748 10�3ðT=KÞ
þ 3:07490 10�6ðT=KÞ2 � 0:350566
10�9ðT=KÞ3 þ 4:11955
106ðT=KÞ�2
for the 900–4000 K range.
4.12.2. Enthalpy of formation
The results for the enthalpy of formation of HoO(g) are
presented in Table 49. Ames et al.206 carried out Knudsen
effusion measurements of the weight loss of Ho2O3(cr). The
results of these measurements were treated in this work under
the assumption of congruent vaporization of Ho2O3(cr)
according to reaction
Ho2O3ðcrÞ ¼ 2HoOðgÞ þ OðgÞ;
J. Phys. Chem. Ref. Data, Vol. 43, No. 1, 2014ject to the terms at: http://scitation.aip.org/termsconditions. Downloaded to IP:
27 Apr 2014 17:09:58

TABLE 49. The enthalpy of formation of HoO(g), in kJ mol�1
Authors Methoda T/K Reaction ΔrH°(298.15 K) ΔfH°(298.15 K)
Ames et al.206 K 2487–2711 Ho2O3 ¼ 2HoO(g) þ O(g) 1988.4 �71.0
Murad and Hildenbrand260 M 1855–2178 Ho(g) þ TiO(g) ¼ HoO(g) þ Ti(g) 65.5 �57.8
Selected value: D0(HoO) ¼ 604.1 � 10 �57.8 � 10
aK ¼ Knudsen effusion; M ¼ mass spectrometry; T ¼ transpiration.
013101-48 KONINGS ET AL.
This a
neglecting the possible formation of Ho(g) atoms in the vapor
(see Sec. 4.1). The enthalpy of formation of HoO(g) so
calculated must be more negative than the correct value, the
degree of deviation being dependent on amount of Ho atoms in
vapors. Comparison with the results of Murad and Hilden-
brand260 confirms this conclusion. The selected value
DfH�ðHoO; g; 298:15 KÞ ¼ �ð57:8 � 10Þ kJmol�1
is taken as a rounded third-law value calculated from the latter
work. The selected enthalpy of formation corresponds to
D0(HoO) ¼ (604.1 � 10) kJ mol�1.
4.13. ErO(g)
4.13.1. Heat capacity and entropy
Thermal functions of ErO(g) in the standard state have been
calculated using themolecular constants presented inTable 50.
The electronic spectrum of ErO was investigated in emis-
sion and absorption by Kaledin and Shenyavskaya295 (see
Huber and Herzberg179 for references to earlier works). The
observed spectrum was highly complex. Only one rotational
band at 5066 Å, observed in emission and absorption, was
analyzed. It was supposed to be connected with the X8 ground
state of the f11(4I)s subconfiguration as predicted by Field.233
TABLE 50. Molecular constants of 166Er16O(g)
Te ωe ωexe Be αe103 De10
7
reNo. State cm�1 pm pi
0a X0� 0 849b 3.54b 0.359 1.9c 2.57d 179.4 1
1e 25 2
2e 95 2
3e 205 2
4e 350 2
5e 525 7
6e 730 4
7e 1030 6
8e 1550 4
9e 2100 2
10e 6115 14
11e 6920 14
12e 11 500 24
13e 15 700 50
14e 20 000 70
15e 25 000 80
16e 30 000 280
17e 35 000 370
18e 40 000 450
aExperimental state.bCalculated from ΔG1/2 = 841.5 cm�1 (see text) and the assumed dissociation
limit.cCalculated from the Kratzer relation.dCalculated from the Pekeris relation.eEstimated state.
J. Phys. Chem. Ref. Data, Vol. 43, No. 1, 2014rticle is copyrighted as indicated in the article. Reuse of AIP content is sub
78.131.95.159 On: Sun,
The values of the fundamental frequency of ErO were
measured in solid inert gas matrices by Weltner and De
Kock245 in Ar (829 cm�1), Willson and Andrews213 in Ar at
10 K (828.5 and 785.5 cm�1 for Er16O and Er18O, respec-
tively), and Willson et al.246 in Ar (828.5 cm�1). Taking into
account the matrix shift (13 cm�1), the value 841.5 cm�1 is
obtained for ΔG1/2 in the gas phase.
In the present work, the vibrational constants for ErO are
calculated from above mentioned value ΔG1/2 ¼ 841.5 cm�1
and the assumed value of the dissociation limit. Rotational
constants are calculated usingB0¼ 0.3583 cm�1 fromKaledin
and Shenyavskaya295 and the well known Pekeris and Kratzer
relations.
The molecular constants for all lanthanide monoxides were
calculated ab initio using pseudopotentials having the 4f
orbitals in the core by Dolg and Stoll193 and compared with
experimental data. Although there was no overall agreement
between calculated and experimental data in the LnO series,
the calculations indicated that the vibrational constants and
internuclear distances of the lanthanide monoxides in electro-
nic states of the same type of configurations changed very
regularly. The selected values for re (ErO) ¼ 179.4 pm and
ωe ¼ 849 cm�1 can be compared with re(DyO) ¼ 179.4 pm,
re(HoO)¼ 179.59 pm, andωe(DyO)= 849 cm�1 andωe(HoO)
¼ 848 cm�1.
According to Field,233 the ground state subconfiguration of
ErO is f11(4I)s and the ground state is X8. Dulick et al.247 and
Carrete andHocquet230 carried out the Ligand field calculation
of the subconfiguration f11(4I)s and confirmed the X0� ground
state. Carrete and Hocquet230 considered all the f11(4I)s states
(total statistical weight 104), while Dulick et al.247 gave only
states up to 10 000 cm�1 with Σp¼ 60. The results obtained by
Dulick et al.247 and andCarrete andHocquet230 were very close
for three lowest states. In the present work we use the estimated
energies of the f11(4I)s states as recommended by Carrete and
Hocquet.230 Table 50 presents also the estimated statistical
weights for the other f11s states (higher 17 000 cm�1), and for
the f11d, f11p, and f12 states (higher 13 000 cm�1, 20 000 cm�1,
and higher 40 000 cm�1, respectively).
The derived standard entropy at room temperature is
S�ð298:15 KÞ ¼ ð256:473� 0:10Þ J K�1 mol�1;
and the coefficients of the equations for the heat capacity are
C�p=ðJ K�1 mol�1Þ ¼ 43:23815� 4:71231 10�3ðT=KÞ
þ 0:571735 10�6ðT=KÞ2 þ 0:747515
10�9ðT=KÞ3 � 2:55285
105ðT=KÞ�2
for the 298.15–1300 K range, and
ject to the terms at: http://scitation.aip.org/termsconditions. Downloaded to IP:
27 Apr 2014 17:09:58

TABLE 51. The enthalpy of formation of ErO(g), in kJ mol�1
Authors Methoda T/K Reaction ΔrH°(298.15 K) ΔfH°(298.15 K)
Ames et al.206 K 2492–2687 Er2O3 ¼ 2ErO(g) þ O(g) 2017.1 �38.5
Murad and Hildenbrand260 M 1855–2165 Er(g) þ TiO(g) ¼ ErO(g) þ Ti(g) �76.8 �32.9
Selected value: D0(ErO) ¼ 593.7 � 8 �32.9 � 8
aK = Knudsen effusion; M = mass spectrometry.
THERMODYNAMIC PROPERTIES OF LANTHANIDE AND ACTINIDE OXIDE COMPOUNDS 013101-49
This a
C�p=ðJ K�1 mol�1Þ ¼ 33:60868þ 3:85434 10�3ðT=KÞ
� 0:382306 10�6ðT=KÞ2þ 0:0464068 10�9ðT=KÞ3 þ 2:52559
106ðT=KÞ�2
for the 1300–4000 K range.
TABLE 52. Molecular constants of 169Tm16O(g)
Te ωe ωexe Be αe103 De10
7
reNo. State cm�1 pm pi
0a X(3.5) 0 853.5b 4.24b 0.360 2.0c 2.56d 179.0 2
1e 24 2
2e 190 2
3e 320 2
4e 420 2
5e 510 2
6e 650 4
7e 860 2
8e 1670 2
9e 1910 2
10e 2560 4
11e 5230 4
12e 6490 14
13e 8100 14e
4.13.2. Enthalpy of formation
The results for the enthalpy of formation of ErO(g) are
presented in Table 51. Ames et al.206 carried out Knudsen
effusion measurement of weight loss for several Ln2O3(cr)
oxides. As in the case of Sm2O3(cr) and other lanthanide
oxides, results of these measurements were treated under
assumption of congruent vaporization of Er2O3(cr) according
to reaction
Er2O3ðcrÞ ¼ 2ErOðgÞ þ OðgÞ;neglecting the possibility of formation of Er(g) atoms in the
vapor. In case of considerable degree of ErO dissociation this
treatment will result in overestimated ErO stability. Mass
spectrometric measurements of isomolecular oxygen
exchange reaction have been carried out by Murad and Hil-
denbrand.260 Results of both papers do not differ significantly,
the enthalpy of formation of ErO(g) calculated from results of
Ames et al. being only 5 kJ mol�1 more negative than that
obtained from mass-spectrometric measurements of Murad
and Hildenbrand. This closeness demonstrates that Er(g) does
not predominate in the Er2O3(cr) vapor, in accordance with
mass-spectrometric data on ErO+/Er+ ratio.206
The selected value
DfH�ðErO; g; 298:15 KÞ ¼ �ð32:9� 8Þ kJmol�1
is taken as the rounded third-law value from thework ofMurad
and Hildenbrand.260 The selected enthalpy of formation cor-
responds to D0(ErO) ¼ (593.7 � 8) kJ mol�1.
14 8900 415e 10 050 4
16e 12 050 10
17e 13 180 8
18e 15 000 50
19e 20 000 700
20e 25 000 90
21e 30 000 100
22e 35 000 110
23e 40 000 130
aExperimental state.bEstimated (see text).cCalculated from the Pekeris relation.dCalculated from the Kratzer relation.eEstimated state.
4.14. TmO(g)
4.14.1. Heat capacity and entropy
The thermal functions of TmO(g) in the standard state have
been calculated using the molecular constants presented in
Table 52.
The spectrum of TmO was measured only by infrared
spectroscopy in solid inert gas matrices by Weltner and De
Kock245 andWillson et al.246 in Ar (832 cm�1) and byWillson
and Andrews213 in Ar at 10 K (832.0 cm�1 and 788.9 cm�1 for
Tm16O and Tm18O, respectively).
rticle is copyrighted as indicated in the article. Reuse of AIP content is sub
78.131.95.159 On: Sun,
The molecular constants for all lanthanide monoxides were
calculated ab initio by Dolg and Stoll193 and compared with
experimental data. Although there was no overall agreement
between calculated and experimental data in the LnO series
(see also Sec. 7.2.3), the calculations indicated that the vibra-
tional constants and internuclear distances of the lanthanide
monoxides in electronic states of the same type of configura-
tions changed very regularly. In the present workwe accept the
extrapolated value of re(TmO) ¼ 179.0 pm considering
re(HoO)¼ 179.59 pm and re(ErO) ¼ 179.4 pm. The accepted
value ΔG1/2 ¼ (845 � 5) cm�1 for TmO is estimated from the
matrix value 832 cm�1 taking into account matrix shift about
13 cm�1. From this value and the dissociation limit according
to Birge-Sponer extrapolation one gets ωe ¼ 853.5 cm�1 and
ωexe ¼ 4.24 cm�1 (compare ωe(HoO) ¼ 848 cm�1).
According to Field233 the ground state superconfiguration of
TmO is f12s. Dulick et al.247 and Carrete and Hocquet230
carried out the Ligand field calculation of the subconfiguration
4f12(3H)6s. Kotzian et al.197 calculated the 4f12(3H)6s and
some of the 4f12(3F)6s states using the Intermediate Neglect of
J. Phys. Chem. Ref. Data, Vol. 43, No. 1, 2014ject to the terms at: http://scitation.aip.org/termsconditions. Downloaded to IP:
27 Apr 2014 17:09:58

013101-50 KONINGS ET AL.
This a
Differential Overlap model (INDO/S-CL). There is even no
qualitative agreement between results of these calculations.
Moreover, the ground state from the Ligand field calculations
Ω ¼ 0.5 while from INDO/S-CL calculation Ω ¼ 3.5 (both
states were derived from the same 4f12(3H)6s subconfigura-
tion). However, for the calculation of the thermal function it
does not change much: both states have the same statistical
weight (pX ¼ 2). The most serious difference is in the
arrangement of the states, mainly the first excited states.
Kotzian et al.197 calculated the first excited state at 24 cm�1
whereas the Ligand field calculation gave 128 or 97 cm�1.
In the present work we accept the data obtained by Kotzian
et al.197 and add the estimations of the states f12d (according to
Kotzian et al.197 above 13 150 cm�1), f12p (higher
20 000 cm�1), and f13 (higher 40 000 cm�1).
The derived standard entropy at room temperature is
S�ð298:15 KÞ ¼ ð255:041� 0:15Þ J K�1 mol�1
and the coefficients of the equations for the heat capacity are
C�p=ð J K�1 mol�1Þ ¼ 37:63499þ 4:06981 10�3ðT=KÞ
� 2:78859 10�6ðT=KÞ2 þ 0:967411
10�9ðT=KÞ3 � 6:69507
104ðT=KÞ�2
for the 298.15–1700 K range, and
C�p=ðJ K�1 mol�1Þ ¼ 39:61651� 0:540323 10�3ðT=KÞ
þ 1:26385 10�6ðT=KÞ2 � 0:143823
10�9ðT=KÞ3 � 1:21233
106ðT=KÞ�2
for the 1700–4000 K range.
4.14.2. Enthalpy of formation
The results for the enthalpy of formation of TmO(g) are
presented in Table 53. Ames et al.206 carried out Knudsen
effusion measurement of weight loss for several Ln2O3(cr)
oxides. As in the case of Sm2O3(cr) and other lanthanide
oxides, the results of these measurements were treated under
assumption of congruent vaporization of Tm2O3(cr) according
to the reaction
Tm2O3ðcrÞ ¼ 2TmOðgÞ þ OðgÞ;neglecting possibility of formation of Tm(g) atoms in the
vapor. In case of considerable degree of TmO dissociation
this treatment will result in overestimated TmO stability.
TABLE 53. The enthalpy of formation of TmO(g), in kJ mol�1
Authors Methoda T/K
Ames et al.206 K 2450-2641 Tm
Murad and Hildenbrand260 M 2249-2364 TmO(
Selected value: D0(T
aK ¼ Knudsen effusion; M ¼ mass spectrometry.
J. Phys. Chem. Ref. Data, Vol. 43, No. 1, 2014rticle is copyrighted as indicated in the article. Reuse of AIP content is sub
78.131.95.159 On: Sun,
Mass spectrometric measurements of isomolecular oxygen
exchange reaction have been carried out by Murad and Hil-
denbrand.260 Results of both papers seriously differ, and the
enthalpy of formation of TmO(g) calculated from results of
Ames et al. is about 260 kJ mol�1 more negative than that
obtained from mass-spectrometric measurements by Murad
and Hildenbrand. This difference can be explained by a large
concentration of Tm atoms in the Tm2O3(cr) vapor in accor-
dance with mass-spectrometric data for the TmO+/Tm+
ratio.206
The selected value
DfH�ðTmO; g; 298:15 KÞ ¼ �ð13:6 � 8Þ kJmol�1
is taken as a rounded third-law value from the work of Murad
and Hildenbrand.260 The selected enthalpy of formation cor-
responds to D0(TmO) ¼ (492.7 � 8) kJ mol�1.
4.15. YbO(g)
4.15.1. Heat capacity and entropy
The thermal functions of YbO(g) in the standard state have
been calculated using the molecular constants presented in
Table 54.
The electronic spectrum of YbO was investigated in emis-
sion by Melville et al.296 and in laser excitation and fluores-
cence by McDonald et al.,297 Linton et al.,227 and Steimle
et al..298 The values of the fundamental frequency of YbO
were observed in solid inert gas matrices by Willson and
Andrews213 in Ar at 10 K (660.0 and 625.8 cm�1 for Yb16O
and Yb18O, respectively), and byWillson et al.246 in Ar (659.9
cm�1). Taking into account the matrix shift, the values
obtained in matrices are in agreement with the gas phase data.
Ab initio calculations for YbO carried out by Dolg and
Stoll,193 Dolg et al.,194 and Cao et al.195 revealed a marked
disagreement with each other and the experimental data. The
theoretical calculations performed by Liu et al.299 favored aΩ¼ 0+ ground state of a leading f14σ0 configuration (in agree-
ment with the interpretation of the experimental data) and
predicted the 5 low-lying f13s states.
The studies of the YbO electronic spectra revealed 7 low-
lying states including the X1Σ+ (f14) ground state, 5 of which
were assigned to the f13s and one to the f13d configurations, and
several excited states with energies 16 400–24 700 cm�1,
assigned to the f13d and f13p configurations of YbO and to the
f14sp5 and f14dp5 superconfigurations of Yb+O�. Ligand field
calculations byMcDonald et al.297 andCarrete andHocquet230
resulted in all the f13s states (the total statistical weight 28);
Dulick et al.247 obtained only the f13s states up to 10000 cm�1
Reaction ΔrH°(298.15 K) ΔfH°(298.15 K)
2O3(cr) ¼ 2TmO(g) þ O(g) 1597.1 �270.4
g) þ Al(g) ¼ Tm(g) þ AlO(g) �16.3 �13.6
mO) ¼ 492.7 � 8 �13.6 � 8
ject to the terms at: http://scitation.aip.org/termsconditions. Downloaded to IP:
27 Apr 2014 17:09:58

TABLE 54. Molecular constants of 174Yb16O(g)
Te ωe ωexe Be αe103 De10
7
reNo. State cm�1 pm pi
0a X1Σ+ 0 689.9b 3.49b 0.352431 4.2 3.68c 180.7 1
1a (2)0� 839 832d 3.4d 0.355 1.9 2.6d 180.1 1
2a (1)1 944 2
3a (1)2 2337 2
4a (2)2 2631 2
5a (1)3 4216 2
6a (3)0+ 4566 1
7e 1557 1
8e 5000 12
9e 7500 16
10e 10 000 24
11e 15 000 40
12e 20 000 50
13e 25 000 55
14e 30 000 44
15e 35 000 35
16e 40 000 35
aExperimental state.bCalculated from ΔG1/2 ¼ 683.107 cm�1 given by Linton et al.227 and the
assumed dissociation limit.cCalculated from the Pekeris relation.dCalculated from the Kratzer relation.eEstimated state.
THERMODYNAMIC PROPERTIES OF LANTHANIDE AND ACTINIDE OXIDE COMPOUNDS 013101-51
This a
with Σp ¼ 17. The data obtained by McDonald et al.297 are
presented in Table 54; they were closer to the experimental
data because of the use of adjustable parameters. In Table 54
also the estimated statistical weights for the f13d states from the
first observed (4637 cm�1) are presented, as well as for the f13p
states (higher than 19000 cm�1), and for the Yb+O� states
assuming the energies of the lowest state at 15000 cm�1.
The widths of configurations are estimated from the YbIII
spectrum.
The accepted molecular constants for the X1Σ+ state are
derived from the high-resolution spectral data: the rotational
constants from the data obtained by Melville et al.,296 the
vibrational constants (ΔG1/2) from the data obtained by Linton
et al.227 The vibrational levels of the X1Σ+ state were recordedin the latter work in the fluorescence spectrum up to v¼ 8, but
with low accuracy (6 cm�1). Moreover the ground state was
perturbed in the region near v¼ 4. Themolecular constants for
low-lying states are also estimated from the low-resolution
fluorescence spectral data. They are typical for the f N�1s states
of all lanthanidemonoxides, and in the present workwe use the
average values. It should be noted that the ground state is the
unique state of the f 14 configuration. The constants for this
state differ considerably from those for the other states. The
low-lying f 13s states have practically identical potential curves
TABLE 55. The enthalpy of formation of YbO(g), in kJ mol�1
Authors Methoda T/K
Yokozeki and Menzinger300 C b Yb(g
Cosmovici et al.301 MB b Yb(g
Selected value: D0(Y
aC ¼ chemiluminiscence; MB ¼ crossed molecular beam.bNot specified.
rticle is copyrighted as indicated in the article. Reuse of AIP content is sub
78.131.95.159 On: Sun,
and therefore the samemolecular constants (ΔG1/2 ≈ 825 cm�1
and re ≈ 180.0 pm). The X1Σ+ state does not correlate with
the Yb and O atoms in their ground states: 1Sg +3Pg give only
triplet states 3Π and 3Σ�. However, the components 0+ of the3Π and 3Σ� states should affect the X1Σ+ state, and because ofthe noncrossing rule the ground state should converge to the1Sg +
3Pg limit. The numerous f13s states (Σp ¼ 28) obviously
have a higher dissociation limit. In the presentworkwe assume
the 3Puþ3Pg limit lying at 17 288 cm�1 above the dissociation
limit to normal atoms.
The derived standard entropy at room temperature is
S�ð298:15 KÞ ¼ ð238:521� 0:10Þ J K�1 mol�1
and the coefficients of the equations for the heat capacity are
C�p=ðJ K�1 mol�1Þ ¼ 37:70801þ 48:5496 10�3ðT=KÞ
� 68:4668 10�6ðT=KÞ2 þ 30:5227
10�9ðT=KÞ3 � 7:73176
105ðT=KÞ�2
for the 298.15–1000 K range, and
C�p=ðJ K�1 mol�1Þ ¼ 32:77497þ 17:3649 10�3ðT=KÞ
� 5:08804 10�6ðT=KÞ2 þ 0:503717
10�9ðT=KÞ3 þ 1:98479
106ðT=KÞ�2
for the 1000–4000 K range.
4.15.2. Enthalpy of formation
There are nomeasurements of gas phase equilibria to derive
the enthalpy of formation of YbO(g), due to very low con-
centration ofYbO(g) in the high-temperature systems.A lower
limit estimate of the YbO dissociation energy (see Table 55)
was obtained by Yokozeki and Menzinger300 from the short
wavelength chemiluminescence cutoffs in the Yb + O3 beam-
gas experiment:D0(YbO) > (394.1� 6.3) kJ mol�1. The value
D0(YbO) ¼ (413.8 � 4.8) kJ mol�1 was found by crossing a
thermal beam of Yb atoms with a supersonic seeded beam of
He + O2 by Cosmovici et al.301 As selected value we take the
rounded result (414.0 � 10) kJ mol�1 with increased uncer-
tainty (Table 55), reflecting possible experimental errors in the
work of Cosmovici et al.301 The selected dissociation energy
of YbO molecule corresponds to:
DfH�ðYbO; g; 298:15 KÞ ¼ �ð16 � 10Þ kJmol�1
Reaction ΔrH°(298.15 K) ΔfH°(298.15 K)
) þ O3(g) ¼ YbO(g) þ O2(g) > 394.1 � 6.3 < 3.9 � 6.3
) þ O2(g) ¼ YbO(g) þ O(g) 413.8 � 4.8 �16.2 � 10
bO) = 414 � 10 �16 � 10
J. Phys. Chem. Ref. Data, Vol. 43, No. 1, 2014ject to the terms at: http://scitation.aip.org/termsconditions. Downloaded to IP:
27 Apr 2014 17:09:58

TABLE 56. Molecular constants of 175Lu16O(g)
Te ωe ωexe Be αe103 De10
7
reNo State cm�1 pm pi
0a X2Σ+ 0 844.5 3.1 0.35894 1.76 2.78b 179.0 2
1a A2Π1/2 19 392 2
2a A2Π3/2 21 470 2
3a 4Π ? c 19 520 8
4a B2Σ+ 24 440 2
5d 14 100 2
6d 15 300 2
7d 21 000 8
8d 23 700 8
9d 27 000 12
10d 31 000 4
11d 40 000 20
aExperimental state.bD0.cUnknown upper state in of the transition band at 5120 Å.dEstimated state.
013101-52 KONINGS ET AL.
This a
4.16. LuO(g)
4.16.1. Heat capacity and entropy
The thermal functions of LuO(g) in the standard state have
been calculated using the molecular constants presented in
Table 56.
Three electronic transitions A2Π1/2-X2Σ+, A2Π3/2-X
2Σ+, andB2Σ+-X2Σ+ were analyzed in the emission spectrum of LuO.
Huber and Herzberg179 reviewed the spectral data on LuO
published till 1975. Later Bernard and Effantin302 reanalyzed
the known systems and found a newband at 5120Å, which alsowas connectedwith the transition to the ground state. These are
slightly different from values derived from the recent mea-
surements of the pure rotational spectrum of 175Lu16O in its
ground electronic state (X2Σ+) by Cooke et al.,303 which werepublished after our analysis was completed. All the upper
states of the transitions were perturbed that indicates many
unobserved states. The values of the fundamental frequency of
LuO were measured in solid inert gas matrices byWillson and
Andrews213 in Ar (829.3 cm�1 and 786.2 cm�1 for Lu16O and
Lu18O, respectively) and byWeltner andDeKock245 inAr and
Ne (825 and 836 cm�1, respectively). Taking into account the
matrix shift, the values of the fundamental frequency of LuO
obtained in matrices are in agreement with the gas phase data.
Ab initio calculations for the ground state of LuO carried out
by Hong et al.,192 Wang and Schwarz,304 K€uchle et al.,305
Dolg and Stoll,193 Dolg et al.,194 and Cao et al.,195 are in
agreement with the experimental data. Kotzian et al.197 cal-
culated the excited states using the INDOmodel. According to
this calculation, all the states below 45 000 cm�1 arise from
TABLE 57. The enthalpy of formation of LuO(g), in kJ mol�1
Authors Methoda T/K
Ames et al.206 K 2615–2700 Lu
M 2080–2214 Lu(g)
Murad and Hildenbrand260 M 1782–1927 Lu(g
Selected value: D0(L
aK ¼ Knudsen effusion; M ¼ mass spectrometry.
J. Phys. Chem. Ref. Data, Vol. 43, No. 1, 2014rticle is copyrighted as indicated in the article. Reuse of AIP content is sub
78.131.95.159 On: Sun,
superconfigurations 5d (A′2Δ,A2Π, andB2Σ+), 6p (2Π and 2Σ+),and 6s (X2Σ+), while the 4f13 states have energies much higher
(100 000 cm�1). These results could not explain either the
upper state of the band 5120Å, or numerous perturbations. The
electronic structures of LaO andLuOare similar. In the present
work the upper state of the band 5120 Å is interpreted as the
lowest component of quartet states, found by Schampsand
et al.198 for LaO. The estimates of the excited states are based
on the above mentioned data.
The accepted molecular constants for the X2Σ+ state are
taken from the work by Bernard and Effantin.302
The derived standard entropy at room temperature is
S�ð298:15 KÞ ¼ ð242:089� 0:03Þ J K�1 mol�1
and the coefficients of the equations for the heat capacity are
C�p=ðJ K�1 mol�1Þ ¼ 28:20132þ 20:4184 10�3ðT=KÞ
� 16:5159 10�6ðT=KÞ2
þ 4:71909 10�9ðT=KÞ3
� 1:19650 105ðT=KÞ�2
for the 298.15–1300 K range, and
C�p=ðJ K�1 mol�1Þ ¼ 40:19679� 0:758989 10�3ðT=KÞ
� 0:623484 10�6ðT=KÞ2 þ 0:273798
10�9ðT=KÞ3 � 2:75040
106ðT=KÞ�2
for the 1300–4000 K range.
4.16.2. Enthalpy of formation
The results for the enthalpy of formation of LuO(g) are
presented in Table 57. Experimental data used in calculations
consist of Knudsen effusion206 and mass spectrometric mea-
surements of isomolecular oxygen exchange reactions.206,260
The results of all measurements are in fair agreement. At the
same time, mass-spectrometric results are more reliable in
comparison with the KE data, because interpretation of Knud-
sen effusion data is not unambiguous (see Sec. 4.1).Among the
mass-spectrometric data, the results of Murad and Hilden-
brand260 are preferred. Absence of primary experimental data
makes it difficult to recalculate results of mass-spectrometric
measurements of Ames et al.206
The selected enthalpy of formation of LuO(g) is taken as the
rounded value from the paper by Murad and Hildenbrand260:
DfH�ðLuO; g; 298:15 KÞ ¼ �ð3:4 � 10Þ kJmol�1:
Reaction ΔrH°(298.15 K) ΔfH°(298.15 K)
2O3(cr) ¼ 2LuO(g) þ O(g) 2150.4 11.5
þ LaO(g) ¼ LuO(g) þ La(g) 117.3 �5.8
) þ YO(g) ¼ LuO(g) þ Y(g) 45.1 3.4
uO) ¼ 758.9 � 10 3.4 � 10
ject to the terms at: http://scitation.aip.org/termsconditions. Downloaded to IP:
27 Apr 2014 17:09:58

TABLE 58. Temperature of melting of thorium dioxide
Tfus/K
THERMODYNAMIC PROPERTIES OF LANTHANIDE AND ACTINIDE OXIDE COMPOUNDS 013101-53
This a
The selected enthalpy of formation corresponds to D0(LuO)
¼ (673.6 � 10) kJ mol�1.
Authors Reported ITS-90
Ruff et al.308 3323
Wartenberg and Reusch309 3803
Geach and Harper310 3323 � 25 3328 � 25
Lambertson et al.311 3573 � 100 3578 � 100
Benz312 3663 � 100 3668 � 100
Chikalla et al.107 3573 3572
Sibieude and Foex313 3473 3472
Ronchi and Hiernaut307 3651 � 17 3651 � 17
Manara et al.52 3620 3620
Selected value: 3651 � 17
5. The Actinide Oxides in Solidand Liquid State
5.1. Ac2O3(cr,l)
5.1.1. Polymorphism and melting point
Actinium sesquioxide has an A-type hexagonal sesquioxide
structure (space group P3m1) at room temperature. Similar to
the isostructural A-type lanthanide sesquioxides, high tem-
perature transformations to theH- andX-type structures can be
expected, but no experimental information exists. Considering
the fact that Ac3+ has an ionic radius somewhat larger than
La3+, the transition temperatures are estimated to be slightly
lower than those in La2O3, i.e., A → H at about 2300 K and
H→ X around 2370 K. Similarly, the melting point of Ac2O3
is estimated to be about 2600 K.
5.1.2. Heat capacity and entropy
The standard entropy of Ac2O3 has been estimated from the
trends in the lanthanide and actinide compounds as
S�ð298:15 KÞ ¼ ð138:3� 5:0Þ J K�1 mol�1
according to the method proposed by Konings et al.127 This is
slightly lower than the value suggested by Konings et al.306
which did not take into account the structural discontinuity in
the Ln2O3 series, as evidenced by the data for monoclinic
Gd2O3.
90
100
.15
K)
)
5.1.3. Enthalpy of formation
The enthalpy of formation of Ac2O3 was estimated by
Konings et al.306 from the enthalpy of the idealised dissolution
reaction:
An2O3ðcrÞ þ 6HþðaqÞ ¼ 2An3þðaqÞ þ 3H2OðlÞrelating the quantity {ΔfH°(MO1.5) – ΔfH°(M
3+} to the molar
volume. They thus obtained
DfH�ð298:15 KÞ ¼ �ð1107� 15Þ kJmol�1
0 500 1000 1500 2000 2500 3000 3500
T/K
50
60
70
80
Ho (
T)-
Ho (
298
(T -
298
.15
FIG. 15. The reduced enthalpy increment (in J K�1 mol�1) of ThO2;�, Jaegerand Veenstra317; ~, Southard318; &, Hoch and Johnston319; * Pears et al.58;
^, Victor and Douglas320; �, Springer et al.321; 5, Fischer et al.323; (,
Agarwal et al.324; � Dash et al.325; �, Osborne and Westrum Jr.314; the curve
shows the recommended equation.
5.2. ThO2(cr,l)
5.2.1. Melting point
ThO2 has a fluorite crystal structure (space group Fm3m),
which is stable up to the melting point. The melting point of
ThO2 has been measured by several authors, as summarized in
Table 58. The reported values vary from T ¼ 3323 K to T
¼ 3808 K, but the more recent ones agree on a melting point
around T ¼ 3600 K. We here consider the value measured by
Ronchi and Hiernaut,307 Tfus ¼ (3651 � 17) K, as the most
rticle is copyrighted as indicated in the article. Reuse of AIP content is sub
78.131.95.159 On: Sun,
accurate one as it was determined on awell-defined sample (O/
Th ratio ¼ 2.00) and with a well-defined technique.
5.2.2. Heat capacity and entropy
The low-temperature heat capacity of ThO2 has been mea-
sured by Osborne and Westrum Jr.314 These measurements
were used in the CODATA Key Values selection,315 and
selected here without change:
S�ð298:15 KÞ ¼ ð65:23� 0:20Þ J K�1 mol�1:
Magnani et al.316 reported heat capacity data that are in good
agreement, but the numerical details of this measurement are
not published and the analytical technique is less accurate.
The high-temperature enthalpy increment of ThO2 has been
measured by Jaeger and Veenstra,317 Southard,318 Hoch and
Johnston,319 Victor and Douglas,320 Pears et al.,58 Springer
et al.,321 Springer and Langedrost,322 Fischer et al.,323,324 and
Dash et al.325 The data cover the temperature range from500 to
3400 K as shown in Fig. 15. Up to 2500 K the results are in fair
agreement, except in the low-temperature region where the
data of Victor and Douglas320 and Springer et al.321 deviate
significantly due to small inaccuracies in temperature or
enthalpy that become prominent close to 298.15 Kwhen using
the fH�ðTÞ � H�ð298:15 KÞg=ðT� 298:15Þ function. The
data listed by Springer et al. have been corrected for obvious
typographical errors. The results of Pears et al.58 are very
scattered and are evidently not accurate enough. Direct heat
J. Phys. Chem. Ref. Data, Vol. 43, No. 1, 2014ject to the terms at: http://scitation.aip.org/termsconditions. Downloaded to IP:
27 Apr 2014 17:09:58

0 500 1000 1500 2000 2500 3000 3500
T/K
50
100
150
200C
p(T
)/J
K-1
mol
-1
FIG. 16. The heat capacity (in J K�1 mol�1) of ThO2; �, Ronchi andHiernaut307; & Dash et al.325; the curve shows the recommended equation.
Note that the data of Ronchi and Hiernaut307 indicate a value of about 600 J
K�1 mol�1 (not shown in the graph) at the maximum of the anomalie.
013101-54 KONINGS ET AL.
This a
capacity measurements of ThO2 have been reported by Dash
et al.,325 in good agreement with the enthalpy measurements
(Fig. 16).
Above T ¼ 2500 K, ThO2 exhibits an excess enthalpy, like
many high-melting refractory oxides (e.g., UO2, PuO2, and
ZrO2). Fischer et al.323 suggested that this effect is due to a
phase transformation and this possibility was studied in detail
by Ronchi and Hiernaut307 using a thermal arrest technique.
From their results, Ronchi and Hiernaut concluded that a
premelting transition occurs at 3090 K, which was attributed
to order-disorder anion displacements in the oxygen sublattice
(Frenkel defects).
For the recommended heat capacity equation the results of
Southard,318 Hoch and Johnston319 and Fischer et al.323 have
been combined and fitted to the equation (298.15– 3500 K):
C�p=ðJ K�1 mol�1Þ ¼ 55:9620þ 51:2579 10�3ðT=KÞ
� 36:8022 10�6ðT=KÞ2
þ 9:2245 10�9ðT=KÞ3
� 5:740310 105ðT=KÞ�2
constrained to C�p(298.15 K) ¼ 61.76 J K�1 mol�1, as derived
from the low-temperature heat capacity measurements by
Osborne andWestrum Jr.314 TheC�p derived from this function,
of course, does not reproduce the heat capacity data by
Ronchi and Hiernaut307 around the order-disorder transition
(see Fig. 16), with a maximum value of 600 J K�1 mol�1(not
shown in the figure).
No experimental data are available for liquid thorium
dioxide. Fink et al.326 estimated C�p(liq)¼ 61.76 J K�1 mol�1,
which is adopted here as
C�pðThO2; liq;TÞ ¼ 61:8 JK�1 mol�1:
The entropy of fusion is assumed to be identical to that of UO2
(24 J K�1 mol�1), yielding
D fusH� ¼ ð88� 6Þ kJmol�1:
5.2.3. Enthalpy of formation
The enthalpy of formation of ThO2 is a CODATA Key
Value for Thermodynamics,315 and is based on the enthalpy of
J. Phys. Chem. Ref. Data, Vol. 43, No. 1, 2014rticle is copyrighted as indicated in the article. Reuse of AIP content is sub
78.131.95.159 On: Sun,
combustion of thorium metal by Huber Jr. et al.:327
DfH�ð298:15 KÞ ¼ �ð1226:4 � 3:5Þ kJmol�1:
Earlier measurements by Roth and Becker328 gave �(1226
� 5) kJ mol�1, which is in good agreement with the selected
value.
5.3. PaO2(cr,l)
5.3.1. Melting point
PaO2 has a fluorite crystal structure (space group Fm3m).
No information exists about the high temperature behavior
of PaO2, but it can be presumed that it is similar to the
neighboring ThO2 and UO2 compounds, i.e. the fluorite
structure is stable up to the melting. The melting point of
PaO2 is estimated from the trend in the actinide dioxide
series, as discussed in Sec. 7.2.2, and we estimate Tfus ¼(3200 � 60) K.
5.3.2. Heat capacity and entropy
The standard entropy of PaO2 was estimated by Konings329
from the trends in actinide dioxide series:
S�ð298:15 KÞ ¼ ð81:1� 5:0Þ J K�1 mol�1:
The high temperature heat capacity of PaO2 has been estimated
as
C�pðTÞ=ðJ K�1 mol�1Þ ¼ 58:0078þ 50:9087 10�3ðT=KÞ
� 35:9277 10�6ðT=KÞ2 þ 9:5704
10�9ðT=KÞ3 � 0:51080
106ðT=KÞ�2
using the approach outlined in Konings and Beneš330.
5.3.3. Enthalpy of formation
The enthalpy of formation of PaO2 was estimated by
Konings et al.306 from the enthalpy of the idealised dissolution
reaction:
AnO2 þ 4HþðaqÞ ¼ An4þðaqÞ þ 2H2OðlÞrelating this quantity to the molar volume. They thus obtained
DfH�ð298:15 KÞ ¼ �ð1107 � 15Þ kJmol�1:
5.4. γ-UO3
5.4.1. Polymorphism
γ-UO3 is one of the many crystallographic modifications of
UO3, but probably the thermodynamic stable one above room
temperature.331,332 It has an orthorhombic cell (space group
Fddd) at 298.15 K. It transforms at373 K to a closely related
tetragonal structure (space group I41/amd).
ject to the terms at: http://scitation.aip.org/termsconditions. Downloaded to IP:
27 Apr 2014 17:09:58
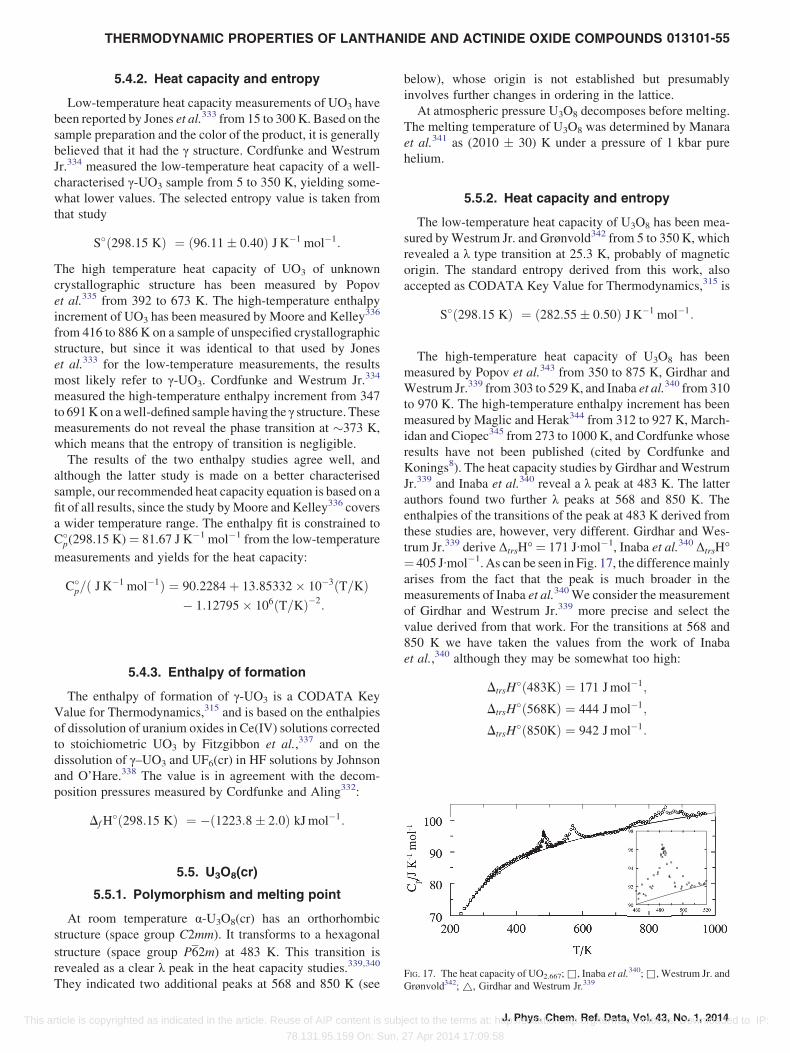
THERMODYNAMIC PROPERTIES OF LANTHANIDE AND ACTINIDE OXIDE COMPOUNDS 013101-55
This a
5.4.2. Heat capacity and entropy
Low-temperature heat capacity measurements of UO3 have
been reported by Jones et al.333 from 15 to 300 K. Based on the
sample preparation and the color of the product, it is generally
believed that it had the γ structure. Cordfunke and Westrum
Jr.334 measured the low-temperature heat capacity of a well-
characterised γ-UO3 sample from 5 to 350 K, yielding some-
what lower values. The selected entropy value is taken from
that study
S�ð298:15 KÞ ¼ ð96:11� 0:40Þ J K�1 mol�1:
The high temperature heat capacity of UO3 of unknown
crystallographic structure has been measured by Popov
et al.335 from 392 to 673 K. The high-temperature enthalpy
increment of UO3 has been measured by Moore and Kelley336
from 416 to 886 K on a sample of unspecified crystallographic
structure, but since it was identical to that used by Jones
et al.333 for the low-temperature measurements, the results
most likely refer to γ-UO3. Cordfunke and Westrum Jr.334
measured the high-temperature enthalpy increment from 347
to 691Kon awell-defined sample having the γ structure. Thesemeasurements do not reveal the phase transition at 373 K,
which means that the entropy of transition is negligible.
The results of the two enthalpy studies agree well, and
although the latter study is made on a better characterised
sample, our recommended heat capacity equation is based on a
fit of all results, since the study byMoore and Kelley336 covers
a wider temperature range. The enthalpy fit is constrained to
C�p(298.15 K)¼ 81.67 J K�1 mol�1 from the low-temperature
measurements and yields for the heat capacity:
C�p=ð J K�1 mol�1Þ ¼ 90:2284þ 13:85332 10�3ðT=KÞ
� 1:12795 106ðT=KÞ�2:
5.4.3. Enthalpy of formation
The enthalpy of formation of γ-UO3 is a CODATA Key
Value for Thermodynamics,315 and is based on the enthalpies
of dissolution of uranium oxides in Ce(IV) solutions corrected
to stoichiometric UO3 by Fitzgibbon et al.,337 and on the
dissolution of γ–UO3 and UF6(cr) in HF solutions by Johnson
and O’Hare.338 The value is in agreement with the decom-
position pressures measured by Cordfunke and Aling332:
DfH�ð298:15 KÞ ¼ �ð1223:8� 2:0Þ kJmol�1:
FIG. 17. The heat capacity of UO2.667;&, Inaba et al.340;&, Westrum Jr. and
Grønvold342; ~, Girdhar and Westrum Jr.339
5.5. U3O8(cr)
5.5.1. Polymorphism and melting point
At room temperature α-U3O8(cr) has an orthorhombic
structure (space group C2mm). It transforms to a hexagonal
structure (space group P62m) at 483 K. This transition is
revealed as a clear λ peak in the heat capacity studies.339,340
They indicated two additional peaks at 568 and 850 K (see
rticle is copyrighted as indicated in the article. Reuse of AIP content is sub
78.131.95.159 On: Sun,
below), whose origin is not established but presumably
involves further changes in ordering in the lattice.
At atmospheric pressure U3O8 decomposes before melting.
The melting temperature of U3O8 was determined by Manara
et al.341 as (2010 � 30) K under a pressure of 1 kbar pure
helium.
5.5.2. Heat capacity and entropy
The low-temperature heat capacity of U3O8 has been mea-
sured byWestrum Jr. and Grønvold342 from 5 to 350 K, which
revealed a λ type transition at 25.3 K, probably of magnetic
origin. The standard entropy derived from this work, also
accepted as CODATA Key Value for Thermodynamics,315 is
S�ð298:15 KÞ ¼ ð282:55� 0:50Þ J K�1 mol�1:
The high-temperature heat capacity of U3O8 has been
measured by Popov et al.343 from 350 to 875 K, Girdhar and
Westrum Jr.339 from 303 to 529K, and Inaba et al.340 from 310
to 970 K. The high-temperature enthalpy increment has been
measured by Maglic and Herak344 from 312 to 927 K, March-
idan and Ciopec345 from 273 to 1000 K, and Cordfunke whose
results have not been published (cited by Cordfunke and
Konings8). The heat capacity studies by Girdhar andWestrum
Jr.339 and Inaba et al.340 reveal a λ peak at 483 K. The latter
authors found two further λ peaks at 568 and 850 K. The
enthalpies of the transitions of the peak at 483 K derived from
these studies are, however, very different. Girdhar and Wes-
trum Jr.339 derive ΔtrsH°¼ 171 J·mol�1, Inaba et al.340 ΔtrsH°¼ 405 J·mol�1. As can be seen in Fig. 17, the differencemainly
arises from the fact that the peak is much broader in the
measurements of Inaba et al.340We consider the measurement
of Girdhar and Westrum Jr.339 more precise and select the
value derived from that work. For the transitions at 568 and
850 K we have taken the values from the work of Inaba
et al.,340 although they may be somewhat too high:
DtrsH�ð483KÞ ¼ 171 Jmol�1;
DtrsH�ð568KÞ ¼ 444 Jmol�1;
DtrsH�ð850KÞ ¼ 942 Jmol�1:
J. Phys. Chem. Ref. Data, Vol. 43, No. 1, 2014ject to the terms at: http://scitation.aip.org/termsconditions. Downloaded to IP:
27 Apr 2014 17:09:58

013101-56 KONINGS ET AL.
This a
The transitions are not detected in the enthalpy drop studies
since these enthalpy effects are too small.
The experimental studies indicate that the baseline heat
capacity of the three phases can be represented by a single
curve as a function of temperature. The selected heat capacity
curve is taken from Cordfunke and Konings8 which includes
unpublished results by Cordfunke. It is subject to the con-
straint of C�p(298.15 K) ¼ 237.94 J K�1 mol�1, as given by
Westrum Jr. and Grønvold342:
C�p=ðJ K�1 mol�1Þ ¼ 279:267þ 27:480 10�3ðT=KÞ
� 4:3116 106ðT=KÞ2:It is recommended to use this equation in combination with the
transition enthalpies.
5.5.3. Enthalpy of formation
The enthalpy of formation of U3O8 is a CODATA Key
Value for Thermodynamics,315 and is based on the enthalpy of
combustion of uranium measured by Huber and Holley Jr.346:
DfH�ð298:15 KÞ ¼ �ð3574:8� 2:5Þ kJmol�1:
This value is in close agreement with, but more precise than
earlier values by Huber Jr. and Holley Jr.98 and Popov and
Ivanov.347
5.6. U4O9(cr)
5.6.1. Polymorphism
U4O9, which has a stability range between 2.234 < O/U
< 2.245, has three polymorphic modifications. The α form
has probably a rhombohedrally distorted fluorite structure.
At 348 K it transforms into the β modification which has a
body-centered cubic (space group I43d). This temperature is
the maximum of the λ peak in the heat capacity measured
by Westrum Jr. et al.348 and Grønvold et al.349 Inaba and
Naito350 and Naito et al.351 found that the temperature of this
transition slightly increases with decreasing O/U ratio of the
sample.
The βmodification transforms to γ-U4O9 at about 893 K, as
derived from electrical conductivity and X-ray diffraction
measurements by Inaba and Naito.350 The structure of this
phase is not known. A disordered UO2.25 phase is stable
above 1400 K.352 Essentially this may be regarded as an
order-disorder transformation at a fixed composition,
although strictly it is peritectoid decomposition from U4O9
(ordered) to UO2+x (disordered, x 0.25) and a small amount
of U3O8�y.
5.6.2. Heat capacity and entropy
The low-temperature heat capacity of U4O9 has been mea-
sured by Osborne et al.353 from 5 to 310 K, by Westrum Jr.
et al.348 from 190 to 399 K, and Flotow et al.354 from 1.6 to
24 K. The results are in good agreement. The standard entropy
J. Phys. Chem. Ref. Data, Vol. 43, No. 1, 2014rticle is copyrighted as indicated in the article. Reuse of AIP content is sub
78.131.95.159 On: Sun,
derived from these measurements is354
S�ð298:15 KÞ ¼ ð334:1� 0:7Þ J K�1 mol�1:
In addition to the results of Westrum Jr. et al.,348 which
extend to 399 K, three more high-temperature heat capacity
studies have been reported. Gotoo and Naito355 reported
measurements from 297 to 515 K, Grønvold et al.349 from
303 to 997 K, and Inaba and Naito350 from 190 to 470 K.
MacLeod352 measured the enthalpy increments of U4O9 from
845 to 1568 K. The heat capacity studies show that the α→ βtransition is associated with a strong λ-type peak. The β → γtransition is only evident from a spread in the C�
p results of
Grønvold et al.349We have selected the heat capacity equation
given by Cordfunke and Konings,8 which describes the three
phases with one polynomial, treating the λ transition as an
enthalpy discontinuity only
C�p=ðJ K�1 mol�1Þ ¼ 319:163þ 49:691 10�3ðT=KÞ
� 3:9602 106ðT=KÞ�2:
MacLeod352 has analysed the integrated enthalpy for the
α → β transition as ΔtrsH°(α-β) ¼ 2594 J·mol�1. The β to γtransition has been assumed to have a negligible associated
enthalpy. Although MacLeod analysed his data to suggest
ΔtrsH°(1395 to 1405 K) ¼ 9.372 kJ mol�1, this calculation
seems to be in error - the enthalpy difference between the
disorderedUO2 + x and the γ-phase at 1400K, fromEqs. (5) and
(6) is in fact 11.90 kJ mol�1.
5.6.3. Enthalpy of formation
The selected enthalpy of formation of U4O9 is
DfH�ð298:15 KÞ ¼ �ð4512 � 7Þ kJmol�1
based on the enthalpies of solution of UO2, U4O9 and γ-UO3 in
aqueous Ce(IV) solutions measured by Fitzgibbon et al.337
This value is supported by the less precisework of Burdese and
Abbatista356 using dissolution in nitric acid.
5.7. UO2(cr,l)
5.7.1. Melting point
UO2 has a fluorite crystal structure (space group Fm3m),
which is stable up to the melting point. The reported melting
temperatures are listed in Table 59, which shows considerable
variation. This is due to the fact that deviations from stoichio-
metry and the relatively high vapor pressure have significant
effects, in addition to interactions of liquid with the container
material. We select the value Tfus¼ (3130� 20) K. The exact
congruent melting composition at atmospheric pressure is still
controversial. Most probably, it lies between UO1.98 and
UO2.00.357,358
ject to the terms at: http://scitation.aip.org/termsconditions. Downloaded to IP:
27 Apr 2014 17:09:58

0 500 1000 1500 2000 2500 3000
T/K
50
100
150
200
Cp(
T)/
J K
-1 m
ol-1
FIG. 19. The heat capacity of UO2; ○, Ronchi et al.380;&, Grønvold et al.349;
~ Amaya et al.381; 5, Popov et al.335;◊, Hunzicker and Westrum Jr.373; (,Inaba et al.382; the curve shows the recommended equation.
TABLE 59. Temperature of melting of uranium dioxide
Tfus/K
Authors Reported ITS-90
Ackermann359 2680 � 19
Lambertson and Handwerk360 3323 � 20
Wisnyi and Pijanowski361 3033 � 30
Ehlert and Margrave362 3133 � 45
Pijanowski and DeLuca363 3033 � 30 3050 � 30
Chikalla364 3003 � 30
Lyon and Bailey365 3046 � 21
Hausner366 3078 � 15
Lyon and Bailey367 3113 � 20
Latta and Fryxell368 3138 � 15 3142 � 15
Tachibana et al.369 3118 � 25 3120 � 25
Ronchi and Sheindlin370 3110 � 10 3110 � 10
Manara et al.371 3147 � 20 3147 � 20
Kato et al.372 3123 3123
Selected value: 3130 � 20
THERMODYNAMIC PROPERTIES OF LANTHANIDE AND ACTINIDE OXIDE COMPOUNDS 013101-57
This a
5.7.2. Heat capacity and entropy
The low-temperature heat capacity of UO2 has been mea-
sured by Jones et al.333 from 15 to 300 K and Hunzicker and
Westrum Jr.373 from 5 to 330 K. These measurements reveal a
transition at 30.4 K from a low-temperature antiferromagnetic
state to a high-temperature paramagnetic state. The selected
standard entropy is the CODATA Key Value,315 which is
solely based on the results of Hunzicker and Westrum Jr.373
that refer to a better characterised sample:
S�ð298:15 KÞ ¼ ð77:03� 0:20Þ J K�1 mol�1:
The high-temperature data for UO2 extend into the liquid
range (up to 8000 K) and have been obtained as heat capa-
city335,349,379–387 and enthalpy increment values.336,374–
378,388–390 The results are shown in Figs. 18 and 19. There is
in general good agreement between the different studies, with
exception of the early heat capacity measurements.335,383–385
It is nowwell established that the heat capacity of UO2 shows
an anomalous increase above 1800 K. Neutron scattering mea-
surements by Hutchings391,392 and Clausen et al.393 reveal that
thermally induced disorder as a results of Frenkel pair formation
on theoxygen latticeoccurs at temperaturesabove2000K.These
studies also showed that excitation of the electronic levels ofU4+
0 500 1000 1500 2000 2500 3000
T/K
50
70
90
110
Ho (
T)-
Ho (
298.
15 K
)
(T -
298
.15)
FIG. 18. The reduced enthalpy increment (in J K�1 mol�1) of UO2;○, Mooreand Kelley336; &, Ogard and Leary374; ~ Fredrickson and Chasanov375; 5,
Hein and Flagella376; ◊, Leibowitz et al.377; (,378; �, Mills et al.379; �, valuederived from the low-temperature measurements by Hunzicker and WestrumJr.373; the curve shows the recommended equation.
rticle is copyrighted as indicated in the article. Reuse of AIP content is sub
78.131.95.159 On: Sun,
contribute to the anomalous behavior. According to Ronchi and
Hyland394 the formerdominate.Theheat capacitymeasurements
in the pre-melting range by Hiernaut et al.386 showed a order-
disorder transition with a peak at (2670 � 30) K.380 The heat
capacity maximumof this peak reaches values above 215 J K�1
mol�1. Above this transition also the role of Schottky effects
must be taken into account.394
Numerous evaluations of the heat capacity of solid and
liquid UO2 have been reported. The listing for the CODATA
Key values315 is based on the evaluation in Glushko et al.,395
which is also adopted for the Equation of State description of
UO2 by Ronchi et al.396 That recommendation does not
include the heat capacity data by Ronchi and cowor-
kers380,386,387 in the premelting and liquid range. For that
reason we have re-fitted the experimental data in a combined
treatment of enthalpy increments and heat capacity, to give
C�p=ðJ K�1 mol�1Þ ¼ 66:7437þ 43:1393 10�3ðT=KÞ
� 35:640 10�6ðT=KÞ2
þ 11:655 10�9ðT=KÞ3
� 1:16863 106ðT=KÞ�2:
This single equation describes the data below and above the λtransition, since no change in the slope of the heat capacity or
enthalpy curves were observed.
The enthalpy increment of liquidUO2 has beenmeasured by
Hein and Flagella376 (four temperatures up to 3270 K) and by
Leibowitz et al.390 (six temperatures between 3173 and 3523
K). These measurements suggest a constant heat capacity
value in this temperature range. The heat capacity measure-
ments for liquid UO2 by387 show a decrease from about 120
J K�1 mol�1 near the melting point to about 84 J K�1 mol�1 at
4500 K, followed by an increase to the maximum temperature
of themeasurements, 8200K. Since it is not possible to fit these
data into a single polynomial equation of the type used in the
present assessment, we have fitted the heat capacity data by
Ronchi et al.387 from the melting point to T ¼ 5000 K to the
following equation:
C�p=ðJ K�1 mol�1Þ ¼ 1365:4956� 0:85866ðT=KÞ
þ 191:305 10�6ðT=KÞ2
� 14:1608 10�9ðT=KÞ3:
J. Phys. Chem. Ref. Data, Vol. 43, No. 1, 2014ject to the terms at: http://scitation.aip.org/termsconditions. Downloaded to IP:
27 Apr 2014 17:09:58

013101-58 KONINGS ET AL.
This a
The enthalpy of fusion of slightly hypostoichiometric UO2
samples was derived from enthalpy increment measurements
as 76 kJ mol�1 by Hein and Flagella376 and 74 kJ mol�1 by
Leibowitz et al.377 We select
DfusH� ¼ ð75� 3Þ kJmol�1:
The selected enthalpy of fusion together with the heat
capacity equations reproduce the enthalpy data for liquid UO2
by Hein and Flagella376 and Leibowitz et al.390 within 2%.
5.7.3. Enthalpy of formation
The enthalpy of formation of UO2 is a CODATAKey value
for Thermodynamics,315 which has been accepted here. This
value is based on the combustion calorimetric experiments
work by Huber and Holley Jr.346 and Johnson and Cord-
funke397:
DfH�ð298:15 KÞ ¼ �ð1085:0 � 1:0Þ kJmol�1
5.8. Np2O5(cr,l)
5.8.1. Crystal structure
Np2O5 has a monoclinic structure (space group P2/c). It
decomposes to NpO2 and O2 at about 700 K.398
0 400 800 1200 1600 2000
T/K
50
60
70
80
90
100
Ho (
T)-
Ho (
298.
15 K
)
(T -
298
.15)
FIG. 20. The reduced enthalpy increment (in J K�1 mol�1) of NpO2; &,
Arkhipov et al.406; ◊, Nishi et al.407;○, Beneš et al.408; �, value derived from thelow-temperature measurements by Westrum Jr. et al.405; the dashed curveshows the recommended equation based on the estimates of Serizawa et al.410
5.8.2. Heat capacity and entropy
The low-temperature heat capacity of Np2O5 has not been
measured. Merli and Fuger399 have estimated the entropy at
room temperature as S°(298.15 K)¼ (186� 15) J K�1 mol�1,
and Lemire400 as S°(298.15 K)¼ (163� 23) J K�1 mol�1.We
select
S�ð298:15 KÞ ¼ ð186� 15Þ J K�1 mol�1:
as this value is in agreement with the variation of the standard
entropy of the uranium oxides.
The high-temperature heat capacity of Np2O5 has been
measured by drop calorimetry from 350 to 750 K by Belyaev
et al.,401 who gave the following equation:
C�pðTÞ=ð J K�1 mol�1Þ ¼ 99:2þ 98:6 10�3ðT=KÞ:
5.8.3. Enthalpy of formation
The enthalpy of formation of Np2O5 has been measured by
Belyaev et al.402 and by Merli and Fuger399 by solution
calorimetry. The results of the two studies, �2148 kJ mol�1
and �(2162.7 � 9.3) kJ mol�1 respectively, are in poor a-
greement. We select the value derived byMerli and Fuger399
as it was based on awell-defined sample and a quick andwell-
defined dissolution reaction. It remains unchanged when
recalculated
DfH�ð298:15 KÞ ¼ �ð2162:7� 9:3Þ kJmol�1:
J. Phys. Chem. Ref. Data, Vol. 43, No. 1, 2014rticle is copyrighted as indicated in the article. Reuse of AIP content is sub
78.131.95.159 On: Sun,
5.9. NpO2(cr,l)
5.9.1. Melting point
NpO2 has a face-centered cubic crystal structure (space
group Fm3m) which is stable up to the melting point. The
melting point of NpO2 was reported to be (2833 � 50) K by
Chikalla et al.,403 which becomes (2836 � 50) K on ITS-90.
However, recent work by Böhler et al.404 using self-crucible
laser melting gave a value of (3072� 66) K, which is selected
here. Due to the high oxygen pressure of neptunium dioxide
at temperatures close to melting, it cannot be excluded that
the congruent melting composition of this compound be
slightly hypostoichiometric.
5.9.2. Heat capacity and entropy
The low-temperature heat capacity of NpO2 has been
measured by Westrum Jr. et al.405 by adiabatic calorimetry
from 5 to 300 K, yielding for the standard entropy:
S�ð298:15 KÞ ¼ ð80:3� 0:4Þ J K�1 mol�1:
Magnani et al.316 reported heat capacity data that are in
excellent agreement, but the numerical details of this measure-
ment have not been reported.
The high-temperature enthalpy increment of NpO2 has been
measured by Arkhipov et al.406 from 350 to 1100 K, by Nishi
et al.407 from 334 to 1071 K and by Beneš et al.408 from 376 to
1770 K. The latter two studies were made on very small
samples (less than 100 mg). The results by Arkhipov
et al.406 are in poor agreement with the low-temperature data
and are significantly higher than the other two studies (Fig. 20).
The results byNishi et al.407 andBeneš et al.408 are in excellentagreement and fit the low temperature data very well (Fig. 20).
Several estimates of the heat capacity of NpO2 have been also
reported. Yamashita et al.409 and Serizawa et al.410 calculated
the lattice heat capacity from the phonon and dilatation con-
tributions using Debye temperature, thermal expansion and
Gr€uneisen constants and the electronic contributions from
crystal field energies. As shown in Fig. 20 they are in fair
agreement with the experimental data.
Above 2000 K, it is likely that the heat capacity of NpO2
exhibits an excess component due to defect formation
ject to the terms at: http://scitation.aip.org/termsconditions. Downloaded to IP:
27 Apr 2014 17:09:58

THERMODYNAMIC PROPERTIES OF LANTHANIDE AND ACTINIDE OXIDE COMPOUNDS 013101-59
This a
(principally oxygen Frenkel pairs). No information on this
effects exists for NpO2, but Konings and Beneš330 estimated
this contribution from the heat capacity values for ThO2, UO2,
and PuO2 by interpolating the enthalpy of oxygen Frenkel
pair formation. By adding this contribution to the representa-
tion of the experimental results they obtained
C�pðTÞ=ð J K�1 mol�1Þ ¼ 64:7712þ 43:8574 10�3ðT=KÞ
� 35:0695 10�6ðT=KÞ2þ 13:1917 10�9ðT=KÞ3� 0:78932 106ðT=KÞ�2
which has been constrained to 66.20 J K�1 mol�1, as derived
from the low-temperature heat capacity measurements by
Westrum Jr. et al.405
No experimental data are available for liquid neptunium
dioxide. We estimate
C�pðNpO2; liq;TÞ ¼ 66 JK�1 mol�1:
The entropy of fusion is assumed to be identical to that of UO2
(24 J K�1 mol�1), yielding
DfusH� ¼ ð70� 6Þ kJmol�1:
5.9.3. Enthalpy of formation
The enthalpy of formation of neptunium dioxide has been
measured by Huber and Holley411 by oxygen bomb calorim-
etery, the product being stoichiometric NpO2:
DfH�ð298:15 KÞ ¼ �ð1078:5� 2:7Þ kJmol�1:
5.10. PuO2(cr,l)
5.10.1. Melting point
PuO2 has a face-centered fluorite structure (space group
Fm3m) up to its melting point. The various measurements of
the melting point of PuO2 are summarized in Table 60.
Because PuO2, similar toCeO2, starts to lose oxygen according
TABLE 60. The melting point of PuO2(cr)
Tfus/K
Authors Reported ITS-90
Pijanowski and DeLuca363 2569 � 30a 2586 � 30
Russel415 2673b
Chikalla364 2553 � 30a 2556 � 30
Freshley and Mattys416 2523
Lyon and Bailey365 2511 � 135c 2513 � 135
Lyon and Bailey367 2663 � 20c 2666 � 20
Aitken and Evans417 2663a
Riley412 2673 � 20b 2682 � 20
Kato et al.372 2843 2843
De Bruycker et al.413 3017 � 28
Selected value: 3017 � 28
ain He.bin Ar.cO2.
rticle is copyrighted as indicated in the article. Reuse of AIP content is sub
78.131.95.159 On: Sun,
to the reaction:
PuO2ðcrÞ ¼ PuO2�xðcrÞ þ x
2O2ðgÞ;
the melting temperature determinations are difficult to inter-
pret. For example, Chikalla364 found that samples of stoichio-
metric PuO2 had a O/Pu ratio near 1.62 after melting in inert
gas atmosphere. Riley412 realised that the melting point of
stoichiometric plutonium dioxide could only be defined under
a high oxygen pressure. However, his flame melting experi-
ments were still imprecise and the samples were still affected
by high temperature reduction despite the controlled atmo-
sphere. Also the interaction of the liquid with container
materials affects the results, as demonstrated by Kato
et al.372 They obtained a melting point for pure PuO2 about
200 K higher than the earlier values, when using rhenium as
container material instead of tungsten. This was further con-
firmed by De Bruycker et al.413,414 who employed a container-
less laser melting technique in oxygen and found an even
higher melting temperature for stoichiometric PuO2, Tfus ¼(3017 � 28) K, which is our selected value.
5.10.2. Heat capacity and entropy
Low-temperature heat capacity measurements have been
performed on samples of 239PuO2 by Sandenaw418 from 15 to
325 K and Kruger and Savage419 from 192 to 320 K, as well as
the less radioactive 242PuO2 and244PuO2 from 12 to 350K and
4 to 25K, respectively, by Flotow et al.420 In the latter samples
the effects of accumulation of radiation damage are less
significant and more accurate results in the very low tempera-
ture range can be obtained. For that reason our selected value
for the entropy is solely based on the results by Flotow et al.420:
S�ð298:15 KÞ ¼ ð66:13� 0:30Þ J K�1 mol�1:
High-temperature heat capacity of PuO2 has been measured
by Engel384 from 300 to 1100 K, and high-temperature
enthalpy increments have been measured by Kruger and
Savage419 from 298 to 1404 K, Ogard421 from 1500 to
2715 K, and Oetting422 from 353 to 1610 K (Fig. 21). Ogard’s
measurements suggest a rapid increase in Cp above 2370 K.
This has been attributed to partial melting of PuO2 through
0 500 1000 1500 2000 2500 3000
T/K
50
70
90
110
130
Ho (
T)-
Ho (
298.
15 K
)
(T -
298
.15)
FIG. 21. The reduced enthalpy increment (in J K�1 mol�1) of PuO2; ○,Ogard421; &, Kruger and Savage419; 5, Oetting422; �, value derived from
the low-temperature measurements by Flotow et al.420; the curve shows the
recommended equation.
J. Phys. Chem. Ref. Data, Vol. 43, No. 1, 2014ject to the terms at: http://scitation.aip.org/termsconditions. Downloaded to IP:
27 Apr 2014 17:09:58

013101-60 KONINGS ET AL.
This a
interaction with the tungsten container,422,423 although no
evidence exists for this interaction. A similar rapid increase
is found in the heat capacities of ThO2, UO2, and ZrO2, which
has been attributed to the formation of Frenkel and Schottky
lattice defects at high temperatures. For that reason we have
fitted all experimental data to a polynomial equation con-
strained to C�p(298.15 K) ¼ 66.25 J K�1 mol�1, as derived by
Flotow et al.,420 though it proved to be very difficult to fit the
results to the standard form due to strong variation between
room temperature and melting temperature. The following
equation gives an acceptable description up to 2300 K and
includes the upward trend, though the results ofOgard421 in the
2470–2640 K range, which were given a lower weight, could
not be reproduced accurately,
C�p=ðJ K�1 mol�1Þ ¼ 35:2952þ 0:15225ðT=KÞ
� 127:255 10�6ðT=KÞ2
þ 36:289 10�9ðT=KÞ3
� 3:47593 105ðT=KÞ�2:
No data for the heat capacity or enthalpy of liquid PuO2 are
known, except a single enthalpy measurement by Ogard.421
The enthalpy of fusion is thus estimated, assuming that the
entropy of fusion is identical to that ofUO2 (22.4 JK�1 mol�1),
yielding
DfusH� ¼ ð64� 6Þ kJmol�1:
We have also estimated for the heat capacity of liquid PuO2
from the value for UO2 as
C�p ¼ 70 JK�1 mol�1:
5.10.3. Enthalpy of formation
The enthalpy of formation of PuO2 has been determined by
Popov et al.,424Holley et al.425 and Johnson et al.426 by oxygen
combustion calorimetry starting from pure plutonium metal.
The results are in very good agreement, as shown in Table 61.
We select
DfH�ð298:15 KÞ ¼ �ð1055:8 � 1:0Þ kJmol�1
which is based to the appreciably more precise value by
Johnson et al.,426 who carefully analysed the metal for impu-
rities and applied appropriate corrections.
TABLE 61. The enthalpy of formation of plutonium dioxide
Authors Methoda ΔfH°(298.15K)/kJ mol�1
Popov et al.424 C �1056.0 � 4.6
Holley et al.425 C �1058.0 � 1.6
Johnson et al.426 C �1055.8 � 1.0
Selected value: �1055.8 � 1.0
aC = combustion calorimetry.
J. Phys. Chem. Ref. Data, Vol. 43, No. 1, 2014rticle is copyrighted as indicated in the article. Reuse of AIP content is sub
78.131.95.159 On: Sun,
5.11. Pu2O3(cr,l)
5.11.1. Polymorphism and melting point
Pu2O3 has a hexagonal type-A rare-earth sesquioxide struc-
ture (space group P3m1). It is likely that Pu2O3 may exhibit a
similar high-temperature behavior as the light lanthanide
sesquioxides, with the eventual appearance of H-type and the
X-type structures before melting. This is however not con-
firmed experimentally. The melting point of stoichiometric
Pu2O3wasmeasured byChikalla et al.427 andRiley412 being in
excellent agreement (Table 62), but significantly lower than
the value reported by Holley et al.425 for a less well-char-
acterised sample.We select (2352� 10)K, based on the results
of Riley,412 corrected to ITS-90, which is, however, relatively
low compared to the lanthanide sesquioxides aswell asAm2O3
and Cm2O3 (see Sec. 7.2.2).
5.11.2. Heat capacity and entropy
Flotow and O’Hare428 have measured the heat capacity of a
sample of 244Pu2O3 from 8K to 350 K. Their results revealed a
λ-type anomaly in the heat capacity at 17.65K, associatedwith
an antiferromagnetic transition. The standard entropy derived
from this work is:
S�ð298:15 KÞ ¼ ð163:02� 0:65Þ J K�1 mol�1
There are no measurements of the heat capacity or enthalpy
of Pu2O3 at high temperatures. We have here estimated the
following equation, based on comparison of actinide and
lanthanide oxides, which fits C�p(298.15 K) ¼ 116.98 J K�1
mol�1 from the low-temperature heat capacity measure-
ments:428
C�p=ðJ K�1 mol�1Þ ¼ 130:6670þ 18:4357 10�3ðT=KÞ
� 1:70530 106ðT=KÞ�2
Previously estimated values have been presented by var-
ious authors,395,429 but these are about 10 kJ mol�1 higher at
2000 K.
We assume that Pu2O3 transforms to the H-type structure
at Ttrs ¼ (2300 � 50) K, like in the lanthanide sesqui-
oxides and estimate for the enthalpies of transition and
fusion:
DtrsH�ðA ! HÞ ¼ ð32� 10Þ kJmol�1
DfusH� ¼ ð71� 10Þ kJmol�1
TABLE 62. Temperature of melting of plutonium sesquioxide
Tfus/K
Authors Reported ITS-90
Holley et al.425 2513 � 33 2516 � 33
Chikalla et al.427 2358 � 25 2361 � 25
Riley412 2348 � 5 2352 � 5
Selected value: 2352 � 10
ject to the terms at: http://scitation.aip.org/termsconditions. Downloaded to IP:
27 Apr 2014 17:09:58

40
50
60
70
80
90
Ho (
T)-
Ho (
298.
15K
)
(T-
298.
15)
THERMODYNAMIC PROPERTIES OF LANTHANIDE AND ACTINIDE OXIDE COMPOUNDS 013101-61
This a
For the heat capacity of the high temperature modifications
we assume the same values as for Sm2O3:
C�pðH;TÞ ¼ 165 JK�1 mol�1
C�pðliq;TÞ ¼ 179 JK�1 mol�1
5.11.3. Enthalpy of formation
The assessment of the enthalpy of formation of Pu2O3 is not
straightforward, as direct measurements do not exists. The
value must be based on the analysis of the reaction:
1
2Pu2O3ðcrÞ þ 1
4O2ðgÞ ¼ PuO2ðcrÞ
This was extensively discussed in various reviews,8,395,430
in which similar results have been derived. These studies
generally refer to the assessment by Markin and Rand431 of
the oxygen potential measurements by the same authors. As
discussed by Lemire et al.,430 the work of Chereau et al.432
suggests, however, that the partial enthalpies and entropies
from the work of Markin and Rand might need some adjust-
ment. Guéneau et al.,357,433 presented a consistent analysis ofthe phase diagram and oxygen potential data in the Pu-O
system using the CALPHAD method. The results of that
analysis are in reasonable agreement with the analysis by
Rand,8,430 though a slight change in the enthalpy of formation
of PuO2 has been suggested, which is not consistent with the
present review. If we take the Gibbs energy of the above
reaction, and combine it with the selected values from this
review, we obtain ΔfH°(298.15 K) ¼ �1647 kJ mol�1, some-
what lower than the value by Rand,8,430 ΔfH°(298.15 K) ¼�(1656� 10) kJ mol�1, or Glushko et al.,395 ΔfH°(298.15 K)¼ �(1670 � 20) kJ mol�1. We select
DfH�ð298:15 KÞ ¼ �ð1647 � 10Þ kJmol�1:
5.12. AmO2(cr,l)
5.12.1. Melting point
Americium dioxide has a fcc fluorite structure (space group
Fm3m). The melting point of AmO2 has been measured by
McHenry.434 His experiments were hindered by the effect of
dissociation, but McHenry concluded from measurements at
different heating rates that the melting point of the dioxide is
about 2383 K. However, this value is probably not referring to
stoichiometric AmO2, but to AmO2�x of undefined composi-
tion. Stoichiometric melting of AmO2 is unlikely to occur at
atmospheric pressure, as follows from the phase diagram.435
Upon heating the oxide start to lose oxygen and transforms into
AmO2�x, which has a wide range of composition.
200 400 600 800 1000 1200
T/K
FIG. 22. The reduced enthalpy increment (in J K�1 mol�1) of AmO2 (&) and
AmO1.5 (○) by Nishi et al.439; the solid curve shows the recommendedequations, the dashed curves the estimates based on comparison with otherlanthanide and actinide dioxides and sesquioxides.
5.12.2. Heat capacity and entropy
No experimental study of the low-temperature heat capacity
of AmO2 has been reported. The estimate by Westrum Jr. and
Grønvold436 for the standard entropy, S°(298.15 K) ¼ 83.7
rticle is copyrighted as indicated in the article. Reuse of AIP content is sub
78.131.95.159 On: Sun,
J K�1 mol�1, is somewhat too high, as has been demonstrated
by Konings,329,437 who analysed the systematics in the entro-
pies of actinide(IV) compounds, deriving S°(298.15K)¼ 75.5
J K�1 mol�1, from a lattice contribution (63.0 J K�1 mol�1)
and an excess contribution (12.5 J K�1 mol�1) from the 6H5/2
electronic state of the Am4+ ion. This value is adopted here
with an estimated uncertainty
S�ð298:15 KÞ ¼ ð75:5� 3:0Þ J K�1 mol�1:
This value is also consistent with preliminary calculations of
the vaporization data for americium oxides dissolved in plu-
tonium oxides.438
The enthalpy increment of AmO2 has been measured by
Nishi et al.439 on a sample of about 50 mg encapsulated in a
platinum container. As a result, the scatter in the data is
relatively large, and the values at the lowest temperatures are
somewhat uncertain. Consequently the fit of the data by Nishi
et al.439 yields too low values near room temperature (Fig. 22).
For that reason we have refitted the enthalpy increment data
constrained to C�p(298.15 K) ¼ 64.3 J K�1 mol�1, as derived
from the trend in the AnO2 series by Konings.329 We thus
obtain
C�p= J K�1 mol�1 ¼ 78:9718þ 3:8365 10�3ðT=KÞ
� 1:40591 106ðT=KÞ�2:
Above about 1200 K, this equation has been fitted to the heat
capacity estimated by Thiriet and Konings440 taking ThO2 as
lattice and calculating the excess from the free ion energy
levels.
5.12.3. Enthalpy of formation
The enthalpy of formation of 243AmO2 has been measured
by Morss and Fuger441 who determined the enthalpy of solu-
tion of a well-characterized sample in a {H2SO4þKI} solution
using a micro-calorimeter. The thermochemical cycle used in
that work, was based on the dissolution of AmCl3 in the same
medium.Their resulting value, which remains unchanged after
recalculation, has been selected here as
DfH�ð298:15 KÞ ¼ �ð932:2� 3:0Þ kJmol�1:
J. Phys. Chem. Ref. Data, Vol. 43, No. 1, 2014ject to the terms at: http://scitation.aip.org/termsconditions. Downloaded to IP:
27 Apr 2014 17:09:58

013101-62 KONINGS ET AL.
This a
Eyring et al.80 measured the enthalpy of solution of241AmO2 in a {HNO3þHBF4} solution and derived for the
enthalpy of formation ΔfH°(298.15 K) ¼ �(1003.7 kJ mol�1,
substantially more negative. The thermochemical cycle used
in that study is based on (estimated) extrapolation of the result
to infinite dilution, which introduces large uncertainties.
5.13. Am2O3(cr,l)
5.13.1. Polymorphism and melting point
The stable crystal structure of americium sesquioxide at
room temperature is not fully established. The early studies
report a bcc C-type rare-earth structure (space group Ia3) at
room temperatures. However, since Pu2O3 has a A-type
hexagonal and Cm2O3 a B-type monoclinic structure, this
is not likely. Considering the ionic radius of Am3+ the B-
type structure is more probable (see also Sec. 7.2.2). This
would be consistent with the transformation to the rare-earth
type-A La2O3 structure at a temperature between 1073 and
1173 K as observed by Wallmann.442 However, most experi-
mental studies on Am2O3 have been made on the hexagonal
form.
Themelting point of Am2O3 was found as (2478� 15) K by
Chikalla et al.,443,444 which is Tfus¼ (2481� 15) K on ITS-90.
TABLE 63. The melting point of Cm2O3(cr)
Tfus/K
Authors Reported ITS-90
McHenry434 2223
Smith449 2538 � 20 2545 � 20
Gibby et al.92a 2548 � 25 2551 � 25
2538 2541
Baybarz450 2533 � 20 2532 � 20
Selected value 2542 � 25
aAlso reported by Chikalla et al.403
5.13.2. Heat capacity and entropy
The low-temperature heat capacity of Am2O3 has not been
measured but several estimates have been made. Westrum Jr.
and Grønvold436 estimated the value S°(298.15 K) ¼ 158.2
J K�1 mol�1 (specified as cubic), by describing the entropy as
the sum of the lattice entropy and an excess contribution. A
similar approach, but using a more sound basis of spec-
troscopic and calorimetric information, was used by
Konings.127,445 The value was composed only of a lattice part,
obtained by extrapolating the trend in the lanthanide sesqui-
oxides to the actinide sesquioxides. The excess part for the
Am3+ ion is zero as the 7F0 ground state degeneracy is 1, and
the first excited state 7F1 does not contribute at room tem-
perature. This value is accepted here
S�ð298:15 KÞ ¼ ð134:2� 5:0Þ J K�1 mol�1:
The high-temperature enthalpy increment of hexagonal (A-
type) Am2O3 has been measured by Nishi et al.439 on a sample
of about 50 mg encapsulated in a platinum container. As a
result, the scatter in the data is relatively large, and the values at
the lowest temperatures are somewhat uncertain (Fig. 22).
Consequently the fit of the data byNishi et al.439 yields too low
values near room temperature (e.g., C�p(298.15 K) ¼ 88.0
J K�1 mol�1) considering the results for the Ln2O3 com-
pounds, for which the lattice heat capacity at 298.15 K is
between 110 and 100 J K�1 mol�1, and the value for Pu2O3
(116.98 J K�1 mol�1). For that reason we have refitted the
enthalpy increment data above 700 K, constrained to C�p ¼
116.5 J K�1 mol�1, as derived from comparison with the
J. Phys. Chem. Ref. Data, Vol. 43, No. 1, 2014rticle is copyrighted as indicated in the article. Reuse of AIP content is sub
78.131.95.159 On: Sun,
Ln2O3 series and the value for Pu2O3. We thus obtain
C�p=J K
�1 mol�1 ¼ 126:0084þ 8:0097 10�3ðT=KÞ� 1:05752 106ðT=KÞ�2:
The equation has been fitted at high temperature to the heat
capacity estimated on the basis of comparison to Pu2O3 and the
lanthanide sesquioxides (Fig. 22).
The transition to the H-type structure is assumed to take
place at Ttrs ¼ (2350 � 50) K, and we estimate for the
enthalpies of transition and fusion:
DtrsH�ðA ! HÞ ¼ ð33� 10Þ kJmol�1;
DtrsH�ðH ! XÞ ¼ ð10� 5Þ kJmol�1;
DfusH� ¼ ð74� 10Þ kJmol�1:
For the heat capacity of the high temperature modifications we
assume the same values as for Eu2O3:
C�pðH;TÞ ¼ 141 JK�1 mol�1;C�
pðliq;TÞ ¼ 156 JK�1 mol�1:
5.13.3. Enthalpy of formation
Morss and Sonnenberger446 have derived the enthalpy of
formation of hexagonal Am2O3 from enthalpy-of-solution
measurements in 6 mol dm�3 hydrochloric acid using a
microcalorimeter. This value remains unchanged after recal-
culation. The thermochemical cycle used in that work, was
based on the dissolution of Am(cr) in the samemedium, based
on the work of Fuger et al.447
DfH�ð298:15 KÞ ¼ �ð1690:4� 7:9Þ kJmol�1:
5.14. Cm2O3(cr)
5.14.1. Polymorphism and melting point
At room temperature stoichiometric curium sequioxide has
a monoclinic B-type crystal structure. Upon heating, three
high-temperature transformations have been identified.92,403
At (1888 � 15) K the monoclinic form transforms into the A-
type hexagonal structure, as was observed by high-tempera-
ture X-ray diffraction.448 Above 2000 K transitions at (2273�20) K and at (2383 � 20) K have been observed, which are
most likely transformations to the H and X structures that are
known for the lanthanide sesquioxides.
There are several reports of the melting point of Cm2O3, as
summarized in Table 63. The values are in good agreement,
ject to the terms at: http://scitation.aip.org/termsconditions. Downloaded to IP:
27 Apr 2014 17:09:58

THERMODYNAMIC PROPERTIES OF LANTHANIDE AND ACTINIDE OXIDE COMPOUNDS 013101-63
This a
except for the results of McHenry,434 who used CmO2 as
starting material and assumed that it was converted to the
sesquioxide during the measurements. For all values a small
correction to the ITS-90 temperature scale is needed. Smith449
used the melting points of Al2O3 and Tm2O3 as reference. For
the former, a value about 7K lower than the currently accepted
value was obtained. For Tm2O3 no recommended value is
available. We correct the value by Smith therefore withþ7 K.
Regarding the results of Gibby et al.,92 Chikalla et al.403 we
think it is likely that they refer to IPTS-48. The selected value
for the melting point is Tfus ¼ (2542 � 25) K.
5.14.2. Heat capacity and entropy
The low-temperature heat capacity of Cm2O3 has not been
measured but several estimates have been made. Westrum Jr.
andGrønvold436 haveestimated the valueS°(298.15K)¼ 160.7
J K�1 mol�1 (specified as cubic), by describing the entropy as
the sum of the lattice entropy and an excess contribution.
A similar approach, but using a more sound basis of spectro-
scopic and calorimetric information, was used by Kon-
ings127,445 who obtained (167.0 � 5.0) J K�1 mol�1 for the
monoclinic modification. The value was composed of a lattice
part (133.5 J K�1 mol�1), obtained by extrapolating the trend in
the lanthanide sequioxides to the actinide sesquioxides, and an
excess part (34.58 J K�1 mol�1), calculated from the ground
state degeneracy of the Cm3+ ion. This value is accepted here
S�ð298:15KÞ ¼ ð168:1� 5:0Þ J K�1 mol�1:
Estimated values for the high-temperature heat capacity of
monoclinic Cm2O3 have been presented byGibby et al.,92 who
used them to convert the thermal diffusivity measurements to
thermal conductivity data, which agree reasonably with direct
measurements (see below). As discussed by Konings437
Gibby’s values are rather high compared to the experimental
values for the lanthanide sesquioxides and Pu2O3. He esti-
mated the following equation:
C�pðTÞ=J K�1 mol�1 ¼ 123:532þ 14:550 10�3ðT=KÞ
� 1:3489 106ðT=KÞ�2:
Data on the heat capacity of the H, X, and liquid (L) phases
and enthalpies of transition for C→ H, H→ X, and X→ L are
not available. Although rather speculative we have estimated
the properties of the high temperaturephases in a similarmanner
as for the lanthanide sesquioxides, and derive for Cm2O3:
DtrsH�ðB ! AÞ ¼ ð6� 3Þ kJmol�1;
DtrsH�ðA ! HÞ ¼ ð32� 6Þ kJmol�1;
DtrsH�ðH ! XÞ ¼ ð10� 5Þ kJmol�1;
DfusH� ¼ ð66� 10Þ kJmol�1:
For the heat capacity of the high temperatureHmodification and
liquid Cm2O3 we estimate
C�pðA;TÞ ¼ 142 JK�1 mol�1;
C�pðH;TÞ ¼ C�
pðX;TÞ ¼ 130 JK�1 mol�1;
C�pðliq;TÞ ¼ 140 JK�1 mol�1:
rticle is copyrighted as indicated in the article. Reuse of AIP content is sub
78.131.95.159 On: Sun,
5.14.3. Enthalpy of formation
The enthalpy of solution of curium sesquioxide in 6
mol dm�3 HCl(aq) has been measured by Morss et al.451 by
solution calorimetry using milligram samples of the mono-
clinic form.Combining this result with the enthalpy of solution
of Cm metal in this solvent, estimated from the value for the
dissolution in 1.0 mol dm�3 HCl(aq), the enthalpy of forma-
tion is calculated as
DfH�ð298:15 KÞ ¼ �ð1684 � 14Þ kJmol�1:
5.15. BkO2(cr) and Bk2O3(cr)
5.15.1. Polymorphism and melting point
BkO2 has a fcc fluorite structure (space group Fm3m). The
stable crystallographic modification of Bk2O3 is the bcc C-
type rare-earth structure (space group Ia3).452 Baybarz450
studied the high temperature polymorphism and found that
C-Bk2O3 irreversibly transforms to amonoclinic B structure at
(1473 � 50) K. The monoclinic-to-hexagonal transition was
observed at about 2022 K and the melting point at (2193 �25) K. Correction to ITS-90 would involve a correction of�1
K if themeasurements would refer to ITPS-68 and +2K in case
of ITPS-48. Since this is not clear from the paper, we choose to
retain the original value.
5.15.2. Heat capacity and entropy
No experimental data exist on the heat capacity and entropy
of the berkelium oxides. Konings et al.306 gave the following
estimates for the standard entropy based on the trends in the
actinide and lanthanide series:
S�ðBkO2; cr; 298:15 KÞ ¼ ð83� 5Þ J K�1 mol�1;
S�ðBk2O3; cr; 298:15 KÞ ¼ ð173:8� 5Þ J K�1 mol�1:
5.15.3. Enthalpy of formation
The enthalpies of formation of BkO2 and Bk2O3(cr) have
not been determined. Konings et al.306 gave the following
estimated values:
DfH�ðBkO2; cr; 298:15 KÞ ¼ � ð1023� 9Þ kJmol�1;
DfH�ðBk2O3; cr; 298:15 KÞ ¼ � ð1694� 20Þ kJmol�1
based on the correlation between the difference in the enthalpy
of formations of the oxides and the aqueous ions with molar
volume for the AnO2 compounds.
5.16. CfO2(cr) and Cf2O3(cr)
5.16.1. Polymorphism and melting point
CfO2 has a fcc fluorite structure (space group Fm3m). The
stable crystallographic modification of Bk2O3 is the bcc
J. Phys. Chem. Ref. Data, Vol. 43, No. 1, 2014ject to the terms at: http://scitation.aip.org/termsconditions. Downloaded to IP:
27 Apr 2014 17:09:58

TABLE 64. Molecular constants of AcO(g)
Te ωe ωexe Be αe103 De10
7
reNo. State cm�1 pm pi
0a X2Σ+ 0 764 2.3 0.34 1.5 2.63 194 2
1b A′ 2Δ3/2 7500 2
2b A′ 2Δ5/2 8200 2
3b A2Π 13 100 4
4b B2Σ 17 900 2
5b C2Π 22 700 4
6b D2Σ 27 000 2
013101-64 KONINGS ET AL.
This a
C-type rare-earth structure (space group Ia3). It transforms to
cubic or hexagonal forms due to self-irradiation.450 The cubic
(cr) to monoclinic (B) transformation has been observed at
about 1673 K.453 The melting point of Cf2O3 was determined
to be (2023 � 25) K by Baybarz450 in vacuum and in helium.
Correction to ITS-90 would involve a correction of�1 K it the
measurements would refer to ITPS-68 and +2 K in case of
ITPS-48. Since this is not clear from the paper, we choose to
retain the original value.
7b F2Σ 28 000 4
8b 17 200 8
9b 18 500 8
10b 21 200 8
11b 24 000 20
12b 25 900 8
13b 30 200 12
14b 35 000 30
15b 40 000 36
aComputed state.bEstimated state
5.16.2. Heat capacity and entropy
No experimental data exist on the heat capacity and entropy
of the berkelium oxides. Konings et al.306 gave the following
estimated values for the standard entropy based on the trends in
the actinide and lanthanide series:
S�ðCfO2; cr; 298:15 KÞ ¼ ð87� 5Þ J K�1 mol�1;
S�ðCf2O3; cr; 298:15 KÞ ¼ ð173:8� 5Þ J K�1 mol�1:
5.16.3. Enthalpy of formation
The enthalpy of formation of CfO2 has not been determined.
Konings et al.306 gave the following estimated value:
DfH�ðCfO2; cr; 298:15 KÞ ¼ �ð857� 14Þ kJmol�1
based on the correlation between the difference in the enthalpy
of formation of the oxides and the aqueous ions with molar
volume for the AnO2 compounds. The enthalpy of formation
of cubic Cf2O3(cr) has been determined by Morss et al.454
using solution microcalorimetry on milligram samples in 6.0
mol dm�3 HCl(aq), to give
DfH�ðCf2O3; cr; 298:15 KÞ ¼ �ð1652:6� 10:3Þ kJmol�1
using a thermochemical cycle based on the solution of Cf(cr)
for which the enthalpy was estimated from the experimental
value in 1.0 mol dm�3 HCl(aq) by Fuger et al.455
6. The Gaseous Actinide Oxides
6.1. AcO(g)
6.1.1. Heat capacity and entropy
The thermal functions of AcO(g) in the standard state have
been calculated using the data given in Table 64. Because no
spectral data on the AcO molecule exists, the molecular
constants were obtained from B3LYP calculations by
Kovács456 and estimations using the trends revealed in the
spectral data of the lanthanide and actinide monoxides. The
electronic structure is assumed to be analogous to that of LaO.
The energies of the low-lying states taken from the LaO data
are approximated to hundreds cm�1. The derived standard
entropy at room temperature is
S�ð298:15 KÞ ¼ ð245:545� 5:0Þ J K�1 mol�1
J. Phys. Chem. Ref. Data, Vol. 43, No. 1, 2014rticle is copyrighted as indicated in the article. Reuse of AIP content is sub
78.131.95.159 On: Sun,
and the coefficients of the equations for the heat capacity are
C�p=ðJ K�1 mol�1Þ ¼ 26:7681þ 26:00447 10�3ðT=KÞ
� 24:23966 10�6ðT=KÞ2
þ 8:10964 10�9ðT=KÞ3
� 0:83961 105ðT=KÞ�2
for the 298.15–1100 K range, and
C�p=ðJ K�1 mol�1Þ ¼ 47:1310� 13:09869 10�3ðT=KÞ
þ 6:02184 10�6ðT=KÞ2 � 0:628330
10�9ðT=KÞ3 � 2:91011
106ðT=KÞ�2
for the 1100–4000 K range.
6.1.2. Enthalpy of formation
No experimental data exists for the derivation of the
enthalpy of formation of AcO(g). We have estimated the
dissociation energy as D0 ¼ (860 � 20) kJ mol�1. This value
corresponds to:
DfH�ðAcO; g; 298:15 KÞ ¼ �ð193 � 20Þ kJmol�1:
6.2. ThO2(g)
6.2.1. Heat capacity and entropy
The thermodynamic functions of ThO2(g) in the standard
state have been calculated using the data given in Table 65.
There are no experimental data for the structure of free gaseous
ThO2 molecules, and the ThO2 structure is determined only
from infrared spectra in the solid matrices. In an early work
Kaufman et al.457 found that a ThO2 molecular beam exhibits
some deflection in an inhomogeneous electric field, indicating
the possibility of a bent structure for this molecule. The first
quantitative information on the bent structure of ThO2 was
ject to the terms at: http://scitation.aip.org/termsconditions. Downloaded to IP:
27 Apr 2014 17:09:58

TABLE 65. The molecular parameters for ThO2(g)
Parameter Value
Ground electronic state 1A1
Symmetry group C2v
Symmetry number, σ 2
IAIBIC (g3 cm6)a 1110 10�117
Vibrational frequencies (cm�1) 808, 160, 757
Electronic states (cm�1)b 0(1), 17909(2), 18933(2),
22220(2), 23569(2), 24637(2)
aProduct of moments of inertia.bNumbers in parentheses represent the statistical weights.
TABLE 66. The enthalpy of sublimation of ThO2(g), in kJ mol�1
Authors Methoda T/K ΔsubH°(298.15 K)
Shapiro465 L 2062–2257 791.3 � 15.0
Hoch and
Johnston466K 2389–2676 (730.6)
Darnell and
McCollum467
K 2268–2593 788.7 � 12.0
Ackermann
et al.468K+M 2180–2871 787.9 � 10.0
Shchukarev and
Semenov472K+M 2600–3000 802.9 � 15.0
Semenov473b K+M 2200–2700 779.0 � 12.0
Ackermann and
Rauh469cK+M 2400–2800 797.1 � 10.0
Hildenbrand and
Murad470dM 2160–2176 782.1 � 15.0
Ackermann and
Rauh471eM 2320–2650 797.1 � 15.0
Selected value: 790.8 � 12.0
aK ¼ Knudsen effusion; M ¼ mass spectrometry; L ¼ Langmuir effusion.bExtended and reassessed data of Shchukarev and Semenov.472
cRecalculated from the Ackermann et al.468 total pressure of Th-bearing
species.dCalculated from the enthalpy of the gaseous reaction Th þ ThO2 ¼ 2ThO.eCalculated from the enthalpy of the gaseous reaction ZrO2 þ ThO ¼ ThO2
þ ZrO.
THERMODYNAMIC PROPERTIES OF LANTHANIDE AND ACTINIDE OXIDE COMPOUNDS 013101-65
This a
obtained from infrared spectroscopy. Gabelnick et al.,212 Zhou
and Andrews,458 and Andrews et al.459 have studied the
infrared spectra of ThO2 isotopomers in argon and neon
matrices. On the basis of 18O isotope shifts a nonlinear
structure has been derived for ThO2 with the bond angle
(122.5� 2)°. Quantum-chemical calculations at DFT (Density
Functional Theory),458–460 Dirac-Hartree-Fock,461 and SO-
CASPT2 level462 resulted in a bent structure for ThO2 as well.
The quantum chemical calculations resulted in Th–O bond
lengths between 188.1–192.3 pm. The probably most accurate
bond distance was suggested on the basis of the frequency–
bond distance relationship derived by Kovács and Konings460
utilizing the experimental matrix-IR data. The product of the
principal moments of inertia of ThO2 (see Table 65) was
calculated using the values re(Th–O) ¼ (191 � 5) pm and
O–Th–O¼ (122.5� 2)°. The re(Th–O) value is an average ofthree bond distances (190.6, 191.1, and 189.2 pm) obtained in
the mentioned theoretical calculations.
The accepted vibrational frequencies ν1 and ν3 (see
Table 65) were taken from IR spectra obtained by Gabelnick
et al.,212 Zhou and Andrews,458 and Andrews et al.459 for the
neon matrix. ThO2 bands detected in the Ne matrix are blue-
shifted 22 cm�1 from the solid argon data. In comparison with
Ar, the Ne matrix is less polarizable, and matrix shifts in this
case are substantially less. The deformation frequency ν2 wasestimated from calculations by Zhou and Andrews,458
Dyall,461 Andrews et al.459 and Kovács and Konings.460
No experimental investigations of the electronic spectra of
ThO2 were reported. Quantum chemical calculations on the
molecule agree in the X1A1 ground state.458–463 This state
corresponds to the closed shell configuration and no low-lying
electronic states may be expected for this molecule. The high
electronic energy levels of ThO2 given in Table 65 are
estimated to be the same as for isoelectronic UO2þ2 from
ab initio calculations by Pierloot et al.464
The derived standard entropy at room temperature is
S�ð298:15 KÞ ¼ ð285:233� 2:0Þ J K�1 mol�1:
and the coefficients of the equations for the heat capacity are
C�p=ðJ K�1 mol�1Þ ¼ 36:83878þ 55:95391 10�3ðT=KÞ
� 56:33462 10�6ðT=KÞ2 þ 20:31019
10�9ðT=KÞ3 � 1:940496
105ðT=KÞ�2
rticle is copyrighted as indicated in the article. Reuse of AIP content is sub
78.131.95.159 On: Sun,
for the 298.15–900 K range, and
C�p=ðJ K�1 mol�1Þ ¼ 56:72155þ 2:163537 10�3ðT=KÞ
� 1:189606 10�6ðT=KÞ2þ 0:2274986 10�9ðT=KÞ3� 1:407937 106ðT=KÞ�2
for the 900–4000 K range.
6.2.2. Enthalpy of formation
The value of ThO2(g) enthalpy of formation is based on
Langmuir and Knudsen effusion measurements of ThO2(cr)
enthalpy of sublimation and mass spectrometric measure-
ments of equilibrium constants for isomolecular oxygen
exchange reactions (see Table 66). In the early Langmuir
and Knudsen effusion measurements, the weight loss of
thoria samples was used for calculation of the vapor pressure
under assumption of ThO2(g) as the only thorium-bearing
vapor species.465–467 Knudsen effusion studies were carried
out using substantially inert tungsten effusion cells. The
only exception is the work by Hoch and Johnston466 in
which a tantalum cell was used. Ackermann et al.468 have
performed a combined study of the thorium-oxygen system
evaporation behavior in the temperature range 2000–
3000 K. It was found that solid thorium dioxide evaporates
congruently. Above 2800 K, a thermodynamically insignif-
icant substoichiometry ThO1.998 was found. A combination
of mass effusion and mass-spectrometric examination of the
vapor composition has led to the conclusion that ThO and
ThO2 gaseous species are of comparable importance in the
thoria vapor. More detailed study of thermodynamics of
thoria vaporization has been carried out by Ackermann and
J. Phys. Chem. Ref. Data, Vol. 43, No. 1, 2014ject to the terms at: http://scitation.aip.org/termsconditions. Downloaded to IP:
27 Apr 2014 17:09:58

013101-66 KONINGS ET AL.
This a
Rauh.469 The congruently vaporizing composition of thoria
was found ThO1.994, instead of previous value ThO1.998.
Using the reassessed results of their previous investiga-
tion,468 Ackermann and Rauh469 have found equations for
the temperature dependence of the ThO(g) and ThO2(g)
partial pressures over stoichiometric thoria. As follows from
these equations, p(ThO)/p(ThO2) value linearly rises from
0.20 to 0.36 in the temperature range 2000–2800 K.
The enthalpy of sublimation values presented in Table 66
were obtained using partial pressures of ThO2(g) species
calculated from the total vapor pressure over slightly sub-
stoichiometric thoria. All values of the enthalpy of sub-
limation are in good agreement. The only exception is the
work by Hoch and Johnston.466 Much higher values of
weight loss found in this work are obviously connected
with use of tantalum effusion cells for vaporization of
thoria, leading to intensive formation of ThO(g). The
enthalpy of sublimation values calculated from the results
of mass-spectrometric measurements of gaseous equili-
bria470,471 are in agreement with Knudsen effusion and
Langmuir measurements.
TABLE 67. Molecular constants of 232Th16O(g)
Te ωe ωexe
No. State cm
0a X1Sþ0
0 895.77 2.39
1a (1)3 5335.9
2a (1)2 6146.6
3a 9315
4a [10.6]0 10626
5a [11.1]1 11156
6a [14.5]1 14525
7a [15.9]1 15975
8a [16.3]0 16354
9a [18.1]2 18053
10a [18.4]0 18406
11a [19.1]0 19068
12a [19.5]1 19586
13a [20.1]3 20112
14a [21.7]1 21756
15a [22.6]1 22685
16a [23.1]0 23155
17a [23.2]0 23199
18a [24.0]3 24084
19a [24.9]1 24886
20a [25.1]1 25184
21a [25.8]1 25850
22a [27.7]1 27756
23a [28.0]0 28071
24a [28.3]2 28360
25a [28.6]1 28614
26a [30.3]1 30346
27a [32.7]2 32770
28d 35000
29d 40000
aExperimental state.bD0.cAdded statistical weights of near-lying predicted states.dEstimated state.
J. Phys. Chem. Ref. Data, Vol. 43, No. 1, 2014rticle is copyrighted as indicated in the article. Reuse of AIP content is sub
78.131.95.159 On: Sun,
The selected value is taken as a rounded weighted average
from all works except Hoch and Johnston466:ΔsubH°(298.15 K)¼ (790.8 � 12.0) kJ mol�1. This value corresponds to:
DfH�ðThO2; g; 298:15Þ ¼ �ð435:6� 12:6Þ kJmol�1:
Thecorresponding energyof atomization isD0(ThO2)¼ (1531.3
� 13.5) kJ mol�1.
6.3. ThO(g)
6.3.1. Heat capacity and entropy
The thermal functions of ThO(g) in the standard state have
been calculated using the molecular constants presented in
Table 67.
The spectroscopic properties of ThO were studied since the
beginning of the last century. The data published up to 1975
were reviewed by Huber and Herzberg179 and up to 1980 by
Gurvich et al.180 Later Edvinsson and Lagerqvist474–479,
Edvinsson and Jonsson,480 published a number of papers
concerning the ThO emission spectrum. The accurate Th-O
Be αe103 De10
7
re�1 pm pi
0.33246 1.3 1.83b 184.018613(24) 1
2
2
4
2c
2
4c
3c
1
2
1
1
2
7c
6c
8c
1
2
4c
6c
3c
8c
6c
2c
2
2
14c
10c
14
20
ject to the terms at: http://scitation.aip.org/termsconditions. Downloaded to IP:
27 Apr 2014 17:09:58

TABLE 68. The enthalpy of formation of ThO(g), in kJ mol�1
Authors Methoda T/K Reaction ΔrH°(298.15 K) ΔfH°(298.15 K)
Ackermann et al.468 KþM 2337–2381 ThO2(cr) ¼ ThO(g) þ O(g) 1434.4 �41.2
Shchukarev and Semenov472 M 2573–2973 ThO2(cr) ¼ ThO(g) þ O(g) 1393.2 �82.3
Ackermann and Rauh469 M 2400–2800 ThO2(cr) ¼ ThO(g) þ O(g) 1447.6 �28.0
K 2080–2214 12Th(cr)þ 1
2ThO2(cr) ¼ ThO(g) 599.8 �13.4
M 1930–2280 ThO(g) þ Y(g) ¼ Th(g) þ YO(g) �169.5 �29.1
Hildenbrand and Murad470 M 1782–1927 12Th(cr)þ 1
2ThO2(cr) ¼ ThO(g) 593.1 �20.1
M 2064–2176 ThO(g) þ Si(g) ¼ Th(g) þ SiO(g) 77.3 �24.1
Ackermann and Rauh469 M 2200–2550 ThO(g) þ Hf(g) ¼ Th(g) þ HfO(g) 73.5 �21.4
Neubert and Zmbov496 M 1759–1961 ThO(g) þ La(g) ¼ Th(g) þ LaO(g) 62.8 �11.7
Murad and Hildenbrand497 M 2288 ThO(g) þ Zr(g) ¼ Th(g) þ ZrO(g) 110.9 �24.4
Selected value: D0(ThO) ¼ 868.6 � 5.0 �21.5� 5.0
aK ¼ Knudsen effusion; M ¼ mass spectrometry.
THERMODYNAMIC PROPERTIES OF LANTHANIDE AND ACTINIDE OXIDE COMPOUNDS 013101-67
This a
bond distance in the ground-state molecule is known from a
recent microwave spectroscopic study.481 The harmonic
vibrational frequency and other rotational and vibrational
constants given in Table 67 were obtained from rotation-
ally-resolved electronic emission spectra.474 The IR measure-
ments of ThO isolated in low-temperature inert gas
matrices212,458,459,482,483 revealed the matrix-shift effects on
the fundamental frequency.
At present, 27 states (see Table 67) classified as belonging
to Hund’s coupling case “c” are rotationally analyzed, and
25 of them are arranged in the term scheme by Edvinsson
et al.474–479,484 The analyses by Behere et al.485,486 are not
convincing. The ground state of the ThO molecule is X0þ0(X1Sþ
0 ), as confirmed experimentally by the studies of the
electronic spectrum of ThO179,180,474–480 and also in the
numerous theoretical calculations by Paulovic et al.,487,488
Watanabe and Matsuoka,489–491 K€uchle et al.,492 Kaledin
et al.,258 Marian et al.,493 Seijo et al.,494 Andrews et al.,459
Goncharov and Heaven,484 Buchachenko,495 and Infante
et al.462
Kaledin et al.258 carried out the Ligand field calculations
and assigned all 17 states observed till that time to the
electron configurations 7s2, 6d7s, 7s7p, and 5f7s, and cal-
culated unobserved states of these and 6d2 configurations.
The calculations showed that the lowest unobserved states
are Ω ¼ 3 (probably W-state) and Ω ¼ 2 (probably lower
state of the band at 5579 Å) of the 6d7s configuration. In thepresent work the statistical weights of predicted but unob-
served states are attributed to the near-lying experimental
states for simplification of the input data. The 5f6d, 6d7p,
and 5f7p states are taken into account in the interval 25000 -
45000 cm�1.
The derived standard entropy at room temperature is
S�ð298:15 KÞ ¼ ð240:071� 0:03Þ J K�1 mol�1;
and the coefficients of the equations for the heat capacity are
C�p=ðJ K�1 mol�1Þ ¼ 30:10768þ 13:9388 10�3ðT=KÞ
� 11:5407 10�6ðT=KÞ2
þ 4:92964 10�9ðT=KÞ3
� 1:86435 105ðT=KÞ�2
rticle is copyrighted as indicated in the article. Reuse of AIP content is sub
78.131.95.159 On: Sun,
for the 298.15–1500 K range, and
C�p=ðJ K�1 mol�1Þ ¼ �13:55069þ 44:5401 10�3ðT=KÞ
� 8:99062 10�6ðT=KÞ2 þ 0:583589
10�9ðT=KÞ3 þ 1:48587
107ðT=KÞ�2
for the 1500–4000 K range.
6.3.2. Enthalpy of formation
The results of the determination of the enthalpy of formation
of ThO(g) are presented in Table 68. The value is based on
Knudsen effusion and mass spectrometric studies of ThO2(cr)
and Th(cr)þThO2(cr) system evaporation468–470,472 andmass
spectrometric measurements of isomolecular oxygen
exchange reactions.469,470,496,497 With the exception of the
results of Ackermann et al.468 and Shchukarev and Seme-
nov,472 all values of the enthalpy of formation of ThO(g) are in
good agreement. The selected value is taken as a rounded
average from all sources except the two mentioned papers:
DfH�ðThO; g; 298:15KÞ ¼ �ð21:5 � 5:0Þ kJmol�1:
This value corresponds to D0(ThO)¼ (868.6 + 5.0) kJ mol�1.
6.4. PaO2(g)
6.4.1. Heat capacity and entropy
The thermodynamic functions of PaO2(g) in the standard
state have been calculated using the data given in Table 69.
Experimental data on molecular structure and spectra of PaO2
are not available. Recently, the molecular geometry, vibra-
tional properties and low-lying electronic states have been
computed by Infante et al.,462 and Kovács and Konings,460
Kovács et al.,498 and Kovács.456 The calculations agree on a
linear structure of D1h symmetry in the ground electronic
state, similar to all AnO2 molecules (except ThO2 which is
bent). The moment of inertia has been evaluated using the SO-
CASPT2 bond distance of 181.6 pm of the linear molecule
Infante et al.462 The vibrational frequencies were taken from
Ref. 460.
J. Phys. Chem. Ref. Data, Vol. 43, No. 1, 2014ject to the terms at: http://scitation.aip.org/termsconditions. Downloaded to IP:
27 Apr 2014 17:09:58

TABLE 69. The molecular parameters for PaO2(g)
Parameter Value
Ground electronic state 2Σ1/2gSymmetry group D1h
Symmetry number, σ 2
I (g cm2)a 17.52 10�39
Vibrational frequencies (cm�1)b 852, 82(2), 899
Electronic states (cm�1)c 0(2), 3961(2), 8252(2),
8924(2), 11290(2), 14430(2),
15488(2), 27933(2), 28075(2),
28617(2), 29739(2), 29914(2)
aMoment of inertia.bNumbers in parentheses represent degeneracy.cNumbers in parentheses represent the statistical weights.
013101-68 KONINGS ET AL.
This a
The electronic ground state of PaO2 is2Σ1/2g.
462 The vertical
excitation energies to the low-lying states were calculated
recently at the SO-CASPT2 level by Kovács.456 The derivedstandard entropy at room temperature is
S�ð298:15 KÞ ¼ ð279:711� 5:0Þ J K�1 mol�1
and the coefficients of the equations for the heat capacity are
C�p=ðJ K�1 mol�1Þ ¼ 35:4855þ 69:7567 10�3ðT=KÞ
� 71:6190 10�6ðT=KÞ2
þ 27:8213 10�9ðT=KÞ3
� 0:58791 105ðT=KÞ�2
for the 298.15–900 K range, and
C�p=ðJ K�1 mol�1Þ ¼ 57:8335þ 4:88325 10�3ðT=KÞ
þ 6:76950 10�8ðT=KÞ2
� 1:07986 10�10ðT=KÞ3
� 1:40951 106ðT=KÞ�2
for the 900–4000 K range.
TABLE 70. Molecular constants of 231Pa16O(g)
Te ωe ωexe Be αe103 De10
7
reNo. State cm�1 pm pi
0 X8Σ 0 845 2.69 0.335 1.5 2.1 183.5 2
1 200 2
2 2000 8
3 3000 12
4 4000 8
5 5500 18
6 7000 8
7 10 000 85
8 15 000 150
9 20 000 180
10 25 000 185
11 30 000 190
12 35 000 195
13 40 000 215
6.4.2. Enthalpy of formation
Kleinschmidt and Ward499 have measured partial pres-
sures of Pa(g), PaO(g), and PaO2(g) above the Pa(l) þPaO2�y(cr) two-phase system and the congruently vapor-
izing composition PaO2�x (x and y values were not spe-
cified). From the latter data Kleinschmidt and Ward
calculated the enthalpy of sublimation ΔsubH°(PaO2, cr,
298.15 K) ¼ (595 � 7) kJ mol�1 as an average of the
second- and third-law values (thermodynamic functions of
all three gaseous species were estimated; however, mole-
cular constants and numerical values of functions were not
presented in the paper). The enthalpy of formation for
PaO2(g) was derived by Kleinschmidt and Ward assuming
the enthalpy of formation of solid substoichiometric pro-
tactinium dioxide equal to that for PaO2(cr). Following
this suggestion, we obtain for the enthalpy of formation
ΔfH°(298.15 K) ¼ �(514 � 17) kJ mol�1.
To acquire some insight into reliability of the enthalpy of
formation of PaO2(g) obtained with indeterminate thermo-
J. Phys. Chem. Ref. Data, Vol. 43, No. 1, 2014rticle is copyrighted as indicated in the article. Reuse of AIP content is sub
78.131.95.159 On: Sun,
dynamic functions, we calculated the third-law enthalpy of
sublimation using the thermodynamic properties for a related
neighbor compound, uranium dioxide, adopted in this work:
ΔsubH°(298.15K)¼ 619 kJmol�1. The 24 kJmol�1 difference
between two enthalpy of sublimation values can serve as an
estimation of possible uncertainty in the enthalpy of formation
of PaO2(g) found by Kleinschmidt and Ward.499 On the basis
of calculations performed, we select the value derived from the
paper by Kleinschmidt and Ward499 as a provisional recom-
mendation, with an extended uncertainty range
DfH�ðPaO2; g; 298:15Þ ¼ �ð514:0 � 30Þ kJmol�1:
To the selected PaO2(g) enthalpy of formation corresponds
the atomization energy value D0(PaO2) ¼ (1576.0 � 30)
kJ mol�1.
6.5. PaO(g)
6.5.1. Heat capacity and entropy
The thermal functions of PaO(g) in the standard state have
been calculated using the data given in Table 70. The mole-
cular constants were estimated using the trends revealed in the
spectral data of the lanthanide monoxides as there is no
spectral data on the PaO molecule. The electronic structure
is assumed to be analogous to that of PrO. The energies of the
low-lying states taken from the PrO data are approximated to
hundreds cm�1.
The derived standard entropy at room temperature is
S�ð298:15 KÞ ¼ ð250:778� 10:0Þ J K�1 mol�1
and the coefficients of the equations for the heat capacity are
C�p=ðJ K�1 mol�1Þ ¼ 22:73634þ 18:0345 10�3ðT=KÞ
þ 28:8250 10�6ðT=KÞ2 � 20:1289
10�9ðT=KÞ3
þ 2:78485 105ðT=KÞ�2
ject to the terms at: http://scitation.aip.org/termsconditions. Downloaded to IP:
27 Apr 2014 17:09:58

THERMODYNAMIC PROPERTIES OF LANTHANIDE AND ACTINIDE OXIDE COMPOUNDS 013101-69
This a
for the 298.15–1100 K range, and
C�p=ðJ K�1 mol�1Þ ¼ 84:42095� 29:0423 10�3ðT=KÞ
þ 8:96146 10�6ðT=KÞ2 � 0:876655
10�9ðT=KÞ3 � 1:36244
107ðT=KÞ�2
for the 1100–4000 K range.
6.5.2. Enthalpy of formation
Kleinschmidt and Ward499 have measured the partial pres-
sures of Pa(g), PaO(g), and PaO2(g) above the Pa(l) þPaO2�y(cr) two-phase system and the congruently vaporizing
composition PaO2�x (x and y values were not specified). From
this data, the third-law enthalpy of formation of PaO2(g)
was found as explained above and the enthalpy of formation
of Pa(g). Thermodynamic functions of all three gaseous
species were estimated. However, neither molecular constants
nor numerical values of functions have been presented in the
paper.
The vapor pressure measurements in the two-phase region
Pa(l) + PaO2�y(cr) resulted in the value ΔfH°(298.15 K) ¼�(18 � 13) kJ mol�1 for the reaction
PaO2ðgÞ þ PaðgÞ ¼ 2PaOðgÞ:
Combining of this enthalpy of reaction with the thermo-
chemical values for PaO2(g) and Pa(g), leads to the enthalpy
of formation of PaO(g):
DfH�ðPaO; g; 298:15 KÞ ¼ ð8 � 30Þ kJmol�1
This value corresponds to D0(PaO) ¼ (789 � 30) kJ mol�1.
This is in good agreement with the value (801� 59) kJ mol�1
estimated by Marçalo and Gibson500 on the basis of gas phaseoxidation reactions involving the ionised species and known
ionisation energies.
TABLE 71. The molecular parameters for UO3(g)
Parameter Value
Ground electronic state X1A1
Symmetry group C2v
Symmetry number, σ 2
IAIBIC (g3 cm6)a 4210 10�117
Vibrational frequencies (cm�1) 860, 760, 186, 865, 212, 152
Electronic states (cm�1)b 0(1), 17909(2), 18933(2),
22220(2), 23569(2), 24637(2)
aProduct of moments of inertia.bNumbers in parentheses represent the statistical weights.
6.6. UO3(g)
6.6.1. Heat capacity and entropy
The thermodynamic functions of UO3(g) in the standard
state have been calculated using the data given in Table 71.
Experimental data for the structure of free gaseous UO3
molecule does not exist in the literature. From analysis of the
infrared spectra of matrix-isolated UO3 and its oxygen-18
isotopomers, Gabelnick et al.501 and Green et al.502 have
determined a planar T-shaped (C2v) geometry for the UO3
molecule, with a O–U–O linear fragment. Three low-fre-
quency and two stretching modes observed in matrix-isolated
UO3 are inconsistent with a pyramidal (C3v) or planar (D3h)
geometry. The investigation of infrared spectra of UO3 in solid
argon byHunt and Andrews503 is in agreement with the data of
Gabelnick et al.501 and Green et al.502 The results of ab
initio calculations by Pyykkö et al.504 support the symmetry
assignment from experiments of Gabelnick et al.501 and
Green et al.,502 and Hunt and Andrews503; it has been shown
rticle is copyrighted as indicated in the article. Reuse of AIP content is sub
78.131.95.159 On: Sun,
that D3h structure is a saddle point, 49 kJ mol�1 above the C2v
minimum. Pyykkö et al.504 obtained ffO–U–O¼ 161°, insteadof the linear O–U–O fragment found byGabelnick et al.501 and
Green et al.502 Similar results have been obtained later by
Privalov et al.505 using a similar theoretical (SCF) level.
Quantum chemical calculations at the more reliable B3LYP
DFT level were performed by Zhou et al.506 for the geometry
and vibrational frequencies. They retain the main structural
features obtained by Pyykkö et al.504 and by Privalov et al.,505
but with reduced difference between the shorter U–O (in the
O–U–O fragment) and the longer U–O′ bonds. The product of
the principal moments of inertia of UO3 (see Table 71) is
calculated with the selected molecular constants re(U–O)
¼ (181 � 5) pm, re(U–O′) ¼ (185.3 � 5) pm, and ffO–U–O¼ (158.8 � 5)° from the DFT calculations by Zhou et al.506
Experimental data on vibrational frequencies were
obtained by IR spectroscopy in argon matrices,501–503 and
in neon matrix.506 With the exception of ν1, all vibrationalmodes were observed. The accepted vibrational frequencies
ν2 and ν4 (see Table 71) were taken from the IR spectra
obtained by Zhou et al.506 in an neon matrix, ensuring
minimal matrix shift of the frequencies. The low frequencies
ν3, ν5, and ν6 were accepted from infrared spectra obtained
by Green et al.502 The unobserved ν1 frequency is accepted
as an average of two values obtained in calculations of
Green et al.502 and Zhou et al.506
The experimental and theoretical investigations of electro-
nic spectra of UO3 are unknown. X1A1 ground state is accepted
for UO3molecule from calculations of Zhou et al.506 This state
corresponds to the closed shell configuration and no low-lying
electronic statesmay be expected for thismolecule. Additional
electronic energy levels of UO3 given in Table 71 are accepted
to be the same as for the isoelectronic UO2þ2 from ab initio
calculations by Pierloot et al.464
The derived standard entropy at room temperature is
S�ð298:15 KÞ ¼ ð310:648� 3Þ J K�1 mol�1
and the coefficients of the equations for the heat capacity are
C�p=ðJ K�1 mol�1Þ ¼ 46:69199þ 94:69427 10�3ðT=KÞ
� 94:91701 10�6ðT=KÞ2 þ 34:1585
10�9ðT=KÞ3 � 2:793843
105ðT=KÞ�2
J. Phys. Chem. Ref. Data, Vol. 43, No. 1, 2014ject to the terms at: http://scitation.aip.org/termsconditions. Downloaded to IP:
27 Apr 2014 17:09:58

TABLE 72. The enthalpy of formation of UO3(g), in kJ mol�1
Authors Methoda T/K ΔfH°(298.15 K)
DeMaria et al.513 M 2200–2322 �769.9 � 20
Ackermann et al.507 T 1200–1370 �799.5 � 6
Alexander508 T 1415–1760 �792.8 � 8
Pattoret et al.515b M 2080-2500 �805.2 � 15
Dharwadkar et al.509 T 1525–1675 �797.2 � 6
Younés et al.221 M 1916–2336 �785.1 � 15
Krikorian et al.510 T 1173–1573 �789.3 � 10
013101-70 KONINGS ET AL.
This a
for the 298.15–900 K range, and
C�p=ðJ K�1 mol�1Þ ¼ 81:70962þ 2:009478 10�3ðT=KÞ
� 1:110505 10�6ðT=KÞ2þ 0:2162739 10�9ðT=KÞ3� 2:580355 106ðT=KÞ�2
for the 900–4000 K range.
Alexander511 T 1410–1815 �792.9 � 8Selected value: �795.0 � 10
aM ¼ mass spectrometry; T ¼ transpiration.bResults of treatment of experimental data from Drowart et al.514
6.6.2. Enthalpy of formation
For determination of the enthalpy of formation of UO3(g)
the results of transpiration and mass-spectrometric measure-
ments were used. Transpiration experiments with U3O8 with
oxygen employed as a carrier gas were carried out by Ack-
ermann et al.,507 Alexander,508 Dharwadkar et al.,509 Krikor-
ian et al.,510 and Alexander.511 In all works except of
Alexander,511 pure oxygen at 1 atm was used as carrier gas;
in the latter work dry air at 1 atm total pressure was employed.
It was shown by Ackermann et al.507 that variation of the
oxygen pressure in the carrier gas established the oxygen-
uranium ratio equal to three for the volatile uranium oxide
molecule. By a comparison with entropies of sublimation
of molybdenum and tungsten trioxides it was inferred that
gaseous monomeric uranium trioxide is the principal species
produced by the reaction of U3O8 with oxygen. To mention is
that, unlike (MoO3)n and (WO3)n, (UO3)n gaseous associates
till now are not detected in the U-O system.
Taking into account that the U3O8 phase has a homogeneity
range, and that at high temperatures some deviation from
stoichiometry develops, the process of transpiration has to be
described according to the equation
1
3U3O8�zðcrÞ þ ð1þ zÞ
6O2ðgÞ ¼ UO3ðgÞ:
Detailed thermodynamic characterization of the U3O8�z phase
was carried out by Ackermann and Chang.512 The U3O8�z
composition equilibrated at controlled temperature and oxy-
gen pressure values was experimentally studied in this work.
The equilibrium composition of the U3O8�z phase becomes
progressively substoichiometric with increasing temperature
at constant oxygen pressure. At the highest temperature of
experiments, 1445K, and the oxygen pressure 1 atm, the initial
composition UO2.667 changes to UO2.636. In air, at an oxygen
pressure ≈ 0.2 atm, the composition changes to ≈2.627. In spiteof these findings, we adopted a simplified approach in the
treatment of the transpiration data, without using information
on deviation from stoichiometry. This approach is justified by
a weak dependence of the free energy of formation of
U3O8�z(cr) on the z value at constant temperature, as was
shown by Ackermann and Chang.512 This feature becomes
apparent in absence of any systematic temperature drift of the
third-law enthalpy values calculated during our assessment of
experimental data for the reaction
1
3U3O8ðcrÞ þ 1
6O2ðgÞ ¼ UO3ðgÞ:
J. Phys. Chem. Ref. Data, Vol. 43, No. 1, 2014rticle is copyrighted as indicated in the article. Reuse of AIP content is sub
78.131.95.159 On: Sun,
Results of all investigations are summarized in Table 72. All
transpiration experiments gave very close results, an average
of five works being -794.3 kJ mol�1. Results of mass-spectro-
metricmeasurements221,513–515 are close to this value but show
more marked scatter. The most probable reason for that is the
use of different estimates for the ionization cross sections of
molecules and different estimates of fragmentation degree
under electron impact, the latter being especially important for
UO3 molecules. We have derived the selected value for
UO3(g) enthalpy of formation as a weighted average of all
results shown in Table 72 (except the results of DeMaria
et al.513 with the largest deviation from the mean):
DfH�ðUO3; g; 298:15Þ ¼ ð�795:0 � 10Þ kJmol�1:
6.7. UO2(g)
6.7.1. Heat capacity and entropy
The thermodynamic functions of UO2(g) in the standard
state have been calculated using the data given in Table 73.
The investigations of infrared spectra of matrix-isolated
uranium oxide species byGabelnick et al.,501 Lue et al.,516 and
Zhou et al.506 strongly indicated a linear geometry of D1h
symmetry for UO2. This is consistent with the absence in
spectra of peaks attributable to ν1 symmetric stretch for the
U16O2 andU18O2 isotopomers. Consistentwith the experiment
results, theoretical calculations for UO2 predict a linear sym-
metric ground state.460,506,517–519 There are no experimental
data on U–O bond distances in UO2(g). The principal moment
of inertia of UO2 is calculated using re(U–O)¼ (178� 5) pm.
This value is an average of five bond distances (177, 178.4,
179.5, 176.4, and 180 pm) obtained from ab initio and DFT
calculations;506,517–520 it is close to r(U-O) ¼ 179 pm esti-
mated by Green et al.502 and the value derived on the basis of
the frequency-bond distance relationship by Kovács and Kon-ings460 utilizing an estimated “gas-phase” value for the asym-
metric stretching fundamental (vide infra).
Experimental data for ν2 bending and ν3 asymmetric vibra-
tions were obtained by infared spectroscopy in noble gas
matrices.501,503,506 An interesting feature of UO2 is the large
red shift (about 130 cm�1) in the asymmetric stretch found
when replacing a neon matrix by an argon matrix. This feature
has been explained and supported by computational and
ject to the terms at: http://scitation.aip.org/termsconditions. Downloaded to IP:
27 Apr 2014 17:09:58

TABLE 73. The molecular parameters for UO2(g)
Parameter Value
Ground electronic state 3Φ2u
Symmetry group D1h
Symmetry number, σ 2
I (g cm2)a 17.0 10�39
Vibrational frequencies (cm�1)b 860, 120(2), 915
Electronic states (cm�1)c 0(2), 360(2), 2231(2), 2588(2), 5047(2), 6148(2), 6501(2), 7081(1), 7152(2),
7431(2), 7867(2), 8268(2), 8746(2), 10089(1), 10914(2), 11221(2), 11436(1),
11510(2), 12310(1), 12564(2), 12700(1), 12958(2), 13458(2), 13919(2), 14104(2),
14654(2), 14995(2), 15196(1), 15408(2), 15455(2), 15502(2), 15860(1), 15945(1),
16625(2), 16786(2), 16949(2), 17058(2), 17127(1), 17340(2), 17516(2), 17606(1),
18355(1), 18596(2), 18913(2), 19105(2), 19317(2), 19491(2), 21300(16), 24700(22),
30100(39)
aMoment of inertia.bNumbers in parentheses represent the degeneracies.cNumbers in parentheses represent the statistical weights.
THERMODYNAMIC PROPERTIES OF LANTHANIDE AND ACTINIDE OXIDE COMPOUNDS 013101-71
This a
further experimental studies506,521,522 that the more polariz-
able argon and krypton stabilize the low-lying 3Hg state
becoming the electronic ground state in these matrices. In
neon the 3Φ2u state found in the gaseous phase remains the
electronic ground state.
The adopted value for ν3 asymmetric vibrational mode of
U16O2 is taken from the investigation of the infrared spectra in
solid neon matrix506 because neon is substantially less polar-
izable than argon andmatrix shifts in this case are substantially
less. The value of infrared inactive ν1 mode is calculated by
normal coordinate analysis using the experimental data for ν3of UO2. These values are in excellent agreement with the
recent assessment by Kovács and Konings,460 who derived thegas-phase ν3 value by correction of 5 cm
�1 for the matrix-shift
of neon and deriving the ν1 value from the frequency-bond
distance relationship.
The bending frequency ν2¼ 120 cm�1 was observed using
the resonantly enhanced multiphoton ionization (REMPI)
technique in the gas phase.523 This bending frequency is
lower than the values predicted by calculations. Majumdar
et al.517 reported ν2 frequency values in the range of 149–
222 cm�1 using three different computational methods. DFT
calculation byZhou et al.506 yielded 138 cm�1. The gas phase
bending frequency is also lower than theΔG1/2¼ 225.2 cm�1
reported for UO2 isolated in a solid Ar matrix by Green
et al.502 In spite of this discrepancy, the experimental value
ν2¼ 120 cm�1 derived for freeUO2molecule byHan et al.523
is selected in our work for calculations of the UO2(g)
thermodynamic functions.
Thermodynamic functions have been calculated with the
inclusion of data for a wide range of excited electronic states.
Experimental data on the UO2 excited energy levels are
fragmentary.523 Several theoretical studiesof UO2 were car-
ried out at relativistic post-Hartree-Fock levels, reporting
electronic energy levels.503,506,516–519,524 From these diverse
studies we adopted the results by518 obtained using the Dirac-
Coulomb intermediate Hamiltonian multireference coupled
cluster approach (DC-IHFSCC). Thismethod is superior to the
ones applied in the other papers by (i) using the coupled cluster
methods to account for electron correlation; (ii) including the
rticle is copyrighted as indicated in the article. Reuse of AIP content is sub
78.131.95.159 On: Sun,
6d orbitals, that have so far been left out of the active space;
(iii) including spin-orbit coupling effects by utilizing the 4-
component Dirac-Coulomb Hamiltonian. From this study we
took the excited electronic states with the energy up to 19491
cm�1. The energy levels above 19491 cm�1 were united in
combined levels with summed up statistical weights (see
Table 73).
The derived standard entropy at room temperature is
S�ð298:15 KÞ ¼ ð277:027� 3:0Þ J K�1 mol�1
and the coefficients of the equations for the heat capacity are
C�p=ðJ K�1 mol�1Þ ¼ 44:35744þ 37:63585 10�3ðT=KÞ
� 23:15563 10�6ðT=KÞ2 þ 5:50268
10�9ðT=KÞ3 � 0:7485093
105ðT=KÞ�2
for the 298.15–1500 K range, and
C�p=ðJ K�1 mol�1Þ ¼ 59:57586þ 5:392403 10�3ðT=KÞ
þ 0:09463181 10�6ðT=KÞ2� 0:1028723 10�9ðT=KÞ3� 6:319451 105ðT=KÞ�2
for the 1500–4000 K range.
6.7.2. Enthalpy of formation
The enthalpy of formation for UO2(g) is calculated from
the enthalpy of sublimation of UO2(cr). The results of the
determination of the enthalpy of sublimation of UO2 are listed
in Table 74. Mass-spectrometric investigations (see e.g.,
Pattoret et al.515) have shown that the vapor over congruently
vaporizing uranium dioxide of slightly substoichiometric
composition mainly consists of UO2 molecules; UO and UO3
molecules are present in the vapor with the total pressure of
several % of UO2(g). To derive the selected value of the
enthalpy of sublimation, the UO(g) andUO3(g) pressureswere
subtracted from the total pressure of uranium-bearing species.
J. Phys. Chem. Ref. Data, Vol. 43, No. 1, 2014ject to the terms at: http://scitation.aip.org/termsconditions. Downloaded to IP:
27 Apr 2014 17:09:58

TABLE 74. The enthalpy of sublimation of UO2(g), in kJ mol�1
Authors Methoda T/K ΔsubH°(298.15 K)
Ackermann et al.531 K 1600–2200 628.2 � 10
Ivanov et al.532 b 1930–2160 623.4 � 10
Voronov et al.525 L 1723–2573 641.9 +10/-20
Ohse533 K 2278–2768 622.5 � 10
Gorban’ et al.534 K 1850–2600 618.9 � 12
Pattoret et al.515 KþM 1890–2420 621.5 � 8
Tetenbaum and
Hunt535T 2080–2705 629.3 � 12
Reedy and
Chasanov536T 2615–3391 614.8 � 18
Ackermann and
Tetenbaum526
M 1540–2315 626.2 � 15
Selected value: 622.9 � 12
aK ¼ Knudsen effusion; L¼ Langmuir; M ¼ mass spectrometry ; T ¼transpiration.bVaporization from a cylindrical crucible; results of weight-loss measure-
ments are close to those of Knudsen effusion.
TABLE 75. Molecular constants of 238U16O(g)
Te ωe ωexe Be αe103 De10
7
reNo. State cm�1 pm pi
0a X(1)4 0 888.5 3.1 0.3346 3.2 1.9c 183.3 2
1a (2)4 294 2
2a (1)3 652 2
3a (1)2 958 2
4a (1)5 1043 2
5b 1200 3
6b 1500 2
7a (3)4 1574 2
8a (3)3 1941 2
9b 2225 7 d
10b 2450 3
11b 4500 7 e
12b 5200 9
13b 5700 15
14b 7500 38
15b 10 000 116
16b 12 500 238
17b 15 000 375
18b 20 000 615
19b 25 000 1060
20b 30 000 1125
21b 35 000 1215
22b 40 000 1610
23b 45 000 1615
aExperimental state.bEstimated state.
013101-72 KONINGS ET AL.
This a
The values of p(UO)þ p(UO3) were calculated using thermo-
dynamic data from Gurvich et al.180; they amounted from
≈0.01 p(total) at 1600 K to ≈0.24 p(total) at 3400 K.
The selected enthalpy of sublimation of UO2(g) is obtained
from the data presented in Table 74 as a weighted average:
ΔsubH°(UO2, cr, 298.15) = (622.9� 12) kJ mol�1. The data of
Voronov et al.525 and of Ackermann and Tetenbaum526 were
not taken into account. In the former work, free evaporation of
a uranium dioxide rod heated by electric current might lead to
serious errors due to nonuniformity of the rod temperature and
to a non unity evaporation coefficient of the substance. The
result obtained by Ackermann and Tetenbaum526 is formally
close to the selected value. However, independent sensitivity
calibration of the mass-spectrometric equipment was not
carried out. Instead, p(UO2) at the temperature 2050 K was
taken equal to an averaged value of all published data.
Combination of the enthalpy of sublimation with the
selected enthalpy of formation of UO2(cr) gives the selected
value:
DfH�ðUO2; g; 298:15Þ ¼ �ð462:1� 12Þ kJmol�1:
This value corresponds to an atomization energyD0(UO2, g)¼(1486.8 � 15) kJ mol�1.
In the above analysis the data of laser heating experiments
on uranium dioxide and other techniques (see, e.g., Ohse
et al.,527 Breitung and Reil,528 Pflieger et al.529) were not
discussed. We have preferred the data which allow unambig-
uous application of thermodynamics of ideal gases, and to
avoid difficulties in extracting the UO2(g) partial pressure
from the total pressure values at very high temperatures (up to
8000 K), complicated by the possibility of substantial devia-
tion of the vapor from the ideal gas behavior. Nevertheless,
extrapolation of our results into the region of extremely high
temperatures shows satisfactory agreement with experimental
data and results derived from the equation of state of uranium
dioxide summarized by Fink.530
J. Phys. Chem. Ref. Data, Vol. 43, No. 1, 2014rticle is copyrighted as indicated in the article. Reuse of AIP content is sub
78.131.95.159 On: Sun,
6.8. UO(g)
6.8.1. Heat capacity and entropy
The thermal functions of UO(g) in the standard state have
been calculated using the data given in Table 75.
Electronic spectra of the uranium monoxide molecule were
studied by Kaledin et al.537 in absorption and emission, by
Heaven et al.538 at the laser excitation of jet cooled UO (U16O
and U18O), by Kaledin et al.539 Gurvich et al.540 and Kaledin
et al.258 (U16O and U18O) in fluorescence, and by Kaledin and
Heaven541 by means of resonantly enhanced two photon
ionization with mass selected ion detection (U16O and
U18O). The studies gave information about the ground XΩ¼ 4 (v� 6) state, 8 low-lying and about 20 higher-lying excited
electronic states. The ground stateΔG1/2 value was found to be
882.351 cm�1. In addition, the bond distance was determined
to be 183.83 pm by Kaledin et al.258
Infrared spectra of matrix-isolated uranium oxide species
were investigated by Carstens et al.,542 Gabelnick et al.,501
Abramowitz andAcquista,543 Hunt andAndrews,503 and Zhou
et al.506 The bands observed near 820 cm�1 in the Ar and Kr
matriceswere assigned to theUOmolecule.Gabelnick et al.501
determined also the anharmonicity value. In the IR spectrumof
uranium oxides isolated in Ne matrix the band assigned to
UO was that at 882.4 cm�1.506 Most quantum chemical
calculations257,460,506,544,545 gave harmonic vibrational fre-
quency values between 845–858 taking into account the
anharmonicity and matrix-shift effects in good agreement
with the Ar-matrix value. Compared to these values, however,
the frequency measured in the Ne matrix is too high.
ject to the terms at: http://scitation.aip.org/termsconditions. Downloaded to IP:
27 Apr 2014 17:09:58

THERMODYNAMIC PROPERTIES OF LANTHANIDE AND ACTINIDE OXIDE COMPOUNDS 013101-73
This a
The reason of these discrepancies is that the ground state
vibrational levels of gaseous UO are irregular. Kaledin and
Kulikov,546 Kaledin et al.547 found that three lowest Ω ¼ 4
states were mutually perturbed. Kaledin et al.258 performed
deperturbation of these levels to determine adiabatic mole-
cular constants. The deperturbed constant ωe ¼ 846.5 cm�1
agreed well with the bands observed in IR spectra of matrix-
isolated uranium oxides (taking into account the well-known
red shift in matrices) and with theoretical predictions.
The information on the excited states is not sufficient for the
calculation of the thermal functions. To estimate the electronic
partition function we use the results of the Ligand field theory
calculations by Kaledin et al.258 All but one low-lying states
were assigned to f3s and theΩ¼ 4 state with energy 294 cm�1
to f2s2 configurations. In the present work, the detailed experi-
mental or calculated data on low-lying electronic states up to
7500 cm�1 are taken into account; the calculated data on the
f3s, f2s2, d2s2, f2ds, f3d, f2d2, f2p2, f2ps, f4, fds2, and f2dp
electronic states in the range 7500–45 000 cm�1 are given in
Table 75 as united terms with the fixed energies and the
corresponding statistical weights.
The ground state molecular constants of UO selected for the
thermal functions calculations (see Table 75) are estimated
from the experimental value ΔG1/2 ¼ 882.351 cm�1 and the
adopted value of the dissociation energy; these constants
describe correctly the v ¼ 0 and 1 levels. The simple pre-
sentation of the vibrational-rotational energy levels used in our
program does not permit to recalculate levels from the deper-
turbed values of constants. Use of the deperturbed constants
(ωe ¼ 846.5 cm�1and ωexe ¼ 2.3 cm�1) would lead to large
underestimation of the v ¼ 1 level energy. Moreover the
vibrational constants assumed are close to the mean of those
for three lowest Ω ¼ 4 states (846, 935, and 843 cm�1), and
with simplification used in our program that
QðiÞvib;rot ¼ ðpi=pXÞQðXÞ
vib;rot our choice should give better results.
The derived standard entropy at room temperature is
S�ð298:15 KÞ ¼ ð252:137� 1:0Þ J K�1 mol�1
and the coefficients of the equations for the heat capacity are
C�p=ðJ K�1 mol�1Þ ¼ 38:48092þ 33:0187 10�3ðT=KÞ
� 40:4519 10�6ðT=KÞ2
þ 14:7496 10�9ðT=KÞ3
� 5:15534 105ðT=KÞ�2
TABLE 76. The enthalpy of formation of UO(g), in kJ mol�1
Authors Methoda T/K
Drowart et al.514 M 2130–2530 UO(g
M 1700–2150 12U(
Coppens et al.208 M 2238–2315 UO(g
Ackermann et al.548 M 1540–2150 12U
Steiger and Cater549 M 2148–2369 U(g)
Younés et al.221 M 1930–2280 UO(g
Selected value: D
aM = mass spectrometry.
rticle is copyrighted as indicated in the article. Reuse of AIP content is sub
78.131.95.159 On: Sun,
for the 298.15–1300 K range, and
C�p=ðJ K�1 mol�1Þ ¼ 50:04939� 18:1106 10�3ðT=KÞ
þ 12:3772 10�6ðT=KÞ2
� 1:71438 10�9ðT=KÞ3
þ 2:50947 106ðT=KÞ�2
for the 1300–4000 K range.
6.8.2. Enthalpy of formation
The results of determination of the enthalpy of formation of
UO(g) are listed in Table 76. Frommany works published, the
most reliable mass spectrometric data including reference
species with well established thermodynamic properties were
chosen for the calculation of the enthalpy of formation. The
selected enthalpy of formation value
DfH�ðUO; g; 298:15KÞ ¼ ð21:4 � 10Þ kJmol�1
was obtained as a weighted average of results in Table 76 with
reduced weights for the most divergent values from works of
Ackermann et al.548 and Steiger and Cater.549 To the selected
enthalpy of formation corresponds dissociation energy of UO
(g) molecule D0(UO) ¼ (758.9 � 10) kJ mol�1.
6.9. NpO2(g)
6.9.1. Heat capacity and entropy
The thermodynamic functions of NpO2(g) in the standard
state in the temperature range 298.15–4000 K have been
calculated using the data given in Table 77.
Experimental data on molecular structure and spectra of
NpO2 are unknown. Neptunium dioxide was studied by rela-
tivistic DFT calculations by Liao et al.550 A linear structure of
D1h symmetry was found for the X4Σg ground state and the
first excited state 4Hg lies only 0.01 eV (≈80 cm�1) aboveX4Σgstate. According to Liao et al.550 this small difference leaves
the identity of the ground state in some doubt. The recent study
of Infante et al.462 at the SO-CASPT2 level clarified the
electronic ground state to be 4H3.5g. This state has a linear
structure too and an equilibrium bond distance of re(Np–O)¼176.1 pm, which was adopted for computing the principal
moment of inertia of NpO2.
Reaction ΔrH°(298.15 K) ΔfH°(298.15 K)
)þSi(g) = U(g) þ SiO(g) �36.6 20.7
l) þ 12UO2(cr) = UO(g) 569.9 27.4
) þ B(g) = U(g) þ BO(g) �40.2 18.1
(l) þ 12UO2(g) = UO(g) 582.0 39.5
þ YO(g) = UO(g) þ Y(g) �51.0 12.4
)þ La(g) = U(g)þ LaO(g) �32.8 14.8
0(UO) = 758.9 � 10 21.4 � 10
J. Phys. Chem. Ref. Data, Vol. 43, No. 1, 2014ject to the terms at: http://scitation.aip.org/termsconditions. Downloaded to IP:
27 Apr 2014 17:09:58
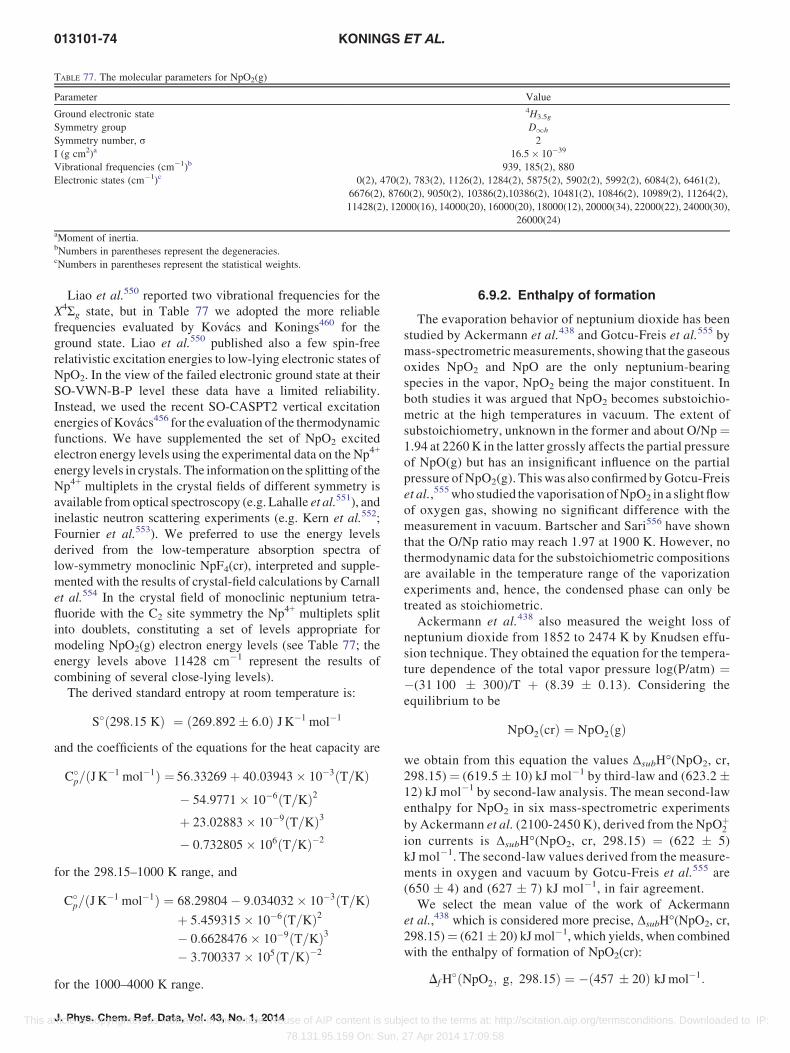
TABLE 77. The molecular parameters for NpO2(g)
Parameter Value
Ground electronic state 4H3.5g
Symmetry group D1h
Symmetry number, σ 2
I (g cm2)a 16.5 10�39
Vibrational frequencies (cm�1)b 939, 185(2), 880
Electronic states (cm�1)c 0(2), 470(2), 783(2), 1126(2), 1284(2), 5875(2), 5902(2), 5992(2), 6084(2), 6461(2),
6676(2), 8760(2), 9050(2), 10386(2),10386(2), 10481(2), 10846(2), 10989(2), 11264(2),
11428(2), 12000(16), 14000(20), 16000(20), 18000(12), 20000(34), 22000(22), 24000(30),
26000(24)
aMoment of inertia.bNumbers in parentheses represent the degeneracies.cNumbers in parentheses represent the statistical weights.
013101-74 KONINGS ET AL.
This a
Liao et al.550 reported two vibrational frequencies for the
X4Σg state, but in Table 77 we adopted the more reliable
frequencies evaluated by Kovács and Konings460 for the
ground state. Liao et al.550 published also a few spin-free
relativistic excitation energies to low-lying electronic states of
NpO2. In the view of the failed electronic ground state at their
SO-VWN-B-P level these data have a limited reliability.
Instead, we used the recent SO-CASPT2 vertical excitation
energies ofKovács456 for the evaluation of the thermodynamic
functions. We have supplemented the set of NpO2 excited
electron energy levels using the experimental data on the Np4+
energy levels in crystals. The information on the splitting of the
Np4+ multiplets in the crystal fields of different symmetry is
available from optical spectroscopy (e.g. Lahalle et al.551), and
inelastic neutron scattering experiments (e.g. Kern et al.552;
Fournier et al.553). We preferred to use the energy levels
derived from the low-temperature absorption spectra of
low-symmetry monoclinic NpF4(cr), interpreted and supple-
mented with the results of crystal-field calculations by Carnall
et al.554 In the crystal field of monoclinic neptunium tetra-
fluoride with the C2 site symmetry the Np4+ multiplets split
into doublets, constituting a set of levels appropriate for
modeling NpO2(g) electron energy levels (see Table 77; the
energy levels above 11428 cm�1 represent the results of
combining of several close-lying levels).
The derived standard entropy at room temperature is:
S�ð298:15 KÞ ¼ ð269:892� 6:0Þ J K�1 mol�1
and the coefficients of the equations for the heat capacity are
C�p=ðJ K�1 mol�1Þ ¼ 56:33269þ 40:03943 10�3ðT=KÞ
� 54:9771 10�6ðT=KÞ2
þ 23:02883 10�9ðT=KÞ3
� 0:732805 106ðT=KÞ�2
for the 298.15–1000 K range, and
C�p=ðJ K�1 mol�1Þ ¼ 68:29804� 9:034032 10�3ðT=KÞ
þ 5:459315 10�6ðT=KÞ2� 0:6628476 10�9ðT=KÞ3� 3:700337 105ðT=KÞ�2
for the 1000–4000 K range.
J. Phys. Chem. Ref. Data, Vol. 43, No. 1, 2014rticle is copyrighted as indicated in the article. Reuse of AIP content is sub
78.131.95.159 On: Sun,
6.9.2. Enthalpy of formation
The evaporation behavior of neptunium dioxide has been
studied by Ackermann et al.438 and Gotcu-Freis et al.555 by
mass-spectrometricmeasurements, showing that the gaseous
oxides NpO2 and NpO are the only neptunium-bearing
species in the vapor, NpO2 being the major constituent. In
both studies it was argued that NpO2 becomes substoichio-
metric at the high temperatures in vacuum. The extent of
substoichiometry, unknown in the former and about O/Np¼1.94 at 2260K in the latter grossly affects the partial pressure
of NpO(g) but has an insignificant influence on the partial
pressure ofNpO2(g). Thiswas also confirmed byGotcu-Freis
et al.,555who studied the vaporisation ofNpO2 in a slight flow
of oxygen gas, showing no significant difference with the
measurement in vacuum. Bartscher and Sari556 have shown
that the O/Np ratio may reach 1.97 at 1900 K. However, no
thermodynamic data for the substoichiometric compositions
are available in the temperature range of the vaporization
experiments and, hence, the condensed phase can only be
treated as stoichiometric.
Ackermann et al.438 also measured the weight loss of
neptunium dioxide from 1852 to 2474 K by Knudsen effu-
sion technique. They obtained the equation for the tempera-
ture dependence of the total vapor pressure log(P/atm) ¼�(31 100 � 300)/T þ (8.39 � 0.13). Considering the
equilibrium to be
NpO2ðcrÞ ¼ NpO2ðgÞ
we obtain from this equation the values ΔsubH°(NpO2, cr,
298.15)¼ (619.5 � 10) kJ mol�1 by third-law and (623.2 �12) kJ mol�1 by second-law analysis. The mean second-law
enthalpy for NpO2 in six mass-spectrometric experiments
by Ackermann et al. (2100-2450 K), derived from the NpOþ2
ion currents is ΔsubH°(NpO2, cr, 298.15) ¼ (622 � 5)
kJ mol�1. The second-law values derived from the measure-
ments in oxygen and vacuum by Gotcu-Freis et al.555 are
(650 � 4) and (627 � 7) kJ mol�1, in fair agreement.
We select the mean value of the work of Ackermann
et al.,438 which is considered more precise, ΔsubH°(NpO2, cr,
298.15)¼ (621� 20) kJ mol�1, which yields, when combined
with the enthalpy of formation of NpO2(cr):
DfH�ðNpO2; g; 298:15Þ ¼ �ð457 � 20Þ kJmol�1:
ject to the terms at: http://scitation.aip.org/termsconditions. Downloaded to IP:
27 Apr 2014 17:09:58

TABLE 78. Molecular constants of 237Np16O(g)
Te ωe ωexe Be αe103 De10
7
reNo. State cm�1 pm pi
0 X0.5 0 840 2.92 0.334 1.6 2.1 183.5 2
1 200 2
2 700 4
3 1200 6
4 2600 18
5 4000 24
6 5300 16
7 6600 32
8 8100 20
9 10 000 40
10 15 000 100
11 20 000 200
12 25 000 600
13 30 000 900
14 35 000 1000
15 40 000 1200
THERMODYNAMIC PROPERTIES OF LANTHANIDE AND ACTINIDE OXIDE COMPOUNDS 013101-75
This a
6.10. NpO(g)
6.10.1. Heat capacity and entropy
The thermal functions of NpO(g) in the standard state in the
temperature range 298.15–4000 K have been calculated using
the data given in Table 78.As therewere no spectral data on the
NpO molecule at the time of writing of this review, the
molecular constants were estimated using the trends revealed
in the spectral data of the lanthanide monoxides. The electro-
nic structure of the NpO molecule is assumed to be analogous
to that of PmO. The energies of the ground state 4f46s super-
configuration rounded to 2 significant digits were taken from
the Ligand field calculation by Dulick et al.,247 the energies of
the other states were estimated as for PmO with small correc-
tion due to a little difference between relative positions the
atomic states of the 5f4 core. These values fairly well agree
with the results of recent quantum chemical studies of Infante
et al.462 and Kovács and Konings.460
The derived standard entropy at room temperature is
S�ð298:15 KÞ ¼ ð253:060� 4:0Þ J K�1 mol�1
and the coefficients of the equations for the heat capacity are
C�p=ðJ K�1 mol�1Þ ¼ 40:73102þ 5:06903 10�3ðT=KÞ
þ 5:58835 10�6ðT=KÞ2
� 3:26062 10�9ðT=KÞ3
� 3:95105 105ðT=KÞ�2
TABLE 79. The enthalpy of formation of NpO(g), in kJ mol�1
Authors Methoda T/K
Ackermann et al.557 M 1665–1972 NpO(g)
M 1173–1972 Np(g) þSelected value: D0(NpO
aM = mass spectrometry.
rticle is copyrighted as indicated in the article. Reuse of AIP content is sub
78.131.95.159 On: Sun,
for the 298.15–1400 K range, and
C�p=ðJ K�1 mol�1Þ ¼ 53:06105þ 1:44612 10�3ðT=KÞ
� 1:95684 10�6ðT=KÞ2
þ 0:362588 10�9ðT=KÞ3
� 5:12159 106ðT=KÞ�2
for the 1400–4000 K range.
6.10.2. Enthalpy of formation
In their study of the vaporisation of neptunium dioxide,
Ackermann et al.557 have revealed nonstoichiometric and not
single-mode NpO2 evaporation, excluding the determination
of thermodynamic properties of NpO(g) directly from the
effusion measurements. The thermodynamic properties of the
NpO(g) molecule were determined by Ackermann and
Rauh558 from mass-spectrometric measurements of equili-
brium constants for two oxygen-exchange reactions, NpO
(g) þ La(g) ¼ Np(g) þ LaO(g) and Np(g) þ YO(g) ¼ NpO
(g) þ Y(g). Results of the calculation of the enthalpy of
formation from both reactions are given in Table 79. For both
reactions, the results are in good agreement.
The selected value
DfH�ðNpO; g; 298:15 KÞ ¼ �ð16:6 � 10:0Þ kJmol�1
is taken as a weighted mean of two values obtained, with the
weight ofNpO(g)þLa(g) equilibrium twice as that ofNp(g)þYO(g), due to the higher statistical errors of the latter. To the
selected enthalpy of formation corresponds the value of dis-
sociation energy,D0(NpO)¼ (734.8� 10) kJmol�1. This is in
good agreement with the value (744� 21) kJ mol�1 estimated
by Marçalo and Gibson500 on the basis of gas phase oxidationreactions involving the ionised species and known ionisation
energies.
6.11. PuO3(g)
6.11.1. Heat capacity and entropy
The thermodynamic functions of PuO3(g) in the standard
state in the temperature range 298.15–4000 K have been
calculated using the data given in Table 80. There are no
experimental data on molecular structure and spectra of PuO3.
Gao et al.559 and Zaitsevskii et al.560 have calculated the
molecular structure for PuO3 by Hartree-Fock and DFT meth-
ods. The results of the calculations show that the PuO3
molecule has a planar structure of C2v symmetry similar to
Reaction ΔrH°(298.15 K) ΔfH°(298.15 K)
þ La(g) = Np(g) þ LaO(g) �63.6 �15.2
YO(g) = NpO(g) þ Y(g) �22.0 �19.6
) ¼ 734.8 � 10 �16.6 � 10
J. Phys. Chem. Ref. Data, Vol. 43, No. 1, 2014ject to the terms at: http://scitation.aip.org/termsconditions. Downloaded to IP:
27 Apr 2014 17:09:58

TABLE 80. The molecular parameters for PuO3(g)
Parameter Value
Ground electronic state 7B1
Symmetry group C2v
Symmetry number, σ 2
IAIBIC (g3 cm6)a 4810 10�117
Vibrational frequencies (cm�1) 840, 700, 170, 800, 190, 145
Electronic states (cm�1)b 0(2), 2530(1), 4870(2), 6700(2), 10334(1), 10983(2), 11225(1), 11651(2), 12326(1),
16713(1), 17737(2), 18565(2), 20029(1), 22703(2), 22889(2), 23022(2), 29710(2),
32198(2), 32759(1), 34080(2), 34702(2), 34982(2)
aProduct of moments of inertia.bNumbers in parentheses represent the statistical weights.
013101-76 KONINGS ET AL.
This a
that of UO3. Themolecular constants of PuO3 obtained byGao
et al.559 seem unreliable being significantly different from the
corresponding molecular constants of UO3. The product of the
principal moments of inertia of PuO3 (see Table 80) is
calculated using re(Pu–O)¼ (185� 5) pm (two equal bonds),
re(Pu–O′)¼ (190� 5) pm, and ffO–Pu–O¼ (160� 10)°. Thebond distances are estimated by comparison with molecular
constants of UO, UO2, UO3, PuO, and PuO2. The value of the
O–Pu–O bond angle is accepted to be equal to that in UO3
molecule (see UO3).
The vibrational frequencies calculated by Gao et al.,559
which have too low values, were not used for estimation of
vibrational contribution to the PuO3 thermodynamic func-
tions. The values of vibrational frequencies (see Table 80)
are estimated by comparison with corresponding frequencies
adopted for UO, UO2, UO3, PuO, and PuO2 molecules.
According to the calculations of Gao et al.,559 the PuO3
molecule has a 7B1 ground state. Experimental and theore-
tical investigations of PuO3 excited electron energy levels
are unknown. The energy levels of PuO3 are assumed to be
approximately the same as for the isoelectronic ion PuO2þ2
(configuration [Rn]5f2). These energy levels have been
obtained by Infante et al.561 using the novel relativistic
intermediate Hamiltonian Fock-space coupled-cluster
method.
The derived standard entropy at room temperature is
S�ð298:15 KÞ ¼ ð319:450� 4Þ J K�1 mol�1
and the coefficients of the equations for the heat capacity
are
C�p=ðJ K�1 mol�1Þ ¼ 52:89593þ 75:46988 10�3ðT=KÞ
� 71:42497 10�6ðT=KÞ2
þ 25:87474 10�9ðT=KÞ3
� 3:753825 105ðT=KÞ�2
for the 298.15–900 K range, and
C�p=ðJ K�1 mol�1Þ ¼ 76:50587þ 8:903191 10�3ðT=KÞ
� 1:504422 10�6ðT=KÞ2þ 0:07709618 10�9ðT=KÞ3� 16:13944 105ðT=KÞ�2
for the 900 K–4000 K range.
J. Phys. Chem. Ref. Data, Vol. 43, No. 1, 2014rticle is copyrighted as indicated in the article. Reuse of AIP content is sub
78.131.95.159 On: Sun,
6.11.2. Enthalpy of formation
Krikorian et al.562 have carried out transpiration experi-
ments to study the volatility of PuO2(cr) in the presence of
oxygen and steam. In experiments in presence of oxygen,
it was expected, in analogy to uranium vaporisation beha-
vior, that volatilization can occur to PuO3(g) species, with
insignificant amounts of the known plutonium oxide species,
PuO(g) and PuO2(g), according to known thermodynamic
data. The existence of the PuO3 vapor species was later
confirmed by Ronchi et al.563 who detected the molecule
in mass-spectrometric study of vapors over plutonium di-
oxide. Krikorian et al.562 used their data for 1 atm oxygen
gas present (3 points, 1482 and 1483 K) to obtain the
pressures of PuO3(g) and to calculate equilibrium constants
Kp ¼ p(PuO3)/a(PuO2)p(O2)1/2), for the reaction
PuO2ðsÞ þ 1
2O2ðgÞ ¼ PuO3ðgÞ:
Taking the activity of PuO2(cr) as unity, Krikorian et al.562
obtained an average third-law value ΔrH°(298.15 K) ¼(493.0 � 4.9) kJ mol�1 (uncertainty is standard deviation).
We have recalculated the equilibium constants of the above
reaction with the thermodynamic functions for PuO2(cr) and
PuO3(g) adopted in this assessment: ΔrH°(298.15 K) ¼(488.2 � 15) kJ mol�1, with an estimate of total uncertainty.
Combining this value with the enthalpy of formation of
PuO2(cr) gives the adopted value
DfH�ðPuO3; g ; 298:15Þ ¼ �ð567:6 � 15Þ kJmol�1:
6.12. PuO2(g)
6.12.1. Heat capacity and entropy
The thermodynamic functions of PuO2(g) in the stan-
dard state have been calculated using the data given in
Table 81.
The only experimental study on the molecular properties of
PuO2 is the infrared spectroscopic measurement of PuO2
isotopomers in Ar and Kr matrices by Green and Reedy.564
The O-Pu-O bond angle of 180° was calculated from the
measured isotope shift. This is consistent with the absence of
peaks attributable to ν1 for the case of Pu16O2 and Pu18O2.
There are no experimental data on Pu–O bond distance in
ject to the terms at: http://scitation.aip.org/termsconditions. Downloaded to IP:
27 Apr 2014 17:09:58

TABLE 81. The molecular parameters for PuO2(g)
Parameter Value
Ground electronic state 5ΣgSymmetry group D1h
Symmetry number, σ 2
I (g cm2)a 18.0 10�39
Vibrational frequencies (cm�1)b 792, 109(2), 828
Electronic states (cm�1)c 0(1), 420(1), 513(1), 516(1), 525(1), 1077(1), 1079(1), 1358(1), 1383(1), 4955(1),
5094(1), 5149(1), 5149(1), 5208(1), 5277(1), 5390(1), 5571(1), 5571(1), 5698(1),5698(1),
8700(3), 9400(12), 10400(3), 11700(5), 12500(11)
aMoment of inertia.bNumbers in parentheses represent the degeneracies.cNumbers in parentheses represent the statistical weights.
THERMODYNAMIC PROPERTIES OF LANTHANIDE AND ACTINIDE OXIDE COMPOUNDS 013101-77
This a
PuO2. The principal moment of inertia of PuO2 (see Table 81)
is calculated using re(Pu–O)¼ (184� 5) pm. This value is an
average of two bond distances (181.2 and 187.0 pm) obtained
in ab initio calculations of Liao et al.550 and Archibong and
Ray.565 The recent computational study by Zaitsevskii et al.560
is in fair agreement.
The adopted values of PuO2 vibrational frequencies (see
Table 81) are taken from the ab initio calculation of Archibong
and Ray565 at the CCSD(T) level. The adopted values ν1 and ν3correlate with the results of density-functional method includ-
ing spin-orbit effects.
There are no experimental data on electronic spectra of
PuO2. Only results obtained in theoretical calculations are
available. According to the calculations made by Liao
et al.550 and Archibong and Ray565 the ground state of PuO2
is X5Σg. Both calculations do not take into consideration the
effects of spin-orbit interactions and present limited num-
bers of energy levels. Therefore, these data were not used for
the evaluation of electronic contribution to the PuO2 ther-
modynamic functions. We preferred to use the energy levels
derived from the low-temperature absorption spectra of low-
symmetry monoclinic PuF4(cr), interpreted and supplemen-
ted with the results of crystal-field calculations by Carnall
et al.554 In the crystal field of monoclinic plutonium tetra-
fluoride with the C2 site symmetry the Pu4+ multiplets split
into singlets. These singlet levels were used for modeling
PuO2(g) levels (see Table 81; the energy levels above 5698
cm�1 represent the results of combining of several close-
lying levels).
The derived standard entropy at room temperature is
S�ð298:15 KÞ ¼ ð278:741� 5Þ J K�1 mol�1
and the coefficients of the equations for the heat capacity
are
C�p=ðJ K�1 mol�1Þ ¼ 70:29021� 13:46001 10�3ðT=KÞ
þ 9:065878 10�6ðT=KÞ2� 1:403447 10�9ðT=KÞ3� 4:810746 105ðT=KÞ�2
for the 298.15–1500 K range, and
rticle is copyrighted as indicated in the article. Reuse of AIP content is sub
78.131.95.159 On: Sun,
C�p=ðJ K�1 mol�1Þ ¼ 49:85911þ 11:46596 10�3ðT=KÞ
� 1:472281 10�6ðT=KÞ2� 8:555747 10�12ðT=KÞ3þ 41:20745 105ðT=KÞ�2
for the 1500–4000 K range.
6.12.2. Enthalpy of formation
Total pressure over substoichiometric plutonium dioxide
was measured in several investigations. Phipps et al.566
employed theKnudsen effusionmethod tomeasure total vapor
pressures between 1593 and 2063 K; evaporation was per-
formed from a tantalum effusion cell. The authors came to
conclusion that “reduction of plutonium dioxide occurs when
it is heated in vacuum in a tantalum oven.” Mulford and
Lamar567 reported the vapor pressure data of plutonium diox-
ide measured at temperatures between 2000 and 2400 K using
tungsten Knudsen effusion cells. The effusion rates were
considerably less than those observed by Phipps. Pardue and
Keller568 measured the vapor pressure of plutonium dioxide in
air, argon, and oxygen at temperatures between 1723 and 2048
K, using the transpiration technique. Total vapor pressures of
PuO2�x compositions were measured by Messier569 gravime-
trically with tungsten Knudsen cells from 2070 to 2380 K, and
the vapor pressure equation for the composition approximat-
ing the congruent one, PuO1.82, was obtained. According to
mass-spectrometric measurements of Battles et al.,570 PuO(g)
is the major species in the vapor phase of the Pu2O3 + PuO1.61
system. In nonreducing atmosphere PuOpressure significantly
diminishes. Nevertheless, its part in the total vapor pressure
must be taken into account in deriving PuO2 pressure over
PuO2�x phase.
Extensive experimental study and detailed thermodynamic
analysis of the vaporization of the substoichiometric pluto-
nium dioxide has been carried out by Ackermann et al.438 The
rates of evaporation of plutonium-bearing species from the
plutonium dioxide phase in the range 1646–2104 K were
measured by the effusion method. The effusion cells were
made from tungsten, rhenium, and tantalum. The results
obtained with tungsten and rhenium cells were found to be
in good agreement. The total pressure calculated under
assumption of PuO2(g) as the only vapor species was
J. Phys. Chem. Ref. Data, Vol. 43, No. 1, 2014ject to the terms at: http://scitation.aip.org/termsconditions. Downloaded to IP:
27 Apr 2014 17:09:58

TABLE 82. Molecular constants of 239Pu16O(g)
Te ωe ωexe Be αe103 De10
7
reNo. State cm�1 pm pi
0a X0�c 0 830 3.1 0.33 1.6 2.13 184.0 1
1b 150 2
2b 600 3
3b 900 2
4b 1300 2
5b 1600 6
6b 2000 2
7b 2400 8
8b 3100 22
9b 4200 20
10b 5000 4
11b 10 000 20
12b 15 700 120
13b 20 000 320
14b 25 000 340
15b 30 000 470
16b 35 000 1640
17b 40 000 2400
aAssumed to be analogous to SmO(g).bEstimated state.
013101-78 KONINGS ET AL.
This a
approximated by the equation
logðp=atmÞ ¼ �ð29620 � 280Þ=ðT=KÞ þ ð7:50� 0:15Þ:The above equation corresponds to evaporation of the PuO1.92
composition, which did not significantly change during the
time of measurements. Results obtained with the tantalum
effusion cell, i.e. under reducing conditions, correspond to the
univariant evaporation of the Pu2O3 + PuO1.61 system. Using
data on evaporation in reducing conditions, free energy of
formation of PuO(g) was derived and the PuO(g) pressure over
PuO1.92 phase was calculated. Values of PuO2(g) pressure
evaluated in the 1600–2150K range were fitted to the equation:
logðp=atmÞ ¼ �29640=ðT=KÞ þ 7:67:
In combinationwith auxiliary data from literature, this equation
was usedbyAckermann et al.438 for deriving the linear equation
for the standard free energy of formation of PuO2(g), in cal/mol:
DfG�ðPuO2; gÞ ¼ �113100þ 4:35ðT=KÞ:
This equation is combined with Gibs energy of formation of
PuO2(cr) for calculation of the PuO2(g) pressures over
stoichiometric PuO2(cr) in the 1650–2150 K temperature
range. With the pressure values so obtained we find the
third-law value for the enthalpy of sublimation: ΔsubH°(PuO2, s, 298.15) ¼ (643.9 � 15) kJ mol�1, yielding ΔfH°¼ �(411.9 � 15) kJ mol�1.
Gotcu-Freis et al.571 studied the evaporation of PuO2 by
mass spectrometry in vacuum and in a flow of low pressure
oxygen. Their results in vacuum are in excellent agreement
with most of the earlier studies, including Ackermann et al.438
They observed, however, a significant difference between the
measurement in vacuum and oxygen, suggesting that the
change in O/Pu ratio has an influence on the vaporisation
equilibria. From the analysis of the measurements in oxygen
considering the reaction PuO2(cr) ¼ PuO2(g) they obtained
ΔsubH°(298.15 K) ¼ (627 � 7) kJ mol�1 by second law
analysis and ΔsubH°(298.15 K)¼ (616� 6) kJ mol�1 by third
law analysis, corresponding to ΔfH° ¼ �(428 � 7) kJ mol�1
and ΔfH° ¼ �(440 � 6) kJ mol�1, respectively.
The selected value of PuO2(g) enthalpy of formation is
DfH�ðPuO2; g; 298:15Þ ¼ �ð428 � 20Þ kJmol�1:
6.13. PuO(g)
6.13.1. Heat capacity and entropy
The thermal functions of PuO(g) in the standard state have
been calculated using the data given in Table 82.
The electronic spectrum of PuO is unknown. The Pu16O and
Pu18O molecules were identified in Ar and Kr matrices by
Green and Reedy.564 Theωe andωexe values given in Table 82
were calculated using these data taking into account thematrix
shift (15 cm�1) from the condition of converging the vibra-
tional levels to the adopted dissociation limit. The internuclear
distance re¼ (184� 2) pm is estimated from the comparison of
J. Phys. Chem. Ref. Data, Vol. 43, No. 1, 2014rticle is copyrighted as indicated in the article. Reuse of AIP content is sub
78.131.95.159 On: Sun,
the re values in the grounds states for theCeOandNdOwith the
same values for the ThO and UO molecules.
Ab initio studies by Gao et al.572 and by Li and Xu573 gave
the ground state X5Σ�, re ¼ 183 pm, ωe ¼ 781.15 cm�1; the
latter value disagreed with the matrix data. The electronic
structure of PuO should be analogous to that of SmO,which has
the X0� ground state and near lying Ω ¼ 1 and Ω ¼ 2 states.
The ground state configuration of SmO is 4f56s, which does not
generate a 5Σ� state. Details of the Ab initio studies by Gao
et al.572 and by Li and Xu573 are not available. The information
was taken from abstracts in Chemical Abstract, where the
symmetry of the X5Σ�may be indicated erroneously. Theωe¼(830 � 10) cm�1 value, derived from the matrix spectra, is
characteristic for the 5fN�17s configuration: see ωe(UO) 846
(deperturbed value). In the present work for PuOwe assume the
electronic structure analogous to that of SmO. The more dense
structure (total statistical weight of excited states is equal to
5382) is due to the more close arrangement of the atomic states
of the 5f5 core PuIV.
The derived standard entropy at room temperature is
S�ð298:15 KÞ ¼ ð252:254� 3:0Þ J K�1 mol�1
and the coefficients of the equations for the heat capacity are
C�p=ðJ K�1 mol�1Þ ¼ 25:39529þ 54:2560 10�3ðT=KÞ
� 36:2549 10�6ðT=KÞ2
þ 6:47005 10�9ðT=KÞ3
þ 3:72127 104ðT=KÞ�2
for the 298.15–1200 K range, and
C�p=ðJ K�1 mol�1Þ ¼ 78:23663� 27:3687 10�3ðT=KÞ
þ 6:77906 10�6ðT=KÞ2
� 0:440726 10�9ðT=KÞ3
� 7:04572 106ðT=KÞ�2
for the 1200–4000 K range.
ject to the terms at: http://scitation.aip.org/termsconditions. Downloaded to IP:
27 Apr 2014 17:09:58

THERMODYNAMIC PROPERTIES OF LANTHANIDE AND ACTINIDE OXIDE COMPOUNDS 013101-79
This a
6.13.2. Enthalpy of formation
The total pressure of plutonium-bearing species in the
process of evaporation of plutonium oxides in tantalum cru-
cibles is well established and is interpreted to correspond to the
equilibrium state in the Pu2O3 þ PuO1.61 two-phase system
(see Cordfunke and Konings8). According to mass-spectro-
metric measurements by Battles et al.,570 PuO(g) is the major
species in the vapor phase of the Pu2O3þ PuO1.61 system. For
calculation of the enthalpy of formation of PuO(g) the data
obtained by Ackermann et al.438 were used. The data of this
paper are in good agreement with the work of Phipps et al.,566
as well as with data of Ohse,574 Messier569 and Gotcu-Freis
et al.571 The pressure of PuO2(g) in the system is small and can
be neglected. A small amount of Pu(g) was calculated from the
equilibrium constant for the reaction
2:584PuO1:161ðcrÞ ¼ 0:584PuðgÞ þ Pu2O3ðcrÞAfter correcting the total pressure for Pu(g), the enthalpy of
formation for PuO(g) was calculated from the enthalpy of
reaction
2:773Pu2O3ðcrÞ ¼ PuOðgÞ þ 4:545PuO1:161ðcrÞ þ 1:522O2ðgÞ:
The third-law value obtained, ΔrH°(298.15 K) = 560.4
kJ mol�1 leads to the enthalpy of formation PuO(g), which
is selected:
D�f ðPuO; g; 298:15 KÞ ¼ �ð51:7� 15Þ kJmol�1
This value corresponds to the dissociation energy D0(PuO) =
(648.7 � 30) kJ mol�1. This is in good agreement with the
value (658 � 10) kJ mol�1 estimated by Marçalo and Gib-
son500 on the basis of gas phase oxidation reactions involving
the ionised species and known ionisation energies.
6.14. AmO2(g)
6.14.1. Heat capacity and entropy
The thermodynamic functions of AmO2(g) in the standard
state have been calculated using the data given in Table 83.
Experimental data on the molecular structure and spectra of
AmO2 are not available. Theoretical calculations of the structure
TABLE 83. The molecular parameters for AmO2(g)
Parameter Value
Ground electronic state X6Π2.5u
Symmetry group D1h
Symmetry number, σ 2
I (g cm2)a 17.35 10�39
Vibrational frequencies (cm�1)b 815, 105(2), 757
Electronic states (cm�1)c 0(2), 447(2), 5515(2), 6565(2), 12622(2),
15418(2), 15668(2), 16664(2), 18676(2),
21580(2), 21925(2), 22230(2), 22469(2),
23882(2), 25844(2), 28909(2)
aMoment of inertia.bNumbers in parentheses represent degeneracy.cNumbers in parentheses represent the statistical weights.
rticle is copyrighted as indicated in the article. Reuse of AIP content is sub
78.131.95.159 On: Sun,
of the AmO2 molecule have been made by Kovács et al.,575
which showed that themolecule has a linearD1h structurewith r
(Am-O)¼180.7pm.Theprincipalmomentof inertia ofAmO2 is
calculated from this value. Subsequent calculations by Infante
et al.462 provided details on the ground-state electronic structure
of the molecule. The harmonic and anharmonic vibrational
frequencies were calculated by Kovács and Konings460 using
DFT methods, while the most important low-lying electronic
states were reported in Ref. 575.
The derived standard entropy at room temperature is
S�ð298:15 KÞ ¼ ð279:464� 6Þ J K�1 mol�1
and the coefficients of the equations for the heat capacity are
C�p=ðJ K�1 mol�1Þ ¼ 52:7906þ 26:0768 10�3ðT=KÞ
� 27:1648 10�6ðT=KÞ2
þ 10:2293 10�9ðT=KÞ3
� 3:3759 105ðT=KÞ�2
for the 298.15–1000 K range, and
C�p=ðJ K�1 mol�1Þ ¼ 54:4906þ 7:17462 10�3ðT=KÞ
� 1:46280 10�6ðT=KÞ2
þ 0:13147 10�9ðT=KÞ3
þ 1:2604 106ðT=KÞ�2
for the 1000–4000 K range.
6.14.2. Enthalpy of formation
Gotcu-Freis et al.576 measured the vapor pressure over
AmO2�x identifying AmO(g), AmO2(g) and Am(g) as vapor
species. However, due to the strong change in the O/Am ratio
of the samples during the measurements, it is not possible to
derive the enthalpy of formation of AmO2(g) from these
results. Kovács et al.575 calculated the dissociation energy of
the reaction AmO2(g) ¼ AmO(g) + O(g) as 6.03 eV (581.8
kJ mol�1) using multiconfigurational relativistic quantum
chemical methods. From these date we obtain
DfH�ðAmO2; g; 298:15Þ ¼ �ð514:0 � 30Þ kJmol�1:
6.15. AmO(g)
6.15.1. Heat capacity and entropy
Thermal functions of AmO(g) in the standard state have
been calculated using the data given in Table 84.
As there is no spectral data on the AmO molecule, the
estimates of the molecular constants given in that table are
based on the trends revealed in the spectral data of the
lanthanide monoxides. After the completion of this assess-
ment, a few quantum chemical calculations on the molecular
geometry, ro-vibrational properties and low-lying electronic
states were published.460,462,575 Infante et al.462 confirmed the
electronic ground state of AmO to be X8Σ1/2. But significant
J. Phys. Chem. Ref. Data, Vol. 43, No. 1, 2014ject to the terms at: http://scitation.aip.org/termsconditions. Downloaded to IP:
27 Apr 2014 17:09:58

TABLE 84. Molecular constants of 243Am16O(g)
Te ωe ωexe Be αe103 De10
7
reNo. State cm�1 pm pi
0 X8Σ 0 700 2.95 0.311 1.7 2.461 190 8
1 5000 8
2 6000 16
3 7000 18
4 8000 28
5 12 000 50
6 15 000 30
7 20 000 30
8 25 000 430
9 30 000 2200
10 35 000 2800
11 40 000 3000
TABLE 85. Molecular constants of 247Cm16O(g)
Te ωe ωexe Be αe103 De10
7
re
013101-80 KONINGS ET AL.
This a
differences were found for the other properties (ωe ¼ 872
cm�1, re ¼ 180.1 pm).
The electronic structure of AmO is assumed to be analogous
to that of EuO. Small difference in the recommended statistical
weights of the united terms is due mainly to a little smaller
accepted energy of A8Σ(f6s) state.Uncertainties of the calculated thermal functions are due
mainly to the unknown energy of the first excited state
A8Σ(f6s). The minimum on the curve presented the variation
of the actinide oxides dissociation energy with the charge on
the actinide atoms implies that the ground state of the AmO
molecule is X8Σ(f7). However, as in case of EuO, the positionof A8Σ(f6s) is quite unclear.
The derived standard entropy at room temperature is
S�ð298:15 KÞ ¼ ð259:105� 5:0Þ J K�1 mol�1
and the coefficients of the equations for the heat capacity are
C�p=ðJ K�1 mol�1Þ ¼ 34:31966þ 6:13074 10�3ðT=KÞ
� 6:40603 10�6ðT=KÞ2
þ 4:00456 10�9ðT=KÞ3
� 2:68922 105ðT=KÞ�2
for the 298.15–1500 K range, and
C�p=ðJ K�1 mol�1Þ ¼ � 85:66885þ 111:574 10�3ðT=KÞ
� 30:2584 10�6ðT=KÞ2
þ 2:82855 10�9ðT=KÞ3
þ 4:35180 107ðT=KÞ�2
for the 1500–4000 K range.
No. State cm�1 pm pi0 X9Σ4 0 840 2.88 0.333 1.5 2.1 183.5 9
1 2300 7
2 10 000 18
3 17 000 50
4 20 000 65
5 25 000 120
6 30 000 400
7 35 000 1040
8 40 000 1500
6.15.2. Enthalpy of formation
No experimental measurement of the enthalpy of formation
AmO(g) is known. Estimates of this value can be made using
estimates of the AmO dissociation energy. The dissociation
energy of AmO(g) was estimated by Haire577 as 550 kJ mol�1
using correlation between dissociation energy and promotion
energy, needed for excitation of the free actinide atom in the ds2
J. Phys. Chem. Ref. Data, Vol. 43, No. 1, 2014rticle is copyrighted as indicated in the article. Reuse of AIP content is sub
78.131.95.159 On: Sun,
configuration. The estimation was confirmed by ICR mass
spectrometric study of reactivity of americium oxide ions by
Santos et al.578 From the results of experiments, Santos et al.
estimated D0(Am+-O) ¼ (580 � 50) kJ mol�1 and found the
ionization energy IE(AmO) ¼ (5.9 � 0.2) eV, or (569 � 20)
kJmol�1. Later,Marçalo andGibson500 revised the former value
to (560 � 28) kJ mol�1. The thermochemical relation
IEðAmOÞ þ D0ðAmþ � OÞ � IEðAmÞ ¼ D0ðAmOÞresulted in the value D0(AmO) ¼ 553 kJ mol�1, in agreement
with an previous estimate.577 The rounded value D0(AmO) ¼(550 � 50) kJ mol�1 is selected in this work. It corresponds to
DfH�ðAmO; g; 298:15KÞ ¼ �ð15 � 50Þ kJmol�1:
6.16. CmO(g)
6.16.1. Heat capacity and entropy
Thermal functions of CmO(g) in the standard state have
been calculated using the data given in Table 85. Since there is
no molecular data on the CmO molecule, the molecular
constants given in this table were estimated using the trends
revealed in the spectral data of the lanthanide monoxides. The
electronic structure is assumed to be analogous to that of GdO.
The more dense structure (total statistical weight of excited
states is estimated to be equal to 3209, that of GdO to 1834) is
due to the more dense arrangement of the atomic states of the
5f5 core CmIV. After the completion of this assessment, a few
quantum chemical calculations on themolecular geometry, ro-
vibrational properties and low-lying electronic states were
published.460,462,575 Infante et al.462 confirmed the electronic
ground state of CmO to be X9Σ4. The other properties agree
well with the estimated values.
The derived standard entropy at room temperature is
S�ð298:15 KÞ ¼ ð259:071� 5:0Þ J K�1 mol�1
and the coefficients of the equations for the heat capacity are
C�p=ðJ K�1 mol�1Þ ¼ 26:15923þ 23:0665 10�3ðT=KÞ
� 11:8949 10�6ðT=KÞ2
þ 1:83564 10�9ðT=KÞ3
� 3:50044 104ðT=KÞ�2
ject to the terms at: http://scitation.aip.org/termsconditions. Downloaded to IP:
27 Apr 2014 17:09:58
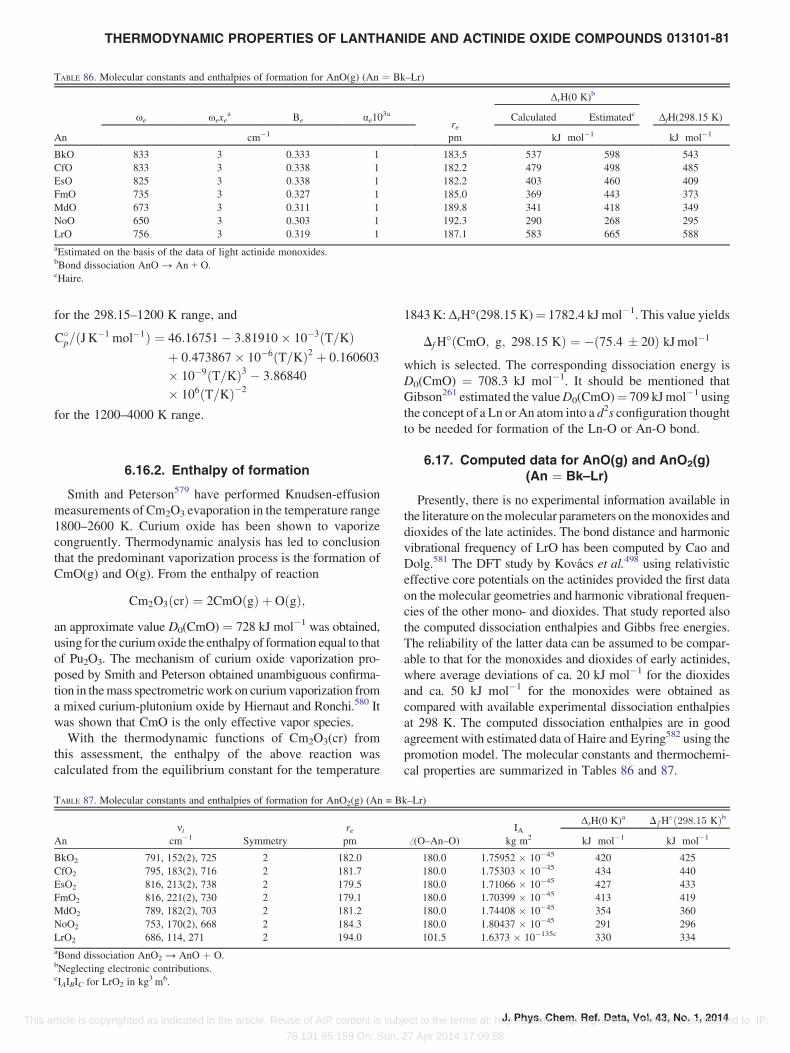
TABLE 86. Molecular constants and enthalpies of formation for AnO(g) (An ¼ Bk–Lr)
ΔrH(0 K)b
ωe ωexea Be αe10
3a
reCalculated Estimatedc ΔfH(298.15 K)
An cm�1 pm kJ mol�1 kJ mol�1
BkO 833 3 0.333 1 183.5 537 598 543
CfO 833 3 0.338 1 182.2 479 498 485
EsO 825 3 0.338 1 182.2 403 460 409
FmO 735 3 0.327 1 185.0 369 443 373
MdO 673 3 0.311 1 189.8 341 418 349
NoO 650 3 0.303 1 192.3 290 268 295
LrO 756 3 0.319 1 187.1 583 665 588
aEstimated on the basis of the data of light actinide monoxides.bBond dissociation AnO → An + O.cHaire.
THERMODYNAMIC PROPERTIES OF LANTHANIDE AND ACTINIDE OXIDE COMPOUNDS 013101-81
This a
for the 298.15–1200 K range, and
C�p=ðJ K�1 mol�1Þ ¼ 46:16751� 3:81910 10�3ðT=KÞ
þ 0:473867 10�6ðT=KÞ2 þ 0:160603
10�9ðT=KÞ3 � 3:86840
106ðT=KÞ�2
for the 1200–4000 K range.
6.16.2. Enthalpy of formation
Smith and Peterson579 have performed Knudsen-effusion
measurements of Cm2O3 evaporation in the temperature range
1800–2600 K. Curium oxide has been shown to vaporize
congruently. Thermodynamic analysis has led to conclusion
that the predominant vaporization process is the formation of
CmO(g) and O(g). From the enthalpy of reaction
Cm2O3ðcrÞ ¼ 2CmOðgÞ þ OðgÞ;an approximate value D0(CmO) ¼ 728 kJ mol�1 was obtained,
using for the curiumoxide the enthalpy of formation equal to that
of Pu2O3. The mechanism of curium oxide vaporization pro-
posed by Smith and Peterson obtained unambiguous confirma-
tion in themass spectrometricwork on curiumvaporization from
a mixed curium-plutonium oxide by Hiernaut and Ronchi.580 It
was shown that CmO is the only effective vapor species.
With the thermodynamic functions of Cm2O3(cr) from
this assessment, the enthalpy of the above reaction was
calculated from the equilibrium constant for the temperature
TABLE 87. Molecular constants and enthalpies of formation for AnO2(g) (An = B
νi reAn cm�1 Symmetry pm
BkO2 791, 152(2), 725 2 182.0
CfO2 795, 183(2), 716 2 181.7
EsO2 816, 213(2), 738 2 179.5
FmO2 816, 221(2), 730 2 179.1
MdO2 789, 182(2), 703 2 181.2
NoO2 753, 170(2), 668 2 184.3
LrO2 686, 114, 271 2 194.0
aBond dissociation AnO2 → AnO þ O.bNeglecting electronic contributions.cIAIBIC for LrO2 in kg3 m6.
rticle is copyrighted as indicated in the article. Reuse of AIP content is sub
78.131.95.159 On: Sun,
1843 K:ΔrH°(298.15 K)¼ 1782.4 kJ mol�1. This value yields
DfH�ðCmO; g; 298:15 KÞ ¼ �ð75:4 � 20Þ kJmol�1
which is selected. The corresponding dissociation energy is
D0(CmO) ¼ 708.3 kJ mol�1. It should be mentioned that
Gibson261 estimated the valueD0(CmO)¼ 709 kJmol�1 using
the concept of a Ln or An atom into a d2s configuration thought
to be needed for formation of the Ln-O or An-O bond.
6.17. Computed data for AnO(g) and AnO2(g)(An ¼ Bk–Lr)
Presently, there is no experimental information available in
the literature on themolecular parameters on themonoxides and
dioxides of the late actinides. The bond distance and harmonic
vibrational frequency of LrO has been computed by Cao and
Dolg.581 The DFT study by Kovács et al.498 using relativistic
effective core potentials on the actinides provided the first data
on the molecular geometries and harmonic vibrational frequen-
cies of the other mono- and dioxides. That study reported also
the computed dissociation enthalpies and Gibbs free energies.
The reliability of the latter data can be assumed to be compar-
able to that for the monoxides and dioxides of early actinides,
where average deviations of ca. 20 kJ mol�1 for the dioxides
and ca. 50 kJ mol�1 for the monoxides were obtained as
compared with available experimental dissociation enthalpies
at 298 K. The computed dissociation enthalpies are in good
agreement with estimated data of Haire and Eyring582 using the
promotion model. The molecular constants and thermochemi-
cal properties are summarized in Tables 86 and 87.
k–Lr)
IAΔrH(0 K)a DfH
�ð298:15 KÞb
ff(O–An–O) kg m2 kJ mol�1 kJ mol�1
180.0 1.75952 10�45 420 425
180.0 1.75303 10�45 434 440
180.0 1.71066 10�45 427 433
180.0 1.70399 10�45 413 419
180.0 1.74408 10�45 354 360
180.0 1.80437 10�45 291 296
101.5 1.6373 10�135c 330 334
J. Phys. Chem. Ref. Data, Vol. 43, No. 1, 2014ject to the terms at: http://scitation.aip.org/termsconditions. Downloaded to IP:
27 Apr 2014 17:09:58

013101-82 KONINGS ET AL.
This a
7. Discussion and Conclusions
7.1. Comparison to existing reviews
The current review has resulted in a consistent set of
thermodynamic data for the lanthanide and actinide oxides
as summarized in Tables 88 and 89. As mentioned in the
Introduction, a number of critical reviews are existing but
they are generally restricted to the condensed state and do
not include the gaseous oxides, which were treated in detail
in the present work. In 1968 Holley Jr. et al.583 published a
rather complete review of the crystalline lanthanide oxides
based on the emerging literature on these intriguing com-
pounds. The current work has extended that review by
providing data in a wider temperature range, and including
many more recent literature sources. Although the selected
values are generally in good agreement with the recommen-
dations of Holley Jr. et al.,583 differences may exist, parti-
cularly for the high temperature properties. During the
course of our work Zinkevich584 published a comprehensive
review of the thermodynamics of the rare earth sesquiox-
ides. He also gave rather complete overview of the existing
literature, and complemented the known values with esti-
mated data. A major difference between that work and the
current results is obvious for the (estimated) properties of
the phase transitions. Whereas we have based the estimation
of the entropies of transition and fusion on the high pressure
work by Hoekstra,116 the experimental study of Gd2O3 by
Barkhatov et al.,148 the recent DTA work on La2O3 by
Ushakov and Navrotsky,14 and the observation for the
lanthanide trihalides that the sum of the transition and
melting entropies is fairly constant throughout those ser-
ies,160 Zinkevich584 based his estimations on the measured
entropies of fusion for Y2O3 and Sc2O3 and a comparison to
the relation between volume change upon melting and
entropy of fusion for the lanthanide metals. These are two
different approaches, resulting in somewhat different
values, but in absence of experimental data it is difficult
to validate them. We think that our approach based on
comparison to the (ionic) halides is physically more justified
than the comparison to metals.
A comprehensive review for the actinide oxides that treats
the condensed and the gaseous phases in a consistent manner
does not exist. In the frame of the thermodynamic database
project OECD/NEA430,585–587 the solid oxides of Th, U, Np,
Pu and U were reviewed, but with emphasis on the room
temperature values. No significant differences exist between
our and that work, since the same sources of information
have been used, with the exception of the high temperature
heat capacity of the oxides of Np and Am for which new
measurements were reported recently. The molecular spe-
cies of some of the major actinides (Th, U, Pu) have been
dealt with in general thermochemical assessments395,588 but
the information was very limited at the time those works
were completed. Currently quantum chemical computa-
tional methods are a main source of molecular data for
most actinide oxide species, and are considered to be more
reliable than the assumed analogy with the better known
J. Phys. Chem. Ref. Data, Vol. 43, No. 1, 2014rticle is copyrighted as indicated in the article. Reuse of AIP content is sub
78.131.95.159 On: Sun,
lanthanide compounds. There are four comprehensive quan-
tum chemical studies460,518,575,589 used in this assessment
which covered the mono- and dioxides of early actinides
(Th, Pa, U, Np, Pu, Am, Cm), although in some cases the
information appeared too late to be included. Quantum
chemical studies are also used to calculate dissociation
energies of early actinide oxides species and their cations
(e.g., Averkiev et al.589). Although the errors of several
experimental values are quite large, the comparison indi-
cates that the quantum chemical computations are suffi-
ciently reliable to predict trends among various actinides
but also that the reliability of the computed values still does
not reach that of the advanced gas-phase experimental
methods.
7.2. Trends
The thermodynamic data from the present review allow
evaluating the trends in the lanthanide and actinide series,
as we have also done for the elements.590 As is obvious
from the sections for the individual compounds, these trends
have been used extensively for checking consistency and
estimating unknown properties. However, unlike the metals
the comparison of the trends in the lanthanide and actinide
oxides is less obvious because the electronic configurations
are different. Whereas in the lanthanide series the com-
pounds are predominantly trivalent due to the fact that the
4f electrons do not participate in the bonding (localised),
this is not the general case for the actinide series. In the light
actinides (Th-Am) the 5f electron are delocalised (itinerant)
and as a result these elements show a wide range of
valence states in compounds. The crystalline sesquioxides
are formed in both series for a large number of elements and
can be compared very well. The crystalline dioxides are
typical for the actinides, and are stable only for a few
lanthanides. In the gas phase the LnO and AnO molecules
are stable for all elements, the AnO2 and AnO3 molecules
are again typical for the light actinides (Th-Am). We will
shortly discuss the trends in the crystalline sesquioxides, the
crystalline dioxides and the gaseous monoxides.
7.2.1. The crystalline sesquioxides
A comparison of the polymorphism of the actinide with the
lanthanide sesquioxides is made in Fig. 23, which is a remake
of Fig. 4 showing the stability domain of the crystallographic
modification not as a function of the position in the lanthanide
series, but as a function of the ionic radius. It is evident that the
actinide sesquioxides fall in the mid range where the poly-
morphism is most complex. It can be seen that the polymorph-
ism of Cm2O3 fits reasonably well in the Ln2O3 series, but the
other An2O3 compounds show discrepancies: the transition
temperatures, particularly the melting points, are significantly
lower.
Figure 24 shows the trend in the standard entropy of the
sesquioxides, which can be well described as the sum of a
lattice component, arising mainly from the vibrations of the
ject to the terms at: http://scitation.aip.org/termsconditions. Downloaded to IP:
27 Apr 2014 17:09:58

TABLE 88. Selected thermodynamic data of the solid and liquid phases of the lanthanide and actinide oxides
DfH�ð298:15Þ S�ð298:15Þ Cp/J K�1 mol�1 = A þ B·T þ C·T2 þ D·T3 þ E·T�2
Temperature ΔtrsH
Phase kJ mol�1 J K�1 mol�1 A B C D E range (K) Ttrs/K kJ mol�1
La2O3(A) �1791.6 � 2.0 127.32 � 0.84 120.6805 13.42414 10�3 �14.13668 105 298–1800 2313 � 30 (A → H) 23 � 5
La2O3(H) – – 150 – – – – 2313–2386 2386 � 30 (H → X) 17 � 5
La2O3(X) – – 150 – – – – 2386–2577 2577 � 15 (X → liq) 78 � 10
La2O3(liq) – – 162 – – – – >2577
CeO2(cr) �1090.4 � 1.0 62.29 � 0.07 74.4814 5.83682 10�3 – – �1.29710 106 298–3083 3083 � 50 (cr → liq) 69 � 5
CeO2(liq) – – 120 – – – – >3083
Ce2O3(A) �1799.8 � 1.8 148.1 � 0.4 113.736 28.4344 10�3 – – �6.41205 105 298–2392 2392 � 30 (A → H) 28 � 8
Ce2O3(H) – – 145 – – – – 2392–2406 2406 � 30 (H → X) 19 � 5
Ce2O3(X) – – 145 – – – – 2406–2512 2512 � 50 (X → liq) 85 � 10
Ce2O3(liq) – – 157 – – – – >2512
PrO2(cr) �959.1 � 2.3 80.8 � 2.0 72.9881 16.628 10�3 – – �0.9990 105 298–663
PrO1.833(cr) �944.6 � 2.5 79.2 � 2.0 68.4932 15.9207 10�3 – – �8.0968 105 298–750
Pr2O3(A) �1809.9 � 3.0 152.7 � 0.3 121.6594 25.5611 10�3 – – �9.8942 105 298–2310 2310 � 30 (A → H) 28 � 8
Pr2O3(H) – – 145 – – – – 2310–2397 2397 � 30 (H → X) 19 � 5
Pr2O3(X) – – 145 – – – – 2397–2583 2583 � 25 (X → liq) 88 � 10
Pr2O3(liq) – – 157 – – – – >2583
Nd2O3(A) �1806.9 � 3.0 158.7 � 1.0 117.1079 28.13655 10�3 – – �1.25845 106 298–2379 2379 � 30 (A → H) 29 � 8
Nd2O3(H) – – 145 – – – – 2379–2477 2477 � 30 (H → X) 20 � 5
Nd2O3(X) – – 145 – – – – 2477–2577 2577 � 15 (X → liq) 88 � 10
Nd2O3(liq) – – 160 – – – – >2577
Pm2O3(B) �1811 � 21 158 � 5.0 122.9493 30.0141 10�3 – – �1.85217 106 298–2013 2013 � 20 (B → A) 6 � 3
Pm2O3(A) – – 129.454 19.960 10�3 – – – 2013–2407 2407 � 20 (A → H) 31 � 8
Pm2O3(H) – – 165 – – – – 2407–2497 2497 � 20 (H → X) 20 � 5
Pm2O3(X) – – 165 – – – – 2497–2592 2592 � 30 (X → liq) 88 � 10
Pm2O3(liq) – – 179 – – – – >2597
Sm2O3(C) �1826.8 � 4.8 132.4358 18.7799 10�3 – – �2.40860 106 298–900 900 (C → B) 6 � 3
Sm2O3(B) �1823.0 � 4.0 150.6 � 0.3 129.7953 19.03114 10�3 – – �1.86227 106 298–2190 2190 � 20 (B → A) 7 � 3
Sm2O3(A) – – 140 – – – – 2190–2395 2395 � 20 (A → H) 32 � 8
Sm2O3(H) – – 165 – – – – 2395–2533 2533 � 30 (H → X) 20 � 5
Sm2O3(X) – – 165 – – – – 2533–2613 2613 � 15 (X → liq) 89 � 10
Sm2O3(liq) – – 179 – – – – >2613
Eu2O3(C) �1662.5 � 6.0 135.4 � 2.0 136.2978 14.9877 10�3 – – �1.4993 106 298–1350 1350 � 15 (C → B) 9 � 3
Eu2O3(B) 133.3906 16.6443 10�3 – – �1.42435 106 298–2327 2327 � 30 (B → A) 7 � 2
Eu2O3(A) – – 141 – – – – 2327–2427 2427 � 30 (A → H) 33 � 8
Eu2O3(H) – – 144 – – – – 2427–2557 2557 � 30 (H → X) 21 � 5
Eu2O3(X) – – 144 – – – – 2557–2622 2622 � 20 (X → liq) 89 � 10
Eu2O3(liq) – – 156 – – – – >2622
Eu3O4(cr) �2276 � 10 315 � 4 182.464 26.108 10�3 – – 298–2000
EuO(cr) �593.2 � 5.0 83.6 � 0.8 46.5453 7.360 10�3 – – 1.42047 104 419–1724
Gd2O3(C) �1819.7 � 3.6 150.6 � 0.2 114.8086 17.2911 10�3 – – �1.28397 106 298–2000 1473 (C → B) 9 � 2
Gd2O3(B) 114.6104 15.2344 10�3 – – �1.24917 106 298–2430 2430 � 30 (B → A) 6.3 � 3.3
Gd2O3(A) – – 142 – – – – 2430–2470 2470 � 30 (A → H) 34.7 � 3.3
Gd2O3(H) – – 130 – – – – 2470–2538 2538 � 20 (H → X) 20 � 5
Gd2O3(X) – – 130 – – – – 2538–2693 2693 � 15 (X → liq) 92 � 10
Gd2O3(liq) – – 140 – – – – >2693
TbO2(cr) �972.2 � 5.0 86.9 � 3.0 73.259 13.2023·10�3 – – 1.0424 106 298–1400 Decomposition
Tb2O3(C) �1865.2 � 6.0 159.2 � 3.0 120.6682 22.17194 10�3 – – �1.00261 106 298–1823 1823 � 30 (C → B) 12 � 4
Tb2O3(B) – – 152 – – – – 1823–2488 2488 � 30 (B → H) 55 � 8
Tb2O3(H) – – 170 – – – – 2488–2682 2682 � 15 (H → liq) 83 � 8
Tb2O3(liq) – – 182 – – – – >2682
Dy2O3(C) �1863.4 � 5.0 149.8 � 0.15 121.2302 15.27609 10�3 – – �8.4580 105 298–2223 2223 � 30 (C → B) 14 � 5
Dy2O3(B) – – 155 – – – – 2223–2488 2488 � 30 (B → H) 55 � 8
Dy2O3(H) – – 173 – – – – 2488–2680 2680 � 15 (H → liq) 83 � 8
Dy2O3(liq) – – 188 – – – – >2680
Ho2O3(C) �1883.3 � 8.2 156.38 � 0.15 121.9340 10.11623 10�3 – – �8.8628 105 298–2538 2538 � 30 (C → B) 16 � 5
Ho2O3(B) – – 135 – – – – 2538–2588 2588 � 30 (B → H) 57 � 8
Ho2O3(H) – – 149 – – – – 2588–2686 2686 � 15 (H → liq) 83 � 8
Ho2O3(liq) – – 162 – – – – >2686
Er2O3(C) �1900.1 � 6.5 153.13 � 0.15 123.2921 8.62245 10�3 – – �1.54433 106 298–2538 2538 � 30 (C → H) 25 � 5
Er2O3(H) – – 162 – – – – 2538–2690 2690 � 15 (H → liq) 83 � 5
Er2O3(liq) – – 176 – – – – >2690
Tm2O3(C) �1889.3 � 5.7 139.7 � 0.4 128.4322 5.23209 10�3 – – �1.17891 106 298–2588 2588 � 30 (C → H) 26 � 5
Tm2O3(H) – – 155 – – – – 2588–2682 2682 � 30 (H → liq) 83 � 8
Tm2O3(liq) – – 168 – – – – >2682
Yb2O3(C) �1814.5 � 6.0 133.1 � 0.3 130.6438 3.34628 10�3 – – �1.44820 106 298–2687 2687 � 20 (C → H) 27 � 5
Yb2O3(H) – – 134 – – – – 2687–2707 2707 � 15 (H → liq) 84 � 8
Yb2O3(liq) – – 146 – – – – >2707
Lu2O3(cr) �1877.0 � 7.7 109.96 � 0.13 122.4593 7.29001 10�3 – – �2.03414 106 298–2762 2762 � 15 (C → liq) 113 � 10
Lu2O3(liq) – – 152 – – – – >2762
ThO2(cr) �1226.4 � 3.5 65.23 � 0.20 55.9620 5.12579 10�2 �3.68022 10�5 9.2245 10�9 �5.740310 105 298–3500 3651 � 17 (cr → liq) 88 � 6
ThO2(liq) – – 61.8 – – – – >3651
γ-UO3(cr) –1223.8 � 2.0 96.11 � 0.40 90.2284 1.385332 10�2 – – �1.12795 106 416–886 – –
THERMODYNAMIC PROPERTIES OF LANTHANIDE AND ACTINIDE OXIDE COMPOUNDS 013101-83
J. Phys. Chem. Ref. Data, Vol. 43, No. 1, 2014 This article is copyrighted as indicated in the article. Reuse of AIP content is subject to the terms at: http://scitation.aip.org/termsconditions. Downloaded to IP:
78.131.95.159 On: Sun, 27 Apr 2014 17:09:58

TABLE 88. Selected thermodynamic data of the solid and liquid phases of the lanthanide and actinide oxides—Continued
DfH�ð298:15Þ S�ð298:15Þ Cp/J K�1 mol�1 = A þ B·T þ C·T2 þ D·T3 þ E·T�2
Temperature ΔtrsH
Phase kJ mol�1 J K�1 mol�1 A B C D E range (K) Ttrs/K kJ mol�1
α-U3O8(cr) �3574.8 � 2.5 282.55 � 0.50 279.267 2.7480 10�2 � � �4.3116 106 298–483 483 0.171
279.267 2.7480 10�2 – – �4.3116 106 483–658 658 0.444
279.267 2.7480 10�2 – – �4.3116 106 658–850 850 0.942
279.267 2.7480 10�2 – – �4.3116 106 >850
U4O9(cr) �4512 � 7 334.1 � 0.7 319.163 4.9691 10�2 – – �3.9602 106 298–1600 – –
UO2(cr) –1085.0 � 1.0 77.03 � 0.20 66.7437 4.31393 10�2 �3.5640 10�5 1.1655 10�8 �1.16863 106 298–3000 3120 � 20 (cr → liq) 75 � 3
UO2(liq) – – 1365.4956 �0.85866 1.91305 10�4�1.41608 10�8 – 3120–5000
Np2O5(cr) –2162.7 � 9.3 186 � 15 99.2 9.86 10�2 – – – 298–750 700 (decomposition) –
NpO2(cr) �1078.5 � 2.7 80.3 � 0.4 64.7712 43.8574 10�3 �35.0695 10�6 13.1917 10�9 �0.78932 106 298–3072 3072 � 66 � 50 (cr → liq) 70 � 6
NpO2(liq) – – 66 – – – – >3072
PuO2(cr) �1055.8 � 1.0 66.13 � 0.30 35.2952 1.5225 10�1 �1.27255 10�4 3.6289 10�8 �3.47593 105 298–3017 3017 � 28 (cr → liq) 64 � 6
PuO2(liq) – – 70 – – – – >3017
Pu2O3(A) �1647 � 10 � 163.02 � 0.65 130.6670 1.84357 10�2 � � �1.70530 106 298–2300 2300 � 50 (A → H) 32 � 10
Pu2O3(H) – – 165 – – – – 2300–2352 2352 � 10 (H → liq) 71 � 10
Pu2O3(liq) – – 179 – – – – >2352
AmO2(cr) �932.2 � 3.0 75.5 � 3.0 78.9718 3.8365 10�3 – – �1.40591 106 298–1200 -
Am2O3(A) �1690.4 � 7.9 134.2 � 5.0 126.0084 8.0097 10�3 – – –1.05752 106 298–2350 2350 � 50 (A → H) 33 � 10
Am2O3(H) – – 141 – – – – 2350–2410 2410 � 50 (H → X) 10 � 10
Am2O3(X) – – 141 – – – – 2410–2481 2481 � 15 (X → liq) 74 � 10
Am2O3(liq) – – 156 – – – – >2481
Cm2O3(B) –1684 � 14 167 � 5 123.532 1.4550 10�2 – – �1.3489 106 298–1888 1888 � 15 (B → A) 6 � 3
Cm2O3(A) – – 142 – – – – 1888–2273 2273 � 20 (A → H) 32 � 6
Cm2O3(H) – – 130 – – – – 2273–2383 2383 � 20 (H → X) 10 � 5
Cm2O3(X) – – 130 – – – – 2283–2543 2543 � 15 (H → liq) 66 � 10
Cm2O3(liq) – – 140 – – – – >2543
013101-84 KONINGS ET AL.
This a
ions in the crystal, and an excess component, which is of
electronic origin:127,445
S� ¼ Slat þ Sexs: ð9Þ
Sexs is zero for the lanthanide ions with empty (La, 4f 0),
half-filled (Gd, 4f 7) and completely filled (Lu, 4f 14) f sub-
shell and thus the lattice contribution can be derived from
the experimental data for the sesquioxides of those ele-
ments. From the results it is clear that the lattice entropy for
the lanthanide sesquioxides falls in two groups, the hexa-
gonal and monoclinic compounds in which the Ln coordina-
tion is sixfold, and the cubic compounds in which it is
eightfold. This trend has been used in this work to estimate
the values for those compounds for which experimental data
are missing. Figure 25 shows how the trend for the lantha-
nides has been extrapolated to the actinides, based on the
single experimental value for Pu2O3. A similar relation hold
for the heat capacity.
The trends in the enthalpies of formation are shown in
Fig. 26. We have plotted the hypothetical solution enthalpy
of the reaction (ΔslnH°(298.15 K)),
M2O3ðcrÞ þ 6HþðaqÞ ¼ 2M3þðaqÞ þ 3H2OðlÞ;
which represents in part the difference between the lattice
enthalpy of the crystalline dioxide and the enthalpy of
J. Phys. Chem. Ref. Data, Vol. 43, No. 1, 2014rticle is copyrighted as indicated in the article. Reuse of AIP content is sub
78.131.95.159 On: Sun,
hydration of its ionic components. As it can be seen, the
results for the lanthanide sesquioxides fall into three
groups of isostructural compounds. The few results for the
actinides parallel the trend for the lanthanide sesquioxides
very well, irrespectively of the crystal structure, suggesting
that the reaction enthalpy is about 20–30 kJ mol�1 less
negative than the corresponding lanthanide sesquioxides.
Morss et al.454 suggested a relationship between the solu-
tion enthalpy of the above reaction and the molar volume
(Fig. 27). That correlation captured well the three crystal-
lographic groups of the lanthanide sesquioxides, but it did
not show a correlation between the lanthanides and acti-
nides, except for the B-type structure.
7.2.2. The crystalline dioxides
The melting point of the actinide dioxides have been
revisited by Manara et al.371,404,413 recently. These authors
have shown that, due to the high oxygen potential of these
compounds at temperatures close to melting, their observed
melting/freezing behavior is not independent of the atmo-
sphere in which fusion and solidification occur. Taking into
account this important aspect, the trend established with
these new data is shown in Fig. 28. It shows a strong
decrease from ThO2 to UO2, after which the melting tem-
perature decreases further in a moderate way. The absence
of data for the melting of PaO2 make it difficult the establish
the trend in a more reliable way. A similar trend is observed
ject to the terms at: http://scitation.aip.org/termsconditions. Downloaded to IP:
27 Apr 2014 17:09:58

TABLE 89. Selected thermodynamic data of the gaseous lanthanide and actinide oxides
DfH�ð298:15Þ S�ð298:15Þ Cp/J K�1 mol�1 ¼ A + B·T + C·T2 + D·T3 + E·T�2
Temperature
Phase kJ mol�1 J K�1 mol�1 A B C D E range (K)
LaO(g) �119 � 8 239.594 � 0.03 28.0550 21.9688 10�3 �1.925691 10�5 6.083418 10�9 �1.145313 105 298–1200
41.7593 �6.82858 10�3 3.529957 10�6 �2.81197 10�10 �1.500459 106 1200–4000
CeO(g) �132 � 8 246.099 � 0.10 22.01944 55.5050 10�3 �4.314095 10�5 1.089494 10�8 �4.23189 104 298–1300
62.79967 �1.753953 10�2 5.431417 10�6 �4.87485 10�10 �4.947446 106 1300–4000
CeO2(g) �538 � 20 274.417 � 3.0 37.7646 55.1209 10�3 �57.1816 10�6 21.2692 10�9 �2.6077 105 298–900
55.9864 2.90431 10�3 �1.4361 10�6 0.25254 10�9 �1.11908 106 900–4000
PrO(g) �145.5 � 8 244.367 � 0.05 22.98903 20.3103 10�3 2.02961 10�5 �1.46500 10�8 2.72239 105 298–1200
84.67666 �2.85857 10�2 8.73036 10�6 �8.4566 10�10 �1.44324 107 1200–4000
NdO(g) �120 � 8 242.817 � 0.05 �9.80368 1.88146 10�1 �1.90285 10�4 6.23079 10�8 5.70945 105 298–1100
57.65812 �9.784651 10�3 2.76479 10�6 �2.18778 10�10 4.42849 105 1100–4000
PmO(g) �145 � 50 246.519 � 2.0 31.6417 3.86653 10�2 �3.03021 10�5 8.45852 10�9 �2.08747 105 298–1100
50.9578 1.31663 10�3 �1.57622 10�6 2.82026 10�10 �2.75930 106 1100–4000
SmO(g) �105.3 � 8 246.592 � 0.10 28.65158 4.58171 10�2 �3.44081 10�5 7.99213 10�9 �4.99673 104 298–1400
70.5862 �2.02158 10�2 4.6805 10�6 �2.43006 10�10 �6.91999 106 1400–4000
EuO(g) �56.5 � 8 253.419 � 0.10 33.8838 7.70507 10�3 �7.38219 10�6 3.41476 10�9 �2.52934 105 298–1700
�79.4911 9.34647 10�2 �2.23194 10�5 1.8699 10�9 5.2756 107 1700–4000
GdO(g) �68.0 � 8 253.495 � 0.03 21.26451 4.09137 10�2 �3.01655 10�5 7.50616 10�9 6.83276 104 298–1300
51.77714 �1.00325 10�2 2.57810 10�6 �1.11668 10�10 �4.8038 106 1300–4000
TbO(g) �84.7 � 10 245.758 � 0.10 30.97785 3.25225 10�2 �1.96568 10�5 4.14576 10�9 �1.18135 104 298–1400
64.48191 �8.31957 10�3 8.83659 10�7 2.70508 10�11 �1.04723 107 1400–4000
DyO(g) �71 � 20 242.208 � 0.10 19.08366 6.17856 10�2 �3.7479 10�5 7.29509 10�9 2.19805 104 298–1300
68.49712 �1.13191 10�2 1.99999 10�6 �4.18797 10�11 �8.39005 106 1300–4000
HoO(g) �57.8 � 10 244.590 � 0.10 48.31232 7.68332 10�2 �1.55715 10�4 7.69567 10�8 �1.57926 106 298–900
43.11154 �5.49748 10�3 3.07490 10�6 �3.50566 10�10 4.11955 106 900–4000
ErO(g) �32.9 � 8 256.473 � 0.10 43.23815 �4.71231 10�3 5.71735 10�7 7.47515 10�10 �2.55285 105 298–1300
33.60868 3.85434 10�3 �3.82306 10�7 4.64068 10�11 2.52559 106 1300–4000
TmO(g) �13.6 � 8 255.041 � 0.15 37.63499 4.06981 10�3 �2.78859 10�6 9.67411 10�10 �6.69507 104 298–1700
39.61651 �5.40323 10�4 1.26385 10�6 �1.43823 10�10 �1.21233 106 1700–4000
YbO(g) �16 � 10 238.521 � 0.10 37.70801 4.85496 10�2 �6.84668 10�5 3.05227 10�8 �7.73176 105 298–1000
32.77497 1.73649 10�2 �5.08804 10�6 5.03717 10�10 1.98479 106 1000–4000
LuO(g) �3.4 � 10 242.089 � 0.03 28.20132 2.04184 10�2 �1.65159 10�5 4.71909 10�9 �1.1965 105 298–1300
40.19679 �7.58989 10�4 �6.23484 10�7 2.73798 10�10 �2.75040 106 1300–4000
AcO(g) �193 � 20 245.545 � 5.0 26.7681 26.00447 10�3 �24.23966 10�6 8.10964 10�9 �0.83961 105 298–1100
47.1310 �13.09869 10�3 6.02184 10�6 �0.628330 10�9 �2.91011 106 1100–4000
ThO2(g) �435.6 � 12.6 285.233 � 2.0 36.83878 55.95391 10�3 �56.33462 10�6 20.31019 10�9 �1.94049 105 298–900
56.72155 2.163537 10�3 �1.189606 10�6 0.227498 10�9 �1.407937 106 900–4000
ThO(g) �21.5 � 5.0 240.071 � 0.03 30.10768 1.39388 10�2 �1.15407 10�5 4.92964 10�9 �1.86435 105 298–1500
�13.55069 4.45401 10�2 �8.99062 10�6 5.83589 10�10 1.48587 107 1500–4000
PaO2(g) �514.0 � 30 279.711 � 5 35.4855 69.7567 10�3 �71.6190 10�6 27.8213 10�9 �0.58791 105 298–900
57.8335 4.88325 10�3 6.76950 10�8 �1.07986 10�10 �1.40951 106 900–4000
PaO(g) 8 � 30 250.778 � 10 22.73634 1.80345 10�2 2.8825 10�5 �2.01289 10�8 2.78485 105 298–1100
84.42095 �2.90423 10�2 8.96146 10�6 �8.76655 10�10 �1.36244 107 1100–4000
UO3(g) �795.0 � 10 310.648 � 3 46.69199 94.6942 10�3 �94.91701 10�6 34.1585 10�9 �2.793843 105 298–900
81.70962 2.009478 10�3 �1.110505 10�6 0.2162739 10�9 �2.580355 106 900–4000
UO2(g) �462.1 � 12 277.027 � 3 44.35744 37.6358 10�3 �23.15563 10�6 5.50268 10�9 �0.7485093 105 298–900
59.57586 5.392403 10�3 0.09463181 10�6 �0.1028723 10�9 �6.319451 105 900–4000
UO(g) 21.4 � 10 252.137 � 1.0 38.48092 3.30187 10�2 �4.04519 10�5 1.47496 10�8 �5.15534 105 298–1300
50.04939 �1.81106 10�2 1.23772 10�5 �1.71438 10�9 2.50947 106 1300–4000
NpO2(g) �457 � 20 269.892 � 6 56.33269 40.03943 10�3 �54.97771 10�6 23.02883 10�9 �7.32805 105 298–1000
68.29804 �9.034032 10�3 5.459315 10�6 �0.6628476 10�9 �3.700337 105 1000–4000
NpO(g) �16.6 � 10 253.060 � 4 40.73102 5.06903 10�3 5.58835 10�6 �3.26062 10�9 �3.95105 105 298–1400
53.06105 1.44612 10�3 �1.95684 10�6 3.62588 10�10 �5.12159 106 1400–4000
PuO3(g) �567.6 � 15 319.450 � 4 52.89593 75.46988 10�3 �71.42497 10�6 25.87474 10�9 �3.753825 105 298–900
76.50587 8.903191 10�3 �1.504422 10�6 0.07709618 10�9 �16.13944 105 900–4000
PuO2(g) �428 � 20 278.741 � 5 70.29021 �13.46001 10�3 9.065878 10�6 �1.403447 10�9 �4.810746 105 298–1500
49.85911 11.46596 10�3 �1.472281 10�6 �8.55574 10�9 41.20745 105 1500–4000
PuO(g) �51.7 � 15 252.254 � 3 25.39529 5.42560 10�2 �3.62549 10�5 6.47005 10�12 3.72127 104 298–1200
78.23663 �2.73687 10�2 6.77906 10�6 �4.40726 10�10 �7.04572 106 1200–4000
AmO2(g) �514.0 � 30 279.464 � 6 52.7906 26.0768 10�3 �27.1648 10�6 10.2293 10�9 �3.3759 105 298–1000
54.4906 7.17462 10�3 �1.46280 10�6 +0.13147 10�9 1.2604 106 1000–4000
AmO(g) �15 � 50 259.105 � 5 34.31966 6.13074 10�3 �6.40603 10�6 4.00456 10�9 �2.68922 105 298–1500
�85.66885 1.11574 10�1 �3.02584 10�5 2.82855 10�9 4.35180 107 1500–4000
CmO(g) �75.4 � 20 259.071 � 5 26.15923 2.30665 10�2 �1.18949 10�5 1.83564 10�9 �3.50044 104 298–1200
46.16751 �3.81910 10�3 4.73867 10�7 1.60603 10�10 �3.86840 106 1200–4000
THERMODYNAMIC PROPERTIES OF LANTHANIDE AND ACTINIDE OXIDE COMPOUNDS 013101-85
J. Phys. Chem. Ref. Data, Vol. 43, No. 1, 2014 This article is copyrighted as indicated in the article. Reuse of AIP content is subject to the terms at: http://scitation.aip.org/termsconditions. Downloaded to IP:
78.131.95.159 On: Sun, 27 Apr 2014 17:09:58

1.001.041.081.121.16
Ionic radius (10-10 m)
800
1200
1600
2000
2400
2800T
/K A B C
HX
Liquid
Pu AmCm
CfBk
FIG. 23. The polymorphism of Ln2O3 (open symbols) and An2O3 (closed
symbols) compounds expressed as ionic radius versus temperature. The
lines are based on the transition temperatures in the lanthanide series (see
Fig. 4).
Ac Th Pa U Np Pu Am Cm Bk Cf Es Fm Md No Lr100
120
140
160
180
So (
M2O
3)/J
K-1
mol
-1
FIG. 25. The standard entropy S°(298.15 K) of the actinide sesquioxides; ■ thelattice entropies derived from experimental studies;& experimental value for
Pu2O3;( estimated values from the lattice and excess entropy as explained in
the text.
013101-86 KONINGS ET AL.
This a
in other properties of the actinide dioxides, for example the
enthalpy of sublimation, which is a good measure for the
cohesion energy in the crystalline lattice, shown also in the
figure. It suggests a notable influence of the 5f electrons on
the bonding. In the lanthanide series, only the melting point
of CeO2 is known, which is substantially lower than the
value of ThO2. Although it is somewhat speculative, this is
consistent with the much lower enthalpy of sublimation
compared to the actinide dioxides.
The trend in the standard entropies of the actinide dioxides is
shown in Fig. 29, which has served as a basis for estimating the
values for actinide and lanthanide dioxides for which no
experimental data are existing. As is the case for the sesqui-
oxides, the trend in the dioxides can be well described by Eq.
(9), estimating the lattice from the measured compounds, in
absence of experimental data for the 5f7 compound (CmO2).
Again, in the lanthanide series only the entropy of CeO2 has
been measured.
The trend in the enthalpy of formation of the solid
dioxides has been evaluated from the hypothetical solution
La Ce Pr Nd Pm Sm Eu Gd Tb Dy Ho Er Tm Yb Lu100
120
140
160
180
So (
M2O
3)/J
K-1
mol
-1
FIG. 24. The standard entropy S°(298.15 K) of the lanthanide sesquioxides; ■the lattice entropies derived from experimental studies; & values calculated
from the lattice, represented by the dashed lines, and excess entropy as
explained in the text; ○ and � the experimental values from the hexagonal/monoclinic and cubic compounds, respectively.
J. Phys. Chem. Ref. Data, Vol. 43, No. 1, 2014rticle is copyrighted as indicated in the article. Reuse of AIP content is sub
78.131.95.159 On: Sun,
enthalpy of the reaction
MO2ðcrÞ þ 4HþðaqÞ ¼ M4þðaqÞ þ 2H2OðlÞ:As shown in Fig. 30, the trend for this quantity in the
actinide series is quite regular, showing a slightly deviating
value for NpO2. The values for the three lanthanide dioxides
indicate also a negative slope, but less than the actinides.
Morss and Fuger441 used a different approach by correlating
the hypothetical solution enthalpy to the molar volume, as
shown in Fig. 31. In this case the lanthanide and actinide
dioxides plot almost on a straight line, with the exception of
TbO2 that deviates significantly. Morss and Fuger441 sug-
gested this may be due to an erroneous value of the enthalpy
of formation of Tb4+(aq), but this remains speculative.
7.2.3. The gaseous monoxides
The bond distances of LnO and AnO molecules are
compared in Fig. 32. Those of the LnO molecules are mostly
experimental data derived from rotationally resolved elec-
tronic spectra. In the AnO series only the bond distances of
ThO and UO have been determined experimentally (derived
similarly from electronic spectra), while the others were
taken from the theoretical study of Kovács et al.,498 exceptAcO, which was calculated at the same level of theory in the
present study. The theoretical level used in the latter study
(B3LYP/small-core relativistic pseudopotentials for the
La Ce Pr Nd Pm Sm Eu Gd Tb Dy Ho Er Tm Yb Lu-500
-450
-400
-350
-300
Δ slnH
o (29
8.15
)/kJ
mol
-1
Pu Am Cm Bk Cf
FIG. 26. The enthalpy of the hypothetical solution reaction for the lanthanide
(open symbols) and actinide (closed symbols) sesquioxides, indicating the
different structures (A-type, &; B-type, ~; C-type, ○).
ject to the terms at: http://scitation.aip.org/termsconditions. Downloaded to IP:
27 Apr 2014 17:09:58

42 44 46 48 50
molar volume/cm3
-500
-460
-420
-380
-340
Δ slnH
o /kJ
mol
-1
Cf2O
3
Cm2O
3
Am2O
3
Pu2O
3
FIG. 27. The enthalpy of the hypothetical solution reaction for the
lanthanide (open symbols) and actinide (closed symbols) sesquioxides
as a function of the molar volume, indicating the different structures
(A-type, &; B-type, ~; C-type, ○).
Th Pa U Np Pu Am Cm Bk Cf Es
60
70
80
90
So (
MO
2)/J
K-1
mol
-1
Ce
FIG. 29. The standard entropy S°(298.15 K) of the actinide dioxides; ■ thelattice entropies derived from experimental studies. The experimental value ofCeO2 is also shown (�).
THERMODYNAMIC PROPERTIES OF LANTHANIDE AND ACTINIDE OXIDE COMPOUNDS 013101-87
This a
actinides) gave bond distances in excellent agreement
(within 0.7 pm) with the experimental data of ThO and
UO. A similar reliability may be expected for the other
actinide monoxides.
Both the LnO and AnO curves show a double-well shape
with some distinct differences. These differences can be
attributed to some special features in the electronic structures
of the concerned molecules. The very long bond distance in
AcO is in agreement with the covalent radii of Ac larger by
about 1 pm with respect to that of Th.591 According to our
present population analysis the explanation of the longer bond
of AcO may mainly be related to the unpaired 7s electron
requiring larger space than the closed 7s2 subshell in ThO and
PaO. On the other hand, in test computations of LaO, CeO, and
PrO we observed an open 7s1 subshell.
The considerably longer bonds toward the end of the
actinide row in FmO, MdO, and NoO have been ascribed to
substantial population of antibonding orbitals in these mole-
cules.498 These antibonding orbitals consist of 5f An and 2p
O atomic orbitals. Such low-energy antibonding orbitals
are not present in the LnO molecules due to the core-like
nature of 4f electrons. Therefore the partly filled 4f orbitals
have no substantial influence on the bond distance of LnO
molecules.
Th Pa U Np Pu Am Cm
2200
2600
3000
3400
3800
Tfu
s/K
500
600
700
800
Δ subH
o (29
8.15
K)/
(kJ
mol
-1)
Ce
FIG. 28. The melting temperature (&, ■) and the enthalpies of sublimation(○,�) of the actinide (open symbols) and lanthanide (closed symbols) dioxides.
rticle is copyrighted as indicated in the article. Reuse of AIP content is sub
78.131.95.159 On: Sun,
Population analysis shows that the bonding in EuO is
significantly different from the other LnO molecules. While
in those other LnO molecules the 4f orbitals have a core-like
character (being lower-energy, not mixing with O orbitals
and with each other), in EuO the 4f orbitals participate in the
bonding orbitals with 2p orbitals of O, and even the non-
bonding 4f orbitals are also high-energy (higher than the
bonding orbitals). Hence they do not have a core-character
in Eu.
The dissociation energy of the lanthanide and actinide
monoxides are plotted in Fig. 33. The trends for the two
series are very similar. It is generally accepted that this trend
can be described by a base energy D0 and an excess energy
ΔE,260,261,582 arising from the promotion energy from the
ground state of the metal to the bonding state in the
molecule.
7.3. Recommendations for further research
Our review has shown that the thermodynamic proper-
ties of the lanthanide sesquioxides are well established in
the low to medium temperature range (up to about
2000 K). At high temperature, still large uncertainty exists
about the properties of the H, X, and liquid phases. This is
still terra incognita and is a challenging topic for further
research. Additionally, the thermodynamic properties of
the intermediate oxides of general formula LnnOm that
occur in several of the Ln-O systems, are still poorly
known.
Th Pa U Np Pu Am Cm Bk Cf-560
-520
-480
-440
Δ slnH
o (29
8.15
K)/
(kJ
mol
-1)
Ce Pr Tb
FIG. 30. The enthalpy of formation of the lanthanide(■) and actinide (&)
dioxides.
J. Phys. Chem. Ref. Data, Vol. 43, No. 1, 2014ject to the terms at: http://scitation.aip.org/termsconditions. Downloaded to IP:
27 Apr 2014 17:09:58

22 24 26 28
molar volume/cm3
-550
-525
-500
-475
-450
{ΔfH
o (M
O2)
-ΔfH
o (M
4+)}
/kJ
mol
-1 Th
U
Ce
Np
Pu
AmCm
BkCf
Pa
PrTb
FIG. 31. The enthalpy of formation of the actinide dioxides as a function of
molar volume.
La Ce Pr Nd Pm Sm Eu Gd Tb Dy Ho Er Tm Yb Lu170
180
190
200
r(M
O)/
pm
Ac Th Pa U Np Pu Am Cm Bk Cf Es Fm Md No Lr
FIG. 32. The interatomic bond distance of the lanthanide (�) and actinide (○)gaseous monoxides.
013101-88 KONINGS ET AL.
This a
For the actinide oxides the situation is somewhat differ-
ent, also because the issue of radioactivity comes into play.
The thermodynamic properties of the crystalline dioxides of
the major actinides (ThO2, UO2, and PuO2) are also well
established, even at very high temperatures, though further
studies of the liquid phase would be welcomed. The proper-
ties of the crystalline oxides of the minor actinides (Np, Am,
Cm) are still poorly known, which is in part due to their
highly radioactive nature. Some progress has been made in
recent years, making use of measuring techniques suitable
for small quantities, but also for these compounds high
temperature studies are highly needed. Their properties are
mainly based on estimation methods that need further
validation. The other actinide oxides are hardly studied,
and this will probably not change. Improvement for these
compounds must be the result of better understanding of the
trends in the actinide series.
La Ce Pr Nd Pm Sm Eu Gd Tb Dy Ho Er Tm Yb Lu200
400
600
800
1000
Do (
MO
)/kJ
mol
-1
Ac Th Pa U Np Pu Am Cm Bk Cf Es Fm Md No Lr
FIG. 33. The dissociation enthalpy of the lanthanide (○) and actinide (&)
gaseous monoxides.
J. Phys. Chem. Ref. Data, Vol. 43, No. 1, 2014rticle is copyrighted as indicated in the article. Reuse of AIP content is sub
78.131.95.159 On: Sun,
Acknowledgments
This article is the final result of a series of studies on the
properties of the lanthanide and actinide oxides, and the
authors would like acknowledge Eric Cordfunke, Lester
Morss, Gerry Lander, and Christine Guéneau, who have
helped and stimulated us in various ways with its realisation.
Part of the work has been financed in the frame of the
MetroFission project in the European Metrology Research
Programme of EURAMET.
8. References
1F. H. Spedding and A. H. Daane, J. Metals 6, 504 (1954).2K. A. Gschneidner, Jr. and J. Capellen, J. Less-Common Met. 126, xvii(1986).
3E. H. P. Cordfunke and R. J. M. Konings, Thermochim. Acta 375, 65(2001).
4J. D. Cox, D. D. Wagman, and V. A. Medvedev, CODATA Key Values for
Thermodynamics (Hemisphere, New York, 1989).5V. B. Parker, D. D. Wagman, and D. Garvin, Technical Report NBSIR 75,
1976.6O. Söhnel and P. Novotný, Densities of Aqueous Solutions of InorganicSubstances (Elsevier, Amsterdam, 1985).
7L. V. Gurvich, I. V. Veyts, and C. B. Alcock, Thermodynamic Properties
of Individual Substances, 4th ed. (Hemisphere Publishing Corp., New
York, 1989), Vol. 1.8E. H. P. Cordfunke and R. J. M. Konings, Thermochemical Data for
Reactor Materials and Fission Products (North-Holland, Amsterdam,
1990).9M. W. Chase Jr., NIST-JANAF THERMOCHEMICAL TABLES, Fourth
Edition, Monograph 9 (Part I and Part II) (1998), 1963 pp. (1998).10M. Foex and J. P. Traverse, Rev. Int. Hautes Temper. Refract. 3, 429(1966).
11L. M. Lopato, A. Shevchenko, A. E. Kushchevskii, and S. G. Tresvyatskii,
Inorg. Mater. 10, 1276 (1974).12F.Wehner, E. T. Henig, and H. L. Lukas, Thermochim. Acta 20, 17 (1977).13A. V. Shevthenko and L. M. Lopato, Thermochim. Acta 93, 537 (1985).14S. V. Ushakov and A. Navrotsky, J. Mater. Res. 26(7), 845 (2011).15J. P. Coutures and M. H. Rand, Pure Appl. Chem. 61, 1461 (1989).16H. V. Wartenberg and H. J. Reusch, Z. Anorg. Allg. Chem. 207, 1(1932).
17W. A. Lambertson and F. H. Gunzel, Technical Report AECD-3465 (U.S.
Atomic Energy Commission, 1952).18T. Sata and R. Kiyoura, Bull. Tokyo Inst. Technol. 53, 39 (1963).19M. Foex, Rev. Int. Hautes Temp. Refract. 3, 309 (1966).20O. A. Mordovin, N. I. Timofeeva, and L. N. Drozdova, Izv. Akad. Nauk
SSSR, Neorg. Mater. 3, 187 (1967).21T. Noguchi and M. Mizuno, Sol. Energy 11, 90 (1967).22S. G. Treswjatskii, L. M. Lopato, A. V. Schevtschenko, and A. E.
Kutschevskii, Colloq. Int. C. N. R. S. N205, 247 (1972).23J. P. Coutures, F. Verges, andM. Foex, Rev. Int. Hautes Temp. Refract. 12,181 (1975).
24M.Mizuno, T. Yamada, and T. Noguchi, Yogyo Kyokaishi 89, 488 (1981).25M. Yoshimura, S. Somiya, and T. Yamada, Rare Earths (The Rare Earth
Society Japan, 1985), Vol. 6, p. 88.26H. W. Goldstein, E. F. Neilson, and P. N. Walsh, J. Phys. Chem. 63, 1445(1959).
27E. G. King, W. W. Weller, and L. B. Pankratz, Technical Report RI-5857
(U.S. Bureau of Mines, 1961).28B. H. Justice and E. F. Westrum, Jr., J. Phys. Chem. 67, 339 (1963).29J. O. Blomeke and W. T. Ziegler, J. Am. Chem. Soc. 73, 5099 (1951).30T. S. Yashvili, D. S. Tsagareishvili, and G. G. Gvelesiani, High Temp. 6,781 (1968).
31D. Sedmidubský, O. Beneš, and R. J. M. Konings, J. Chem. Thermodyn.
37, 1098 (2005).32R. Basili, A. El-Sharkawy, and S. Atalla, Rev. Int. Hautes Temp. Refract.
16, 331 (1979).
ject to the terms at: http://scitation.aip.org/termsconditions. Downloaded to IP:
27 Apr 2014 17:09:58

THERMODYNAMIC PROPERTIES OF LANTHANIDE AND ACTINIDE OXIDE COMPOUNDS 013101-89
This a
33P. Wu and A. D. Pelton, J. Alloys Compd. 179, 259 (1992).34E. H. P. Cordfunke and R. J. M. Konings, Thermochim. Acta 375, 51(2001).
35E. J. Huber, Jr. and C. E. Holley, Jr., J. Am. Chem. Soc. 75, 5645 (1953).36R. L. Montgomery and T. D. Hubert, Technical Report USBM-RI-5525
(U.S. Bureau of Mines, 1959).37G. C. Fitzgibbon, C. E. Holley, Jr., and I. Wadsö, J. Phys. Chem. 69, 2464(1965).
38G. G. Gvelesiani and T. S. Yashvili, Zh. Neorg. Khim. 12, 3233 (1967).39L. Merli, F. Rorif, and J. Fuger, Radiochim. Acta 82, 3 (1998).40W. Muthmann and L. Weis, Ann. 331, 1 (1904).41C. Matignon, Ann. Chim. Phys. 10, 101 (1906).42H. C. Kremers and R. G. Stevens, J. Am. Chem. Soc. 45, 614 (1923).43J. E. Moose and S. W. Parr, J. Am. Chem. Soc. 46, 2656 (1924).44G. Beck, Z. Anorg. Allg. Chem. 174, 31 (1928).45W. A. Roth, U. Wolf, and O. Fritz, Z. Electrochem. 46, 42 (1940).46H. von Wartenberg, Z. Anorg. Allg. Chem. 299, 227 (1959).47H. Oppermann, A.Morgenstern, and S. Ehrlich, Z. Naturforsch. B 52, 1062(1997).
48M. Zinkevich, D. Djurovic, and F. Aldinger, Solid State Ionics 177, 989(2006).
49A. M. Tshieryepanov and S. G. Trjesvyatsky, Mettallgyzdat M. 358
(1964).50F. Trombe, cited by Noguchi and Mizino (1967).51M. D. Watson, Ph.D. thesis (Georgia Institute of Technology, 1977).52D.Manara, R. Böhler, K. Boboridis, L. Capriotti, A. Quaini, L. Luzzi, F. D.Bruycker, C. Guéneau, N. Dupin, and R. Konings, Procedia Chem. 7, 505(2012).
53Y. Du, M. Yashima, T. Koura, M. Kakihana, and M. Yoshimura, Scr.
Metall. Mater. 31, 327 (1994).54O. Ruff, Z. Anorg. Allg. Chem. 82, 373 (1913).55H. von Wartenberg and W. Gurr, Z. Anorg. Chem. 196, 374 (1930).56E. F. Westrum, Jr. and A. F. Beale, Jr., J. Chem. Phys. 65, 353 (1961).57F. A. Kuznetsov, T. N. Rezukhina, and A. N. Golubenko, Russ. J. Phys.
Chem. 34, 1010 (1960).58C. D. Pears, S. Oglesby, J. G. Allen, D. S. Neel, W. H.Mann, P. H. Rhodes,
D. Osment, W. J. Barrett, S. G. Holder, and J. O. Honeycutt, Jr. et al.,
Technical Report AASD-TDR-62-765 (Southern Research Institute,
Birmingham, Alabama, 1963).59R. Mezaki, E. W. Tilleux, T. F. Jambois, and J. L. Margrave, in Proceed-
ings of 3rd ASME Symposium on Advanced Thermophysical Property of
Extreme Temperature, Lafayette, Indiana (New York, 1965).60T. S. Yashvili, D. S. Tsagareishvili, and G. G. Gvelesiani, Soobshch. Akad.
Nauk Gruz. SSR 46, 409 (1967).61I. Riess, M. Ricken, and J. Nölting, J. Solid State Chem. 57, 314 (1985).62S. A. Gallagher and W. R. Dworzak, J. Am. Ceram. Soc. 68, C206 (1985).63F. B. Baker, E. J. Huber, Jr., C. E. Holley, Jr., andN. H. Krikorian, J. Chem.
Thermodyn. 3, 77 (1971).64H. Hirsch, Trans. Electrochem. Soc. 20, 57 (1911).65L. B. Pankratz and K. K. Kelly, Technical Report RI-6248 (U.S. Bureau of
Mines, 1963).66W. W. Weller and E. G. King, Technical Report RI-6245 (U.S. Bureau of
Mines, 1963).67B. H. Justice and E. F. Westrum, Jr., J. Phys. Chem. 73, 1959 (1969).68M. E. Huntelaar, A. S. Booij, E. H. P. Cordfunke, R. R. van der Laan, A. C.
G. van Genderen, and J. C. van Miltenburg, J. Chem. Thermodyn. 32, 465(2000).
69J. B. Gruber, B. H. Justice, E. F. Westrum, Jr., and B. Zandi, J. Chem.
Thermodyn. 34, 457 (2002).70F. A. Kuznetsov, V. I. Belyi, T. N. Rezukhina, and Y. I. Gerasimov, Dokl.
Acad. Nauk SSSR 139, 1405 (1961).71R. Venkata Krishnan and K. Nagarajan, Thermochim. Acta 440, 141(2006).
72A. D. Mah, Technical Report USBM-RI-5676 (U.S. Bureau of Mines,
1961).73F. B. Baker and C. E. Holley, Jr., J. Chem. Eng. Data 13, 405 (1968).74R. L. Putnam, A. Navrotsky, E. H. P. Cordfunke, and M. E. Huntelaar, J.
Chem. Thermodyn. 32, 911 (2000).75F. H. Spedding and C. F. Miller, J. Am. Chem. Soc. 74, 4195 (1952).76L. R. Morss and R. J. M. Konings, Binary Rare Earth Oxides (Springer-
Verlag, 2004), Chap. 7, pp. 163–188.77B. G. Hyde, E. E. Garver, U. E. Kuntz, and L. Eyring, J. Phys. Chem. 69,1667 (1965).
rticle is copyrighted as indicated in the article. Reuse of AIP content is sub
78.131.95.159 On: Sun,
78S. V. Ushakov and A. Navtrosky, in Proceedings of the 23rd Rare Earth
Research Conference, Davis, USA (Academic Press, San Diego, California,
2002).79C. H. Gardiner, A. T. Boothroyd, P. Pattison, M. J. McKelvy, G. J.
McIntyre, and S. J. S. Lister, Phys. Rev. B 70, 024415 (2004).80H. Eyring, R. Lohr, and B. B. Cunningham, J. Am. Chem. Soc. 74, 1186(1952).
81S. A. Gramsch and L. R. Morss, J. Chem. Thermodyn. 27, 551 (1995).82L. B. Pankratz, Techical Report RI-6781 (U.S. Bureau of Mines, 1966).83R. P. Turcotte, J. M. Warmkessel, R. J. D. Tilley, and L. Eyring, J. Solid
State Chem. 3, 265 (1971).84C. T. Stubblefield, H. Eick, and L. Eyring, J. Am. Chem. Soc. 78, 3877(1956).
85G. C. Fitzgibbon, E. J. Huber, Jr., and C. E. Holley, Jr., Rev. Chim. Miner.
10, 29 (1973).86C. T. Stubblefield, Rev. Sci. Instrum. 40, 456 (1969).87M. V. Kravchonskaya, A. K. Kuznetsov, P. A. Tckhonov, and E. K.
Koehler, Ceram. Int. 4, 14 (1978).88F. A. Kuznetsov and T. N. Rezukhina, Russ. J. Phys. Chem. 36, 729(1962).
89I. Warshaw and R. Roy, J. Phys. Chem. 65, 2048 (1961).90L. B. Pankratz, E. G. King, and K. K. Kelly, Technical Report RI-6033
(U.S. Bureau of Mines, 1962).91P. Aldebert and J. P. Traverse, Mater. Res. Bull. 14, 303 (1979).92R. L. Gibby, C. E. McNeilly, and T. D. Chikalla, J. Nucl. Mater. 34, 299(1970).
93M. Bober, H. U. Karow, and K. Muller, High Temp.-High Press. 12, 161(1980).
94J. P. Coutures, J. Am. Ceram. Soc. 68, 105 (1985).95T. P. Salikhov and V. V. Kan, Int. J. Thermophys. 20, 1801 (1999).96S. Stecura and W. J. Campbell, Technical Report RI-5847 (U.S. Bureau of
Mines, 1961).97C. Matignon, Ann. Chim. Phys. 10, 101 (1907).98E. J. Huber, Jr. and C. E. Holley, Jr., J. Am. Chem. Soc. 74, 5530 (1952).99F. H. Spedding, K. Gschneidner, Jr., and A. H. Daane, Trans. Metall. Soc.
AIME 215, 192 (1959).100G. C. Fitzgibbon, D. Pavone, and C. E. Holley, Jr., J. Chem. Eng. Data 13,
547 (1968).101T. S. Yashvili and G. G. Gvelesiani, Russ. J. Phys. Chem. 45, 551 (1971).102L. R. Morss, C. M. Haar, and S. Mroczkowski, J. Chem. Thermodyn. 21,
1079 (1989).103A. A. Popova and A. S. Monaenkova, Zh. Fiz. Khim. 63, 2340 (1989).104C. Hennig and H. Oppermann, Z. Naturforsch. B 53, 175 (1998).105J. M. Stuve, Technical Report USBM-RI-6697 (U.S. Bureau of Mines,
1965).106L. A. Tiflova, Ph.D. thesis, Moscow State University, 1990.107T. D. Chikalla, C. E. McNeilly, J. L. Bates, and J. J. Rasmussen, (1972),
Vol. N205, p. 351.108R. L. Gibby, T. D. Chikalla, R. P. Nelson, and C. E. McNeilly, Technical
Report BNWL-SA-1796-A (Battelle Memorial Institute, 1968).109R. J. M. Konings, J. Nucl. Mater. 301, 223 (2002).110T. D. Chikalla, C. E. McNeilly, and F. P. Roberts, J. Am. Ceram. Soc. 55,
428 (1972).111L. G. Wisnyi and S. Pijanowski, Technical Report TID 7530 (U.S. Atomic
Energy Commission, 1957).112C. E. Curtis and J. R. Johnson, J. Am. Ceram. Soc. 40, 15 (1957).113B. H. Justice and E. F. Westrum, Jr., J. Phys. Chem. 67, 345 (1963).114L. B. Pankratz, E. G. King, and K. K. Kelley, Technical Report RI 6033
(U.S. Bureau of Mines, 1961).115G. G. Gvelesiani, D. S. Tsagareishvili, and T. S. Yashvili, Izv. Akad. Nauk
SSSR, Neorg. Mater. 4, 553 (1968).116H. R. Hoekstra, Inorg. Chem. 5, 754 (1966).117E. J. Huber, Jr., C. O. Matthews, and C. E. Holley, Jr., J. Am. Chem. Soc.
77, 6493 (1955).118F. B. Baker, G. C. Fitzgibbon, D. Pavone, C. E. Holley, Jr., L. D. Hansen,
and E. A. Lewis, J. Chem. Thermodyn. 4, 621 (1972).119C. Hennig and H. Oppermann, Z. Naturforsch. B 52, 1517 (1997).120S. Stecura, Technical Report USBM-RI-6616 (U. S. Bureau of Mines,
1965).121R. S. Roth and S. J. Schneider, J. Res. Natl. Bur. Stand. 64A, 309 (1960).122J. B. Ainscough, D. A. Moore, and S. C. Osborn, J. Nucl. Mater. 55, 229
(1975).123H. Suzuki, T. Iseki, and T. Maruyama, J. Am. Ceram. Soc. 59, 451 (1976).
J. Phys. Chem. Ref. Data, Vol. 43, No. 1, 2014ject to the terms at: http://scitation.aip.org/termsconditions. Downloaded to IP:
27 Apr 2014 17:09:58
013101-90 KONINGS ET AL.
This a
124I. S. Sukhushina, I. A. Vasil’eva, and S. B. Dashkov, Russ. J. Phys. Chem.
67, 1776 (1993).125S. J. Schneider, J. Res. Natl. Bur. Stand., Sect. A 65, 429 (1961).126N. S. Lyutsareva, G. A. Berezovskii, and I. E. Paukov, Zh. Fiz. Khim. 68,
1179 (1994).127R. J. M. Konings, J. C. van Miltenburg, and A. G. G. van Genderen,
J. Chem. Thermodyn. 37, 1219 (2005).128L. B. Pankratz and E. G. King, Techical Report RI-6175 (U.S. Bureau of
Mines, 1962).129D. S. Tsagareishvili and G. G. Gvelesiani, Russ. J. Inorg. Chem. 10, 171
(1965).130E. C. Curtis and A. G. Tharp, J. Am. Ceram. Soc. 42, 151 (1959).131R. L. Wilfong, L. P. Domingues, L. R. Furlong, and J. A. Finlayson,
Technical Report RI-6180 (U. S. Bureau of Mines, 1962).132E. J. Huber, Jr., G. C. Fitzgibbon, and C. E. Holley, Jr., J. Phys. Chem. 68,
2720 (1964).133G. C. Fitzgibbon, E. J. Huber, Jr., and C. E. Holley, Jr., J. Chem.
Thermodyn. 4, 349 (1972).134C. Hennig, H. Oppermann, and A. Blonska, Z. Naturforsch. B 53, 1169
(1998).135J. M. Stuve, Technical Report USBM-RI-6640 (U.S. Bureau of Mines,
1965).136R. G. Bedford and E. Catalano, J. Solid State Chem. 3, 112 (1971).137J. M. Haschke and H. A. Eick, J. Phys. Chem. 72, 4235 (1968).138H. A. Eick, N. C. Baenziger, and L. Eyring, J. Am. Chem. Soc. 78, 5147
(1956).139O. D. McMasters, K. A. Gschneider, Jr., E. Kaldis, and G. Sampietro,
J. Chem. Thermodyn. 6, 845 (1974).140G. J. McCarthy and W. B. White, J. Less-Common Met. 22, 409 (1970).141M. W. Shafer, J. B. Torrance, and T. Penney, J. Phys. Chem. Solids 33,
2251 (1972).142T. B. Reed and R. E. Fahey, J. Cryst. Growth 8, 337 (1971).143D. T. Teany and V. L. Moruzzi, Les Eléments des Terres Rares, Tome II
(Centre National de la Recherche Scientifique, Paris, 1970), p. 131.144J. L. Burnett, Technical Report UCRL-11850, 1964.145E. J. Huber and C. E. Holley, Jr., J. Chem. Thermodyn. 1, 301 (1969).146E. J. Huber and C. E. Holley, Jr., J. Chem. Thermodyn. 2, 896 (1970).147M. W. Shafer and R. Roy, J. Am. Ceram. Soc. 42, 563 (1959).148L. S. Barkhatov, L. I. Zhmakin, D. N. Kagan, V. V. Koroleva, and E. E.
Shpil’rain, High Temp.-High Press. 13, 39 (1981).149F. M. Spiridonov, V. A. Stephanov, L. N. Komissarova, and V. I. Spitsyn,
J. Less-Common Met. 14, 435 (1968).150M. Mizuno, T. Yamada, and T. Noguchi (personal communication, 1989).151K. W. Kang, J. H. Yang, J. H. Kim, Y. W. Rhee, D. J. Kim, K. S. Kim, and
K. W. Song, Thermochim. Acta 455, 134 (2007).152G. R. Stewart, J. L. Smith, J. C. Spirlet, and W. M€uller, in Proceedings of
3rd Conference on Superconductivity in 5f and 6d Metals, La Jolla,
California, edited by H. Subl and M. B. Maple (Academic, New York,
1979), pp. 65–70.153A. E. Miller, F. J. Jelinek, K. A. Gschneidner, Jr., and B. C. Gerstein,
J. Chem. Phys. 55, 2647 (1971).154S. S. Rosenblum, H. Sheinberg, and W. A. Steyert, IEEE Trans. Magn.
MAG-13, 834 (1977).155D. S. Tsagareishvili, G. G. Gvelesiani, and T. S. Yashvili, Russ. J. Phys.
Chem. 43, 487 (1969).156E. J. Huber, Jr. and C. E. Holley, Jr., J. Am. Chem. Soc. 77, 1444 (1955).157A. T. Lowe and L. Eyring, J. Solid State Chem. 14, 383 (1975).158G. C. Fitzgibbon and C. E. Holley, Jr., J. Chem. Eng. Data 13, 63 (1968).159R. W. Hill, J. Phys. C 19, 673 (1986).160R. J. M. Konings and A. Kovács, Handbook on the Physics and Chemistry
of Rare Earths (North-Holland, Amsterdam, 2003), Vol. 33, Chap. 213,
pp. 147–247.161B. H. Justice and E. F. Westrum, Jr., J. Phys. Chem. 67, 659 (1963).162E. J. Huber, Jr., G. C. Fitzgibbon, and C. E. Holley, Jr., J. Chem.
Thermodyn. 3, 643 (1971).163E. J. Huber, Jr., E. L. Head, and C. E. Holley, Jr., J. Phys. Chem. 60, 1457
(1956).164D. S. Tsagareishvili and G. G. Gvelesiani, Inorg. Mater. 7, 1679
(1971).165E. J. Huber, Jr., E. L. Head, and C. E. Holley, Jr., J. Phys. Chem. 61, 1021
(1957).166L. R. Morss, P. P. Day, C. Felinto, and H. Brito, J. Chem. Thermodyn. 25,
415 (1993).
J. Phys. Chem. Ref. Data, Vol. 43, No. 1, 2014rticle is copyrighted as indicated in the article. Reuse of AIP content is sub
78.131.95.159 On: Sun,
167J. M. Stuve, Technical Report USBM-RI-7046 (U. S. Bureau of Mines,
1967).168Y. J. Tang, X. W. Cao, J. C. Ho, and H. C. Ku, Phys. Rev. B 46, 1213
(1992).169D. S. Tsagareishvili and G. G. Gvelesiani, High Temp. 9, 588 (1971).170E. E. Shpil’rain, D. N. Kagan, L. S. Barkhatov, and V. V. Koroleva, High
Temp.-High Press. 8, 183 (1976).171E. J. Huber, Jr., E. L. Head, and C. E. Holley, Jr., J. Phys. Chem. 60, 1582
(1956).172R. L. Montgomery and J. M. Stuve, Technical Report USBM-RI-5892
(U.S. Bureau of Mines, 1961).173J. Fuger, L. R. Morss, and D. Brown, J. Chem. Soc. Dalton Trans. 1980,
1076.174B. H. Justice, E. F. Westrum, Jr., E. Chang, and R. Radebaugh, J. Phys.
Chem. 73, 333 (1969).175E. J. Huber, Jr., E. L. Head, and C. E. Holley, Jr., J. Chem. Phys. 33, 1849
(1960).176H. Li, C. Y. Wu, and J. C. Ho, Phys. Rev. B 49, 1447 (1994).177A. K. Shirvinskaya and V. F. Popova, Dokl. Akad. NAuk SSSR 233, 1110
(1977).178E. J. Huber, Jr., E. L. Head, and C. E. Holley, Jr., J. Phys. Chem. 64, 1768
(1960).179K. P. Huber and G. Herzberg,Molecular Spectra and Molecular Structure.
IV. Constants of Diatomic Molecules (Van Nostrand Reinhold, New York,
1979).180L. V. Gurvich, I. V. Veyts et al., Termodinamicheskiye Svoistva Indivi-
dual’nykh Veschestv, 3rd ed. (Nauka, Moscow, 1978), Vols. 1–4.181A. Bernard and A. M. Sibai, Z. Naturforsch. 35a, 1313 (1980).182C. B. Suarez, Spectrosc. Lett. 18, 507 (1985).183P. Carette, J. Mol. Spectrosc. 140, 269 (1990).184A. Bernard and J. Vergès, J. Mol. Spectrosc. 201, 172 (2000).185T. C. Steimle and W. Virgo, J. Chem. Phys. 116, 6012 (2002).186A. Bernard, F. Taher, A. Topouzkhanian, and G. Wannous, Astron.
Astrophys. Suppl. Ser. 139, 163 (1999).187W. J. Childs, G. L. Goodman, L. S. Goodman, and L. Young, J. Mol.
Spectrosc. 119, 166 (1986).188R. D. Suenram, F. J. Lovas, G. T. Fraser, and K.Matsumura, J. Chem. Phys.
92, 4724 (1990).189T. Törring, K. Zimmermann, and J. Hoeft, Chem. Phys. Lett. 151, 520
(1988).190L. Andrews, M. Zhou, G. V. Chertihin, and C. W. Bauschlicher, Jr., Phys.
Chem. A 103, 6525 (1999).191L. Zhang, L. Shao, and M. Zhou, Chem. Phys. 272, 27 (2001).192G. Hong, M. Dolg, and L. Li, Chem. Phys. Lett 334, 396 (2001).193M. Dolg and H. Stoll, Theor. Chim. Acta 75, 369 (1989).194M. Dolg, H. Stoll, H. J. Flad, and H. Preuss, J. Chem. Phys. 97, 1162
(1992).195X. Cao, W. Liu, and M. Dolg, Sci. China, Ser. B: Chem. 45, 91 (2002).196A. Marquez, M. J. Capitan, A. Odriozola, and J. F. Sanz, Int. J. Quantum
Chem. 52, 1329 (1994).197M. Kotzian, N. Roesch, and M. C. Zerner, Theor. Chim. Acta 81, 201
(1992).198J. Schamps,M. Bencheikh, J.-C. Barthelat, and R.W. Field, J. Chem. Phys.
103, 8004 (1995).199L. A. Kaledin, J. E. McCord, and M. Heaven, J. Mol. Spectrosc. 158, 40
(1993).200R. Klingeler, G. Luttgens, N. Pontius, R. Rochow, P. S. Bechthold, M.
Neeb, and W. Eberhardt, Eur. Phys. J. D 9, 263 (1999).201L. Schoonveld and S. Sundaram, Astrophys. J., Suppl. 27, 307 (1974).202H. W. Goldstein, P. N. Walsh, and D. White, J. Phys. Chem. 65, 1400
(1961).203R. J. Ackermann and E. Rauh, J. Chem. Thermodyn. 3, 445 (1971).204W. A. Chupka, M. G. Inghram, and R. F. Porter, J. Chem. Phys. 24, 792
(1956).205S. Smoes, J. Drowart, and G. Verhaegen, J. Chem. Phys. 43, 732 (1965).206L. L. Ames, P. N. Walsh, and D. White, J. Phys. Chem. 71, 2707 (1967).207P. Coppens, S. Smoes, and J. Drowart, Trans. Faraday Soc. 63, 2140
(1967).208P. Coppens, S. Smoes, and J. Drowart, Trans. Faraday Soc. 64, 630 (1968).209J. L. Gole and C. L. Chalek, J. Chem. Phys. 65, 4384 (1976).210A. C. Parr (private communication, 1974); cited in L. M. Biann and P. G.
Wahlbeck, High Temp. Sci. 6, 179 (1974).211R. L. DeKock and W. Weltner, Jr., J. Phys. Chem. 75, 514 (1971).
ject to the terms at: http://scitation.aip.org/termsconditions. Downloaded to IP:
27 Apr 2014 17:09:58

THERMODYNAMIC PROPERTIES OF LANTHANIDE AND ACTINIDE OXIDE COMPOUNDS 013101-91
This a
212S. D. Gabelnick, G. T. Reedy, and M. G. Chasanov, J. Chem. Phys. 60,1167 (1974).
213S. P. Willson and L. Andrews, J. Phys. Chem. A 103, 3171 (1999).214C. Heinemaan, H. H. Cornehl, D. Schröder, M. Dolg, and H. Schwarz,
Inorg. Chem. 35, 2463 (1996).215M. H€ulsen, A. Weigand, and M. Dolg, Theor. Chem. Acc. 122, 23 (2009).216T. K. Todorova, I. Infante, L. Gagliardi, and J. M. Dyke, Int. J. Quantum
Chem. 109, 2068 (2009).217S. A. Shukarev and G. A. Semenov, Dokl. Akad. Nauk SSSR 141, 652
(1961).218G. Benezech and M. Foex, Compt. Rend. (Paris) 268C, 2315 (1969).219V. Piacente, G. Bardi, L. Malaspina, and A. Desideri, J. Chem. Phys. 59, 31
(1973).220R. J. Ackermann and E. Rauh, J. Chem. Thermodyn. 3, 609 (1971).221C. Younés, L. D. Nguyen, and A. Pattoret, High Temp.-High Press. 13, 105
(1981).222H. G. Staley and J. H. Norman, J. Mass. Spectrom. Ion. Phys. 2, 35 (1969).223R. F. Barrow, R. Clements, S. M. Harris, and P. P. Jenson, Astrophys. J.
229, 439 (1979).224C. Linton, M. Dulick, and R. W. Field, J. Mol. Spectrosc. 78, 428–436
(1979).225C. Linton, M. Dulick, R. W. Field, P. Carrete, and R. Barrow, J. Chem.
Phys. 74, 189 (1981).226C. Linton and M. Dulick, J. Mol. Spectrosc. 89, 569 (1981).227C. Linton, M. Dulick, R. W. Field, P. Carette, P. C. Leyland, and R. F.
Barrow, J. Mol. Spectrosc. 102, 441 (1983).228R. B. Dushin and L. D. Shcherba, Khim. Fiz. 4, 321 (1985).229L. A. Kaledin, J. E.McCord, andM. C. Heaven, J. Mol. Spectrosc. 170, 166
(1995).230P. Carrete and A. Hocquet, J. Mol. Spectrosc. 131, 301 (1988).231M. Dolg, H. Stoll, and H. Preuss, J. Mol. Struct. (THEOCHEM) 231, 243
(1991).232M. Kotzian and N. Roesch, Eur. J. Solid State Inorg. Chem. 28(Suppl.), 127
(1991).233R. W. Field, Ber. Bunsenges. Phys. Chem. 86, 771 (1982).234M. Dulick, Ph.D. thesis, Massachusetts Institute of Technology, Cambridge,
Mass., 1982.235P. N. Walsh, D. F. Dever, and D. White, J. Phys. Chem. 65, 1410 (1961).236E. A. Shenyavskaya, I. V. Egorova, and V. N. Lupanov, J. Mol. Spectrosc.
47, 355 (1973).237J. M. Delaval, J. Van Heems, and J. C. Beaufils, Can. J. Spectrosc. 22, 117
(1977).238J. C. Beaufils, P. Carette, and J. Blondeau, J. Mol. Spectrosc. 77, 1 (1979).239M. Dulick, R. W. Field, and J. C. Beaufils, J. Mol. Spectrosc. 78, 333
(1979).240M. Dulick, R. W. Field, and J. C. Beaufils, J. Mol. Spectrosc. 87, 268
(1981).241M. Dulick, R. W. Field, J. C. Beaufils, and J. Schamps, J. Mol. Spectrosc.
87, 278 (1981).242E. A. Shenyavskaya and L. A. Kaledin, J. Mol. Spectrosc. 91, 22
(1982).243M. Dulick and R. W. Field, J. Mol. Spectrosc. 113, 105–141 (1985).244W. J. Childs, Y. Azuma, and G. L. Goodman, J. Mol. Spectrosc. 144, 70
(1990).245W. Weltner and R. L. De Kock, J. Chem. Phys. 75, 514 (1971).246S. P. Willson, L. Andrews, and M. Neurock, J. Phys. Chem. A 104, 3446
(2000).247M. Dulick, E. Murad, and R. F. Barrow, J. Chem. Phys. 85, 385 (1986).248M. Kotzian and N. Roesch, J. Mol. Spectrosc. 147, 346 (1991).249J. A. Fries and E. D. Cater, Technical Report COO-1182-27 (U.S. Atomic
Energy Commission/University of Iowa, Iowa City, 1969).250E. Murad, Chem. Phys. Lett. 59, 359 (1978).251C. Linton, C. Effantin, P. Crozet, A. J. Ross, E. A. Shenyavskaya, and J.
d’Incan, J. Mol. Spectrosc. 225, 132 (2004).252E. A. Shenyavskaya, A. Bernard, and J. Vèrges, J. Mol. Spectrosc. 222, 240
(2003).253A. N. Kulikov, Ph.D. thesis, Moscow State University, Moscow, 1985).254L. A. Kaledin and E. A. Shenyavskaya, Opt. Spectrosc. (USSR) 47, 564
(1979).255L. A. Kaledin, E. A. Shenyavskaya, and I. Kovacs, Acta Phys. Hung. 54,
189 (1983).256E. A. Boudreaux and E. Baxter, Int. J. Quantum Chem. 90, 629 (2002).257M. Krauss and W. J. Stevens, Mol. Phys. 101, 125 (2003).
rticle is copyrighted as indicated in the article. Reuse of AIP content is sub
78.131.95.159 On: Sun,
258L. A. Kaledin, J. E. McCord, and M. Heaven, J. Mol. Spectrosc. 164, 27(1994).
259M. Tetenbaum, High Temp. Sci. 7, 37 (1975).260E. Murad and D. L. Hildenbrand, J. Chem. Phys. 73, 4005 (1980).261J. K. Gibson, J. Phys. Chem. A 107, 7891 (2003).262C. Linton, A. M. James, and B. Simard, J. Chem. Phys. 99, 9420 (1993).263G. Bujin and C. Linton, J. Mol. Spectrosc. 147, 120 (1991).264G. Bujin and C. Linton, J. Mol. Spectrosc. 137, 114 (1989).265C. Linton, G. Bujin, R. Rana, and J. A. Gray, J. Mol. Spectrosc. 126, 370
(1987).266C. Linton, G. Bujin, R. Rana, and J. A. Gray, J. Phys. Colloq. 48, 663
(1987).267M. C. Hannigan, J. Mol. Spectrosc. 99, 235 (1983).268H. L. Hildenbrand, Chem. Phys. Lett. 48, 340 (1977).269C. R. Dickson and R. N. Zare, Chem. Phys. 7, 361 (1975).270S. A. McDonald, Ph.D. thesis, Massachusetts Institute of Technology,
1985).271M. Dolg, H. Stoll, and H. Preuss, Chem. Phys. Lett. 174, 208 (1990).272E. Murad and D. L. Hildenbrand, J. Chem. Phys. 65, 3250 (1976).273G. Balducci, G. Gigli, and M. Guido, J. Chem. Phys. 67, 147 (1977).274B. R. Yadav, S. B. Rai, and D. K. Rai, Can. J. Phys. 54, 2429 (1976).275B. R. Yadav, S. B. Rai, and D. K. Rai, J. Mol. Spectrosc. 89, 1 (1981).276C. B. Suárez and R. Grinfeld, J. Chem. Phys. 53, 1110 (1970).277R. J. Van Zee, R. F. Ferrante, K. J. Zeringue, and W. Weltner, J. Chem.
Phys. 75, 5297 (1981).278Y. N. Dmitriev, L. A. Kaledin, E. A. Shenyavskaya, and L. V. Gurvich,
Acta Phys. Hung. 55, 467 (1984).279Y. N. Dmitriev, L. A. Kaledin, A. Kobylyanskii, A. N. Kulikov, E. A.
Shenyavskaya, and L. V. Gurvich, Acta Phys. Hung. 61, 51 (1987).280Y. N. Dmitriev, Ph.D. thesis, Moscow State University, 1988.281L. V. Gurvich, Y. N. Dmitriev, L. A. Kaledin, A. Kobylyanskii, A. N.
Kulikov, and E. A. Shenyavskaya, Izv. Akad. Nauk SSSR, Ser. Geogr.
Geofiz. 48, 721 (1984).282P. Carette, A. Hocquet, M. Douay, and B. Pinchemel, J. Mol. Spectrosc.
124, 243 (1987).283M. Dolg, W. Liu, and S. Kalvoda, Int. J. Quantum Chem. 76, 359 (2000).284Y. Sakai, T. Nakai, K. Mogi, and E. Miyoshi, Mol. Phys. 101, 117 (2003).285R. Klingeler, N. Pontius, G. Luttgens, P. S. Bechthold, M. Neeb, and W.
Eberhardt, Phys. Rev. A 65, 032502 (2002).286L. A. Kaledin and E. A. Shenyavskaya, Optika i Spektroskopiya 51, 934
(1981).287L. A. Kaledin and E. A. Shenyavskaya, J. Mol. Spectrosc. 90, 590 (1981).288A. N. Kulikov, L. A. Kaledin, A. I. Kobylyanskii, and L. V. Gurvich, Zh.
Fiz. Khim. 58, 2854 (1984).289A. N. Kulikov, L. A. Kaledin, A. I. Kobylyanskii, and L. V. Gurvich, Can.
J. Phys. 62, 1855 (1984).290B. R. Yadav, S. B. Rai, and D. K. Rai, Pramana 14, 379 (1980).291C. Linton, D. M. Gaudet, and H. Shall, J. Mol. Spectrosc. 115, 58 (1986).292C. H. Cheng, Diss. Abstr. Int. B 54, 4212 (1994).293Y. C. Liu, C. Linton, H. Shall, and R. W. Field, J. Mol. Spectrosc. 104, 72
(1984).294C. Linton and Y. C. Liu, J. Mol. Spectrosc. 131, 367 (1988).295L. A. Kaledin and E. A. Shenyavskaya, J. Mol. Spectrosc. 133, 469 (1989).296T. C. Melville, I. Gordon, K. Tereszchuk, J. A. Coxon, and P. F. Bernath, J.
Mol. Spectrosc. 218, 235 (2003).297S. A. McDonald, S. R. Rice, R. W. Field, and C. Linton, J. Chem. Phys. 93,
7676 (1990).298T. C. Steimle, D. M. Goodridge, and C. Linton, J. Chem. Phys. 107, 3723
(1997).299W. Liu, M. Dolg, and L. Li, J. Chem. Phys. 108, 2886 (1998).300A. Yokozeki and M. Menzinger, Chem. Phys. 14, 427 (1976).301C. B. Cosmovici, E. D’Anna, A. D’Innocenzo, G. Leggieri, A. Perrone, and
R. Dirscherl, Chem. Phys. Lett. 47, 241 (1977).302A. Bernard and C. Effantin, Can. J. Phys. 64, 246–251 (1986).303S. A. Cooke, C. Krumrey, and M. C. L. Gerry, J. Mol. Spectrosc. 267, 108
(2011).304S. G. Wang and W. H. E. Schwarz, J. Phys. Chem. A 99, 11687 (1995).305W. K€uchle, M. Dolg, and H. Stoll, J. Phys. Chem. A 101, 7128 (1997).306R. J. M. Konings, L. R. Morss, and J. Fuger, The Chemistry of the Actinide
and Transactinide Elements (Springer-Verlag, Berlin, 2006), Chap. 19, pp.
2113–2224.307C. Ronchi and J. Hiernaut, J. Alloys Compd. 240, 179 (1996).308O. Ruff, F. Ebert, and H.Woitinek, Z. Anorg. Allg. Chem. 180, 252 (1929).
J. Phys. Chem. Ref. Data, Vol. 43, No. 1, 2014ject to the terms at: http://scitation.aip.org/termsconditions. Downloaded to IP:
27 Apr 2014 17:09:58

013101-92 KONINGS ET AL.
This a
309H. V. Wartenberg and H. J. Reusch, Z. Anorg. Allg. Chem. 208, 369(1932).
310G. A. Geach and M. E. Harper, Metallurgia 47, 269 (1953).311W. A. Lambertson, M. H. Mueller, and F. H. Gunzel, J. Am. Ceram. Soc.
36, 397 (1953).312R. Benz, J. Nucl. Mater. 29, 43 (1969).313F. Sibieude and M. Foex, J. Nucl. Mater. 56, 229 (1975).314D. W. Osborne and E. F. Westrum, Jr., J. Chem. Phys. 21, 1884 (1953).315J. D. Cox, D. D. Wagman, and V. A. Medvedev, CODATA Key Values for
Thermodynamics (Hemisphere, New York, 1989).316N.Magnani, P. Santini, G. Amoretti, R. Caciuffo, P. Javorský, F. Wastin, J.
Rebizant, and G. H. Lander, Physica B 359–361, 1087 (2005).317F. M. Jaeger and W. A. Veenstra, Proc. R. Acad. Sci. Amsterdam 37, 327
(1934).318J. C. Southard, J. Am. Chem. Soc. 63, 3142 (1941).319M. Hoch and H. L. Johnston, J. Phys. Chem. 65, 1184 (1961).320A. C. Victor and T. B. Douglas, J. Res. Natl. Bur. Stand., Ser. A 65, 105
(1961).321J. Springer, E. A. Eldridge, M. U. Goodyear, T. R. Wright, and J. F.
Langedrost, Technical Report BMI-X-10210 (Battelle Memorial Institute,
1967).322J. Springer and J. F. Langedrost, Technical Report BMI-X-10231 (Battelle
Memorial Institute, 1968).323D. F. Fischer, J. K. Fink, and L. Leibowitz, J. Nucl. Mater. 102, 220 (1981).324R. Agarwal, R. Prasad, and V. Venugopal, J. Nucl. Mater. 322, 98 (2003).325S. Dash, S. C. Parida, Z. Singh, B. K. Sen, and V. Venugopal, J. Nucl.
Mater. 393, 267 (2009).326J. K. Fink, M. G. Chasanov, and L. Leibowitz, Technical Report ANL-
CEN-RSD–77-1 (Argonne National Laboratory, 1977).327E. J. Huber, Jr., C. E. Holley, Jr., and E. H. Meierkord, J. Am. Chem. Soc.
74, 3406 (1952).328W. A. Roth and G. Becker, Z. Phys. Chem. A159, I (1932).329R. J. M. Konings, J. Chem. Thermodyn. 36, 121 (2004).330R. J. M. Konings and O. Beneš, J. Phys. Chem. Solids 74(5), 653
(2013).331A. R. Beketov and G. W. Vlasov, Zh. Prikl. Khim. 38, 2103 (1965).332E. H. P. Cordfunke and P. Aling, Trans. Faraday Soc. 61, 50 (1965).333W. M. Jones, J. Gordon, and E. A. Long, J. Chem. Phys. 20, 695 (1952).334E. H. P. Cordfunke and E. F. Westrum, Jr., Thermochim. Acta 124, 285
(1988).335M.M. Popov, G. L. Galchenko, andM. D. Senin, Zh. Neorg. Khim. 3, 1734
(1958).336G. E. Moore and K. K. Kelley, J. Am. Chem. Soc. 69, 2105 (1947).337G. C. Fitzgibbon, D. Pavone, and C. E. Holley, Jr., J. Chem. Eng. Data 12,
122 (1968).338G. K. Johnson and P. A. G. O’Hare, J. Chem. Thermodyn. 10, 577 (1978).339H. L. Girdhar and E. F. Westrum, Jr., J. Chem. Eng. Data 13, 531 (1968).340H. Inaba, H. Shimizu, and K. Naito, J. Nucl. Mater. 64, 66 (1977).341D. Manara, R. Pflieger-Cuveiller, and M. Sheindlin, Int. J. Thermophys.
26, 1193 (2005).342E. F. Westrum, Jr. and F. Grønvold, J. Am. Chem. Soc. 81, 1777
(1959).343M. M. Popov, F. A. Kostylev, and N. V. Zubova, Russ. J. Inorg. Chem. 4,
770 (1959).344K. Maglic and R. Herak, Rev. Int. Hautes Temp. Refract. 7, 247
(1970).345D. I. Marchidan and M. Ciopec, Rev. Roum. Chim. 20, 143 (1975).346E. J. Huber and C. E. Holley, Jr., J. Chem. Thermodyn. 1, 267 (1969).347M. M. Popov and M. I. Ivanov, Sov. At. Energy 2, 360 (1957).348E. F.Westrum, Jr., Y. Takahashi, and F. Grønvold, J. Phys. Chem. 69, 3192
(1965).349F. Grønvold, N. J. Kveseth, A. Sveen, and J. Tichy, J. Chem. Thermodyn.
2, 665 (1970).350H. Inaba and K. Naito, J. Nucl. Mater. 49, 181 (1973).351K. Naito, T. Tsuji, and T. Matsui, J. Nucl. Mater. 48, 58 (1973).352A. C. MacLeod, J. Chem. Thermodyn. 4, 699 (1972).353D. W. Osborne, E. F. Westrum, Jr., and H. R. Lohr, J. Am. Chem. Soc. 79,
529 (1957).354H. E. Flotow, D. W. Osborne, and E. F. Westrum, Jr., J. Chem. Phys. 49,
2438 (1968).355K. Gotoo and K. Naito, J. Phys. Chem. Solids 26, 1673 (1965).356A. Burdese and F. Abbatista, Ric. Sci. 328, 1634 (1958).
J. Phys. Chem. Ref. Data, Vol. 43, No. 1, 2014rticle is copyrighted as indicated in the article. Reuse of AIP content is sub
78.131.95.159 On: Sun,
357C. Guéneau, N. Dupin, C. Martial, J. C. Dumas, S. Gossé, S. Chatain, B.Sundman, F. D. Bruycker, D. Manara, and R. Konings, J. Nucl. Mater. 419,145 (2011).
358F. D. Bruycker, K. Boboridis, R. Konings, M. Rini, R. Eloirdi, C. Guéneau,N. Dupin, and D. Manara, J. Nucl. Mater. 419, 186 (2011).
359R. J. Ackermann, Techical Report ANL-5482, Argonne National Labora-
tory (1955).360W. A. Lambertson and J. H. Handwerk, Technical Report (ANL-5053,
Argonne National Laboratory, 1956).361L. G. Wisnyi and S. Pijanowski, Technical Report KAPL-1702, 1957.362T. C. Ehlert and J. L. Margrave, J. Am. Ceram. Soc. 41, 330 (1958).363S. W. Pijanowski and L. S. DeLuca, Technical Report KAPL-1957, 1960.364T. D. Chikalla, Technical Report HW-69832, 1961.365W. L. Lyon and W. E. Bailey, Technical Report GEAP-64640, 1964.366H. Hausner, J. Nucl. Mater. 15, 179 (1965).367W. L. Lyon and W. E. Bailey, J. Nucl. Mater. 22, 332 (1967).368R. E. Latta and R. E. Fryxell, J. Nucl. Mater. 35, 195 (1970).369T. Tachibana, T. O. S. Yamanouchi, and T. Itaki, J. Nucl. Sci. Technol. 22,
155 (1985).370C. Ronchi and M. Sheindlin, Int. J. Thermophys. 23, 293 (2002).371D. Manara, C. Ronchi, and M. Sheindlin, High Temp.-High Press. 35/36,
25 (2003).372M. Kato, K. Morimoto, H. Sugata, K. Konashi, M. Kashimura, and T. Abe,
J. Nucl. Mater. 373, 237 (2008).373J. J. Hunzicker and E. F. Westrum, Jr., J. Chem. Thermodyn. 3, 61 (1971).374A. E. Ogard and J. A. Leary, in Proceedings of Thermodynamics of Nuclear
Materials, International Atomic Energy Agency, Vienna (IAEA, Vienna,
1967), p. 651.375D. R. Fredrickson and M. G. Chasanov, J. Chem. Thermodyn. 2, 623
(1970).376R. A. Hein and P. N. Flagella, Technical Report GEMP-578, 1968.377L. Leibowitz, L. W. Mishler, and M. G. Chasanov, J. Nucl. Mater. 29, 356
(1969).378Y. Takahashi and M. Asou, J. Nucl. Mater. 201, 108 (1993).379K. C. Mills, F. H. Ponsford, M. J. Richardson, N. Zaghini, and P. Fassina,
Thermochim. Acta 139, 107 (1989).380C. Ronchi, M. Shiendlin, M. Musella, and G. J. Hyland, J. Appl. Phys. 85,
776 (1999).381M. Amaya, K. Une, and K. Minato, J. Nucl. Mater. 294, 1 (2001).382H. Inaba, K. Naito, and M. Oguma, J. Nucl. Mater. 149, 341 (1987).383C. Afforit, High Temp.-High Press. 1, 27 (1969).384T. K. Engel, J. Nucl. Mater. 31, 211 (1969).385C. Afforit and J. Marcon, Rev. Int. Hautes Temp. Refract 7, 236
(1970).386J. P. Hiernaut, G. J. Hyland, and C. Ronchi, Int. J. Thermophys. 14, 259
(1993).387C. Ronchi, J. P. Hiernaut, R. Selfslag, and G. J. Hyland, Nucl. Sci. Eng.
113, 1 (1993).388J. B. Conway and R. A. Hein, J. Nucl. Mater. 15, 149 (1965).389R. A. Hein, L. A. Sjodahl, and R. Szwarc, J. Nucl. Mater. 25, 99 (1968).390L. Leibowitz, M. G. Chasanov, and L. W. Mishler, J. Nucl. Mater. 39, 115
(1971).391M. T. Hutchings, K. Clausen, M. H. Dicken, W. Hayes, J. K. Kjems, P. G.
Schnabel, and C. Smith, J. Phys. C 17, 3903 (1984).392M. T. Hutchings, J. Chem. Soc., Faraday Trans. 2 83, 1083 (1987).393K. Clausen, W. Hayes, J. E. Macdonald, and R. Osborn, Phys. Rev. Lett.
52, 1238 (1984).394C. Ronchi and H. Hyland, J. Alloys Compd. 213/214, 159 (1994).395V. P. Glushko, L. V. Gurvich, G. A. Bergman, I. V. Veyts, V. A.
Medvedev, G. A. Khachkuruzov, and V. S. Yungman Termodinamicheskie
Svoitsva Individual’nykh Veshchestv. Tom IV (Nauka, Moscow, 1982).396C. Ronchi, I. L. Iosilevski, and E. Yakub, Equation of State of Uranium
Dioxide (Springer-Verlag, Berlin, 2004).397G. K. Johnson and E. H. P. Cordfunke, J. Chem. Thermodyn. 13, 273
(1981).398K. Richter and C. Sari, J. Nucl. Mater. 148, 266 (1987).399L. Merli and J. Fuger, Radiochim. Acta 66/67, 109 (1994).400R. J. Lemire, Technical Report AECL-7817, 1984.401Y. I. Belyaev, V. N. Dobretsov, and V. A. Ustinov, Sov. Radiochem. 21,
386 (1979).402Y. I. Belyaev, N. L. Smirnov, and A. P. Taranov, Sov. Radiochem. 21, 590
(1979).
ject to the terms at: http://scitation.aip.org/termsconditions. Downloaded to IP:
27 Apr 2014 17:09:58

THERMODYNAMIC PROPERTIES OF LANTHANIDE AND ACTINIDE OXIDE COMPOUNDS 013101-93
This a
403T. D. Chikalla, C. E. McNeilly, J. L. Bates, and J. J. Rasmussen, Technical
Report BNWL-SA-3818, 1971.404R. Böhler, M. J. Welland, K. Boboridis, A. Janssen, R. Eloirdi, R. J. M.
Konings, and D. Manara, J. Appl. Phys. 111, 113501 (2012).405E. F. Westrum, Jr., J. B. Hatcher, and D. W. Osborne, J. Chem. Phys. 21,
419 (1953).406V. A. Arkhipov, E. A. Gutina, V. N. Dobretsov, and V. A. Ustinov, Sov.
Radiochem. 16, 123 (1974).407T. Nishi, A. Itoh, M. Takano, M. Numata, M. Akabori, Y. Arai, and K.
Minato, J. Nucl. Mater. 376, 78 (2008).408O. Beneš, P. Gotcu, F. Schwörer, R. J. M. Konings, and T. Fanghänel, J.
Chem. Thermodyn. 43, 651 (2011).409T. Yamashita, N. Nitani, T. Tsuji, and T. Kato, J. Nucl. Mater. 247, 90
(1997).410H. Serizawa, Y. Arai, and K. Nakajima, J. Chem. Thermodyn. 33, 615
(2001).411E. J. Huber, Jr. and C. Holley, Jr., J. Chem. Eng. Data 13, 545 (1968).412B. Riley, Sci. Ceram. 5, 83 (1970).413F. De Bruycker, K. Boboridis, D. Manara, P. Pöml, M. Rini, and R. J. M.
Konings, Mater. Today 13(11), 52 (2010).414F. D. Bruycker, K. Boboridis, P. Pöml, R. Eloirdi, R. Konings, and D.
Manara, J. Nucl. Mater. 416, 166 (2011).415L. E. Russel, in Proceedings of the 2nd International Conference on
Plutonium Metallurgy, Grenoble, France (Cleaver-Hume Press, London,
1961), p. 492.416M. D. Freshley and H. M. Mattys, Technical Report HW-76559, 1962.417E. A. Aitken and S. K. Evans, Technical Report USAEC GEAP-5672,
1968.418T. A. Sandenaw, J. Nucl. Mater. 10, 165 (1963).419O. L. Kruger and H. Savage, J. Chem. Phys. 49, 4540 (1968).420H. E. Flotow, D. W. Osborne, S. M. Fried, and J. G. Malm, J. Chem. Phys.
65, 1124 (1976).421A. E. Ogard, Plutonium 1970 and Other Actinides (Metallurgical Society
of the American Institute of Mining, New York, 1970), p. 78.422F. L. Oetting, J. Nucl. Mater. 105, 257 (1982).423J. K. Fink, Int. J. Thermophys. 3, 165 (1982).424M. M. Popov, F. A. Kostylev, and T. F. Karpova, Russ. J. Inorg. Chem. 2, 9
(1957).425C. E. Holley, R. N. R. Mulford, E. J. Huber, E. L. Head, and C. W.
Bjorklund, in Proceedings Second International Conference on Peaceful
Uses of Atomic Energy, Geneva (United Nations, Geneva, 1958), p. 215.426G. K. Johnson, E. H. V. Deventer, O. L. Kruger, and W. N. Hubbard, J.
Chem. Thermodyn. 1, 89 (1969).427T. D. Chikalla, C. E. McNeilly, and R. E. Skavdahl, J. Nucl. Mater. 12, 131
(1964).428H. E. Flotow and P. A. G. O’Hare, J. Chem. Phys. 74, 3046 (1981).429T. M. Besmann and T. E. Lindemer, J. Am. Ceram. Soc. 166, 782 (1983).430R. J. Lemire, J. Fuger, H. Nitsche, P. Potter, M. H. Rand, J. Rydberg, K.
Spahiu, J. C. Sullivan, W. Ullman, P. Vitorge et al., Chemical Thermo-
dynamics of Neptunium and Plutonium (Elsevier, Amsterdam, 2001).431T. L. Markin and M. H. Rand, Thermodynamics : proceedings of the
symposium on thermodynamics with emphasis on nuclear materials and
atomic transport in solids (International Atomic Energy Agency, Vienna,
1966), pp. 145–156.432P. Chereau, G. Dean, M. de Franco, and M. Gerdanian, J. Chem. Thermo-
dyn. 9, 211 (1977).433C. Guéneau, C. Chatillon, and B. Sundman, J. Nucl. Mater. 378, 257
(2008).434R. E. McHenry, Trans. Am. Nucl. Soc. 8, 75 (1965).435P. Gotcu-Freis, J. Y. Colle, C. Guéneau, N. Dupin, B. Sundman, and R. J.
M. Konings, J. Nucl. Mater. 414, 408 (2011).436E. F. Westrum, Jr. and F. Grønvold, in Proceedings of a Symposium on
Thermodynamics of Nuclear Materials. International Atomic Energy
Agency, Vienna (IAEA, Vienna, 1962), p. 3.437R. J. M. Konings, J. Nucl. Mater. 298, 255 (2001).438R. J. Ackermann, R. L. Faircloth, andM. H. Rand, J. Phys. Chem. 70, 3698
(1966).439T. Nishi, A. Itoh, K. Ichise, and Y. Arai, J. Nucl. Mater. 414, 109 (2011).440C. Thiriet and R. J. M. Konings, J. Nucl. Mater. 320, 292 (2003).441L. R. Morss and J. Fuger, J. Inorg. Nucl. Chem. 43, 2059 (1981).442J. C. Wallmann, J. Inorg. Nucl. Chem. 26, 2053 (1964).443T. D. Chikalla, C. E. McNeilly, J. L. Bates, and J. J. Rasmussen, Technical
Report BNWL-SA-3818, 1973.
rticle is copyrighted as indicated in the article. Reuse of AIP content is sub
78.131.95.159 On: Sun,
444T. D. Chikalla, C. E. McNeilly, J. L. Bates, and J. J. Rasmussen, in
Proceedings of International on Colloquium on High Temperature Phase
Transformations, CNRS Publ. No. 205 (CNRS, Paris, 1973), p. 351.445R. J. M. Konings, J. Nucl. Mater. 295, 57 (2001).446L. R. Morss and D. C. Sonnenberger, J. Nucl. Mater. 130, 266 (1985).447J. Fuger, J. C. Spirlet, and W. M€uller, Inorg. Nucl. Chem. Lett. 8, 709
(1972).448W. C. Mosley, J. Inorg. Nucl. Chem. 34, 539 (1972).449P. K. Smith, J. Inorg. Nucl. Chem. 31, 241 (1969).450R. D. Baybarz, J. Inorg. Nucl. Chem. 35, 4149 (1973).451L. R. Morss, J. Fuger, J. Goffart, and R. G. Haire, Inorg. Chem. 22, 1993
(1983).452J. R. Peterson and B. B. Cunningham, Inorg. Nucl. Chem. Lett. 3, 327
(1967).453R. D. Baybarz and M. L. Adair, J. Inorg. Nucl. Chem. 34, 3127 (1972).454L. R. Morss, J. Fuger, J. Goffart, N. Edelstein, and G. V. Shalimoff, J. Less-
Common Met. 127, 251 (1987).455J. Fuger, R. G. Haire, and J. R. Peterson, J. Less-Common Met. 98, 315
(1984).456A. Kovács (2012) (unpublished).457M. Kaufman, J. Muenter, and W. Klemperer, J. Chem. Phys. 47, 3365
(1967).458M. Zhou and L. Andrews, J. Chem. Phys. 111, 11044 (1999).459L. Andrews,M. Zhou, B. Liang, J. Li, and B. E. Bursten, J. Am. Chem. Soc.
122, 11440 (2000).460A. Kovács and R. J. M. Konings, J. Phys. Chem. A 115, 6646 (2011).461K. G. Dyall, Mol. Phys. 96, 511 (1999).462I. Infante, A. Kovács, G. La Macchia, A. R. M. Shahi, J. K. Gibson, and L.
Gagliardi, J. Phys. Chem. A 114, 6007 (2010).463W. R. Wadt, J. Am. Chem. Soc. 103, 6053 (1981).464K. Pierloot, E. van Besien, E. van Lenthe, and E. J. Baerends, J. Chem.
Phys. 126, 194311 (2007).465E. Shapiro, J. Am. Chem. Soc. 74, 5233 (1952).466M. Hoch and H. L. Johnston, J. Amer. Chem. Soc. 76, 4833 (1954).467A. J. Darnell and W. A. McCollum, Atomics International, Technical
Report NAA-SR-6498, 1961.468R. J. Ackermann, E. G. Rauh, R. J. Thorn, and M. C. Cannon, J. Phys.
Chem. 67, 762 (1963).469R. J. Ackermann and E. G. Rauh, High Temp. Sci. 5, 463 (1973).470D. L. Hildenbrand and E. Murad, J. Chem. Phys. 61, 1232 (1974).471R. J. Ackermann and E. G. Rauh, High Temp. Sci. 7, 304 (1975).472S. A. Shchukarev and G. A. Semenov, Issledovanya v Oblasti Khimii
Silikatov I Okislov (Nauka, Moscow, 1965), p. 208.473G. A. Semenov, Technical Report, Chemical Department of Leningrad
State University (1969).474G. Edvinsson and A. Lagerqvist, Phys. Scr. 30, 309 (1984).475G. Edvinsson and A. Lagerqvist, Phys. Scr. 32, 602 (1985).476G. Edvinsson and A. Lagerqvist, J. Mol. Spectrosc. 113, 93 (1985).477G. Edvinsson and A. Lagerqvist, J. Mol. Spectrosc. 122, 428 (1987).478G. Edvinsson and A. Lagerqvist, J. Mol. Spectrosc. 128, 117 (1988).479G. Edvinsson and A. Lagerqvist, Phys. Scr. 41, 316 (1990).480G. Edvinsson and J. Jonsson, Technical Report USIP-91-01, 1991; ETN-
91-99499, 1991.481C. T. Dewberry, K. C. Etchison, and S. A. Cooke, Phys. Chem. Chem.
Phys. 9, 4895 (2007).482M. J. Linevsky, U.S. Govt. Res. Develop. Rep. 40(3), 58 (1964).483G. P. Kushto and L. Andrews, J. Phys. Chem. A 103, 4836 (1999).484V. Goncharov and M. C. Heaven, J. Chem. Phys. 124, 064312 (2006).485S. H. Behere, T. Wentink, Jr., and B. B. Laud, Indiana J. Phys., B 58B(1),
15 (1984).486S. H. Behere, T. Wentink, Jr., and B. B. Laud, Indiana J. Phys., B 58B(1),
52 (1984).487J. Paulovic, T. Nakajima, K. Hirao, and L. Seijo, J. Chem. Phys. 117, 3597
(2002).488J. Paulovic, T. Nakajima, K. Hirao, R. Lindh, and P. Malmqvist, J. Chem.
Phys. 119, 798 (2003).489Y. Watanabe and O. Matsuoka, J. Chem. Phys. 107, 3738 (1997).490Y. Watanabe and O. Matsuoka, J. Chem. Phys. 109, 8182 (1998).491Y. Watanabe and O. Matsuoka, J. Chem. Phys. 116, 9585 (2002).492W. K€uchle, M. Dolg, H. Stoll, and H. Preuss, J. Chem. Phys. 100, 7535
(1994).493C. M. Marian, U. Wahlgren, O. Gropen, and P. Pyykko, THEOCHEM 169,
339 (1988).
J. Phys. Chem. Ref. Data, Vol. 43, No. 1, 2014ject to the terms at: http://scitation.aip.org/termsconditions. Downloaded to IP:
27 Apr 2014 17:09:58

013101-94 KONINGS ET AL.
This a
494L. Seijo, Z. Barandiarán, and E. Harguindey, J. Chem. Phys. 114, 118(2001).
495A. A. Buchachenko, J. Chem. Phys. 133, 041102 (2010).496A. Neubert and K. F. Zmbov, High Temp. Sci. 6, 303 (1974).497E. Murad and D. L. Hildenbrand, J. Chem. Phys. 63, 1133 (1975).498A. Kovács, P. Pogány, and R. J. M. Konings, Inorg. Chem. 51, 4841 (2012).499P. D. Kleinschmidt and J. W. Ward, J. Less-Common Met. 121, 61 (1986).500J. Marçalo and J. K. Gibson, J. Phys. Chem. A 113, 12599 (2009).501S. D. Gabelnick, G. T. Reedy, and M. G. Chasanov, J. Chem. Phys. 58,
4468 (1973).502D. W. Green, G. R. Reedy, and S. D. Gabelnick, J. Chem. Phys. 73, 4207
(1980).503R. D. Hunt and L. Andrews, J. Chem. Phys. 98, 3690 (1993).504P. Pyykkö, J. Li, and N. Runeberg, J. Phys. Chem. 98, 4809 (1994).505T. Privalov, B. Schimmelpfennig, U. Wahlgren, and I. Grenthe, J. Phys.
Chem. A 106, 11277 (2002).506M. Zhou, L. Andrews, N. Ismail, and C. Marsden, J. Phys. Chem. A 104,
5495 (2000).507R. J. Ackermann, R. J. Thorn, C. Alexander, and M. Tetenbaum, J. Phys.
Chem. 64, 350 (1960).508C. A. Alexander, Ph.D. thesis, Ohio State University, 1961.509S. R. Dharwadkar, S. N. Tripathi, M. D. Karkhanavala, and M. S.
Chandrasekharaiah, Thermodynamics of Nuclear Materials (International
Atomic Energy Agency, Vienna, 1975), Vol. II, pp. 455–465.510O. H. Krikorian, B. B. Ebbinghaus, M. G. Adamson, A. S. Fontes, Jr., and
D. L. Fleming, Technical Report UCRL-ID-114774, 1993.511C. A. Alexander, J. Nucl. Mater. 346, 312 (2005).512R. J. Ackermann and A. T. Chang, J. Chem. Thermodyn. 5, 873 (1973).513G. DeMaria, R. P. Burns, J. Drowart, and M. B. Inghram, J. Chem. Phys.
32, 1373 (1960).514J. Drowart, A. Pattoret, and S. Smoes, Proc. Br. Ceram. Soc. 8, 67 (1967).515A. Pattoret, J. Drowart, and S. Smoes, in Proceedings of a Symposium on
Thermodynamics of Nuclear Materials, Vienna, 1967 (International
Atomic Energy Agency, Vienna, 1968), pp. 635–636.516C. J. Lue, J. Jin, M. J. Ortiz, J. C. Rienstra-Kiracofe, and M. C. Heaven, J.
Am. Chem. Soc. 126, 1812 (2004).517D.Majumdar, K. Balasubramanian, and H. Nitsche, Chem. Phys. Lett. 361,
143 (2002).518I. Infante, Ph.D. thesis, Vrije Universiteit, Amsterdam, 2006.519T. Fleig, H. J. A. Jensen, J. Olsen, and L. Visscher, J. Chem. Phys. 124,
104106 (2006).520I. Infante, E. Eliav,M. J. Vilkas, Y. Ishikawa, U. Kaldor, and L. Visscher, J.
Chem. Phys. 127, 124308 (2007).521J. Li, B. E. Bursten, L. Andrews, and C. J. Marsden, J. Am. Chem. Soc. 126,
3424 (2004).522I. Infante, L. Andrews, X.Wang, and L. Gagliardi, Chem.-Eur. J. 16, 12804
(2010).523J. D. Han, V. Goncharov, L. A. Kaledin, A. Komissarov, andM. C. Heaven,
J. Chem. Phys. 120, 5155 (2004).524L. Gagliardi, M. C. Heaven, J. W. Krogh, and B. O. Roos, J. Am. Chem.
Soc. 127, 86 (2005).525N. M. Voronov, A. S. Danilin, and I. T. Kovalev, in Proceedings of the
International Symposium on Thermodynamics of Nuclear Materials,
Vienna, Austria, 21–25 May 1962 (International Atomic Energy Agency,
Vienna, Austria, 1963), pp. 789–800.526R. J. Ackermann and M. Tetenbaum, High Temp. Sci. 13, 91 (1980).527R. Ohse, J. Babelot, C. Cercignani, J. Hiernaut, M. Hoch, G. J. Hyland, and
J. Magill, J. Nucl. Mater. 130, 165 (1985).528W. Breitung and O. Reil, Nucl. Sci. Eng. 101, 26 (1989).529R. Pflieger, J. Y. Colle, I. Iosilevskiy, andM. Sheindlin, J. Appl. Phys. 109,
033501 (2011).530J. K. Fink, J. Nucl. Mater. 279, 1 (2000).531R. J.Ackermann, P.W.Gilles, andR. J. Thorn, J.Chem.Phys.25, 1089 (1956).532V. E. Ivanov, A. A. Kruglykh, V. S. Pavlov, G. P. Kovtun, and V. M.
Amonenko, in Proceedings of the International Symposium on Thermo-
dynamics of Nuclear Materials, Austria, 21–25 May 1962 (International
Atomic Energy Agency, Vienna, Austria, 1963), pp. 735–746.533R. W. Ohse, J. Chem. Phys. 44, 1375 (1966).534Y. A. Gorban’, L. V. Pavlinov, and V. N. Bykov, Atomnaya Energiya 22,
465 (1967).535M. Tetenbaum and P. D. Hunt, J. Nucl. Mater. 34, 86 (1970).536G. T. Reedy and M. G. Chasanov, J. Nucl. Mater. 42, 341 (1972).
J. Phys. Chem. Ref. Data, Vol. 43, No. 1, 2014rticle is copyrighted as indicated in the article. Reuse of AIP content is sub
78.131.95.159 On: Sun,
537L. A. Kaledin, E. A. Shenyavskaya, and L. V. Gurvich, Zh. Fiz. Khim. 60,1049 (1986).
538M. C. Heaven, J. P. Nicolai, S. J. Riley, and E. K. Parks, Chem. Phys. Lett.
119, 229 (1985).539L. A. Kaledin, A. N. Kulikov, A. I. Kobyliansky, E. A. Shenyavskaya, and
L. V. Gurvich, Zh. Fiz. Khim. 61, 1374 (1987).540L. V. Gurvich, Y. N. Dmitriev, L. A. Kaledin, A. Kobylyanskii, A. N.
Kulikov, and E. A. Shenyavskaya, Izv. Akad. Nauk SSSR, Ser. Fiz. 53,1731 (1989).
541L. A. Kaledin and M. C. Heaven, J. Mol. Spectrosc. 185, 1 (1997).542D. H. W. Carstens, D. M. Gruen, and J. P. Kozlowski, High Temp. Sci. 4,
436 (1972).543S. Abramowitz and N. J. Acquista, J. Res. Natl. Bur. Stand. 78A, 421
(1974).544M. J. Krauss and W. J. Stevens, Chem. Phys. Lett. 99, 417 (1983).545J. Paulovič, L. Gagliardi, J. M. Dyke, and K. Hirao, J. Chem. Phys. 122,
144317 (2005).546L. A. Kaledin and A. N. Kulikov, Zh. Fiz. Khim. 63, 1697 (1989).547L. A. Kaledin, A. N. Kulikov, and L. V. Gurvich, Zh. Fiz. Khim. 63, 801
(1989).548R. J. Ackermann, M. Kojima, E. G. Rauh, and R. R. Walters, J. Chem.
Thermodyn. 1, 527 (1969).549R. P. Steiger and D. E. Cater, High Temp. Sci 7, 288 (1975).550M. S. Liao, T. Kar, and S. Scheiner, J. Phys. Chem. A 108, 3056
(2004).551M. P. Lahalle, J. C. Krupa, R. Guillaumont, and C. Rizzoli, J. Less-
Common Met. 122, 65 (1986).552S. Kern, J. Morris, C. K. Loong, G. L. Goodman, G. H. Lange, and B. Cort,
J. Appl. Phys. 63, 3598 (1988).553J. M. Fournier, A. Blaise, G. Amoretti, R. Caciuffo, J. Larroque, M. T.
Hutchings, R. Osborn, and A. D. Taylor, Phys. Rev. B 43, 1142
(1991).554W. T. Carnall, G. K. Liu, C. W. Williams, and M. F. Reid, J. Chem. Phys.
95, 7194 (1991).555P. Gotcu-Freis, J. P. Hiernaut, J. Y. Colle, and R. J. M. Konings, J. Chem.
Thermodyn. 43, 492 (2011).556W. Bartscher and C. Sari, J. Nucl. Mater. 140, 91 (1986).557R. J. Ackermann, R. L. Faircloth, E. G. Rauh, and R. J. Thorn, J. Inorg.
Nucl. Chem. 28, 111 (1966).558R. J. Ackermann and E. G. Rauh, J. Chem. Phys. 62, 108 (1975).559T. Gao, Z.-H. Zhu, X.-L. Wang, Y. Sun, and D.-Q. Meng, Acta Chim. Sin.
62, 454 (2004).560A. V. Zaitsevskii, A. V. Titovb, S. S. Malkovc, I. G. Tananaev, and Y. M.
Kiseleve, Dokl. Chem. 448, 1 (2013).561I. Infante, A. S. P. Gomes, and L. Visscher, J. Chem. Phys. 125, 073401
(2006).562O. H. Krikorian, A. S. Fontes, Jr., B. B. Ebbinghaus, andM. G. Adamson, J.
Nucl. Mater. 247, 161 (1997).563C. Ronchi, F. Capone, J. Y. Colle, and J. P. Hiernaut, J. Nucl. Mater. 280,
111 (2000).564D. W. Green and G. T. Reedy, J. Chem. Phys. 69, 544 (1978).565E. F. Archibong and A. K. Ray, J. Mol. Struct. (THEOCHEM) 530, 165
(2000).566T. E. Phipps, G. W. Sears, and O. C. Simpson, J. Chem. Phys. 18, 724
(1950).567R. N. R.Mulford and L. E. Lamar, in Plutonium, edited by E. Grisoti,W. B.
H. Lord, and R. D. Fowlereds (Cleaver-Hume Press, Ltd., London, 1961),
pp. 411–421.568W. M. Pardue and D. L. Keller, J. Am. Ceram. Soc. 47, 610 (1964).569D. R. Messier, J. Am. Ceram. Soc. 751, 710 (1968).570J. E. Battles, W. A. Shinn, and J. W. Reihus, Technical Report ANL 7575,
1969.571P. Gotcu-Freis, J. Y. Colle, J. P. Hiernaut, F. Naisse, C. Guéneau, and R. J.
M. Konings, J. Chem. Thermodyn. 43, 1164 (2011).572T. Gao, H.-Y. Wang, Y.-G. Yi, M.-L. Tan, Z.-H. Zhu, Y. Sun, X.-L. Wang,
and Y.-B. Fu, Acta Phys. Sin. 48, 2222 (1999).573Q. Li and C. Xu, J. Sichuan Normal Univ. (Nat. Sci) 23, 386
(2000).574R. W. Ohse, Tech. Rep. Progress Report No. 5 (Institute for Transuranium
Elements, 1968).575A. Kovács, R. J. M. Konings, J. Raab, and L. Gagliardi, Phys. Chem. Chem.
Phys. 10, 1114 (2008).
ject to the terms at: http://scitation.aip.org/termsconditions. Downloaded to IP:
27 Apr 2014 17:09:58

THERMODYNAMIC PROPERTIES OF LANTHANIDE AND ACTINIDE OXIDE COMPOUNDS 013101-95
This a
576P. Gotcu-Freis, J. P. Hiernaut, J. Y. Colle, and R. J. M. Konings, J. Nucl.
Mater. 409, 194 (2011).577R. G. Haire, J. Alloys Compd. 213/214, 185 (1994).578M. Santos, J. Marcalo, J. P. Leal, A. P. de Matos, J. Gibson, and R. G.
Haire, Int. J. Mass Spectrom. 228, 457 (2003).579P. K. Smith and D. E. Peterson, J. Chem. Phys. 52, 4963 (1970).580J. P. Hiernaut and C. Ronchi, J. Nucl. Mater. 334, 133 (2004).581X. Y. Cao and M. Dolg, THEOCHEM 673, 203 (2004).582R. G. Haire and L. Eyring, Handbook on the Physics and Chemistry of
Rare Earths (North-Holland, Amsterdam, 1994), Vol. 18, Chap. 125,
pp. 413–505.583C. E. Holley, Jr., E. J. Huber, Jr., and F. B. Baker, Progress in the Science
and Technology of the Rare Earths (Pergamon, Oxford, 1968), Vol. 3,
pp. 343–433.584M. Zinkevich, Prog. Mater. Sci. 52, 597 (2007).
rticle is copyrighted as indicated in the article. Reuse of AIP content is sub
78.131.95.159 On: Sun,
585I. Grenthe, J. Fuger, R. J. M. Konings, R. J. Lemire, A. B. Muller, C.
Nguyen-Trung, and H. Wanner, Chemical Thermodynamics of Uranium
(Elsevier, Amsterdam, 1992).586R. J. Silva, G. Bidoglio, M. H. Rand, P. B. Robouch, H. Wanner, and I.
Puigdomenech, Chemical Thermodynamics of Americium (Elsevier,
Amsterdam, 1995).587M. Rand, J. Fuger, I. Grenthe, V. Neck, and D. Rai, Chemical Thermo-
dynamics of Thorium (OECD Publishing, Paris, 2009).588E. H. P. Cordfunke, R. J. M. Konings, and E. F. Westrum, Jr., J. Nucl.
Mater. 167, 205 (1989).589B. Averkiev, M. Mantina, R. Valero, I. Infante, A. Kovács, D. G. Truhlar,
and L. Gagliardi, Theor. Chem. Acc. 129, 657 (2011).590R. J. M. Konings and O. Beneš, J. Phys. Chem. Ref. Data 39, 043102
(2010).591P. Pyykkö, S. Riedel, and M. Patzschke, Chem.-Eur. J. 11, 3511 (2005).
J. Phys. Chem. Ref. Data, Vol. 43, No. 1, 2014ject to the terms at: http://scitation.aip.org/termsconditions. Downloaded to IP:
27 Apr 2014 17:09:58
Recommended