THE ROLE OF DEL1 IN CHONDROCYTE EXPANSION AND
MECHANOTRANSDUCTION – AN INVESTIGATIVE STUDY.
ALA QUSOUS
A thesis submitted in partial fulfilment of he requirements of the University of Westminster
for the degree of Doctor of Philosophy
September 2009
Statement of Originality
The accompanying thesis submitted for the degree of Doctor of
Philosophy is entitled “The role of DEL1 in chondrocyte expansion and
mechanotransduction – an investigative study”. This thesis is based
on the work conducted by the author in the Department of Human
Health Sciences, University of Westminster during the period
between September 2005 and September 2009. All the work
recorded in this thesis is original unless otherwise acknowledged in
the text or by references.
This work has not been submitted for another degree in this or any
other University.

i
Table of Contents Table of Figures .............................................................................................iv List of Tables.................................................................................................vii Abbreviations: .............................................................................................. viii Acknowledgements ........................................................................................xi Dedications ...................................................................................................xii Abstract ........................................................................................................ xiii 1 Introduction ............................................................................................... 1
1.1 Cartilage and Chondrocytes ............................................................. 2 1.1.1 Structure of Cartilage ..................................................................... 2 1.1.2 Chondrocytes and chondrocytic phenotype ................................... 6
1.2 Osteoarthritis .................................................................................. 12 1.3 In vitro Expansion of chondrocytes ................................................. 14 1.4 Mechanotransduction and Calcium Homeostasis ........................... 18 1.5 Volume Regulation and 2D Expansion ........................................... 20 1.6 Actin Cytoskeletal Organisation ...................................................... 23 1.7 DEL1 and Integrin Signalling .......................................................... 26 1.7.1 Integrin Signalling....................................................................... 27 1.7.2 Developmental Endothelial Locus 1 (DEL1) ............................... 28
1.8 Aims................................................................................................ 30 2 Materials and methods............................................................................ 31
2.1 Materials ......................................................................................... 32 2.1.1 Tissue Culture ............................................................................ 32 2.1.2 Molecular Biology ....................................................................... 33 2.1.3 Actin Cytoskeleton studies ......................................................... 34 2.1.4 Antibodies used in protein identification experiments................. 34 2.1.5 Fluorophores .............................................................................. 35 2.1.6 Pharmacological and inhibitory reagents.................................... 36
2.2 Culture Media and Experimental Salines ........................................ 37 2.3 Chondrocyte isolation and culture................................................... 38 2.4 Expression Profiling of Expanded Chondrocytes ............................ 40 2.4.1 RNA extraction, Reverse transcription and Polymerase Chain Reaction (PCR) ..................................................................................... 40 2.4.2 Gel Densitometery Optimisation................................................. 44 2.4.3 GAPD suitability as an internal PCR positive control.................. 44
2.5 Confocal Microscopy....................................................................... 48 2.6 siRNA design .................................................................................. 50 2.7 siRNA and transfection ................................................................... 55 2.7.1 Optimisation of MTT viability assay ............................................ 55 2.7.2 Transfection and transfection efficiency quantification ............... 57 2.7.3 Uptake and localisation of siRNA ............................................... 62
2.8 Actin organisation ........................................................................... 64 2.9 Volume, cellular dimensions and Sphericity of chondrocytes ......... 68 2.9.1 Optimisation of Imaris Isosurface Feature using beads.............. 68
ii
2.9.2 Chondrocyte Cell Dimesion and Volume Acquisition.................. 70 2.9.3 RVI experiments......................................................................... 72
2.10 Calcium imaging............................................................................ 73 2.11 Chondrocyte Attachment Assay.................................................... 77 2.12 Cellular protein isolation and analysis ........................................... 78 2.12.1 Intracellular cell signal proteins.................................................. 78 2.12.2 Extracellular DEL1 protein isolation........................................... 78 2.12.3 SDS-PAGE................................................................................ 79 2.12.4 Western Blot .............................................................................. 80
2.12 Statistical Analysis ........................................................................ 82 3 Experimental Chapter: The influence of chondrocyte expansion on phenotype, morphology and dedifferentiation. ............................................. 83
3.1 Chapter introduction........................................................................ 84 Aims of Experimental Chapter............................................................... 86
3.2 Results............................................................................................ 88 3.2.1 Expansion and Growth Rates..................................................... 88 3.2.2 Morphology, shape and volume of freshly isolated and expanded chondrocytes......................................................................................... 93 3.2.3 Phenotype and expression profiling of cultured chondrocytes.... 99 3.2.4 The regulation of actin cytoskeletal organisation upon 2D culture102
3.3 Chapter Discussion....................................................................... 107 4 Experimental Chapter: The mechanotransduction properties of 2D cultured chondrocytes.............................................................................................. 113
4.1 Chapter Introduction ..................................................................... 114 4.1.1 RVI ........................................................................................... 114 4.1.2 Calcium Signalling.................................................................... 115 Aims of Experimental Chapter............................................................. 116
4.2 Results.......................................................................................... 117 4.2.1 Regulatory volume increase (RVI) in freshly isolated and 2D expanded chondrocytes ...................................................................... 117 4.2.2 Calcium mechanotransduction and Homeostasis..................... 122
4.3 Chapter Discussion....................................................................... 133 5 Experimental Chapter: The role of DEL1 in 2D chondrocytes expansion140
5.1 Chapter introduction...................................................................... 141 Aims of Experimental Chapter............................................................. 143
5.2 Results.......................................................................................... 144 5.2.1 The expression level of DEL1 in response to 2D culture of chondrocytes....................................................................................... 144 5.2.2 DEL1 knockdown using RNAi technology ................................ 149 5.2.3 The role of DEL1 knockdown on chondrocytic phenotype, morphology and mechanotransduction ............................................... 152
5.3 Chapter Discussion....................................................................... 170 6 Experimental Chapter: The molecular signalling pathway of DEL1 in chondrocytes.............................................................................................. 175
6.1 Chapter Introduction ..................................................................... 176 Aims of Experimental Chapter............................................................. 178
6.2 Results.......................................................................................... 179
iii
6.2.1 The role of DEL1 on Akt activation signalling ........................... 179 6.2.2 The expression and role of Twist in 2D expansion of chondrocytes 183 6.2.3 The dependency of Twist expression on DEL1 level in 2D culture of chondrocytes....................................................................................... 185 6.2.4 The feedback effect of Twist and SOX9 on DEL1 expression .. 189
6.3 Chapter Discussion....................................................................... 199 7 Discussion, Conclusion and Future Work ............................................. 203
7.1 Quantification of changes in phenotypic markers in response to 2D culture ................................................................................................... 204 7.2 The role of DEL1 in the regulation of chondrocyte phenotype ...... 207 7.3 Summary and concluding remarks................................................ 209
8 References and bibliography ................................................................ 214

iv
Table of Figures
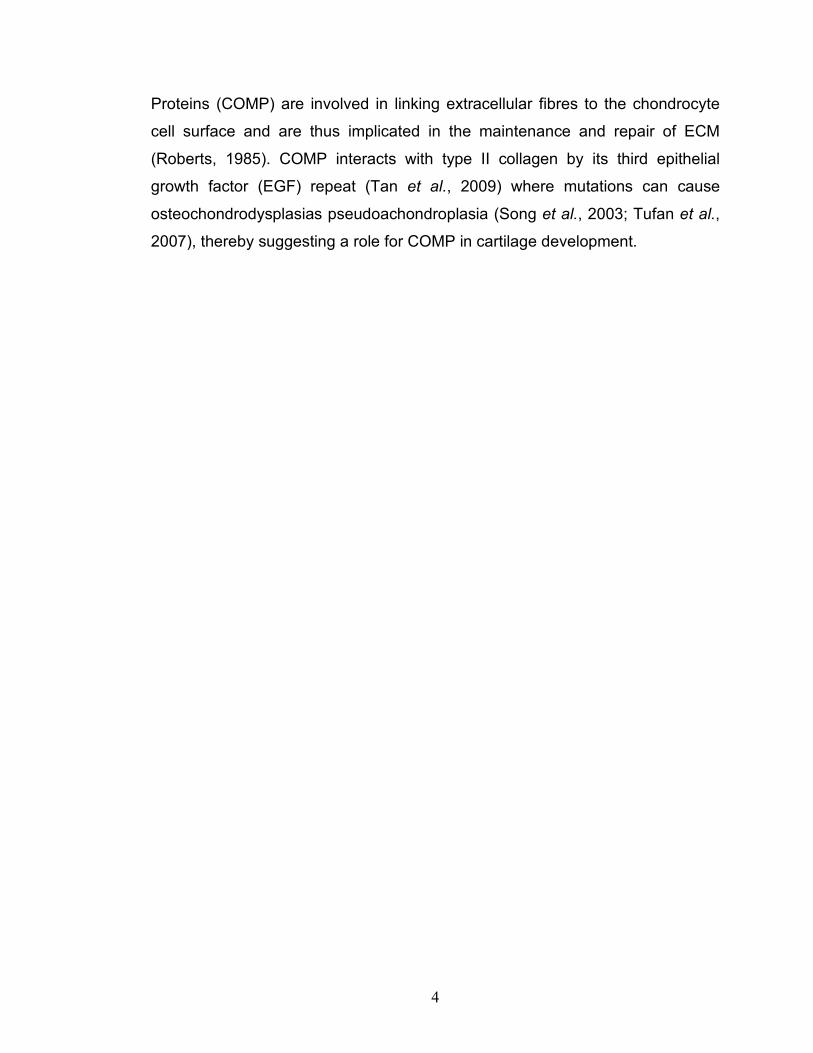
Figure 1.1: Schematic diagram of the structure of the extracellular matrix (ECM)...................................................................................................................... 5
Figure 1.2: Representative image of bovine articular cartilage............................ 9 Figure 1.3: Morphology of freshly isolated and 2D-cultured chondrocytes ........ 17 Figure 1.4: Representative Diagram of transporters involved in RVI................. 22 Figure 1.5: Actin organisation of freshly isolated and 2D-cultured chondrocytes
................................................................................................................... 25 Figure 2.1: The linear relationship between the band intensity and size vs. the
amount of DNA present.............................................................................. 45 Figure 2.2: The level of expression of Glyceraldehyde 3-phosphate
dehydrogenase (GAPD) during culture ...................................................... 46 Figure 2.3: A representative image of an ethidium bromide-stained DNA gel ... 47 Figure 2.4: The natural anti-viral mechanism that led to the discovery of RNAi.51 Figure 2.5: Linear relationship between the absorbance of reduced MTT crystals
and the total cell number. ........................................................................... 56 Figure 2.6: Transfection efficiency of freshly isolated chondrocytes (P0).......... 59 Figure 2.7: Transfection efficiency monolayer expanded chondrocytes after 9
days in culture (P1) .................................................................................... 60 Figure 2.8: Transfection efficiency monolayer expanded chondrocytes after 14
days in culture (P2). ................................................................................... 61 Figure 2.9: Confocal Z-stack series of images of chondrocytes after 48 hours of
transfection with 10nM FAM-labelled negative control siRNA (green) and 3µl/ml of HiPerfect...................................................................................... 63
Figure 2.10 Representative diagram of fluorescence of actin-phalloidin-alexa 488 complexes across standardised cellular dimensions........................... 66
Figure 2.11: Representative mean fluorescence of phalloidin-alexa 488 across standardised cell diameter 2D cultured chondrocytes................................ 67
Figure 2.12: Apparent volume of beads analysed using Imaris 6.3.1 using 10-90% threshold. ........................................................................................... 69
Figure 2.13: Illustrative diagram of isosurface objects created using Imaris (Bitplane) at 10% and 60% threshold......................................................... 71
Figure 2.14: The effects of fluid flow on calcium signalling................................ 75 Figure 2.15: Effects of Ionomycin and negative control DMSO solution on [Ca2+]i
in freshly isolated chondrocytes. ................................................................ 76 Figure 3.1: Growth curve of bovine articular chondrocyte upon in vitro culture. 90 Figure 3.2: Viability assay in response to in vitro 2D culture. ............................ 91 Figure 3.3: Morphology of freshly isolated and 2D cultured chondrocytes as
seen under confocal microscopy................................................................ 96
v
Figure 3.4: Cellular dimensions and sphericity of chondrocytes as quantified using Imaris Isosurface Surpass utility. ...................................................... 97
Figure 3.5 The expression profiling of chondrocytes before and throughout culture ...................................................................................................... 101
Figure 3.6: Actin organisation in freshly isolated and 2D cultured chondrocytes as seen with confocal microscopy............................................................ 103
Figure 3.7: The number of actin striation units across the cell cytoplasm of freshly isolated and 2D cultured chondrocytes,........................................ 104
Figure 3.8: Percentage of cortical and filamentous actin structures in freshly isolated and 2D cultured chondrocytes. ................................................... 106
Figure 3.9: Model of the significant changes (p<0.05) in phenotypic markers in response to 2D culture. ............................................................................ 112
Figure 4.1: The capacity of freshly isolated and 2D expanded chondrocytes to exhibit RVI in response to hyperosmotic conditions. ................................ 118
Figure 4.2: Box plot of 2D expanded chondrocytes against percentage volume recovery at time 20 minutes. .................................................................... 120
Figure 4.3: The effect of REV5901 loading on freshly isolated and 2D cultured chondrocytes............................................................................................ 123
Figure 4.4: Effect of extracellular calcium removal on REV5901-induced calcium rise in freshly isolated and 2D cultured chondrocytes. ............................. 125
Figure 4.5: [Ca2+]i rise inhibition profiling in freshly isolated and 2D cultured chondrocytes............................................................................................ 128
Figure 4.6: Changes in [Ca2+]I in response to REV5901 loading in the presence of pharmacological inhibitors to G-protein downstream elements. ........... 130
Figure 4.7: Representative diagram of currently known intracellular calcium signalling pathways. ................................................................................. 139
Figure 5.1: Changes in the expression of DEL1 in chondrocytes upon 2D culture. ..................................................................................................... 146
Figure 5.2: Changes in DEL1 and collagen expression ratio within the first 9 days of 2D culture. ................................................................................... 147
Figure 5.3: Western blot image of chondrocyte supernatant assayed for DEL1 protein. ..................................................................................................... 148
Figure 5.4: The transience inhibition effect of anti-DEL1 siRNA transfection on DEL1 mRNA levels. ................................................................................. 150
Figure 5.5: Percentage attachment of freshly isolated and 2D cultured chondrocytes............................................................................................ 155
Figure 5.6: Percentage attachment of chondrocytes against time in control and Del(-)/P1 chondrocytes. ........................................................................... 156
Figure 5.7: Changes in chondrocyte morphology and cellular dimension in response to long-term DEL1 knockdown. ................................................ 160
Figure 5.8: Changes in chondrocyte expression battery in response to DEL1 knockdown. .............................................................................................. 162
Figure 5.9: Actin organisation upon DEL1 knockdown.................................... 164 Figure 5.10: RVI in DEL1(-)/P1 chondrocytes in response to hyperosmotic
challenge.................................................................................................. 166 Figure 5.11: Contribution of store-mediated calcium release to REV5901-
induced calcium rise................................................................................. 168
vi
Figure 5.12: The sensitivity of DEL1(-) chondrocytes to calcium channel inhibitors................................................................................................... 169
Figure 6.1: Changes in Akt phosphorylation and activity upon 2D culture....... 180 Figure 6.2: The effect of DEL1 knockdown on the phosphorylation and activity of
Akt............................................................................................................ 182 Figure 6.3: The level of Twist expression in freshly isolated and 2D cultured
chondrocytes............................................................................................ 184 Figure 6.4: The effect of DEL1 knockdown on the expression of Twist in P1
chondrocytes............................................................................................ 186 Figure 6.5: The effect of pharmacological inhibition of β-catenin on Twist
expression................................................................................................ 188 Figure 6.6: The effect of BMP2 treatment on the expression of SOX9, Twist and
DEL1. ....................................................................................................... 191 Figure 6.7: Changes in the expression of collagen molecules in response to
BMP2 treatment in P3 chondrocytes........................................................ 192 Figure 6.8: Twist expression upon knockdown using anti-Twist siRNA........... 194 Figure 6.9: Changes in Expression of collagens in P3 chondrocytes in response
to Twist knockdown using anti-Twist siRNA. ............................................ 197 Figure 6.10: The effect of Twist knockdown on the expression of DEL1 and
SOX9. ...................................................................................................... 198 Figure 6.11: The proposed pathway of action of DEL1. .................................. 202 Figure 7.1: New Analysis tool for the study of filamentous actin organisation. 213
vii
List of Tables
Table 1.1: Summary of the properties of the zones of mature articular cartilage.................................................................................................................... 10
Table 1.2: The effect of various stimuli on the regulation of ECM in chondrocytes.............................................................................................. 11
Table 1.3: Summary of chondrocytic phenotypes in relation to the types of collagen synthesised.................................................................................. 16
Table 2.1: Tissue culture reagents. ................................................................... 32 Table 2.2: Reagents used in molecular biology studies. ................................... 33 Table 2.3: Reagents used to study the actin cytoskeleton. ............................... 34 Table 2.4: Reagents used to study the actin cytoskeleton. ............................... 34 Table 2.5 Fluorophores used. ........................................................................... 35 Table 2.6: Pharmacological agents used in calcium signalling determination. .. 36 Table 2.7: Sequences of PCR primer pairs ....................................................... 42 Table 2.8: Steps involved in Polymerase Chain Reaction (PCR) amplification. 43 Table 2.9: Fluorophores used in confocal microscopy for imaging and cell
volume calculation...................................................................................... 49 Table 2.10: Criteria of the rational siRNA design............................................... 53 Table 2.11: Sequences of siRNA sequences used in knockdown experiments.54 Table 3.1: Range of seeding densities used in the literature for in vitro expansion
of chondrocytes.......................................................................................... 87 Table 3.2: Summary of culture properties of chondrocytes cultured at literature-
based seeding densities............................................................................. 92 Table 3.3: Cell volume changes in freshly isolated and 2D cultured chondrocytes
as acquired by Imaris and calculated mathematically. ............................... 98 Table 4.1: Volume regulatory properties of freshly isolated and 2D cultured
chondrocytes............................................................................................ 121 Table 4.2: Impact of loading of various solutions on [Ca2+]i levels................... 132 Table 5.1: Growth rate properties of P1 and DEL1(-)/P1 chondrocytes. ......... 151 Table 5.2: Summary of attachment properties of freshly isolated and 2D cultured
chondrocytes............................................................................................ 157 Table 5.3: Summary of changes observed upon DEL1 knockdown and possible
mode of action.......................................................................................... 174 Table 7.1: Summary of the properties of differentiated, mesodifferentiated and
dedifferentiated chondrocytes as defined using key markers of phenotype.................................................................................................................. 212
viii
Abbreviations:
[Ca2+]i: intracellular calcium
[Na+]e: Extracellular sodium 2D: Two-Dimensional
3D: Three-Dimensional
Akt: v-Akt murine thymoma viral oncogene homolog 1
AM: Acetyloxymethyl BMP-6: Bone Morphogenetic Protein – 6
bp: base pair
BPS: Basic Physiological Saline
CD: Cluster of differentiation
cDNA: complementary Deoxyribonucleic Acid
CLSM: Confocal Laser Scanning Microscope
col1:col2: Ratio of collagen I to collagen II
DAG: Diacylglycerol
DEL1: Developmental Endothelial Locus 1
DEPC: Diethylpyrocarbonate DMEM: Dulbecco’s Modified Eagle Medium
DMSO: Dimethyl Sulphoxide
dNTP: deoxyribonucleotides
ds: double stranded
dsRNA: Double stranded Ribonucleic Acid
DZ: Deep Zone
ECM: Extracellular Matrix
EDIL: EGF-like repeats and discoidin I-like domains
EDTA: ethylenediaminetetraacetic acid
EGF: Endothelial Growth Factor
EGTA: ethylene glycol tetraacetic acid
NCX: Epithelial Sodium Channel
FAM: 5’-carboxyfluorescein
ix
FCS: Foetal Calf Serum
FnR: Fibronectin Receptor
GAG: Glycosaminoglycan
GAPD: Glyceraldehyde 3-phosphate dehydrogenase
GC: Guanine-Cytosine
GPCR: G-protein Coupled Receptor
HD: High Density
(I-IB).A: Difference between Intensity and Background multiplied by Area IP3: Inositol triphosphate
LB: Latrunculin B
LD: Low Density
MD: Intermediate Density
mOsm: Milliosmole/Kg H2O
MACI: Matrix-induced autologous chondrocyte implantation
mRNA: messenger Ribonucleic Acid
MSC: Mesenchymal Stem Cells
MTT: 3-(4,5-Dimethylthiazol-2-yl)-2,5-diphenyltetrazolium bromide
MZ: Mid Zone
NCBI: National Centre for Biotechnology Information
NHE: Na+/H+ antiporter
NKCC1: Sodium/potassium/chloride transporter member 1
nt: nucleotide
OA: Osteoarthritis
P/S: Penicillin Streptomycin Solution
PBS: Phosphate Buffer Saline
PCR: Polymerase Chain Reaction
PGs: Proteoglycans
PCR: Polymerase Chain Reaction
PI5K: Phosphatidylinositol 5-kinase
PIP2: Phosphatidylinositol (4,5)-biphosphate
PIP3: Phosphatidylinositol (3,4,5)-triphosphate
x
PKC: Protein Kinase C
PLCβ3: Phosspholipase C Beta 3
REV5901: Alpha-pentyl-3-(2-quinolinylmethoxy)-benzene-methanol
RGD: Arginine-Glycine-Aspartic acid
RISC: RNA-induced Silencing Complex
RNAi: Ribonucleic Acid Interference
RNase A: Ribonuclease A
RT-: Reverse Transcriptase
RVD: Regulatory Volume Decrease
RVI: Regulatory Volume Increase
SACC: Stretch-activated Cation Channel
SDS: sodium dodecyl sulphate
siRNA: Small Interfering Ribonucleic Acid
SLC12A2: Solute Carrier Family 12 Member 2, (NKCC1)
SLC16A3: Monocarboxylic acid transporter member 3
SOX9: Sex determining region Y-box 9
StU: Striation Unit
SZ: Superficial Zone
t½: Half the time required for chondrocytes to recover 100% volume
TBE: Tris-Borate-EDTA
TBS: Tris-Buffered Saline
TBS/T: Tris-Buffered Saline containing Tween
TE: Tris-EDTA
TGF-β: Transforming Growth Factor Beta
Tm: Mid temperature
U73122: 1-[6-[[(17β)-3-methoxyestra-1,3,5(10)-trien-17-yl]amino]hexyl]-1H-
pyrrole-2,5-dione
VSAC: Volume-sensitive anion channel

xi
Acknowledgements
I would like to acknowledge my director of studies Dr Mark J P Kerrigan for his
exceptional support and assistance in what must have been the longest five
years of his academic career. Thank You, Dr Kerrigan and sorry about the
drama. My eternal gratitude goes out to Mr Andrew Stanton for his financial and
moral support.
Special thanks to Prof Tajalli Keshavarz who welcomed me with open arms first
as a MSc postgraduate, later as a PhD student and most recently as my
supervisor. My lifelong gratitude goes to the Cavendish Campus and the School
of Biosciences for having awarded me a fee waiver to pursue my career. Many
thanks to Prof Simon Jarvis, Prof Frank Hucklebridge, Prof Jane Lewis, Dr
Sanjiv Rughooputh, Dr Pamela Greenwell, Ms Jennifer Mackenzie, Ms Vanita
Amin and all the members of staff at the School of Life Sciences.
I would like to acknowledge all my friends and colleagues at the University of
Westminster over the years both in Osteoarthritis Research Laboratory and
otherwise. In chronological order to name but a few, Mr Headley Williams and
Mrs Anna Wingate (my first friend in the UK), Mrs Corinne Geewan who
shadowed me in my early months, Mrs Claire Cove for the ‘bestest’ lunches and
tea breaks, Ms Hanna Everitt, Ellie Parker, Yanitsa Nedelcheva and Magdalena
Kaneva.
Finally special thanks to my dear friends: Marcel Thanassack, Scavo Parker,
Nicky Fernandez Reiss, Auntie Sofie, Faisal Atmeh, Azza Shoaibi, Hazem
Jabaji, Bonnie Bell, Russell McLean, Melinda Molnar, Nertila Beshi, Regan
Andrew, Ewelina Skowronek and every at T&G Covent Garden and Ku Bar for
the best fun!

xii
Dedications
I would like to dedicate this thesis to my dear Mother, my best friend, the
greatest mother and the strongest woman in the world.
I also dedicate this work to Dr Noor Qusous and The Badra’s.
In living memory of Stephen Robert Parker.
xiii
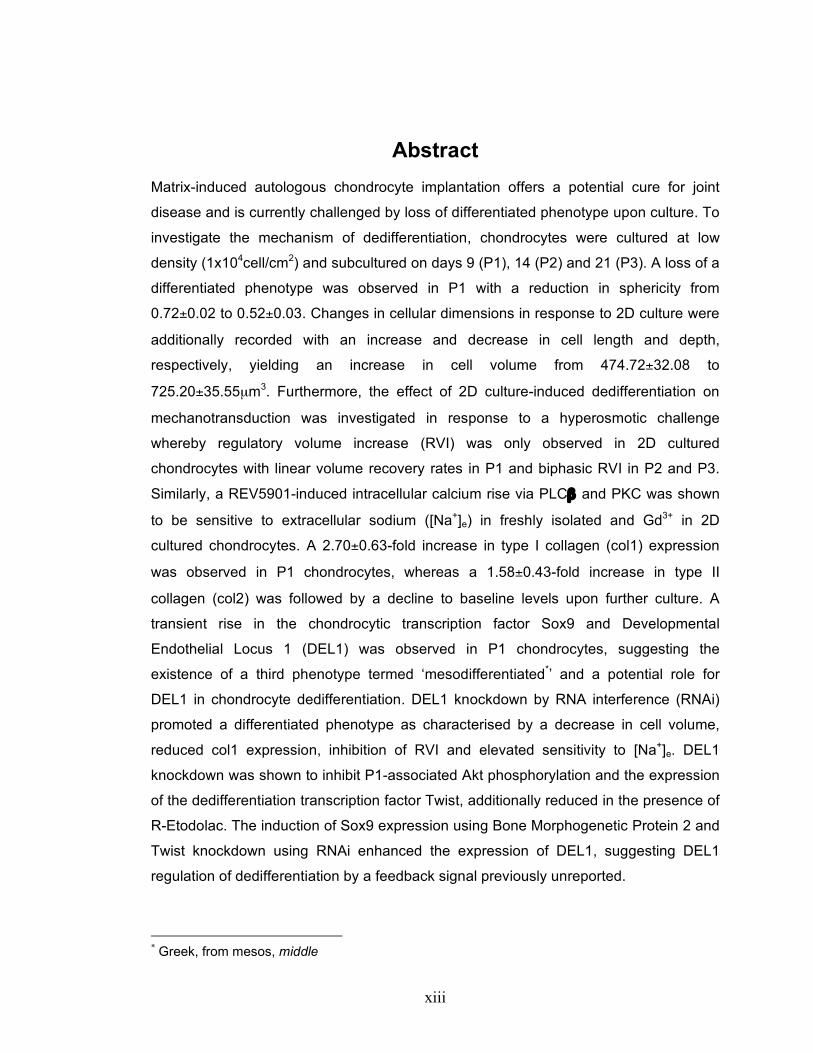
Abstract Matrix-induced autologous chondrocyte implantation offers a potential cure for joint
disease and is currently challenged by loss of differentiated phenotype upon culture. To
investigate the mechanism of dedifferentiation, chondrocytes were cultured at low
density (1x10⁴cell/cm2) and subcultured on days 9 (P1), 14 (P2) and 21 (P3). A loss of a
differentiated phenotype was observed in P1 with a reduction in sphericity from
0.72±0.02 to 0.52±0.03. Changes in cellular dimensions in response to 2D culture were
additionally recorded with an increase and decrease in cell length and depth,
respectively, yielding an increase in cell volume from 474.72±32.08 to
725.20±35.55µm3. Furthermore, the effect of 2D culture-induced dedifferentiation on
mechanotransduction was investigated in response to a hyperosmotic challenge
whereby regulatory volume increase (RVI) was only observed in 2D cultured
chondrocytes with linear volume recovery rates in P1 and biphasic RVI in P2 and P3.
Similarly, a REV5901-induced intracellular calcium rise via PLCβ and PKC was shown
to be sensitive to extracellular sodium ([Na+]e) in freshly isolated and Gd3+ in 2D
cultured chondrocytes. A 2.70±0.63-fold increase in type I collagen (col1) expression
was observed in P1 chondrocytes, whereas a 1.58±0.43-fold increase in type II
collagen (col2) was followed by a decline to baseline levels upon further culture. A
transient rise in the chondrocytic transcription factor Sox9 and Developmental
Endothelial Locus 1 (DEL1) was observed in P1 chondrocytes, suggesting the
existence of a third phenotype termed ‘mesodifferentiated*’ and a potential role for
DEL1 in chondrocyte dedifferentiation. DEL1 knockdown by RNA interference (RNAi)
promoted a differentiated phenotype as characterised by a decrease in cell volume,
reduced col1 expression, inhibition of RVI and elevated sensitivity to [Na+]e. DEL1
knockdown was shown to inhibit P1-associated Akt phosphorylation and the expression
of the dedifferentiation transcription factor Twist, additionally reduced in the presence of
R-Etodolac. The induction of Sox9 expression using Bone Morphogenetic Protein 2 and
Twist knockdown using RNAi enhanced the expression of DEL1, suggesting DEL1
regulation of dedifferentiation by a feedback signal previously unreported.
* Greek, from mesos, middle

1
1 Introduction
2
Osteoarthritis (OA) is a common joint disease that leads to disability with six
million working days lost in the UK and a total estimated cost totalling £5.5 billion
(Peach et al., 2005). An emerging treatment for OA is cartilage replacement
where cartilage explants are removed from patients, the chondrocytes isolated
and then subsequently grown in 2D (expansion) monolayer culture medium in
vitro (Giannoni et al., 2005; Sgaglione, 2005; Tallheden et al., 2005). An
important factor when working with articular cartilage is the regulation of the cell
phenotype whereby as a result of monolayer culture, chondrocytes undergo
dedifferentiation and acquire a fibroblast-like phenotype (Benya & Shaffer,
1982b). Changes in cell shape, actin reorganisation, regulatory volume increase
(RVI), calcium homeostasis, and key genes expression was investigated in
response to 2d culture to further our understanding of dedifferentiation.
1.1 Cartilage and Chondrocytes
1.1.1 Structure of Cartilage
Articular Cartilage is a dense connective tissue which provides a scaffold for
bone deposition and smooth surfaces for the movement of articulating bones
(Stockwell, 1978; Buckwalter & Mankin, 1998; Gray, 2000). Cartilage, in
conjunction with synovial fluid, provides protection against both compressive
and dynamic loading as a consequence of joint use by dissipating the weight
over a larger surface area (Stockwell, 1971b, c; Gray, 2000). Cartilage has a
glassy appearance with a white colour (Stockwell, 1979; Hall, 1998b). Cartilage
is comprised of an extracellular matrix (ECM) synthesised by the only resident
cell type chondrocytes, which account for ~10% of the tissue volume as
measured in adult human hip cartilage (Stockwell, 1971a; Byers et al., 1977). In
response to physio-chemical environment, chondrocytes maintain a balance of
anabolism and catabolism of a limited number of ECM macromolecules thus
3
maintaining and adapting the ECM to the forces against it (Holmes et al., 1988;
Urban, 1994; Archer & Francis-West, 2003; Lin et al., 2006).
The ECM of articular cartilage is comprised principally of collagen type II, which
is the most abundant form of collagen in healthy adult cartilage (Matyas et al.,
1995; Nalin et al., 1995), and proteoglycan (PG). PGs contribute to the ability of
cartilage to resist compression (Urban, 1994) and are composed of chains of
Glucosaminoglycans (GAG; mainly chondroitin sulphate and keratan sulphate)
attached to aggrecan core protein (Hughes, 1997). PGs are further interlinked
by a backbone of hyaluronic acid, which is in turn bound to cluster of
differentiation 44 (CD44) on the chondrocyte cell membrane, forming clusters in
the order of 5x10⁴ to 5x10⁵ kDa (Figure 1.1). Due to the negative charge on their
carboxyl and sulphonic groups, PGs have a high affinity to cations (mainly,
sodium and to a less extent potassium and calcium) and therefore contribute to
a relatively higher ionic strength of cartilage (310-370 mOsm) compared to that
of other body fluids (Stockwell, 1991b; Urban, 1994; Wilkins et al., 2000).
Type II Collagen is a homotrimeric protein with a characteristic Gly-X-Y repeat
forming right handed helical fibres fibres, 30-200nm in diameter. Collagen type I
is expressed in smaller quantities throughout cartilage and more abundantly in
bone-cartilage surface (Roberts, 1985) forming a heterotrimeric helix.
Conversely, Type IX collagen is a highly glycosylated non fibular protein that
interlinks type II collagen fibres, thereby forming a complex mesh that ‘traps’
chondrocytes and prevents maximal hydration of PGs (Stockwell, 1991a; Eyre et
al., 2002). This mesh is able to tolerate high pressures that arise during load
bearing, sometimes as high as 0.2MPa in the adult human hip (Hodge, 1986).
As well as structural proteins, cartilage comprises of other proteins involved in
the regulation of the ECM. Fibronectin, Anchorin and Cartilage Oligomeric
4
Proteins (COMP) are involved in linking extracellular fibres to the chondrocyte
cell surface and are thus implicated in the maintenance and repair of ECM
(Roberts, 1985). COMP interacts with type II collagen by its third epithelial
growth factor (EGF) repeat (Tan et al., 2009) where mutations can cause
osteochondrodysplasias pseudoachondroplasia (Song et al., 2003; Tufan et al.,
2007), thereby suggesting a role for COMP in cartilage development.

5
Figure 1.1: Schematic diagram of the structure of the extracellular matrix (ECM).
The extracellular matrix (ECM) of cartilage is mainly composed of proteoglycans (PGs) and
collagen fibrils. PGs branch from hyaluronan molecules that extend from the chondrocyte cell
surface. Negatively charged glycosaminoglucan chains of PGs attract cations and cause water
retention in the tissue. Collagen Type II fibrils are interlinked by collagen Type IX fibrils and
together they form a mesh that traps PGs. Adapted from Urban, 1994.
Collagen Type II fibrils
Fixed Cations
Proteoglycan Hyaluronan
Mobile Anions
Chondrocyte
Nucleus
6
1.1.2 Chondrocytes and chondrocytic phenotype
Chondrocytes are the only resident cells found in cartilage at a density of up to
10,000 chondrocytes/mm3 in human adult femoral head cartilage and are
responsible for the maintenance of the cartilage ECM (Stockwell, 1971). During
embryogenesis, chondrocyte are extensively distributed within the foetus and
are responsible for the longitudinal bone growth within the epiphyseal growth
plate (Hall & Miyake, 1992; Archer & Francis-West, 2003). Chondrocytes
differentiate from colony-forming unit-fibroblast, and later mesenchymal stem
cells (MSC) which appear as condensations between 10-12 days postcoitum
and initially express collagen type I prior to differentiation into foetal
chondrocytes (Lui et al., 1995).
In vivo, three distinct chondrocytic phenotypes have been observed in healthy
tissue; foetal in embryonic tissue, hypertrophic in immature, and differentiated in
mature cartilage. During embryogenesis, mesenchymal stem cells differentiate
into foetal chondrocytes, which are arranged in two distinct zones termed
reserve and proliferative zones (Ryan & Sandell, 1990). Chondrocytes in the
reserve zone possess a volume of 1500±240µm3, are uniform yet compactly
arranged, and occur singly or in pairs (Melrose et al., 2008). Conversely,
chondrocytes in the proliferative zone are flat and well divided into longitudinal
columns with exclusive mitotic activity (Ballock & O'Keefe, 2003). Foetal
chondrocytes switch to the expression of chondrocyte specific type II collagen
(Ryan & Sandell, 1990; Sandell et al., 1991) in addition to type IX and XI
collagens, while levels of type I collagen expression are significantly inhibited
(Luo et al., 1995).
During postnatal bone growth, foetal chondrocytes in growth plates proceed
through a differentiation pathway characterised by cellular enlargement
(chondrocyte hypertrophy) and resulting in terminal differentiation (Drissi et al.,
2005). Hypertrophic chondrocytes increase in volume by a factor ~10x
7
compared to foetal chondrocytes reaching a volume of 17,500±425µm3 (Bohme
et al., 1995; Ng et al., 1997; DeLise et al., 2000), primarily as a result of water
imbibition (Buckwalter et al., 1986), and express high levels of collagen X, the
role of which is to facilitate calcium deposition within the matrix (Alvarez et al.,
2001).
Differentiated (mature) chondrocytes synthesise and maintain the ECM, and are
therefore ‘maturationally arrested’ and do not exhibit proliferation potential
(Sailor et al., 1996; Buckwalter & Mankin, 1998; Drissi et al., 2005). As cartilage
is avascular in nature, chondrocytes operate and maintain low oxygen tension to
outgrow fibroblasts, and rely on nutrients obtained from the articular surface by
diffusion (Rajpurohit et al., 1996) as well as signals obtained by the extracellular
ionic environment and ECM interactions (Stockwell, 1991a). Chondrocytes
produce PGs and types II, III, IX and XI collagens, degrading the ECM by the
secretion of collagenases and gelatinases and inhibit blood vessel invasion by
synthesis of tissue inhibitor metalloproteinases (Stockwell, 1991a).
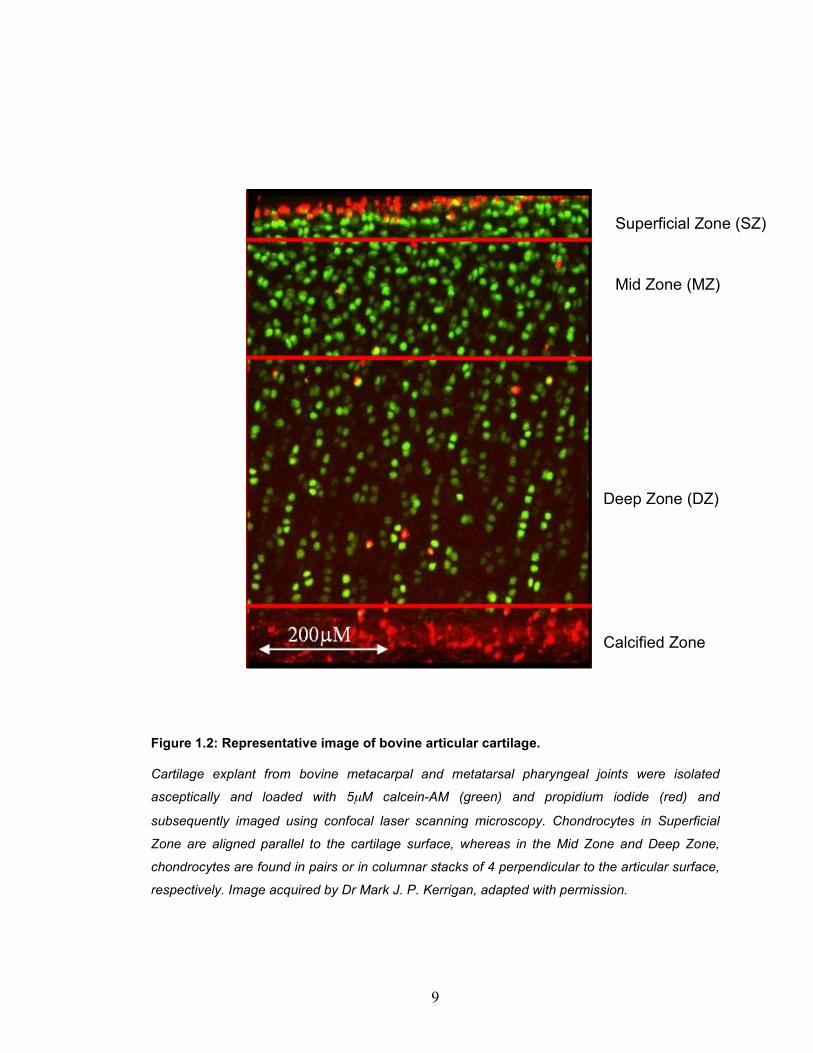
A cross section of mature cartilage (Figure 1.2) highlights the presence of four
zones; superficial zone (SZ), middle zone (MZ), deep zone (DZ) and calcified
zone (Stockwell, 1991a). In the SZ, collagen fibres are densely packed around
flattened chondrocytes, ellipsoid in shape and are approximately 2-3µm in
diameter with a volume of 454±18µm3, whereas In the MZ, chondrocytes are
spherical (sometimes found in pairs) with a lightly larger volume of 553±15µm3
and are embedded in randomly arranged collagen fibres forming a ‘Basket
Weave’ structure (Table 1.1). The DZ is characterised by columns of ellipsoid
cells possessing a volume of 805±79µm3 distributed between radially oriented
collagen fibres that extend into the calcified zone (Stockwell, 1991a; Hall,
1998b).
8
The transcription factor SOX9 is a key regulator of chondrocyte differentiation in
both mesenchymal stem cells and foetal chondrocytes (Ng et al., 1997; DeLise
et al., 2000) and the expression level remains elevated in differentiated
chondrocytes accounting to 20% of the expression of Glyceraldehyde 3-
phosphate dehydrogenase (GAPD) (Haag et al., 2008). The expression of
various chondrocyte-specific genes including type II collagen is tightly regulated
by chondrocyte-specific SOX9 transcription factor (de Crombrugghe et al., 2000)
and mutations in SOX9 lead to skeletal malformation syndromes including
campomelic dysplasia (Sock et al., 2003).
Chondrocytes are able to ‘sense’ and respond to external factors and regulate
matrix synthesis to the forces and stimuli perceived, some of which will be
introduced in following sections (Table 1.2).
9
Figure 1.2: Representative image of bovine articular cartilage.
Cartilage explant from bovine metacarpal and metatarsal pharyngeal joints were isolated
asceptically and loaded with 5µM calcein-AM (green) and propidium iodide (red) and
subsequently imaged using confocal laser scanning microscopy. Chondrocytes in Superficial
Zone are aligned parallel to the cartilage surface, whereas in the Mid Zone and Deep Zone,
chondrocytes are found in pairs or in columnar stacks of 4 perpendicular to the articular surface,
respectively. Image acquired by Dr Mark J. P. Kerrigan, adapted with permission.
Calcified Zone
Deep Zone (DZ)
Mid Zone (MZ)
Superficial Zone (SZ)
10
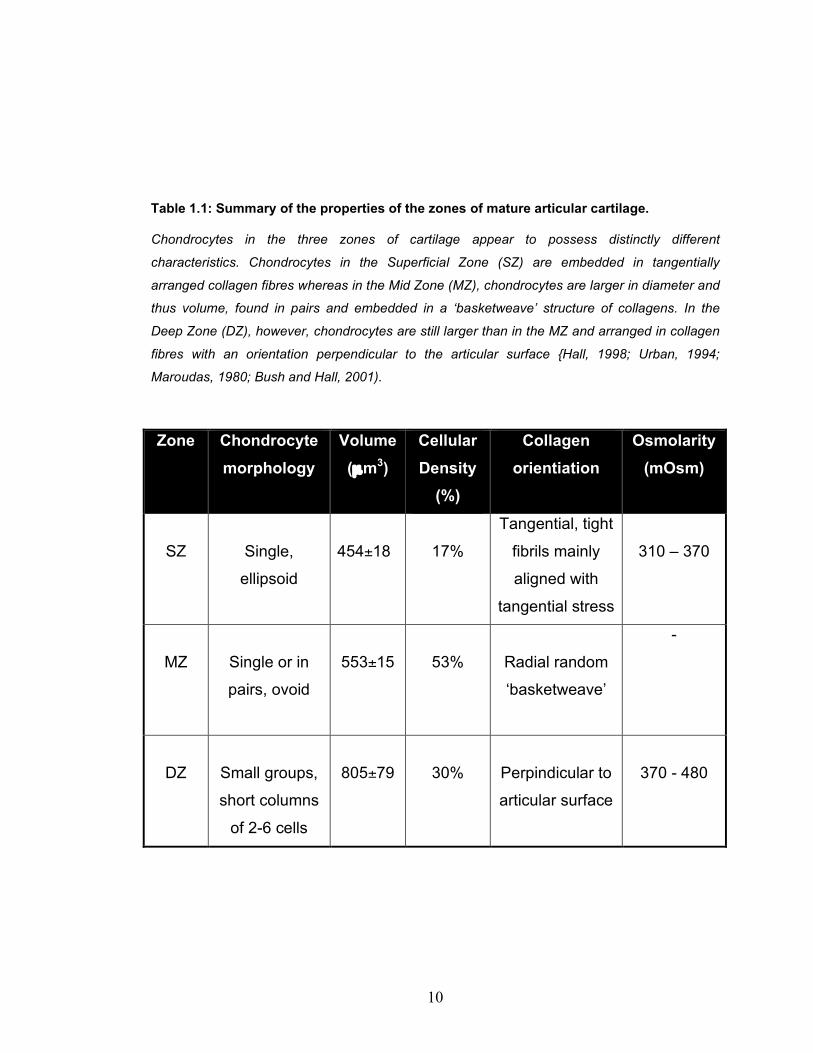
Table 1.1: Summary of the properties of the zones of mature articular cartilage.
Chondrocytes in the three zones of cartilage appear to possess distinctly different
characteristics. Chondrocytes in the Superficial Zone (SZ) are embedded in tangentially
arranged collagen fibres whereas in the Mid Zone (MZ), chondrocytes are larger in diameter and
thus volume, found in pairs and embedded in a ‘basketweave’ structure of collagens. In the
Deep Zone (DZ), however, chondrocytes are still larger than in the MZ and arranged in collagen
fibres with an orientation perpendicular to the articular surface {Hall, 1998; Urban, 1994;
Maroudas, 1980; Bush and Hall, 2001).
Zone Chondrocyte
morphology Volume (µm3)
Cellular Density
(%)
Collagen orientiation
Osmolarity (mOsm)
SZ
Single,
ellipsoid
454±18
17%
Tangential, tight
fibrils mainly
aligned with
tangential stress
310 – 370
MZ
Single or in
pairs, ovoid
553±15
53%
Radial random
‘basketweave’
-
DZ
Small groups,
short columns
of 2-6 cells
805±79
30%
Perpindicular to
articular surface
370 - 480
11
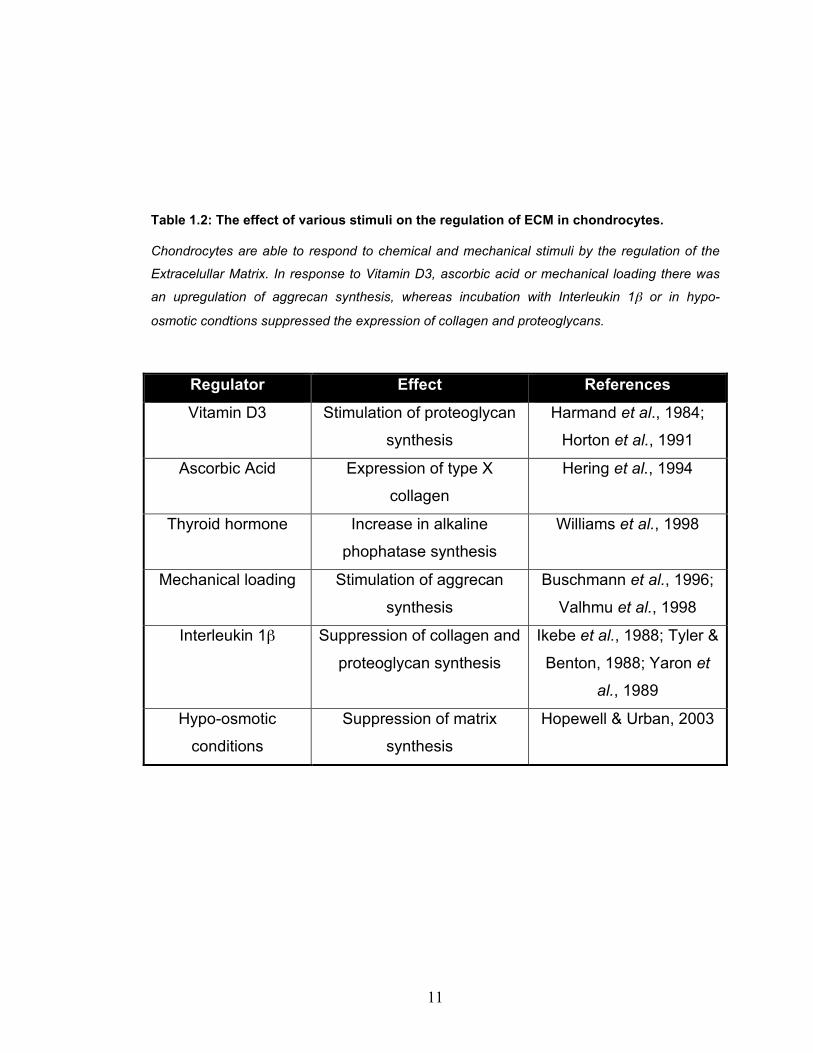
Table 1.2: The effect of various stimuli on the regulation of ECM in chondrocytes.
Chondrocytes are able to respond to chemical and mechanical stimuli by the regulation of the
Extracelullar Matrix. In response to Vitamin D3, ascorbic acid or mechanical loading there was
an upregulation of aggrecan synthesis, whereas incubation with Interleukin 1β or in hypo-
osmotic condtions suppressed the expression of collagen and proteoglycans.
Regulator Effect References
Vitamin D3 Stimulation of proteoglycan
synthesis
Harmand et al., 1984;
Horton et al., 1991
Ascorbic Acid Expression of type X
collagen
Hering et al., 1994
Thyroid hormone Increase in alkaline
phophatase synthesis
Williams et al., 1998
Mechanical loading Stimulation of aggrecan
synthesis
Buschmann et al., 1996;
Valhmu et al., 1998
Interleukin 1β Suppression of collagen and
proteoglycan synthesis
Ikebe et al., 1988; Tyler &
Benton, 1988; Yaron et
al., 1989
Hypo-osmotic
conditions
Suppression of matrix
synthesis
Hopewell & Urban, 2003

12
1.2 Osteoarthritis
Osteoarthritis (OA; or more accurately yet less commonly referred to as
Osteoarthrosis) is a common joint disease that leads to disability. In the UK, 7
million people are diagnosed with OA (Arthritis Research Campaign website),
and 206 million working days were lost in 1999-2000 with a total estimated cost
of £5.5 billion (Peach et al., 2005). Symptoms of OA include pain, stiffness and
in severe cases loss of joint function (Bulstrode, 2002).
Cartilage can be damaged by bone remodelling or trauma (Roos et al., 1998),
metabolic diseases (haemochromatosis and Ochnronosis), accumulation of
toxins in the synonvium, alteration in load bearing in people suffering from
obesity (Anderson & Felson, 1988) or anatomical abnormalities (Roos et al.,
1998; Mototani et al., 2005). This is followed by attempted cartilage repair which
leads to cartilage “fibrillation” (Stockwell, 1991a), subchondral cyst formation,
bone outgrowth, hyperplasia of the synovium and sclerosis of subchondral bone
(Stevens & Lowe, 2000).
In OA, there is an increase in cartilage hydration attributed to the degradation of
collagen structures and thus the increased swelling capacity of PGs (Stockwell,
1991b). Tissue hydration causes an increase in the bioavailability of diffusible
factors, including cytokines and nutrients, and subsequent changes in ionic
environment. An increase in OA chondrocyte cell volume was also observed and
an article reported that it was due to passive swelling in the over-hydrated tissue
(Bush & Hall, 2005).
On the cellular level, OA chondrocytes escape the maturation arrest (tightly
regulated by Transforming Growth Factor Beta; TGF-β) and undergo a
13
hypertrophic-like Bone Morphogenetic Protein (BMP) dependent maturation
(Ballock et al., 1993; Serra et al., 1999; Grimsrud et al., 2001; Li et al., 2006)
whilst expressing high levels of types X, III, IIA and VI collagen (Schmid et al.,
1991; Aigner et al., 1995; Soder et al., 2002; Gebhard et al., 2003) and
abnormal levels of versican, a chondroitin sulphate proteoglycan (Martin et al.,
2001). Moreover, there is also an upregulation of inflammatory mediators
including IL-1β, IL-4, TNFα, Nitric Oxide (LeGrand et al., 2001), and matrix
metalloproteinases (Tetlow et al., 2001; Fernandes et al., 2002).
Osteoarthritis is managed using painkillers (Paracetamol), non-steroidal anti-
inflammatory drugs (NSAIDs; aspirin, Ibuprofen and, to a less degree, selective
COX-2 inhibitors including Celecoxib) and/or corticosteroid treatment
(Prednisone; on the website of the National Health Service). More recent
developments in OA therapy include MabThera, a chimeric human monoclonal
antibody against CD20 (Tsiakalos et al., 2008; Nakou et al., 2009), and other
similar biotechnological drugs against TNFα and IL-1 (Koumakis et al., 2009;
Mertens & Singh, 2009). Nevertheless, the aetiology and mechanism of disease
progression is still largely unknown and the only treatment to OA is joint
arthroplasty.
14
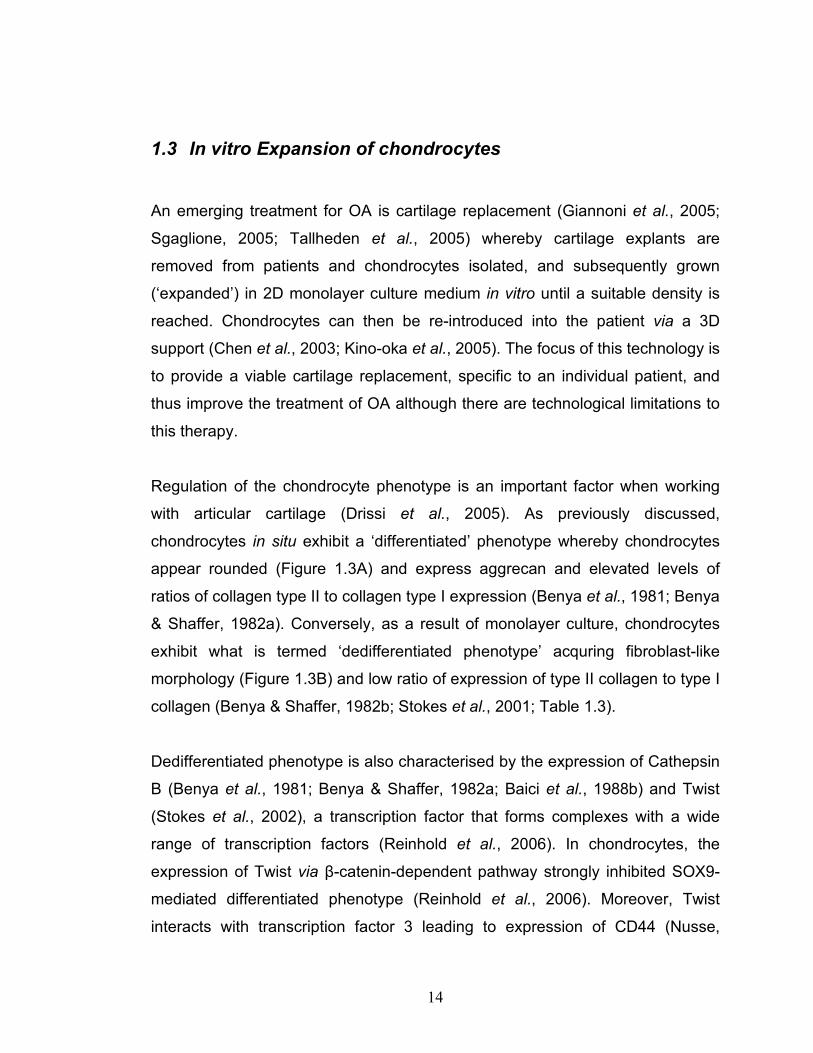
1.3 In vitro Expansion of chondrocytes
An emerging treatment for OA is cartilage replacement (Giannoni et al., 2005;
Sgaglione, 2005; Tallheden et al., 2005) whereby cartilage explants are
removed from patients and chondrocytes isolated, and subsequently grown
(‘expanded’) in 2D monolayer culture medium in vitro until a suitable density is
reached. Chondrocytes can then be re-introduced into the patient via a 3D
support (Chen et al., 2003; Kino-oka et al., 2005). The focus of this technology is
to provide a viable cartilage replacement, specific to an individual patient, and
thus improve the treatment of OA although there are technological limitations to
this therapy.
Regulation of the chondrocyte phenotype is an important factor when working
with articular cartilage (Drissi et al., 2005). As previously discussed,
chondrocytes in situ exhibit a ‘differentiated’ phenotype whereby chondrocytes
appear rounded (Figure 1.3A) and express aggrecan and elevated levels of
ratios of collagen type II to collagen type I expression (Benya et al., 1981; Benya
& Shaffer, 1982a). Conversely, as a result of monolayer culture, chondrocytes
exhibit what is termed ‘dedifferentiated phenotype’ acquring fibroblast-like
morphology (Figure 1.3B) and low ratio of expression of type II collagen to type I
collagen (Benya & Shaffer, 1982b; Stokes et al., 2001; Table 1.3).
Dedifferentiated phenotype is also characterised by the expression of Cathepsin
B (Benya et al., 1981; Benya & Shaffer, 1982a; Baici et al., 1988b) and Twist
(Stokes et al., 2002), a transcription factor that forms complexes with a wide
range of transcription factors (Reinhold et al., 2006). In chondrocytes, the
expression of Twist via β-catenin-dependent pathway strongly inhibited SOX9-
mediated differentiated phenotype (Reinhold et al., 2006). Moreover, Twist
interacts with transcription factor 3 leading to expression of CD44 (Nusse,
15
2005), a collagen receptor upregulated in 2D-cultured chondrocytes (Stokes et
al., 2002).
Trying to ‘recapture’ the chondrocytic differentiated phenotype following
expansion has been under intensive research. It has been shown that it was
possible to maintain the chondrocyte phenotype by growing chondrocytes in 3D
supports composed of type II collagen, agarose or alginate (Nehrer et al., 1997;
Beekman et al., 1997; Benz et al., 2002b; Miot et al., 2005a). Supplementation
with TGFβ1 or BMP6 induced the upregulation of chondrocyte-specific genes
including type II collagen, SOX9 and aggrecan (Zhou et al., 2008; Sung et al.,
2009; van der Windt et al., 2009). Similarly, the application of cyclic hydrostatic
pressure has been shown to induce the expression of GAG and type II collagen
whilst downregulating type I collagen (Heyland et al., 2006; Kawanishi et al.,
2007). Finally, treatment with actin depolymerising drugs including cytochalasin
D have been shown to induce the re-expression of type II collagen and
upregulation of PGs synthesis (Newman & Watt, 1988; Benz et al., 2002a; Miot
et al., 2005b).
The success of the recapture methodologies was found to be influenced by the
passage number where introduction of chondrocytes cultured for 3-12 days into
3D high-density culture induced a recovery of phenotype (Shakibaei, 1998,
Schulze-Tanzil et al., 2002). Upon further culture, however, chondrocyte
phenotype recovery was abolished, suggesting the existence of irreverisibly
dedifferentiated chondrocytes in later passages (Haisch et al., 2006).
16
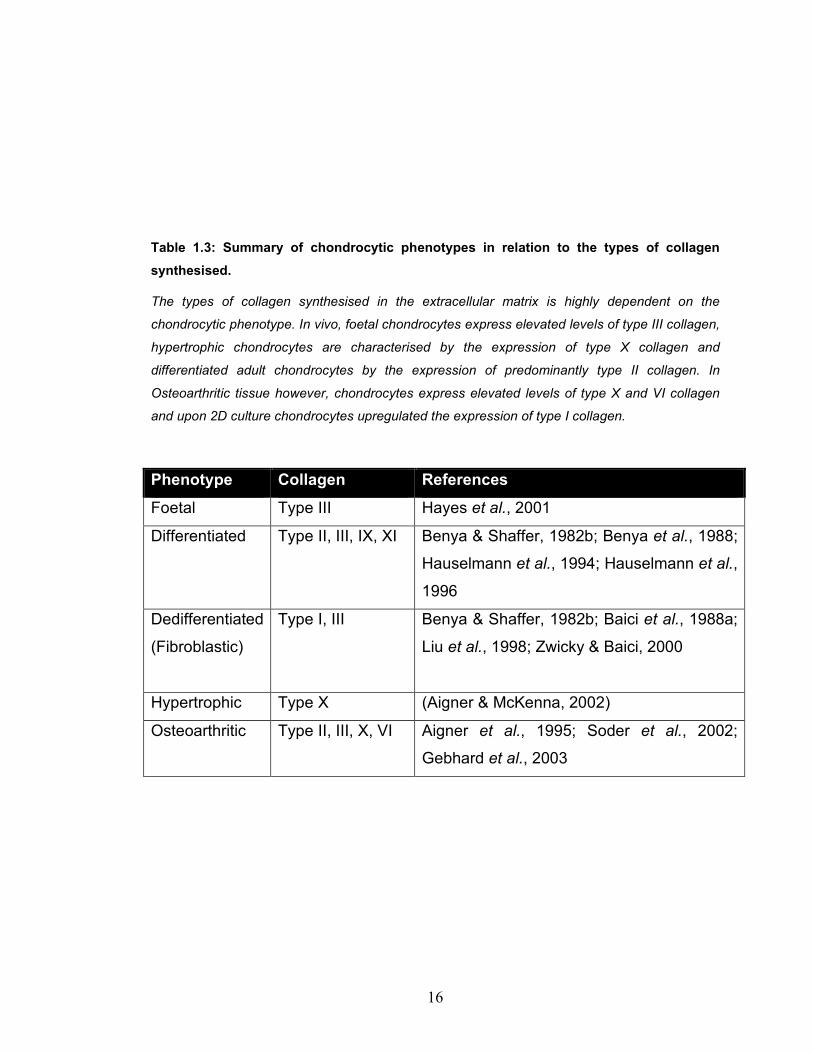
Table 1.3: Summary of chondrocytic phenotypes in relation to the types of collagen synthesised.
The types of collagen synthesised in the extracellular matrix is highly dependent on the
chondrocytic phenotype. In vivo, foetal chondrocytes express elevated levels of type III collagen,
hypertrophic chondrocytes are characterised by the expression of type X collagen and
differentiated adult chondrocytes by the expression of predominantly type II collagen. In
Osteoarthritic tissue however, chondrocytes express elevated levels of type X and VI collagen
and upon 2D culture chondrocytes upregulated the expression of type I collagen.
Phenotype Collagen References
Foetal Type III Hayes et al., 2001
Differentiated Type II, III, IX, XI Benya & Shaffer, 1982b; Benya et al., 1988;
Hauselmann et al., 1994; Hauselmann et al.,
1996
Dedifferentiated
(Fibroblastic)
Type I, III Benya & Shaffer, 1982b; Baici et al., 1988a;
Liu et al., 1998; Zwicky & Baici, 2000
Hypertrophic Type X (Aigner & McKenna, 2002)
Osteoarthritic Type II, III, X, VI Aigner et al., 1995; Soder et al., 2002;
Gebhard et al., 2003
17
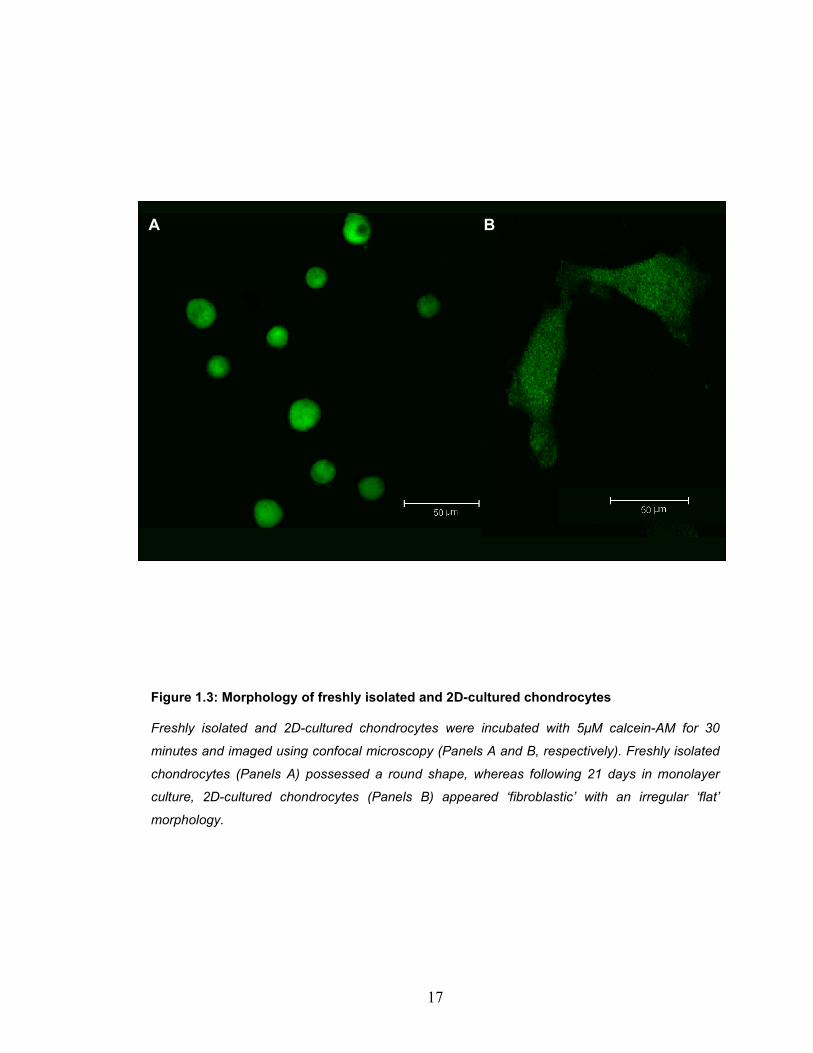
Figure 1.3: Morphology of freshly isolated and 2D-cultured chondrocytes
Freshly isolated and 2D-cultured chondrocytes were incubated with 5µM calcein-AM for 30
minutes and imaged using confocal microscopy (Panels A and B, respectively). Freshly isolated
chondrocytes (Panels A) possessed a round shape, whereas following 21 days in monolayer
culture, 2D-cultured chondrocytes (Panels B) appeared ‘fibroblastic’ with an irregular ‘flat’
morphology.
B A
18
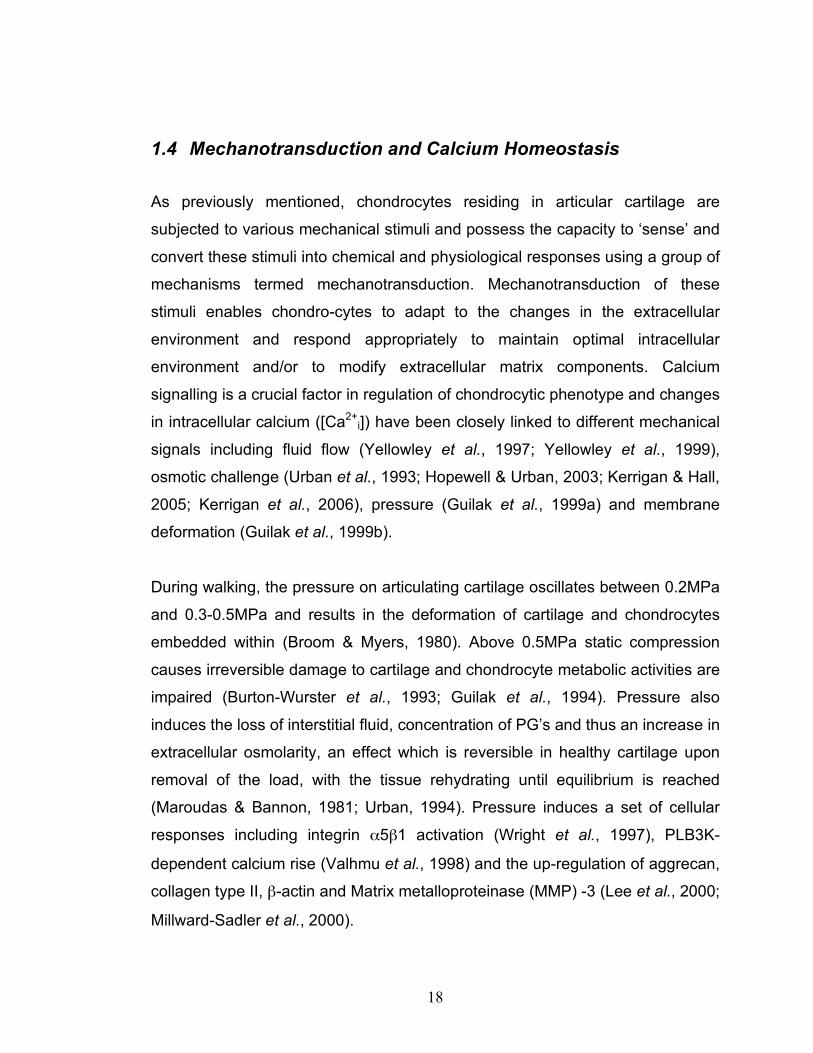
1.4 Mechanotransduction and Calcium Homeostasis
As previously mentioned, chondrocytes residing in articular cartilage are
subjected to various mechanical stimuli and possess the capacity to ‘sense’ and
convert these stimuli into chemical and physiological responses using a group of
mechanisms termed mechanotransduction. Mechanotransduction of these
stimuli enables chondro-cytes to adapt to the changes in the extracellular
environment and respond appropriately to maintain optimal intracellular
environment and/or to modify extracellular matrix components. Calcium
signalling is a crucial factor in regulation of chondrocytic phenotype and changes
in intracellular calcium ([Ca2+i]) have been closely linked to different mechanical
signals including fluid flow (Yellowley et al., 1997; Yellowley et al., 1999),
osmotic challenge (Urban et al., 1993; Hopewell & Urban, 2003; Kerrigan & Hall,
2005; Kerrigan et al., 2006), pressure (Guilak et al., 1999a) and membrane
deformation (Guilak et al., 1999b).
During walking, the pressure on articulating cartilage oscillates between 0.2MPa
and 0.3-0.5MPa and results in the deformation of cartilage and chondrocytes
embedded within (Broom & Myers, 1980). Above 0.5MPa static compression
causes irreversible damage to cartilage and chondrocyte metabolic activities are
impaired (Burton-Wurster et al., 1993; Guilak et al., 1994). Pressure also
induces the loss of interstitial fluid, concentration of PG’s and thus an increase in
extracellular osmolarity, an effect which is reversible in healthy cartilage upon
removal of the load, with the tissue rehydrating until equilibrium is reached
(Maroudas & Bannon, 1981; Urban, 1994). Pressure induces a set of cellular
responses including integrin α5β1 activation (Wright et al., 1997), PLB3K-
dependent calcium rise (Valhmu et al., 1998) and the up-regulation of aggrecan,
collagen type II, β-actin and Matrix metalloproteinase (MMP) -3 (Lee et al., 2000;
Millward-Sadler et al., 2000).
19
Chondrocytes are embedded in an overall negatively charged matrix attracting
cations, which in turn increase the water content of cartilage. The mobile fluid
phase flows surrounding chondrocytes during joint articulation, and therefore,
fluid flow has been employed in vitro to mimic shear-induced stress (Yellowley et
al., 1997). It has been observed that fluid flow induced both a G-protein-
mediated Ca2+ release from intracellular stores and stretch-activated cation
channels (SACC) activation (Yellowley et al., 1997; Yellowley et al., 1999).
Conversely, membrane deformation, as a result of fluid flow in vivo or
mechanical stimulation in vitro, has been shown to induce an intracellular store-
independent [Ca2+]i rise which was inhibited by pharmacological inhibitors of
Sodium Calcium Exchanger (NCX) and SACC (Guilak, 1999).
NCX (also known as Solute carrier family 8 (sodium/calcium exchanger),
member 3) is involved in maintaining [Ca2+]i homeostasis in a wide variety of
cell types with NCX3 being restricted to neurons (Thruneysen et al., 2002). NCX
can transport Ca2+ at high speed of 5,000 ions/s (Carafoli et al., 2001), is
regulated by [Ca2+]i and is found on both the plasma membrane and intracellular
organellar membranes (Gabellini, 2004). SACC, conversely, is a group of Gd3+-
sensitive channels that respond to mechanical ‘stress’ by allowing the exchange
of cations.
It has been shown that freshly isolated chondrocytes, but not 2D-cultured
chondrocytes, exhibited a transient increase in intracellular calcium in a
gadolinium-sensitive manner in response to a hypo-osmotic challenge (Kerrigan
& Hall, 2007) mediated by PLC/IP3-depandant calcium release from intracellular
stores (Sanchez et al., 2003), whereas only NCX was involved in hyperosmotic
challenge-induce [Ca2+]i rise (Sanchez & Wilkins, 2004). Moreover, treatment of
2D cultured chondrocytes with Gadolinium, a SACC inhibitor, induced the loss of
a differentiated phenotype (Perkins et al., 2005) potentially via a calcium-
dependent pathway (Wright et al., 1996). Therefore, investigating changes in
calcium signalling pathways is an area of continued research.
20
1.5 Volume Regulation and 2D Expansion
In non-impacted cartilage tissue, the extracellular environment possesses an
ionic concentration ranging between 355±5mOsm in the SZ and 410±30mOsm
in the DZ (Urban, 1994). As previously described, joint loading induces an
changes in extracellular ionic environment (Urban et al., 1993; Kerrigan & Hall,
2005; Kerrigan et al., 2006) and the activation of volume regulatory mechanism
including Regulatory Volume Decrease (RVD) and post-RVD Regulatory
Volume Increase (post-RVD RVI; Kerrigan et al., 2006).
RVI and RVD are two mechanisms by which some cell types maintain constant
(in dynamic equilibrium) volume and intracellular ionic strength necessary to
support physiological processes and optimal metabolism during a hyperosmotic
and hypo-osmotic challenges, respectively (O'Neill, 1999). These mechanisms
result in an opposing water motion and gradual restoration of cell volume
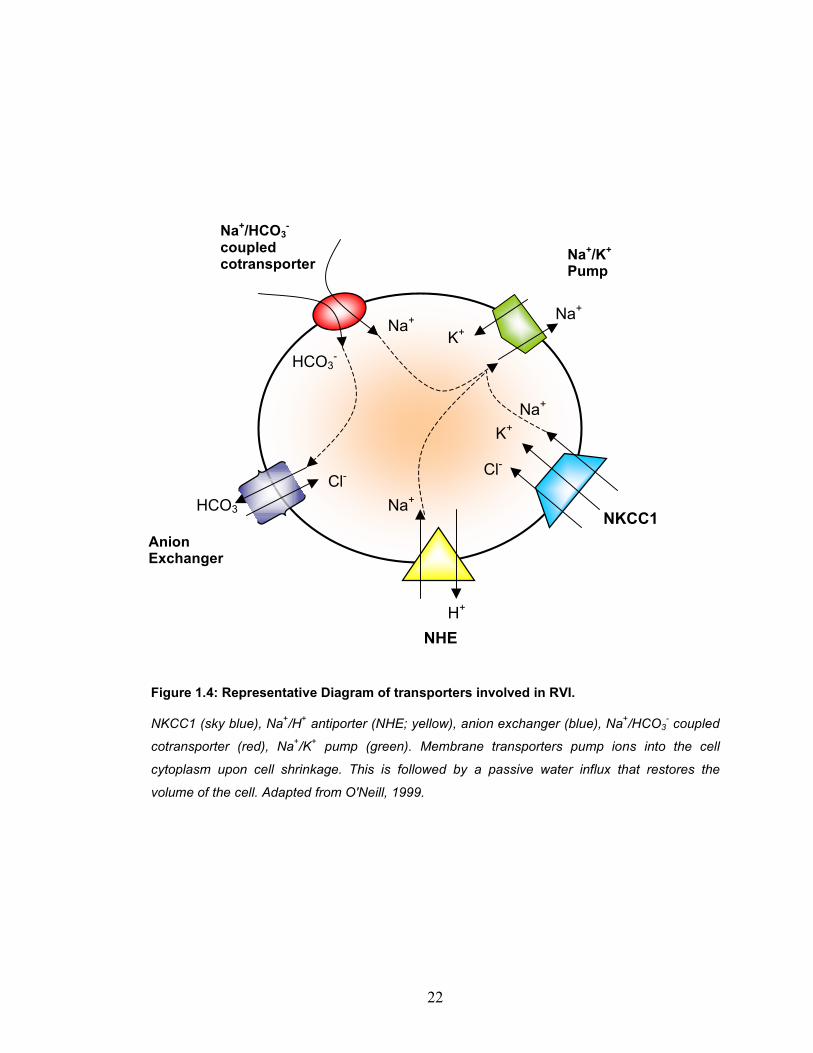
(Hoffmann et al., 2007). RVI is mediated by several different types of membrane
transporters (Figure 1.4) including sodium/potassium/chloride transporter
(Trujillo et al., 1999; Kerrigan et al., 2006), Na+/H+ antiporter (Trujillo et al.,
1999), anion exchanger (Shrode et al., 1997; Trujillo et al., 1999; Yamazaki et
al., 2000; Tattersall et al., 2003), Na+/HCO3- coupled cotransporter and Na+/K+
pump (O'Neill, 1999).
It has been shown that deviations from range of osmolarity values found
naturally in vivo resulted in a reduction in ECM production (Urban et al., 1993;
Hopewell & Urban, 2003). In OA hydrated cartilage, for example, there is a
decrease in extracellular osmolarity and an increase in fluid flow (Maroudas &
Venn, 1977; Mizrahi et al., 1986; Bush & Hall, 2005), possibly contributing to
changes in chondrocyte phenotype in OA.
21
Previous studies have shown variations in response to extracellular omsolarity
between differentiated and 2D-cultured chondrocytes, and therefore the ability of
chondrocytes to exhibit volume regulatory mechanisms appears to be closely
linked to the phenotypic state. 2D-cultured chondrocytes exhibited RVI whereas
freshly isolated and in situ chondrocytes did not (Kerrigan et al., 2006), thereby
confirming that 2D-cultured chondrocytes respond differently to mechanical
stimuli. Nevertheless, treatment of freshly isolated chondrocytes with latrunculin
B induced a bumetanide-sensitive RVI response suggesting the involvement of
NKCC1 in RVI in chondrocytes. Furthermore, molecular inhibition of NKCC1
using RNA intereference (RNAi) in chondrocytic cell line C-20/A4 induced the
loss of RVI mechanisms, thus confirming the role of NKCC in chondrocytes
(Qusous et al., in press).
22
Figure 1.4: Representative Diagram of transporters involved in RVI.
NKCC1 (sky blue), Na+/H+ antiporter (NHE; yellow), anion exchanger (blue), Na+/HCO3- coupled
cotransporter (red), Na+/K+ pump (green). Membrane transporters pump ions into the cell
cytoplasm upon cell shrinkage. This is followed by a passive water influx that restores the
volume of the cell. Adapted from O'Neill, 1999.
NHE H+
Na+
Na+
K+
Cl-
HCO3-
K+ Na+
Cl- Na+ HCO3
-
Na+/HCO3-
coupled cotransporter Na+/K+
Pump
NKCC1 Anion Exchanger

23
1.6 Actin Cytoskeletal Organisation
The actin cytoskeleton is a dynamic intracellular structure, which gives
mechanical support to cells and is involved in a wide range of cellular functions.
Actin, reported to be the most abundant protein in eukaryotic cells with a cellular
concentration of over 100µM, is a 43kDa globular protein (and thus termed G-
actin) that forms a unipolymer termed F-actin. Actin polymerisation is ATP and
Mg2+/Ca2+-dependent and is regulated by a variety of actin binding proteins
including nucleation promoting proteins Arp2/3 and Profilin (Goley & Welch,
2006), depolymerising proteins ADF and Cofillin (Ono, 2007), G-actin
sequestering protein Thymosin β4 (Yarmola & Bubb, 2004) and capping protein
Gelsolin (Yarmola & Bubb, 2004). Other factors that influence actin organisation
include hyperosmotic and hypo-osmotic conditions leading to an increase and a
decrease in F-actin, respectively (Guilak et al., 2002).
Several reports have demonstrated that actin organisation follows a cortical
disribution with predominant localisation to the cell periphery in situ (Durrant et
al., 1999; Langelier et al., 2000), in agarose 3D cultured (Idowu et al., 2000;
Knight et al., 2001) and in high-density monolayer chondrocytes (Blain et al.,
2006). Conversely, in 2D cultured chondrocytes the cortical arrangement is lost
and actin filaments span the whole cell (Idowu et al., 2000; Loty et al., 2000;
Figure 1.5). Interestingly, in OA chondrocytes F-actin is less defined than in
differentiated chondrocytes and localised diffusely in the cytoplasm (Fioravanti
et al., 2003).
The actin cytoskeleton provides chondrocytes with the mechanical integrity
required to withstand compressive loads (Guilak, 1995) as seen by the reduction
of chondrocyte stiffness by 90% and the increase in apparent viscosity by 80%
in response to treatment with cytochalasin D (Trickey et al., 2004) a fungal
24
metabolite that inhibits actin polymerisation (Schliwa, 1982). Furthermore,
cytochalasin D treatment has been shown to reduce both the rate of matrix
synthesis as well as chondrocyte anchorage to extracellular PGs, thus
suggesting a role for actin in signal transduction and phenotype modulation
(Nofal & Knudson, 2002). The effects of actin organisation on chondrocyte
morphology and phenotype has been well documented with dedifferentiated
chondrocytes re-expressing type II collagen and upregulating PGs expression in
response to cytochalasin D treatment (Newman & Watt, 1988; Benz et al.,
2002a; Miot et al., 2005b), an effect found to be independent of morphology
(Brown & Benya, 1988).
As previously mentioned, freshly isolated chondrocytes do not exhibit RVI but it
has been reported that chondrocytes treated with Latrunculin B, an actin
capping agent, exhibited bumetanide-sensitive RVI in freshly isolated
chondrocytes (Kerrigan et al., 2006). Moreover, Latrunculin B treatment induced
a significant increase in the number of cells expressing ‘fast’ RVD (Kerrigan &
Hall, 2005), thereby implying that the actin cytoskeleton plays a role in the
regulation of membrane transporters, possibly the NKCC, and thus the RVI
mechanisms. The above findings suggest a wide role for actin in the regulation
of chondrocytic phenotype and mechanotransduction.
25
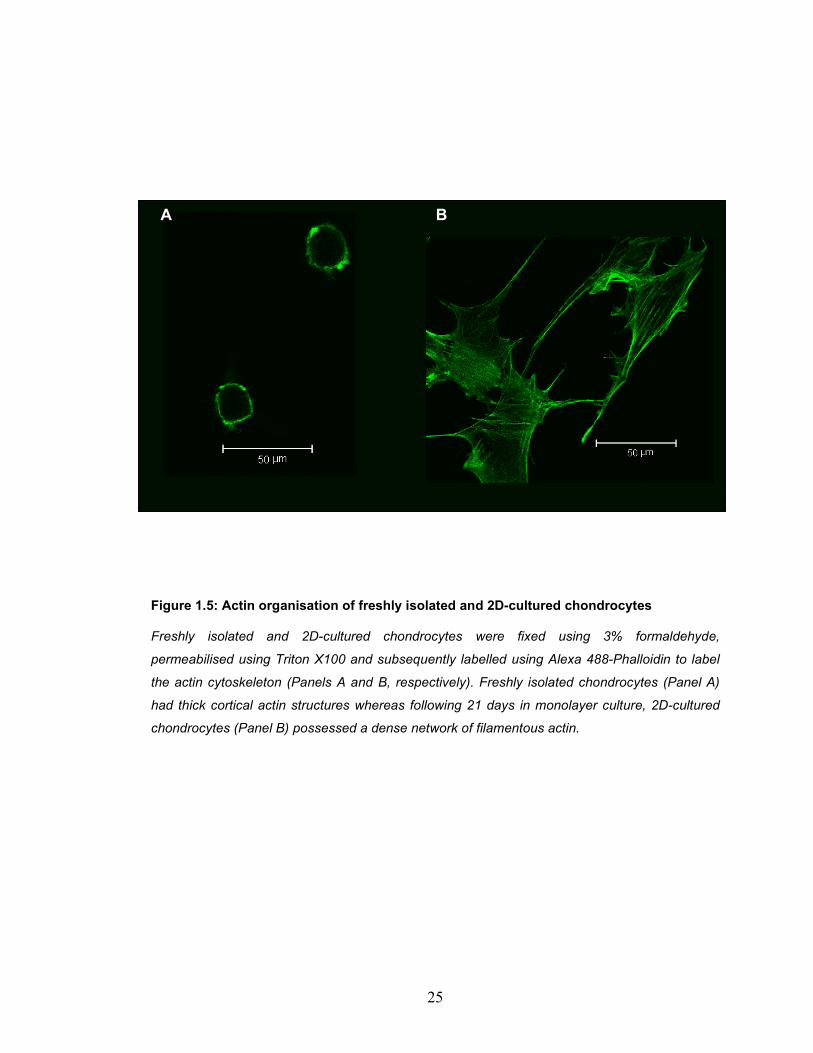
Figure 1.5: Actin organisation of freshly isolated and 2D-cultured chondrocytes
Freshly isolated and 2D-cultured chondrocytes were fixed using 3% formaldehyde,
permeabilised using Triton X100 and subsequently labelled using Alexa 488-Phalloidin to label
the actin cytoskeleton (Panels A and B, respectively). Freshly isolated chondrocytes (Panel A)
had thick cortical actin structures whereas following 21 days in monolayer culture, 2D-cultured
chondrocytes (Panel B) possessed a dense network of filamentous actin.
B A
26
1.7 DEL1 and Integrin Signalling
Integrins are transmembrane homo or heterodimers composed of α and/or β
chains covalently bound with a ligand affinity dependent on the combination of
chains (Hemler, 1990; Hynes, 1992). Integrins are involved in a wide range of
cellular functions including cellular attachment (Enomoto-Iwamoto et al., 1997),
maintaining shape, proliferation and actin organisation, (Hirsch et al., 1997;
Shakibaei et al., 1997) and relaying pressure-induced mechanotransduction
signals (Wright et al., 1997). Changes in the expression of integrin dimers in
response to 2D culture have been reported including an upregulation of α2-6
chains and α5β1 (Fibronectin receptors; FnR) heterodrimers (Enomoto-Iwamoto
et al., 1997; Diaz-Romero et al., 2005), indicating a role for Integrin signalling in
the regulation of phenotype upon 2D expansion. The role of integrin signalling in
differentiation and gene expression has been investigated in mammary gland
epithelium (Schmidhauser et al., 1992), myogenesis (Enomoto et al., 1993),
keratinocytes (Adams & Watt, 1991) and kidney tubule epithelium (Sorokin et
al., 1990).
In chondrocytes, gene mutations in integrin-mediated adhesion signalling lead to
various chondroskeletal complications. α1 integrin knock-out models developed
growth plate abnormalities and osteoarthritis (Zemmyo et al., 2003), whereas
α10 integrin knock-outs developed growth retardation, increased apoptosis and
abnormal cell shape (Bengtsson et al., 2005). Moreover, tissue specific knock-
out of β1 integrin disorganised the growth plate and proliferative columns,
reduced proliferation, caused abnormal cell shape and decreased cellular
adhesion (Aszodi et al., 2003).
27
1.7.1 Integrin Signalling
Binding of ECM ligands to integrins can induce a set of cellular responses
including the expression of matrix genes (Clancy et al., 1997), the degradation
of the matrix by inducing the synthesis of matrix proteinases (Werb et al., 1989)
and organisation of the actin cytoskeleton (Turner & Burridge, 1991; Wang &
Kandel, 2004). Integrins do not possess tyrosine kinase domains but are
associated with a group of proteins which induce a cascade of phosphorylation.
Following ligand binding and subsequent integrin activation and aggregation
(Schaller et al., 1994), FAK trans-autophophorylation is induced which in turn
results in the activation of PI3K (Chen et al., 1996) and Rho (Hotchin & Hall,
1995). PI3K activation leads to the phophorylation of Akt, whereas Rho signals
induce Erk and cofilin activation which regulate the cell cycle and actin
polymerisation, respectively (Renshaw et al., 1996).
Akt is also involved in a number of cell signalling pathways including cell survival
and motility and has been shown to regulate the expression of Basic helix-loop-
helix transcription factors (Vojtek et al., 2003) including Twist. There has also
been evidence that the signalling strategies used by integrins include additional
pathway to those employed by growth factor cell receptors. It has been found
that focal contact sites do not only contain cytoskeletal-regulatory tyrosine
kinases (Schaller et al., 1992), but also low amounts of a number of non-
enzymatic proteins that are activated by tyrosine kinases and mediate protein-
protein interactions in the focal contact (Turner & Burridge, 1991).
28
1.7.2 Developmental Endothelial Locus 1 (DEL1)
DEL1 (also known as EGF-like repeats and discoidin I-like domains 3; Edil3) is a
52kDa matrix adhesion protein composed of two Endothelial Growth Factor-like
(EGF-like) domains, the second of which containing an integrin-binding Arginine-
Glycine-Aspartic acid (RGD) motif (Hidai et al., 1998). Similarly to Edil1
(lactadherin; Silvestre et al., 2005), DEL1 interacts with αvβ3 phosphorylating
proteins in the focal contact including FAK, MAPK, Shc and Akt and providing an
autocrine angiogenic pathway as evident by inhibition of productive activation of
its receptor by matrix substrates (Penata et al., 1998).
It has been shown that DEL1 influenced endothelial cell behaviour and played
an important role in mediating angiogenesis, vessel wall remodelling and
development (Aoka et al., 2002; Ho et al., 2004). In vascular smooth muscle
cells, DEL1 is involved in adhesion, migration and proliferation through
interaction with integrin αvβ3 and actin filaments re-organisation (Rezaee et al.,
2002). Moreover, the attachment function of DEL1 has been shown to be
involved the immune system, whereby DEL1 expression by endothelial cells
induced leukocyte adhesion and inflammatory recruitment (Chol et al., 2008).
DEL1 expression by apoptotic cells enhanced phagocytosis by immune cells by
promoting attachment to phagocytic cells expressing αvβ3 integrin (Hanayama
et al., 2004).
DEL1 is involved in both foetal and adult differentiation via integrin signalling due
to the similarity between DEL1 amnio acid sequence and the notch receptor
ligands, known to inhibit terminal differentiation of a wide range of cell types
(Penata et al., 1998). In Xenopus embryogenesis, DEL1 is essential for dorsal
development whereby DEL1 knockdown is sufficient to cause ventralisation of
embryos via the attenuation of BMP-signalling (Arakanawa et al., 2007). DEL1 is
expressed by the keratinocytes in the dermal papilla and has been recently
29
shown to induce follicle development in mice skin by unknown mechanisms
(Hsu et al., 2008).
In chondrocytes, the expression of DEL1 has been observed in foetal tissue. An
upregulation of DEL1 expression has been previously reported in high density
culture but not 2D culture of foetal chondrocytes (Stokes et al., 2002). The
expression level and biological significance of DEL1 in adult chondrocytes,
however, have not yet been investigated. Due to the established complex effect
of integrin signalling on chondrocyte development and differentiation, as well as
the recent observations of changes in DEL1 expression in response to 2D
culture, DEL1 has become a candidate for continuing research in chondrocyte
phenotypic regulation.
30
1.8 Aims
Due to a current gap in knowledge, I aimed to study the regulation of
chondrocytic phenotype and mechanotransduction responses as a result of 2D
culture. We proposed to identify the mechanism of DEL1–induced de-
differentiation via Twist and the corresponding changes in morphology, actin
organisation and mechanotransduction.
1 Quantify the changes in chondrocyte phentoype occurring in response to
2D culture including cell shape, actin organisation and expression battery.
2 Study the mechanotransduction responses of freshly isolated and 2D
cultured chondrocytes in response to hyperomsmotic challenge and
pharmacologically-induced [Ca2+]i rise.
3 Investigate the role of DEL1 expression on chondrocyte phenotype
regulation and mechanotransduction.
4 Investigate the signalling pathway of DEL1.

31
2 Materials and methods
32
2.1 Materials
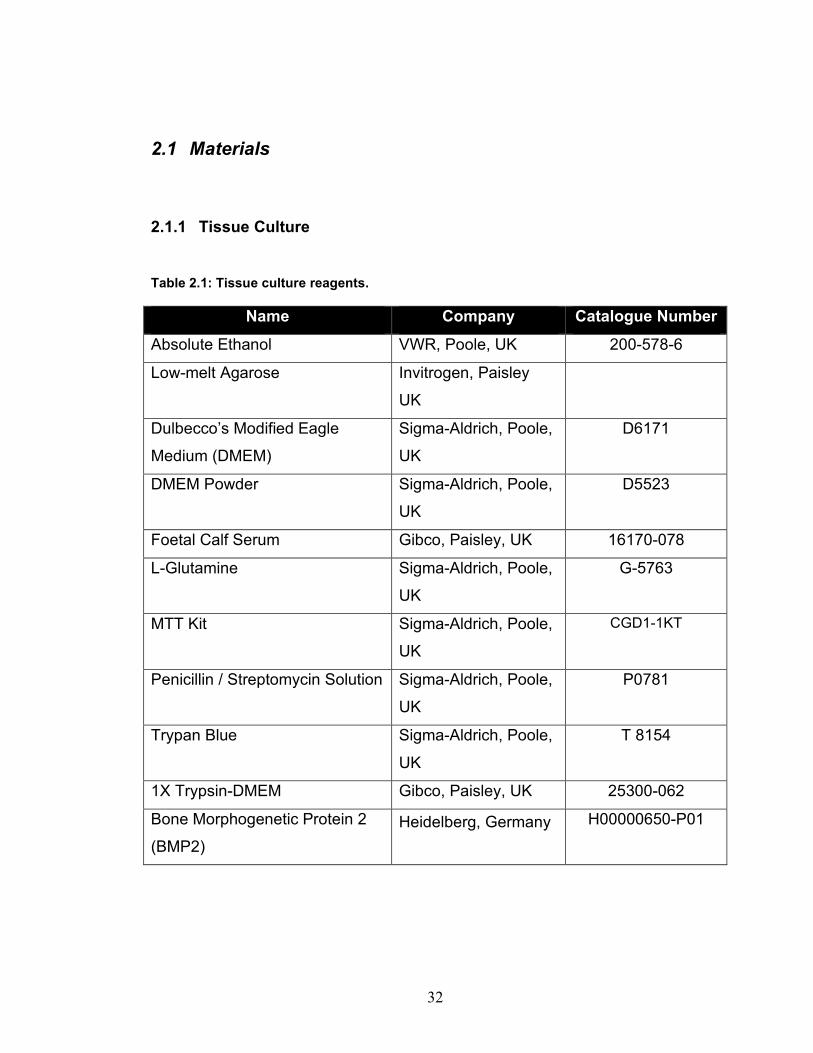
2.1.1 Tissue Culture
Table 2.1: Tissue culture reagents.
Name Company Catalogue Number
Absolute Ethanol VWR, Poole, UK 200-578-6
Low-melt Agarose Invitrogen, Paisley
UK
Dulbecco’s Modified Eagle
Medium (DMEM)
Sigma-Aldrich, Poole,
UK
D6171
DMEM Powder Sigma-Aldrich, Poole,
UK
D5523
Foetal Calf Serum Gibco, Paisley, UK 16170-078
L-Glutamine Sigma-Aldrich, Poole,
UK
G-5763
MTT Kit Sigma-Aldrich, Poole,
UK
CGD1-1KT
Penicillin / Streptomycin Solution Sigma-Aldrich, Poole,
UK
P0781
Trypan Blue Sigma-Aldrich, Poole,
UK
T 8154
1X Trypsin-DMEM Gibco, Paisley, UK 25300-062
Bone Morphogenetic Protein 2
(BMP2) Heidelberg, Germany H00000650-P01
33
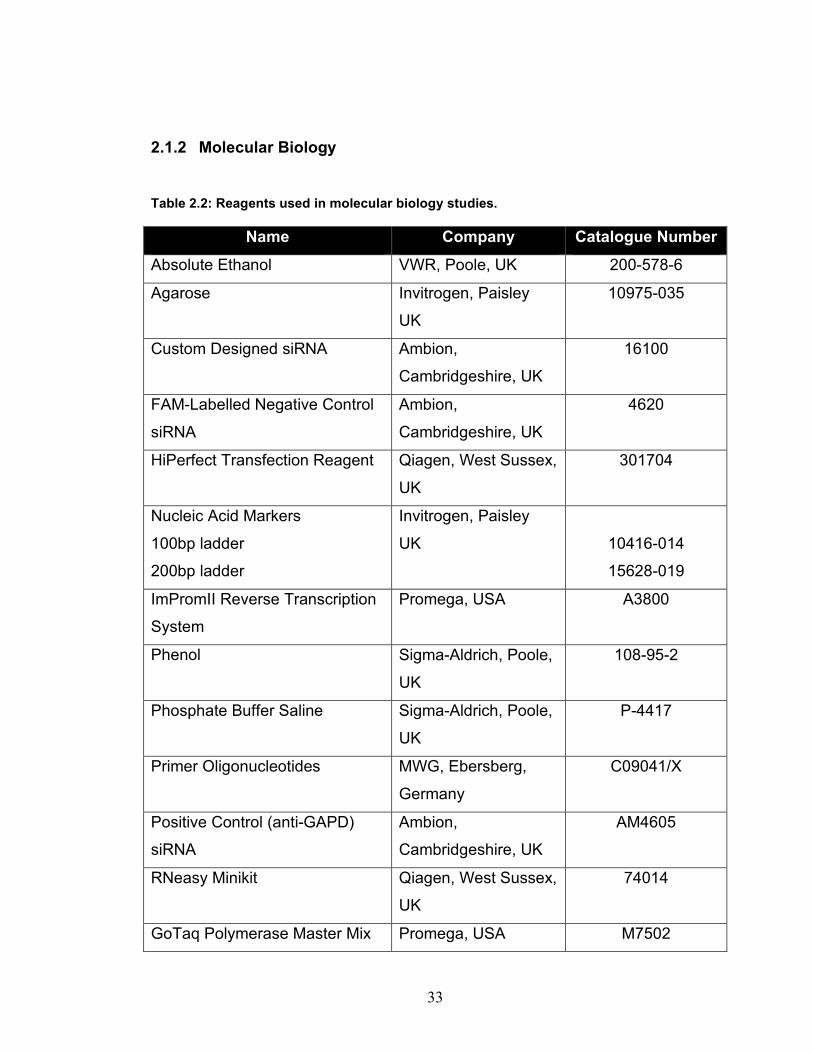
2.1.2 Molecular Biology
Table 2.2: Reagents used in molecular biology studies.
Name Company Catalogue Number
Absolute Ethanol VWR, Poole, UK 200-578-6
Agarose Invitrogen, Paisley
UK
10975-035
Custom Designed siRNA Ambion,
Cambridgeshire, UK
16100
FAM-Labelled Negative Control
siRNA
Ambion,
Cambridgeshire, UK
4620
HiPerfect Transfection Reagent Qiagen, West Sussex,
UK
301704
Nucleic Acid Markers
100bp ladder
200bp ladder
Invitrogen, Paisley
UK
10416-014
15628-019
ImPromII Reverse Transcription
System
Promega, USA A3800
Phenol Sigma-Aldrich, Poole,
UK
108-95-2
Phosphate Buffer Saline Sigma-Aldrich, Poole,
UK
P-4417
Primer Oligonucleotides MWG, Ebersberg,
Germany
C09041/X
Positive Control (anti-GAPD)
siRNA
Ambion,
Cambridgeshire, UK
AM4605
RNeasy Minikit Qiagen, West Sussex,
UK
74014
GoTaq Polymerase Master Mix Promega, USA M7502

34
2.1.3 Actin Cytoskeleton studies
Table 2.3: Reagents used to study the actin cytoskeleton.
Name Company Catalogue Number
Bovine Serum Albumin Sigma-Aldrich, Poole, UK 85041C
Paraformaldehyde Sigma-Aldrich, Poole, UK P6148
Phosphate Buffer Saline Sigma-Aldrich, Poole, UK P-4417
Triton X100 VWR, Poole, UK VW8887-4
2.1.4 Antibodies used in protein identification experiments
Table 2.4: Reagents used to study the actin cytoskeleton.
Name Company Catalogue Number
Rabbit anti-Akt New England Biolabs,
Hertfordshire, UK
2938
Rabbit anti-p-Akt New England Biolabs,
Hertfordshire, UK
3787
Mouse anti-DEL1
polyclonal
Stratech, Suffolk, UK P-4417
Goat anti-Rabbit, HRP
conjugated
New England Biolabs,
Hertfordshire, UK
7074
Goat anti-Mouse, HRP
conjugated
New England Biolabs,
Hertfordshire, UK
7059
Immobilon Western
Chemiluminescent HRP
Substrate
Millipore, Watford, UK WBKLS0500
Immobilin-P membrane Millipore, Watford, UK IPVH20200
35
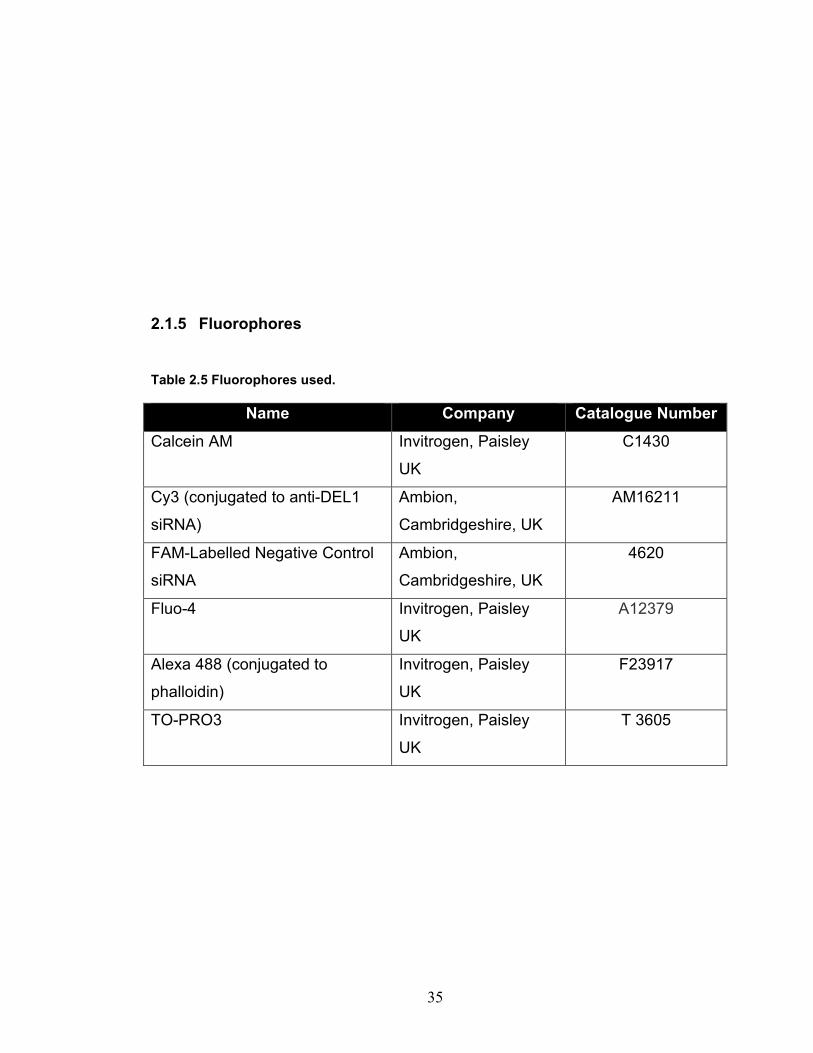
2.1.5 Fluorophores
Table 2.5 Fluorophores used.
Name Company Catalogue Number
Calcein AM Invitrogen, Paisley
UK
C1430
Cy3 (conjugated to anti-DEL1
siRNA)
Ambion,
Cambridgeshire, UK
AM16211
FAM-Labelled Negative Control
siRNA
Ambion,
Cambridgeshire, UK
4620
Fluo-4 Invitrogen, Paisley
UK
A12379
Alexa 488 (conjugated to
phalloidin)
Invitrogen, Paisley
UK
F23917
TO-PRO3 Invitrogen, Paisley
UK
T 3605
36
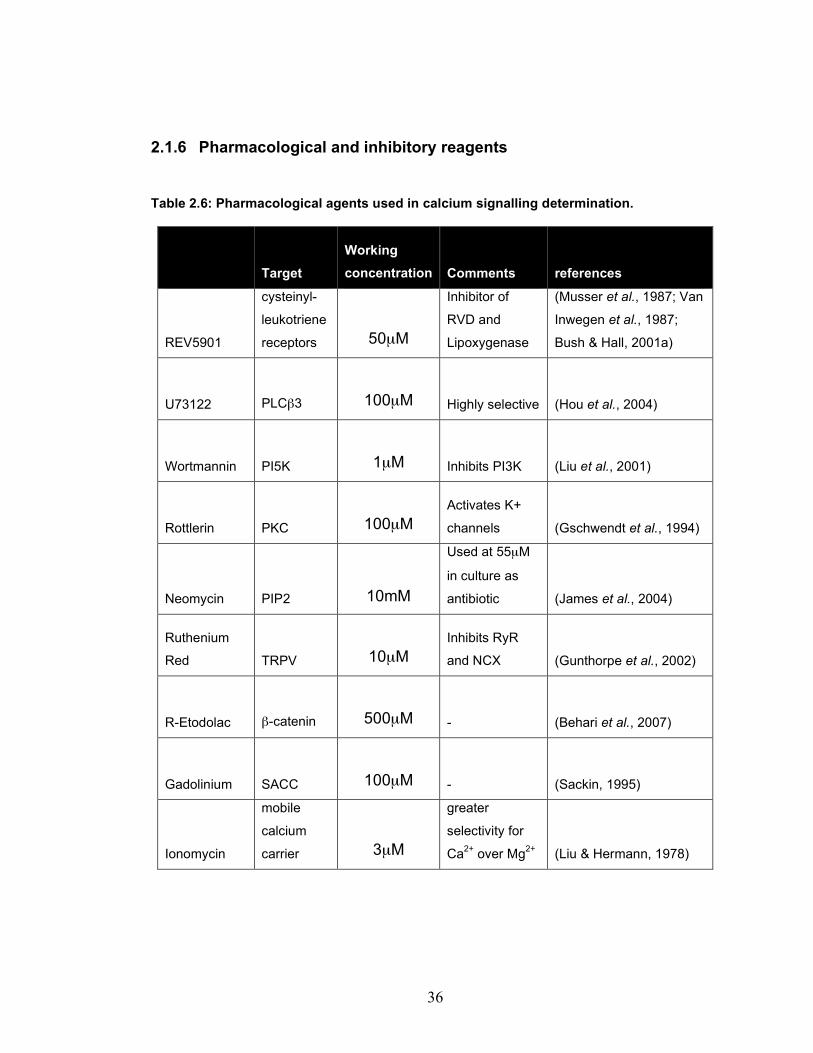
2.1.6 Pharmacological and inhibitory reagents
Table 2.6: Pharmacological agents used in calcium signalling determination.
Target Working concentration Comments references
REV5901
cysteinyl-
leukotriene
receptors 50µM
Inhibitor of
RVD and
Lipoxygenase
(Musser et al., 1987; Van
Inwegen et al., 1987;
Bush & Hall, 2001a)
U73122 PLCβ3 100µM Highly selective (Hou et al., 2004)
Wortmannin PI5K 1µM Inhibits PI3K (Liu et al., 2001)
Rottlerin PKC 100µM Activates K+
channels (Gschwendt et al., 1994)
Neomycin PIP2 10mM
Used at 55µM
in culture as
antibiotic (James et al., 2004)
Ruthenium
Red TRPV 10µM Inhibits RyR
and NCX (Gunthorpe et al., 2002)
R-Etodolac β-catenin 500µM - (Behari et al., 2007)
Gadolinium SACC 100µM - (Sackin, 1995)
Ionomycin
mobile
calcium
carrier 3µM
greater
selectivity for
Ca2+ over Mg2+ (Liu & Hermann, 1978)
37
2.2 Culture Media and Experimental Salines
The tissue culture media used was Dulbecco’s Modified Eagle Medium (DMEM;
Sigma) supplemented with 1% penicillin/streptomycin solution under asceptic
conditions. For work on freshly isolated chondrocytes, the osmolarity of DMEM
was adjusted to 380mOsm/kg H2O (mOsm) by the addition of filter-sterilised
50mM sodium chloride (NaCl). Media used for long term culture purposes
contained 1% penicillin/streptomycin solution, filter-sterilised 20mM L-Glutamine
(an essential amino acid; as instructed by manufacturer), 10% Foetal Calf
Serum (FCS), filter-sterilised 50µg/ml Ascorbic Acid (necessary for matrix
synthesis) and 50mM NaCl (necessary to adjust the osmolarity to 380 mOsm).
In experiments requiring the supplementation with Bone Morphogenetic Protein
2 (BMP2), 14-day 2D cultured chondrocytes were treated with 500ng/ml of
BMP2 for 7 days to allow phenotypic switch (Minina et al., 2001). For all volume
regulation experiments, a bottle of powder DMEM was dissolved in double
distilled water containing 15mM HEPES and the pH adjusted to 7.40±0.05. The
osmolarity was measured using Vapro™ vapour pressure osmometer and
adjusted using NaCl to 380±5mOsm and 700±5mOsm for Isomotic and
hyperosmotic media, respectively (Kerrigan et al., 2006).
As phenol red in media interferes with calcium measurement, experiments were
performed using basic physiological saline (BPS) containing (in mM); HEPES
(15), glucose (10), potassium chloride (KCl; 5), magnesium chloride (MgCl2; 1)
and calcium chloride (CaCl2; 1). The pH was adjusted to 7.40 ±0.05 and the
osmolarity measured using Vapro™ vapour pressure osmometer and adjusted
by the addition of NaCl. When performing calcium-free experiments, calcium
chloride was replaced with 2mM EGTA and when performing sodium-free
experiments, the osmolarity was adjusted by the addition of choline chloride
(Dascalu et al., 1996).
38
2.3 Chondrocyte isolation and culture
Bovine metacarpal and metatarsal joints of freshly slaughtered 18-21 month old
female animals were obtained from the local abattoir (with permission) and full-
depth cartilage isolated into 280mOsm DMEM supplemented with 1%
penicillin/streptomycin solution under aseptic conditions and chondrocytes
isolated as previously described (Hall et al., 1996). Cartilage explants were
incubated overnight in 380mOsm DMEM (to mimic the osmolarity of cartilage
and reduce the changes that may occur due to the osmolarity of the media)
supplemented with 1% penicillin/streptomycin solution and 0.8mg/mL
collagenase. The collagenase treatment resulted in the degradation of the ECM,
thereby releasing chondrocytes into the medium.
Following incubation for 18 hours, undigested material was removed by passing
the suspension through a sterile (autoclaved) tea strainer followed by a 40µm
sterile cell strainer and subsequently chondrocytes washed twice by
centrifugation at room temperature at 600g for 10 minutes. Finally the
supernatant was discarded, the pellet resuspended in 380mOsm DMEM and
chondrocyte cell suspension aliquoted onto appropriate substrate (6, 12 or 24-
well plates) and used within 2-8 hours.
Chondrocytes maintained in monolayer culture were resuspended in long-term
culture media (Section 2.2) and a 100µl sample was counted by mixing it with
100µl of trypan blue, loading the mixture onto a haemocytometer and observing
under a light microscope. In order to optimise the culture conditions,
chondrocytes were seeded and subcultured upon confluence for up to 21 days
at three different culture densities; High Density (HD; 2x10⁵ cell/cm2),
Intermediate Density (MD; 1x10⁵ cell/cm2) and Low Density (LD; 2x10⁴ cell/cm2)
39
in 25 or 75cm2 vented tissue culture flasks and incubated at 37°C in a 5%
carbon dioxide humidified incubator.
Upon reaching 80% confluence, chondrocytes from one flask were lifted and
split into several new flasks. Briefly, the supplemented media was removed and
chondrocytes incubated in 0.05% trypsin-EDTA solution (380mOsm/kg H2O) for
5-10 min at 37°C, thus inducing cell rounding and subsequent detachment from
the substrate as observed under a light microscope. The action of trypsin was
reduced by dilution in fresh culture media and cells were washed twice by
centrifugation at 600g for 10 minutes. Finally chondrocytes were resuspended in
fresh culture media, counted and re-seeded at the original cell density for further
culture or the use in required experimentation.
Chondrocytes were counted and assayed for viability at the end of every
passage using trypan blue staining and a growth curve constructed. A
logarithmic growth curve of Log cell number Log(N) was plotted against time in
days (t) and the regression line calculated:
!
N = N0" 2
G" t
Applying log to both sides of the equation, the doubling time was calculated from
the gradients of the equation of the best fit lines:
!
" log(N) = log(N0) +G # log(2) # t
The gradient of the equation of the line best fit was therefore the product of the
Growth rate (G) and log(2). The time needed for the cells to double in number,
doubling time, was calculated as the inverse of the growth rate (shown in
Section 3.2.1). LD was deemed most suitable and thus utilised for all further
culture experiments whereby chondrocytes were subcultured on days 9, 14 and
21 post seeding and termed P1, P2 and P3 chondrocytes, respectively.
The number of joints used in each experiment is denoted (N) and the number of
cells, where applicable, (n).
40
2.4 Expression Profiling of Expanded Chondrocytes
2.4.1 RNA extraction, Reverse transcription and Polymerase Chain Reaction (PCR)
The change in expression of key differentiation genes was studied by extracting
RNA from freshly isolated and 2D cultured chondrocytes at the end of each
passage and on days 2, 4, 6 and 8 of 2D culture using RNeasy Mini Kit
(Qiagen). Briefly, chondrocytes were treated with 0.05% Trypsin-EDTA for 5 min
at 37°C causing detachment from the substrate (plastic). The suspension was
diluted with culture media (DMEM; 380mOsm/kg) and chondrocytes washed
twice by centrifugation at 600g. Following the final centrifugation, the pellet was
lysed with RLT cell lysis buffer and 350 µl of the lysate mixed with 350µl of 70%
ethanol, loaded on an RNeasy column, subjected to centrifugation at 8,000g for
30 seconds, washed by centrifugation with SW1 and twice with RPL buffer and
RNA attached to the column subsequently eluted in 50µl nuclease-free water.
RNA was quantified by measuring the absorbance at 260nm using a
spectrophotometer (1 absorbance unit corresponds to 40µg/ml RNA; as
recommended by Qiagen) and 1µg of each sample was reverse-transcribed
using ImPromII Reverse Transcription (RT) System (Promega) as per
manufacturer’s instructions. 0.5µg PolyT and 0.5µg random primers were mixed
with 1µg of the RNA and 20u RNase inhibitor and heated to 70°C for 5 minutes
to allow denaturation of the RNA secondary structures. The mixture was then
quickly cooled on ice to allow the hybridisation of the primer oligonucleotides to
the RNA sequences. Upon incubation on ice, 0.5mM dNTP, 4µl reaction buffer
and 1µl reverse transcriptase were added to the primer-RNA solution and the
reaction proceeded at 42°C overnight in the presence of 5mM MgCl2 until
stopped by heat inactivation at 70°C for 15 minutes.

41
Primers used in the study were designed for mammalian genomic sequences
and thus deemed suitable for bovine material (Table 2.7). Published sequences
were used (Park et al., 2005) or novel sequences designed. Briefly, gene
sequences of bovine and human origin were obtained from the National Center
for Biotechnology Information (NCBI) website and aligned using clustalx
allignment tool to obtain conserved (consensus) sequence for which primers
were designed using primer3 online tools (Rozen & Skaletsky, 2000). All primers
were designed such that the PCR products had a product size of >50bp suitable
for visualisation on 2% agarose gels and a primer melting temperature of 58-
60°C. Selected primers were tested for specifity by running an online alignment
search using Basic Local Alignment Search Tool (BLAST) on the NCBI website.
Polymerase chain reaction (PCR) was used to assay the expression of key
genes during chondrocyte expansion. 2µl of the reverse transcriptase reaction
containing cDNA were used in the GoTaq® Green Master Mix containing 0.2µM
of each primer, and PCR cycles run as recommended by manufacturer’s
protocol (Table 2.8). The PCR products were loaded on 2% agarose gels
(suitable for the size of amplicons) made up in 1X Tris-Borate-EDTA (TBE)
Buffer and the gel subsequently subjected to a constant voltage of 150V for 2
hours prior to being stained with 1% Ethidium bromide in TBE buffer, washed in
distilled water and imaged using by video capture under UV excitation.
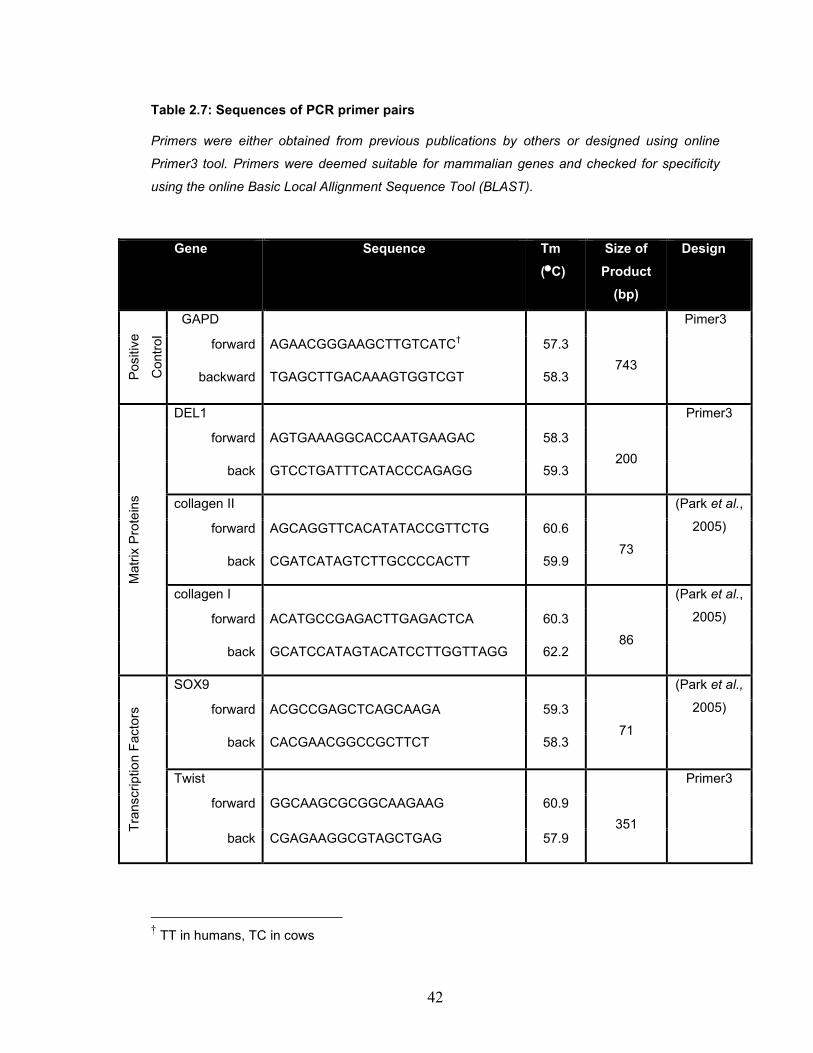
42
Table 2.7: Sequences of PCR primer pairs
Primers were either obtained from previous publications by others or designed using online
Primer3 tool. Primers were deemed suitable for mammalian genes and checked for specificity
using the online Basic Local Allignment Sequence Tool (BLAST).
Gene Sequence Tm (°C)
Size of Product
(bp)
Design
GAPD
forward AGAACGGGAAGCTTGTCATC† 57.3
Posi
tive
Con
trol
backward TGAGCTTGACAAAGTGGTCGT 58.3
743
Pimer3
DEL1
forward AGTGAAAGGCACCAATGAAGAC 58.3
back GTCCTGATTTCATACCCAGAGG 59.3
200
Primer3
collagen II
forward AGCAGGTTCACATATACCGTTCTG 60.6
back CGATCATAGTCTTGCCCCACTT 59.9
73
(Park et al.,
2005)
collagen I
forward ACATGCCGAGACTTGAGACTCA 60.3
Mat
rix P
rote
ins
back GCATCCATAGTACATCCTTGGTTAGG 62.2
86
(Park et al.,
2005)
SOX9
forward ACGCCGAGCTCAGCAAGA 59.3
back CACGAACGGCCGCTTCT 58.3
71
(Park et al.,
2005)
Twist
forward GGCAAGCGCGGCAAGAAG 60.9
Tran
scrip
tion
Fact
ors
back CGAGAAGGCGTAGCTGAG 57.9
351
Primer3
† TT in humans, TC in cows
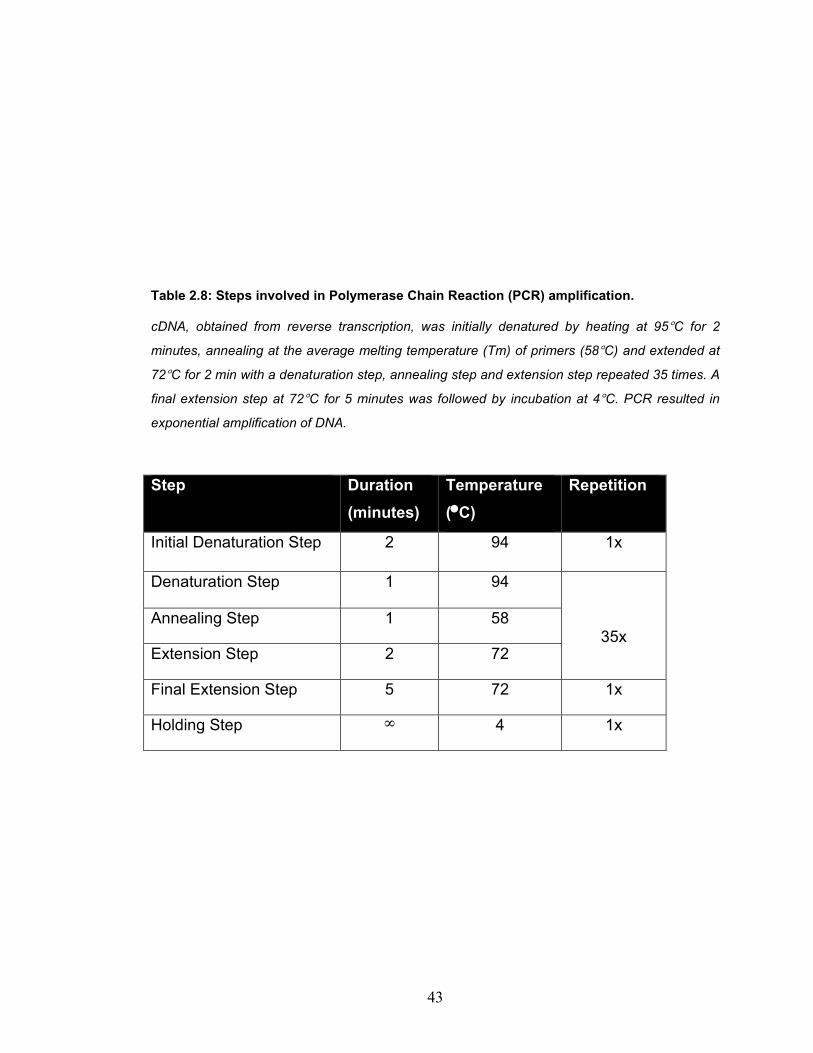
43
Table 2.8: Steps involved in Polymerase Chain Reaction (PCR) amplification.
cDNA, obtained from reverse transcription, was initially denatured by heating at 95°C for 2
minutes, annealing at the average melting temperature (Tm) of primers (58°C) and extended at
72°C for 2 min with a denaturation step, annealing step and extension step repeated 35 times. A
final extension step at 72°C for 5 minutes was followed by incubation at 4°C. PCR resulted in
exponential amplification of DNA.
Step Duration
(minutes) Temperature (°C)
Repetition
Initial Denaturation Step 2 94 1x
Denaturation Step 1 94
Annealing Step 1 58
Extension Step 2 72
35x
Final Extension Step 5 72 1x
Holding Step ∞ 4 1x
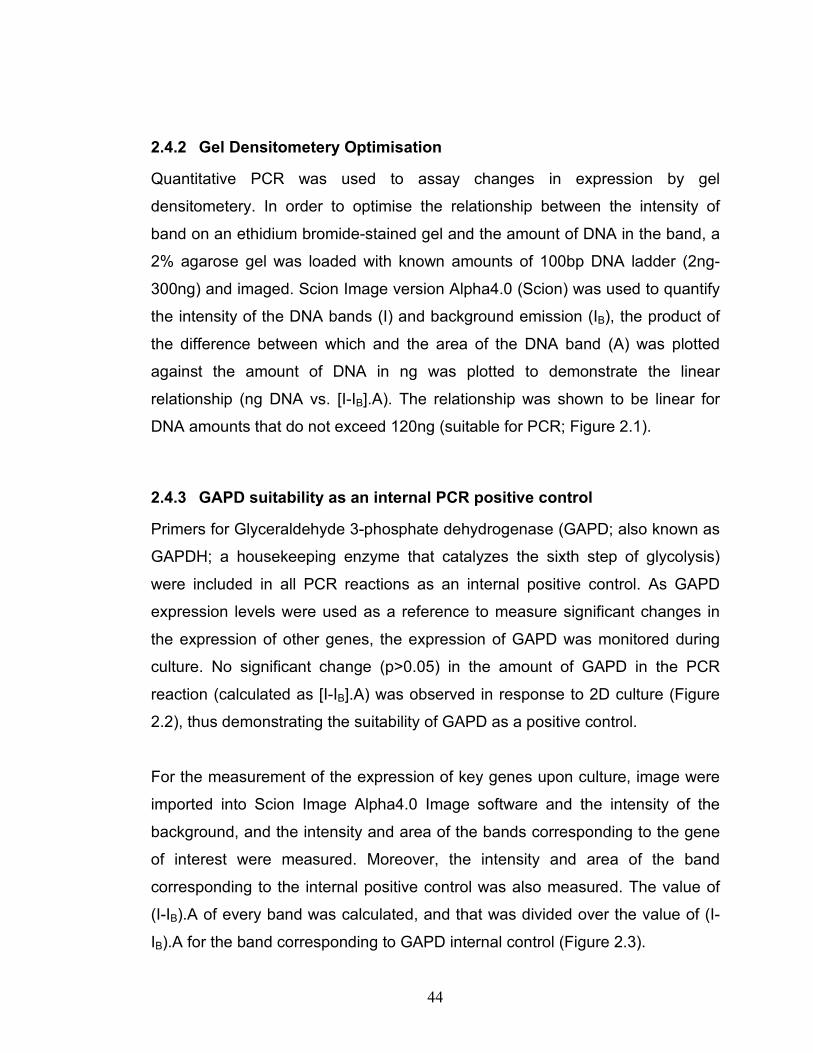
44
2.4.2 Gel Densitometery Optimisation
Quantitative PCR was used to assay changes in expression by gel
densitometery. In order to optimise the relationship between the intensity of
band on an ethidium bromide-stained gel and the amount of DNA in the band, a
2% agarose gel was loaded with known amounts of 100bp DNA ladder (2ng-
300ng) and imaged. Scion Image version Alpha4.0 (Scion) was used to quantify
the intensity of the DNA bands (I) and background emission (IB), the product of
the difference between which and the area of the DNA band (A) was plotted
against the amount of DNA in ng was plotted to demonstrate the linear
relationship (ng DNA vs. [I-IB].A). The relationship was shown to be linear for
DNA amounts that do not exceed 120ng (suitable for PCR; Figure 2.1).
2.4.3 GAPD suitability as an internal PCR positive control
Primers for Glyceraldehyde 3-phosphate dehydrogenase (GAPD; also known as
GAPDH; a housekeeping enzyme that catalyzes the sixth step of glycolysis)
were included in all PCR reactions as an internal positive control. As GAPD
expression levels were used as a reference to measure significant changes in
the expression of other genes, the expression of GAPD was monitored during
culture. No significant change (p>0.05) in the amount of GAPD in the PCR
reaction (calculated as [I-IB].A) was observed in response to 2D culture (Figure
2.2), thus demonstrating the suitability of GAPD as a positive control.
For the measurement of the expression of key genes upon culture, image were
imported into Scion Image Alpha4.0 Image software and the intensity of the
background, and the intensity and area of the bands corresponding to the gene
of interest were measured. Moreover, the intensity and area of the band
corresponding to the internal positive control was also measured. The value of
(I-IB).A of every band was calculated, and that was divided over the value of (I-
IB).A for the band corresponding to GAPD internal control (Figure 2.3).
45
Figure 2.1: The linear relationship between the band intensity and size vs. the amount of DNA present
Known amounts of DNA (2-150ng) was run on a 2% agarose gel and the band intensity and size
([I-IB].A) calculated by Scion Image Alpha4.0. The mean intensity of background was subtracted
from the mean intensity of the band and subsequently multiplied by the area of the band. This
product value was plotted against the amount of DNA in the band and the relationship was found
to be linear for amounts of DNA <120ng. Data was pooled from 6 individual experiments. Values
shown as mean ± s.e.m. R2 = 0.936.
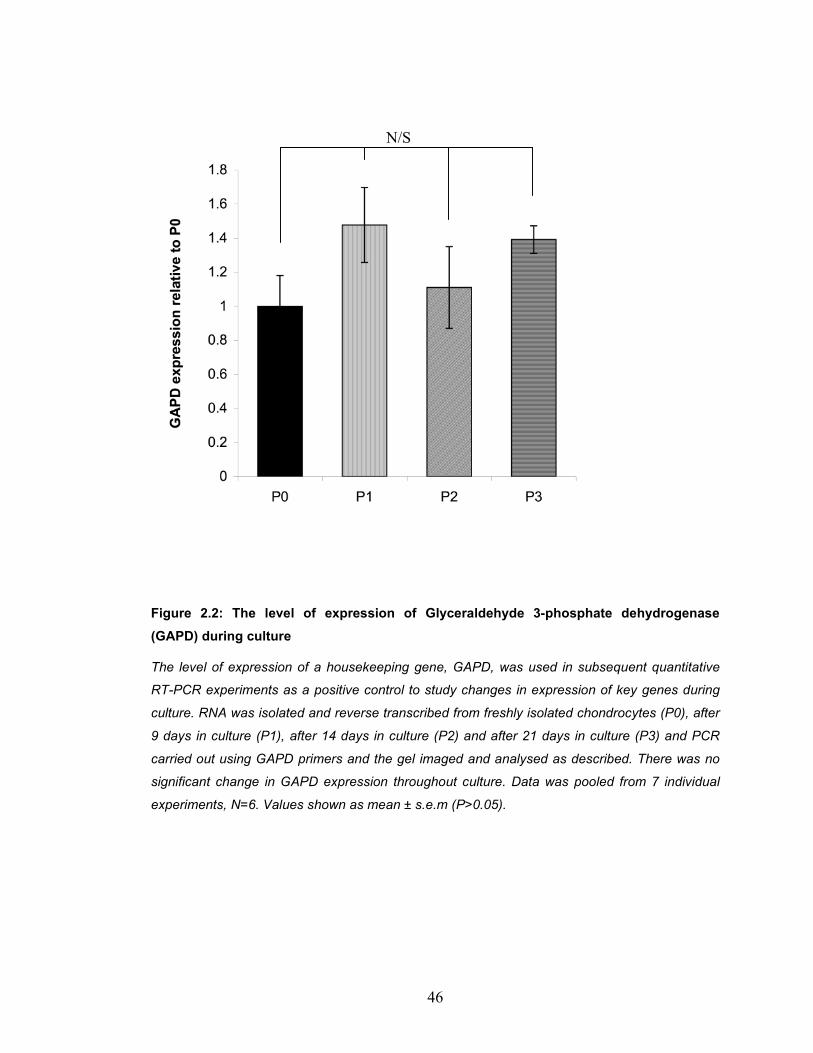
46
Figure 2.2: The level of expression of Glyceraldehyde 3-phosphate dehydrogenase (GAPD) during culture
The level of expression of a housekeeping gene, GAPD, was used in subsequent quantitative
RT-PCR experiments as a positive control to study changes in expression of key genes during
culture. RNA was isolated and reverse transcribed from freshly isolated chondrocytes (P0), after
9 days in culture (P1), after 14 days in culture (P2) and after 21 days in culture (P3) and PCR
carried out using GAPD primers and the gel imaged and analysed as described. There was no
significant change in GAPD expression throughout culture. Data was pooled from 7 individual
experiments, N=6. Values shown as mean ± s.e.m (P>0.05).
N/S
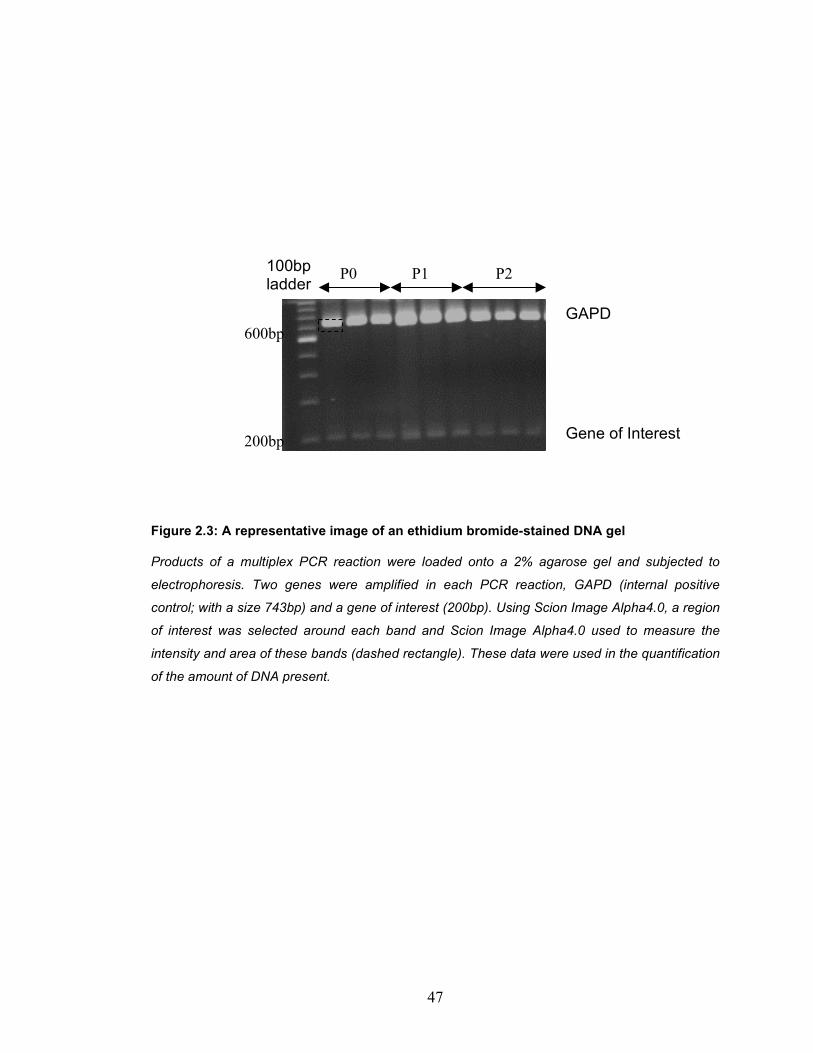
47
Figure 2.3: A representative image of an ethidium bromide-stained DNA gel
Products of a multiplex PCR reaction were loaded onto a 2% agarose gel and subjected to
electrophoresis. Two genes were amplified in each PCR reaction, GAPD (internal positive
control; with a size 743bp) and a gene of interest (200bp). Using Scion Image Alpha4.0, a region
of interest was selected around each band and Scion Image Alpha4.0 used to measure the
intensity and area of these bands (dashed rectangle). These data were used in the quantification
of the amount of DNA present.
P0 P1 P2
600bp
200bp
GAPD
Gene of Interest
100bp ladder
48
2.5 Confocal Microscopy
Images were acquired using a Leica SP2 TCS CLSM and Leica Software
version 2.61 as previously described (Kerrigan & Hall, 2005) using grey
resolution of 8 bit, pinhole radius of 1.00 Airy Unit to match to the diameter of
objective used, beam splitter 488/543/633, laser speed of 400 Hz and the
dipping lens HCX APO L U-V-1 63.0x 90 W.
The different fluorophores used in the experiments posessed different excitation
and emission properties (Table 2.9). For the 3D reconstruction of images of
chondrocytes for volume analysis, z-stack series of image slices were taken at
1µm intervals in depth whereas for localisation and actin experiments higher
resolution images were acquired using Nyquist settings that were deemed
suitable for deconvolution using Hygens 3.3 (SVI). Images were imported into
Hygens 3.3, the image properties entered and deconvolution performed using
default settings prior to reassembling the series using the Imaris version 6.3.1
(Bitplane).

49
Table 2.9: Fluorophores used in confocal microscopy for imaging and cell volume calculation.
Settings employed for image acquisition using Confocal Laser Scanning Microscope (CLSM)
depended on the fluorophores used and the complexity of the analysis ensued. Nyquist settings
were used for actin and small interfering RNA (siRNA) experiments, whereas lower resolution
images were required for volume and dimensional analysis.
Dye TO-PRO3
(1mM solution in DMSO)
FAM (conjugated to negative control siRNA)
Cy3 (conjugated to anti-DEL1 siRNA)
Alexa 488 (conjugated to phalloidin, 0.5µg/ml)
Calcein AM (1mg/ml solution in DMSO)
Settings Nyquist Settings Other
Maximum absorption (nm)
575nm 494nm 550nm 488nm 495nm
Maximum Emission
599nm 520nm 570nm 519nm 525nm / 512-
540nm
Light Source
He/Ne 633 Kr 568 He/Ne 633 He/Ne 633 Kr 568 / 25%
Laser Strength (%)
35% 73% 73% 25% 25%
Resolution
1024x1024 1024x1024 1024x1024 1024x1024 512x512
Line averaging
4
4
4
4
1
Use Cytoplasm
and nucleus
staining
(working
concentration
2µM)
Labelling of
negative
control
siRNA
Labelling of
oligonucleotid
e molecules
Labelling of
phalloidin and
subsequently
the actin
cytoskeleton
Volume
marker,
Measuring
cell volume
(working
concentration
25µM)
50
2.6 siRNA design
RNA interference (RNAi) is a novel molecular technique that is based on a
natural antiviral mechanism that involves interruption of gene expression at the
messenger RNA (mRNA) translation level (Wang & Metzlaff, 2005). Short (~21nt
long) double stranded (ds) sequences of small interfering RNA (siRNA)
employed in this technique bind to complementary sequences on the messenger
and recruit the RNA-induced silencing complex (RISC) to degrade the message
(Elbashir et al., 2001a; Figure 2.4). This results in a temporary knockdown of the
expression which can last for up to 72 hours. Being a very specific technique
when the target sequence is carefully designed, RNAi is gaining increasing
interest in molecular medicine as a gene therapy technique for knocking down
dominant mutated genes in hereditary diseases including retinitis pigmentosa
(Kiang et al., 2005) and viral sequences in infections including AIDS (Cullen,
2005). In chondrocytes, RNAi was used to study the role of various proteins
including SOX9 (Wenke et al., 2009), p16 (Zhou et al., 2004) and NKCC1
(Qusous et al., in press).
Nevertheless, RNAi, like other similar techniques of gene therapy, still faces
several drawbacks. Designing a suitable vector, which protects siRNA from the
action of nucleases and delivers high concentrations to particular tissues, is still
a hurdle. Moreover, unlike gene knockout, RNAi has a transient effect which
does not possess the potential to cure permanent or chronic diseases. This
requires construction of new vectors that integrate DNA sequences encoding
siRNA into the host genome (Bridge et al., 2003; Lee et al., 2003b; Tomar et al.,
2003), carrying the risk of causing insertional mutations that may lead to
neoplasia. Finally, siRNA can instigate a non-specific cytokine response that
involves inflammation and cell apoptosis in a mechanism similar to that triggered
by a viral infection (Bridge et al., 2003).
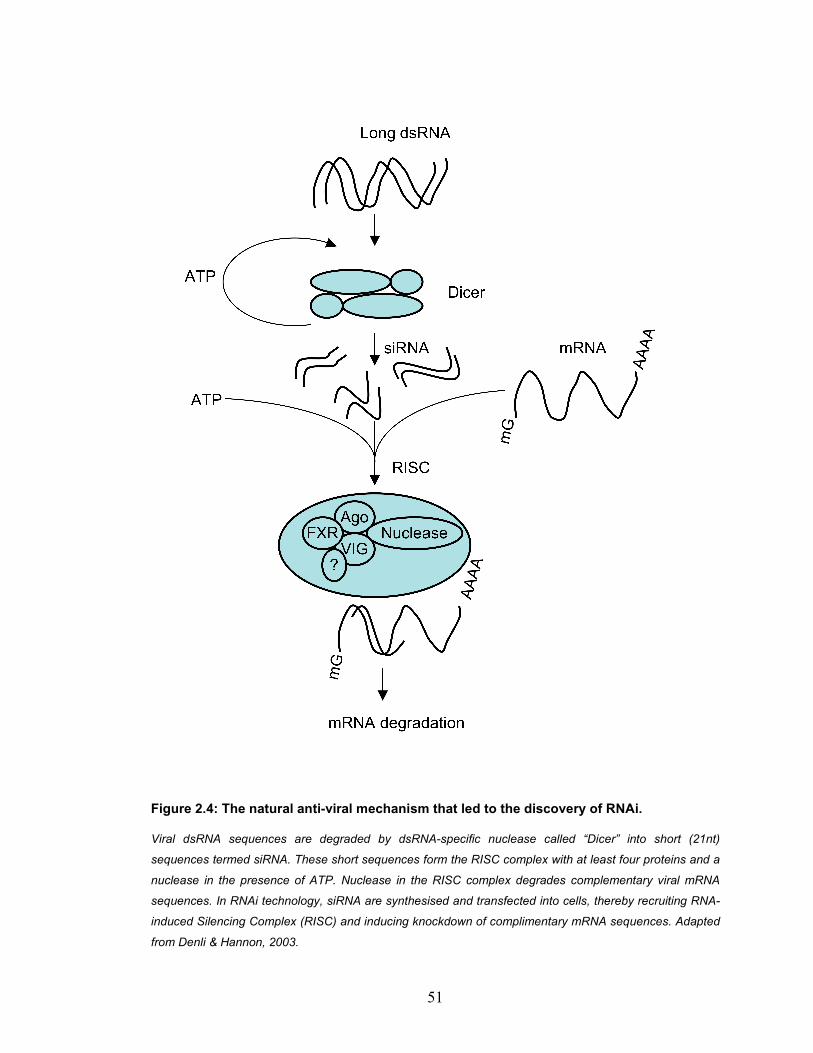
51
Figure 2.4: The natural anti-viral mechanism that led to the discovery of RNAi.
Viral dsRNA sequences are degraded by dsRNA-specific nuclease called “Dicer” into short (21nt)
sequences termed siRNA. These short sequences form the RISC complex with at least four proteins and a
nuclease in the presence of ATP. Nuclease in the RISC complex degrades complementary viral mRNA
sequences. In RNAi technology, siRNA are synthesised and transfected into cells, thereby recruiting RNA-
induced Silencing Complex (RISC) and inducing knockdown of complimentary mRNA sequences. Adapted
from Denli & Hannon, 2003.
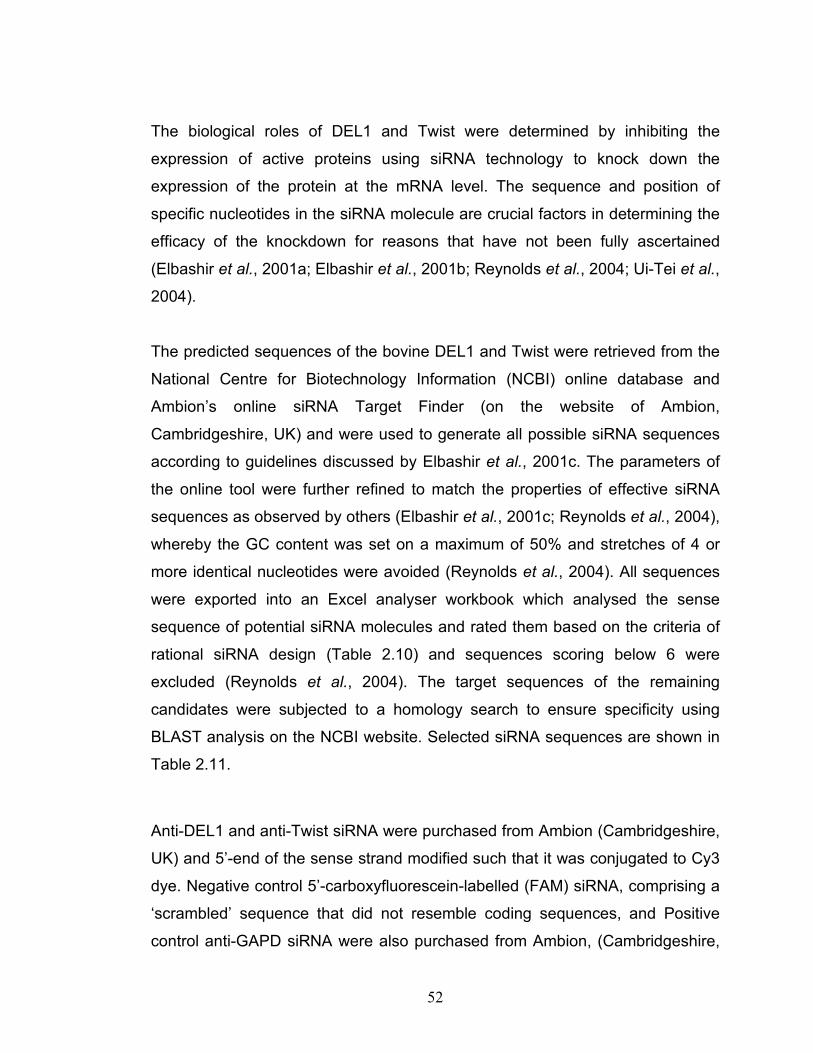
52
The biological roles of DEL1 and Twist were determined by inhibiting the
expression of active proteins using siRNA technology to knock down the
expression of the protein at the mRNA level. The sequence and position of
specific nucleotides in the siRNA molecule are crucial factors in determining the
efficacy of the knockdown for reasons that have not been fully ascertained
(Elbashir et al., 2001a; Elbashir et al., 2001b; Reynolds et al., 2004; Ui-Tei et al.,
2004).
The predicted sequences of the bovine DEL1 and Twist were retrieved from the
National Centre for Biotechnology Information (NCBI) online database and
Ambion’s online siRNA Target Finder (on the website of Ambion,
Cambridgeshire, UK) and were used to generate all possible siRNA sequences
according to guidelines discussed by Elbashir et al., 2001c. The parameters of
the online tool were further refined to match the properties of effective siRNA
sequences as observed by others (Elbashir et al., 2001c; Reynolds et al., 2004),
whereby the GC content was set on a maximum of 50% and stretches of 4 or
more identical nucleotides were avoided (Reynolds et al., 2004). All sequences
were exported into an Excel analyser workbook which analysed the sense
sequence of potential siRNA molecules and rated them based on the criteria of
rational siRNA design (Table 2.10) and sequences scoring below 6 were
excluded (Reynolds et al., 2004). The target sequences of the remaining
candidates were subjected to a homology search to ensure specificity using
BLAST analysis on the NCBI website. Selected siRNA sequences are shown in
Table 2.11.
Anti-DEL1 and anti-Twist siRNA were purchased from Ambion (Cambridgeshire,
UK) and 5’-end of the sense strand modified such that it was conjugated to Cy3
dye. Negative control 5’-carboxyfluorescein-labelled (FAM) siRNA, comprising a
‘scrambled’ sequence that did not resemble coding sequences, and Positive
control anti-GAPD siRNA were also purchased from Ambion, (Cambridgeshire,

53
UK). Negative control siRNA was used in experiments to determine localisation
of siRNA molecules whereas anti-GAPD positive control siRNA was used to
determine transfection efficiency by inducing cell death.
Table 2.10: Criteria of the rational siRNA design.
siRNA sequences possessing the properties of rational siRNA design induce efficient
knockdown. Sequences generated by Ambion online tool have appropriate GC content and no
internal repeats. An Excel analyser was created to rate sense sequences according to the
criteria above whereby sequences scoring below 6 were excluded (Reynolds et al., 2004).
Description Score
Moderate to low (30%-52%) GC Content 1 point
At least 3 A/Us at positions 15-19 1 point each
A at position 19 1 point
A at position 3 1 point
U at position 10 1 point
G/C at position 19 -1 point
G at position 13 -1 point
54
Table 2.11: Sequences of siRNA sequences used in knockdown experiments.
The sequences of siRNA molecules were designed according to parameters previously
described by others. Target sequences possessed a low GC content and no stretches of of 4 or
more identical nucleotides prior to being rated according to the rational siRNA design criteria.
The specificity of chosen target sequences was ensured by performing an online homology
search.
Ant
i-D
EL1
Target sequence 5’- AATCGGCTTATTTGTTTATTT
Sense strand 5’- UCGGCUUAUUUGUUUAUUUUU
Antisense strand 5’- AAAUAAACAAAUAAGCCGAUU
Ant
i-Tw
ist
Target Sequence 5’-AAGAACACCTTTAGAAATAAA
Sense strand 5’- GAACACCUUUAGAAAUAAAUU
Antisense strand 5’ UUUAUUUCUAAAGGUGUUCUU
55
2.7 siRNA and transfection
2.7.1 Optimisation of MTT viability assay
3-(4,5-Dimethylthiazol-2-yl)-2,5-diphenyltetrazolium bromide (MTT) was used as
a viability assay to study anti-GAPD siRNA transfection efficiency, whereby
MTT, yellow in colour, is reduced to purple formazan in the mitochondria of living
(non transfected) chondrocytes.
Firstly and to confirm the linear relationship between the number of cells and the
absorbance of reduced MTT, 0.1x volume of MTT solution (5mg/ml in RPMI
media) was added to the culture media and chondrocytes seeded at different
desnsities (0-1x10⁵cells/cm2) and incubated for three hours at 37°C.
Subsequetly, media were aspirated and reduced MTT crystals dissolved in
equal volume of MTT solvent, dimethyl sulfoxide (DMSO). The absorbance of
the solution was measured at 570nm and the background at 690nm and the
difference found to be directly proportional to the number of cells catalysing the
reduction of MTT (Figure 2.5).
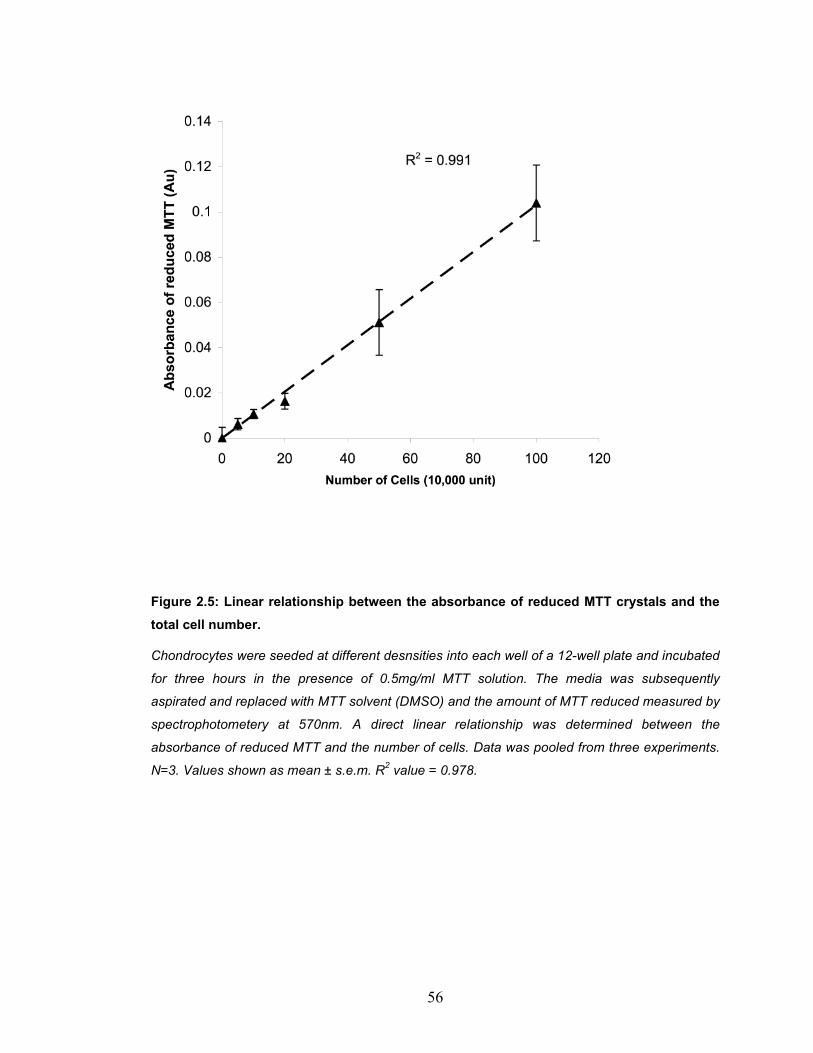
56
Figure 2.5: Linear relationship between the absorbance of reduced MTT crystals and the total cell number.
Chondrocytes were seeded at different desnsities into each well of a 12-well plate and incubated
for three hours in the presence of 0.5mg/ml MTT solution. The media was subsequently
aspirated and replaced with MTT solvent (DMSO) and the amount of MTT reduced measured by
spectrophotometery at 570nm. A direct linear relationship was determined between the
absorbance of reduced MTT and the number of cells. Data was pooled from three experiments.
N=3. Values shown as mean ± s.e.m. R2 value = 0.978.
57
2.7.2 Transfection and transfection efficiency quantification
Anti-GAPD siRNA inhibited the inability to produce ATP and inducing cellular
death. The efficiency of the transfection was assayed after 48h as
recommended by the manufacturer by measuring anti-GAPD siRNA-induced cell
death using MTT viability test performed according to manufacturer’s protocol
(Sigma-Aldrich).
Freshly isolated and 2D cultured chondrocytes were assayed for transfection
using HiPerfect Transfection reagent (primarily used for cell line; Qiagen)
according to manufacturer’s protocol by mixing different concentrations of
positive control anti-GAPD siRNA (1, 5 or 10nM) with different amounts of the
transfection reagent (3, 6 or 9µl/ml) in serum-free media and allowing
complexes to form for 5 minutes at room temperature. Chondrocytes were
seeded onto a 12-well plates at LD culture density (2x10⁴cells/cm2) and
transfected in suspension by dropwise loading of siRNA-HiPerfect complexes.
Chondrocytes were incubated for 48 hours at 37°C in a humidified incubator
prior to measurement of anti-GAPD siRNA-induced cell death using MTT assay.
0.1x volume of 5mg/ml MTT solution was added to the culture and chondrocytes
incubated for 3 hours at 37°C prior to the removal of media containing excess
MTT and the dissolution of formazan in DMSO and the measurement of
absorbance at 570nm and 690nm.
Optimum transfection conditions were highly dependent on the phenotypic state
of chondrocytes and therefore passage number. Although HiPerfect is
recommended for the use with cell lines, satisfactory transfection efficiencies
were obtained with freshly isolated chondrocytes optimally transfected with
10nM siRNA and 3µl/ml of HiPerfect and yielding 63.73±6.86% transfection
efficiency (Figure 2.6). Upon 2D culture, however, significant differences in
58
transfection efficiencies were observed under similar conditions (Figure 2.7-
Figure 2.8). Optimum transfection efficiencies were achieved with 10nM siRNA
and 9µl/ml HiPerfect for P1 (71.38±4.24%), whereas no significant differences
were observed in P2 chondrocytes with different complex combinations (1nM
siRNA and 3µl/ml HiPerfect; 61.91±4.35%). Due to the high cost of the
transfection reagent and the positive control siRNA, transfection efficiency
experiments were performed once for every passage.
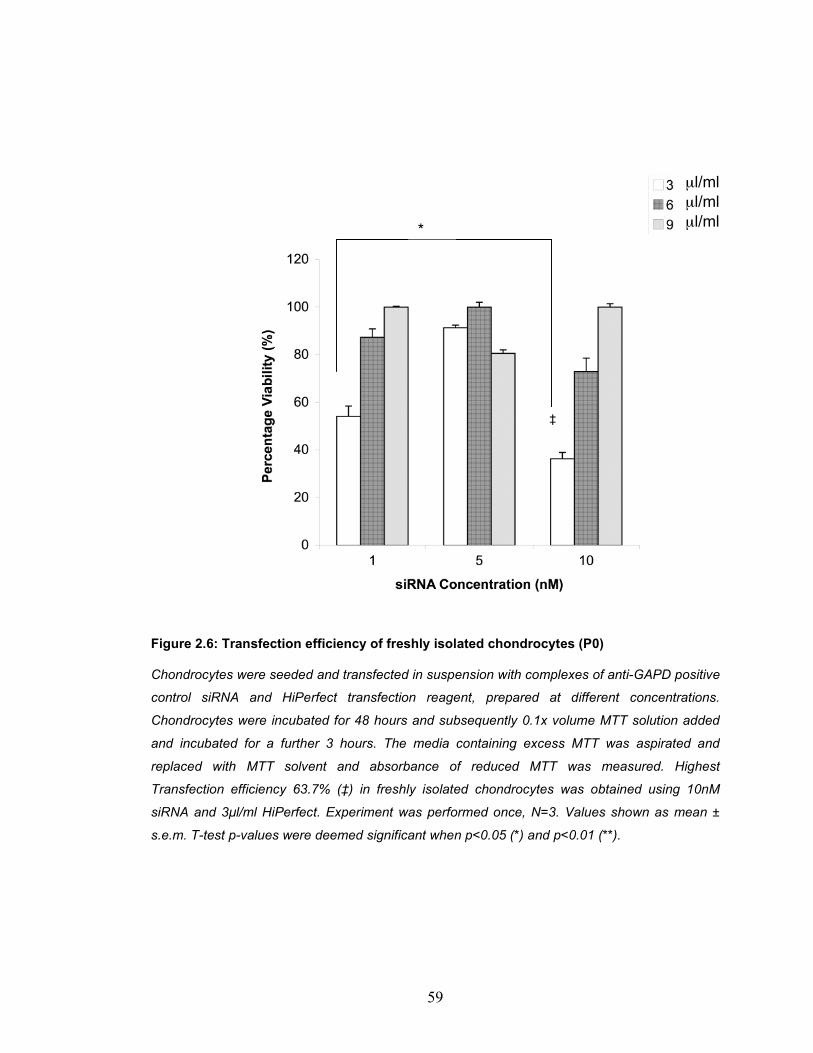
59
Figure 2.6: Transfection efficiency of freshly isolated chondrocytes (P0)
Chondrocytes were seeded and transfected in suspension with complexes of anti-GAPD positive
control siRNA and HiPerfect transfection reagent, prepared at different concentrations.
Chondrocytes were incubated for 48 hours and subsequently 0.1x volume MTT solution added
and incubated for a further 3 hours. The media containing excess MTT was aspirated and
replaced with MTT solvent and absorbance of reduced MTT was measured. Highest
Transfection efficiency 63.7% (‡) in freshly isolated chondrocytes was obtained using 10nM
siRNA and 3µl/ml HiPerfect. Experiment was performed once, N=3. Values shown as mean ±
s.e.m. T-test p-values were deemed significant when p<0.05 (*) and p<0.01 (**).
*
‡
µl/ml µl/ml µl/ml
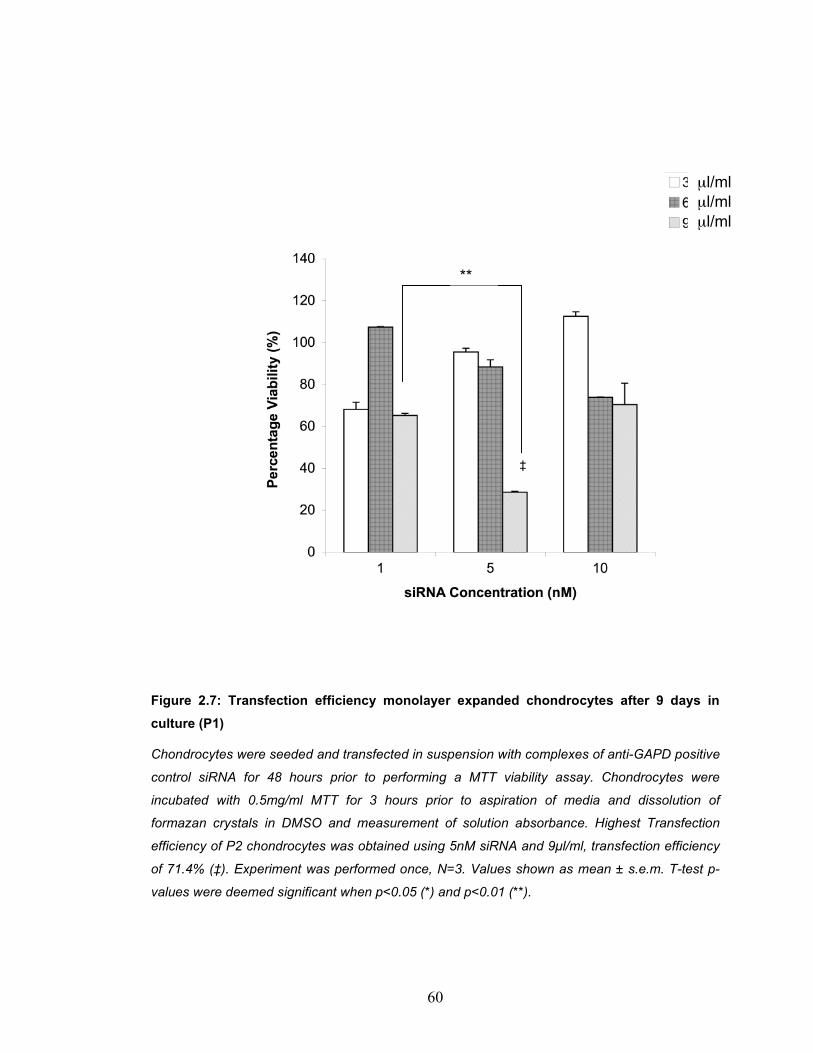
60
Figure 2.7: Transfection efficiency monolayer expanded chondrocytes after 9 days in culture (P1)
Chondrocytes were seeded and transfected in suspension with complexes of anti-GAPD positive
control siRNA for 48 hours prior to performing a MTT viability assay. Chondrocytes were
incubated with 0.5mg/ml MTT for 3 hours prior to aspiration of media and dissolution of
formazan crystals in DMSO and measurement of solution absorbance. Highest Transfection
efficiency of P2 chondrocytes was obtained using 5nM siRNA and 9µl/ml, transfection efficiency
of 71.4% (‡). Experiment was performed once, N=3. Values shown as mean ± s.e.m. T-test p-
values were deemed significant when p<0.05 (*) and p<0.01 (**).
**
‡
µl/ml µl/ml µl/ml
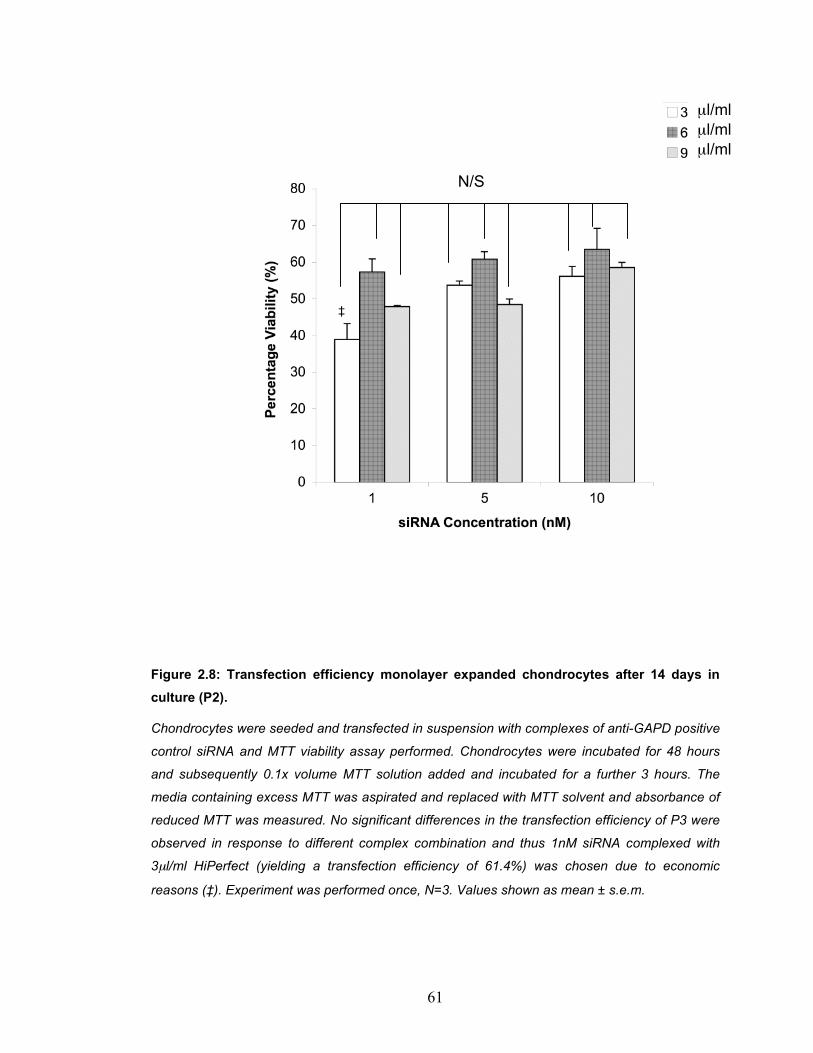
61
Figure 2.8: Transfection efficiency monolayer expanded chondrocytes after 14 days in culture (P2).
Chondrocytes were seeded and transfected in suspension with complexes of anti-GAPD positive
control siRNA and MTT viability assay performed. Chondrocytes were incubated for 48 hours
and subsequently 0.1x volume MTT solution added and incubated for a further 3 hours. The
media containing excess MTT was aspirated and replaced with MTT solvent and absorbance of
reduced MTT was measured. No significant differences in the transfection efficiency of P3 were
observed in response to different complex combination and thus 1nM siRNA complexed with
3µl/ml HiPerfect (yielding a transfection efficiency of 61.4%) was chosen due to economic
reasons (‡). Experiment was performed once, N=3. Values shown as mean ± s.e.m.
‡
N/S
µl/ml µl/ml µl/ml
62
2.7.3 Uptake and localisation of siRNA
The uptake and localisation of the siRNA molecules was also confirmed by
confocal microscopy using FAM-labelled negative control siRNA molecules
transfected using the optimum conditions obtained from the GAPD-transfection
and MTT assay. Chondrocytes were transfected in suspension and incubated
for 48 hour prior to being fixed using ice-cold 3% formaldehyde for 20 minutes at
37°C, washed three times in ice-cold PBS to remove formaldehyde and then
quenched for 10 minutes in ice-cold 50mM NH4Cl. Chondrocytes were
permeabilised using 0.1% Triton X100 in PBS for 5 minutes and then dipped in
100mM Glycine to stop the permeabilisation followed by washing three times in
ice-cold PBS and incubation with 2µM TO-PRO3 for 45 minutes at room
temperature. After the incubation period, chondrocytes were washed three times
with ice-cold PBS and visualised using Confocal Laser Scaning Microscopy
(CLSM). siRNA molecules were observed to be peri-nuclearly localised as
described by the manufacturer (Figure 2.9).
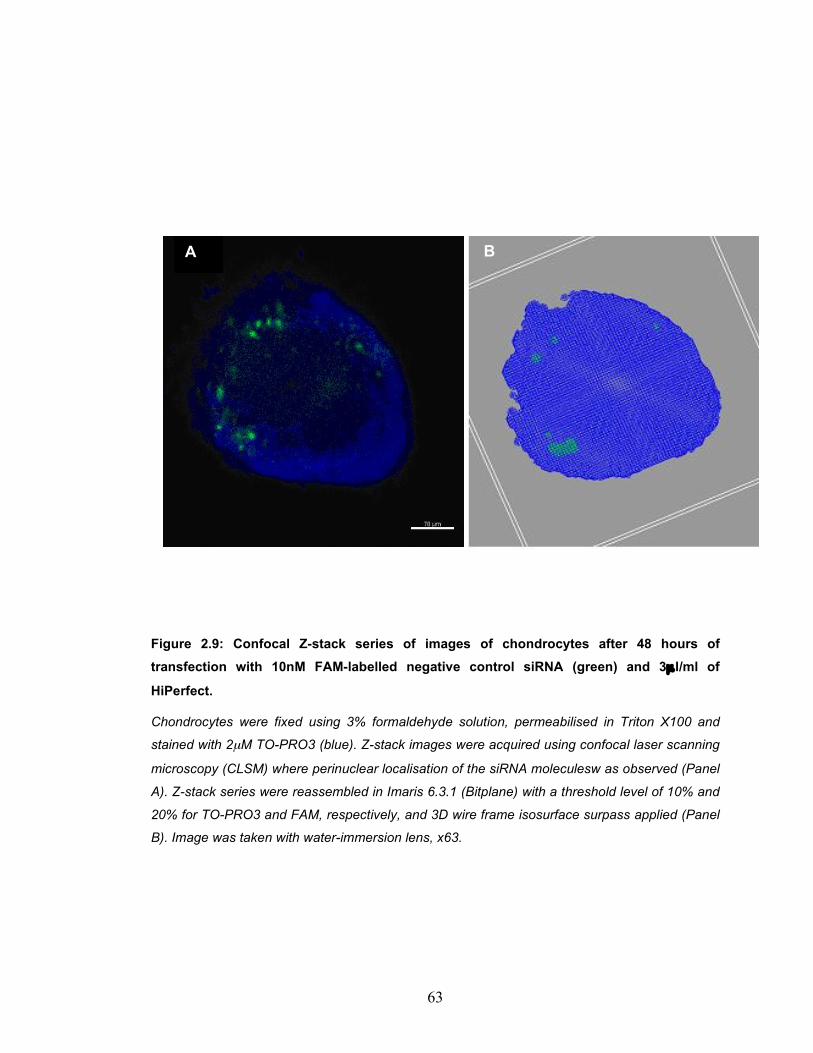
63
Figure 2.9: Confocal Z-stack series of images of chondrocytes after 48 hours of transfection with 10nM FAM-labelled negative control siRNA (green) and 3µ l/ml of
HiPerfect.
Chondrocytes were fixed using 3% formaldehyde solution, permeabilised in Triton X100 and
stained with 2µM TO-PRO3 (blue). Z-stack images were acquired using confocal laser scanning
microscopy (CLSM) where perinuclear localisation of the siRNA moleculesw as observed (Panel
A). Z-stack series were reassembled in Imaris 6.3.1 (Bitplane) with a threshold level of 10% and
20% for TO-PRO3 and FAM, respectively, and 3D wire frame isosurface surpass applied (Panel
B). Image was taken with water-immersion lens, x63.
A B

64
2.8 Actin organisation
For actin labelling, chondrocytes were fixed using ice-cold 3% formaldehyde for
20 minutes at 37°C, washed three times in ice-cold PBS to remove excess
formaldehyde and then quenched for 10 minutes in ice-cold 50mM NH4Cl.
Chondrocytes were subsequently permeabilised using 0.1% Triton X100 in PBS
for 5 minutes and then dipped in 100mM Glycine to stop permeabilisation prior
to being washed three times in ice-cold PBS and then labelled with Alexa 488-
phalloidin in the dark for 45 minutes. After the incubation period, chondrocytes
were washed three times with ice-cold PBS and z-stack images (series) of
chondrocytes were acquired using confocal laser scanning microscopy and
Nyquist settings.
Images of actin cystoskeleton were imported into Hygens 3.3 (SVI; Hilversum,
The Netherlands) and deconvolved using default settings, imported into Imaris
6.3.1 (Biplane; Zurich, Switzerland) where images were created. The organ-
isation of the actin cytoskeleton was studied using ImagePro 7.0 (Media
Cybernetics; Maryland, USA) and fluorescence intensity determined using
Linear Profiling across the cell diameter. The fluorescence profiling of individual
chondrocytes was plotted against standardised cell diameter (%) and
transcellular peaks in fluorescence corresponded to individual actin structures
termed ‘striation units’ (StU), the count of which providing a representation of the
number of filaments within the cellular body (Figure 2.10).
Mean of fluorescence of chondrocytes within the same passage was calculated
and plotted against 10% increments in standardised cell diameter, and the first
and last peaks in fluorescence (observed between 0-20% and 80-100%
standardised cell diameter, respectively) were deemed cortical actin
condensations. Binomial best fit curves for the mean cortical actin fluorescence
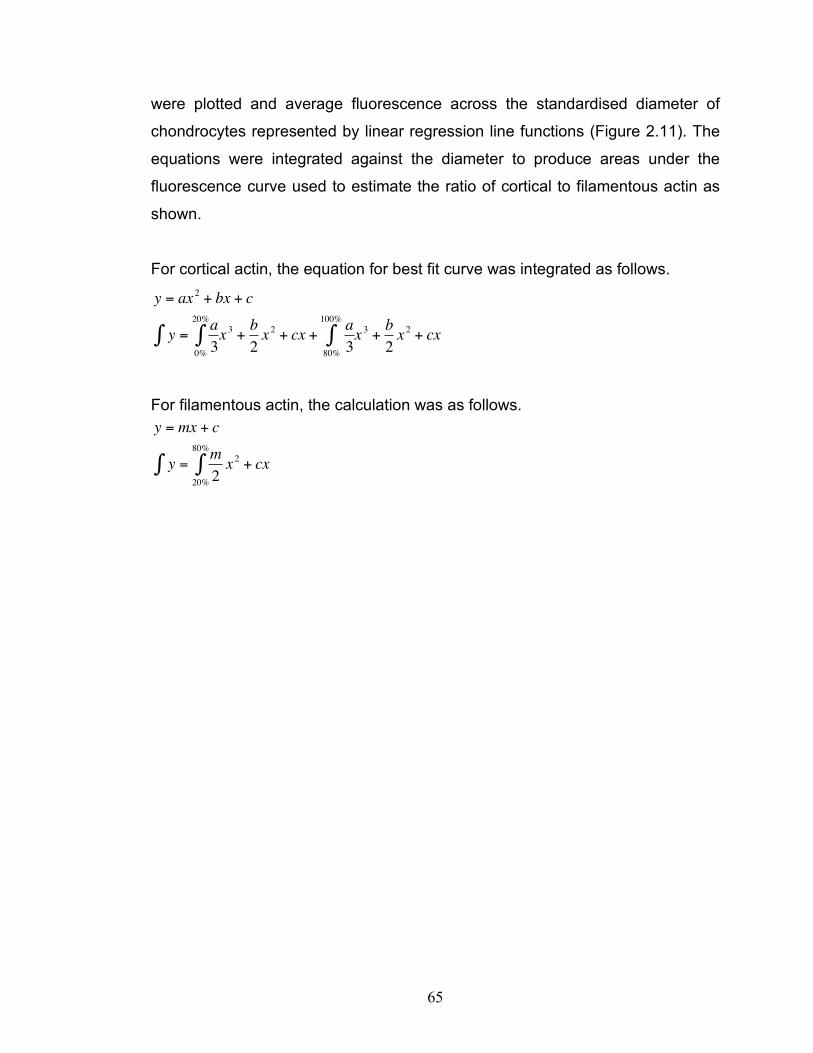
65
were plotted and average fluorescence across the standardised diameter of
chondrocytes represented by linear regression line functions (Figure 2.11). The
equations were integrated against the diameter to produce areas under the
fluorescence curve used to estimate the ratio of cortical to filamentous actin as
shown.
For cortical actin, the equation for best fit curve was integrated as follows.
!
y = ax2
+ bx + c
y" =a
30%
20%
" x3
+b
2x2
+ cx +a
380%
100%
" x3
+b
2x2
+ cx
For filamentous actin, the calculation was as follows.
!
y = mx + c
y" =m
2x2
+ cx20%
80%
"
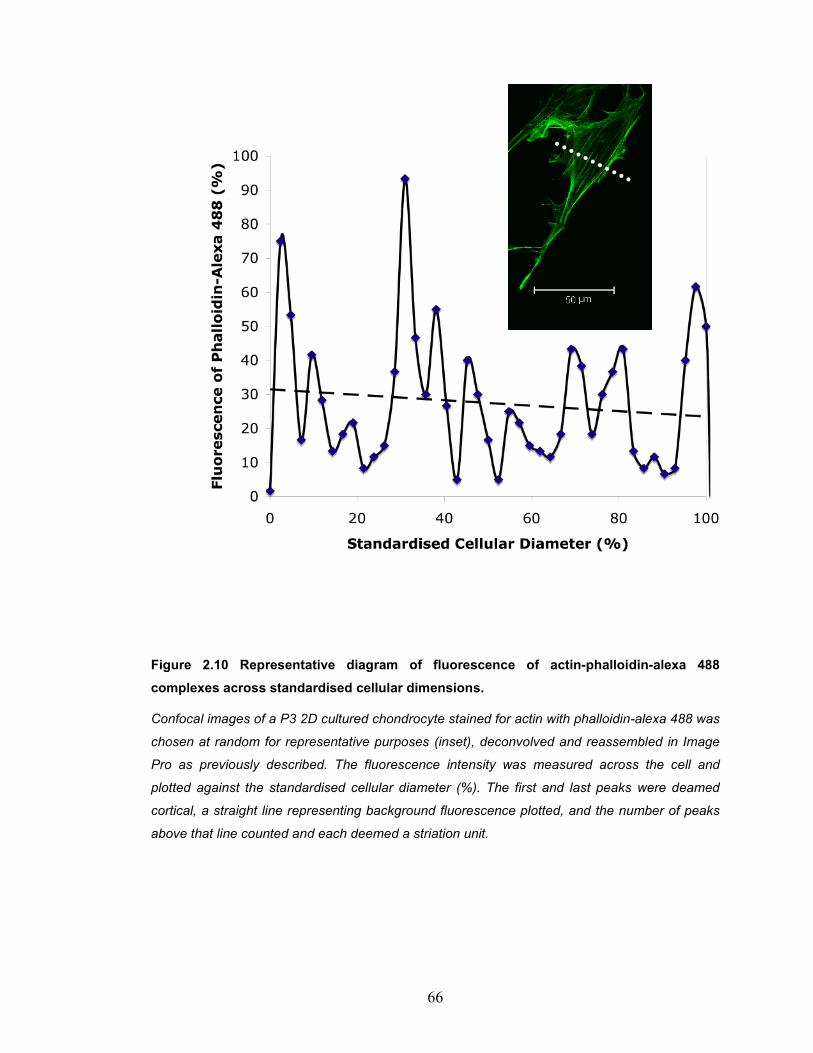
66
Figure 2.10 Representative diagram of fluorescence of actin-phalloidin-alexa 488 complexes across standardised cellular dimensions.
Confocal images of a P3 2D cultured chondrocyte stained for actin with phalloidin-alexa 488 was
chosen at random for representative purposes (inset), deconvolved and reassembled in Image
Pro as previously described. The fluorescence intensity was measured across the cell and
plotted against the standardised cellular diameter (%). The first and last peaks were deamed
cortical, a straight line representing background fluorescence plotted, and the number of peaks
above that line counted and each deemed a striation unit.

67
Figure 2.11: Representative mean fluorescence of phalloidin-alexa 488 across standardised cell diameter 2D cultured chondrocytes.
P3 chondrocytes chosen for illustrative purposes whereby chondrocytes were fixed and stained
with phalloidin-alexa488 to detect the organisation of the actin cytoskeleton. Images were
analysed using ImagePro to produce actin fluorescence against standardised cell diameter of P3
chondrocytes (Panel A). These data were used to plot a best fit binomial function representing
the first and last peaks (cortical) and a best fit line for the remaining peaks (filamentous actin).
The equations of the graphs were integrated to mathematically calculate the areas under the
cortical and filamentous parts of the plot and consequently the ratio of cortical and filamentous
actin (representation in Panel B). N=4, n=36. Data shown as mean ± s.e.m.
A
B
Filamentous
corti
cal
corti
cal
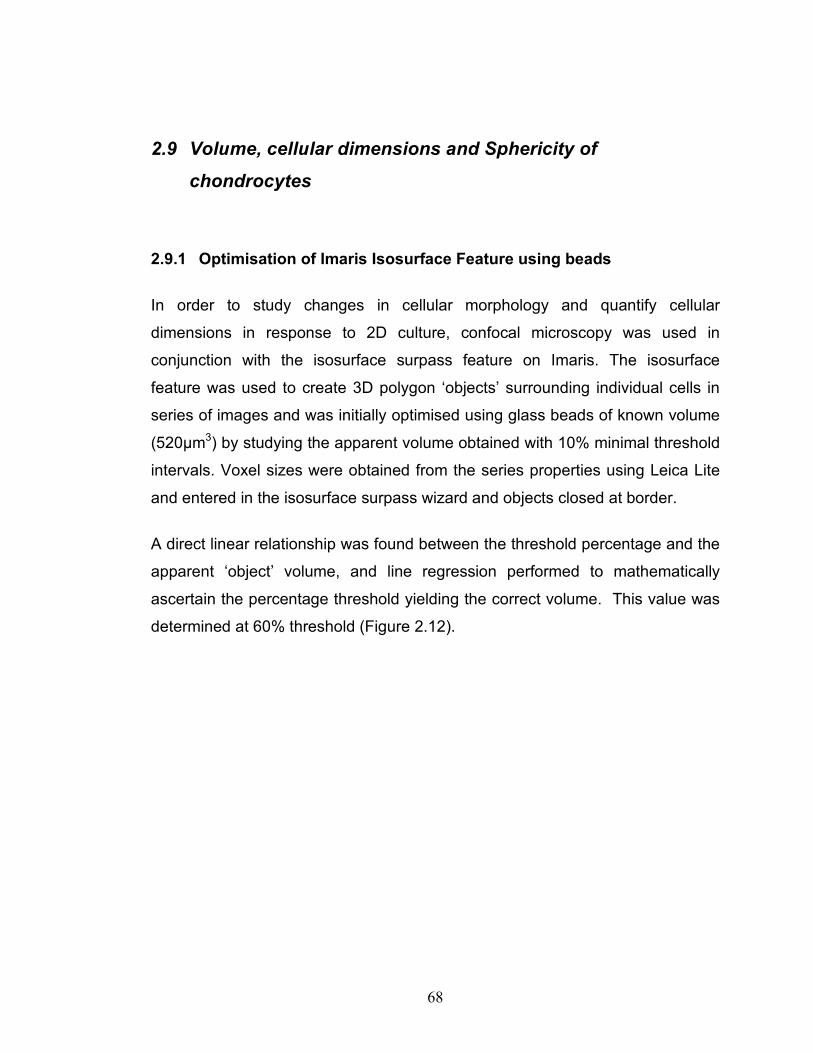
68
2.9 Volume, cellular dimensions and Sphericity of
chondrocytes
2.9.1 Optimisation of Imaris Isosurface Feature using beads
In order to study changes in cellular morphology and quantify cellular
dimensions in response to 2D culture, confocal microscopy was used in
conjunction with the isosurface surpass feature on Imaris. The isosurface
feature was used to create 3D polygon ‘objects’ surrounding individual cells in
series of images and was initially optimised using glass beads of known volume
(520µm3) by studying the apparent volume obtained with 10% minimal threshold
intervals. Voxel sizes were obtained from the series properties using Leica Lite
and entered in the isosurface surpass wizard and objects closed at border.
A direct linear relationship was found between the threshold percentage and the
apparent ‘object’ volume, and line regression performed to mathematically
ascertain the percentage threshold yielding the correct volume. This value was
determined at 60% threshold (Figure 2.12).
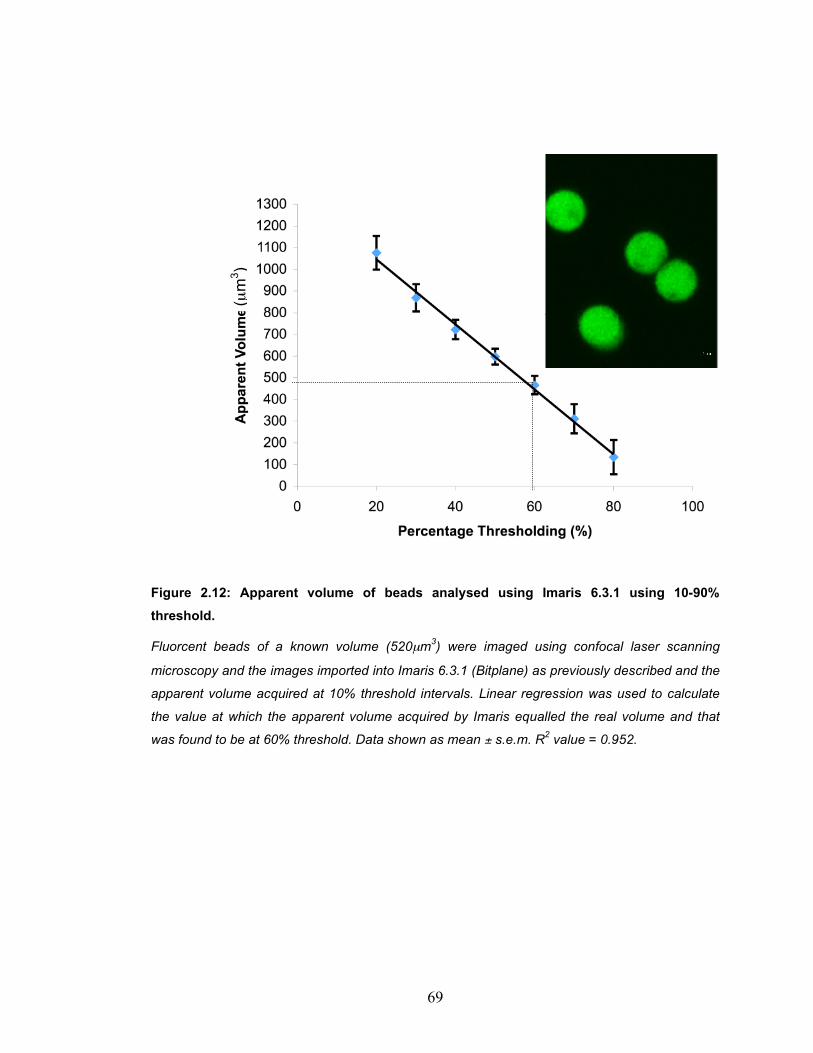
69
Figure 2.12: Apparent volume of beads analysed using Imaris 6.3.1 using 10-90% threshold.
Fluorcent beads of a known volume (520µm3) were imaged using confocal laser scanning
microscopy and the images imported into Imaris 6.3.1 (Bitplane) as previously described and the
apparent volume acquired at 10% threshold intervals. Linear regression was used to calculate
the value at which the apparent volume acquired by Imaris equalled the real volume and that
was found to be at 60% threshold. Data shown as mean ± s.e.m. R2 value = 0.952.
(µm
3 ) 3

70
2.9.2 Chondrocyte Cell Dimesion and Volume Acquisition
During 2D cultures, chondrocytes undergo drastic changes in morphology from
a sphere-like shape into a ‘flat’ fibroblast-like shape. The change in morphology
of chondrocytes during culture was observed by studying the cell dimensions
including depth (a), width (b), length (c), and sphericity (ψ), defined as the ratio
of the surface area of a sphere with the same volume as a given chondrocyte
cell to the surface area of the chondrocytes, where V is the volume of the
chondrocytes and A is the surface area of the perfect sphere.
!
" =#1
3$(6V )
2
3
A
Due to the change in cellular morphology upon 2D culture, a threshold of 60%
was deemed unsuitable for ‘flat’ chondrocytes as an isosurface object merely
encompassed the nucleus (Figure 2.13). The depth of the nucleus at 60%
threshold was termed ‘nuclear coefficient’ (aη) and was used to standardise the
apparent dimensions (b10% and c10%) and volume (V10%) of chondrocytes
obtained at 10% threshold. The following formulae were based on the
assumption that the depth of a round nucleus of a chondrocyte is approximately
equal to that of the ‘flat’ chondrocyte.
!
Qa " a#
$V =V10%
a10%
a#( )3,b =
b10%
% a#
a10%
,c =c10%
% a#
a10%
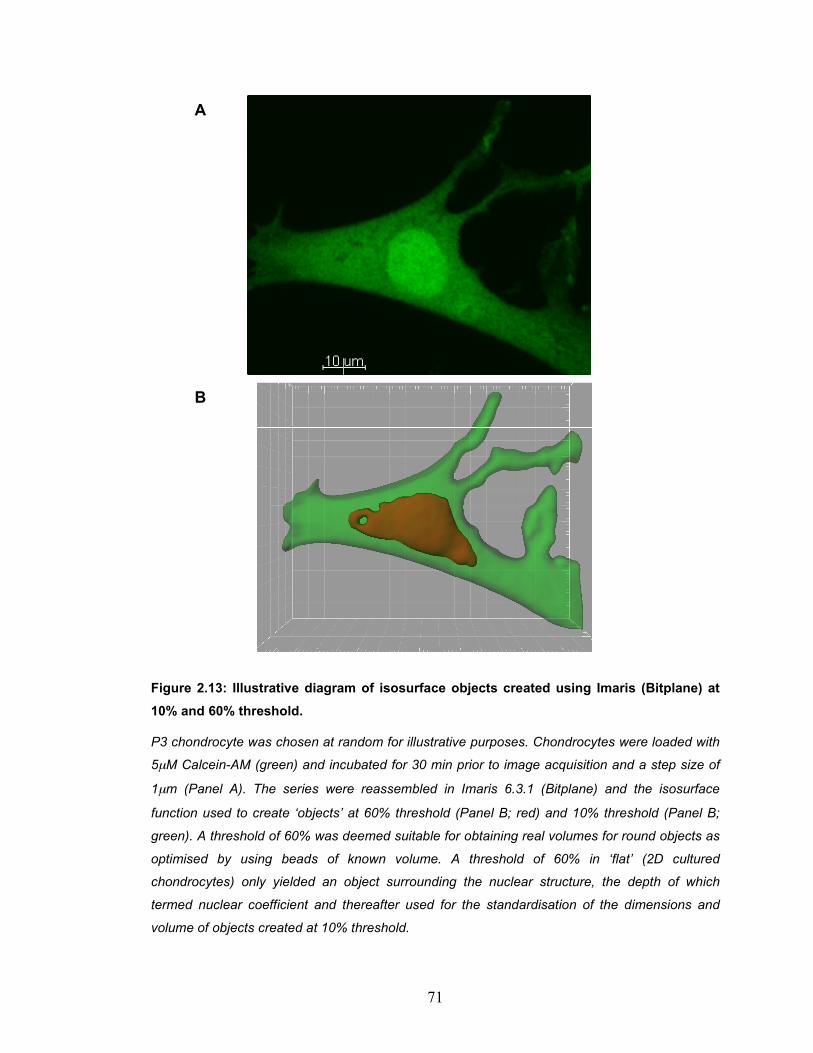
71
Figure 2.13: Illustrative diagram of isosurface objects created using Imaris (Bitplane) at 10% and 60% threshold.
P3 chondrocyte was chosen at random for illustrative purposes. Chondrocytes were loaded with
5µM Calcein-AM (green) and incubated for 30 min prior to image acquisition and a step size of
1µm (Panel A). The series were reassembled in Imaris 6.3.1 (Bitplane) and the isosurface
function used to create ‘objects’ at 60% threshold (Panel B; red) and 10% threshold (Panel B;
green). A threshold of 60% was deemed suitable for obtaining real volumes for round objects as
optimised by using beads of known volume. A threshold of 60% in ‘flat’ (2D cultured
chondrocytes) only yielded an object surrounding the nuclear structure, the depth of which
termed nuclear coefficient and thereafter used for the standardisation of the dimensions and
volume of objects created at 10% threshold.
A
B
72
2.9.3 RVI experiments
The capacity of chondrocytes to demonstrate RVI was studied by applying a
42% hyperosmotic challenge as previously described (Kerrigan et al., 2006) and
acquiring z-stack images (series) using confocal laser scanning microscopy
which were subsequently reassembled in Imaris version 6.3.1 (Bitplane).
Chondrocytes were seeded two hours prior to imaging and incubated in the dark
with 5µM calcein AM at 37°C for 30 minutes. The medium containing excess
calcein AM was aspirated and replaced with isosmotic (380mOsm) media
prepared as previously described and baseline Z-stack images of chondrocytes
acquired using CLSM. 1x volume of hyperosmotic media (700mOsm) was
subsequently added raising the osmolarity to 540mOsm as determined by
Vapro™ vapour pressure osmometer and images were acquired 1.5, 3, 5, 10
and 20 minutes post challenge. Images were reassembled in Imaris version
6.3.1 (Bitplane) and isosurface objects created at 60% and 10% threshold for
freshly isolated and 2D cultured chondrocytes, respectively. Volume values were
exported into Excel where changes were calculated relative to baseline values
(obtained prior to hyperosmotic challenge) and plotted against time following
hyperosmotic challenge.
Gradients of the lines that best fit the volume recovery points were obtained and
used for the calculation of half the time required for chondrocyte to regulate
100% of initial volume in response to the challenge (t½).
73
2.10 Calcium imaging
Differences in intracellular calcium ([Ca2+]i) signalling between freshly isolated
and cultured chondrocytes were determined using a fluorescence plate reader in
conjunction with the calcium indicator dye fluo-4 AM, a calcium indicator that
provides a rapid and proven method of imaging intracellular calcium flux (Gandhi
et al., 2000). To study changes in [Ca2+]i, chondrocytes were seeded onto a 12-
well plate at LD and allowed to adhere prior to incubation with 3µM Fluo-4 AM
for 30 minutes at 37°C, and subsequently media was replaced with BPS to
remove excess dye.
Firstly, the loading speed was optimised in order to reduce the effects of fluid
flow (Yellowley et al., 1997; Yellowley et al., 1999) on calcium response.
Calcium-bound fluo-4 AM was excited at 494nm and the basal fluorescence
measured at 520nm bandpass prior to BPS injection at three individual speeds
(420, 360 & 260 µl/s) and recording fluorescence every 14 seconds for 10
minutes (Figure 2.14). At both 420µl/s and 360µl/s, there was an immediate rise
in [Ca2+]i of an average of 4.52±0.34% (p>0.05) whereas the effects of fluid flow
were diminished at 260µl/s as seen by the slight rise in calcium of 1.19±0.3%.
These data concluded that 260µl/s was the injection speed deemed most
suitable for further experiments (Figure 2.14)
To further optimise the protocol for Ca2+-fluo-4 fluorescence measurement,
Ionomycin, a calcium salt which facilitates Ca2+ transport across the cell
membrane, was used at 3µM as a positive control (Liu & Hermann, 1978) and
2µl/ml DMSO (drug solvent) as a negative control. A DMSO solution induced a
1.34±0.6% rise in [Ca2+]i which was not significantly different from the effects
induced by fluid flow (p>0.05) whereas Ionomycin caused an influx of Ca2+
74
raising [Ca2+]i levels by 6.5±0.6%. These data confirmed that the methodology
devised above is suitable for the purposes of this research (Figure 2.15).
Previous work in our group has shown that 50µM Alpha-pentyl-3-(2-
quinolinylmethoxy)-benzene-methanol (REV5901) loading induced a rise in
[Ca2+]i (Ali et al., in press) and REV5901 was therefore used as a
pharmacological inducer of [Ca2+]i rise. For the purposes of investigating
individual channel and/or signalling molecule contribution to the calcium rise,
various inhibitors were employed (Table 2.6). Sodium Calcium Exchanger (NCX)
was inhibited by the use of Na+-free physiological BPS (Sanchez & Wilkins,
2004) adjusted to 380mOsm using choline chloride (Dascalu, 1996). Stretch-
activated cation channels (SACC) and transient receptor potential ion channels
(TRP); were inhibited by the use of 100µM Gd3+; (Kerrigan & Hall, 2008) or
10µM Ruthenium Red; (Gunthorpe et al., 2002), respectively. Pharmacological
inhibitors were added to culture media with fluo-4 and incubated for 30 minutes
before being replaced with BPS (containing the inhibitor) and loading 1x volume
100µM REV5901 solution supplemented with the same inhibitor.
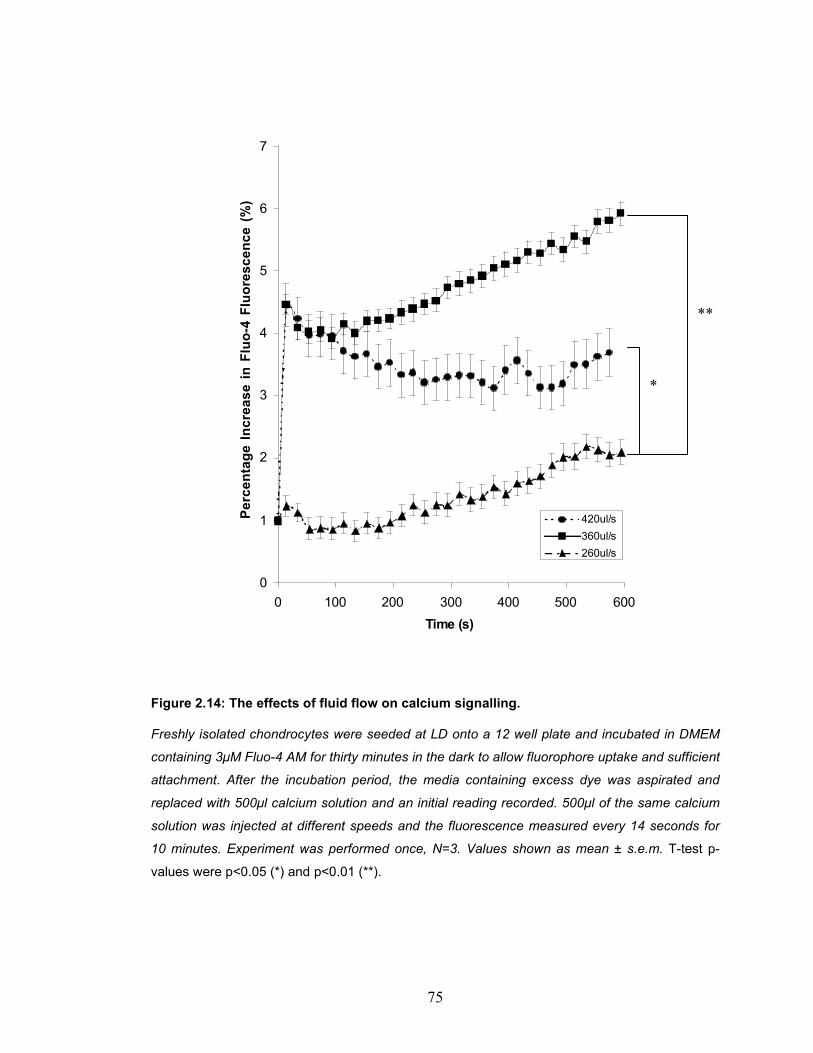
75
0
1
2
3
4
5
6
7
0 100 200 300 400 500 600
Time (s)
Pe
rce
nta
ge
In
cre
as
e i
n F
luo
-4 F
luo
res
ce
nc
e (
%)
420ul/s
360ul/s
260ul/s
Figure 2.14: The effects of fluid flow on calcium signalling.
Freshly isolated chondrocytes were seeded at LD onto a 12 well plate and incubated in DMEM
containing 3µM Fluo-4 AM for thirty minutes in the dark to allow fluorophore uptake and sufficient
attachment. After the incubation period, the media containing excess dye was aspirated and
replaced with 500µl calcium solution and an initial reading recorded. 500µl of the same calcium
solution was injected at different speeds and the fluorescence measured every 14 seconds for
10 minutes. Experiment was performed once, N=3. Values shown as mean ± s.e.m. T-test p-
values were p<0.05 (*) and p<0.01 (**).
*
**

76
Figure 2.15: Effects of Ionomycin and negative control DMSO solution on [Ca2+]i in freshly isolated chondrocytes.
The methodology devised for the calculation of changes in [Ca2+]i was assayed using Ionomycin,
an Ionophore used to passively raise [Ca2+]i . Chondrocytes were loaded with 3µM Fluo4 for 30
minutes and baseline [Ca2+]i measured prior to loading of 3µM ionomycin or 2µl/ml DMSO. A
DMSO solution induced a 1.34±0.6% rise in [Ca2+]i (equivalent to the rise induce by fluid flow),
whereas Ionomycin caused an influx of Ca2+ raising [Ca2+]i levels by 6.5±0.6% thus indicating
that the methodology is suitable for the purposes of this research. N=3, experiment repeated 6
times. Data shown as means ± s.e.m. T-test p-values were p<0.05 (*) and p<0.01 (**).
**
77
2.11 Chondrocyte Attachment Assay
The role of extracellular attachment protein, DEL1, was studied by assaying for
the rate of attachment of freshly isolated and 2D cultured chondrocytes on
plastic substrate. Chondrocytes were isolated (using collagenase for freshly
isolated and trypsin for 2D cultured chondrocytes), washed by centrifugation,
seeded at a density of 2x10⁴ cells/cm2 (LD) and allowed to attach for 1, 2 and 4
hours in a humidified incubator at 37°C and 5% CO2.
After the incubation period, media containing unattached chondrocytes were
replaced with fresh media containing 0.5mg/ml MTT solution and chondrocytes
incubated for 3 hours to allow for the reduction of MTT in the mitochondria.
Excess MTT was removed and MTT solvent (DMSO) used to solubilise the
reduced formazan crystals, and the absorbance measured at 570nm and 690nm
(for the background) and used to quantify the number of attaching chondrocytes.
The values obtained from different incubation times were used to evaluate the
number of attached chondrocytes at each time point and thus calculate the rate
of attachment by linear regression of number of attaching chondrocytes vs. time
(hours).
78
2.12 Cellular protein isolation and analysis
2.12.1 Intracellular cell signal proteins
A potential cellular pathway activated by the ligand-receptor interaction between
DEL1 and integrins was studied by observing the activation of protein kinase Akt
by phophorylation within the pathway. Protein kinases were isolated and studied
by polyacrylamide gel electrophoresis (SDS-PAGE) and western blotting using
antibodies against phosphorylated and unphosphorylated forms of Akt (Silvestre
et al., 2005). Akt phosphorylation was studied as previously described
(Sanchez-Sanchez et al., 2004) by cell lysis of 3x10⁵ chondrocytes in 50µl Akt
lysis buffer (20mM Tris-HCl, 120mM NaCl, 1% Trition X100, 10% glycerol, 1mM
sodium pyrophosphate, 20mM sodium fluoride, 1mM sodium orthovanadate,
pH=7.5 containing protease inhibitor) prior to boiling with 50µl 2x SDS-PAGE
sample buffer at 95°C for 5 minutes. A sample from the extracts was diluted by a
factor of 5 prior to assay using Bradford reagent due to the incompatibility of the
latter with Triton in the former, protein samples were subsequently assayed and
diluted to 2.5mg/ml and stored at -80°C until further use.
2.12.2 Extracellular DEL1 protein isolation
DEL1 production levels were confirmed but not quantified (due to the quality of
the anti-DEL1 polyclonal antibody) in freshly isolated and 2D cultured
chondrocytes using western blots and anti-DEL1 polyclonal antibody (Stratech
Scientific, Suffolk). To maximise the yield of DEL1 available in the media, 2x10⁴
cells/cm2 2D culture chondrocytes were seeded in 25cm2 flasks, cultured for 7
days and media subsequently assayed for the production of DEL1. Conversely,

79
freshly isolated chondrocytes were seeded at a higher density of 3.5x10⁵
cell/cm2, equivalent to the product of 7 (number of days of incubation for 2D
cultured chondrocytes) and 5x10⁴ cell/cm2 (the average density of 2D cultured
chondrocytes within one passage period) and media isolated after 24 hour
incubation. The amount of proteins produced by chondrocytes was measured by
Bradford assay, the concentration calculated and samples diluted to 2.5mg/ml.
2.12.3 SDS-PAGE
Protein samples were separated in 5.7% stacking and 12.5% resolving
polyacrylamide gels. Briefly, 6.7ml of acrylamide-bisacrylamide solution were
dissolved in 8.0ml of water, 100µl of 20% SDS, 5ml of 4x resolving buffer (1.5M
Tris-HCl, pH=8.8) and 10µl of TEMED. 150µl of freshly prepared 10%
ammonium persulphate were added to the polyacrylamide solution which was
allowed to set between two glass plates at room temperature under isobutanol
layer to prevent oxidation. Isobutanol was removed and the gel washed twice
with distilled water before overlaying the stacking gel prepared with 1.5ml of
acrylamide-bisacrylamide solution, 4.4ml of water, 40µl of 20% SDS, 2ml of 4x
stacking buffer (0.5M Tris-HCl, pH=6.8), 8µl of TEMED and 40µl of freshly
prepared 10% ammonium persulphate.
Samples were prepared for SDS-PAGE by the addition of 1x volume of 2xSDS-
PAGE loading buffer (20% glycerol, 4% SDS, 10% 2-mercaptoethanol and
0.005% bromophenol blue in stacking buffer) and the sample heated to 95°C for
5 minutes in a heating block. Wells were loaded with 100µg each, the tank filled
with running buffer (25mM Tris-HCl, 0.2M glycine, 0.1% SDS, pH=8.3) and the
gel subjected to 25mAmp/gel for one hour.
80
Protein gels were either visualised using coomassie blue staining or western
immunoblotting. For the former, gels were stained in filtered staining solution
(50% methanol, 10% acetic acid. 0.25% coomassie blue) with gentle shaking for
3 hours. To destain, the staining solution was decanted and sufficient destaining
solution (5% acetic acid and 10% methanol) was added and replaced when
necessary.
2.12.4 Western Blot
Western blot was performed in a semi-dry transfer assembly and Immobilon™-P
(Millipore, Watford, UK) transfer membrane according to manufacturer’s
instructions. The transfer membrane was cut to the dimensions of the gel,
wetted in 100% methanol for 15 seconds, placed in water for 2 minutes, and
soaked in anode buffer II (25mM Tris-HCl, 10% methanol, pH=10.4) for at least
5 minutes. The gel was prepared for transfer by immersing in cathode buffer
(25mM Tris base, 40mM glycine, 10% methanol, pH=9.4) and allowed to
equilibrate for 15 minutes. Two sheets of filter paper were saturated in anode
buffer I (0.3M Tris-HCl, 10% methanol, pH=10.4) and placed on the anode
electrode plate followed by one sheet of filter paper saturated in anode buffer II,
the membrane and the gel in that order. Three sheets of filter paper were wetted
in cathode buffer and placed between the gel and the cathode electrode plate
and the electrode leads connected and a fixed current of 100mA applied for one
hour. The blotted membrane was later dried by incubation at 37°C for one hour
and stored for future use at 4°C.
Western immunoblotting of Akt proteins was performed according to antibody
manufacturer’s instructions. Briefly, after transfer, the blot membrane was
washed with Tris-buffered saline (TBS; 50mM Tris base, 0.15M NaCl, pH=7.6)
for 5 minutes at room temperature, blocked in blocking buffer (5% non-fat milk,
0.1% Tween 20 in TBS) for 1 hour at room temperature and then washed three
81
times in TBS/T (0.1% Tween 20 in TBS) for 5 minutes each. The membrane was
incubated in 10ml of TBS/T containing 10µl of the primary antibody with gentle
agitation overnight at 4°C and then washed three times in TBS/T for 5 minutes
each at room temperature. The blot was then incubated in 10ml of TBS/T
containing 5µl goat Horseradish Peroxidase (HRP) conjugated anti-rabbit IgG at
room temperature for one hour and subsequently washed 3 times with TBS/T for
5 minutes each. Upon hybrdisation, the blot was incubated in 10ml 1:1
luminol:hydrogen peroxide solution for 5 minutes, drained and exposed to x-ray
film. The films were exposed to the membrane for 30 seconds prior to the former
being developed and fixed in developing and fixing solutions (Kodak, Herts) for 2
minutes each. The time for exposure was adjusted if necessary.
For DEL1 western blot detection experiments, membranes were blocked in 10ml
of 5% non-fat milk in 0.2% PBS/T (0.2% Tween 20 in PBS) at 4°C overnight and
10µl of anti-DEL1 polyclonal antibody (Stratech Scientific Ltd., Suffolk, UK) were
added to the blocking buffer and the membrane incubated at 4°C overnight.
Following incubation, the membrane was washed three times for 10 minutes
each in 0.2% PBST prior to incubation in 10 ml of 5% non-fat milk in 0.1% PBST
(0.1% Tween 20 in PBS) containing 2µl rabbit HRP-conjugated anti-mouse IgG
at room temperature for one hour. The blot was subsequently washed 4 times
with 0.2% PBST for 10 minutes each and incubated in 10ml 1:1
luminol:hydrogen peroxide solution for 5 minutes, drained and exposed to x-ray
film.
Membranes were stripped for further use in the recommended buffer (100mM β-
mercaptoethanol, 2% SDS, 62.5mM Tris/HCl, pH=6.7) and incubated at 50°C for
30 minutes followed by 2x wash in TBS/T for one hour each prior to drying at
37°C for 1 hour and storing at 4°C for further use.
82
2.12 Statistical Analysis
All statistical analysis and plotting of graphs were performed using Microsoft®
Excel 2004. Equations of linear and binomial regression graphs were obtained
using the ‘trendline’ feature and R2 values given for every equation.
All values are shown as mean ± standard error of the mean (s.e.m) unless
otherwise stated. Two-tailed homoscredastic Student’s T-tests were carried out
to determine whether two sets of values are different and deemed significantly
different if the p value was p<0.05 (*) or p<0.01 (**).
All experiments were repeated as described in each legend. In order to reduce
the effects of any genetic variation, experiments were performed with
chondrocytes obtained from as many animals as possible. The number of
individual joints utilised for each experiment was denoted (N) and the number of
cells studied, where applicable, was denoted (n).

83
3 Experimental Chapter: The influence of chondrocyte expansion on phenotype, morphology and dedifferentiation.
84
3.1 Chapter introduction
Chondrocytes in adult cartilage do not undergo cell division, but upon isolation
and introduction to serum-enriched media, chondrocytes are released from G0,
a process termed ‘expansion’ (Chen et al., 2003; Kino-oka et al., 2005). Several
methodologies for chondrocyte isolation and culture have been developed with a
wide range of culture seeding densities (Table 3.1). Culture is performed using
media containing 4.5g/L glucose, 10% serum, 2mM L-glutamine and 50µg/ml
ascorbic acid (Reginato et al., 1994) and occasionally other additional
supplements including vitamin D3 (Harmand et al., 1984). For purposes of
expansion and subsequent re-introduction into patients, chondrocytes are
cultured in monolayers or 3D matrices composed of hydrogels (Reginato et al.,
1994), agarose (Spirito et al., 1993), collagen substrates (Ana M. Schor, 2001),
pellet models (Johnstone et al., 1998; Yoo et al., 1998) or alginate beads (Guo
et al., 1989; Shakibaei & De Souza, 1997).
Changes in chondrocyte morphology, phenotype and expression in response to
in vitro expansion have been the subject of extensive studies as previously
discussed (Benya et al., 1981; Benya & Shaffer, 1982a). When cultured in
monolayers (in 2D) or treated with retinoic acid, the most apparent change is a
switch from spherical/ellipsoid to spread/attached morphology as observed as
early as the 5th day in culture (Shakibaei et al., 1997), a process that could be
reversed upon re-introduction of 2D cultured chondrocytes into 3D support
(Benya & Shaffer, 1982b). These changes have not been quantified in the
literature in dimensional terms and have been found to be independent of other
changes in chondrocytic phenotype (Horton & Hassell, 1986).
It has been noted, however, that accompanying changes in actin organisation
contributed to potent modulation of chondrocytic phenotype where disruption of
actin filaments using cytochalasin D and dihydrocytochalasin B recaptured
85
chondrocyte-specific phenotype (Benya, 1988; Benya et al., 1988; Loty et al.,
2000). A switch in actin organization from cortical localization in freshly isolated
chondroctes to higly filamentous in 2D cultured chondrocytes has been widely
observed (Mallein-Gerin et al., 1991; Idowu et al., 2000; Zwicky & Baici, 2000),
but not fully quantified. Moreover, organisation of filamentous actin in response
to retinoic acid treatment (Mallein-Gerin et al., 1991), Gd3+ incubation (Perkins et
al., 2005) and actin depolymerising drugs have been associated with changes in
morphology (Takigawa et al., 1984), a switch in ‘expression battery’ (Brown &
Benya, 1988; Newman & Watt, 1988; Loty et al., 2000; Kim et al., 2003) and the
capacity to exhibit RVD and RVI (Kerrigan & Hall, 2005; Kerrigan et al., 2006).
A decline in the expression of chondrocyte-specific type II collagen upon
monolayer culture has been largely documented (Huh et al., 2003; Schulze-
Tanzil et al., 2004; Darling & Athanasiou, 2005) and is used, often in conjunction
with changes in type I collagen expression, as a phenotypic marker. Moreover,
transcription factor SOX9 has been shown to play a role in chondrocyte
differentiation and to be decreased in expression in response to 2D culture
(Stokes et al., 2002; Tallheden et al., 2004). Additional genes which increased in
expression upon expansion include Twist, CD44, cadherin 11 (Stokes et al.,
2002), insulin-like growth factor binding protein 3 (Schnabel et al., 2002; Stokes
et al., 2002), cox-2 (Huh et al., 2003), TNF-R1 (Schnabel et al., 2002) and
integrins α5, αvβ3 and α3 (Diaz-Romero et al., 2005). Other genes that are
downregulated upon expansion include α1, LPS-R (Diaz-Romero et al., 2005),
aggercan, insulin-like growth factor 2, BMP6, and types IX, XI collagen (Stokes
et al., 2002) and type X collagen (Tallheden et al., 2004).
Therefore, In order to provide a background of intensive knowledge into the
changes in chondrocytic phenotype, experiments were conducted to
quantitatively study changes in cell shape and actin organisation in addition to
key molecular markers of chondrocyte phenotype to further our knowledge of
the mechanism of loss of phenotype in 2D expansion.
86
Aims of Experimental Chapter
1 Optimise 2D culture methodology of chondrocytes.
2 Study changes in cell volume, shape and dimensions in response to 2D
culture.
3 Quantify changes in the ‘expression battery’ upon expansion.
4 Quantify changes in the actin cytoskeletal organisation in response to 2D
culture.
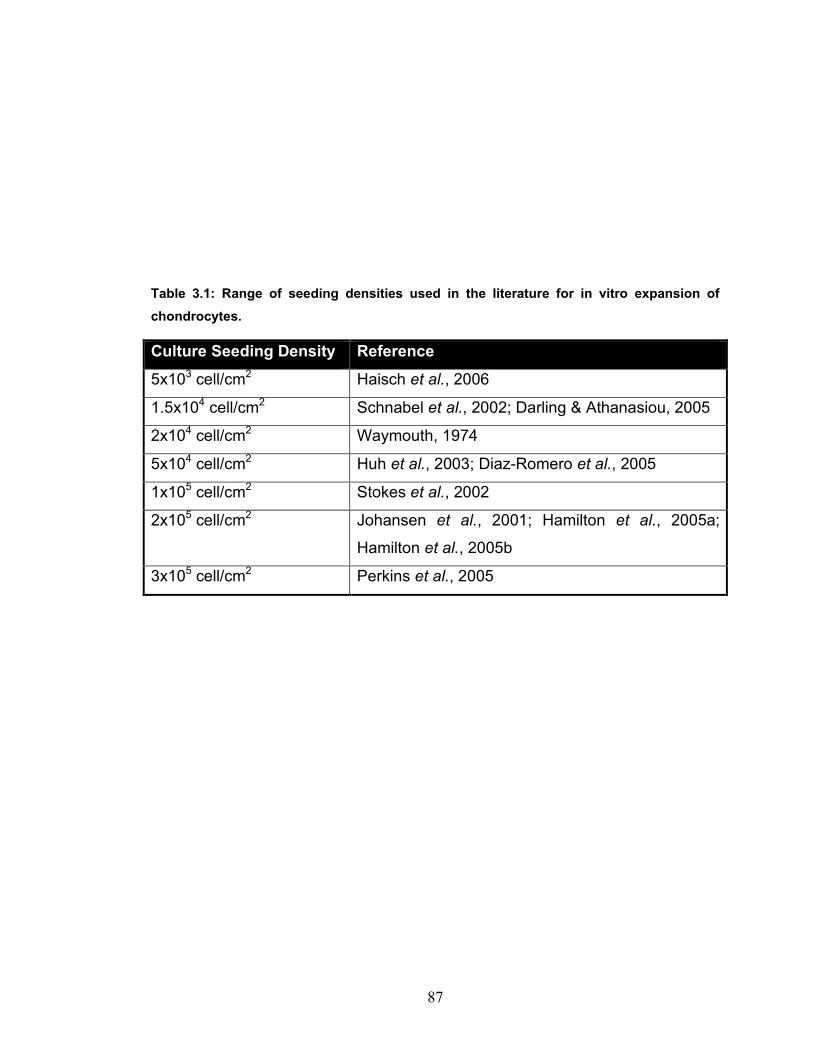
87
Table 3.1: Range of seeding densities used in the literature for in vitro expansion of chondrocytes.
Culture Seeding Density Reference
5x10³ cell/cm2 Haisch et al., 2006
1.5x10⁴ cell/cm2 Schnabel et al., 2002; Darling & Athanasiou, 2005
2x10⁴ cell/cm2 Waymouth, 1974
5x10⁴ cell/cm2 Huh et al., 2003; Diaz-Romero et al., 2005
1x10⁵ cell/cm2 Stokes et al., 2002
2x10⁵ cell/cm2 Johansen et al., 2001; Hamilton et al., 2005a;
Hamilton et al., 2005b
3x10⁵ cell/cm2 Perkins et al., 2005
88
3.2 Results
3.2.1 Expansion and Growth Rates
Chondrocytes were isolated from bovine metacarpal and metatarsal joints into
DMEM and prepared as previously described (see Materials and Methods).
Briefly, cartilage explants were washed in DMEM and subsequently incubated in
0.5mg/ml collagenase in 380mOsm DMEM for 18 hours. Isolated chondrocytes
were washed and seeded at different densities in culture media containing 10%
FCS, 1% P/S, 50µg/ml ascorbic acid and 20mM glutamine to determine the
optimal conditions for culture for all future experiments. Chondrocytes were
subcultured for up to three weeks until 80% confluency was achieved,
whereupon chondrocytes were trypsin-lifted, counted and re-seeded at the same
density (Figure 3.1).
Chondrocytes cultured at High Density (HD) did not show an increase in cell
number by the end of the first passage (day 9; Figure 3.1). This was most likely
due to contact and density inhibition mechanisms inhibiting cell growth
(Freshney, 2001). Conversely, chondrocytes cultured at Intermediate Density
(MD) exhibited an increase of 47.50±29.44% in cell number during the first
passage (9 days) and subsequently, as chondrocytes adopted a fibroblast-like
morphology, ceased to increase in number. Conversely, chondrocytes cultured
at 2x10⁴cells/cm2 (Low Density; LD) demonstrated a steady increase in cell
number (r2>0.9) during the entire culture period and therefore this culture density
was selected for all expansion experiments. In order to determine the maximum
culture time, chondrocytes plated at LD were cultured until cellular senescence
was reached upon culture to passage number 8 (60 days in culture) as observed
by the inhibition of further cellular division.
89
After 2 days of introduction to culture, chondrocytes were collected and cell
viability assayed by trypan blue and a haemocytometer. When chondrocytes
were seeded at HD or MD, there was a mean viability of 90.39±4.01% or
90.06±5.46%, respectively (Figure 3.2). Converely, cell viability decreased to
71.02±8.66% in response to culture at 2x10⁴cells/cm2 (LD).
These data suggested that despite a reduction in chondrocyte viability, LD was
favourable choice for 2D cell culture and was used thereafter as part of a
standard culture technique (Table 3.2).
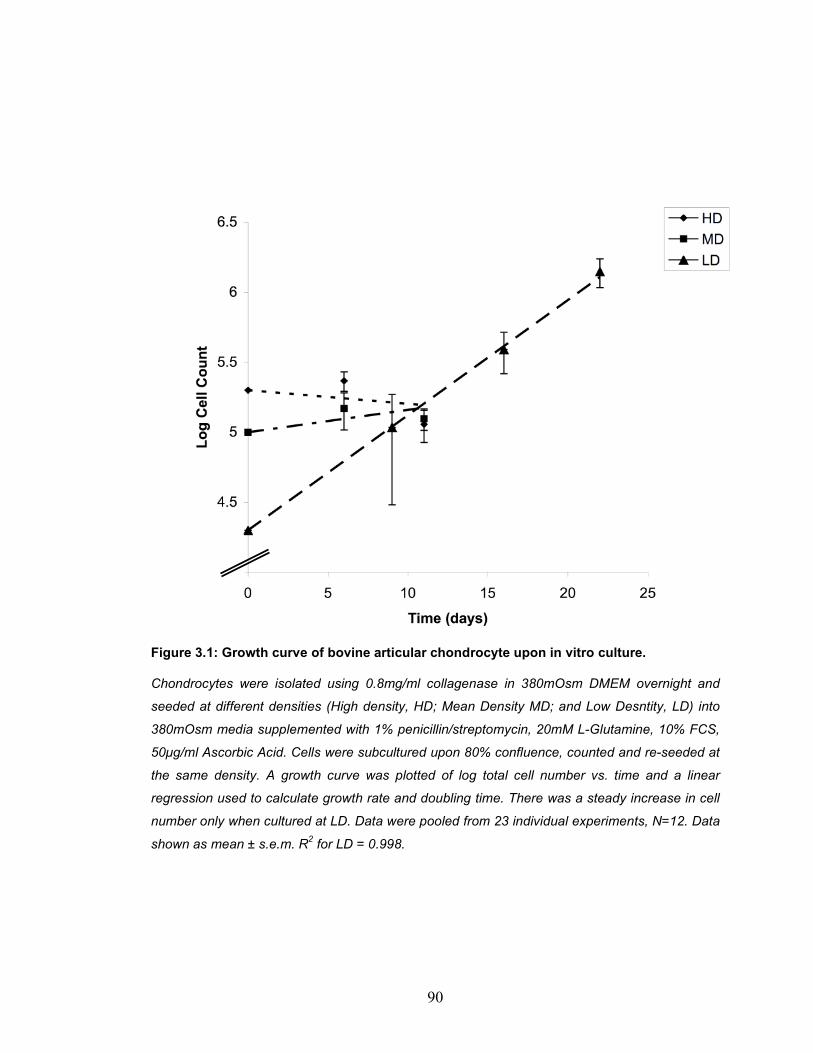
90
Figure 3.1: Growth curve of bovine articular chondrocyte upon in vitro culture.
Chondrocytes were isolated using 0.8mg/ml collagenase in 380mOsm DMEM overnight and
seeded at different densities (High density, HD; Mean Density MD; and Low Desntity, LD) into
380mOsm media supplemented with 1% penicillin/streptomycin, 20mM L-Glutamine, 10% FCS,
50µg/ml Ascorbic Acid. Cells were subcultured upon 80% confluence, counted and re-seeded at
the same density. A growth curve was plotted of log total cell number vs. time and a linear
regression used to calculate growth rate and doubling time. There was a steady increase in cell
number only when cultured at LD. Data were pooled from 23 individual experiments, N=12. Data
shown as mean ± s.e.m. R2 for LD = 0.998.
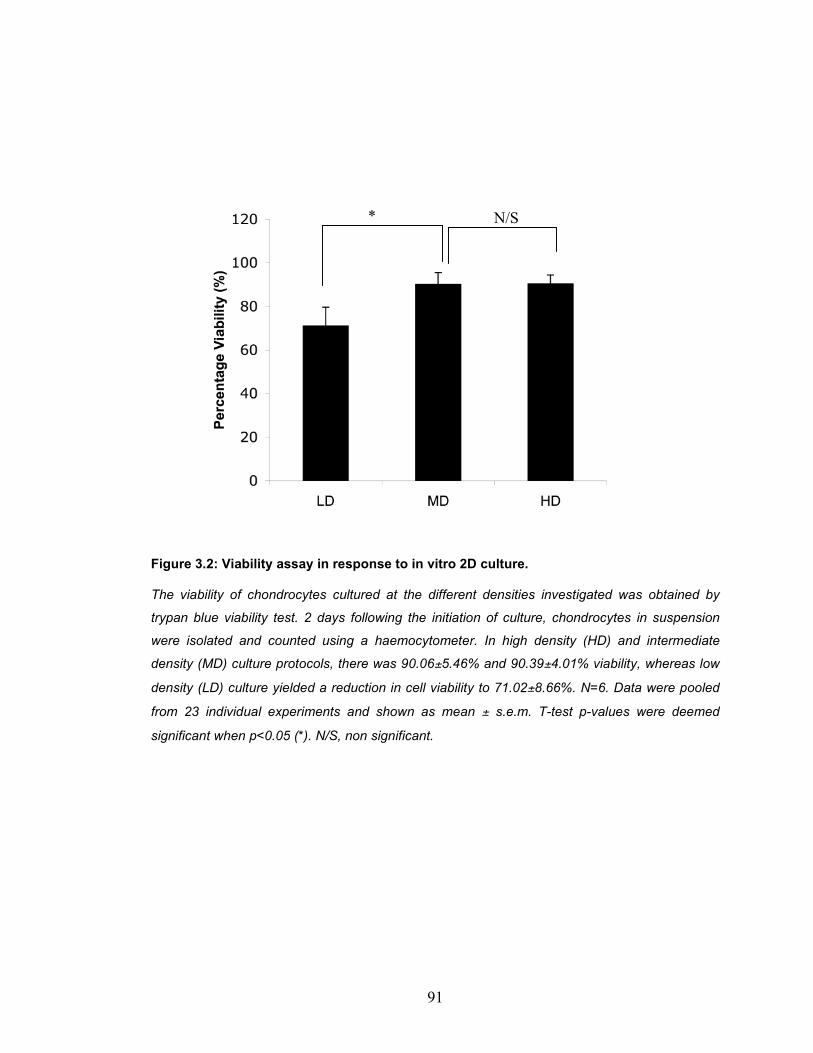
91
Figure 3.2: Viability assay in response to in vitro 2D culture.
The viability of chondrocytes cultured at the different densities investigated was obtained by
trypan blue viability test. 2 days following the initiation of culture, chondrocytes in suspension
were isolated and counted using a haemocytometer. In high density (HD) and intermediate
density (MD) culture protocols, there was 90.06±5.46% and 90.39±4.01% viability, whereas low
density (LD) culture yielded a reduction in cell viability to 71.02±8.66%. N=6. Data were pooled
from 23 individual experiments and shown as mean ± s.e.m. T-test p-values were deemed
significant when p<0.05 (*). N/S, non significant.
* N/S
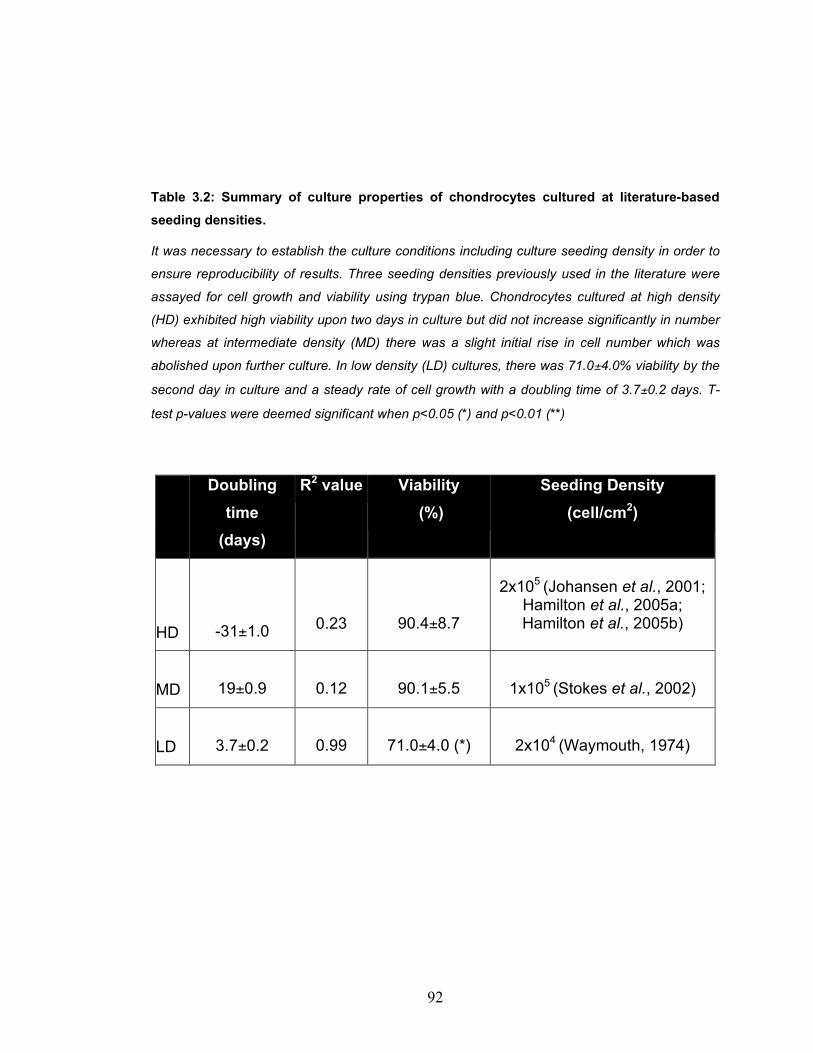
92
Table 3.2: Summary of culture properties of chondrocytes cultured at literature-based seeding densities.
It was necessary to establish the culture conditions including culture seeding density in order to
ensure reproducibility of results. Three seeding densities previously used in the literature were
assayed for cell growth and viability using trypan blue. Chondrocytes cultured at high density
(HD) exhibited high viability upon two days in culture but did not increase significantly in number
whereas at intermediate density (MD) there was a slight initial rise in cell number which was
abolished upon further culture. In low density (LD) cultures, there was 71.0±4.0% viability by the
second day in culture and a steady rate of cell growth with a doubling time of 3.7±0.2 days. T-
test p-values were deemed significant when p<0.05 (*) and p<0.01 (**)
Doubling time
(days)
R2 value Viability (%)
Seeding Density (cell/cm2)
HD -31±1.0
0.23
90.4±8.7
2x10⁵ (Johansen et al., 2001;
Hamilton et al., 2005a; Hamilton et al., 2005b)
MD 19±0.9
0.12
90.1±5.5
1x10⁵ (Stokes et al., 2002)
LD 3.7±0.2
0.99
71.0±4.0 (*)
2x10⁴ (Waymouth, 1974)
93
3.2.2 Morphology, shape and volume of freshly isolated and expanded chondrocytes
Currently, the process of chondrocyte de-differentiation and the relationship
between phenotype and morphology, essential data that will underpin all
replacement technologies, is not fully understood, and this process was
therefore investigated. For the purposes of studying the morphology and cellular
dimensions of chondrocytes upon culture, freshly isolated and 2D cultured
chondrocytes were incubated with 5µM calcein-AM for 30 minutes at 37°C and
3D images acquired by CLSM (Materials and Methods). Z-stacks were acquired
at 1µm depth intervals and reassembled in Imaris 6.3.1 to create a 3D polygon-
based isosurface ‘object’ for each cell (Figure 3.3). The volume, sphericity (ϕ),
depth (a; µm), width (b; µm) and length (c; µm) of every chondrocyte were
determined and exported into Microsoft Excel for statistical analysis.
Within 9 days of culture, chondrocytes lost their round morphology and acquired
a ‘flat’ fibroblast-like structure as seen by CLSM (Figure 3.3). There was a
decrease in cell depth (a) in reponse to culture from 4.08±0.11µm in freshly
isolated chondrocytes to 2.24±0.19, 1.96±0.10 and 2.20±0.13 in P1, P2 and P3
chondrocytes, respectively (p<0.05). Conversely, a significant increase (p<0.05)
in cell length was observed upon 9 days in culture from 6.04±0.10 to
12.51±1.82µm with no further change upon longer culture periods. No change,
however was observed in cell width in response to 2D culture with an average
diameter of 5.17±0.08, 5.19±0.66, 4.60±0.25 and 5.17±0.96µm in freshly
isolated, P1, P2 and P3 chondrocytes, respectively (p>0.05).
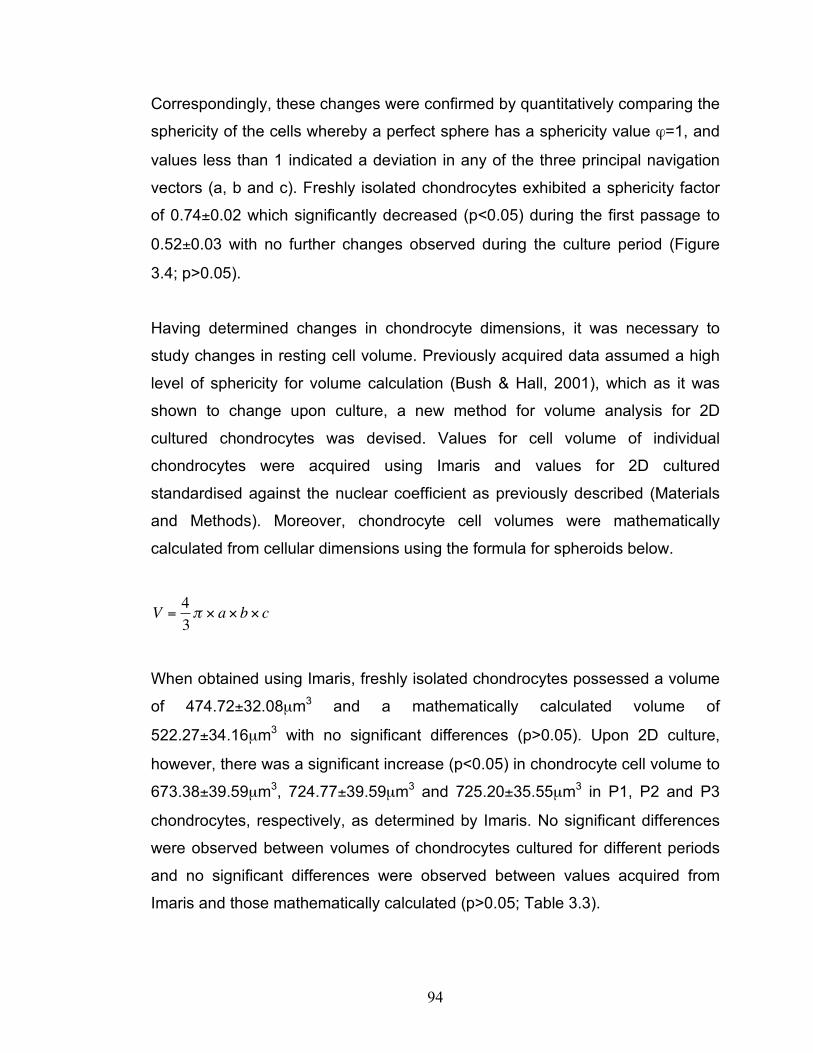
94
Correspondingly, these changes were confirmed by quantitatively comparing the
sphericity of the cells whereby a perfect sphere has a sphericity value ϕ=1, and
values less than 1 indicated a deviation in any of the three principal navigation
vectors (a, b and c). Freshly isolated chondrocytes exhibited a sphericity factor
of 0.74±0.02 which significantly decreased (p<0.05) during the first passage to
0.52±0.03 with no further changes observed during the culture period (Figure
3.4; p>0.05).
Having determined changes in chondrocyte dimensions, it was necessary to
study changes in resting cell volume. Previously acquired data assumed a high
level of sphericity for volume calculation (Bush & Hall, 2001), which as it was
shown to change upon culture, a new method for volume analysis for 2D
cultured chondrocytes was devised. Values for cell volume of individual
chondrocytes were acquired using Imaris and values for 2D cultured
standardised against the nuclear coefficient as previously described (Materials
and Methods). Moreover, chondrocyte cell volumes were mathematically
calculated from cellular dimensions using the formula for spheroids below.
!
V =4
3" # a # b # c
When obtained using Imaris, freshly isolated chondrocytes possessed a volume
of 474.72±32.08µm3 and a mathematically calculated volume of
522.27±34.16µm3 with no significant differences (p>0.05). Upon 2D culture,
however, there was a significant increase (p<0.05) in chondrocyte cell volume to
673.38±39.59µm3, 724.77±39.59µm3 and 725.20±35.55µm3 in P1, P2 and P3
chondrocytes, respectively, as determined by Imaris. No significant differences
were observed between volumes of chondrocytes cultured for different periods
and no significant differences were observed between values acquired from
Imaris and those mathematically calculated (p>0.05; Table 3.3).

95
A
C
B
D
D
E
F
G
H

96
Figure 3.3: Morphology of freshly isolated and 2D cultured chondrocytes as seen under confocal microscopy.
Chondrocytes were freshly isolated (panel A) as previously described, cultured for 9, 14 or 21
days (panels B, C or D, respectively) and the loaded with 5µm calcein-AM for 30 minutes at
37°C in the dark. Chondrocytes were imaged as previously described and the series of images
reassembled in Imaris as an Isosurface surpass (corresponding panels E-H) at 60% threshold
for freshly isolated chondrocytes and 10% threshold for 2D cultured chondrocytes. Changes in
the morphology of chondrocytes were onserved as early as 9 days post culture with a loss of a
spherical cell shape. Images acquired using x63 dipping lens.
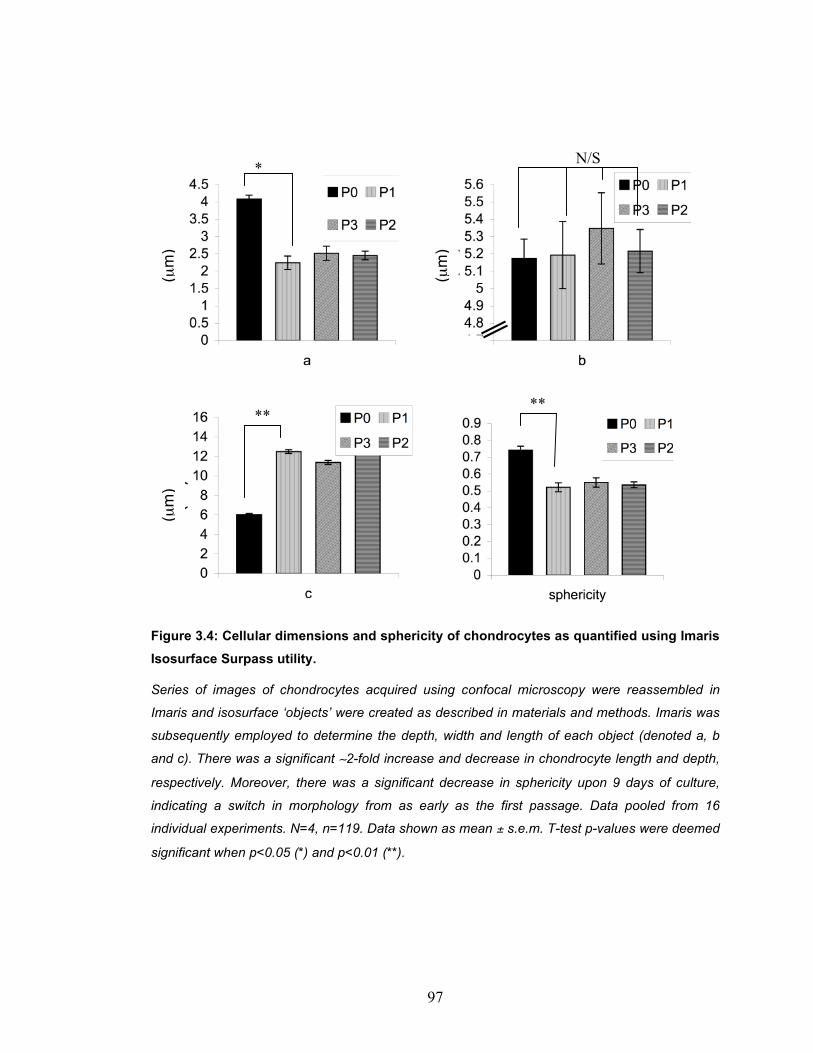
97
Figure 3.4: Cellular dimensions and sphericity of chondrocytes as quantified using Imaris Isosurface Surpass utility.
Series of images of chondrocytes acquired using confocal microscopy were reassembled in
Imaris and isosurface ‘objects’ were created as described in materials and methods. Imaris was
subsequently employed to determine the depth, width and length of each object (denoted a, b
and c). There was a significant ∼2-fold increase and decrease in chondrocyte length and depth,
respectively. Moreover, there was a significant decrease in sphericity upon 9 days of culture,
indicating a switch in morphology from as early as the first passage. Data pooled from 16
individual experiments. N=4, n=119. Data shown as mean ± s.e.m. T-test p-values were deemed
significant when p<0.05 (*) and p<0.01 (**).
(µm
) (µ
m)
*
** **
N/S
(µm
)
(µm
) (µ
m)

98
Table 3.3: Cell volume changes in freshly isolated and 2D cultured chondrocytes as acquired by Imaris and calculated mathematically.
We have devised a new protocol for the assay of cell volume in 2D cultured chondrocytes by
standardising the volume of 2D cultured chondrocytes as obtained using Imaris (Bitplane) at
10% threshold against the nuclear coefficient (depth of nucleus acquired at 60% threshold). To
confirm the validity of the protocol, the volumes obtained using Imaris were compared to those
mathematically calculated using cellular dimensions. It was observed that there was no
significant difference in the values obtained by both methods (p>0.05) and that both methods
demonstrated an increase in chondrocyte cell volume upon 2D culture. N=4, n=119. Data shown
as mean ± s.e.m. T-test p-values were deemed significant when p<0.05 (*) and p<0.01 (**);
relative to P0.
Cell Volume as acquired from Imaris
(µm3)
Cell Volume as mathematically calculated (µm3)
Freshly Isolated (P0) 474.72 ± 32.08 522.27 ± 34.16
P1 673.38 ± 39.59 (**) 610.21 ± 35.87 (**)
P2 724.77 ± 33.03 (**) 662.80 ± 30.20 (**)
P3 725.20 ± 35.55 (**) 642.67 ± 31.51 (**)

99
3.2.3 Phenotype and expression profiling of cultured chondrocytes
Having determined the morphological changes which occur during culture, it was
then necessary to determine changes in the key markers of the chondrocyte
phenotype so these changes could be correlated. RNA was isolated from
chondrocytes as previously described (Materials and Methods). Briefly,
chondrocytes were treated with trypsin-EDTA to allow detachment, washed and
incubated on ice in RLT lysis buffer (Qiagen, Poole) for 5 min. RNA was
extracted from the lysate using RNeasy kit (Qiagen, Poole), quantified using UV
spectrophotometery and reverse transcribed using ImPromII RT system
(Promega, USA) as previously described. cDNA was subjected to PCR to
determine the expression levels of key genes (types I and II collagens and
SOX9) relative to GAPD expression levels (internal multiplexed positive control).
The ratio of type II collagen to type I collagen (col2:col1) expression was
determined as a marker for the state of differentiation as previously published
(Benya & Shaffer, 1982b; Baici et al., 1988a; Benya, 1988), whereby a high ratio
is indicative of the chondrocytic phenotype.
A significant overproduction of collagen was observed as early as the first
passage with relative expression level of type I collagen increasing from
1.00±0.064 to 2.70±0.63 after 9 days in culture (p<0.01). Expression level of
type II collagen increased transiently within 9 days of culture from 0.98±0.13 to
1.58±0.15 (p<0.05) and subsequently returned to baseline levels after 14 days
of culture with no significant differences observed (p>0.05). The ratio of type II
collagen to type I collagen expression was therefore reduced by a factor of ~2
from as early as the first passage to 0.58±0.15 indicating an early onset switch
of phenotype that was maintained for the remainder of the culture period with no
futher significant change (p>0.05; Figure 3.5).
100
Expression of the chondrocytic transcription factor SOX9, a key regulator of
chondrocytic phenotype was also studied upon culture to confirm the data
obtained from the collagen ratio for the purpose of determining the switch in
chondrocyte phenotype. A significant yet transient 1.75±0.40-fold increase in
SOX9 expression (p<0.05) was observed within 9 days of culture. Expression
levels of SOX9 expression declined upon further culture to baseline levels
(p>0.05). This increase was associated with that of collagen indicating a
potential role for SOX9 in type II collagen expression, and together the transient
rise in type II collagen and SOX9 expression levels suggested that
dedifferentiation occurred in a 2-step trend.
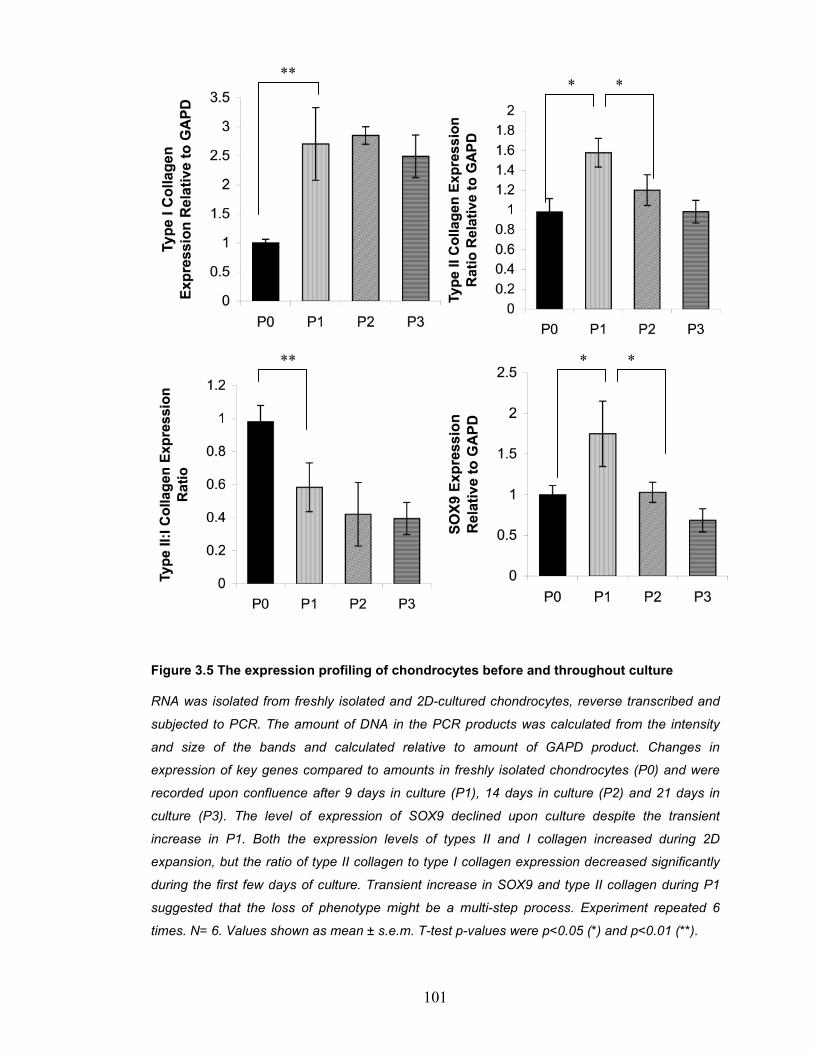
101
Figure 3.5 The expression profiling of chondrocytes before and throughout culture
RNA was isolated from freshly isolated and 2D-cultured chondrocytes, reverse transcribed and
subjected to PCR. The amount of DNA in the PCR products was calculated from the intensity
and size of the bands and calculated relative to amount of GAPD product. Changes in
expression of key genes compared to amounts in freshly isolated chondrocytes (P0) and were
recorded upon confluence after 9 days in culture (P1), 14 days in culture (P2) and 21 days in
culture (P3). The level of expression of SOX9 declined upon culture despite the transient
increase in P1. Both the expression levels of types II and I collagen increased during 2D
expansion, but the ratio of type II collagen to type I collagen expression decreased significantly
during the first few days of culture. Transient increase in SOX9 and type II collagen during P1
suggested that the loss of phenotype might be a multi-step process. Experiment repeated 6
times. N= 6. Values shown as mean ± s.e.m. T-test p-values were p<0.05 (*) and p<0.01 (**).
**
**
* *
* *
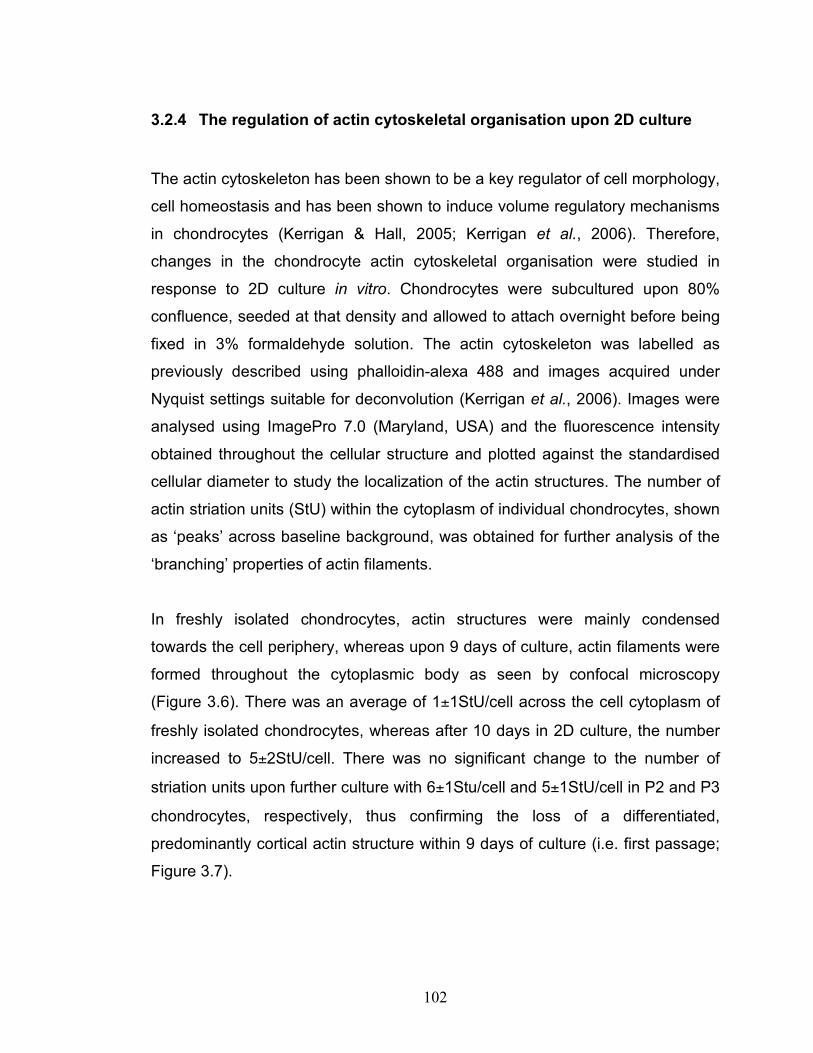
102
3.2.4 The regulation of actin cytoskeletal organisation upon 2D culture
The actin cytoskeleton has been shown to be a key regulator of cell morphology,
cell homeostasis and has been shown to induce volume regulatory mechanisms
in chondrocytes (Kerrigan & Hall, 2005; Kerrigan et al., 2006). Therefore,
changes in the chondrocyte actin cytoskeletal organisation were studied in
response to 2D culture in vitro. Chondrocytes were subcultured upon 80%
confluence, seeded at that density and allowed to attach overnight before being
fixed in 3% formaldehyde solution. The actin cytoskeleton was labelled as
previously described using phalloidin-alexa 488 and images acquired under
Nyquist settings suitable for deconvolution (Kerrigan et al., 2006). Images were
analysed using ImagePro 7.0 (Maryland, USA) and the fluorescence intensity
obtained throughout the cellular structure and plotted against the standardised
cellular diameter to study the localization of the actin structures. The number of
actin striation units (StU) within the cytoplasm of individual chondrocytes, shown
as ‘peaks’ across baseline background, was obtained for further analysis of the
‘branching’ properties of actin filaments.
In freshly isolated chondrocytes, actin structures were mainly condensed
towards the cell periphery, whereas upon 9 days of culture, actin filaments were
formed throughout the cytoplasmic body as seen by confocal microscopy
(Figure 3.6). There was an average of 1±1StU/cell across the cell cytoplasm of
freshly isolated chondrocytes, whereas after 10 days in 2D culture, the number
increased to 5±2StU/cell. There was no significant change to the number of
striation units upon further culture with 6±1Stu/cell and 5±1StU/cell in P2 and P3
chondrocytes, respectively, thus confirming the loss of a differentiated,
predominantly cortical actin structure within 9 days of culture (i.e. first passage;
Figure 3.7).
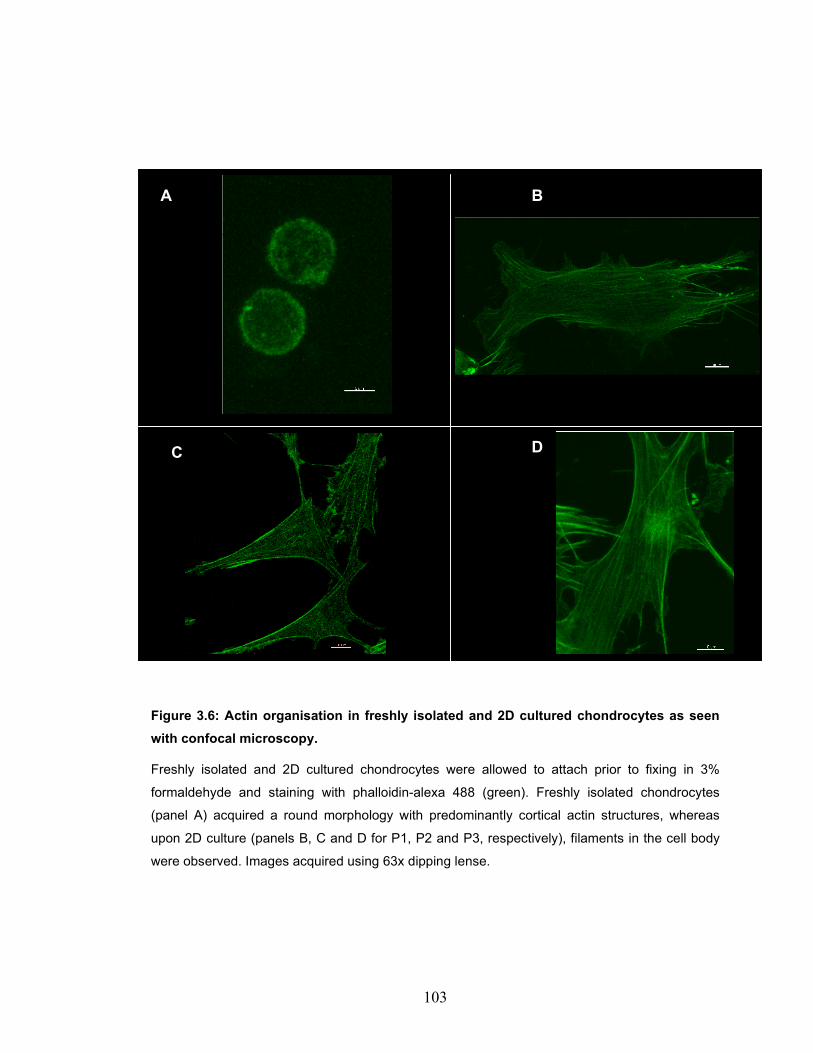
103
Figure 3.6: Actin organisation in freshly isolated and 2D cultured chondrocytes as seen with confocal microscopy.
Freshly isolated and 2D cultured chondrocytes were allowed to attach prior to fixing in 3%
formaldehyde and staining with phalloidin-alexa 488 (green). Freshly isolated chondrocytes
(panel A) acquired a round morphology with predominantly cortical actin structures, whereas
upon 2D culture (panels B, C and D for P1, P2 and P3, respectively), filaments in the cell body
were observed. Images acquired using 63x dipping lense.
A B
D C
104
Figure 3.7: The number of actin striation units across the cell cytoplasm of freshly isolated and 2D cultured chondrocytes,
The fluorescence of actin-phalloidin-alexa 488 complexes was plotted against the standardised
cell diameter and the number of peaks counted as a representative of actin striation units (StU).
Freshly isolated chondrocytes possessed a mean of 1±1 StU/cell whereas upon culture there
was an increase in the number of filaments reaching 5±2 StU/cell within 9 days of culture (P1).
There was no significant change in the number of striation units upon further culture. Experiment
repeated 3 times. N=6, n=127. Data shown as mean ± s.e.m. T-test p-values were deemed
significant when p<0.01 (**). N/S, non significant.
*** ** N
umbe
r of S
tU/c
ell
N/S
105
To further investigate changes in actin organisation upon 2D culture, the values
of actin-phalloidin 488 fluorescence at 10% standardised cell length intervals for
all chondrocytes from one passage were obtained and the mean plotted against
standard cell length as a representative of actin localisation in different
passages. Distinct peaks were observed at both ends of the plot corresponding
to plasma membrane-localised cortical actin structures in chondrocytes from all
passage and the area under the curve representing actin fluorescence against
standardised cell length was calculated by mathematical integration of the
equations of the graphs (Materials and Methods).
Graphs were divided into three distinct regions corresponding to 2 cortical
(binomial) and one cytoplasmic (linear) actin and the percentage of cortical and
filamentous actin recorded for freshly isolated and 2D cultured chondrocytes
(Figure 3.8). In freshly isolated chondrocytes 85.00±4.25% of actin structures
were deemed cortical and upon 9 days in culture there was a significant
decrease in the contribution of submembraneous actin structures (p<0.05) with
only 45.00±2.25% cortical actin in P1 chondrocytes. No further significant
changes in actin ratio were observed upon further culture with 47.00±2.35% and
46±2.30% cortical actin in P2 and P3 chondrocytes, respectively.
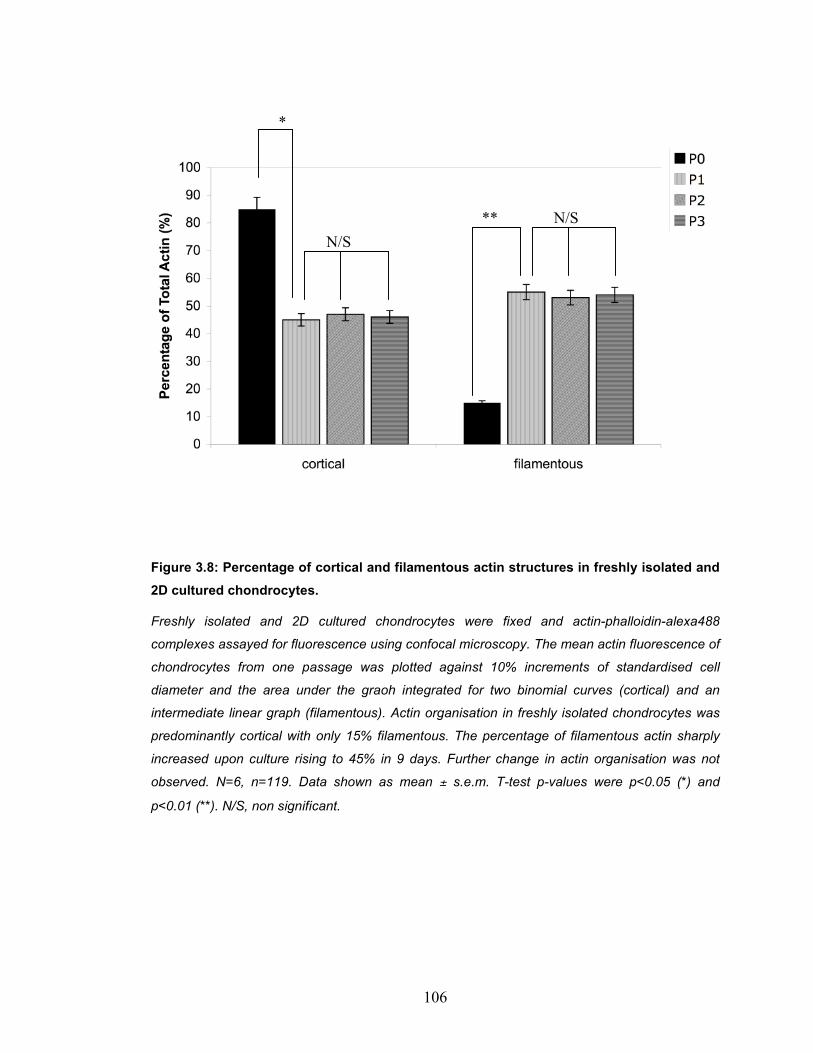
106
Figure 3.8: Percentage of cortical and filamentous actin structures in freshly isolated and 2D cultured chondrocytes.
Freshly isolated and 2D cultured chondrocytes were fixed and actin-phalloidin-alexa488
complexes assayed for fluorescence using confocal microscopy. The mean actin fluorescence of
chondrocytes from one passage was plotted against 10% increments of standardised cell
diameter and the area under the graoh integrated for two binomial curves (cortical) and an
intermediate linear graph (filamentous). Actin organisation in freshly isolated chondrocytes was
predominantly cortical with only 15% filamentous. The percentage of filamentous actin sharply
increased upon culture rising to 45% in 9 days. Further change in actin organisation was not
observed. N=6, n=119. Data shown as mean ± s.e.m. T-test p-values were p<0.05 (*) and
p<0.01 (**). N/S, non significant.
*
** N/S
N/S
107
3.3 Chapter Discussion
It has been well documented that in vitro culture of chondrocytes in 2D
monolayers induces a switch in phenotype from ‘differentiated’ to ‘fibroblast-like’
dedifferentiated. These changes are evident by the loss of the round cellular
shape, the acquisition of flattened irregular morphology and the decrease in type
II to type I collagen expression ratio (Benya & Shaffer, 1982b; Stokes et al.,
2001). Therefore, the loss of the chondrocytic phenotype is a major setback to
chondrocyte expansion and thus cartilage engineering. These distinct changes
were studied in response to a standardised cell culture technique to further our
understanding of chondrocyte phenotype and 2D culture-induced loss of
differentiation.
Firstly, the culture methodology was optimised by growing freshly isolated
chondrocytes at different seeding densities in serum-enriched media and
studying the growth rates. At HD, chondrocytes did not undergo any cell growth
possibly due to contact inhibition (Stoker, 1973) whereas chondrocytes cultured
at MD increased only slightly in number prior to acquiring a ‘flat’ morphology
which may have also promoted contact inhibition. Chondrocytes cultured at LD
divided at a steady rate of 0.27 doublings/day (the equivalent of a doubling time
of 3.66 days) as previously reported (Frondoza et al., 1996; Lee et al., 2003a).
Moreover, it appeared that chondrocytes cultured at LD exhibited significantly
larger cell death when compared to MD and HD cultures, which is possibly
attributed to cell-to-cell interactions promoting cellular survival (Table 3.2).
Similar observations have been reported upon high density culture in porcine
hepatocytes whereby >90% viability initially achieved was followed by a decline
with time (Chen et al., 2002).
108
The first and most apparent effect of monolayer culture was the loss of the
round morphology quantified by studying the sphericity, Ψ, of chondrocytes
(defined as the ratio of the surface area of a sphere with the same volume as a
given chondrocyte to the surface area of the chondrocyte). By the 9th day in
monolayer, a drop in sphericity was observed with no change occuring upon
further culture, thereby indicating the complete loss of morphology as early as
the first passage. These data were consistent with the literature, suggesting a
change in morphology after the 6th day in culture (Shakibaei et al., 1997). This
switch in morphology was further confirmed by studying accompanying changes
in cellular dimensions whereby, upon culture, there was a 1.84-fold decrease in
cell depth (a) and 1.97-fold increase in cell length (c) confirming that the loss of
sphericity was attributed to a ‘flat’ morphology with irregular cellular shape
(Figure 3.4).
Interestingly, in response to culture, an increase in chondrocyte cell volume was
observed from 474.72±32.08µm3 in freshly isolated chondrocytes to
673.38±39.59µm3 following 9 days in monolayer. Whilst the former values for
volume of freshly isolated chondrocytes were in accordance with those reported
in the literature (Bush & Hall, 2001b), changes in cell volume of 2D cultured
chondrocytes were not previously investigated due to the limitation of
fluorescence technology that required the use of spherical fluorescent beads for
the optimization of the methodology. A new method for obtaining volume for
non-spherical ‘objects’ was devised using Imaris version 6.3.1 (Bitplane) and the
depth of the nucleus (termed ‘Nuclear Coefficient’; aη), obtained using standard
methodology for volume acquisition at 60% threshold for round objects, to
standardise the dimensions and cell volume obtained at 10% threshold.
Increase in cell volume may be attributed to (but not exclusively) actin
reorganisation as actin reorganisation in epithelial cells has been shown to
cause cellular enlargement (Boland et al., 1996). Another potential reason for
the increase in chondrocyte cell volume is the culture-induced release from
maturational arrest otherwise observed in OA and hypertrophic chondrocytes
109
(Pullig et al., 2000; Sandell & Aigner, 2001; Serra & Chang, 2003; Ho et al.,
2009).
One of the other prominent changes in chondrocytes associated with the switch
in morphology was observed in the form of the reorganisation of the actin
cytoskeleton where an increase in actin filaments across the cell cytoplasm has
been previously observed but not quantified. Intracellular actin filaments
developed in response to 2D culture with an increase from 1±1StU/cell in freshly
isolated chondrocytes to 5±1StU/cell following 9 days in culture and a general
increase in percentage filamentous actin from 15% to 55% (Figure 3.8).
The cause-and-effect properties of volume, morphology, actin organisation and
expression battery of chondrocytes have been under intensive investigation. It
has been widely documented that reversal of the actin organisation using actin-
depolymerising drugs (including cytochalasin B and D) reverts the expression
back to type II collagen and thus recaptures a differentiated phenotype (Brown &
Benya, 1988; Mallein-Gerin et al., 1991; Pirttiniemi & Kantomaa, 1998)
independently of cell shape (Benya et al., 1988). Furthermore, actin has been
shown to influence volume regulatory mechanisms with latrunculin B (actin
polymerising drug) inducing RVI in freshly isolated chondrocytes by the
activation of NKCC (Kerrigan et al., 2006) and it is therefore possible that the
increase in chondrocyte cell volume in response to 2D culture is induced by the
reorganisation of the actin cytoskeleton.
Finally, modification in the expression ‘battery’ of chondrocytes in response to
2D culture was documented by RT-PCR and densitometery analysis. The ratio
of type II to type I collagen has long been used as a marker of chondrocyte
differentiation (Benya & Shaffer, 1982b; Baici et al., 1988a; Idowu et al., 2000)
and we have similarly reported a 0.58±0.15-fold decline in col2:col1 within the
first passage (9 days of culture) which decreased insignificantly upon further
culture reaching 0.39±0.1 in P3 2D cultured chondrocytes. Interestingly, the

110
fluctuations in the expression levels of individual collagens demonstrated more
distinct changes within 2D cultured chondrocytes. The expression of the
chondrocyte-specific type II collagen transiently yet significantly increased after
9 days in culture prior to returning to baseline levels observed in freshly isolated
chondrocytes upon further culture. Conversely, type I collagen expression levels
increased by 2.70±0.63-fold in P1 chondrocytes and remained elevated for the
remainder of culture as previously reported (Stokes et al., 2002), thus
contributing to the decrease in col2:col1 expression ratio. These data, however,
demonstrated that the loss of phenotype may occur in 2 steps when phenotype
is defined according to expression levels of collagens. P1 chondrocytes
upregulated the expression of both collagens prior to the ultimate suppression of
type II collagen expression and this is consistent with previous findings where an
increase in type II collagen expression in the first 3 passages of high-density
porcine auricular chondrocyte culture was observed (Haisch et al., 2006).
Similar observations were reported upon culture of porcine auricular
chondrocytes where a transient upregulation of type II collagen was observed up
to the 12th day in culture (Haisch et al., 2006).
SOX9 expression levels were also used as a marker of chondrocyte
differentiation as a decline in SOX9-mediated transcription has been reported to
play a role in chondrocytic phenotype (Stokes et al., 2002; Tallheden et al.,
2004). It was, however, observed that the level of SOX9 expression increased
by a factor of 1.75±0.40-fold following 9 days in culture (simultaneously to the
rise in type II collagen expression) and subsequently declined upon further
culture to 0.69±0.14 relative to freshly isolated chondrocytes. SOX9 has been
shown to regulate the expression of type II collagen in chondrocytes (Hattori et
al., 2008), the increase of which was therefore attributed to an upregulation in
SOX9 expression in P1 chondrocytes.
Together, these data have confirmed and quantified changes documented in
response to 2D culture, and although the exact order of events observed cannot

111
be concluded (Figure 3.9), these differences were considered ‘markers’ of
dedifferentiation necessary for future experiments. Moreover, these data
suggested the existence of a distinct phenotype in P1 chondrocytes previously
undefined and thereafter termed ‘mesodifferentiated‡’.
‡ Greek, from mesos, middle.
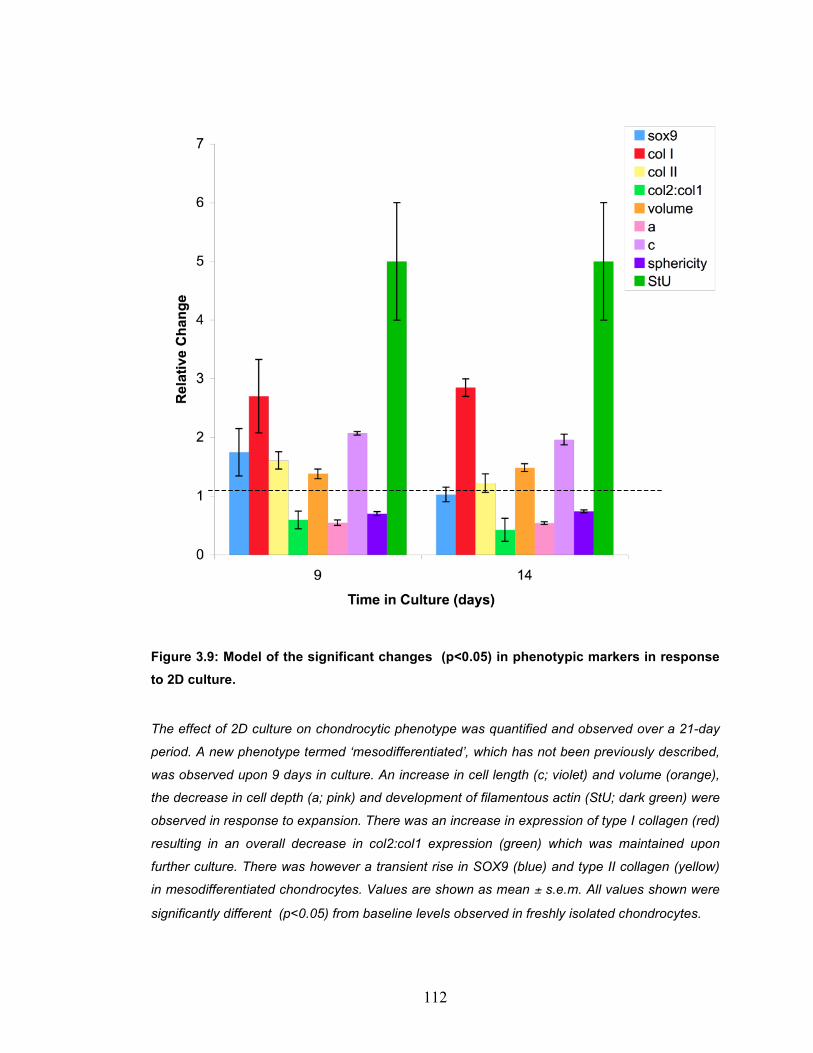
112
Figure 3.9: Model of the significant changes (p<0.05) in phenotypic markers in response to 2D culture.
The effect of 2D culture on chondrocytic phenotype was quantified and observed over a 21-day
period. A new phenotype termed ‘mesodifferentiated’, which has not been previously described,
was observed upon 9 days in culture. An increase in cell length (c; violet) and volume (orange),
the decrease in cell depth (a; pink) and development of filamentous actin (StU; dark green) were
observed in response to expansion. There was an increase in expression of type I collagen (red)
resulting in an overall decrease in col2:col1 expression (green) which was maintained upon
further culture. There was however a transient rise in SOX9 (blue) and type II collagen (yellow)
in mesodifferentiated chondrocytes. Values are shown as mean ± s.e.m. All values shown were
significantly different (p<0.05) from baseline levels observed in freshly isolated chondrocytes.
113
4 Experimental Chapter: The mechanotransduction properties of 2D cultured chondrocytes.
114
4.1 Chapter Introduction
Chondrocytes receive no direct nervous or vascular support and are neverthe-
less able to ‘sense’ and respond to external stimuli (Stockwell, 1991a) using a
group of mechanisms, termed ‘mechanotransduction’. External stimuli that
induce a mechanotransduction response include fluid flow (Yellowley et al.,
1997), fluctuations in osmotic environment (Hall, 1998b), changes in pressure
(Roberts et al., 2001) and deformations in the cell membrane (Roberts et al.,
2001), all of which occur upon joint loading. Chondrocytes feed back in
response to such stimuli by various mechanisms including volume regulatory
mechanisms and/or Ca2+ signalling pathways.
4.1.1 RVI
Regulatory Volume Increase (RVI) is one of the mechanisms by which some
types of cells maintain constant volume and intracellular ionic strength that
supports physiological processes and optimal metabolism (O'Neill, 1999). Upon
an increase in extracellular ionic concentration, passive water outflux occurs
followed by cell shrinkage and activation of certain membrane transporters
including the NKCC (Qusous et al., in press; O’Neill, 1999). Membrane
transporters involved in RVI pump ions across the plasma membrane into the
cell cytoplasm resulting in water influx and gradual restoration of cell volume
(O'Neill, 1999). Experiments aimed at investigating the capacity to exhibit RVI
are conducted by subjecting cells to a hyperosmotic solution and recording
changes in cellular volume. In chondrocytes, it has been shown that only 6% of
freshly isolated and in situ chondrocytes exhibited RVI whereas 54% of 2D
cultured chondrocytes possessed the capacity to regulate their volume in
response to a hyperosmotic challenge (Kerrigan et al., 2006). Therefore, the
capacity of chondrocytes to exhibit RVI was further investigated in 2D
115
chondrocytes as a novel key mechanotransduction marker of chondrocyte
dedifferentiation in response to expansion.
4.1.2 Calcium Signalling
The role of calcium within mechanotransduction is that of an intracellular
secondary messenger. Transient rises in [Ca2+]i have been observed in
response to mechanical stimuli including, both steady (Yellowley et al., 1997)
and oscilliating pressure forces (Edlich et al., 2001), REV5901-loading (Ali et al.,
in press), hyperomsotic (Sanchez & Wilkins, 2004; Dascalu et al.,, 1996) and
hypo-osmotic (Sanchez et al., 2003; Pritchard et al.,, 2004; Kerrigan and Hall,
2008) challenges. Calcium enters the cytoplasm of chondrocytes through cell
membrane calcium channels (including SACC, NCX or members of the TRPV)
or via IP3-induced release from intracellular stores (Yellowley et al., 1999).
Moreover, previous studies have shown that an increase in [Ca2+]i in response
to hypo-osmotic challenge was additionally mediated by SACC and TRPV
channel activation (Sanchez et al., 2003). In contrast, only NCX was involved in
hyperosmotic challenge-induce [Ca2+]i rise (Sanchez & Wilkins, 2004) and these
channels were therefore studied.
REV5901 is an antagonist of cysteinyl-leukotriene receptors (a family of G-
protein coupled receptor; GPCR) in porcine epithelial cells (Van Inwegen et al.,
1987), an inhibitor of rat neutrophil 5-LO (Musser et al., 1987) and an inhibitor of
RVD in articular chondrocytes (Hall & Bush, 2001). It was also recently observed
within our research group that REV5901-loading induced a sustained rise in
[Ca2+]I, thus making REV5901 a suitable pharmacological inducer of [Ca2+]i rise
necessary to study [Ca2+]i responses in chondrocytes. The mode of action of
REV5901 has not been investigated (Ali et al., in press). In response to
histamine or parathyroid hormone exposure, a rise in [Ca2+]i was induced by
PKC activation and IP3 generation, both of which are downstream elements of
GCPR (Iannotti et al., 1990; Horwitz et al., 1996). A known G-protein coupled
116
receptor-mediated pathway was thus proposed and studied in 2D cultured
chondrocytes using appropriate pharmacological inhibitors.
Aims of Experimental Chapter
1 Study the cellular response to hyperosmotic challenge in freshly isolated
and 2D cultured chondrocytes as a potential marker of phenotype.
2 Develop the use of REV5901 as a pharmacological inducer of calcium
responses.
3 Using REV5901-induced [Ca2+]i rise, investigate changes in individual
channel contribution in response to 2D culture .
4 Investigate the REV5901-mediated signalling pathway responsible for
inducing a rise in [Ca2+]i .

117
4.2 Results
4.2.1 Regulatory volume increase (RVI) in freshly isolated and 2D expanded chondrocytes
Previous work has shown that the capacity for chondrocytes to exhibit RVI in
response to hyperosmotic challenge during culture thus providing a novel assay
for the determination of phenotype and mechanotransduction (Kerrigan et al.,
2006). Freshly isolated and 2D-cultured chondrocytes were subjected to a
hyperosmotic challenge (380-540mOsm) and z-stack images acquired at 0
(isosmotic) and subsequently at 1.5, 3, 5, 10 and 20 minutes post challenge by
CLSM, as previously described (see Materials & Methods). Images were
reassembled in Imaris 6.3.1 and an isosurface surpass applied and cell volume
determined.
Following an increase in extracellular osmolarity, freshly isolated chondrocytes
decreased in volume to 0.79±0.05 of their original volume at time 1.5 minutes
and underwent further volume loss readily over the following 20 minutes,
reaching 0.67±0.04 the original volume after 20mins (Figure 4.1A). Conversely,
P1, P2 and P3 chondrocytes decreased in volume by 1.5 minutes to
0.87±0.03%, 0.88±0.02 and 0.86±0.03% respectively which whilst not
significantly different to each other (p>0.05) was significantly different (p<0.05)
from freshly isolated chondrocytes. Unlike freshly isolated chondrocytes P1-P3
chondrocytes exhibited RVI (p<0.05) whereby at 20mins post-osmotic challenge
they had recovered 0.99±0.01, 0.99±0.03% and 0.99±0.03% of their original
respectively volume, respectively (Figure 4.1B-D).

118
Figure 4.1: The capacity of freshly isolated and 2D expanded chondrocytes to exhibit RVI in response to hyperosmotic conditions.
Freshly isolated, P1, P2 and P3 chondrocytes (Panels A, B, C and D, respectively) were loaded
with 5µM calcein-AM and imaged using CLSM before and up to 20 minutes following a 42%
hyperosmotic challenge. Freshly isolated chondrocytes did not exhibit RVI whereas P1, P2 and
P3 2D cultured chondrocytes reaquired 99.6%, 99.8% and 99.7% of their original volume by 20
minutes, respectively. N=4, n=119. Data shown as mean ± s.e.m. T-test p-values were p<0.01
(**).
A B
C D
** **
** **
119
A logarithmic rate of volume regulation was observed in P2 and P3 whereas the
rate followed a linear trend in P1 chondrocytes (Figure 4.1B). Therefore, the
trend of RVI in P2 and P3 was deemed ‘bi-phasic’ including ‘robust’ RVI
between 1.5 and 5 minutes and ‘slow’ RVI between 5 and 20 minutes post
challenge. P1 chondrocytes, however, solely exhibited ‘slow’ RVI throughout the
volume recapture time (1.5->20 minutes) thus lacking ‘bi-phasic’ volume
regulation seen in other 2D expanded cultured passages. The gradient of the
lines representing ‘slow’ and/or ‘robust’ RVI were used to calculate half the time
required for chondrocytes to regain 100% of their original volume (denoted t½).
Slight yet insignificant differences (p>0.5) in t½ of ‘slow’ RVI were observed with
a value of 9.6±0.6, 10.1±0.7 and 10.9±0.5 minutes in P1, P2 and P3,
respectively. t½ values for ‘robust’ RVI in P2 and P3 chondrocytes were 3.5±0.5
and 2.8±0.5 minutes respectively with no significant differences observed
(p>0.5).
As previous work by others showed heterogeneity in the response to mechano-
stimulation including hyperosmotic challenges (Kerrigan et al., 2006), a box plot
was created to study the distribution of population of chondrocytes according to
percentage volume recovery within every passage. It was observed that P1
chondrocytes exhibited lower and upper quartile values of 97.10% and 102.90%
volume recovery, respectively. These values were spanned over a larger range
(p<0.05) upon further culture to 92.15 – 106.31% and 88.04 – 105.90% in P2
and P3 2D cultured chondrocytes, respectively. To further support these
findings, the percentage of chondrocytes exhibiting 90-110% interquartile
volume recovery was obtained for 2D cultured chondrocytes. 91.48% of P1
chondrocytes exhibited interquartile volume recovery whereas only 53.85% and
50.23% of P2 and P3 chondrocytes, respectively, showed RVI within the
corresponding range values with no significant difference between P2 and P3
chondrocytes (p>0.05; Figure 4.2). These data indicated a distinct switch in
chondrocyte mechanotransduction after 9 days in culture and yet another
pattern of RVI exhibited after 14 days in culture (Table 4.1).
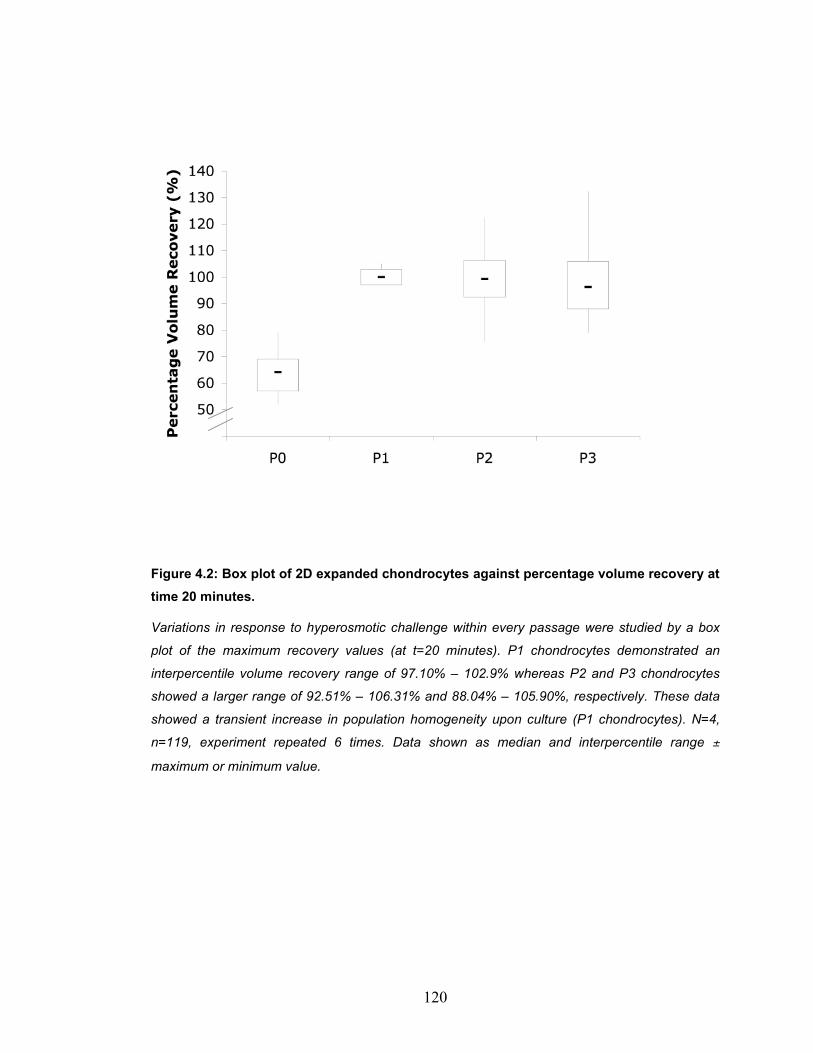
120
Figure 4.2: Box plot of 2D expanded chondrocytes against percentage volume recovery at time 20 minutes.
Variations in response to hyperosmotic challenge within every passage were studied by a box
plot of the maximum recovery values (at t=20 minutes). P1 chondrocytes demonstrated an
interpercentile volume recovery range of 97.10% – 102.9% whereas P2 and P3 chondrocytes
showed a larger range of 92.51% – 106.31% and 88.04% – 105.90%, respectively. These data
showed a transient increase in population homogeneity upon culture (P1 chondrocytes). N=4,
n=119, experiment repeated 6 times. Data shown as median and interpercentile range ±
maximum or minimum value.

121
Table 4.1: Volume regulatory properties of freshly isolated and 2D cultured chondrocytes.
Freshly isolated chondrocytes were characterised by their inability to volume regulate in
response to hyperosmotic challenge whereas upon culture, P1 chondrocytes exhibited a
homogenous ‘slow’ RVI response with a t½ of 9.6±0.9 min and an interpercentile range of
17.76±13.66% volume recovery. Upon further culture, however, P2 and P3 chondrocytes
exhibited bi-phasic volume regulation with slow and robust RVI. P2 and P3 chondrocytes were
also characterised by an increase in the heterogeneity of the response to osmotic challenge.
Cell Type P0 P1 P2 P3
Minimal Percentage Volume (%) 79.7±4.7 87.5±2.6 83.4±2.2 81.9±2.7
Percentage Volume Recovery (%) N/A 99.6±2.9 99.8±2.5 99.7±3.1
Robust RVI t½ (min) N/A N/A 3.5±1.0 2.8±0.9
Slow RVI t½ (min) N/A 9.6±0.9 10.1±1.0 10.9±1.0
Interquartile range of Percentage Recovery ± average whiskers (%) 17.76±13.66 5.80±1.09 13.30±16.53 17.86±17.81
Percentage of cells
Exhibiting interquartile Percentage Recovery
(%)
72.72
91.48
53.85
50.23
122
4.2.2 Calcium mechanotransduction and Homeostasis
As mechanotransduction is linked to phenotype, changes in calcium homeo-
stasis were investigated in response to 2D culture, whereby REV5901 was used
as a pharmacological inducer of [Ca2+]i rise.
4.2.2.1 The effect of REV5901 on [Ca2+]i homeostasis Preliminary work in our research group showed a significant and sustained
increase in [Ca2+]i in both freshly isolated and 2D expanded chondrocytes in
response to 50µM REV5901 loading (Ali et al., in press). In conjunction with
previous work that has demonstrated the influence of REV5901 on volume
regulation, these initial findings indicated an effect of REV5901 on calcium
signalling and thus potentially mechanotransduction.
To determine how REV5901 affected calcium signalling, freshly isolated and 2D
cultured chondrocytes were incubated with 3µM fluo-4 in BPS in the dark for 30
minutes and 37°C. Upon loading a negative control solution (DMSO carrier),
freshly isolated chondrocytes exhibited 1.67±0.32% increase in [Ca2+]i levels
(Figure 4.3A) whereas 2D cultured chondrocytes showed 1.60±0.50%,
1.70±0.81% and 1.60±0.32% increases in P1, P2 and P3 2D cultured
chondrocytes, respectively, in response to fluid flow. When perfused with a final
concentration of 50µM REV5901, however, both freshly isolated and 2D cultured
chondrocytes exhibited a significant and sustained rise in [Ca2+]i levels. Freshly
isolated chondrocytes demonstrated increased sensitivity to REV5901-loading
reaching a maximum increase in [Ca2+]i of 38.0±5.7% compared to P1, P2 and
P3 which reached a maximum [Ca2+]i increase (recorded at the end of the
experiment; t=5 minutes) of 12.5±0.60%, 12.8±1.70% and 18.9±0.81%,
respectively (Figure 4.3B). These data confirmed initial personal observations
that suggested a role for REV5901 in the regulation of intracellular calcium
homeostasis.
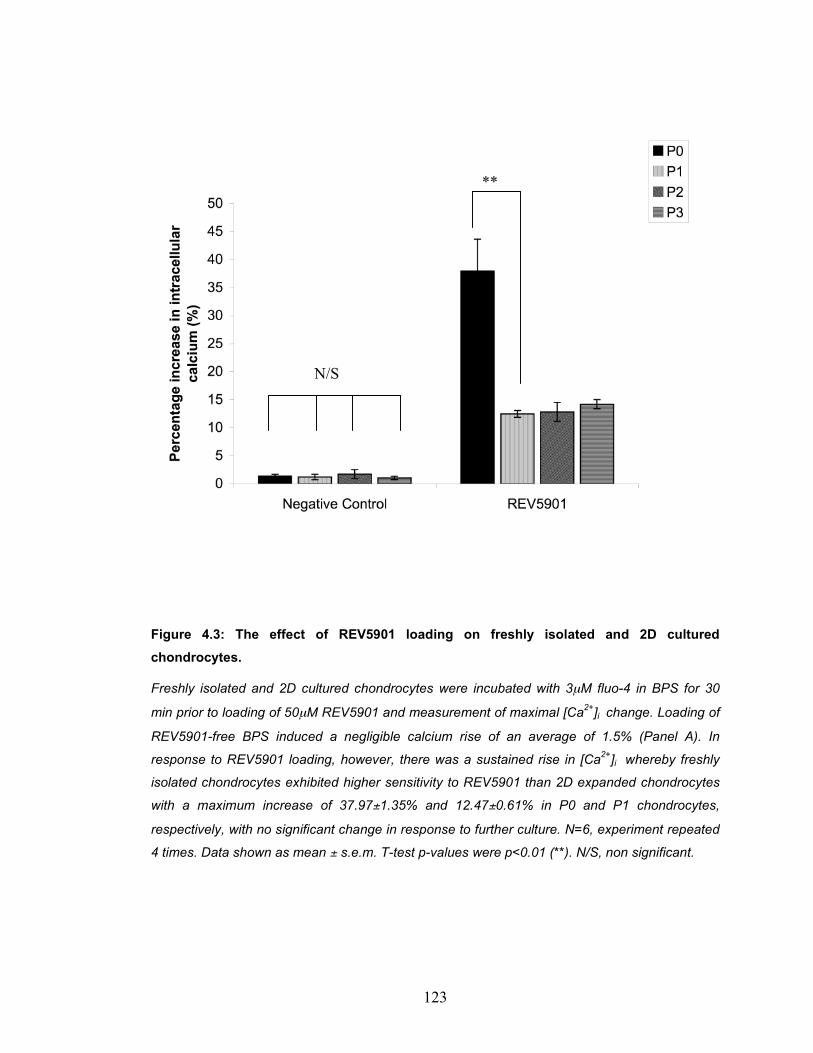
123
Figure 4.3: The effect of REV5901 loading on freshly isolated and 2D cultured chondrocytes.
Freshly isolated and 2D cultured chondrocytes were incubated with 3µM fluo-4 in BPS for 30
min prior to loading of 50µM REV5901 and measurement of maximal [Ca2+]i change. Loading of
REV5901-free BPS induced a negligible calcium rise of an average of 1.5% (Panel A). In
response to REV5901 loading, however, there was a sustained rise in [Ca2+]i whereby freshly
isolated chondrocytes exhibited higher sensitivity to REV5901 than 2D expanded chondrocytes
with a maximum increase of 37.97±1.35% and 12.47±0.61% in P0 and P1 chondrocytes,
respectively, with no significant change in response to further culture. N=6, experiment repeated
4 times. Data shown as mean ± s.e.m. T-test p-values were p<0.01 (**). N/S, non significant.
**
N/S
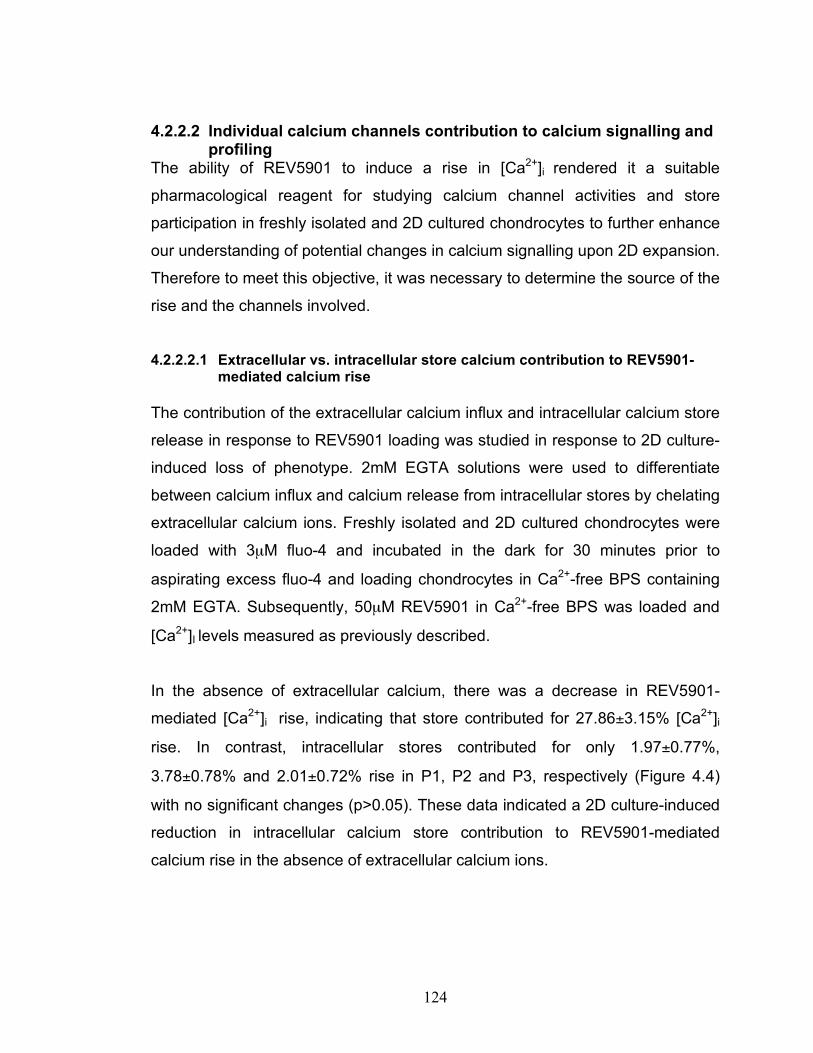
124
4.2.2.2 Individual calcium channels contribution to calcium signalling and profiling
The ability of REV5901 to induce a rise in [Ca2+]i rendered it a suitable
pharmacological reagent for studying calcium channel activities and store
participation in freshly isolated and 2D cultured chondrocytes to further enhance
our understanding of potential changes in calcium signalling upon 2D expansion.
Therefore to meet this objective, it was necessary to determine the source of the
rise and the channels involved.
4.2.2.2.1 Extracellular vs. intracellular store calcium contribution to REV5901-
mediated calcium rise The contribution of the extracellular calcium influx and intracellular calcium store
release in response to REV5901 loading was studied in response to 2D culture-
induced loss of phenotype. 2mM EGTA solutions were used to differentiate
between calcium influx and calcium release from intracellular stores by chelating
extracellular calcium ions. Freshly isolated and 2D cultured chondrocytes were
loaded with 3µM fluo-4 and incubated in the dark for 30 minutes prior to
aspirating excess fluo-4 and loading chondrocytes in Ca2+-free BPS containing
2mM EGTA. Subsequently, 50µM REV5901 in Ca2+-free BPS was loaded and
[Ca2+]I levels measured as previously described.
In the absence of extracellular calcium, there was a decrease in REV5901-
mediated [Ca2+]i rise, indicating that store contributed for 27.86±3.15% [Ca2+]i
rise. In contrast, intracellular stores contributed for only 1.97±0.77%,
3.78±0.78% and 2.01±0.72% rise in P1, P2 and P3, respectively (Figure 4.4)
with no significant changes (p>0.05). These data indicated a 2D culture-induced
reduction in intracellular calcium store contribution to REV5901-mediated
calcium rise in the absence of extracellular calcium ions.
125
Figure 4.4: Effect of extracellular calcium removal on REV5901-induced calcium rise in freshly isolated and 2D cultured chondrocytes.
Freshly isolated and 2D cultured chondrocytes were incubated with 3µM fluo-4 in BPS for 30
minutes prior to loading of 50µM REV5901 and measurement of maximal [Ca2+]i change in the
presence of 2mM EGTA. In freshly isolated chondrocytes, there was a maximal [Ca2+]i rise of
27.86±3.15% which dropped upon 2D culture to 1.97±0.77%, 3.78±0.78% and 2.01±0.72% in
P1, P2 and P3 chondrocytes, respectively. These data induicated a reduction in store
contribution to REV5901-mediared [Ca2+]i rise upon 2D culture. N=6, experiment repeated 4
times. Data shown as means ± s.e.m. T-test p-values were p<0.01 (**). N/S, non significant.
**
N/S
**
126
4.2.2.2.2 Transmembrane channels contribution to REV5901-mediated calcium
rise
As the level of REV5901-induced transmembrane Ca2+ influx was not affected
by 2D culture, membrane channel-dependent [Ca2+]i regulation was investigated
as a key mechanotransduction pathway using pharmacological or chemical
inhibitors to calcium influx. Individual groups of calcium channels were chosen
including NCX, SACC and TRPV channels as previous work has suggested their
involvement in osmotic challenge-induced [Ca2+]i rise (Sanchez et al., 2003;
Sanchez & Wilkins, 2004). Freshly isolated and 2D cultured chondrocytes were
loaded with fluo-4 and incubated in the dark for 30 minutes with or without
appropriate inhibitory conditions (Table 2.6) and subsequently REV5901 loaded
and [Ca2+]I levels measured as previously described.
Significant differences in the sensitivity to pharmacological inhibition of calcium
channels were observed between freshly isolated and cultured chondrocytes but
not between 2D cultured chondrocytes from different passages, thereby
indicating changes in channel physiology upon 2D culture. No significant
differences (p>0.5) were observed in the sensitivity of freshly isolated and 2D
cultured chondrocytes to ruthenium red inhibition of the TRPV channels with
46.36±6.66, 49.32±6.87%, 51.15±14.07 and 55.13±22.75% inhibition of total
[Ca2+]i rise in freshly isolated, P1, P2 and P3 2D cultured chondrocytes,
respectively.
The sensitivity of chondrocytes to the absence of extracellular Na+ was reduced
upon culture from 84.03±9.22% inhibition of total [Ca2+]i rise in freshly isolated
chondrocytes to 57.86±2.76% in P1 2D cultured chondrocytes indicating a loss
of dependency on NCX function upon culture with no further significant change
upon subsequent culture (57.42±11.95% and 55.41±8.00% in P2 and P3
chondrocytes, respectively; p>0.05). Conversely, in the presence of Gd3+, the
inhibition of total [Ca2+]i rise in chondrocytes was increased upon culture from
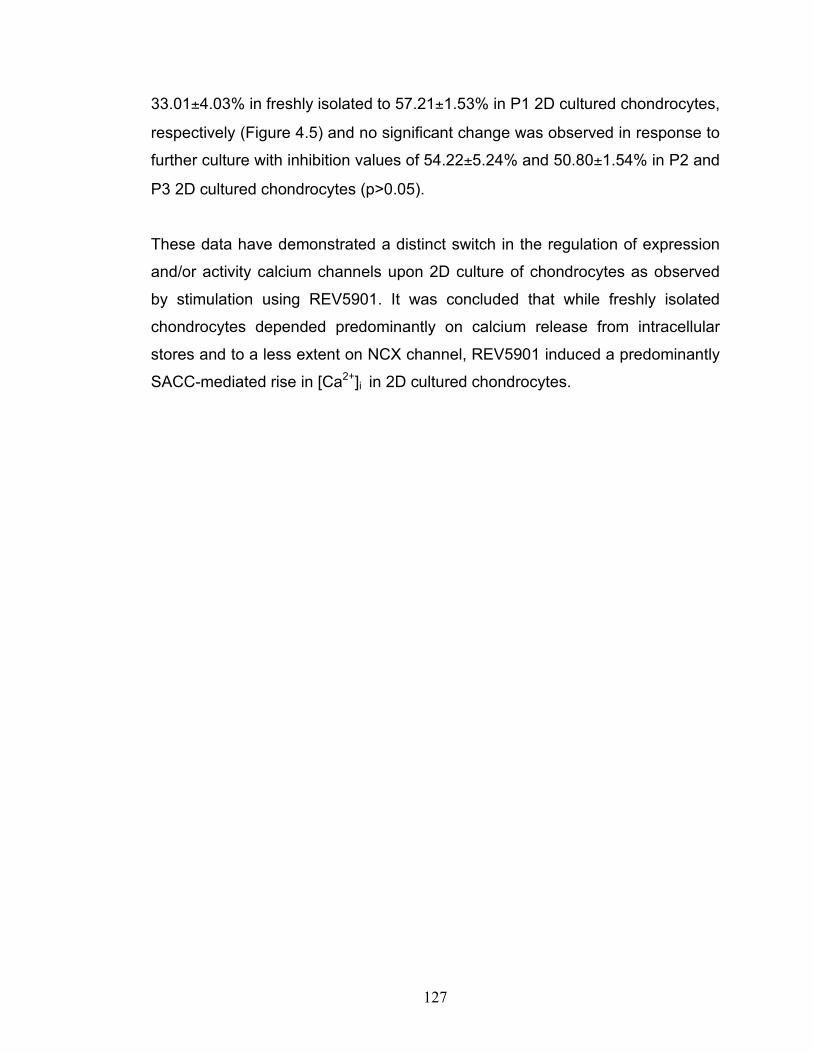
127
33.01±4.03% in freshly isolated to 57.21±1.53% in P1 2D cultured chondrocytes,
respectively (Figure 4.5) and no significant change was observed in response to
further culture with inhibition values of 54.22±5.24% and 50.80±1.54% in P2 and
P3 2D cultured chondrocytes (p>0.05).
These data have demonstrated a distinct switch in the regulation of expression
and/or activity calcium channels upon 2D culture of chondrocytes as observed
by stimulation using REV5901. It was concluded that while freshly isolated
chondrocytes depended predominantly on calcium release from intracellular
stores and to a less extent on NCX channel, REV5901 induced a predominantly
SACC-mediated rise in [Ca2+]i in 2D cultured chondrocytes.
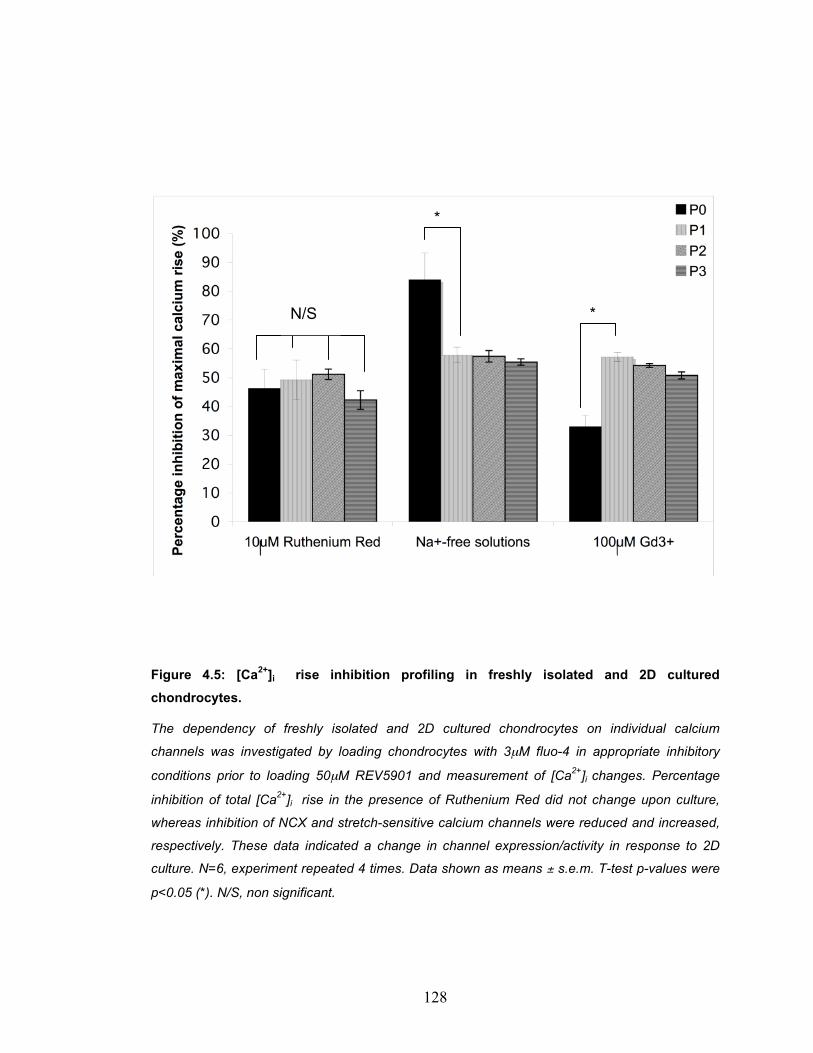
128
Figure 4.5: [Ca2+]i rise inhibition profiling in freshly isolated and 2D cultured chondrocytes.
The dependency of freshly isolated and 2D cultured chondrocytes on individual calcium
channels was investigated by loading chondrocytes with 3µM fluo-4 in appropriate inhibitory
conditions prior to loading 50µM REV5901 and measurement of [Ca2+]i changes. Percentage
inhibition of total [Ca2+]i rise in the presence of Ruthenium Red did not change upon culture,
whereas inhibition of NCX and stretch-sensitive calcium channels were reduced and increased,
respectively. These data indicated a change in channel expression/activity in response to 2D
culture. N=6, experiment repeated 4 times. Data shown as means ± s.e.m. T-test p-values were
p<0.05 (*). N/S, non significant.
N/S
*
*

129
4.2.2.3 The mechanism of effect of REV5901 on intracellular calcium concentration [Ca2+]i
REV5901 is typically used as an inhibitor of RVD mechanisms in freshly isolated
chondrocytes possibly via actin re-organisation (Bush and Hall, 2001;
Nadelcheva et al., in press). As 2D cultured chondrocytes exhibited a reduced
intracellular calcium response to REV5901, the pathway of action of REV5901
loading on [Ca2+]i homeostasis was further investigated in freshly isolated
chondrocytes to investigate all mechanisms which may not exist in 2D cultured
counterparts. The proposed G-protein-induced pathway for REV5901-induced
[Ca2+]I rise using individual pharmacological agents against the individual
proteins downstream of the receptor (Table 2.6). Chondrocytes were loaded with
3µM Fluo-4 in basic physiological saline (BPS) containing individual
pharmacological agents for 30 minutes prior to REV5901 loading and
measurement of intracellular calcium changes.
1µM Wartmannin, an inhibitor of PI5K (Liu et al., 2001), did not cause inhibition
of the REV5901-mediated calcium rise, indicating the lack of contribution by the
PIP3/PI5K pathway to [Ca2+]i levels. Neomycin sequestering of PIP2 molecules
reduced the initial calcium ‘burst’ with maximum [Ca2+]i rise of 23.79±2.21%,
whereas 100µM U73122 (inhibitor PLCβ3) decreased the rate of [Ca2+]i rise
thus reaching a final [Ca2+]i increase of 23.09±2.70%. Finally, incubation with
100µM Rottlerin reduced REV5901-induced [Ca2+]i rise to 2.27±3.30%
inhibition of the calcium rise demonstrating the dependency of the pathway on
PKC activity (Figure 4.6).
130
Figure 4.6: Changes in [Ca2+]I in response to REV5901 loading in the presence of pharmacological inhibitors to G-protein downstream elements.
Freshly isolated chondrocytes were incubated with 3µM fluo-4 and suitable pharmacological
agents required to inhibit signalling molecules downstream of G-proteins. Upon 30 minute
incubation, media containing excess fluo-4 were replaced with BMP containing pharmacological
agents and baseline bound [Ca2+]i measured prior to loading 50µM REV5901 in BPS. Rottlerin
reduced the maximal calcium rise to 2.27% compared to REV5901 control. Both U73122 and
neomycin caused an overall inhibition of 45% with neomycin also causing a distinctive reduction
in the original burst of [Ca2+]i. N=4, experiment repeated 6 times. Data shown as means ± s.e.m.
T-test p-values were p<0.01 (**). N/S, non significant.
A
B
**
**
**
*
N/S **
131
The rate of calcium increase with and without pharmacological reagents was
further studied by dividing the change in percentage fluorescence over the time
of measurement. REV5901 solution induced an increase in [Ca2+]i at a rate of
3.81±0.42%/min which was reduced in the presence of EGTA and U73122 to
0.95±0.10%/min and 1.75±0.19%/min, respectively (Table 4.2). In the presence
of Rottlerin, however, the initial rise was followed by a gradual slight decrease at
0.39±0.04%/min. Exclusively to treatment with of Neomycin, the initial calcium
rise was delayed by up to 28.8 seconds post REV5901 loading increasing
gradually at the same rate (3.85±0.42%/min) as a neomycin-free REV5901
solution (Table 4.2).
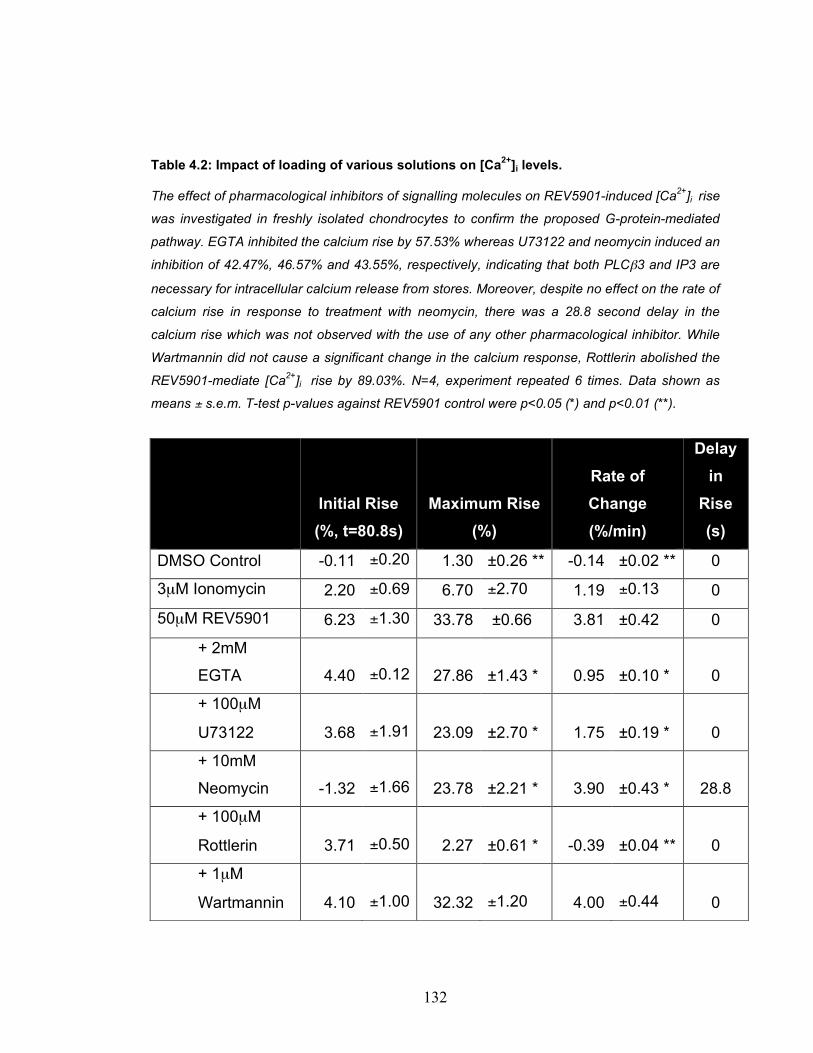
132
Table 4.2: Impact of loading of various solutions on [Ca2+]i levels.
The effect of pharmacological inhibitors of signalling molecules on REV5901-induced [Ca2+]i rise
was investigated in freshly isolated chondrocytes to confirm the proposed G-protein-mediated
pathway. EGTA inhibited the calcium rise by 57.53% whereas U73122 and neomycin induced an
inhibition of 42.47%, 46.57% and 43.55%, respectively, indicating that both PLCβ3 and IP3 are
necessary for intracellular calcium release from stores. Moreover, despite no effect on the rate of
calcium rise in response to treatment with neomycin, there was a 28.8 second delay in the
calcium rise which was not observed with the use of any other pharmacological inhibitor. While
Wartmannin did not cause a significant change in the calcium response, Rottlerin abolished the
REV5901-mediate [Ca2+]i rise by 89.03%. N=4, experiment repeated 6 times. Data shown as
means ± s.e.m. T-test p-values against REV5901 control were p<0.05 (*) and p<0.01 (**).
Initial Rise (%, t=80.8s)
Maximum Rise (%)
Rate of Change (%/min)
Delay in
Rise (s)
DMSO Control -0.11 ±0.20 1.30 ±0.26 ** -0.14 ±0.02 ** 0
3µM Ionomycin 2.20 ±0.69 6.70 ±2.70 1.19 ±0.13 0
50µM REV5901 6.23 ±1.30 33.78 ±0.66 3.81 ±0.42 0
+ 2mM
EGTA 4.40 ±0.12 27.86 ±1.43 * 0.95 ±0.10 * 0
+ 100µM
U73122 3.68 ±1.91 23.09 ±2.70 * 1.75 ±0.19 * 0
+ 10mM
Neomycin -1.32 ±1.66 23.78 ±2.21 * 3.90 ±0.43 * 28.8
+ 100µM
Rottlerin 3.71 ±0.50 2.27 ±0.61 * -0.39 ±0.04 ** 0
+ 1µM
Wartmannin 4.10 ±1.00 32.32 ±1.20 4.00 ±0.44 0
133
4.3 Chapter Discussion
Mechanotransduction is the term used to describe the processes by which
chondrocytes ‘respond’ to extracellular mechanical stimuli by initiating cellular
signalling pathways often involving the regulation of [Ca2+]i levels. Examples of
these extracellular stimuli include pressure, fluid flow and oscillations in
extracellular ionic environment. Previous work has shown RVI and Gd3+-
sensitive calcium rise (in response to hypo-osmotic conditions) were exclusive to
2D cultured chondrocytes indicating a switch in the cellular response to external
stimuli upon loss of phenotype (Kerrigan and Hall, 2008). Therefore,
chondrocyte response to hyperosmotic challenge and chondrocyte calcium
signalling were studied as key markers of chondrocyte phenotype.
The capacity of chondrocytes to exhibit RVI in response to a hyperosmotic
challenge was studied as a key marker of differentiation. It was previously
observed that freshly isolated chondrocytes did not exhibit RVI whereas upon
2D culture, RVI is activated and principally mediated by the NKCC (Kerrigan et
al., 2006; Qusous et al., in press). Furthermore, volume regulatory mechanisms
have been previously classified into ‘slow’ and ‘robust’ (Kerrigan & Hall, 2008)
but passage-dependency was not investigated. We have shown that P1
chondrocytes exhibited linear volume recovery deemed ‘slow’ RVI over the
course of the experiment recovering at a t½ of 9.60±0.9 minutes. Conversely,
P2 and P3 chondrocytes exhibited logarithmic volume recovery deemed
‘biphasic’ with robust RVI at a rate of t½ of 3.5±1.0 and 2.8±0.39 minutes,
respectively, followed by slow RVI at a rate of t½ of 10.1±1.0 and 10.9±1.0
(Table 4.1).
These data confirm previous work by others who suggested that cultured
chondrocytes undergo a switch in mechanotransduction responses (Kerrigan et
134
al., 2006; Kerrigan & Hall, 2008), and our earlier observations that an
intermediate dedifferentiated phenotype (termed ‘mesodifferentiated’) existed in
P1 chondrocytes prior to final dedifferentiation upon further culture. The
difference in RVI response in P1 could be mediated by the NKCC as previous
work has shown that bumentanide-sensitive RVI can be induced in freshly
isolated chondrocytes by actin depolymerisation (Kerrigan et al., 2006). No
change in NKCC expression was reported in response to 2D culture (Stokes et
al., 2002) and it is therefore conceivable that a change in NKCC activity,
possibly regulated by actin organisation, rather than expression, is accountable
for the lack of robust RVI in P1 chondrocytes.
Furthermore, chondrocytes have been found not to exhibit RVI in situ in
response to hyperosmotic conditions, and therefore cell shrinkage provided
chondrocytes with protective mechanism from joint articulation (Parker et al., in
press). It is therefore possible that differentiated chondrocytes do not exhibit RVI
to maximise these benefits of cellular shrinkage which may lose significance
upon loss of the differentiated state. This might furthermore explain the
existence of a small population of chondrocytes possessing a volume of
2500µm3 in degenerate cartilage tissue (Bush & Hall, 2005) where loss of
phenotype occurs.
The variation within chondrocyte populations of the same passage number was
observed using box plot analysis, which indicated a more homogenous
response in P1 chondrocytes when compared to freshly isolated chondrocytes,
P2 or P3 chondrocytes (Figure 4.2). Chondrocytes in situ possess a wide range
of cell volume (Bush and Hall, 2001) and are exposed to different extents of
mechanical stimuli (Urban, 1994). Our results showed that freshly isolated
chondrocytes appear to constitute a heterogeneous population as observed by
the response to hyperosmotic conditions. The loss of heterogeneity upon
introduction to culture may be attributed to what appears to be a relatively
selective culture technique and thus a more homogenous response in
135
mesodifferentiated chondrocytes. Upon further culture, chondrocytes appear to
dedifferentiate into another heterogeneous population capable of a wide range
of response to a hyperosmotic challenge.
Intracellular calcium is a key regulator of various intracellular functions including
mechanotransduction, and changes in [Ca2+]i levels have been observed in
response to various other mechanical stimuli. Previous work has shown that
incubation with REV5901 induced an immediate and sustained elevation in
[Ca2+]I (Ali et al., in press), thereby suggesting a potential mechanism by which
REV5901 inhibits other cellular functions including RVD and 5-Lipoxygenase
activity. The ability of REV5901 to induce a rise in [Ca2+]i rendered it a suitable
pharmacological candidate for modulation of [Ca2+]i levels for further studies
aimed at using calcium homeostasis mechanisms as a marker of phenotype.
Changes in [Ca2+]i signalling in response to expansion were studied using
REV5901 as an inducer of [Ca2+]i rise and it was observed that there was a
decrease in REV5901-induced intracellular store-mediated calcium release in
response to 2D culture. Previous work has shown that mechanical pressure
enhanced the sensitivity of IP3R channel (Zhang et al., 2006) possibly due to
chondroprotective calcium mechanisms (Amin et al., 2008). Therefore, it is
suggested that, like the loss of mechanical stimuli, the loss of phenotype may
decrease sensitivity of intracellular calcium stores to REV5901 in 2D cultured
chondrocytes. Conversely, an increase in store operation, via various stimuli
including IP3 receptor upregulation, has been seen in response to culture of
both myocytes and smooth muscle cells (Dreja et al., 2001; Berra-Romani et al.,
2008).
No change in extracellular calcium influx was observed in REV5901 treated 2D
chondrocytes despite changes in individual channel contribution to calcium influx
as determined by using calcium channel inhibitors (Figure 4.4). Incubation with
75µM ruthenium red prior to REV5901 loading induced a 46.36±2.53% inhibition
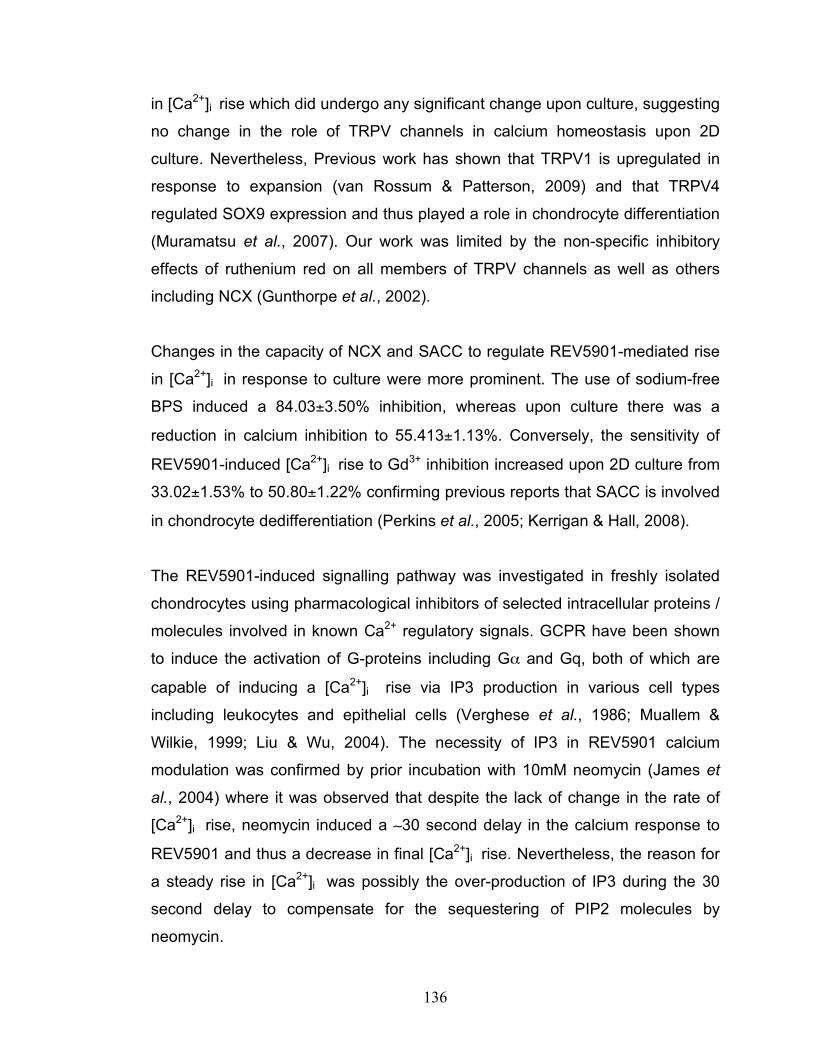
136
in [Ca2+]i rise which did undergo any significant change upon culture, suggesting
no change in the role of TRPV channels in calcium homeostasis upon 2D
culture. Nevertheless, Previous work has shown that TRPV1 is upregulated in
response to expansion (van Rossum & Patterson, 2009) and that TRPV4
regulated SOX9 expression and thus played a role in chondrocyte differentiation
(Muramatsu et al., 2007). Our work was limited by the non-specific inhibitory
effects of ruthenium red on all members of TRPV channels as well as others
including NCX (Gunthorpe et al., 2002).
Changes in the capacity of NCX and SACC to regulate REV5901-mediated rise
in [Ca2+]i in response to culture were more prominent. The use of sodium-free
BPS induced a 84.03±3.50% inhibition, whereas upon culture there was a
reduction in calcium inhibition to 55.413±1.13%. Conversely, the sensitivity of
REV5901-induced [Ca2+]i rise to Gd3+ inhibition increased upon 2D culture from
33.02±1.53% to 50.80±1.22% confirming previous reports that SACC is involved
in chondrocyte dedifferentiation (Perkins et al., 2005; Kerrigan & Hall, 2008).
The REV5901-induced signalling pathway was investigated in freshly isolated
chondrocytes using pharmacological inhibitors of selected intracellular proteins /
molecules involved in known Ca2+ regulatory signals. GCPR have been shown
to induce the activation of G-proteins including Gα and Gq, both of which are
capable of inducing a [Ca2+]i rise via IP3 production in various cell types
including leukocytes and epithelial cells (Verghese et al., 1986; Muallem &
Wilkie, 1999; Liu & Wu, 2004). The necessity of IP3 in REV5901 calcium
modulation was confirmed by prior incubation with 10mM neomycin (James et
al., 2004) where it was observed that despite the lack of change in the rate of
[Ca2+]i rise, neomycin induced a ∼30 second delay in the calcium response to
REV5901 and thus a decrease in final [Ca2+]i rise. Nevertheless, the reason for
a steady rise in [Ca2+]i was possibly the over-production of IP3 during the 30
second delay to compensate for the sequestering of PIP2 molecules by
neomycin.
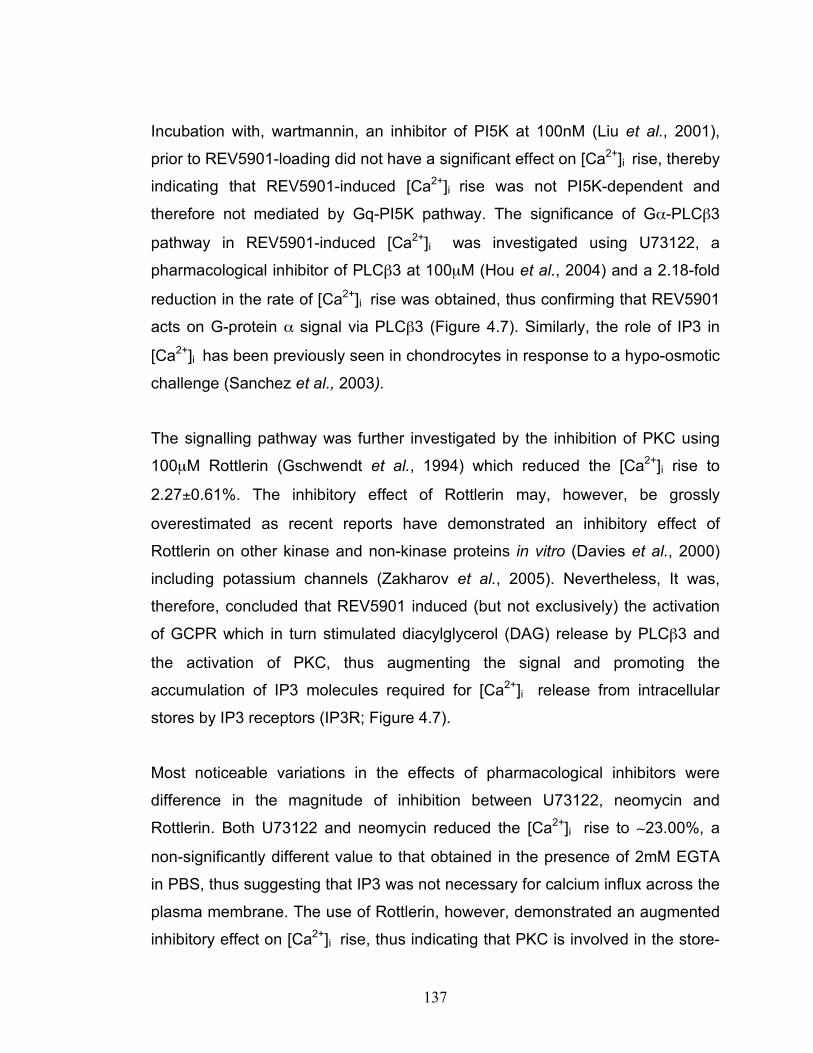
137
Incubation with, wartmannin, an inhibitor of PI5K at 100nM (Liu et al., 2001),
prior to REV5901-loading did not have a significant effect on [Ca2+]i rise, thereby
indicating that REV5901-induced [Ca2+]i rise was not PI5K-dependent and
therefore not mediated by Gq-PI5K pathway. The significance of Gα-PLCβ3
pathway in REV5901-induced [Ca2+]i was investigated using U73122, a
pharmacological inhibitor of PLCβ3 at 100µM (Hou et al., 2004) and a 2.18-fold
reduction in the rate of [Ca2+]i rise was obtained, thus confirming that REV5901
acts on G-protein α signal via PLCβ3 (Figure 4.7). Similarly, the role of IP3 in
[Ca2+]i has been previously seen in chondrocytes in response to a hypo-osmotic
challenge (Sanchez et al., 2003).
The signalling pathway was further investigated by the inhibition of PKC using
100µM Rottlerin (Gschwendt et al., 1994) which reduced the [Ca2+]i rise to
2.27±0.61%. The inhibitory effect of Rottlerin may, however, be grossly
overestimated as recent reports have demonstrated an inhibitory effect of
Rottlerin on other kinase and non-kinase proteins in vitro (Davies et al., 2000)
including potassium channels (Zakharov et al., 2005). Nevertheless, It was,
therefore, concluded that REV5901 induced (but not exclusively) the activation
of GCPR which in turn stimulated diacylglycerol (DAG) release by PLCβ3 and
the activation of PKC, thus augmenting the signal and promoting the
accumulation of IP3 molecules required for [Ca2+]i release from intracellular
stores by IP3 receptors (IP3R; Figure 4.7).
Most noticeable variations in the effects of pharmacological inhibitors were
difference in the magnitude of inhibition between U73122, neomycin and
Rottlerin. Both U73122 and neomycin reduced the [Ca2+]i rise to ∼23.00%, a
non-significantly different value to that obtained in the presence of 2mM EGTA
in PBS, thus suggesting that IP3 was not necessary for calcium influx across the
plasma membrane. The use of Rottlerin, however, demonstrated an augmented
inhibitory effect on [Ca2+]i rise, thus indicating that PKC is involved in the store-

138
independent direct activation of calcium channels. Potential channel targets of
PKC activation may include TRPV1 as recent reports have shown that the
phospohorylation of TRPV1 requires PKC, protein kinase A and protein
phosphatase 2B in embryonic kidney cell line (van Rossum & Patterson, 2009).
The expression of TRPV1 has been confirmed in both freshly isolated and 2D
cultured chondrocytes (Gavenis et al., 2009).
In conclusion, these data have quantified changes in mechanotransduction
responses to expansion. In contrast to freshly isolated chondrocytes, 2D
cultured chondrocytes exhibited RVI with a distinct response trend in P1
chondrocytes confirming the existence of a different phenotype in the first 9 days
of culture. REV5901-induced rise in [Ca2+]i was investigated and a reduction in
store-sensitivity observed upon culture. Moreover, the role of NCX, SACC and
possibly TRPV1 has been suggested in chondrocyte homeostasis with changes
in individual contributions reported in response to 2D culture. Finally, these data
have documented changes in mechanotransduction upon 2D culture, thereby
indicating that these responses may be used as phenotypic markers of a
differentiated chondrocyte phenotype to ensure optimal performance of
expanded chondrocytes in artificial cartilage.
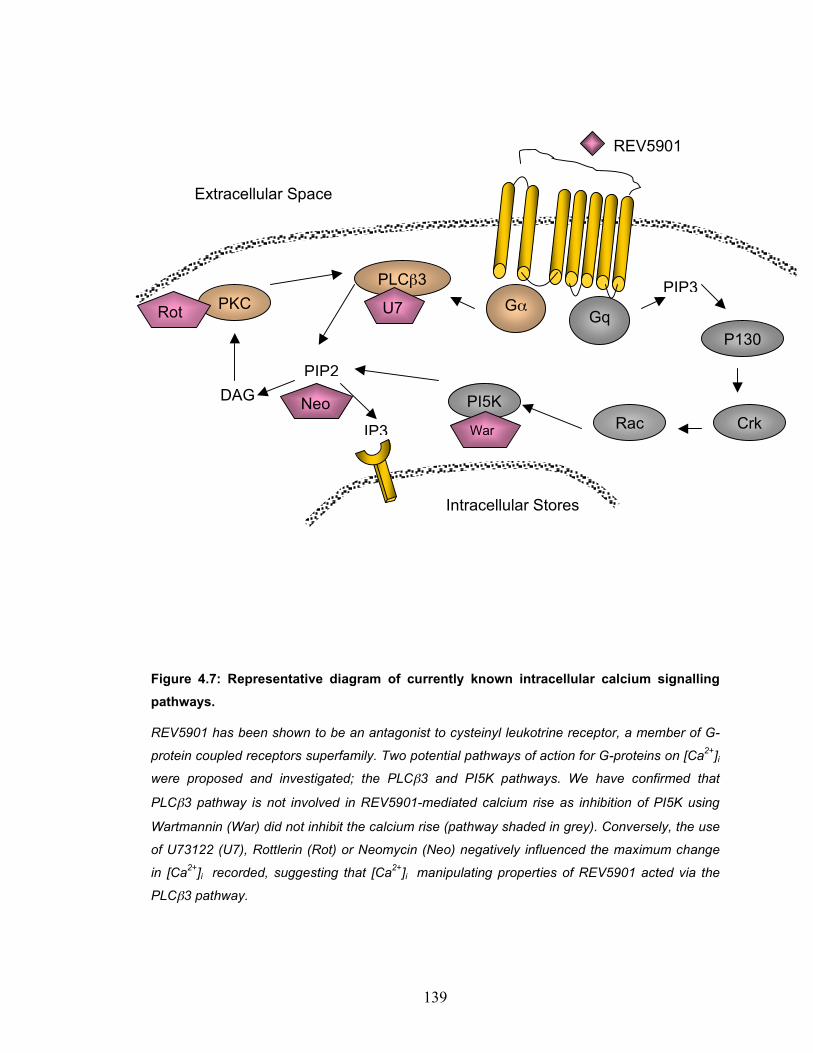
139
Figure 4.7: Representative diagram of currently known intracellular calcium signalling pathways.
REV5901 has been shown to be an antagonist to cysteinyl leukotrine receptor, a member of G-
protein coupled receptors superfamily. Two potential pathways of action for G-proteins on [Ca2+]i
were proposed and investigated; the PLCβ3 and PI5K pathways. We have confirmed that
PLCβ3 pathway is not involved in REV5901-mediated calcium rise as inhibition of PI5K using
Wartmannin (War) did not inhibit the calcium rise (pathway shaded in grey). Conversely, the use
of U73122 (U7), Rottlerin (Rot) or Neomycin (Neo) negatively influenced the maximum change
in [Ca2+]i recorded, suggesting that [Ca2+]i manipulating properties of REV5901 acted via the
PLCβ3 pathway.
Gα Gq
PKC PLCβ3
PIP2 DAG
IP3
PI5K
PIP3
Rac Crk
P130
Neo.
Rot U7
War
Intracellular Stores
Extracellular Space
REV5901
140
5 Experimental Chapter: The role of DEL1 in 2D chondrocytes expansion
141
5.1 Chapter introduction
Integrin signalling has been the subject of intensive studies over the last 2
decades since the term was first used to describe cell surface receptors which
mediate cellular adhesion and interaction with the extracellular matrix (Tamkun
et al., 1986; Ruoslahti & Pierschbacher, 1987). Integrins are transmembrane
dimers composed of α and/or β chains non-covalently bound together with
ligand specificity determined by the combination of the chains (Hemler, 1990;
Hynes, 1992). In chondrocytes of healthy cartilage, several integrins have been
found to be expressed with especially elevated levels of α1β1, α5β1 (fibronectin
recpetor; FnR) and αvβ5 in addition to α3β1 and αvβ3 (Woods et al., 1994).
Conversely, chondrocytes from OA cartilage expressed elevated levels of α2,
α4 and β2 chains (Ostergaard et al., 1998) with a reduction in β1 chains
inversely related to the progression of OA (Lapadula et al., 1997, 1998). Upon
isolation, chondrocytes have been shown to possess elevated levels of α2, α5,
α6, αv and β1 chains (Durr et al., 1993) whereas upon monolayer culture there
was a decrease in α1 and an increase in α2-6 chains and α5β1 heterodimers
(Enomoto-Iwamoto et al., 1997; Diaz-Romero et al., 2005). These findings
indicate a role for integrins in the maintenance of chondrocyte homeostasis in
different conditions and thus the regulation of chondrocytic phenotype.
Integrin signalling induces a set of cellular functions including differentiation,
morphology switch, actin organtisation, growth and survival as well as cellular
attachment, the initial and most anticipated function (Aszodi et al., 2003;
Zemmyo et al., 2003; Bengtsson et al., 2005). α2β1 chains were identified as
essential for chondrocyte attachment on type II collagen-coated plates whereas
α5β1 chains were required for attachment on fibronectin-coated plates
(Enomoto-Iwamoto et al., 1997) or on a monolayer of fibroblasts
(Ramachandrula et al., 1992). It was observed that α2, α3 and β1 chains are
142
involved in mediating a signal that promotes collagen X production with the β1
being additionally involved in actin polymerisation and survival (Hirsch et al.,
1997), maintanance of spherical morphology (Shakibaei et al., 1997), and
enhancing TGF-induced differentiated phenotype (Scully et al., 2001).
Conversely, α5β1 heterodimer has been shown to induce collagenase and
stromelysin production in synovial fibroblasts (Werb et al., 1989), coordinate
cartilage differentiation in mouse embryos (Garciadiego-Cazares et al., 2004),
mediate a switch to fibroblast-like morphology (Ramachandrula et al., 1992) and
proliferation in articular chondrocytes (Enomoto-Iwamoto et al., 1997).
DEL1 is a 52-kDa extracellular matrix integrin ligand composed of two
carbohydrate-binding discoidin domains and two EGF-like Ca2+-binding repeats,
the second of which contains an RGD motif (Hidai et al., 1998). DEL1 is
expressed by endothelial cells during embryological vascular development and
has been shown to be expressed in angiogenic neoplastic tissue (Aoka et al.,
2002), ischemic tissue (Ho et al., 2004) and human foetal chondrocytes (Stokes
et al., 2002). Similarly to another member of the EGF-like repeats and discoidin
I-like proteins (Lactadherin; EDIL1), DEL1 activity requires the interaction with
integrin αvβ3 (Penta et al., 1999; Silvestre et al., 2005) and upon DEL1 ligation,
integrins undergo aggregation and induce phophorylation of downstream
signalling proteins (Penta et al., 1999).
The expression level of DEL1 in adult chondrocytes and biological significance
of DEL1/integrin interaction has not been previously investigated. As expansion
for tissue engineering purposes requires a 3D matrix that would provide the
correct integrin signals (van der Kraan et al., 2002), we have studied the role of
DEL1 in bovine articular chondrocyte 2D expansion in this experimental chapter.
143
Aims of Experimental Chapter
1 Study the level of DEL1 expression in response to 2D culture.
2 Successfully perform DEL1 knockdown using the designed siRNA
molecules
3 Study the role of DEL1 in attachment.
4 Investigate the effect of DEL1 knockdown on phenotypic markers including:
i. Expression battery of chondrocytes
ii. RVI response
iii. REV5901-mediated rise in [Ca2+]i
144
5.2 Results
5.2.1 The expression level of DEL1 in response to 2D culture of chondrocytes
As previously mentioned, the loss of DEL1 upregulation in 2D cultured foetal
chondrocytes suggested a potentially important role in the regulation of the
chondrocytic phenotype (Stokes et al., 2002), and therefore the next part of the
project was to determine the bio-significance of DEL1 in 2D cultured
chondrocytes. Freshly isolated and 2D cultured chondrocytes were collected by
centrifugation and RNA isolated and reverse transcribed as previously
described. The level of DEL1 transcription was subsequently studied by PCR
and densitometery DNA electrophoresis (Materials and Methods).
There was a 2.48±0.34-fold increase in the level of DEL1 expression upon 9
days of culture (p<0.05) and subsequently declined in culture reaching
0.68±0.04 and 0.86±0.08 of baseline levels in P2 and P3 chondrocytes,
respectively (Figure 5.1), with no significant changes observed (p>0.05). The
increase in DEL1 expression in P1 chondrocytes was simultaneous to the 1.75-
fold increase in SOX9 expression and the switch in type II:I collagen expression
ratio as previously discussed (Section 3.2.3). These data, therefore, suggested
a potential role for DEL1 in phenotype loss and an association between the
expression of DEL1 and SOX9.
To further elucidate the time of the rise in DEL1 expression in the first passage,
RNA was isolated from 2D cultured chondrocytes after 2, 4 and 6 days in culture
and RT-PCR analysis performed as previously described. The level of DEL1
expression increased upon 2 days in culture reaching 12.19±1.67-fold increase

145
compared to freshly isolated chondrocytes and declined to 10.44±1.43,
6.02±0.82 and 2.48±0.34-fold increase after 4, 6 and 9 days, respectively
(Figure 5.2A).
Changes in the ratio of type II:I collagen expression were observed to be of later
onset than those in DEL1 expression, whereby no significant change in collagen
expression ratio was observed by the 2nd day in culture with a value of
1.12±0.15 as standardised against freshly isolated chondrocytes. The switch in
collagen ratio expression, however, only occurred by the 4th day in culture
(Figure 5.2B) with a decrease to 0.67±0.11 in the expression ratio, which further
declined to 0.30±0.10 and 0.39±0.10 upon 6 and 9 days in culture, respectively.
These data suggested a switch in collagen phenotype of chondrocytes following
a 12.19±0.15-fold increase in DEL1 expression at the commencement of culture.
The expression and secretion of DEL1 proteins was confirmed by western blot
but not quantified due to the poor quality of anti-DEL1 polyclonal preparation.
Media from chondrocytes were collected as previously described (Materials and
Methods) and subjected to 12.5% polyacrylamide SDS-PAGE and gels blotted
on membrane and probed for DEL1 expression. DEL1 proteins were detected in
freshly isolated and 2D cultured chondrocytes (Figure 5.3) confirming the
expression of DEL1 in adult bovine chondrocytes.
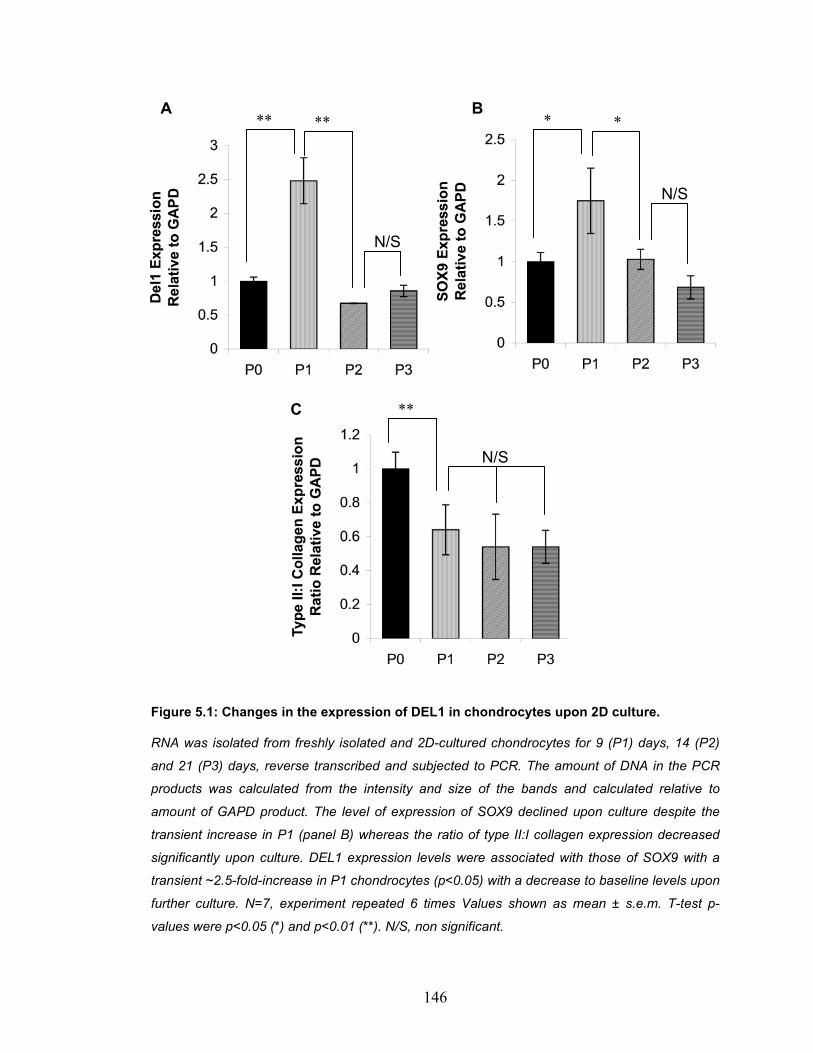
146
Figure 5.1: Changes in the expression of DEL1 in chondrocytes upon 2D culture.
RNA was isolated from freshly isolated and 2D-cultured chondrocytes for 9 (P1) days, 14 (P2)
and 21 (P3) days, reverse transcribed and subjected to PCR. The amount of DNA in the PCR
products was calculated from the intensity and size of the bands and calculated relative to
amount of GAPD product. The level of expression of SOX9 declined upon culture despite the
transient increase in P1 (panel B) whereas the ratio of type II:I collagen expression decreased
significantly upon culture. DEL1 expression levels were associated with those of SOX9 with a
transient ~2.5-fold-increase in P1 chondrocytes (p<0.05) with a decrease to baseline levels upon
further culture. N=7, experiment repeated 6 times Values shown as mean ± s.e.m. T-test p-
values were p<0.05 (*) and p<0.01 (**). N/S, non significant.
**
** *
C
A B **
N/S
N/S
N/S
*
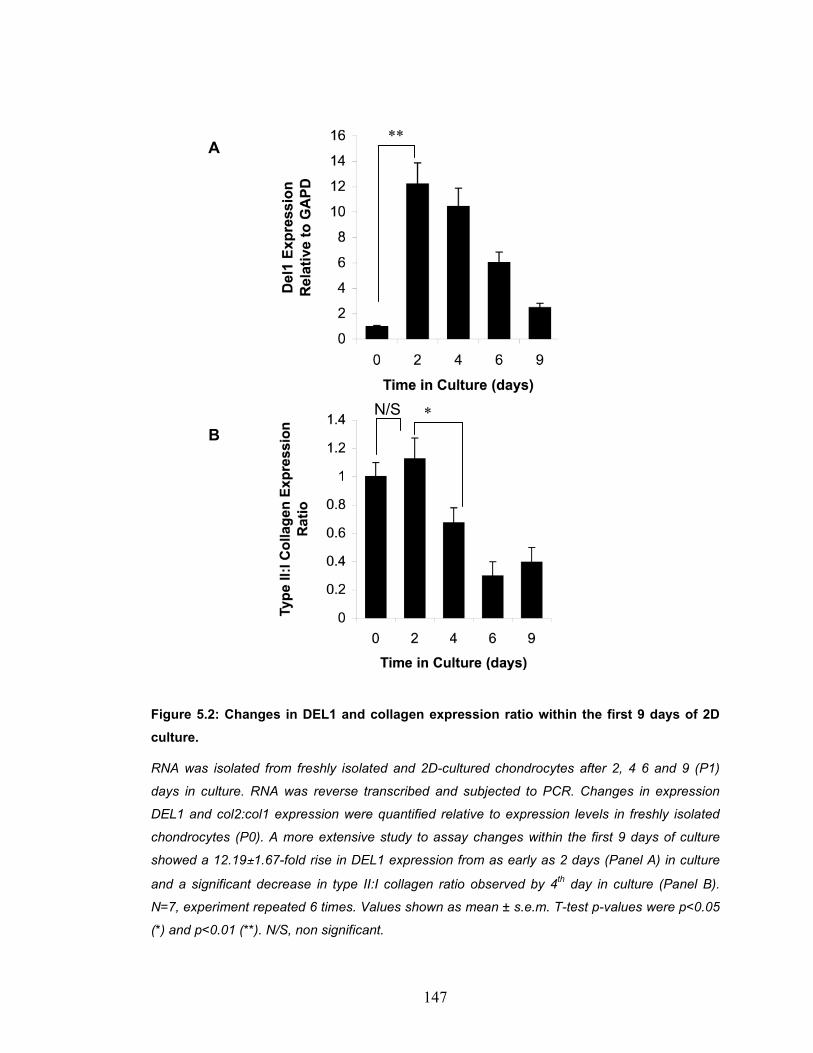
147
Figure 5.2: Changes in DEL1 and collagen expression ratio within the first 9 days of 2D culture.
RNA was isolated from freshly isolated and 2D-cultured chondrocytes after 2, 4 6 and 9 (P1)
days in culture. RNA was reverse transcribed and subjected to PCR. Changes in expression
DEL1 and col2:col1 expression were quantified relative to expression levels in freshly isolated
chondrocytes (P0). A more extensive study to assay changes within the first 9 days of culture
showed a 12.19±1.67-fold rise in DEL1 expression from as early as 2 days (Panel A) in culture
and a significant decrease in type II:I collagen ratio observed by 4th day in culture (Panel B).
N=7, experiment repeated 6 times. Values shown as mean ± s.e.m. T-test p-values were p<0.05
(*) and p<0.01 (**). N/S, non significant.
**
* B
A
N/S
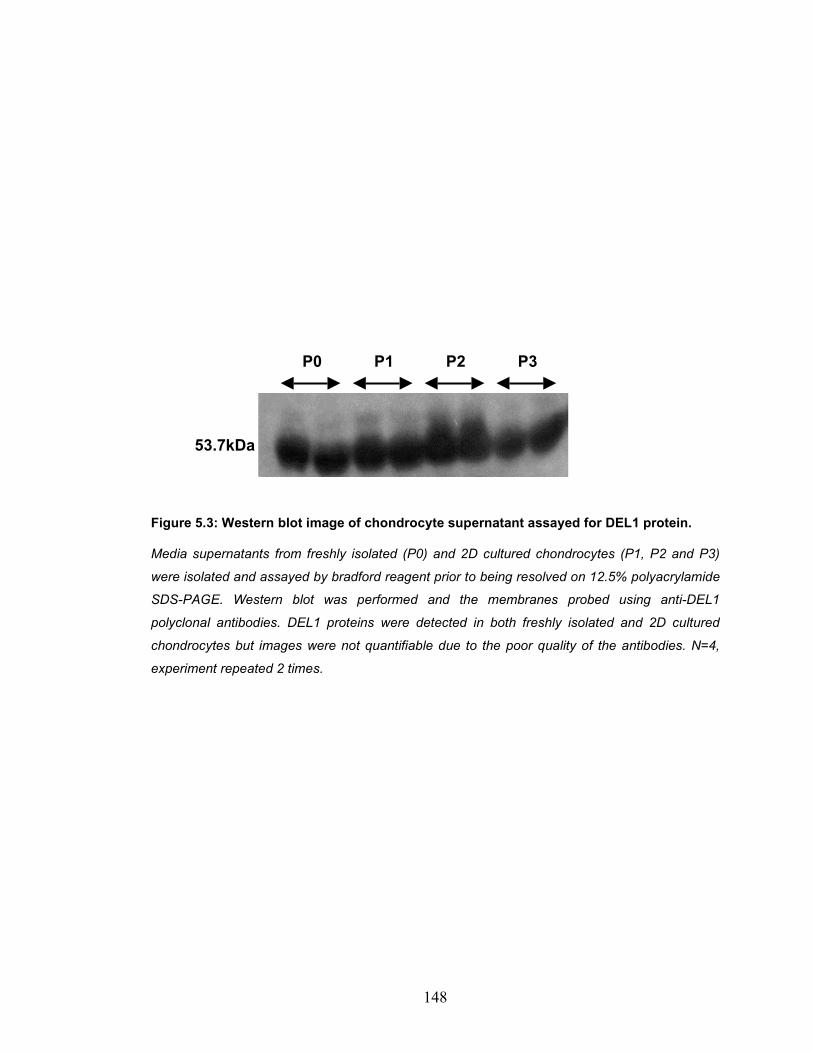
148
Figure 5.3: Western blot image of chondrocyte supernatant assayed for DEL1 protein.
Media supernatants from freshly isolated (P0) and 2D cultured chondrocytes (P1, P2 and P3)
were isolated and assayed by bradford reagent prior to being resolved on 12.5% polyacrylamide
SDS-PAGE. Western blot was performed and the membranes probed using anti-DEL1
polyclonal antibodies. DEL1 proteins were detected in both freshly isolated and 2D cultured
chondrocytes but images were not quantifiable due to the poor quality of the antibodies. N=4,
experiment repeated 2 times.
P0 P1 P2 P3
53.7kDa
149
5.2.2 DEL1 knockdown using RNAi technology
To investigate the role of DEL1 on chondrocytic phenotype, RNAi technology
was employed by transfecting freshly isolated chondrocytes with anti-DEL1
siRNA molecules prior culture-stimulated DEL1 rise. Firstly, to study the efficacy
and duration of the siRNA molecules designed, freshly isolated chondrocytes
were transfected in suspension with 10nM and 3µl/ml HiPerfect transfection
reagent, as previously described, and incubated in serum-free 380mOsm media
at 37°C in a humidified 5% CO2 incubator. RNA was extracted after 2, 4, 6 and 9
days and RT-PCR performed to assay the levels of DEL1 expression.
Anti-DEL1 siRNA molecules achieved successful knockdown with the level of
DEL1 expression reduced to 0.24±0.01-fold (relative to freshly isolated
chondrocytes) after 2 days of transfection and the knockdown state was
maintained for at least another 4 days reaching 0.24±0.01% and 0.39±0.02%
with no significant differences (p>0.05) by the 4th and 6th days post-transfection.
After 9 days of transfection, however, DEL1 expression resumed reaching
1.51±0.08 baseline levels (p<0.05; Figure 5.4). These data confirmed the
transience of siRNA-mediated knockdown observed to last for a mere 6 days
post-transfection and demonstrated the efficacy of anti-DEL1 siRNA sequences
designed. The effect of anti-DEL1 siRNA molecules on the growth curve of
chondrocytes was assayed by trypan blue assay after 2, 4, and 6 days of culture
and no significant difference was observed in the growth curve of anti-DEL1
siRNA transfected, mock transfected, or non transfected chondrocytes (doubling
times of 4.02, 3.66 and 3.73 days, respectively; p>0.05; Table 5.1).

150
Figure 5.4: The transience inhibition effect of anti-DEL1 siRNA transfection on DEL1 mRNA levels.
Freshly isolated chondrocytes were transfected in suspension using 10nM anti-DEL1 Cy3-
tagged siRNA (inset red; appears yellow due to overlay) freshly prepared with 3µl/ml HiPerfect
Reagent and incubated in culture media for 6 hours prior to being imaged using confocal
microscopy where siRNA molecules were observed around the nucleus of the Calcein-AM-
labelled chondrocyte (green). DEL1(-) chondrocytes were cultured for 2, 4, 6 and 9 days, RNA
isolated and RT-PCR performed to assay changes in DEL1 expression in response to
transfection. Upon 2 days of trasfection, DEL1 expression was significantly reduced to 0.24±0.01
of baseline levels and remained diminished for another 4 days. DEL1 expression levels were
restored upon 9 days in culture with 1.52±0.08% relative to freshly isolated chondrocytes.
Values shown as mean ± s.e.m. N=4, experiment repeated 3 times. T-test p-values were p<0.01
(**). N/S, non significant.
0
0.2
0.4
0.6
0.8
1
1.2
1.4
1.6
1.8
0 2 4 6 9 Time Post Transfection
(days)
DEL
1 Ex
pres
sion
Rel
ativ
e to
GA
PD
and
P0
** **
**
N/S
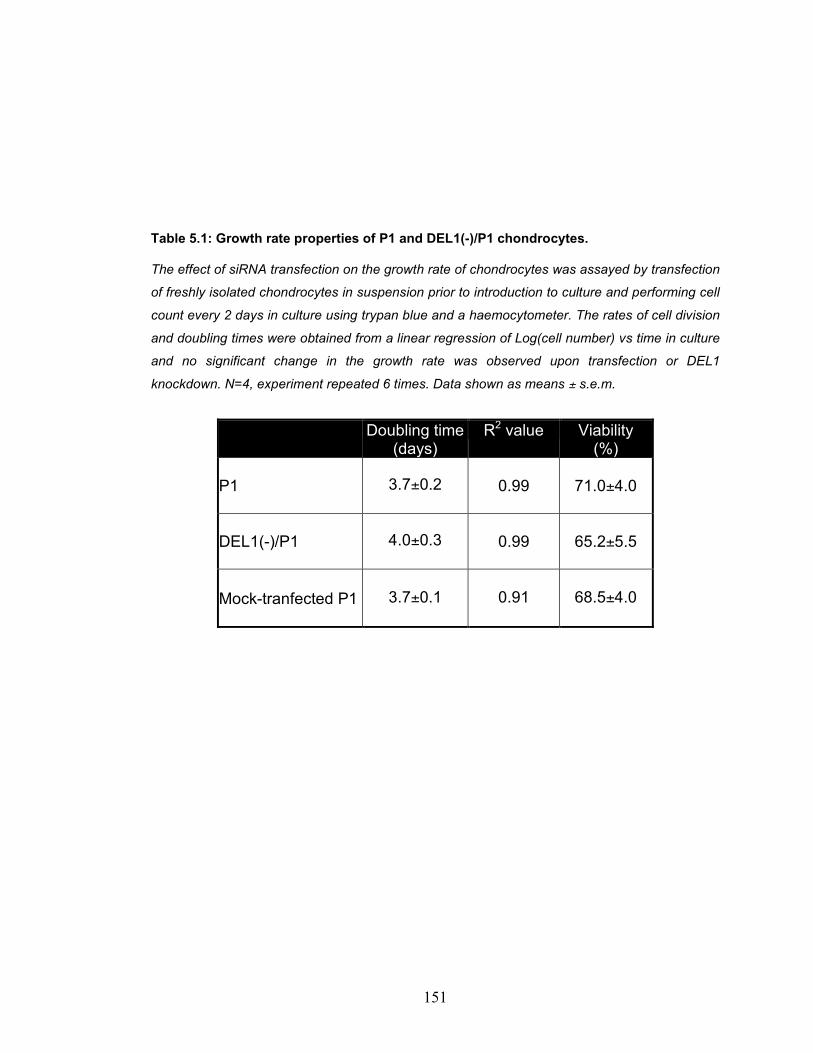
151
Table 5.1: Growth rate properties of P1 and DEL1(-)/P1 chondrocytes.
The effect of siRNA transfection on the growth rate of chondrocytes was assayed by transfection
of freshly isolated chondrocytes in suspension prior to introduction to culture and performing cell
count every 2 days in culture using trypan blue and a haemocytometer. The rates of cell division
and doubling times were obtained from a linear regression of Log(cell number) vs time in culture
and no significant change in the growth rate was observed upon transfection or DEL1
knockdown. N=4, experiment repeated 6 times. Data shown as means ± s.e.m.
Doubling time
(days) R2 value Viability
(%) P1
3.7±0.2
0.99
71.0±4.0
DEL1(-)/P1
4.0±0.3
0.99
65.2±5.5
Mock-tranfected P1
3.7±0.1
0.91
68.5±4.0
152
5.2.3 The role of DEL1 knockdown on chondrocytic phenotype, morphology and mechanotransduction
Having determined a change in DEL1 expression following culture, the effect of
DEL1 expression on phenotypic properties was studied by long-term knockdown
of DEL1 using RNAi. Freshly isolated chondrocytes were transfected with anti-
DEL1 siRNA in suspension prior to commencing culture in serum-enriched
media for 9 days (chondrocytes termed DEL1(-)/P1). Due to the transiency of
the knockdown, chondrocytes were repeat-transfected after 6 days in culture to
maintain the inhibition of DEL1 translation. Control chondrocytes employed in
these experiments were P1 chondrocytes mock-transfected using negative
control (scrambled) siRNA (Ambion).
5.2.3.1 The role of DEL1 on chondrocyte attachment
The role of DEL1, defined as a matrix adhesion protein, on cellular attachment in
chondrocytes was investigated during 2D culture. Briefly, freshly isolated and 2D
cultured chondrocytes (isolated by trypsinisation) were washed and seeded at
LD as previously described. Chondrocytes were subsequently incubated for 1, 2
or 4 hours at 37°C in a humidified CO2 incubator prior to removal of the media
containing unattached cell suspension and the addition of fresh media
containing 0.5mg/ml MTT and incubation for 3 hours at 37°C.The number of
attached chondrocytes was ascertained by measuring the absorbance of
reduced MTT as previously described (Materials and Methods).
After one hour in 380mOsm media, 78.20±2.29% of freshly isolated
chondrocytes seeded were attached whereas after 9 days in culture,
55.00±2.74% of P1 chondrocytes underwent attachment in one hour of seeding.
When cultured for longer periods, however, chondrocytes recovered their
original quick-onset attachment properties with 87.5±3.35% and 91.2±3.35%
153
attachment after 1 hour of seeding in P2 and P3 2D cultured chondrocytes,
respectively. The lack of initial attachment response (after 1 hour of seeding) in
P1 2D cultured chondrocytes was associated with an over-expression of DEL1
in 2D culture. Following incubation for 4 hour, attachment reached 105.40±2.19,
98.33±7.16, 120.33±2.13 and 116.48±2.12 in P0, P1, P2 and P3 chondrocytes
respectively, with no significant difference observed (p>0.05; Figure 5.5).
The rate of attachment was additionally studied by linear regression of
percentage attachment over time. Freshly isolated, P2 and P3 chondrocytes
exhibited a rate of attachment of 10.13%/hour, whereas P1 chondrocytes
possessed a significantly higher rate of 15.07%/hour (p<0.05), suggesting that
despite a late onset attachment in P1 chondrocytes, a higher rate of attachment
was exhibited in the presence of elevated levels of DEL1 expression. These
data suggested a potential role for DEL1 in the regulation of P1-exculsive
attachment profile characterised by an increased rate yet slow onset
attachment.

154
5.2.3.1.1 The effect of DEL1 knockdown on the rate of attachment of
chondrocytes Therefore, the necessity for DEL1 in attachment of chondrocytes was assayed
upon continuous knockdown of P1 chondrocytes for 9 days prior to isolation by
trypsinisation, seeding and performing MTT attachment assay as previously
described. Initial attachment (upon 1 hour in culture) was significantly reduced
from 55.0±2.74% in control P1 chondrocytes to 8.12±3.33% (p<0.05) and
percentage attachment after 4 hours in culture from 98.33±7.16% to
24.59±1.83% (p<0.05; Figure 5.6). These data have shown a decreased rate of
attachment in the absence of DEL1 expression from 15.07%/hour in control
chondrocytes to 5.12%/hour (p<0.05). It was thus concluded that an increase in
release of DEL1 in P1, if time-dependent and therefore of late onset, is
necessary for the attachment of chondrocytes for at least 9 days upon culture,
thus contributing to higher attachment rates in P1 chondrocytes (Table 5.2).
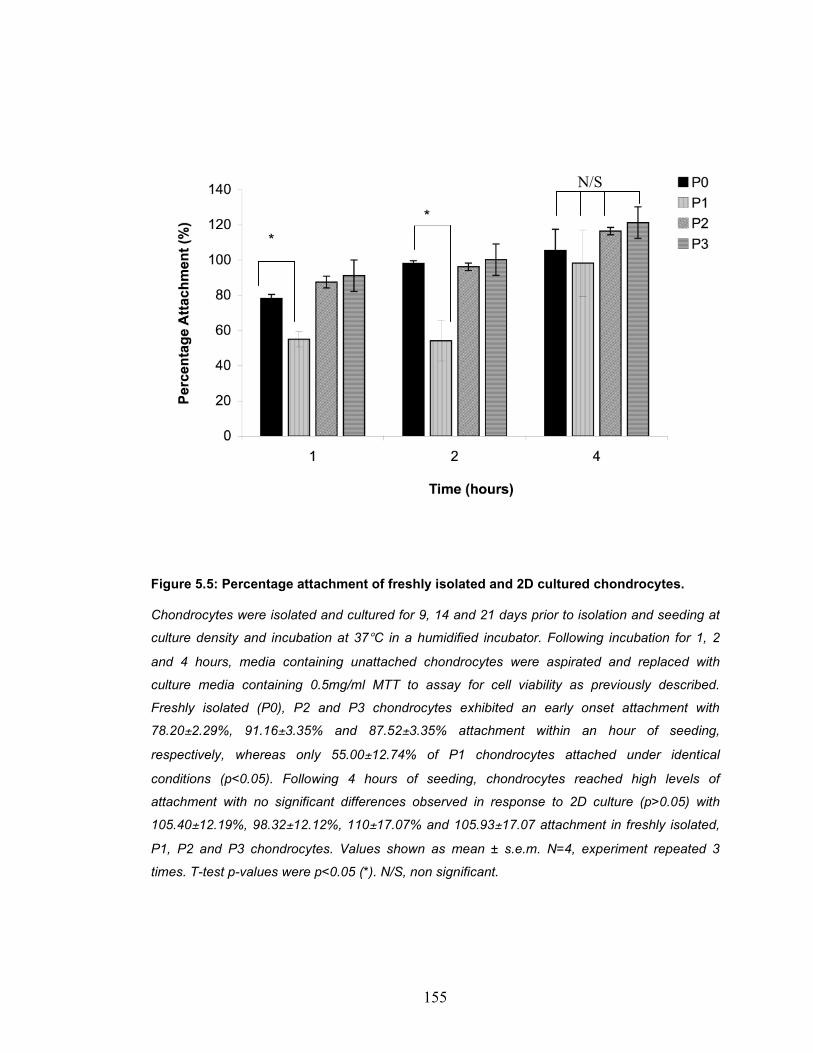
155
Figure 5.5: Percentage attachment of freshly isolated and 2D cultured chondrocytes.
Chondrocytes were isolated and cultured for 9, 14 and 21 days prior to isolation and seeding at
culture density and incubation at 37°C in a humidified incubator. Following incubation for 1, 2
and 4 hours, media containing unattached chondrocytes were aspirated and replaced with
culture media containing 0.5mg/ml MTT to assay for cell viability as previously described.
Freshly isolated (P0), P2 and P3 chondrocytes exhibited an early onset attachment with
78.20±2.29%, 91.16±3.35% and 87.52±3.35% attachment within an hour of seeding,
respectively, whereas only 55.00±12.74% of P1 chondrocytes attached under identical
conditions (p<0.05). Following 4 hours of seeding, chondrocytes reached high levels of
attachment with no significant differences observed in response to 2D culture (p>0.05) with
105.40±12.19%, 98.32±12.12%, 110±17.07% and 105.93±17.07 attachment in freshly isolated,
P1, P2 and P3 chondrocytes. Values shown as mean ± s.e.m. N=4, experiment repeated 3
times. T-test p-values were p<0.05 (*). N/S, non significant.
* *
N/S
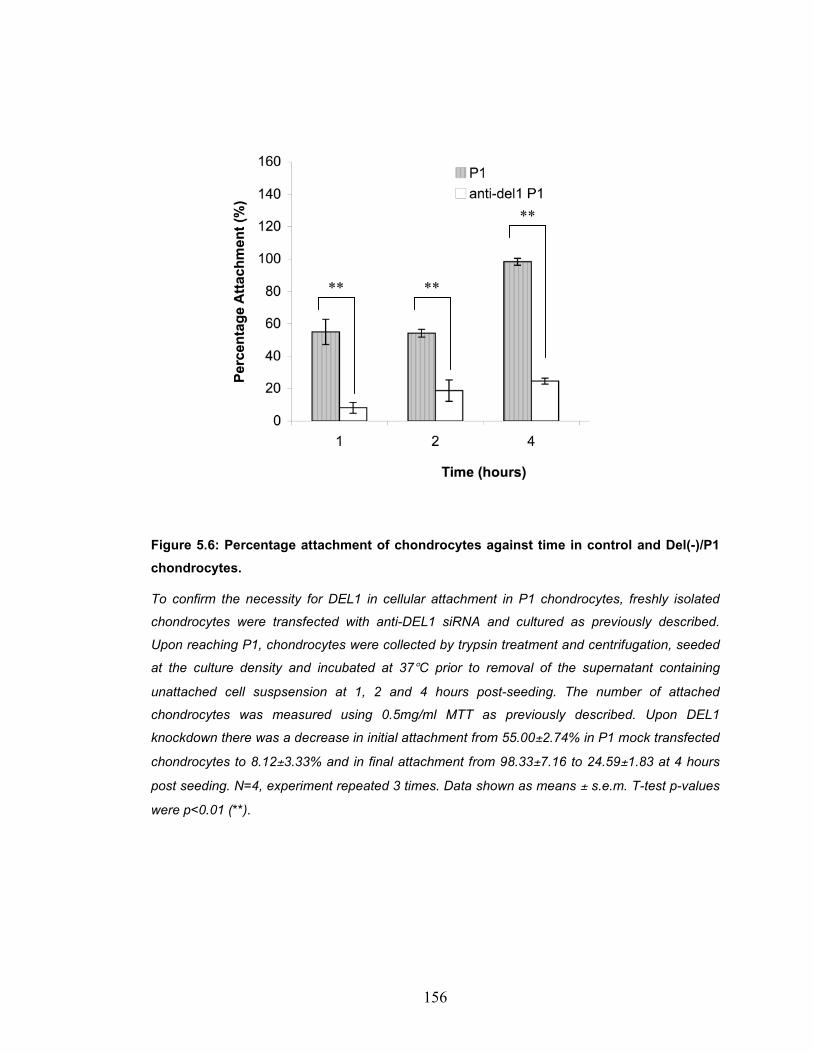
156
Figure 5.6: Percentage attachment of chondrocytes against time in control and Del(-)/P1 chondrocytes.
To confirm the necessity for DEL1 in cellular attachment in P1 chondrocytes, freshly isolated
chondrocytes were transfected with anti-DEL1 siRNA and cultured as previously described.
Upon reaching P1, chondrocytes were collected by trypsin treatment and centrifugation, seeded
at the culture density and incubated at 37°C prior to removal of the supernatant containing
unattached cell suspsension at 1, 2 and 4 hours post-seeding. The number of attached
chondrocytes was measured using 0.5mg/ml MTT as previously described. Upon DEL1
knockdown there was a decrease in initial attachment from 55.00±2.74% in P1 mock transfected
chondrocytes to 8.12±3.33% and in final attachment from 98.33±7.16 to 24.59±1.83 at 4 hours
post seeding. N=4, experiment repeated 3 times. Data shown as means ± s.e.m. T-test p-values
were p<0.01 (**).
** **
**

157
Table 5.2: Summary of attachment properties of freshly isolated and 2D cultured chondrocytes.
Freshly isolated (P0) and P2 and P3 chondrocytes exhibited quick onset attachment properties
with 80.60% of chondrocytes attaching within 1 hour of seeding, whereas only 55.00±2.74% of
P1 chondrocytes attached within the same time. After 4 hours in culture, however, P1
chondrocytes reached a similar plateau of cellular attachment to the one observed in P0, P2 and
P3 chondrocytes, thus demonstrating a higher rate of attachment. Upon DEL1 knockdown,
however, there was a significant reduction in both intital attachment and attachment rate. N=10,
experiment repeated 6 times. Data shown as means ± s.e.m. T-test p-values (against freshly
isolated chondrocytes) were p<0.05 (*) and p<0.01 (**).
Rate
(Δ %/h)
Initial Percentage attachment
Onset
Time for 100%
attachment (hour)
Efficiency
P0 10.13 80.60±2.29% Fast 1.92 Low
P1 15.07 * 55.00±2.74% ** Slow 4.45 * High
P2 10.13 80.60±3.35% Fast 1.92 Low
P3 10.13 80.60±3.22% Fast 1.92 Low
DEL1(-)/P1 5.1 ** 8.10±3.33 % ** Slow 18.51** Low
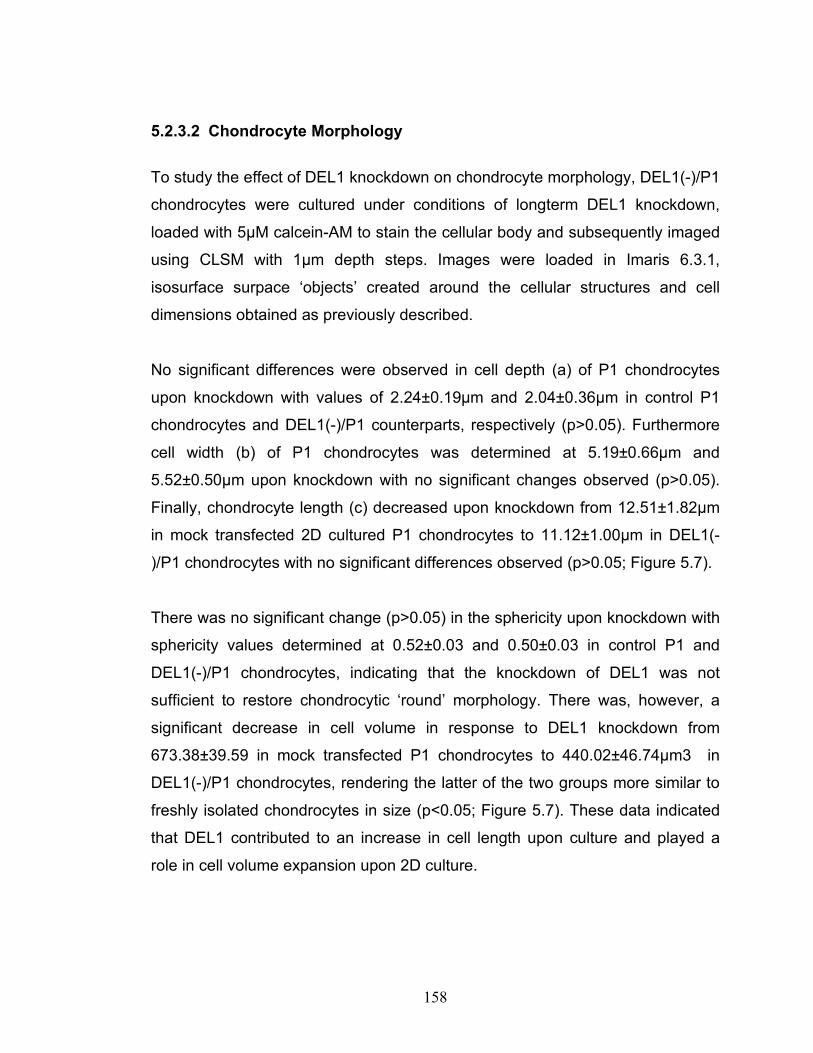
158
5.2.3.2 Chondrocyte Morphology
To study the effect of DEL1 knockdown on chondrocyte morphology, DEL1(-)/P1
chondrocytes were cultured under conditions of longterm DEL1 knockdown,
loaded with 5µM calcein-AM to stain the cellular body and subsequently imaged
using CLSM with 1µm depth steps. Images were loaded in Imaris 6.3.1,
isosurface surpace ‘objects’ created around the cellular structures and cell
dimensions obtained as previously described.
No significant differences were observed in cell depth (a) of P1 chondrocytes
upon knockdown with values of 2.24±0.19µm and 2.04±0.36µm in control P1
chondrocytes and DEL1(-)/P1 counterparts, respectively (p>0.05). Furthermore
cell width (b) of P1 chondrocytes was determined at 5.19±0.66µm and
5.52±0.50µm upon knockdown with no significant changes observed (p>0.05).
Finally, chondrocyte length (c) decreased upon knockdown from 12.51±1.82µm
in mock transfected 2D cultured P1 chondrocytes to 11.12±1.00µm in DEL1(-
)/P1 chondrocytes with no significant differences observed (p>0.05; Figure 5.7).
There was no significant change (p>0.05) in the sphericity upon knockdown with
sphericity values determined at 0.52±0.03 and 0.50±0.03 in control P1 and
DEL1(-)/P1 chondrocytes, indicating that the knockdown of DEL1 was not
sufficient to restore chondrocytic ‘round’ morphology. There was, however, a
significant decrease in cell volume in response to DEL1 knockdown from
673.38±39.59 in mock transfected P1 chondrocytes to 440.02±46.74µm3 in
DEL1(-)/P1 chondrocytes, rendering the latter of the two groups more similar to
freshly isolated chondrocytes in size (p<0.05; Figure 5.7). These data indicated
that DEL1 contributed to an increase in cell length upon culture and played a
role in cell volume expansion upon 2D culture.
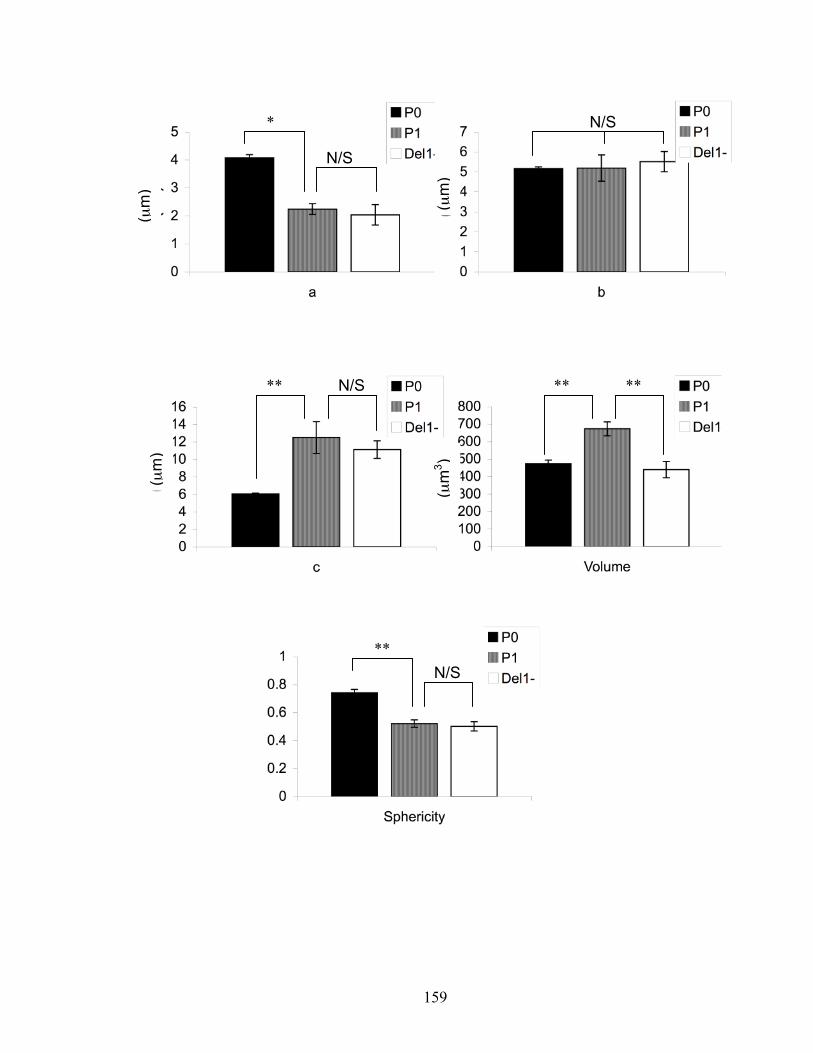
159
*
** N/S ** **
**
N/S
N/S
N/S
(µm
) (µ
m)
(µm
) (µ
m3 )
160
Figure 5.7: Changes in chondrocyte morphology and cellular dimension in response to long-term DEL1 knockdown.
Series of images of chondrocytes acquired using confocal microscopy were reassembled in
Imaris and isosurface ‘objects’ created as described (Materials and Methods). Imaris was
subsequently employed to determine the depth, width and length of each object (denoted a, b
and c). No significant changes were observed in the depth and width between control mock
transfected and DEL1(-) chondrocytes but there was, however, a significant decrease in cell
length in response to DEL1 knockdown (p<0.05). There was no significant change in the
sphericity factor but a decrease in cell volume upon DEL1 knock down from 673.38±39.59 to
440.02±46.74µm3 was observed, values previously observed in freshly isolated chondrocytes.
Data pooled from 16 individual experiments. N=4, n=85. Data shown as mean ± s.e.m. T-test p-
values were p<0.05 (*) and p<0.01 (**). N/S, non significant.
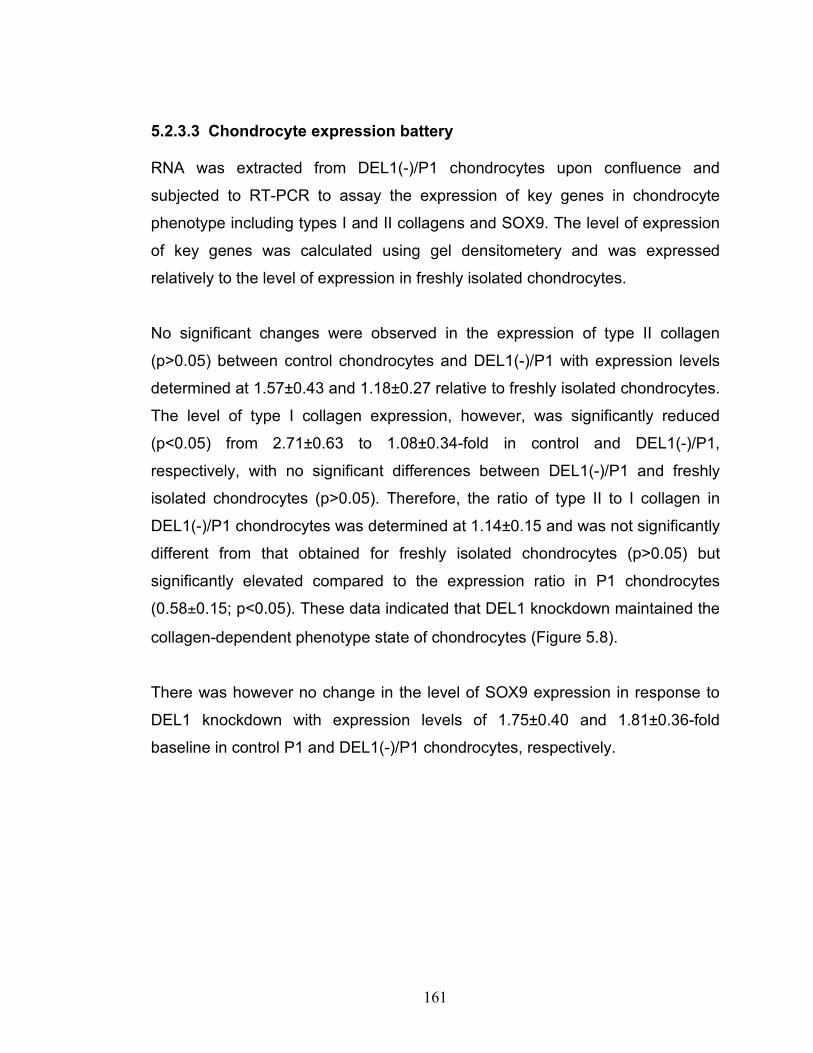
161
5.2.3.3 Chondrocyte expression battery RNA was extracted from DEL1(-)/P1 chondrocytes upon confluence and
subjected to RT-PCR to assay the expression of key genes in chondrocyte
phenotype including types I and II collagens and SOX9. The level of expression
of key genes was calculated using gel densitometery and was expressed
relatively to the level of expression in freshly isolated chondrocytes.
No significant changes were observed in the expression of type II collagen
(p>0.05) between control chondrocytes and DEL1(-)/P1 with expression levels
determined at 1.57±0.43 and 1.18±0.27 relative to freshly isolated chondrocytes.
The level of type I collagen expression, however, was significantly reduced
(p<0.05) from 2.71±0.63 to 1.08±0.34-fold in control and DEL1(-)/P1,
respectively, with no significant differences between DEL1(-)/P1 and freshly
isolated chondrocytes (p>0.05). Therefore, the ratio of type II to I collagen in
DEL1(-)/P1 chondrocytes was determined at 1.14±0.15 and was not significantly
different from that obtained for freshly isolated chondrocytes (p>0.05) but
significantly elevated compared to the expression ratio in P1 chondrocytes
(0.58±0.15; p<0.05). These data indicated that DEL1 knockdown maintained the
collagen-dependent phenotype state of chondrocytes (Figure 5.8).
There was however no change in the level of SOX9 expression in response to
DEL1 knockdown with expression levels of 1.75±0.40 and 1.81±0.36-fold
baseline in control P1 and DEL1(-)/P1 chondrocytes, respectively.
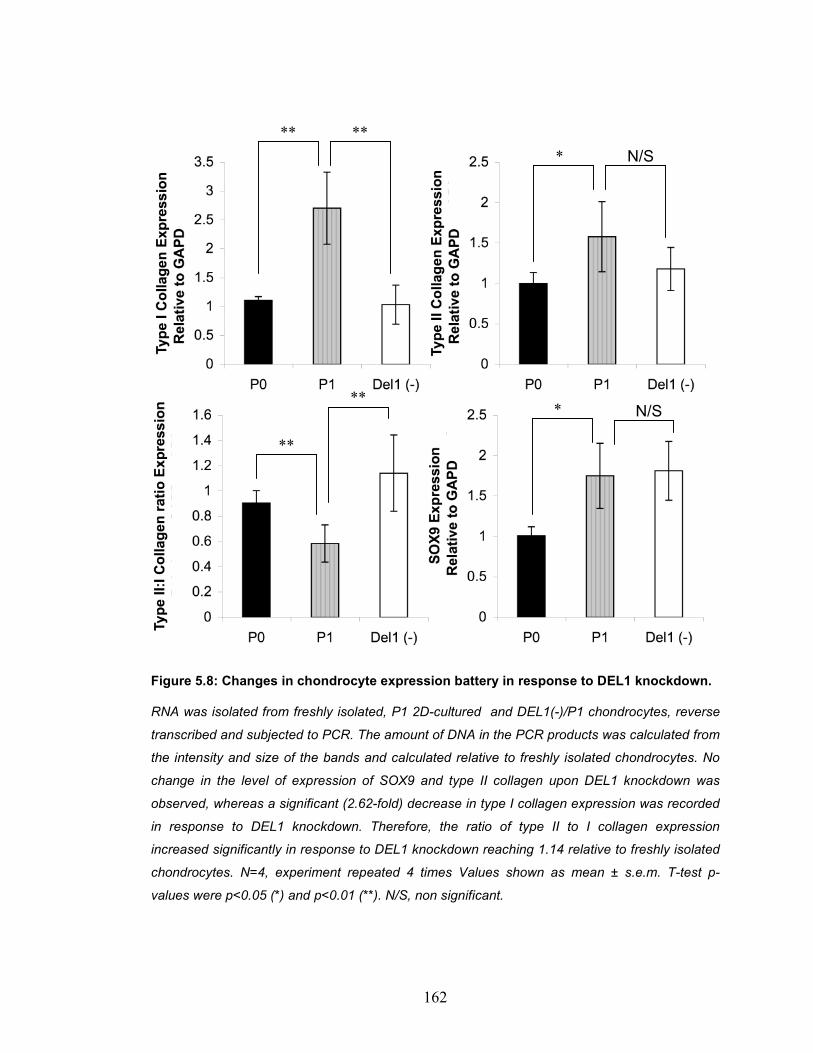
162
Figure 5.8: Changes in chondrocyte expression battery in response to DEL1 knockdown.
RNA was isolated from freshly isolated, P1 2D-cultured and DEL1(-)/P1 chondrocytes, reverse
transcribed and subjected to PCR. The amount of DNA in the PCR products was calculated from
the intensity and size of the bands and calculated relative to freshly isolated chondrocytes. No
change in the level of expression of SOX9 and type II collagen upon DEL1 knockdown was
observed, whereas a significant (2.62-fold) decrease in type I collagen expression was recorded
in response to DEL1 knockdown. Therefore, the ratio of type II to I collagen expression
increased significantly in response to DEL1 knockdown reaching 1.14 relative to freshly isolated
chondrocytes. N=4, experiment repeated 4 times Values shown as mean ± s.e.m. T-test p-
values were p<0.05 (*) and p<0.01 (**). N/S, non significant.
** ** * N/S
*
**
**
N/S
163
5.2.3.4 The effect of DEL1 on actin organisation DEL1(-)/P1 and P1 chondrocytes were allowed to attach overnight prior to being
fixed in 3% formaldehyde and stained for actin cytoskeleton using phalloidin-
alexa 488. Images were acquired using CLSM under Nyquest settings,
deconvolved, reassembled in Imaris (Bitplane) and then fluorescence of actin-
phalloidin-alexa 488 complexes assayed using Image Pro version 7.0
(Maryland, USA). The number of striation units (as the number of peaks in
fluorescence across the cell body) in each chondrocyte was recorded, and the
mean fluorescence plotted against 10% intervals of a standardised cell
diameter. The areas under the graphs were mathematically calculated by the
integration of the equations of the graphs, as previously described (Materials
and Methods).
DEL1 knockdown induced a significant increase in the mean number of striation
units in P1 chondrocytes to 7±1StU/cell compared to 5±1StU/cell in control
mock-transfected chondrocytes (p<0.05), and therefore the percentage of
filamentous actin, correspondingly, increased from 45.0±2.3% in control
chondrocytes to 48.0±2.4% in DEL1(-)/P1. The increase in filamentous actin
percentage, however, was deemed insignificant (p>0.05) suggesting that DEL1
is involved in the intensification of the cortical localisation of actin.
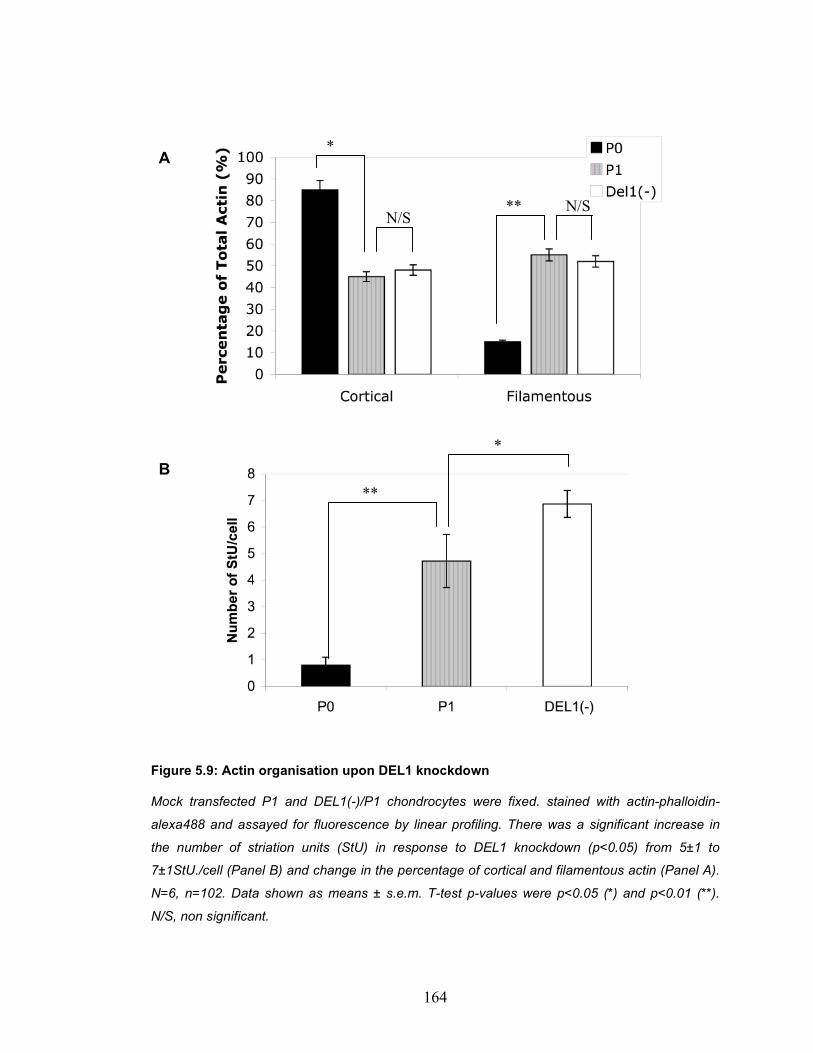
164
Figure 5.9: Actin organisation upon DEL1 knockdown
Mock transfected P1 and DEL1(-)/P1 chondrocytes were fixed. stained with actin-phalloidin-
alexa488 and assayed for fluorescence by linear profiling. There was a significant increase in
the number of striation units (StU) in response to DEL1 knockdown (p<0.05) from 5±1 to
7±1StU./cell (Panel B) and change in the percentage of cortical and filamentous actin (Panel A).
N=6, n=102. Data shown as means ± s.e.m. T-test p-values were p<0.05 (*) and p<0.01 (**).
N/S, non significant.
A
**
*
**
* B
N/S N/S
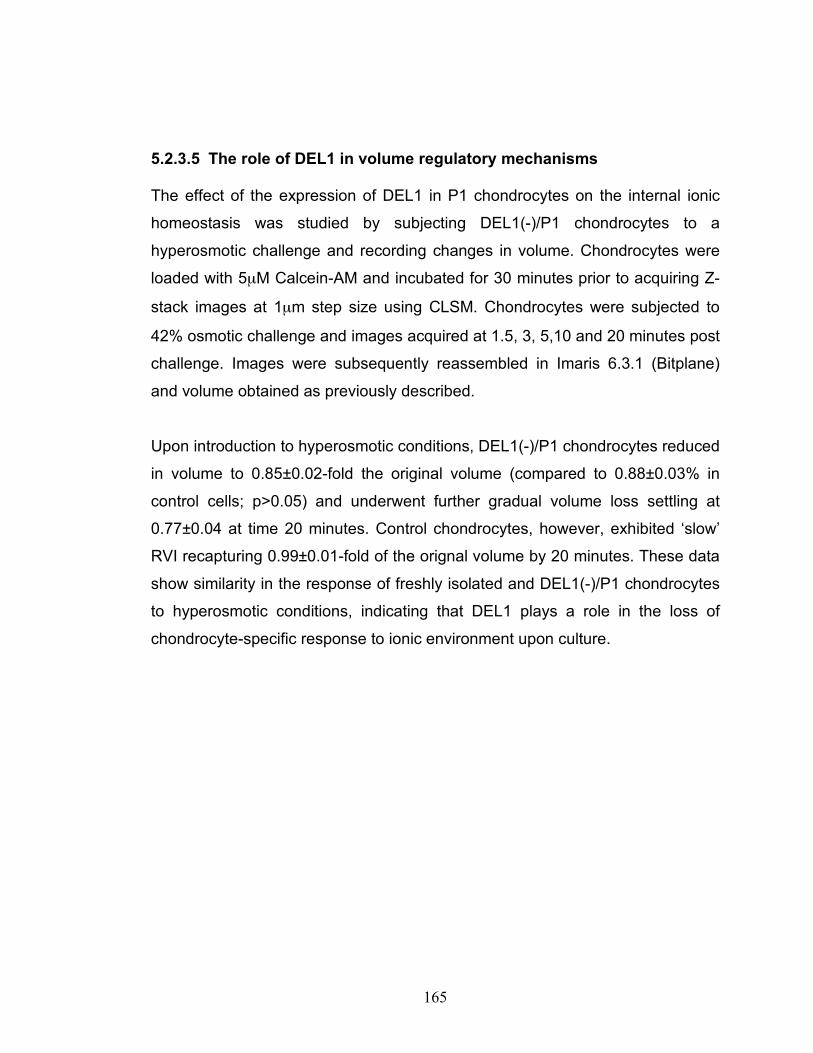
165
5.2.3.5 The role of DEL1 in volume regulatory mechanisms The effect of the expression of DEL1 in P1 chondrocytes on the internal ionic
homeostasis was studied by subjecting DEL1(-)/P1 chondrocytes to a
hyperosmotic challenge and recording changes in volume. Chondrocytes were
loaded with 5µM Calcein-AM and incubated for 30 minutes prior to acquiring Z-
stack images at 1µm step size using CLSM. Chondrocytes were subjected to
42% osmotic challenge and images acquired at 1.5, 3, 5,10 and 20 minutes post
challenge. Images were subsequently reassembled in Imaris 6.3.1 (Bitplane)
and volume obtained as previously described.
Upon introduction to hyperosmotic conditions, DEL1(-)/P1 chondrocytes reduced
in volume to 0.85±0.02-fold the original volume (compared to 0.88±0.03% in
control cells; p>0.05) and underwent further gradual volume loss settling at
0.77±0.04 at time 20 minutes. Control chondrocytes, however, exhibited ‘slow’
RVI recapturing 0.99±0.01-fold of the orignal volume by 20 minutes. These data
show similarity in the response of freshly isolated and DEL1(-)/P1 chondrocytes
to hyperosmotic conditions, indicating that DEL1 plays a role in the loss of
chondrocyte-specific response to ionic environment upon culture.
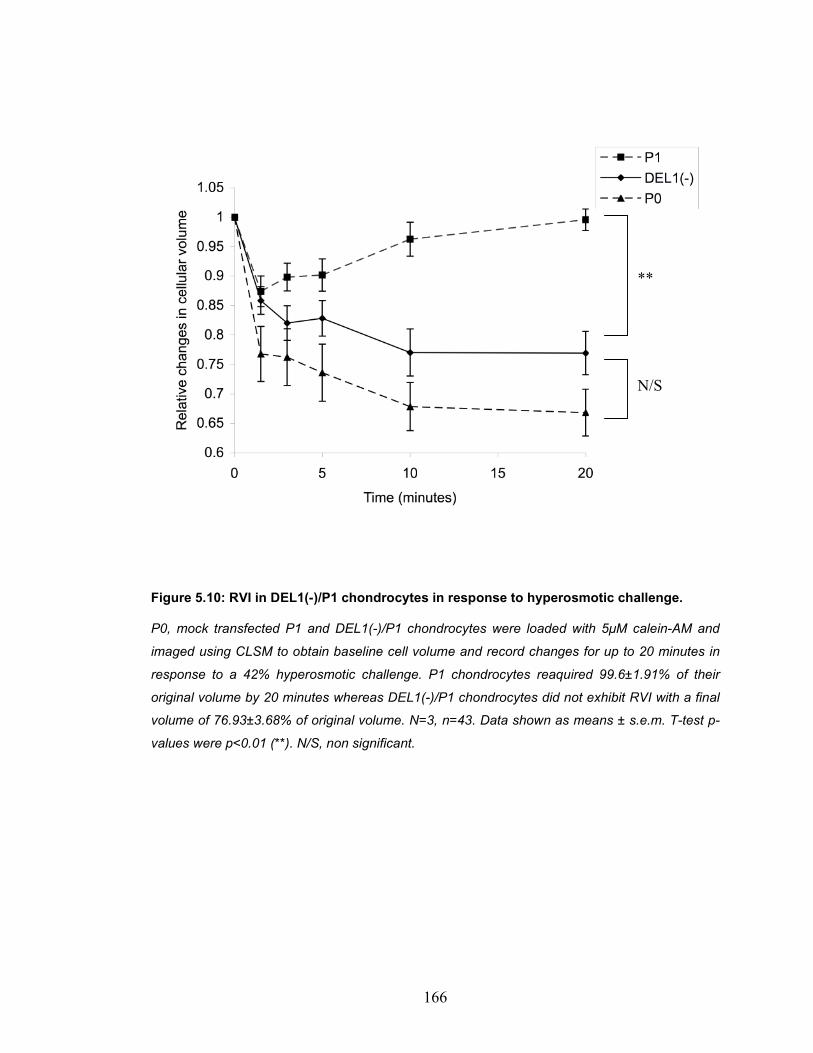
166
Figure 5.10: RVI in DEL1(-)/P1 chondrocytes in response to hyperosmotic challenge.
P0, mock transfected P1 and DEL1(-)/P1 chondrocytes were loaded with 5µM calein-AM and
imaged using CLSM to obtain baseline cell volume and record changes for up to 20 minutes in
response to a 42% hyperosmotic challenge. P1 chondrocytes reaquired 99.6±1.91% of their
original volume by 20 minutes whereas DEL1(-)/P1 chondrocytes did not exhibit RVI with a final
volume of 76.93±3.68% of original volume. N=3, n=43. Data shown as means ± s.e.m. T-test p-
values were p<0.01 (**). N/S, non significant.
**
N/S

167
5.2.3.6 The effect of DEL1 knockdown on calcium channel phenotyping in response to REV5901
As changes in the contribution of intracellular stores and calcium membrane
channels to REV5901-induced [Ca2+]i rise have been observed in response to
2D culture, the role of DEL1 in [Ca2+]i homeostasis was investigated. Freshly
isolated, P1 and DEL1(-)/P1 chondrocytes were loaded with 3µM fluo-4 prior to
perfusion in 50µM REV5901 and measurement of calcium changes in the
presence of various inhibiting conditions (2mM EGTA to chelate extracellular
calcium ions; Na+-free solution, NCX inhibition; Gd3+, inhibitor of SACC). The
effect of REV5901 on DEL1(-)/P1 chondrocyte was not significantly different
from that observed in P1 chondrocytes with maximal rise in [Ca2+]i of 11.6±0.6%
and 12.5±0.4% and no significant differences (p>0.05). Moreover the rise in
[Ca2+]i in the presence of 2mM EGTA was not significantly different between
DEL1(-)/P1 and control mock transfected chondrocytes with 3.69±1.04% and
1.97±0.77%, respectively (Figure 5.12).
Changes in the sensitivity to individual channel-inhibiting conditions were
however more prominent. There was an increase in NCX inhibition in Na+-free
conditions in Del(-)/P1 chondrocytes compared to control cells from 57.9±1.2%
to 67.6±4.3% inhibition (p<0.05), rendering DEL1(-)/P1 more similar to freshly
isolated chondrocytes with 84.0±3.4% inhibition (p>0.05; Figure 5.12).
The sensitivity of Del(-)/P1 chondrocytes to Gd3+ inhibition of SACC, however,
did not increase upon DEL1 knockdown unlike control P1 chondrocytes. Freshly
isolated chondrocytes exhibited 33.0±9.2% inhibition to REV5901 loading in the
presence of Gd3+ which increased upon culture reaching 57.2±5.4% in P1
chondrocytes. In response to long-term DEL1 knockdown, sensitivity of
chondrocytes to SACC inhibition using Gd3+ showed a similar trend to freshly
isolated chondrocytes with a percentage inhibition of 24.9±6.0% (p<0.05; Figure
5.12). These data indicated that the transient increase in DEL1 expression is
required for the increase in activity and/or expression of SACC.
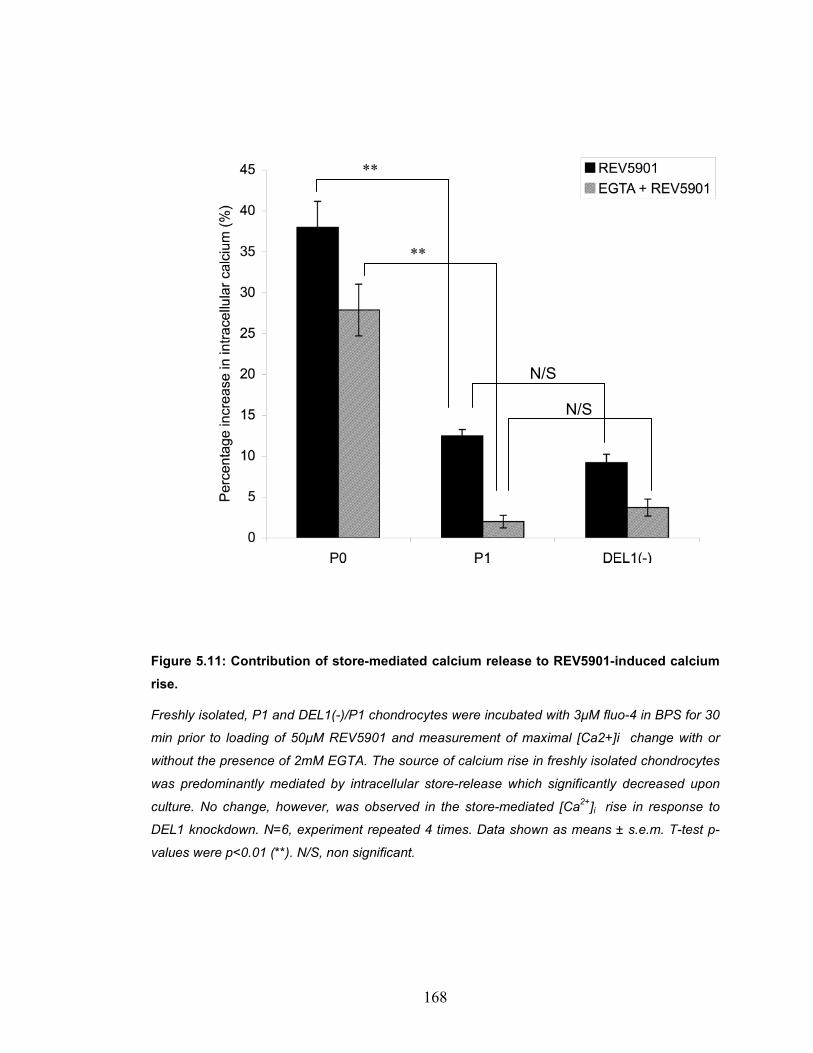
168
Figure 5.11: Contribution of store-mediated calcium release to REV5901-induced calcium rise.
Freshly isolated, P1 and DEL1(-)/P1 chondrocytes were incubated with 3µM fluo-4 in BPS for 30
min prior to loading of 50µM REV5901 and measurement of maximal [Ca2+]i change with or
without the presence of 2mM EGTA. The source of calcium rise in freshly isolated chondrocytes
was predominantly mediated by intracellular store-release which significantly decreased upon
culture. No change, however, was observed in the store-mediated [Ca2+]i rise in response to
DEL1 knockdown. N=6, experiment repeated 4 times. Data shown as means ± s.e.m. T-test p-
values were p<0.01 (**). N/S, non significant.
**
**
N/S
N/S
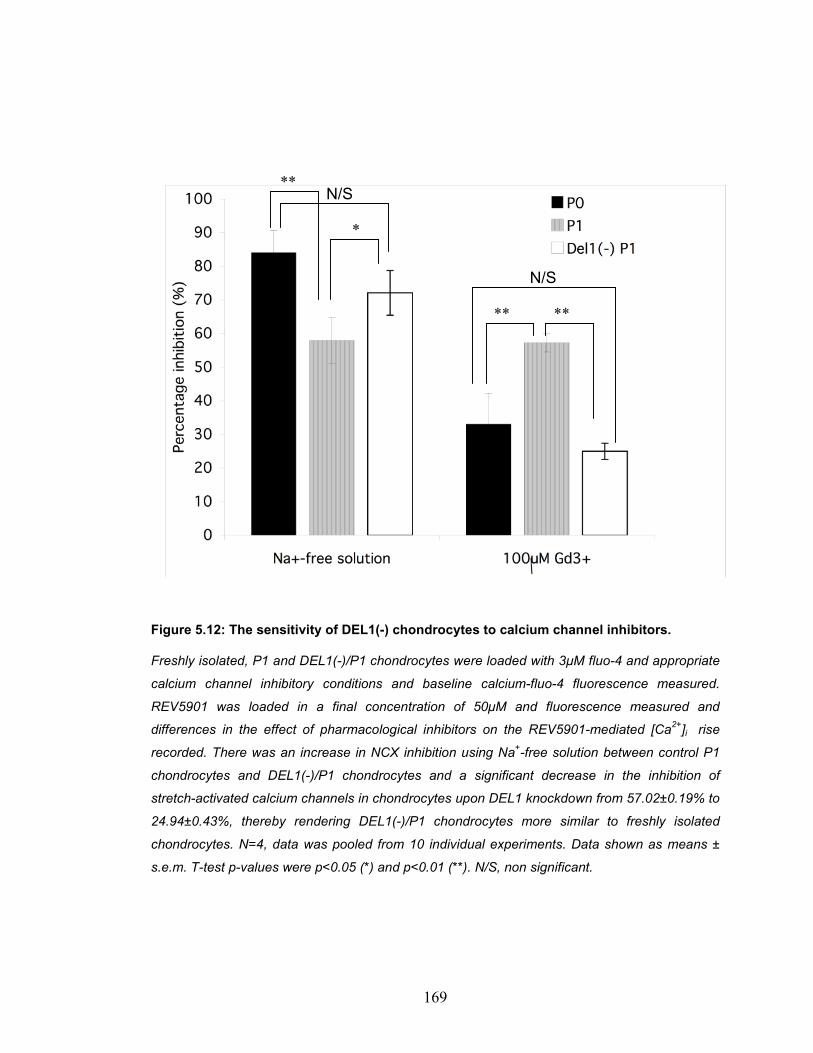
169
Figure 5.12: The sensitivity of DEL1(-) chondrocytes to calcium channel inhibitors.
Freshly isolated, P1 and DEL1(-)/P1 chondrocytes were loaded with 3µM fluo-4 and appropriate
calcium channel inhibitory conditions and baseline calcium-fluo-4 fluorescence measured.
REV5901 was loaded in a final concentration of 50µM and fluorescence measured and
differences in the effect of pharmacological inhibitors on the REV5901-mediated [Ca2+]i rise
recorded. There was an increase in NCX inhibition using Na+-free solution between control P1
chondrocytes and DEL1(-)/P1 chondrocytes and a significant decrease in the inhibition of
stretch-activated calcium channels in chondrocytes upon DEL1 knockdown from 57.02±0.19% to
24.94±0.43%, thereby rendering DEL1(-)/P1 chondrocytes more similar to freshly isolated
chondrocytes. N=4, data was pooled from 10 individual experiments. Data shown as means ±
s.e.m. T-test p-values were p<0.05 (*) and p<0.01 (**). N/S, non significant.
**
** **
*
N/S
N/S

170
5.3 Chapter Discussion
DEL1 is an extracellular integrin ligand shown to have influence on attachment,
differentiation and migration in other tissues including angiogenic neoplastic
tissue (Aoka et al., 2002) and ischemic tissue (Ho et al., 2004). Despite reports
in the literature indicating a role for integrin in the expression of type II collagen
and members of SOX family (Lee and Kim et al., 2009), the expression of DEL1
has only been previously shown in foetal chondrocytes (Stokes et al., 2002).
We have confirmed the expression of DEL1 in adult bovine chondrocytes and
shown a transient rise in DEL1 expression in P1 chondrocytes similarly to
previously reported levels observed in hydrogel cultured foetal chondrocytes
(Stokes et al., 2002) where phenotype is thought to be preserved for up to 180
days (Reginato et al., 1994). The rise in DEL1 expression has been found to
occur simultaneously with a transient rise in SOX9 and collagen II expression
and the decline in col2:col1. Therefore to further our knowledge of the cause-
and-effect status of DEL1 rise, the expression of DEL1 and collagens was
investigated at days 2, 4 , 6 and 9 of P1.
It was observed that the rise in DEL1 expression occurred as early as the 2nd
day in culture with ∼12-fold increase in expression followed by the decline in
col2:col1 expression on the 4th day in culture (Figure 5.2). These data indicated
a potential role for DEL1 in chondrocyte phenotype and confirmed earlier
observations of mesodifferentiated phenotype. The role of DEL1 expression in
chondrocyte phenotype was therefore further investigated using RNAi
technology.
The efficacy of the anti-DEL1 siRNA sequences designed was studied and
knockdown confirmed to last for up to 6 days. In response to longterm DEL1
171
knockdown, there was a reduction in type I collagen expression and therefore an
increase in col2:col1 to levels seen in freshly isolated chondrocytes (Figure 5.8).
These data confirmed that the loss of phenotype appeared to require transient
increase in DEL1 expression which may affect the expression of SOX9 and/or
Twist (key regulators of collagen expression and chondrocytic phenotype).
The role of DEL1 as an attachment protein was studied during 2D culture and it
was observed that although DEL1 was present at higher concentrations in P1
chondrocytes, the initial attachment was significantly reduced compared to that
observed in freshly isolated and 2D cultured chondrocytes. This was possibly
due to the time required for DEL1 protein accumulation post trypsinisation. It
was noted, however, that attachment levels similar to those in P0, P2 and P3
chondrocytes were obtained 4 hours post seeding, thus indicating an elevated
rate of attachment in P1 chondrocytes. Moreover, in response to knockdown,
there was a sharp decrease in both initial attachment and rate of attachment
suggesting that DEL1 is necessary for attachment in P1 mesodifferentiated
chondrocytes (Table 5.2).
The effect of DEL1 on the chondrocyte differentiated phenotype was studied by
longterm knockdown of DEL1. Upon DEL1 knockdown, a significant decrease in
both types collagen I and II expression was observed with an overall increase in
col2:col1 expression to values previously observed in freshly isolated
chondrocytes (Figure 5.8). Therefore and despite having no effect on the
expression levels of SOX9, DEL1 knockdown appeared to conserve a
differentiated phenotype (as defined by col2:col1 expression) for at least 9 days
in 2D culture.
Cellular dimensions and actin organisation were studied in response to DEL1
knockdown whereby an increase in the number of striation units was seen from
5±2 in control mock transfected P1 chondrocytes to 7±1 in DEL1(-)/P1
chondrocytes. The DEL1-mediated decrease in the number of striation units
172
could be caused by the recruitment of actin regulatory proteins and the creation
of subcortical focal contacts (Schaller et al., 1992), thereby reducing the
availability of monomeric G-actin molecules for the formation of actin filaments.
A reduction in chondrocyte length (c) and a significant decrease in cell volume
were additionally observed in DEL1(-)/P1 chondrocytes and could be possibly
attributed to the accompanying changes in actin cytoskeletal organisation and
thus volume regulatory mechanisms. Conversely, a significant increase in both
stress fibres and actin localisation within the focal contact has been previously
observed in response to DEL1 ligation in vascular smooth muscle cells (Razaee
et al., 2002).
Finally the effect of DEL1 knockdown on mechanotransduction processes
previously studied (RVI and REV5901-induced [Ca2+]i rise) was investigated as
a final confirmation of the effect of DEL1 on chondrocytic phenotype. In
response to DEL1 knockdown followed by a hyperosmotic challenge, DEL1(-
)/P1 chondrocytes did not exhibit RVI unlike their control mock-transfected
counterparts (Figure 5.10), rendering the former with a similar response to a
hyperosmotic challenge to that observed in freshly isolated chondrocytes. Work
by others has shown that the depolymerisation of actin using LB induced NKCC-
mediated RVI in freshly isolated chondrocytes (Kerrigan et al., 2006), and it
appears that the increase in filamentous actin polymerisation in response to
DEL1 knockdown inhibited RVI mechanisms observed in control P1
chondrocytes (slow RVI). Consequently, it could be argued the abolishment of a
RVI response upon knockdown may possibly be due to the previously discussed
changes in actin organisation, a key regulator of RVI.
The role of DEL1 in calcium homeostasis was investigated using REV5901 as
pharmacological inducer of [Ca2+]i rise and there was no change in the
magnitude of [Ca2+]i rise, the contribution of intracellular stores in response to
DEL1 knockdown. There was however, an increase and decrease in the NCX
and SACC contribution, respectively, to REV5901-induced [Ca2+]i rise to levels
173
observed in freshly isolated chondrocytes. Gd3+-sensitive SACC has been
implicated in the loss of phenotype in rat chondrosarcoma cell line (Perkins et
al., 2005) and shown to play a role in [Ca2+]i homeostasis of 2D cultured
chondrocytes (Kerrigan and Hall, 2008). Our observations of a reduced SACC
contribution upon DEL1 knockdown suggested that the loss of differentiated
phenotype may be mediated, but not exclusively, by an alteration in activity of
SACC, which may indeed be directly manipulated by co-localisation with
integrins as previously reported (Shakibaei and Mobasheri, 2003).
In conclusion, DEL1 has been shown to induce a decrease in col2:col1, increase
the rate of attachment, increase cell volume, increase cell length, increase
activity of SACC and induce slow RVI in response to hyperosmotic conditions.
Taken together these data confirmed the role of DEL1 in initiating the loss of
phenotype upon expansion by inducing a mesodifferentiated phenotype
characterised by the upregulation of DEL1 (Table 5.3) and proposed a DEL1
signalling pathway mediating the loss of phenotype (possibly via SOX9 and
Twist; investigated in the following chapter).
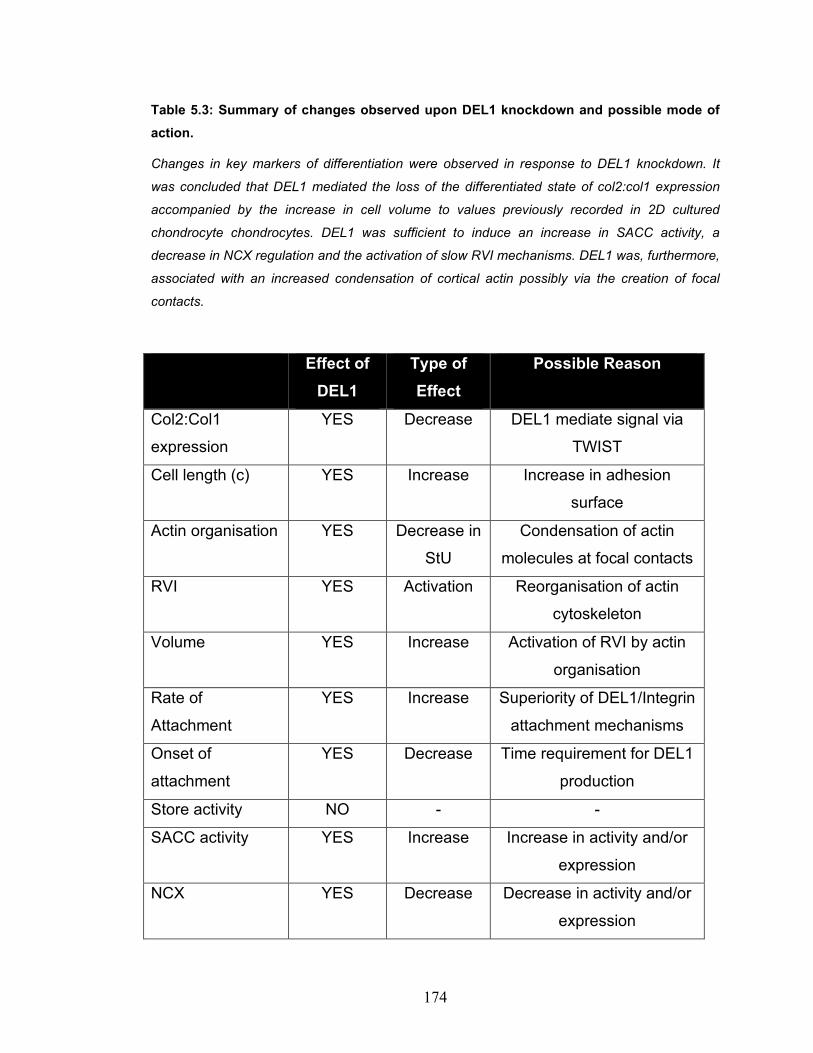
174
Table 5.3: Summary of changes observed upon DEL1 knockdown and possible mode of action.
Changes in key markers of differentiation were observed in response to DEL1 knockdown. It
was concluded that DEL1 mediated the loss of the differentiated state of col2:col1 expression
accompanied by the increase in cell volume to values previously recorded in 2D cultured
chondrocyte chondrocytes. DEL1 was sufficient to induce an increase in SACC activity, a
decrease in NCX regulation and the activation of slow RVI mechanisms. DEL1 was, furthermore,
associated with an increased condensation of cortical actin possibly via the creation of focal
contacts.
Effect of
DEL1 Type of Effect
Possible Reason
Col2:Col1
expression
YES Decrease DEL1 mediate signal via
TWIST
Cell length (c) YES Increase Increase in adhesion
surface
Actin organisation YES Decrease in
StU
Condensation of actin
molecules at focal contacts
RVI YES Activation Reorganisation of actin
cytoskeleton
Volume YES Increase Activation of RVI by actin
organisation
Rate of
Attachment
YES Increase Superiority of DEL1/Integrin
attachment mechanisms
Onset of
attachment
YES Decrease Time requirement for DEL1
production
Store activity NO - -
SACC activity YES Increase Increase in activity and/or
expression
NCX YES Decrease Decrease in activity and/or
expression
175
6 Experimental Chapter: The molecular signalling pathway of DEL1 in chondrocytes.
176
6.1 Chapter Introduction
Integrin signalling pathway was investigated when it was first observed that
integrin-ligand interaction induces integrin aggregation and the initiation of the
signal (Schaller et al., 1994). Following integrin activation, FAK trans-
autophosphorylation occurs which in turn induces the activation of PI3K (Chen
et al., 1996) and Rho (Hotchin & Hall, 1995) thereby activating Akt and Erk,
respectively (Renshaw et al., 1996). Erk and Akt signals initiate a switch in
expression battery and promote survival and cell proliferation. Furthermore, Rho
activates actin polymerisation proteins including cofilin, via PIP2 and possibly
[Ca2+]i regulation (Chong et al., 1994; Hartwig et al., 1995; Gilmore & Burridge,
1996).
The cellular signalling pathway of DEL1 binding was investigated by stable
transfection of osteosarcoma cells with recombinant DEL1 sequence using a
viral vector (Penta et al., 1999). It was concluded that DEL1 attachment was
associated with clustering of integrins, recruitment of actin-binding proteins
including Talin and Vinculin and the activation of FAK. In ovo, DEL1 possessed
highly angiogenic properties which were inhibited upon using anti-αvβ3
antibodies (Penta et al., 1999). Moreover, DEL1 has been shown to induce
angiogenesis and a switch in gene expression through interaction with αvβ3
heterodimers upon transfer to ischemic muscular tissue (Zhong et al., 2003; Ho
et al., 2004). Finally, it has been confirmed that a close relative of DEL1, Edil1,
promotes neovascularisation in vivo via αvβ3-dependent Akt phophorylation
(Silvestre et al., 2005).
SOX9 is a transcription factor that plays a role in chondrocyte differentiation by
binding to the promoters and activating the transcription of chondrocyte-specific
genes including type II collagen and aggrecan (de Crombrugghe et al., 2000;
177
Uusitalo et al., 2001), and our previous work has shown an association between
DEL1 and SOX9 levels of expression (Section 5.2.1). Therefore, the effect of
SOX9 on the transcription levels of DEL1 was studied using BMP2-induced rise
in SOX9 levels in 2D cultured chondrocytes.
BMP2 is a member of the TGF-β protein superfamily and is involved in the
development of bone and cartilage. It is expressed in the perichondrium/
periosteum (Zou et al., 1997; Pathi et al., 1999) and signals back to initiate key
cellular functions including proliferation (Venezian et al., 1998), hypertrophic
differentiation (De Luca et al., 2001; Li et al., 2006) and extracellular matrix
accumulation (Cheng et al., 2007). It was recently reported that BMP2 induced
chondrocyte-specific genes (including SOX9, type II collagen and aggrecan) in
synovium-derived progenitor cells (Park et al., 2005), an effect which could be
inhibited by the expression of Twist (Reinhold et al., 2006).
Twist is a member of basic helix loop helix (bHLH) transcription factors found to
be expressed in mesoderm-derived adult tissue including cartilage, and it was
recently observed to be overexpressed in 2D cultured chondrocytes (Stokes et
al., 2002). Twist has the capacity to form complexes with various transcription
factors thus performing various functions which include cell survival (Maestro et
al., 1999; Dupont et al., 2001; Valsesia-Wittmann et al., 2004), cell death (Sosic
et al., 2003; Ota et al., 2004), differentiation (Chen & Behringer, 1995; Spicer et
al., 1996; Ishii et al., 2003; Bialek et al., 2004) and most recently chondrocyte
maturation and dedifferentiation (Dong et al., 2007).
It has been hypothesised that Twist inhibited chondrocyte-specific phenotype by
direct interaction with the p65 subunit of NFκB transcription complex (Sosic et
al., 2003) and/or p300, a close associate of SOX9 and enhancer of type II
collagen production (Hamamori et al., 1999; Tsuda et al., 2003). Reinhold et al.
reported that Twist expression was mediated by the canonical Wnt signalling
pathway involving β-catenin and GSK3-mediated β-catenin ubiquitination
178
complex (Giles et al., 2003) as observed by the overexpression of Twist in the
presence of Wnt3a or a pharmacological GSK3 inhibitor.
In this chapter, Akt, a biological GSK3 inhibitor, was studied as a potential
downstream element of DEL1, and key regulator of β-catenin levels
(pharmacologically inhibited using 500µM R-Etodolac; Behari et al., 2007) and
thus Twist expression. Furthermore, the effect of Twist knockdown using siRNA
was also investigated as a key indicator of the role of Twist in chondrocyte
phenotype manipulation.
Aims of Experimental Chapter
1 Determine the SOX9 regulatory effects on DEL1 expression using BMP2.
2 Determine the activation of Akt in response to elevated DEL1 expression.
3 Investigate the role of β-catenin in mediating DEL1-Twist signal.
4 Investigate the expression level of Twist in response to 2D culture.
5 Investigate the role of DEL1 on Twist expression.
6 Establish Twist knockdown using the designed Twist siRNA.
7 Study the effect of Twist knockdown on gene expression.
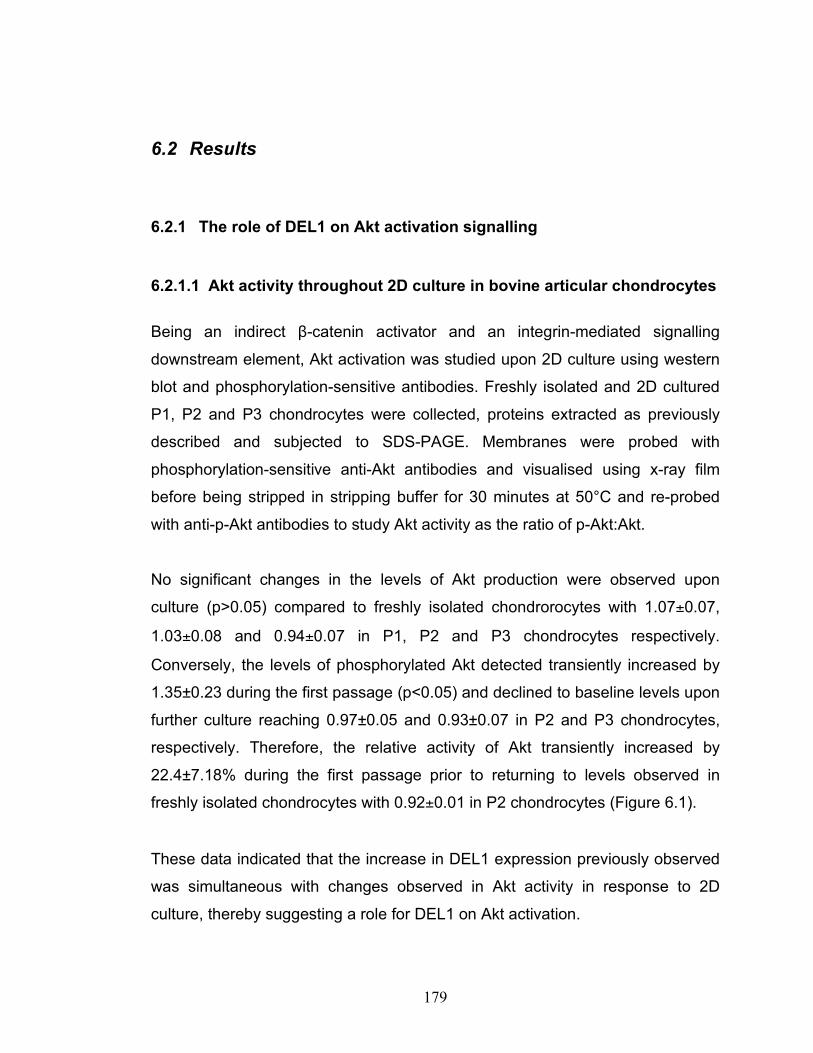
179
6.2 Results
6.2.1 The role of DEL1 on Akt activation signalling
6.2.1.1 Akt activity throughout 2D culture in bovine articular chondrocytes
Being an indirect β-catenin activator and an integrin-mediated signalling
downstream element, Akt activation was studied upon 2D culture using western
blot and phosphorylation-sensitive antibodies. Freshly isolated and 2D cultured
P1, P2 and P3 chondrocytes were collected, proteins extracted as previously
described and subjected to SDS-PAGE. Membranes were probed with
phosphorylation-sensitive anti-Akt antibodies and visualised using x-ray film
before being stripped in stripping buffer for 30 minutes at 50°C and re-probed
with anti-p-Akt antibodies to study Akt activity as the ratio of p-Akt:Akt.
No significant changes in the levels of Akt production were observed upon
culture (p>0.05) compared to freshly isolated chondrorocytes with 1.07±0.07,
1.03±0.08 and 0.94±0.07 in P1, P2 and P3 chondrocytes respectively.
Conversely, the levels of phosphorylated Akt detected transiently increased by
1.35±0.23 during the first passage (p<0.05) and declined to baseline levels upon
further culture reaching 0.97±0.05 and 0.93±0.07 in P2 and P3 chondrocytes,
respectively. Therefore, the relative activity of Akt transiently increased by
22.4±7.18% during the first passage prior to returning to levels observed in
freshly isolated chondrocytes with 0.92±0.01 in P2 chondrocytes (Figure 6.1).
These data indicated that the increase in DEL1 expression previously observed
was simultaneous with changes observed in Akt activity in response to 2D
culture, thereby suggesting a role for DEL1 on Akt activation.
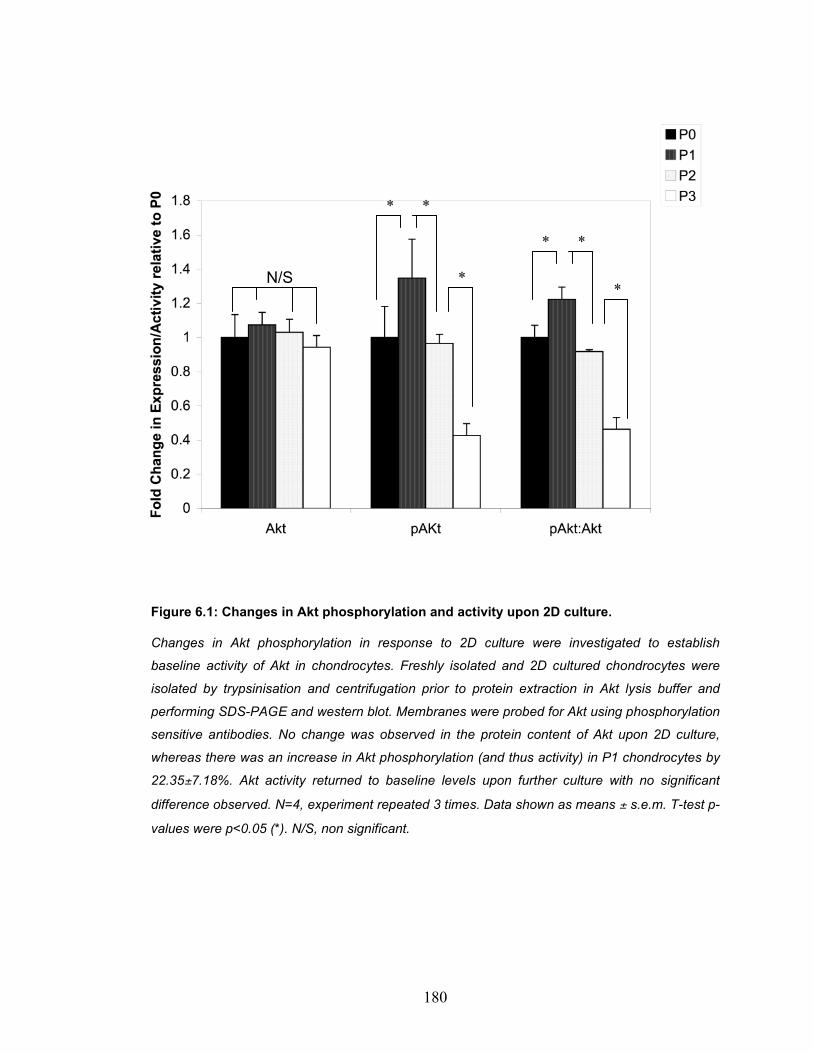
180
Figure 6.1: Changes in Akt phosphorylation and activity upon 2D culture.
Changes in Akt phosphorylation in response to 2D culture were investigated to establish
baseline activity of Akt in chondrocytes. Freshly isolated and 2D cultured chondrocytes were
isolated by trypsinisation and centrifugation prior to protein extraction in Akt lysis buffer and
performing SDS-PAGE and western blot. Membranes were probed for Akt using phosphorylation
sensitive antibodies. No change was observed in the protein content of Akt upon 2D culture,
whereas there was an increase in Akt phosphorylation (and thus activity) in P1 chondrocytes by
22.35±7.18%. Akt activity returned to baseline levels upon further culture with no significant
difference observed. N=4, experiment repeated 3 times. Data shown as means ± s.e.m. T-test p-
values were p<0.05 (*). N/S, non significant.
* *
* *
N/S * *
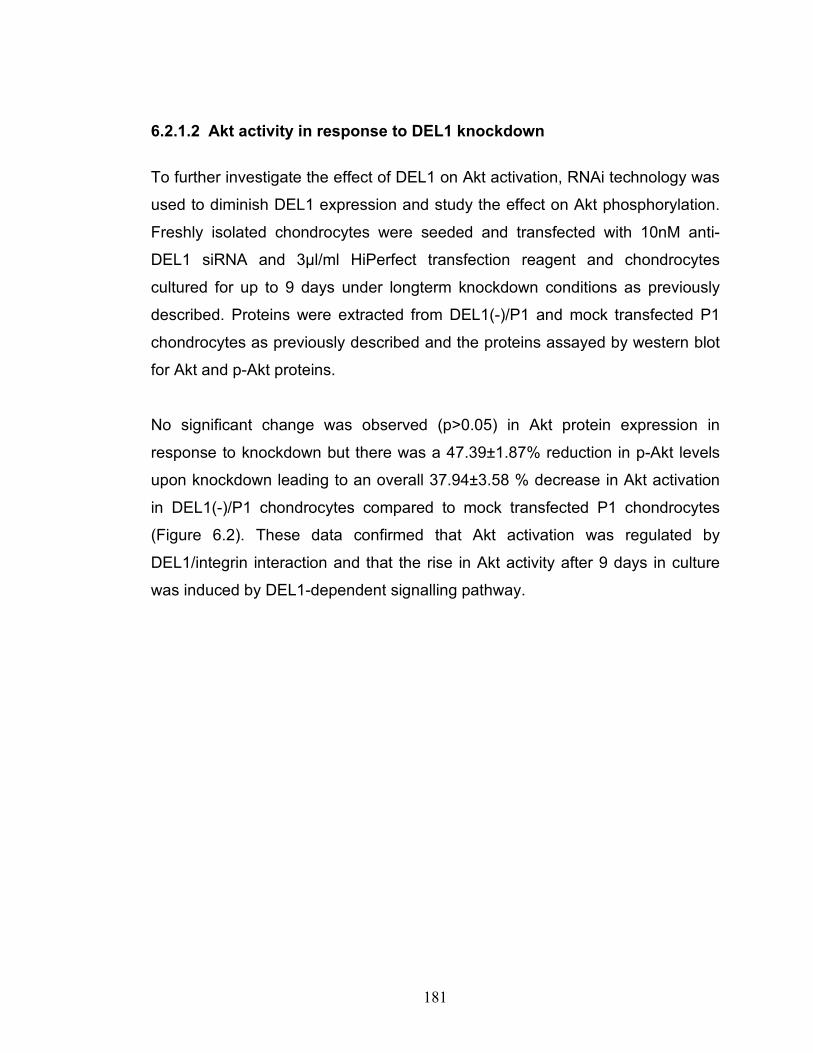
181
6.2.1.2 Akt activity in response to DEL1 knockdown
To further investigate the effect of DEL1 on Akt activation, RNAi technology was
used to diminish DEL1 expression and study the effect on Akt phosphorylation.
Freshly isolated chondrocytes were seeded and transfected with 10nM anti-
DEL1 siRNA and 3µl/ml HiPerfect transfection reagent and chondrocytes
cultured for up to 9 days under longterm knockdown conditions as previously
described. Proteins were extracted from DEL1(-)/P1 and mock transfected P1
chondrocytes as previously described and the proteins assayed by western blot
for Akt and p-Akt proteins.
No significant change was observed (p>0.05) in Akt protein expression in
response to knockdown but there was a 47.39±1.87% reduction in p-Akt levels
upon knockdown leading to an overall 37.94±3.58 % decrease in Akt activation
in DEL1(-)/P1 chondrocytes compared to mock transfected P1 chondrocytes
(Figure 6.2). These data confirmed that Akt activation was regulated by
DEL1/integrin interaction and that the rise in Akt activity after 9 days in culture
was induced by DEL1-dependent signalling pathway.
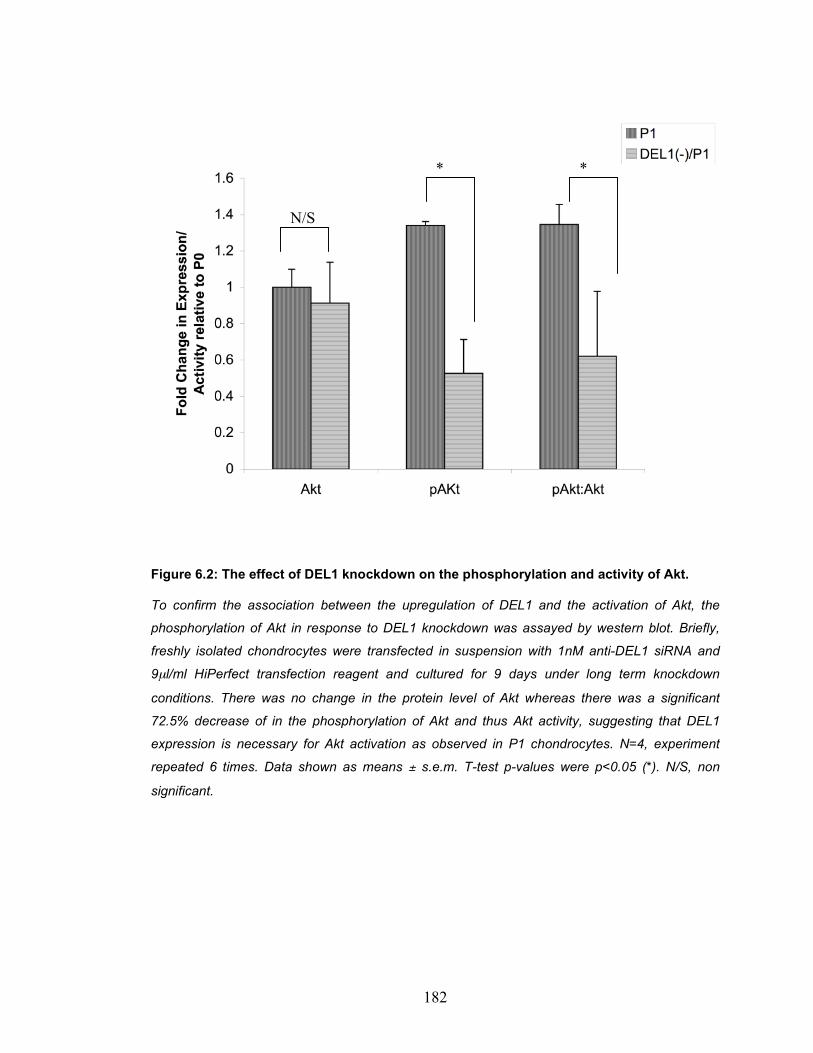
182
Figure 6.2: The effect of DEL1 knockdown on the phosphorylation and activity of Akt.
To confirm the association between the upregulation of DEL1 and the activation of Akt, the
phosphorylation of Akt in response to DEL1 knockdown was assayed by western blot. Briefly,
freshly isolated chondrocytes were transfected in suspension with 1nM anti-DEL1 siRNA and
9µl/ml HiPerfect transfection reagent and cultured for 9 days under long term knockdown
conditions. There was no change in the protein level of Akt whereas there was a significant
72.5% decrease of in the phosphorylation of Akt and thus Akt activity, suggesting that DEL1
expression is necessary for Akt activation as observed in P1 chondrocytes. N=4, experiment
repeated 6 times. Data shown as means ± s.e.m. T-test p-values were p<0.05 (*). N/S, non
significant.
* *
N/S

183
6.2.2 The expression and role of Twist in 2D expansion of chondrocytes
6.2.2.1 Changes in Twist expression upon 2D chondrocyte culture
Being a potential downstream element of DEL1 and a key regulator of
chondrocytic phenotype, Twist expression was assayed before and upon culture
as a first indicator of its biological relevance. Freshly isolated and 2D cultured
chondrocytes were collected and RNA extracted and subjected to RT-PCR to
assay Twist expression. PCR products were separated using 2% agarose gel
electrophoresis and band intensity assayed by ethidium bromide densitometery
as previously described (see Materials and Methods).
There was a significant increase (p<0.05) in the level of Twist relative
expression from 1.08±0.08 to 3.00±0.54 after 9 days in culture and this elevation
in Twist expression was maintained for the remainder of culture period studied
with no further significant changes (p>0.05) with 3.33±0.54 and 3.32±0.53 in P2
and P3 2D cultured chondrocytes, respectively. These data confirmed reported
findings that suggest a role for Twist expression in the loss of differentiated
chondrocytic phenotype upon 2D culture.
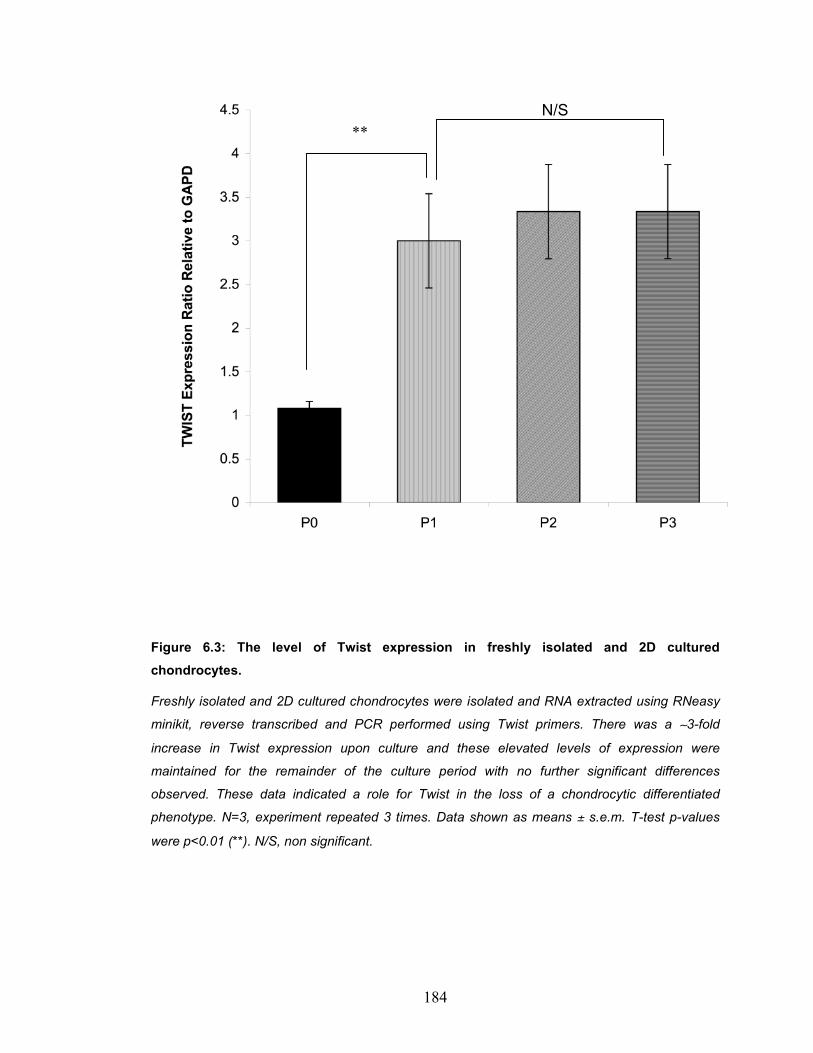
184
Figure 6.3: The level of Twist expression in freshly isolated and 2D cultured chondrocytes.
Freshly isolated and 2D cultured chondrocytes were isolated and RNA extracted using RNeasy
minikit, reverse transcribed and PCR performed using Twist primers. There was a ∼3-fold
increase in Twist expression upon culture and these elevated levels of expression were
maintained for the remainder of the culture period with no further significant differences
observed. These data indicated a role for Twist in the loss of a chondrocytic differentiated
phenotype. N=3, experiment repeated 3 times. Data shown as means ± s.e.m. T-test p-values
were p<0.01 (**). N/S, non significant.
** N/S
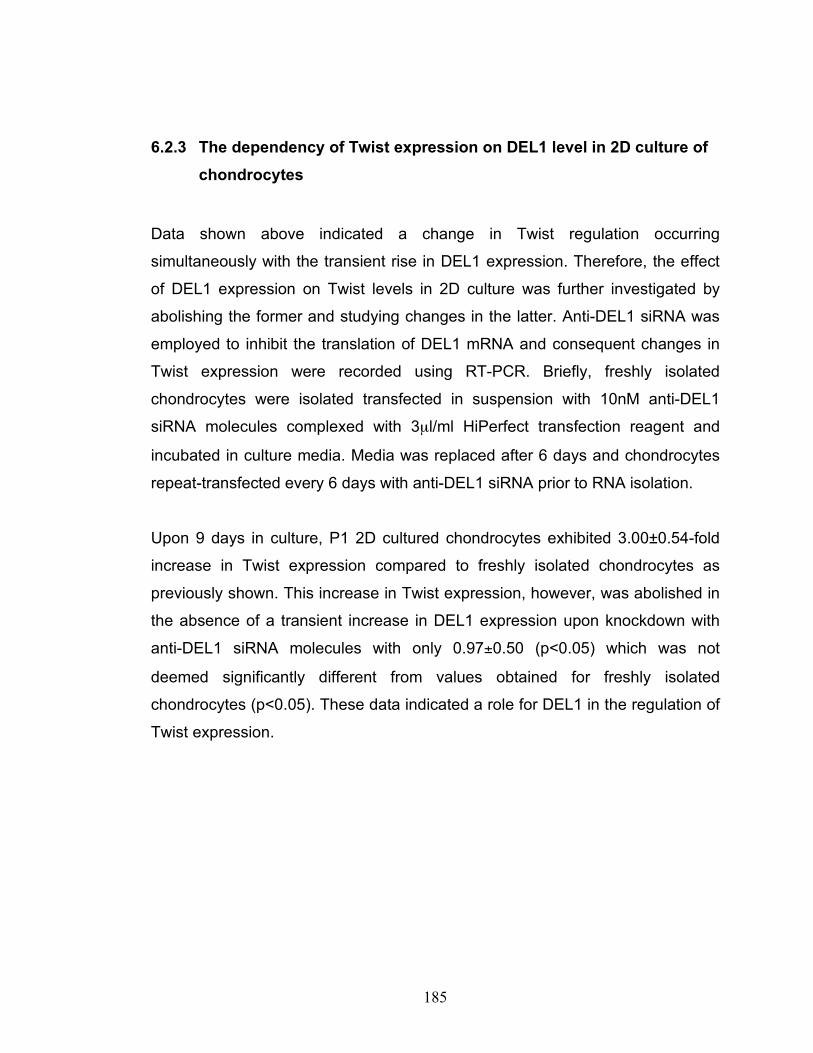
185
6.2.3 The dependency of Twist expression on DEL1 level in 2D culture of chondrocytes
Data shown above indicated a change in Twist regulation occurring
simultaneously with the transient rise in DEL1 expression. Therefore, the effect
of DEL1 expression on Twist levels in 2D culture was further investigated by
abolishing the former and studying changes in the latter. Anti-DEL1 siRNA was
employed to inhibit the translation of DEL1 mRNA and consequent changes in
Twist expression were recorded using RT-PCR. Briefly, freshly isolated
chondrocytes were isolated transfected in suspension with 10nM anti-DEL1
siRNA molecules complexed with 3µl/ml HiPerfect transfection reagent and
incubated in culture media. Media was replaced after 6 days and chondrocytes
repeat-transfected every 6 days with anti-DEL1 siRNA prior to RNA isolation.
Upon 9 days in culture, P1 2D cultured chondrocytes exhibited 3.00±0.54-fold
increase in Twist expression compared to freshly isolated chondrocytes as
previously shown. This increase in Twist expression, however, was abolished in
the absence of a transient increase in DEL1 expression upon knockdown with
anti-DEL1 siRNA molecules with only 0.97±0.50 (p<0.05) which was not
deemed significantly different from values obtained for freshly isolated
chondrocytes (p<0.05). These data indicated a role for DEL1 in the regulation of
Twist expression.
186
Figure 6.4: The effect of DEL1 knockdown on the expression of Twist in P1 chondrocytes.
The effect of DEL1 upregulation in P1 chondrocytes on the expression of Twist was studied by
DEL1 knockdown prior to culture, and observing Twist expression using RT-PCR. Following 9
days in culture, mock-transfected P1 chondrocytes demonstrated a significant 3.00±0.54-fold
increase in Twist expression which was abolished in the absence of DEL1. These data indicated
a role for DEL1 in the upregulation of Twist expression in mesodifferentiated chondrocytes. N=4,
experiment repeated 6 times. Data shown as means ± s.e.m. T-test p-values were p<0.01 (**).
** **
187
6.2.3.1 The role of the β-catenin-dependent DEL1/Akt signal on Twist expression
To further study the signal between DEL1/integrin interaction and Twist
expression, a pharmacological inhibitor of β-catenin, R-Etodolac, was used to
confirm the necessity for β-catenin for the expression of Twist suggested by
others (Reinhold et al., 2006). Freshly isolated chondrocytes were seeded in
culture media with or without the presence of 500µM R-Etodolac and cultured as
previously described. Upon confluence, RNA was extracted from P1
chondrocytes using RNeasy minikit and subjected to RT-PCR to study the
changes in Twist expression.
As previously observed, there was an increase (p>0.05) in Twist expression by
the end of the first passage to 3.00±0.54 which was significantly reduced
(p<0.05) to 1.70±0.61% in the presence of R-Etodolac (p<0.05). Despite Twist
expression levels not returning to baseline levels upon R-Etodolac treatment
(p<0.05), these data indicated that the upregulation of Twist was significantly
reduced by inhibition of intracellular β-catenin levels, which were in turn
potentially regulated by Akt activity and DEL1 expression levels.
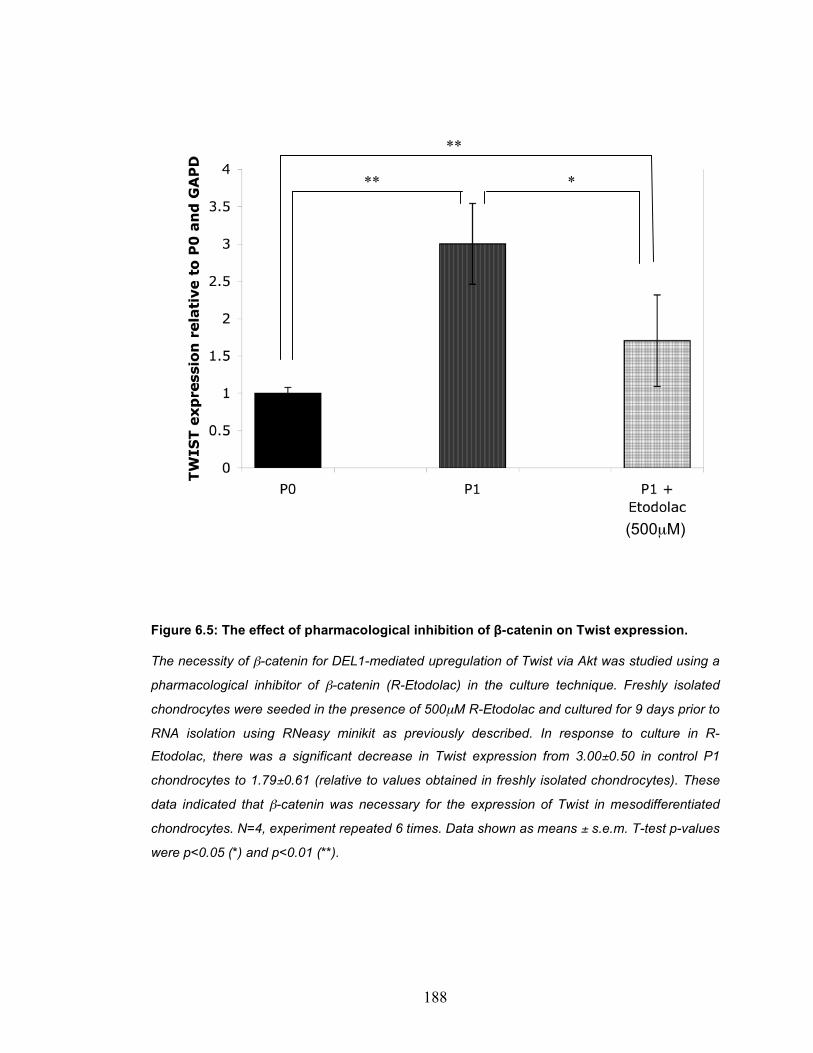
188
Figure 6.5: The effect of pharmacological inhibition of β-catenin on Twist expression.
The necessity of β-catenin for DEL1-mediated upregulation of Twist via Akt was studied using a
pharmacological inhibitor of β-catenin (R-Etodolac) in the culture technique. Freshly isolated
chondrocytes were seeded in the presence of 500µM R-Etodolac and cultured for 9 days prior to
RNA isolation using RNeasy minikit as previously described. In response to culture in R-
Etodolac, there was a significant decrease in Twist expression from 3.00±0.50 in control P1
chondrocytes to 1.79±0.61 (relative to values obtained in freshly isolated chondrocytes). These
data indicated that β-catenin was necessary for the expression of Twist in mesodifferentiated
chondrocytes. N=4, experiment repeated 6 times. Data shown as means ± s.e.m. T-test p-values
were p<0.05 (*) and p<0.01 (**).
* **
**
(500µM)
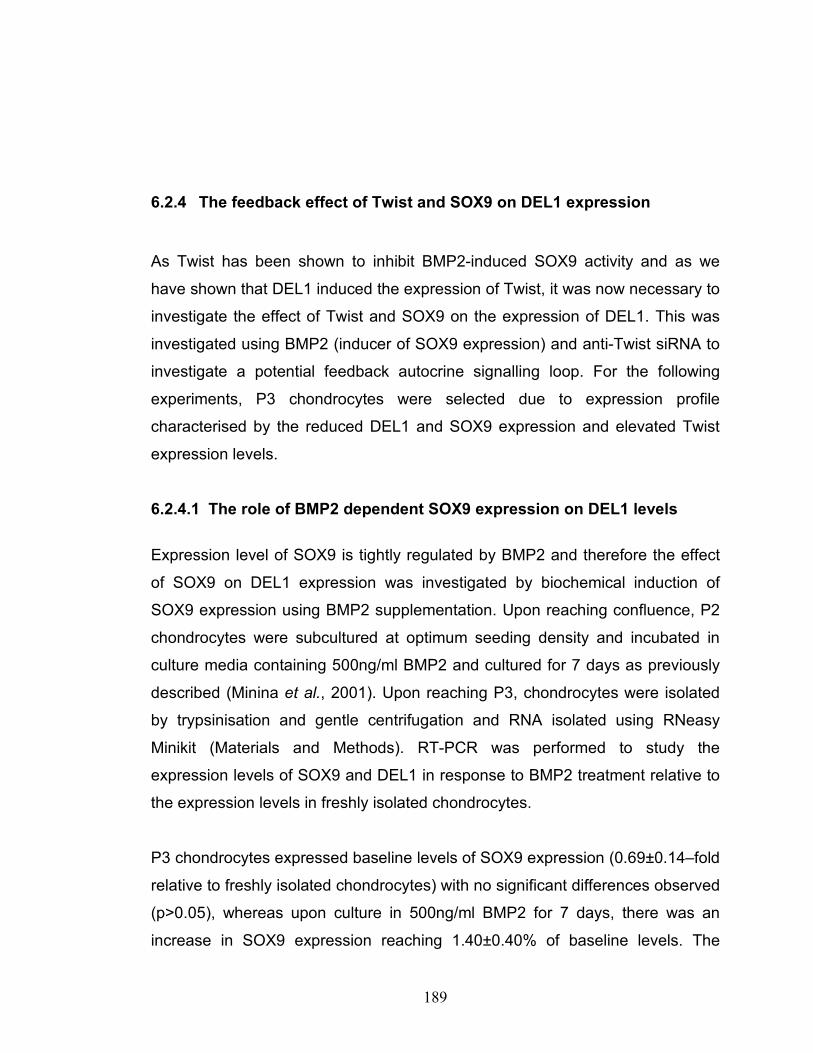
189
6.2.4 The feedback effect of Twist and SOX9 on DEL1 expression
As Twist has been shown to inhibit BMP2-induced SOX9 activity and as we
have shown that DEL1 induced the expression of Twist, it was now necessary to
investigate the effect of Twist and SOX9 on the expression of DEL1. This was
investigated using BMP2 (inducer of SOX9 expression) and anti-Twist siRNA to
investigate a potential feedback autocrine signalling loop. For the following
experiments, P3 chondrocytes were selected due to expression profile
characterised by the reduced DEL1 and SOX9 expression and elevated Twist
expression levels.
6.2.4.1 The role of BMP2 dependent SOX9 expression on DEL1 levels
Expression level of SOX9 is tightly regulated by BMP2 and therefore the effect
of SOX9 on DEL1 expression was investigated by biochemical induction of
SOX9 expression using BMP2 supplementation. Upon reaching confluence, P2
chondrocytes were subcultured at optimum seeding density and incubated in
culture media containing 500ng/ml BMP2 and cultured for 7 days as previously
described (Minina et al., 2001). Upon reaching P3, chondrocytes were isolated
by trypsinisation and gentle centrifugation and RNA isolated using RNeasy
Minikit (Materials and Methods). RT-PCR was performed to study the
expression levels of SOX9 and DEL1 in response to BMP2 treatment relative to
the expression levels in freshly isolated chondrocytes.
P3 chondrocytes expressed baseline levels of SOX9 expression (0.69±0.14–fold
relative to freshly isolated chondrocytes) with no significant differences observed
(p>0.05), whereas upon culture in 500ng/ml BMP2 for 7 days, there was an
increase in SOX9 expression reaching 1.40±0.40% of baseline levels. The

190
BMP2-mediated SOX9 rise was not significantly different (p>0.05) from naturally
occurring rise in SOX9 previously observed in P1 chondrocytes (Figure 6.6).
It was observed that in the presence of SOX9 upregulation in response to BMP2
treatment, there was an overexpression of DEL1 on RNA level relative to
baseline expression in freshly isolated chondrocytes (p<0.05). In the presence
of 500ng/ml BMP2 and thus higher levels of SOX9 expression, there was a ~3-
fold increase in DEL1 expression levels reaching 3.01±0.67 relative baseline
levels, a rise deemed not significantly different (p>0.05) from the rise in DEL1
expression observed in P1 chondrocytes (Figure 6.6). These data confirmed that
BMP2 is a key regulator of SOX9 expression levels, which in turn appeared to
be regulate the expression of DEL1. These data support the theory that SOX9
and DEL1 upregulation in P1 chondrocytes is part of a regulatory pathway
involved in chondrocyte differentiation. No further rise in Twist expression in
BMP2-treated P3 chondrocytes was observed, thereby indicating no regulatory
role for SOX9 on the expression of Twist in dedifferentiated chondrocytes
(p>0.05).
There was, however, no change in the expression of types I and II collagens and
thus no change in col2:col1 expression in response to BMP2 treatment. Control
P3 chondrocytes and BMP2-treated exhibited relative expression of 2.49±0.37
and 1.43±0.51 of type I collagen and 0.98±0.34 and 0.78±0.52 of type II
collagen, respectively. These data indicated that while BMP2 treatment induced
a mesodifferentiated-like phenotype in dedifferentiated chondrocytes as
characterised by SOX9, DEL1 and col2:col1 expression, it was not sufficient to
recapture the differentiated phenotype in P3 chondrocytes following expansion
(Figure 6.7).
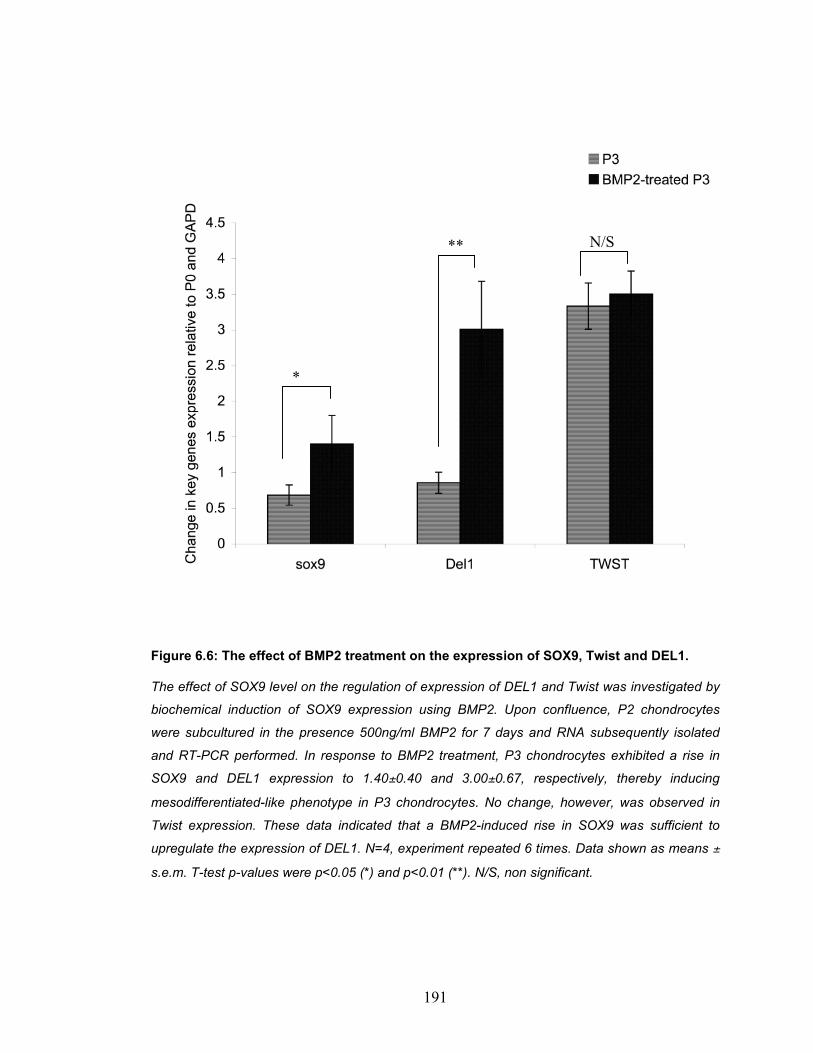
191
Figure 6.6: The effect of BMP2 treatment on the expression of SOX9, Twist and DEL1.
The effect of SOX9 level on the regulation of expression of DEL1 and Twist was investigated by
biochemical induction of SOX9 expression using BMP2. Upon confluence, P2 chondrocytes
were subcultured in the presence 500ng/ml BMP2 for 7 days and RNA subsequently isolated
and RT-PCR performed. In response to BMP2 treatment, P3 chondrocytes exhibited a rise in
SOX9 and DEL1 expression to 1.40±0.40 and 3.00±0.67, respectively, thereby inducing
mesodifferentiated-like phenotype in P3 chondrocytes. No change, however, was observed in
Twist expression. These data indicated that a BMP2-induced rise in SOX9 was sufficient to
upregulate the expression of DEL1. N=4, experiment repeated 6 times. Data shown as means ±
s.e.m. T-test p-values were p<0.05 (*) and p<0.01 (**). N/S, non significant.
*
** N/S
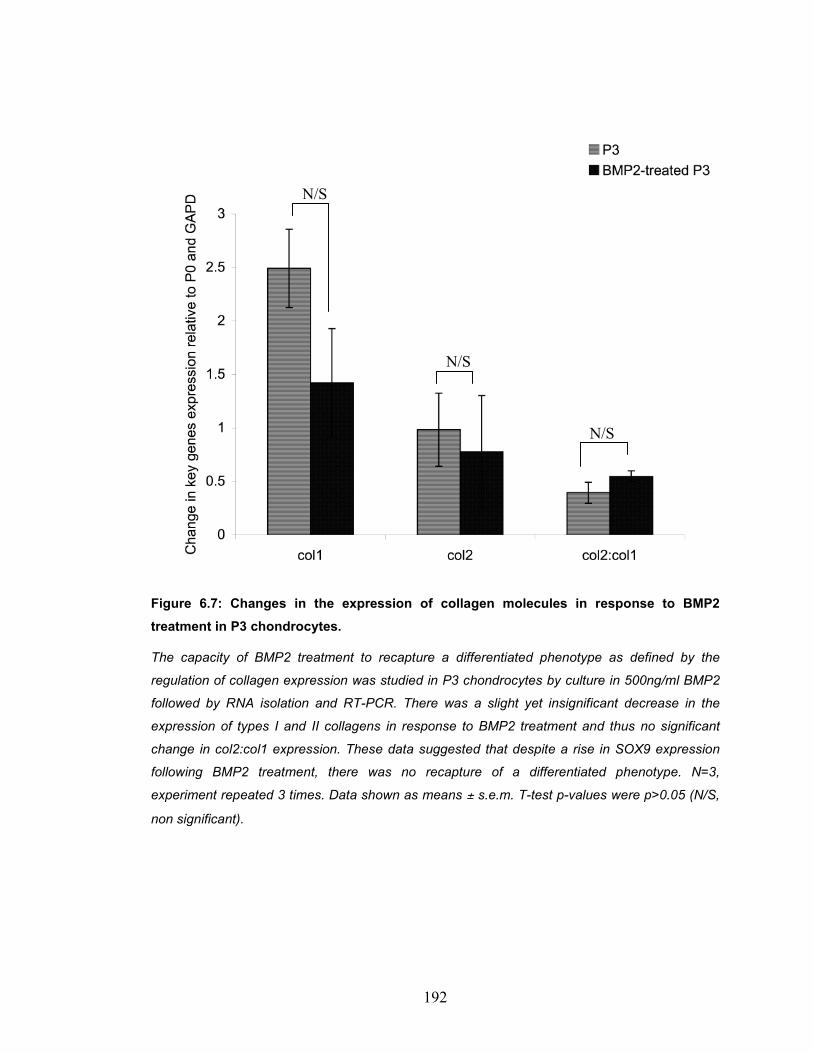
192
Figure 6.7: Changes in the expression of collagen molecules in response to BMP2 treatment in P3 chondrocytes.
The capacity of BMP2 treatment to recapture a differentiated phenotype as defined by the
regulation of collagen expression was studied in P3 chondrocytes by culture in 500ng/ml BMP2
followed by RNA isolation and RT-PCR. There was a slight yet insignificant decrease in the
expression of types I and II collagens in response to BMP2 treatment and thus no significant
change in col2:col1 expression. These data suggested that despite a rise in SOX9 expression
following BMP2 treatment, there was no recapture of a differentiated phenotype. N=3,
experiment repeated 3 times. Data shown as means ± s.e.m. T-test p-values were p>0.05 (N/S,
non significant).
N/S
N/S
N/S
193
6.2.4.2 Twist knockdown using RNAi
To further assay the direct effect of Twist on chondrocytic phenotype, RNAi
technology was employed to knockdown Twist expression and record changes
in DEL1 expression. Anti-Twist siRNA were designed as previously described
(Materials and Methods) and the efficacy of the knockdown of the selected
sequences studied in P3 2D cultured chondrocytes where Twist overexpression
was observed and deemed stable.
Confluent P2 2D cultured chondrocytes were isolated by trypsin treatment and
centrifugation prior to transfection in suspension using anti-Twist siRNA
complexes freshly prepared with 1nM siRNA complexed with 3µl/ml HiPerfect
transfection reagent (See Materials and Methods). Chondrocytes were seeded
at standard seeding density, RNA isolated every 2 days in culture until reaching
P3, and the levels of Twist expression studied by RT-PCR relative to GAPD and
freshly isolated chondrocytes.
Upon 2 days of transfection, there was a decrease in Twist expression to
0.73±0.04-fold relative to control expression levels (p<0.05), indicating
successful knockdown using the sequences designed. These values of
expression were maintained for a further 2 days with no significant differences
observed (p>0.05), whereas following 6 days of transfection, the levels of Twist
expression increased reaching 2.50±0.13% of baseline P3 Twist expression
(Figure 6.8). These data confirmed the transience of RNAi knockdown and were
necessary to determine the frequency of repeat-transfection required to
establish long-term Twist knockdown.
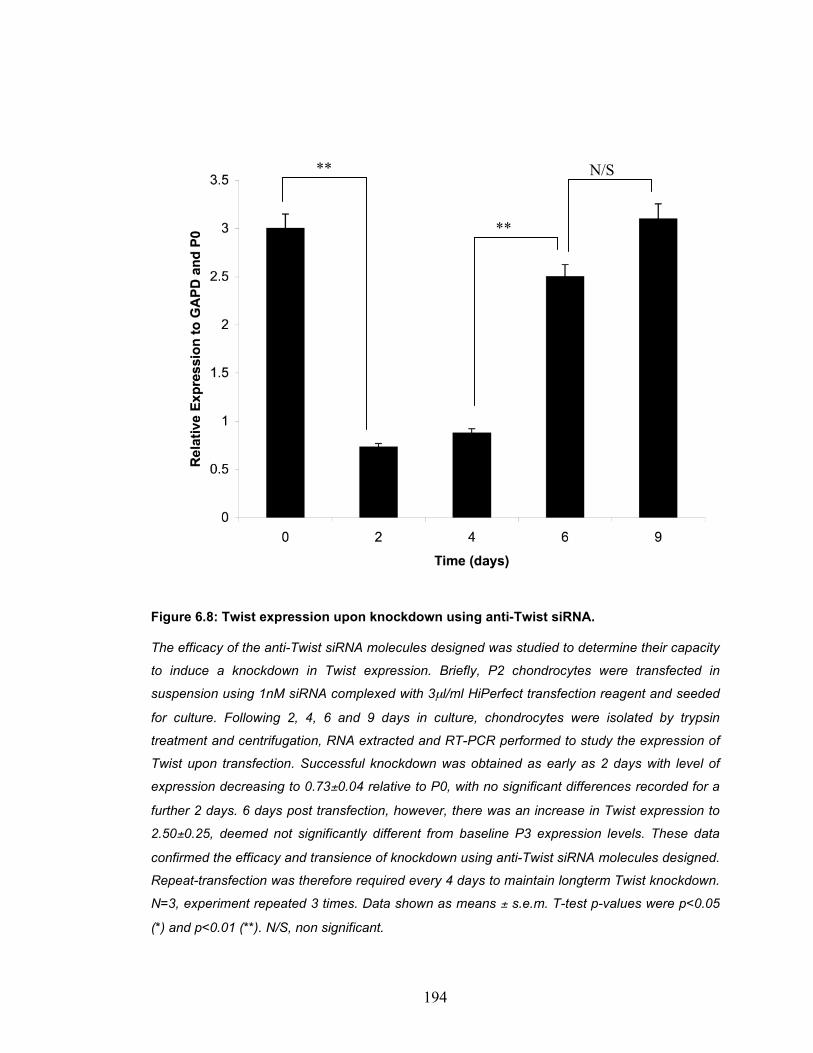
194
Figure 6.8: Twist expression upon knockdown using anti-Twist siRNA.
The efficacy of the anti-Twist siRNA molecules designed was studied to determine their capacity
to induce a knockdown in Twist expression. Briefly, P2 chondrocytes were transfected in
suspension using 1nM siRNA complexed with 3µl/ml HiPerfect transfection reagent and seeded
for culture. Following 2, 4, 6 and 9 days in culture, chondrocytes were isolated by trypsin
treatment and centrifugation, RNA extracted and RT-PCR performed to study the expression of
Twist upon transfection. Successful knockdown was obtained as early as 2 days with level of
expression decreasing to 0.73±0.04 relative to P0, with no significant differences recorded for a
further 2 days. 6 days post transfection, however, there was an increase in Twist expression to
2.50±0.25, deemed not significantly different from baseline P3 expression levels. These data
confirmed the efficacy and transience of knockdown using anti-Twist siRNA molecules designed.
Repeat-transfection was therefore required every 4 days to maintain longterm Twist knockdown.
N=3, experiment repeated 3 times. Data shown as means ± s.e.m. T-test p-values were p<0.05
(*) and p<0.01 (**). N/S, non significant.
**
**
N/S
195
6.2.4.3 The effect of Twist knockdown on chondrocyte phenotype as characterised by collagen expression
The effect of Twist expression on chondrocyte phenotype regulation was
investigated using anti-Twist siRNA. Briefly, P2 chondrocytes were tryspinised
upon confluence and transfected in suspension with 1nM anti-Twist siRNA and
3µl/ml HiPerfect transfection reagent and repeat transfected every 4 days to
maintain long term Twist knockdown. Upon confluence, RNA extracted from
control P3 and Twist-knockdown P3 chondrocytes and subjected to RT-PCR to
assay the expression of key genes including types I and II collagen. The level of
expression was calculated using gel densitometry and was expressed relative to
the level of expression in freshly isolated chondrocytes.
Twist knockdown did not have a significant effect on the regulation of types II
and I collagen expression (Figure 6.9). There was a slight yet insignificant
increase in the expression of type I collagen in response to Twist knockdown
from 2.22±0.35 in P3 cultured chondrocytes to 3.26±0.34 in Twist knockdown P3
chondrocytes (relative to freshly isolated chondrocytes; p>0.05). Similarly,
collagen II expression increased from 1.50±0.09 in control mock-transfected P3
chondrocytes to 1.82±0.12 upon Twist knockdown with no significant differences
observed (p>0.05).
There was therefore no significant change in the type II to type I collagen
expression ratio upon Twist knockdown with a slight decrease from 0.71±0.16 in
mock-transfected P3 chondrocytes to 0.56±0.02 in Twist knockdown P3
chondrocytes relative to levels determined in freshly isolated chondrocytes
(p>0.05). These details indicate that Twist knockdown is not sufficient to induce
a restoration of chondrocyte differentiated phenotype.
Interestingly, a ~2-fold increase in DEL1 expression was observed upon Twist
knockdown with expression values of 1.88±0.37 relative to freshly isolated
196
chondrocytes (p<0.05; Figure 6.10). Furthermore, Twist knockdown had no
significant effect on SOX9 expression with 0.69±0.14 of baseline expression
observed in mock transfected and Twist knockdown P3 chondrocytes. These
data showed that Twist knockdown induced DEL1 expression possibly via
activation rather than upregulation of SOX9.
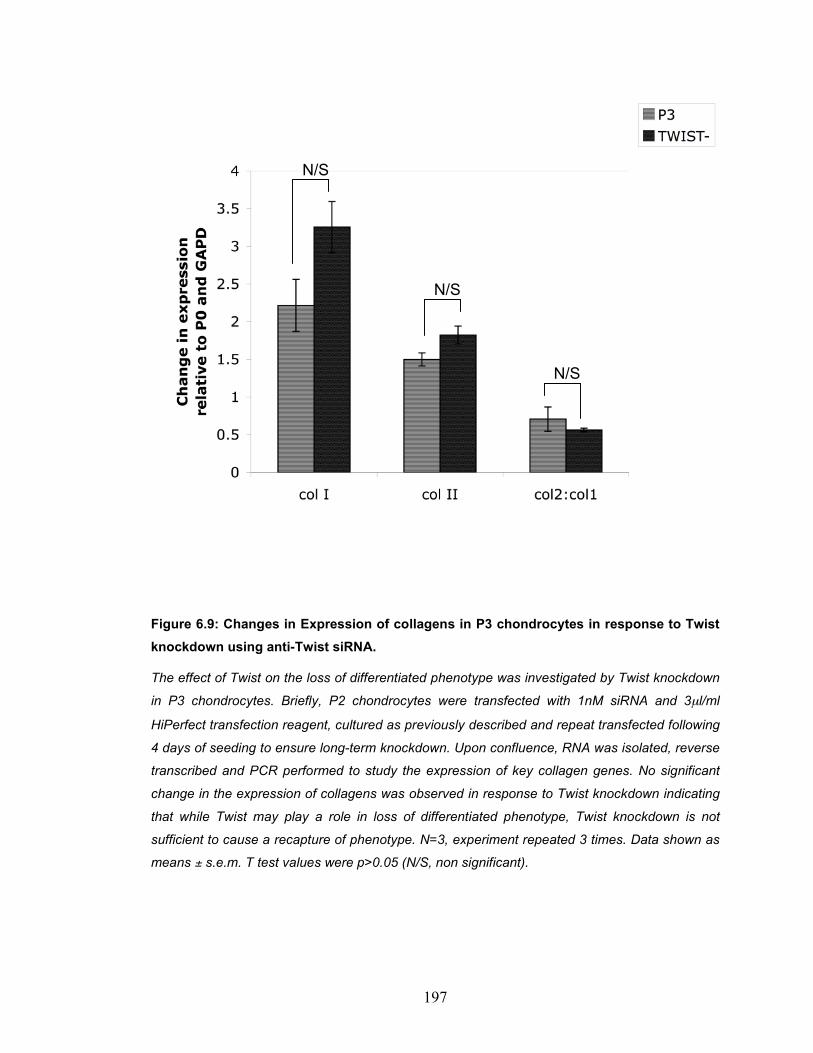
197
Figure 6.9: Changes in Expression of collagens in P3 chondrocytes in response to Twist knockdown using anti-Twist siRNA.
The effect of Twist on the loss of differentiated phenotype was investigated by Twist knockdown
in P3 chondrocytes. Briefly, P2 chondrocytes were transfected with 1nM siRNA and 3µl/ml
HiPerfect transfection reagent, cultured as previously described and repeat transfected following
4 days of seeding to ensure long-term knockdown. Upon confluence, RNA was isolated, reverse
transcribed and PCR performed to study the expression of key collagen genes. No significant
change in the expression of collagens was observed in response to Twist knockdown indicating
that while Twist may play a role in loss of differentiated phenotype, Twist knockdown is not
sufficient to cause a recapture of phenotype. N=3, experiment repeated 3 times. Data shown as
means ± s.e.m. T test values were p>0.05 (N/S, non significant).
N/S
N/S
N/S
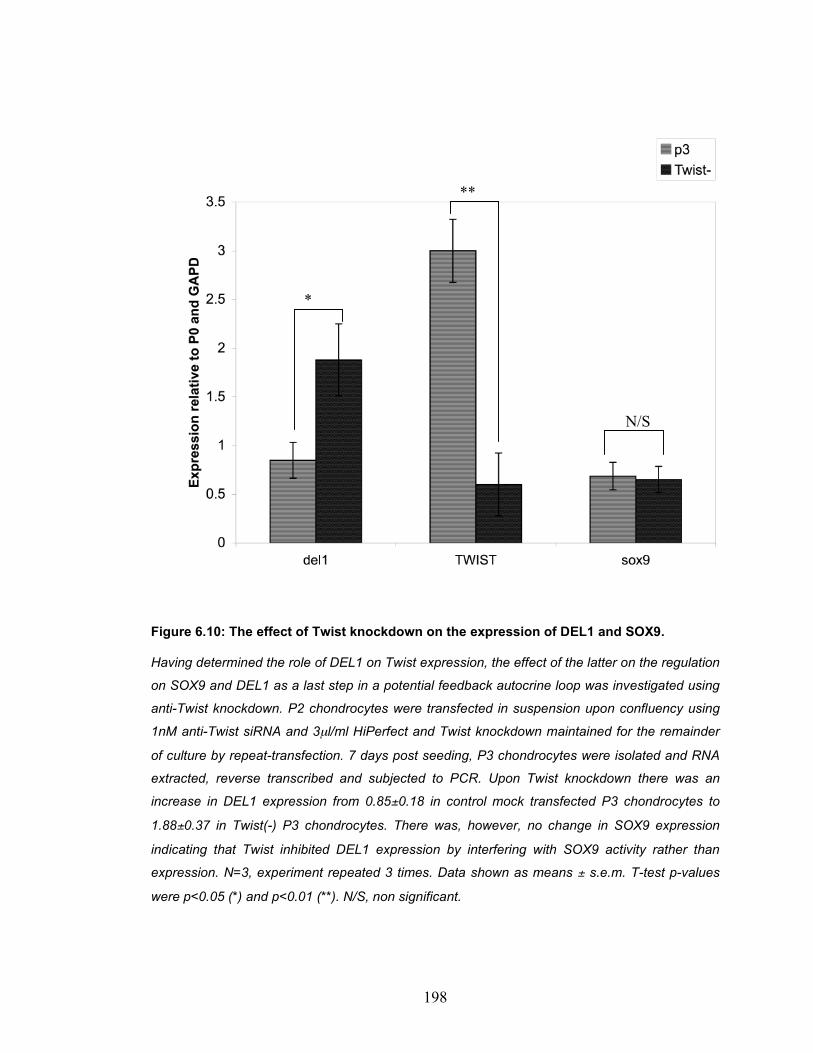
198
Figure 6.10: The effect of Twist knockdown on the expression of DEL1 and SOX9.
Having determined the role of DEL1 on Twist expression, the effect of the latter on the regulation
on SOX9 and DEL1 as a last step in a potential feedback autocrine loop was investigated using
anti-Twist knockdown. P2 chondrocytes were transfected in suspension upon confluency using
1nM anti-Twist siRNA and 3µl/ml HiPerfect and Twist knockdown maintained for the remainder
of culture by repeat-transfection. 7 days post seeding, P3 chondrocytes were isolated and RNA
extracted, reverse transcribed and subjected to PCR. Upon Twist knockdown there was an
increase in DEL1 expression from 0.85±0.18 in control mock transfected P3 chondrocytes to
1.88±0.37 in Twist(-) P3 chondrocytes. There was, however, no change in SOX9 expression
indicating that Twist inhibited DEL1 expression by interfering with SOX9 activity rather than
expression. N=3, experiment repeated 3 times. Data shown as means ± s.e.m. T-test p-values
were p<0.05 (*) and p<0.01 (**). N/S, non significant.
**
*
N/S
199
6.3 Chapter Discussion
Having confirmed the role of DEL1 in chondrocyte phenotype regulation, it was
necessary to investigate the proposed DEL1-integrin signalling pathway. Despite
inducing the expression of chondrocyte-specific genes in mesenchymal and
synovium-derived progenior cells (Park et al., 2005; Reinhold et al., 2005), BMP
signalling plays a key role in mouse chondrocytes maturation (Li et al., 2006).
Conversely, Twist has been shown to interfere with BMP2-induced gene and
cause the downregulation of aggrecan and type II collagen, thereby promoting
dedifferentiation (Reinhold et al., 2006).
The biosignificance of the simultaneous increase in DEL1 and SOX9 expression
in mesodifferentiated chondrocytes was investigated by biological stimulation of
SOX9 expression in P3 chondrocytes by supplementation with 500ng/ml BMP-2
(Minina et al., 2001) for 7 days in culture as previously described (Park et al.,
2005). An increase in SOX9 expression was obtained and was accompanied
with a 3-fold rise in DEL1 expression with both rises deemed similar to those
observed naturally in P1 chondrocytes. These observations confirmed our
hypothesis that DEL1 expression is mediated by SOX9 (Figure 6.6). Incubation
with BMP2 was, nevertheless, not sufficient to recapture a differentiated
phenotype but maintained a mesodifferentiated phenotype as defined by the
expression of collagens (col2:col1 expression).
Previous work has shown that members of Edil family of extracellular proteins
act by the activation of Akt signalling protein (Silvestre et al., 2005) and our data
confirmed a rise in Akt activity in P1 chondrocytes where DEL1 expression
levels were elevated. To further investigate the effect of DEL1 on Akt activity,
the latter was studied in response to DEL1 knockdown where it was shown that
200
knockdown reduced the activity of Akt by 46.12% (Figure 6.2). These data
indicated the necessity of DEL1 for an overactivation of Akt in P1 chondrocytes.
To investigate the potential signal initiated by DEL1, the expression levels of
Twist, a potential downstream element of the DEL1 signal, were assayed in
response to culture. A significant and sustained rise in Twist expression was
observed as early as 9 days post culture (P1 chondrocytes). Upon DEL1
knockdown, Twist expression was abolished (Figure 6.4) suggesting that the
rise in Twist expression is mediated by DEL1-intgerin signalling pathway.
It has been shown by others that Twist-induced dedifferentiation is tightly
regulated by β-catenin levels (Reinhold et al., 2006), which are in turn indirectly
positively influenced by Akt activity (Giles et al., 2003). Previous work has
shown that the accumilation of β-catenin caused dedifferentiation in rabbit
articular chondrocytes as characterised by a decrease in col2:col1 expression
(Hwang et al., 2005). The role of β-catenin signal on Twist expression was
therefore investigated using R-Etodolac, a pharmacological inhibitor of β-catenin
at 500µM (Behari et al., 2007), to knock down the levels of β-catenin. Similarly
to DEL1 knockdown, the reduction in β-catenin levels inhibited the expression of
Twist at the end of P1 (Figure 6.5) confirming the dependency of Twist
expression on β-catenin levels mediated by DEL1-induced Akt activation.
To further study the role of Twist on chondrocyte phenotype, siRNA sequences
designed to inhibit Twist expression were used and our data confirmed that the
sequences selected induced Twist knockdown with 75.92% reduction in
expression in P3 chondrocytes and possessed an effect lasting for up to 4 days
post transfection. RNA isolated from Twist(-)/P3 chondrocytes did not show a
recapture of phenotype as determined by the lack of change in the expression of
SOX9 or col2:col1 despite an increase in type II collagen expression as reported
elsewhere (Reinhold et al., 2006). Additionally, there was an increase in DEL1
expression in response to Twist knockdown, thus indicating that Twist did not
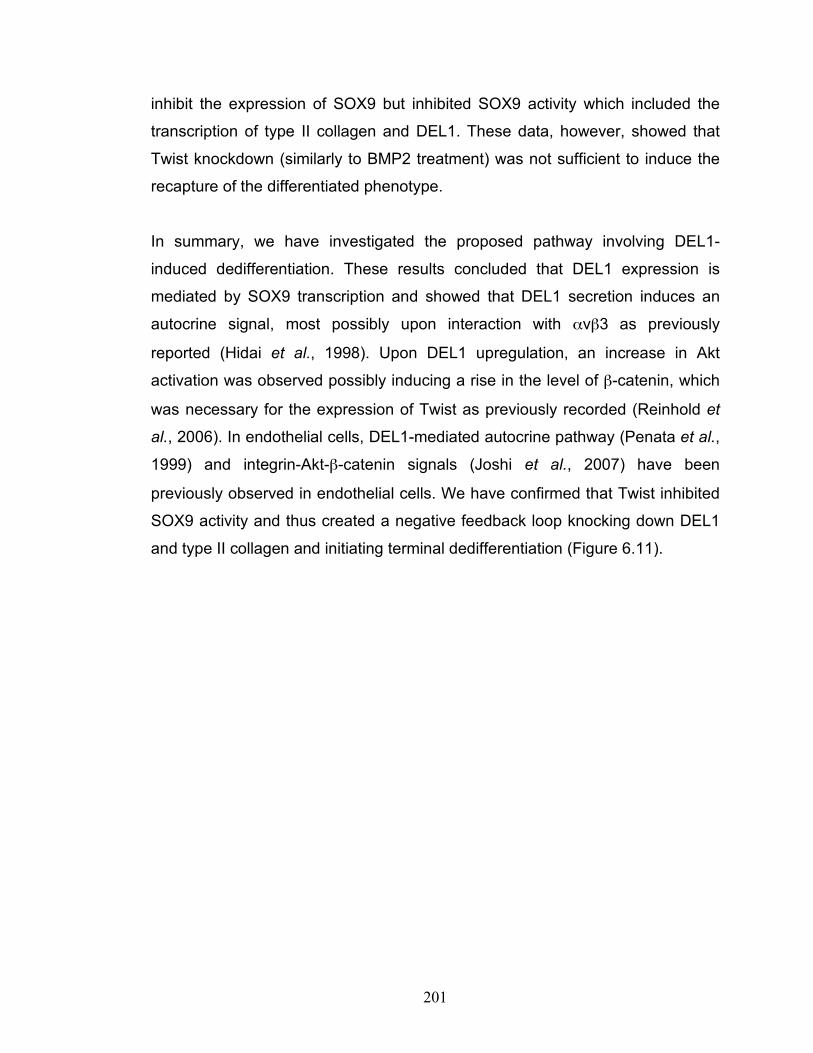
201
inhibit the expression of SOX9 but inhibited SOX9 activity which included the
transcription of type II collagen and DEL1. These data, however, showed that
Twist knockdown (similarly to BMP2 treatment) was not sufficient to induce the
recapture of the differentiated phenotype.
In summary, we have investigated the proposed pathway involving DEL1-
induced dedifferentiation. These results concluded that DEL1 expression is
mediated by SOX9 transcription and showed that DEL1 secretion induces an
autocrine signal, most possibly upon interaction with αvβ3 as previously
reported (Hidai et al., 1998). Upon DEL1 upregulation, an increase in Akt
activation was observed possibly inducing a rise in the level of β-catenin, which
was necessary for the expression of Twist as previously recorded (Reinhold et
al., 2006). In endothelial cells, DEL1-mediated autocrine pathway (Penata et al.,
1999) and integrin-Akt-β-catenin signals (Joshi et al., 2007) have been
previously observed in endothelial cells. We have confirmed that Twist inhibited
SOX9 activity and thus created a negative feedback loop knocking down DEL1
and type II collagen and initiating terminal dedifferentiation (Figure 6.11).
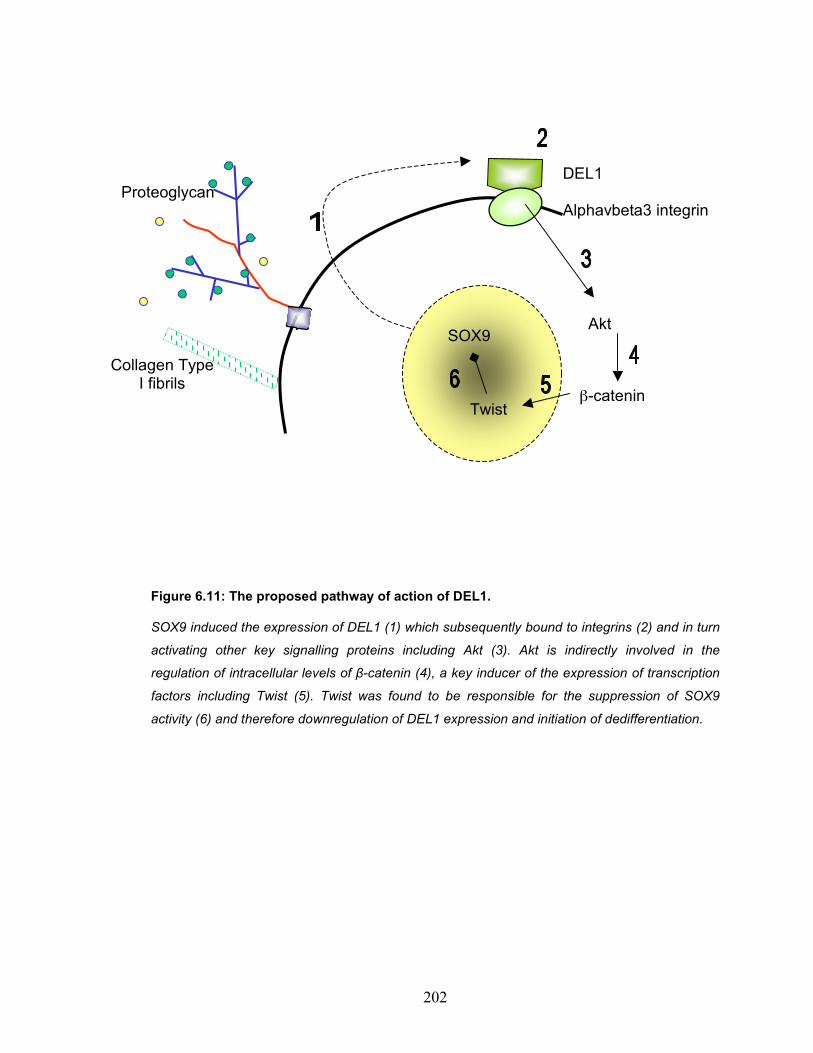
202
Figure 6.11: The proposed pathway of action of DEL1.
SOX9 induced the expression of DEL1 (1) which subsequently bound to integrins (2) and in turn
activating other key signalling proteins including Akt (3). Akt is indirectly involved in the
regulation of intracellular levels of β-catenin (4), a key inducer of the expression of transcription
factors including Twist (5). Twist was found to be responsible for the suppression of SOX9
activity (6) and therefore downregulation of DEL1 expression and initiation of dedifferentiation.
Collagen Type I fibrils
Proteoglycan DEL1 Alphavbeta3 integrin
Akt SOX9
β-catenin Twist

203
7 Discussion, Conclusion and Future Work
204
7.1 Quantification of changes in phenotypic markers in
response to 2D culture
Expansion and in vitro tissue engineering are novel promising techniques for
treatment of OA, are challenged by the ultimate loss of chondrocytic phenotype
in response to chondrocyte monolayer culture. We have aimed to further our
knowledge of the phenotypic changes occurring upon chondrocyte expansion,
with quantification when possible, of key differentiation markers including cell
shape and actin organisation, expression battery and mechanotransduction.
Prior to studying the effects of 2D culture, it was necessary to establish a
standard culture methodology to eliminate errors incurred by variation in length
of time in culture. Several culture densities in the literature were studied and cell
viability assayed (HD, MD and LD; Johansen et al., 2001; Hamilton et al., 2005a;
Hamilton et al., 2005b Stokes et al., 2002 Waymouth, 1974). Despite obtaining
higher levels of cell death in LD when compared to other culture densities, there
was a steady increase in cell number upon LD 2D culture, and time points for
subculture were determined at 9, 14 and 21 days post culture (termed P1, P2
and P3, respectively). Therefore, LD culture density was selected for cell culture
methodology performed (Table 3.2).
Some of the first and most obvious changes in phenotype include a switch in cell
morphology from ‘round’ to a ‘flat’ fibroblast-like shape. These changes were
further confirmed by studying the dimensions and sphericity factors of individual
chondrocytes at different culture intervals using CLSM. It was confirmed that a
loss of sphericity occurred as early as the 9th day in culture (P1) and was due to
an increase in cell length (c) and a reduction in cell depth (a). These changes
were also accompanied with an increase in chondrocyte cell volume which was
205
additionally confirmed by mathematical calculation from values obtained for
cellular dimensions (Table 3.3).
Furthermore, changes in the actin cytoskeleton were observed in response to
culture with a visually assessable increase in trans-cellular actin organisation in
the form of actin filaments. We devised a new method for the analysis of the
localisation and number of actin ‘striation units’ enabling us to quantify these
changes. There was a marked increase in the percentage of filamentous actin
seen as early as the first passage (Figure 3.8), and these changes were
confirmed by the increase of trans-cellular actin filaments (Figure 3.7). Similarly
to alterations in cell volume, sphericity and dimensions, no further reorganisation
of the actin cytoskeleton was observed in response to further culture.
On a molecular level, the loss of chondrocyte phenotype in response to 2D
culture was confirmed by studying changes in expression of key genes and a
switch from chondrocyte-specific type II collagen to type I (represented as
col2:col1). Firstly, the expression of DEL1 in bovine articular chondrocytes was
confirmed using RT-PCR and western blot and upon 9 days in culture, there was
an increase in DEL1 expression, only previously observed in hydrogel-cultured
foetal chondrocytes (Stokes et al., 2002). Moreover upon 9 days in culture, there
was a rise in type II collagen, type I collagen, differentiation transcription factor
SOX9, dedifferentiation transcription factor Twist and a decrease in col2:col1
expression, thereby indicating the loss of differentiated phenotype (Figure 3.9,
Figure 6.3). While changes in col2:col1 expression have been widely reported in
response to 2D culture (Benya & Shaffer, 1982b; Stokes et al., 2001), an
increase in type II collagen was not previously observed. Upon further culture,
however, there was no change in col2:col1 ratio, type I collagen or Twist but a
decline in the expression level of type II collagen, SOX9 and DEL1 was
recorded.
206
The effect of cellular expansion on mechanotransduction was also used as a
key marker of chondrocytic phenotype as previous work has shown that RVI and
Gd3+-sensitive rise in [Ca2+]i (in response to hypo-osmotic conditions) were
solely exhibited by 2D cultured chondrocytes (Kerrigan & Hall, 2008). We were
able to confirm that whereas freshly isolated chondrocytes did not exhibit RVI,
P1 2D cultured chondrocytes recovered cell volume in a linear fashion with a t½
of 9.60 minutes post challenge. Conversely, P2 and P3 chondrocytes exhibited
a logarithmic and thus ‘biphasic’ volume recovery pattern with robust RVI at t½ =
3.45 minutes and slow RVI similar to that observed in P1 chondrocytes (Table
4.1). Actin organisation has been shown to regulate the capacity of
chondrocytes to exhibit RVI, whereby treatment with LB (an actin deploymeris-
ing toxin) induced bumentanide-sensitive RVI in freshly isolated chondrocytes
(Kerrigan et al., 2006). Therefore, the activation of RVI mechanisms upon
culture, possibly via actin reorganisation and thus NKCC activation, may
contribute to the increase in cell volume discussed previously.
To investigate changes in mechanotransduction responses upon expansion, the
calcium responses of freshly isolated and 2D cultured chondrocytes were
studied using REV5901 as a pharmacological stimulus of [Ca2+]i rise. It was
observed that freshly isolated chondrocytes were more sensitive to REV5901
loading compared to 2D cultured chondrocytes (Figure 4.4) and the decrease in
sensitivity was confirmed to be due to a reduction in intracellular calcium store
release upon 2D culture. It was previously reported that mechanical pressure
not only induced a rise in [Ca2+]i (Guilak et al., 1999a), but also increased the
activity of IP3R channels on intracellular stores in 2D cultured chondrocytes
(Zhang et al., 2006), thus suggesting a reduction in store sensitivity upon
culture. Moreover, research has indicated that a rise in REV5901 provided
chondrocytes with protective mechanisms from the effects of pressure, possibly
via [Ca2+]i rise (Amin et al., 2008, Parker et al., in press). Taken together, these
data suggest that an increase in store sensitivity plays a crucial role in
differentiatied load-bearing chondrocyte which may be lost upon 2D culture.

207
As the contribution of transmembrane extracellular calcium influx in response to
REV5901 was not altered upon expansion, the participation of membrane
channels was assayed by incubation with channel inhibitors prior to REV5901
loading. Upon 2D culture, there was a decrease in inhibition of [Ca2+]i rise in the
absence of extracellular sodium and an increase in inhibition in the presence of
Gd3+ indicating a decrease in NCX activity and an increase in SACC activity
(Figure 4.5). Previous work has reported a decrease in NCX expression in
chondrocytes taken from OA tissue (Trujillo et al., 1999) suggesting that the loss
of apparent NCX contribution is possibly due to a similar down-regulation of
NCX upon 2D culture. Conversely, previous work has shown that inhibition of
SACC using Gd3+ inhibited hypo-osmotic challenge-induced [Ca2+]i rise in 2D
cultured but not freshly isolated chondrocytes (Kerrigan & Hall, 2008) and
induced a loss of phenotype in rat chondrosarcoma cell line (Perkins et al.,
2005) confirming our results that SACC activity is phenotype-dependent and/or
phenotype-regulatory.
These data demonstrated the existence of a third phenotype, termed
mesodifferentiated, previously unrecorded as defined by the RVI response in P1
chondrocytes and the expression battery (
Table 7.1).
7.2 The role of DEL1 in the regulation of chondrocyte
phenotype
208
As it has been shown that the expression of DEL1 was associated with the
upregulation of SOX9, the potential role of SOX9 on DEL1 expression was
investigated by biochemical induction of SOX9 using BMP2 (Minina et al., 2001).
There was an increase in SOX9 expression in response to BMP2 treatment and
that was associated with a rise in DEL1 expression, thus confirming that SOX9
is necessary for DEL1 expression. Moreover, there was an increase in type II
collagen expression confirming that observed changes are in response to SOX9
upregulation.
To further our understanding of the cause and effect relationship of DEL1 in
chondrocyte 2D culture, the expression level of DEL1 and col2:col1 was further
investigated within the first week of culture. There was a ∼10-fold increase in
DEL1 expression 2 days following 2D culture and the expression declined upon
further culture, whereas the decline in col2:col1 expression was initiated
following 4 days in culture (Figure 5.2). These data proposed a role for DEL1 in
the regulation of chondrocyte phenotype which was further investigated using
anti-DEL1 siRNA molecules to induce DEL1 knockdown in P1 chondrocytes.
Upon DEL1 knockdown, there was no increase in type I collagen expression in
response to 2D culture and thus no decline in col2:col1 ratio indicating the
preservation of a differentiated phenotype. Furthermore, DEL1 knockdown and
pharmacological inhibition of β-catenin induced the knockdown of Twist
expression suggesting that the expression of Twist is mediated by an integrin
signal involving DEL1 and relayed by β-catenin (Figure 6.2, Figure 6.5). It has
been therefore confirmed that β-catenin levels regulated the expression of Twist
in chondrocytes as previously investigated by others (Reinhold et al., 2006).
The effect of DEL1 on mechanotransduction responses was investigated upon
knockdown in P1 chondrocytes to confirm observations of phenotype
preservation in response to DEL1 knockdown. It has been shown that DEL1-
knockdown P1 chondrocytes did not exhibit slow RVI as observed in control
209
mock transfected P1 chondrocytes and this was possibly due to changes in actin
organisation in response to DEL1 knockdown. Furthermore, the effect of DEL1
on calcium channel activation was seen in the decrease in SACC contribution in
response to knockdown, rendering DEL1(-)/P1 similar to freshly isolated
chondrocytes in the regulation of calcium homeostasis (Table 5.3).
Due to the apparent effect of DEL1 on various phenotypic markers, the role of
DEL1 in initiating an integrin-mediated signal was investigated with Twist as the
final target. Being a downstream element of various integrin-ligand interactions
including EDIL3 ligand (Silvestre et al., 2005), Akt activity was studied in culture
and in response to DEL1 knockdown. It was observed that upregulation of DEL1
expression in P1 mesodifferentiated chondrocytes was associated with an
increase in Akt activity, which was abolished in response to DEL1 knockdown
(Figure 6.1, Figure 6.2).
Finally, Twist has been shown to inhibit BMP2-induced differentiation and thus
SOX9 function (Reinhold et al., 2006) and these findings were confirmed using
anti-Twist siRNA to inhibit the expression of Twist in P3 chondrocytes and assay
the expression of key genes. While Twist knockdown did not induce a significant
switch in col2:col1 expression, a sharp increase in the expression of DEL1 and
type II collagen, two product genes of SOX9 transcription, was observed. No
change, however, was observed in the level of SOX9 expression suggesting that
Twist inhibited SOX9 activity rather than expression. These findings thus
completed an autocrine feedback loop whereby DEL1-induced Akt activation, β-
catenin accumulation and consequently Twist expression which in turn inhibited
SOX9 expression and finalised the dedifferentiation process (Figure 6.11).
7.3 Summary and concluding remarks
210
In summary, we have reported the existence of a new (possibly homogenous)
chondrocyte population upon 9 days in culture with a phenotype previously
undefined (
Table 7.1). Mesodifferentiated chondrocytes are characterised by an elevation of
SOX9 and DEL1 expression, and a decrease in col2:col1 expression,
suggesting that dedifferentiation occurs in a multi-step process. Elevated levels
of DEL1 expression have been shown to induce a switch in phenotype via Akt &
β-catenin activation and Twist (an antagonist of SOX9) upregulation.
DEL1 knockdown induced an inhibition of a group of mesodifferentiated
mechanotransduction markers including slow RVI and elevated SACC activity
without significant effect on culture properties. Therefore these data suggested
that longterm DEL1 knockdown may be used in expansion to maintain
chondrocytic differentiated phenotype.
Chondrocyte expansion and matrix-induced autologous chondrocyte implant-
ation (MACI) are currently under research in an attempt to offer a ‘cure’ for
osteoarthritis, but due to difficulties in clinical testing, there has been relatively
slow progress in the innovation of commercial technologies. The technique
involves 2D culture of mature chondrocytes or mesenchymal stem cells (MSC)
from a patient prior to introduction into a 3D scaffold, and is currently limited in
potential due to several hurdles.
Firstly, neither 2D cultured adult chondrocytes nor MSCs exhibit suitable
phenotypes. Whilst adult chondrocytes lose their differentiated phenotype upon
culture, MSC’s have shown inclination to differentiation into fibrocartilage or scar
tissue rather than hyaline cartilage for reasons yet to be elucidated. One of the
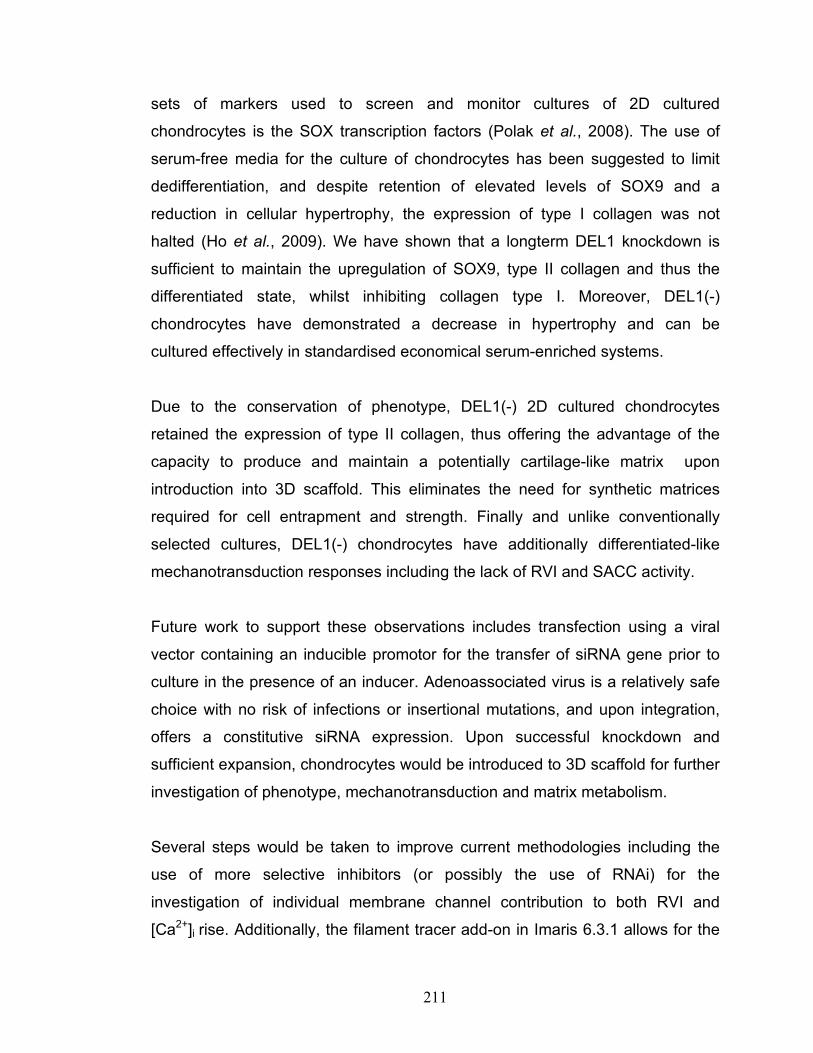
211
sets of markers used to screen and monitor cultures of 2D cultured
chondrocytes is the SOX transcription factors (Polak et al., 2008). The use of
serum-free media for the culture of chondrocytes has been suggested to limit
dedifferentiation, and despite retention of elevated levels of SOX9 and a
reduction in cellular hypertrophy, the expression of type I collagen was not
halted (Ho et al., 2009). We have shown that a longterm DEL1 knockdown is
sufficient to maintain the upregulation of SOX9, type II collagen and thus the
differentiated state, whilst inhibiting collagen type I. Moreover, DEL1(-)
chondrocytes have demonstrated a decrease in hypertrophy and can be
cultured effectively in standardised economical serum-enriched systems.
Due to the conservation of phenotype, DEL1(-) 2D cultured chondrocytes
retained the expression of type II collagen, thus offering the advantage of the
capacity to produce and maintain a potentially cartilage-like matrix upon
introduction into 3D scaffold. This eliminates the need for synthetic matrices
required for cell entrapment and strength. Finally and unlike conventionally
selected cultures, DEL1(-) chondrocytes have additionally differentiated-like
mechanotransduction responses including the lack of RVI and SACC activity.
Future work to support these observations includes transfection using a viral
vector containing an inducible promotor for the transfer of siRNA gene prior to
culture in the presence of an inducer. Adenoassociated virus is a relatively safe
choice with no risk of infections or insertional mutations, and upon integration,
offers a constitutive siRNA expression. Upon successful knockdown and
sufficient expansion, chondrocytes would be introduced to 3D scaffold for further
investigation of phenotype, mechanotransduction and matrix metabolism.
Several steps would be taken to improve current methodologies including the
use of more selective inhibitors (or possibly the use of RNAi) for the
investigation of individual membrane channel contribution to both RVI and
[Ca2+]i rise. Additionally, the filament tracer add-on in Imaris 6.3.1 allows for the

212
creation of filamentous structures and calculates the number of branch points,
thereby providing more sophisticated data with improved accuracy for the
estimation of actin reorganisation (Figure 7.1).

213
Table 7.1: Summary of the properties of differentiated, mesodifferentiated and dedifferentiated chondrocytes as defined using key markers of phenotype.
Marker Differentiated Mesodifferentiated Dedifferentiated
DEL1 Low High Low
sox9 Intermediate High Low
col I Low High High
col II Intermediate High Low
col2:col1 High Low Low
Twist Low High High
Volume Low High High
a High Low Low
c Low High High
ϕ High Low Low
StU Low High High
Intracellular store release High Low Low
NCX High Low Low
SACC Low High High
attachment rate Low High Low
Akt activity Low High Low
RVI None Slow Biphasic
214
Figure 7.1: New Analysis tool for the study of filamentous actin organisation.
Confocal images of a P3 2D cultured chondrocyte stained for actin with phalloidin-alexa 488 was
chosen at random for representative purposes, deconvolved and reassembled in Imaris 6.31
(PanelA; Bitplane). The filament tracer add-on was used with default settings to produce
filamentous structures (Panel B; red) and an isosurface object was added for the same channel
(green) for illustration. Imaris filament tracer can be used to record various parameters including
the number of branch points, number of filaments and length of filaments, and can therefore be
used for future actin analysis.
A B

215
8 References and bibliography
216
Adams JC & Watt FM. (1991). Expression of beta 1, beta 3, beta 4, and beta 5
integrins by human epidermal keratinocytes and non-differentiating
keratinocytes. The Journal of cell biology 115, 829-841.
Aigner T, Dietz U, Stoss H & von der Mark K. (1995). Differential expression of
collagen types I, II, III, and X in human osteophytes. Lab Invest 73, 236-
243.
Aigner T & McKenna L. (2002). Molecular pathology and pathobiology of
osteoarthritic cartilage. Cell Mol Life Sci 59, 5-18.
Alvarez J, Balbin M, Fernandez M & Lopez JM. (2001). Collagen metabolism is
markedly altered in the hypertrophic cartilage of growth plates from rats
with growth impairment secondary to chronic renal failure. J Bone Miner
Res 16, 511-524.
Ali N, Getting S & Kerrigan MJP. (2008). The effect of hypotonicity on
chondrocyte volume regulation and intracellular calcium signalling.
Proceedings of the British Pharmacological Society. Vol 6, Issue 2.
Ana M. Schor IE, Seth L. Schor. (2001). Chemotaxis and Chemokinesis in 3D
Macromolecular Matrices: Relevance to Angiogenesis, vol. 46. Springer.
Anderson JJ & Felson DT. (1988). Factors associated with osteoarthritis of the
knee in the first national Health and Nutrition Examination Survey
(HANES I). Evidence for an association with overweight, race, and
physical demands of work. Am J Epidemiol 128, 179-189.
217
Aoka Y, Johnson FL, Penta K, Hirata Ki K, Hidai C, Schatzman R, Varner JA &
Quertermous T. (2002). The embryonic angiogenic factor DEL1
accelerates tumor growth by enhancing vascular formation. Microvascular
research 64, 148-161.
Arakawa A, Matsuo-Takasaki M, Takai A, Inomata H, Matsumura M, Ikeya M,
Takahashi K, Miyachi Y, Sasai N & Sasai Y. (2007). The secreted EGF-
Discoidin factor xDEL1 is essential fr dorsal development of Xenopus
embryo. Dev Biol, 306, 160-9.
Archer CW & Francis-West P. (2003). The chondrocyte. Int J Biochem Cell Biol
35, 401-404.
Aszodi A, Hunziker EB, Brakebusch C & Fassler R. (2003). Beta1 integrins
regulate chondrocyte rotation, G1 progression, and cytokinesis. Genes
Dev 17, 2465-2479.
Baici A, Lang A, Horler D & Knopfel M. (1988a). Cathepsin B as a marker of the
dedifferentiated chondrocyte phenotype. Ann Rheum Dis 47, 684-691.
Baici A, Lang A, Horler D & M. K. (1988b). Cathepsin B as a marker of the
dedifferentiated chondrocyte phenotype. Ann Rheum Dis 47, 684-691.
Ballock RT, Heydemann A, Wakefield LM, Flanders KC, Roberts AB & Sporn
MB. (1993). TGF-beta 1 prevents hypertrophy of epiphyseal
chondrocytes: regulation of gene expression for cartilage matrix proteins
and metalloproteases. Developmental biology 158, 414-429.
Ballock RT & O'Keefe RJ. (2003). The biology of the growth plate. J Bone Joint
Surg Am 85-A, 715-726.

218
Beekman B, Verzijl N, Bank RA, von der Mark K & TeKoppele JM. (1997).
Synthesis of collagen by bovine chondrocytes cultured in alginate;
Posttranslational modifications and cell-matrix interaction. Exp Cell Res
237, 135-141.
Behari J, Zeng G, Otruba W, Thompson MD, Muller P, Micsenyi A, Sekhon SS,
Leoni L & Monga SP. (2007). R-R-Etodolac decreases beta-catenin
levels along with survival and proliferation of hepatoma cells. J Hepatol
46, 849-857.
Bengtsson T, Aszodi A, Nicolae C, Hunziker EB, Lundgren-Akerlund E & Fassler
R. (2005). Loss of alpha10beta1 integrin expression leads to moderate
dysfunction of growth plate chondrocytes. J Cell Sci 118, 929-936.
Benya PD. (1988). Modulation and reexpression of the chondrocyte phenotype;
mediation by cell shape and microfilament modification. Pathol
Immunopathol Res 7, 51-54.
Benya PD, Brown PD & Padilla SR. (1988). Microfilament modification by
dihydrocytochalasin B causes retinoic acid-modulated chondrocytes to
reexpress the differentiated collagen phenotype without a change in
shape. J Cell Biol 106, 161-170.
Benya PD & Shaffer JD. (1982a). Dedifferentiated Chondrocytes Reexpress the
Differentiated Collagen Phenotype When Cultured in Agarose Gels. Cell
30, 215-224.
Benya PD & Shaffer JD. (1982b). Dedifferentiated chondrocytes reexpress the
differentiated collagen phenotype when cultured in agarose gels. Cell 30, 215-224.

219
Benya PD, Shaffer JD & Nimni ME. (1981). Flexibility of the Chondrocyte
Collagen Phenotype. Semin Arthritis Rheum 11, 44-45.
Benz K, Breit S, Lukoschek M, Mau H & Richter W. (2002a). Molecular analysis
of expansion, differentiation, and growth factor treatment of human
chondrocytes identifies differentiation markers and growth-related genes.
Biochem Biophys Res Commun 293, 284-292.
Benz K, Breit S, Lukoschek M, Mau H & Richter W. (2002b). Molecular analysis
of expansion, differentiation, and growth factor treatment of human
chondrocytes identifies differentiation markers and growth-related genes.
Biochem Biophys Res Commun 293, 284-292.
Berra-Romani R, Mazzocco-Spezzia A, Pulina MV & Golovina VA. (2008). Ca2+
handling is altered when arterial myocytes progress from a contractile to
a proliferative phenotype in culture. Am J Physiol Cell Physiol, 295, C779-
90.
Bialek P, Kern B, Yang X, Schrock M, Sosic D, Hong N, Wu H, Yu K, Ornitz DM,
Olson EN, Justice MJ & Karsenty G. (2004). A twist code determines the
onset of osteoblast differentiation. Dev Cell 6, 423-435.
Blain EJ, Gilbert SJ, Hayes AJ & Duance VC. (2006). Disassembly of the
vimentin cytoskeleton disrupts articular cartilage chondrocyte
homeostasis. Matrix Biol 25, 398-408.
Bohme K, Winterhalter KH & Bruckner P. (1995). Terminal differentiation of
chondrocytes in culture is a spontaneous process and is arrested by
transforming growth factor-beta 2 and basic fibroblast growth factor in
synergy. Exp Cell Res 216, 191-198.

220
Boland S, Boisview-Ulrich E, Houcine O, Baeza-Squiban A, Pouchelet M,
Schoevaert D & Marano F. (1996). TGF beta 1 promotes actin
cytoskeleton reorganisation and migratory phenotype in epithelial tracheal
cells in primary culture. J Cell Sci., 109, 2207-19.
Bridge AJ, Pebernard S, Ducraux A, Nicoulaz AL & Iggo R. (2003). Induction of
an interferon response by RNAi vectors in mammalian cells. Nat Genet
34, 263-264.
Broom ND & Myers DB. (1980). A study of the structural response of wet hyaline
cartilage to various loading situations. Connect Tissue Res 7, 227-237.
Brown PD & Benya PD. (1988). Alterations in chondrocyte cytoskeletal
architecture during phenotypic modulation by retinoic acid and
dihydrocytochalasin B-induced reexpression. J Cell Biol 106, 171-179.
Buckwalter JA & Mankin HJ. (1998). Articular cartilage: tissue design and
chondrocyte-matrix interactions. Instr Course Lect 47, 477-486.
Buckwalter JA, Mower D, Ungar R, Schaeffer J & Ginsberg B. (1986).
Morphometric analysis of chondrocyte hypertrophy. J Bone Joint Surg Am
68, 243-255.
Bulstrode CB, J; Carr, A.; Marsh, L.; Fairbank, J.; Wilson-MacDonald, J.;
Bowden, G. (2002). Oxford Textbook of Orthopaedics and
Trauma. Oxford University Press.
Burton-Wurster N, Vernier-Singer M, Farquhar T & Lust G. (1993). Effect of
compressive loading and unloading on the synthesis of total protein,
proteoglycan, and fibronectin by canine cartilage explants. J Orthop Res
11, 717-729.
221
Buschmann MD, Hunziker EB, Kim YJ & Grodzinsky AJ. (1996). Altered
aggrecan synthesis correlates with cell and nucleus structure in statically
compressed cartilage. J Cell Sci 109 ( Pt 2), 499-508.
Bush PG & Hall AC. (2001a). Regulatory volume decrease (RVD) by isolated
and in situ bovine articular chondrocytes. J Cell Physiol 187, 304-314.
Bush PG & Hall AC. (2001b). The osmotic sensitivity of isolated and in situ
bovine articular chondrocytes. J Orthop Res 19, 768-778.
Bush PG & Hall AC. (2003). The volume and morphology of chondrocytes within
non-degenerate and degenerate human articular cartilage. Osteoarthritis
Cartilage 11, 242-251.
Bush PG & Hall AC. (2005). Passive osmotic properties of in situ human
articular chondrocytes within non-degenerate and degenerate cartilage. J
Cell Physiol 204, 309-319.
Byers PD, Maroudase A, Oztop F, Stockwell RA & Venn MF. (1977).
Histological and biochemical studies on cartilage from osteoarthrotic
femoral heads with special reference to surface characteristics. Connect
Tissue Res 5, 41-49.
Chen G, Sato T, Ushida T, Hirochika R & Tateishi T. (2003). Redifferentiation of
dedifferentiated bovine chondrocytes when cultured in vitro in a PLGA-
collagen hybrid mesh. FEBS Lett 542, 95-99.
Chen Q, Lin TH, Der CJ & Juliano RL. (1996). Integrin-mediated activation of
MEK and mitogen-activated protein kinase is independent of Ras
[corrected]. J Biol Chem 271, 18122-18127.
222
Chen Z, Ding Y & Zhang H. (2002). Morphology, viability and functions of
suckling pig hepatocytes cultured in serum-free medium at high density.
Dig Surg, 19, 184-91.
Chen ZF & Behringer RR. (1995). twist is required in head mesenchyme for
cranial neural tube morphogenesis. Genes Dev 9, 686-699.
Cheng C, Conte E, Pleshko-Camacho N & Hidaka C. (2007). Differences in
matrix accumulation and hypertrophy in superficial and deep zone
chondrocytes are controlled by bone morphogenetic protein. Matrix Biol
26, 541-553.
Chong LD, Traynor-Kaplan A, Bokoch GM & Schwartz MA. (1994). The small
GTP-binding protein Rho regulates a phosphatidylinositol 4-phosphate 5-
kinase in mammalian cells. Cell 79, 507-513.
Clancy RM, Rediske J, Tang X, Nijher N, Frenkel S, Philips M & Abramson SB.
(1997). Outside-in signaling in the chondrocyte. Nitric oxide disrupts
fibronectin-induced assembly of a subplasmalemmal actin/rho A/focal
adhesion kinase signaling complex. The Journal of clinical investigation
100, 1789-1796.
Cullen BR. (2005). Does RNA interference have a future as a treatment for HIV-
1 induced disease? AIDS Rev 7, 22-25.
Darling EM & Athanasiou KA. (2005). Rapid phenotypic changes in passaged
articular chondrocyte subpopulations. J Orthop Res 23, 425-432.

223
Dascalu A, Korenstein R, Oron Y & Nevo Z. (1996). A hyperosmotic stimulus
regulates intracellular pH, calcium, and S-100 protein levels in avian
chondrocytes. Biochem Biophys Res Commun 227, 368-373.
de Crombrugghe B, Lefebvre V, Behringer RR, Bi W, Murakami S & Huang W.
(2000). Transcriptional mechanisms of chondrocyte differentiation. Matrix
Biol 19, 389-394.
De Luca F, Barnes KM, Uyeda JA, De-Levi S, Abad V, Palese T, Mericq V &
Baron J. (2001). Regulation of growth plate chondrogenesis by bone
morphogenetic protein-2. Endocrinology 142, 430-436.
Dedhar S & Gray V. (1990). Isolation of a novel integrin receptor mediating Arg-
Gly-Asp-directed cell adhesion to fibronectin and type I collagen from
human neuroblastoma cells. Association of a novel beta 1-related subunit
with alpha v. J Cell Biol 110, 2185-2193.
DeLise AM, Fischer L & Tuan RS. (2000). Cellular interactions and signaling in
cartilage development. Osteoarthritis Cartilage 8, 309-334.
Denli AM & Hannon GJ. (2003). RNAi: an ever-growing puzzle. Trends Biochem
Sci 28, 196-201.
Diaz-Romero J, Gaillard JP, Grogan SP, Nesic D, Trub T & Mainil-Varlet P.
(2005). Immunophenotypic analysis of human articular chondrocytes:
changes in surface markers associated with cell expansion in monolayer
culture. J Cell Physiol 202, 731-742.
Dong YF, Soung do Y, Chang Y, Enomoto-Iwamoto M, Paris M, O'Keefe RJ,
Schwarz EM & Drissi H. (2007). Transforming growth factor-beta and Wnt
224
signals regulate chondrocyte differentiation through Twist1 in a stage-
specific manner. Mol Endocrinol 21, 2805-2820.
Dreja K, Nordstrom I & Hellstrand P. (2001). Rat arterial smooth muscle devoid
of ryanodine recepto function: effect on cellular ca(2+) handling. Br J
Pharmacol, 132, 1957-66.
Drissi H, Zuscik M, Rosier R & O'Keefe R. (2005). Transcriptional regulation of
chondrocyte maturation: potential involvement of transcription factors in
OA pathogenesis. Molecular aspects of medicine 26, 169-179.
Dupont J, Fernandez AM, Glackin CA, Helman L & LeRoith D. (2001). Insulin-
like growth factor 1 (IGF-1)-induced twist expression is involved in the
anti-apoptotic effects of the IGF-1 receptor. J Biol Chem 276, 26699-
26707.
Durr J, Goodman S, Potocnik A, von der Mark H & von der Mark K. (1993).
Localization of beta 1-integrins in human cartilage and their role in
chondrocyte adhesion to collagen and fibronectin. Exp Cell Res 207, 235-
244.
Durrant LA, Archer CW, Benjamin M & Ralphs JR. (1999). Organisation of the
chondrocyte cytoskeleton and its response to changing mechanical
conditions in organ culture. J Anat 194 ( Pt 3), 343-353.
Edlich M, Yellowley CE, Jacobs CR & Donahue HJ. (2001). Oscillating fluid flow
regulates cytosolic calcium concentration in bovine articular
chondrocytes. J Biomech 34, 59-65.
225
Elbashir SM, Harborth J, Lendeckel W, Yalcin A, Weber K & Tuschl T. (2001a).
Duplexes of 21-nucleotide RNAs mediate RNA interference in cultured
mammalian cells. Nature 411, 494-498.
Elbashir SM, Lendeckel W & Tuschl T. (2001b). RNA interference is mediated
by 21- and 22-nucleotide RNAs. Genes & development 15, 188-200.
Elbashir SM, Martinez J, Patkaniowska A, Lendeckel W & Tuschl T. (2001c).
Functional anatomy of siRNAs for mediating efficient RNAi in Drosophila
melanogaster embryo lysate. Embo J 20, 6877-6888.
Enomoto MI, Boettiger D & Menko AS. (1993). Alpha 5 integrin is a critical
component of adhesion plaques in myogenesis. Developmental biology
155, 180-197.
Enomoto-Iwamoto M, Iwamoto M, Nakashima K, Mukudai Y, Boettiger D,
Pacifici M, Kurisu K & Suzuki F. (1997). Involvement of alpha5beta1
integrin in matrix interactions and proliferation of chondrocytes. J Bone
Miner Res 12, 1124-1132.
Eyre DR, Wu JJ, Fernandes RJ, Pietka TA & Weis MA. (2002). Recent
developments in cartilage research: matrix biology of the collagen II/IX/XI
heterofibril network. Biochem Soc Trans 30, 893-899.
Fernandes JC, Martel-Pelletier J & Pelletier JP. (2002). The role of cytokines in
osteoarthritis pathophysiology. Biorheology 39, 237-246.
Fioravanti A, Nerucci F, Annefeld M, Collodel G & Marcolongo R. (2003).
Morphological and cytoskeletal aspects of cultivated normal and
osteoarthritic human articular chondrocytes after cyclical pressure: a pilot
study. Clin Exp Rheumatol 21, 739-746.

226
Freshney RI. (2001). Culture of Animal Cells - A manual of Basic Technique.
Wiley-Liss, New York.
Frondoza C, Sohrabi A & Hungerford D. (1996). Human chondrocytes proliferate
and produce matrix components in microcarrier suspension culture.
Biomaterials 17, 879-888.
Gandhi CS, Loots E & Isacoff EY. (2000). Reconstructing voltage sensor-pore
interaction from a fluorescence scan of a voltage-gated K+ channel.
Neuron 27, 585-595.
Garciadiego-Cazares D, Rosales C, Katoh M & Chimal-Monroy J. (2004).
Coordination of chondrocyte differentiation and joint formation by
alpha5beta1 integrin in the developing appendicular skeleton.
Development 131, 4735-4742.
Gavenis K, Schumacher C, Schneider U, Eisfeld J, Mollenhauer J & Schmidt-
Rohlfing B. (2009). Expression of ion channels of the TRP family in
articular chondrocytes from osteoarthritic patients: changes between
native and in vitro propagated chondrocytes. Mol Cell Biochem 321, 135-
143.
Gebhard PM, Gehrsitz A, Bau B, Soder S, Eger W & Aigner T. (2003).
Quantification of expression levels of cellular differentiation markers does
not support a general shift in the cellular phenotype of osteoarthritic
chondrocytes. J Orthop Res 21, 96-101.
Giannoni P, Pagano A, Maggi E, Arbico R, Randazzo N, Grandizio M, Cancedda
R & Dozin B. (2005). Autologous chondrocyte implantation (ACI) for aged
227
patients: development of the proper cell expansion conditions for possible
therapeutic applications. Osteoarthritis Cartilage 13, 589-600.
Giles RH, van Es JH & Clevers H. (2003). Caught up in a Wnt storm: Wnt
signaling in cancer. Biochim Biophys Acta 1653, 1-24.
Gilmore AP & Burridge K. (1996). Molecular mechanisms for focal adhesion
assembly through regulation of protein-protein interactions. Structure 4, 647-651.
Goley ED & Welch MD. (2006). The ARP2/3 complex: an actin nucleator comes
of age. Nat Rev Mol Cell Biol 7, 713-726.
Gray H. (2000). Anatomy of the Human Body. BARTLEBY.COM, New York.
Grimsrud CD, Romano PR, D'Souza M, Puzas JE, Schwarz EM, Reynolds PR,
Roiser RN & O'Keefe RJ. (2001). BMP signaling stimulates chondrocyte
maturation and the expression of Indian hedgehog. J Orthop Res 19, 18-
25.
Gschwendt M, Muller HJ, Kielbassa K, Zang R, Kittstein W, Rincke G & Marks
F. (1994). Rottlerin, a novel protein kinase inhibitor. Biochem Biophys
Res Commun 199, 93-98.
Guilak F. (1995). Compression-induced changes in the shape and volume of the
chondrocyte nucleus. J Biomech 28, 1529-1541.
Guilak F, Erickson GR & Ting-Beall HP. (2002). The effects of osmotic stress on
the viscoelastic and physical properties of articular chondrocytes. Biophys
J 82, 720-727.
228
Guilak F, Jones WR, Ting-Beall HP & Lee GM. (1999a). The deformation
behavior and mechanical properties of chondrocytes in articular cartilage.
Osteoarthritis Cartilage 7, 59-70.
Guilak F, Meyer BC, Ratcliffe A & Mow VC. (1994). The effects of matrix
compression on proteoglycan metabolism in articular cartilage explants.
Osteoarthritis Cartilage 2, 91-101.
Guilak F, Zell RA, Erickson GR, Grande DA, Rubin CT, McLeod KJ & Donahue
HJ. (1999b). Mechanically induced calcium waves in articular
chondrocytes are inhibited by gadolinium and amiloride. J Orthop Res 17, 421-429.
Gunthorpe MJ, Benham CD, Randall A & Davis JB. (2002). The diversity in the
vanilloid (TRPV) receptor family of ion channels. Trends Pharmacol Sci
23, 183-191.
Guo JF, Jourdian GW & MacCallum DK. (1989). Culture and growth
characteristics of chondrocytes encapsulated in alginate beads. Connect
Tissue Res 19, 277-297.
Haag J, Gebhard PM & Aigner T. (2008). SOX gene expression in human
osteoarthritic cartilage. Pathobiology 75, 195-199.
Haisch A, Marzahn U, Mobasheri A, Schulze-Tanzil G & Shakibaei M. (2006).
Development and phenotypic characterization of a high density in vitro
model of auricular chondrocytes with applications in reconstructive plastic
surgery. Histol Histopathol 21, 467-476.
Hall AC. (1998a). Physiology of Cartilage. W. B. Saunders.
229
Hall AC, ed. (1998b). Physiology of Cartilage. W.B. Saunders, London.
Hall AC & Bush PG. (2001). The role of a swelling-activated taurine transport
pathway in the regulation of articular chondrocyte volume. Pflugers Arch
442, 771-781.
Hall AC, Starks I, Shoults CL & Rashidbigi S. (1996). Pathways for K+ transport
across the bovine articular chondrocyte membrane and their sensitivity to
cell volume. The American journal of physiology 270, C1300-1310.
Hall BK & Miyake T. (1992). The membranous skeleton: the role of cell
condensations in vertebrate skeletogenesis. Anat Embryol (Berl) 186, 107-124.
Hamamori Y, Sartorelli V, Ogryzko V, Puri PL, Wu HY, Wang JY, Nakatani Y &
Kedes L. (1999). Regulation of histone acetyltransferases p300 and
PCAF by the bHLH protein twist and adenoviral oncoprotein E1A. Cell 96, 405-413.
Hamilton DW, Riehle MO, Monaghan W & Curtis AS. (2005a). Articular
chondrocyte passage number: influence on adhesion, migration,
cytoskeletal organisation and phenotype in response to nano- and micro-
metric topography. Cell biology international 29, 408-421.
Hamilton DW, Riehle MO, Rappuoli R, Monaghan W, Barbucci R & Curtis AS.
(2005b). The response of primary articular chondrocytes to micrometric
surface topography and sulphated hyaluronic acid-based matrices. Cell
biology international 29, 605-615.
230
Hanayama R, Tanaka M, Miwa K & Nagata S. (2004). Expression of
developmental endothelial locus-1 in a subset of macrophages for
engulfment of apoptotic cells. J immunol, 172, 3876-82.
Harmand MF, Thomasset M, Rouais F & Ducassou D. (1984). In vitro
stimulation of articular chondrocyte differentiated function by 1,25-
dihydroxycholecalciferol or 24R,25-dihydroxycholecalciferol. J Cell
Physiol 119, 359-365.
Hartwig JH, Bokoch GM, Carpenter CL, Janmey PA, Taylor LA, Toker A &
Stossel TP. (1995). Thrombin receptor ligation and activated Rac uncap
actin filament barbed ends through phosphoinositide synthesis in
permeabilized human platelets. Cell 82, 643-653.
Hattori T, Coustry F, Stephens S, Eberspaecher H, Takigawa M, Yasuda H & de
Crombrugghe B. (2008). Transcriptional regulation of chondrogenesis by
coactivator Tip60 via chromatin association with Sox9 and Sox5. Nucleic
Acids Res 36, 3011-3024.
Hauselmann HJ, Fernandes RJ, Mok SS, Schmid TM, Block JA, Aydelotte MB,
Kuettner KE & Thonar EJ. (1994). Phenotypic stability of bovine articular
chondrocytes after long-term culture in alginate beads. J Cell Sci 107 ( Pt 1), 17-27.
Hauselmann HJ, Masuda K, Hunziker EB, Neidhart M, Mok SS, Michel BA &
Thonar EJ. (1996). Adult human chondrocytes cultured in alginate form a
matrix similar to native human articular cartilage. Am J Physiol 271, C742-752.
Hayes AJ, Benjamin M & Ralphs JR. (2001). Extracellular matrix in development
of the intervertebral disc. Matrix Biol 20, 107-121.
231
Hemler ME. (1990). VLA proteins in the integrin family: structures, functions, and
their role on leukocytes. Annu Rev Immunol 8, 365-400.
Heyland J, Wiegandt K, Goepfert C, Nagel-Heyer S, Illinich E, Schmacher U &
Portner R. (2006). Redifferentiation of chondrocytes and cartilage
formation under intermittent hydrostatic pressure. Biotechnol Lett, 28,
1641-8.
Hidai C, Zupancic T, Penta K, Mikhail A, Kawana M, Quertermous EE, Aoka Y,
Fukagawa M, Matsui Y, Platika D, Auerbach R, Hogan BL, Snodgrass R
& Quertermous T. (1998). Cloning and characterization of developmental
endothelial locus-1: an embryonic endothelial cell protein that binds the
alphavbeta3 integrin receptor. Genes Dev 12, 21-33.
Hirsch MS, Lunsford LE, Trinkaus-Randall V & Svoboda KK. (1997).
Chondrocyte survival and differentiation in situ are integrin mediated. Dev
Dyn 210, 249-263.
Ho HK, Jang JJ, Kaji S, Spektor G, Fong A, Yang P, Hu BS, Schatzman R,
Quertermous T & Cooke JP. (2004). Developmental endothelial locus-1
(Del-1), a novel angiogenic protein: its role in ischemia. Circulation 109, 1314-1319.
Ho STB, Yang Z, Hui HPJ, Oh KESO, Choo BHA & Lee EH. (2009). A serum
free approach towards the conservation of chondrogenic phenotype
during in vitro cell expansion. Growth Factors 27, 321-333.
Hodge WA, Fijan, R. S., Carlson, K. L., Burgess, R. G., Harris W. H. and Mann,
R.W. (1986). Contact Pressures in the human hip joint measured in vivo.
Proc Natl Acad Sci U S A 83, 2879-2883.
232
Hoffmann EK, Schettino T & Marshall WS. (2007). The role of volume-sensitive
ion transport systems in regulation of epithelial transport. Comparative
biochemistry and physiology 148, 29-43.
Holmes MW, Bayliss MT & Muir H. (1988). Hyaluronic acid in human articular
cartilage. Age-related changes in content and size. The Biochemical
journal 250, 435-441.
Hopewell B & Urban JP. (2003). Adaptation of articular chondrocytes to changes
in osmolality. Biorheology 40, 73-77.
Horton W & Hassell JR. (1986). Independence of cell shape and loss of cartilage
matrix production during retinoic acid treatment of cultured chondrocytes.
Dev Biol 115, 392-397.
Horton WE, Jr., Balakir R, Precht P & Liang CT. (1991). 1,25-Dihydroxyvitamin
D3 down-regulates aggrecan proteoglycan expression in immortalized rat
chondrocytes through a post-transcriptional mechanism. J Biol Chem
266, 24804-24808.
Horwitz ER, Higgins TM & Harvey BJ. (1996). Histamine-induced cytosolic
calcium increase in porcine articular chondrocytes. Biochim Biophys Acta
1313, 95-100.
Hotchin NA & Hall A. (1995). The assembly of integrin adhesion complexes
requires both extracellular matrix and intracellular rho/rac GTPases. J
Cell Biol 131, 1857-1865.
Hou C, Kirchner T, Singer M, Matheis M, Argentieri D & Cavender D. (2004). In
vivo activity of a phospholipase C inhibitor, 1-(6-((17beta-3-methoxyestra-
233
1,3,5(10)-trien-17-yl)amino)hexyl)-1H-pyrrole -2,5-dione (U73122), in
acute and chronic inflammatory reactions. J Pharmacol Exp Ther 309, 697-704.
Hsu GP, Mathy JA, Wang Z, Xia W, Sakamoto G, Kundu R, Longaker MT,
Quertermous T & Yang GP. (2008). Increased rate of hair regrowth in
mice with constitutive overexpression of DEL1. J Surg Res, 146, 73-80.
Hughes SaM, I., ed. (1997). Sciences Basic to Orthopaedics. Saunders, Oxford.
Huh YH, Kim SH, Kim SJ & Chun JS. (2003). Differentiation status-dependent
regulation of cyclooxygenase-2 expression and prostaglandin E2
production by epidermal growth factor via mitogen-activated protein
kinase in articular chondrocytes. J Biol Chem 278, 9691-9697.
Hwang SG, Yu SS, Lee SW & Chun JS. (2005). Wnt-3a regulates chondrocyte
differentiation via c-Jun/AP-1 pathway. FEBS Lett, 21, 4837-42.
Hynes RO. (1992). Integrins: versatility, modulation, and signaling in cell
adhesion. Cell 69, 11-25.
Iannotti JP, Brighton CT, Iannotti V & Ohishi T. (1990). Mechanism of action of
parathyroid hormone-induced proteoglycan synthesis in the growth plate
chondrocyte. J Orthop Res 8, 136-145.
Idowu BD, Knight MM, Bader DL & Lee DA. (2000). Confocal analysis of
cytoskeletal organisation within isolated chondrocyte sub-populations
cultured in agarose. Histochem J 32, 165-174.
Ikebe T, Hirata M & Koga T. (1988). Effects of human recombinant tumor
necrosis factor-alpha and interleukin 1 on the synthesis of

234
glycosaminoglycan and DNA in cultured rat costal chondrocytes. J
Immunol 140, 827-831.
Ishii M, Merrill AE, Chan YS, Gitelman I, Rice DP, Sucov HM & Maxson RE, Jr.
(2003). Msx2 and Twist cooperatively control the development of the
neural crest-derived skeletogenic mesenchyme of the murine skull vault.
Development 130, 6131-6142.
James DJ, Salaun C, Brandie FM, Connell JM & Chamberlain LH. (2004).
Neomycin prevents the wortmannin inhibition of insulin-stimulated Glut4
translocation and glucose transport in 3T3-L1 adipocytes. J Biol Chem
279, 20567-20570.
Johansen JS, Olee T, Price PA, Hashimoto S, Ochs RL & Lotz M. (2001).
Regulation of YKL-40 production by human articular chondrocytes.
Arthritis Rheum 44, 826-837.
Johnstone B, Hering TM, Caplan AI, Goldberg VM & Yoo JU. (1998). In vitro
chondrogenesis of bone marrow-derived mesenchymal progenitor cells.
Exp Cell Res 238, 265-272.
Joshi MB, Ivanov D, Philippova M, Erne P & Resink TJ. (2007). Integrin-linked
kinase is an essential mediator for T-cadherin-dependent signalling via
Akt and GSK3beta in endothelial cells. FASEB J, 12, 3083-95.
Kawanishi M, Oura A, Furukawa K, Fukubayashi T, Nakamura K, Tateishi T &
Ushida T. (2007). Redifferetiation of dedifferentiated bovine articular
chondrocytes enhanced by cyclic hydrostatic pressure under a gas-
controlled system. Tissue Eng., 13, 957-64.
235
Kerrigan MJ & Hall AC. (2005). Stimulation of regulatory volume decrease
(RVD) by isolated bovine articular chondrocytes following F-actin
disruption using latrunculin B. Biorheology 42, 283-293.
Kerrigan MJ & Hall AC. (2007). Control of chondrocyte regulatory volume
decrease (RVD) by [Ca(2+)](i) and cell shape. Osteoarthritis Cartilage.
Kerrigan MJ & Hall AC. (2008). Control of chondrocyte regulatory volume
decrease (RVD) by [Ca2+]i and cell shape. Osteoarthritis Cartilage 16, 312-322.
Kerrigan MJ, Hook CS, Qusous A & Hall AC. (2006). Regulatory volume
increase (RVI) by in situ and isolated bovine articular chondrocytes. J Cell
Physiol 209, 481-492.
Kiang AS, Palfi A, Ader M, Kenna PF, Millington-Ward S, Clark G, Kennan A,
O'Reilly M, Tam LC, Aherne A, McNally N, Humphries P & Farrar GJ.
(2005). Toward a Gene Therapy for Dominant Disease: Validation of an
RNA Interference-Based Mutation-Independent Approach. Mol Ther.
Kim SJ, Hwang SG, Kim IC & Chun JS. (2003). Actin cytoskeletal architecture
regulates nitric oxide-induced apoptosis, dedifferentiation, and
cyclooxygenase-2 expression in articular chondrocytes via mitogen-
activated protein kinase and protein kinase C pathways. J Biol Chem 278, 42448-42456.
Kino-oka M, Maeda Y, Ota Y, Yashiki S, Sugawara K & Taya M. (2005). Process
design of chondrocyte cultures with monolayer growth for cell expansion
and subsequent three-dimensional growth for production of cultured
cartilage. J Biosci Bioeng 100, 67-76.
236
Knight MM, Idowu BD, Lee DA & Bader DL. (2001). Temporal changes in
cytoskeletal organisation within isolated chondrocytes quantified using a
novel image analysis technique. Med Biol Eng Comput 39, 397-404.
Koumakis E, Wipff J, Avouac J, Kahan A & Allanore Y. (2009). Severe
Refractory Rheumatoid Arthritis Successfully Treated with Combination
Rituximab and Anti-Tumor Necrosis Factor-{alpha}-Blocking Agents. J
Rheumatol 36, 2125-2126.
Langelier E, Suetterlin R, Hoemann CD, Aebi U & Buschmann MD. (2000). The
chondrocyte cytoskeleton in mature articular cartilage: structure and
distribution of actin, tubulin, and vimentin filaments. J Histochem
Cytochem 48, 1307-1320.
Lapadula G, Iannone F, Zuccaro C, Grattagliano V, Covelli M, Patella V, Lo
Bianco G & Pipitone V. (1997). Integrin expression on chondrocytes:
correlations with the degree of cartilage damage in human osteoarthritis.
Clin Exp Rheumatol 15, 247-254.
Lapadula G, Iannone F, Zuccaro C, Grattagliano V, Covelli M, Patella V, Lo
Bianco G & Pipitone V. (1998). Chondrocyte phenotyping in human
osteoarthritis. Clin Rheumatol 17, 99-104.
Lee DA, Reisler T & Bader DL. (2003a). Expansion of chondrocytes for tissue
engineering in alginate beads enhances chondrocytic phenotype
compared to conventional monolayer techniques. Acta Orthop Scand 74, 6-15.
Lee HS, Millward-Sadler SJ, Wright MO, Nuki G & Salter DM. (2000). Integrin
and mechanosensitive ion channel-dependent tyrosine phosphorylation of
237
focal adhesion proteins and beta-catenin in human articular chondrocytes
after mechanical stimulation. J Bone Miner Res 15, 1501-1509.
Lee MT, Coburn GA, McClure MO & Cullen BR. (2003b). Inhibition of human
immunodeficiency virus type 1 replication in primary macrophages by
using Tat- or CCR5-specific small interfering RNAs expressed from a
lentivirus vector. J Virol 77, 11964-11972.
LeGrand A, Fermor B, Fink C, Pisetsky DS, Weinberg JB, Vail TP & Guilak F.
(2001). Interleukin-1, tumor necrosis factor alpha, and interleukin-17
synergistically up-regulate nitric oxide and prostaglandin E2 production in
explants of human osteoarthritic knee menisci. Arthritis Rheum 44, 2078-
2083.
Lin Z, Willers C, Xu J & Zheng MH. (2006). The chondrocyte: biology and clinical
application. Tissue Eng 12, 1971-1984.
Liu B & Wu D. (2004). Analysis of G protein-mediated activation of
phospholipase C in cultured cells. Methods Mol Biol 237, 99-102.
Liu C & Hermann TE. (1978). Characterization of ionomycin as a calcium
ionophore. J Biol Chem 253, 5892-5894.
Liu CJ. (2009). The role of ADAMTS-7 and ADAMTS-12 in the pathogenesis of
arthritis. Nat Clin Pract Rheumatol 5, 38-45.
Liu Y, Wang W, Cao Y, Shang Q & Zhong W. (1998). [Culture of chondrocytes
seeded onto chitin scaffoldings coating with different materials:
experimental study]. Zhonghua Wai Ke Za Zhi 36, 495-496.
238
Liu Y, Wang Y, Yamakuchi M, Masuda S, Tokioka T, Yamaoka S, Maruyama I &
Kitajima I. (2001). Phosphoinositide-3 kinase-PKB/Akt pathway activation
is involved in fibroblast Rat-1 transformation by human T-cell leukemia
virus type I tax. Oncogene 20, 2514-2526.
Loty S, Sautier JM & Forest N. (2000). Phenotypic modulation of nasal septal
chondrocytes by cytoskeleton modification. Biorheology 37, 117-125.
Lui VC, Ng LJ, Nicholls J, Tam PP & Cheah KS. (1995). Tissue-specific and
differential expression of alternatively spliced alpha 1(II) collagen mRNAs
in early human embryos. Dev Dyn 203, 198-211.
Luo G, D'Souza R, Hogue D & Karsenty G. (1995). The matrix Gla protein gene
is a marker of the chondrogenesis cell lineage during mouse
development. J Bone Miner Res 10, 325-334.
Maestro R, Dei Tos AP, Hamamori Y, Krasnokutsky S, Sartorelli V, Kedes L,
Doglioni C, Beach DH & Hannon GJ. (1999). Twist is a potential
oncogene that inhibits apoptosis. Genes Dev 13, 2207-2217.
Mallein-Gerin F, Garrone R & van der Rest M. (1991). Proteoglycan and
collagen synthesis are correlated with actin organization in
dedifferentiating chondrocytes. Eur J Cell Biol 56, 364-373.
Maroudas A & Bannon C. (1981). Measurement of swelling pressure in cartilage
and comparison with the osmotic pressure of constituent proteoglycans.
Biorheology 18, 619-632.
Maroudas A & Venn M. (1977). Chemical composition and swelling of normal
and osteoarthrotic femoral head cartilage. II. Swelling. Ann Rheum Dis
36, 399-406.
239
Martin I, Jakob M, Schafer D, Dick W, Spagnoli G & Heberer M. (2001).
Quantitative analysis of gene expression in human articular cartilage from
normal and osteoarthritic joints. Osteoarthritis Cartilage 9, 112-118.
Matyas JR, Adams ME, Huang D & Sandell LJ. (1995). Discoordinate gene
expression of aggrecan and type II collagen in experimental
osteoarthritis. Arthritis and rheumatism 38, 420-425.
Melrose J, Smith SM, Smith MM & Little CB. (2008). The use of Histochoice for
histological examination of articular and growth plate cartilages,
intervertebral disc and meniscus. Biotech Histochem 83, 47-53.
Mertens M & Singh JA. (2009). Anakinra for rheumatoid arthritis: a systematic
review. J Rheumatol 36, 1118-1125.
Millward-Sadler SJ, Wright MO, Lee H, Caldwell H, Nuki G & Salter DM. (2000).
Altered electrophysiological responses to mechanical stimulation and
abnormal signalling through alpha5beta1 integrin in chondrocytes from
osteoarthritic cartilage. Osteoarthritis Cartilage 8, 272-278.
Minina E, Wenzel HM, Kreschel C, Karp S, Gaffield W, McMahon AP &
Vortkamp A. (2001). BMP and Ihh/PTHrP signaling interact to coordinate
chondrocyte proliferation and differentiation. Development 128, 4523-
4534.
Miot S, Woodfield T, Daniels AU, Suetterlin R, Peterschmitt I, Heberer M, van
Blitterswijk CA, Riesle J & Martin I. (2005a). Effects of scaffold
composition and architecture on human nasal chondrocyte
redifferentiation and cartilaginous matrix deposition. Biomaterials 26, 2479-2489.
240
Miot S, Woodfield T, Daniels AU, Suetterlin R, Peterschmitt I, Heberer M, van
Blitterswijk CA, Riesle J & Martin I. (2005b). Effects of scaffold
composition and architecture on human nasal chondrocyte
redifferentiation and cartilaginous matrix deposition. Biomaterials 26, 2479-2489.
Mizrahi J, Maroudas A, Lanir Y, Ziv I & Webber TJ. (1986). The "instantaneous"
deformation of cartilage: effects of collagen fiber orientation and osmotic
stress. Biorheology 23, 311-330.
Mototani H, Mabuchi A, Saito S, Fujioka M, Iida A, Takatori Y, Kotani A, Kubo T,
Nakamura K, Sekine A, Murakami Y, Tsunoda T, Notoya K, Nakamura Y
& Ikegawa S. (2005). A functional single nucleotide polymorphism in the
core promoter region of CALM1 is associated with hip osteoarthritis in
Japanese. Hum Mol Genet 14, 1009-1017.
Muallem S & Wilkie TM. (1999). G protein-dependent Ca2+ signaling complexes
in polarized cells. Cell Calcium 26, 173-180.
Muramatsu S, Wakabayashi M, Ohno T, Amano K, Ooishi R, Sugahara T,
Shiojiri S, Tashiro K, Suzuki Y, Nishimura R, Kuhara S, Sugano S,
Yoneda T & Matsuda A. (2007). Functional gene screening system
identified TRPV4 as a regulator of chondrogenic differentiation. J Biol
Chem 282, 32158-32167.
Musser JH, Chakraborty UR, Sciortino S, Gordon RJ, Khandwala A, Neiss ES,
Pruss TP, Van Inwegen R, Weinryb I & Coutts SM. (1987). Substituted
arylmethyl phenyl ethers. 1. A novel series of 5-lipoxygenase inhibitors
and leukotriene antagonists. J Med Chem 30, 96-104.
241
Nakou M, Katsikas G, Sidiropoulos P, Bertsias G, Papadimitraki E, Raptopoulou
A, Koutala H, Papadaki HA, Kritikos H & Boumpas DT. (2009). Rituximab
therapy reduces activated B cells both in the peripheral blood and bone
marrow of patients with rheumatoid arthritis: depletion of memory B cells
correlates with clinical response. Arthritis Res Ther 11, R131.
Nalin AM, Greenlee TK, Jr. & Sandell LJ. (1995). Collagen gene expression
during development of avian synovial joints: transient expression of types
II and XI collagen genes in the joint capsule. Dev Dyn 203, 352-362.
Nedelcheva Y, Getting SJ & Kerrigan MJP. (2008). The role of the aactin
skeleton in chondrocyte protection following single impact. Proceedings
of the British Pharmacological Society. Vol 6, Issue 4.
Nehrer S, Breinan HA, Ramappa A, Shortkroff S, Young G, Minas T, Sledge CB,
Yannas IV & Spector M. (1997). Canine chondrocytes seeded in type I
and type II collagen implants investigated in vitro. J Biomed Mater Res,
38, 95-104.
Newman P & Watt FM. (1988). Influence of cytochalasin D-induced changes in
cell shape on proteoglycan synthesis by cultured articular chondrocytes.
Exp Cell Res 178, 199-210.
Ng LJ, Wheatley S, Muscat GE, Conway-Campbell J, Bowles J, Wright E, Bell
DM, Tam PP, Cheah KS & Koopman P. (1997). SOX9 binds DNA,
activates transcription, and coexpresses with type II collagen during
chondrogenesis in the mouse. Dev Biol 183, 108-121.
Nofal GA & Knudson CB. (2002). Latrunculin and cytochalasin decrease
chondrocyte matrix retention. J Histochem Cytochem 50, 1313-1324.
242
Nusse R. (2005). Wnt signaling in disease and in development. Cell Res 15, 28-
32.
O'Neill WC. (1999). Physiological significance of volume-regulatory transporters.
The American journal of physiology 276, C995-C1011.
Ono S. (2007). Mechanism of depolymerization and severing of actin filaments
and its significance in cytoskeletal dynamics. Int Rev Cytol 258, 1-82.
Ostergaard K, Salter DM, Petersen J, Bendtzen K, Hvolris J & Andersen CB.
(1998). Expression of alpha and beta subunits of the integrin superfamily
in articular cartilage from macroscopically normal and osteoarthritic
human femoral heads. Ann Rheum Dis 57, 303-308.
Ota MS, Loebel DA, O'Rourke MP, Wong N, Tsoi B & Tam PP. (2004). Twist is
required for patterning the cranial nerves and maintaining the viability of
mesodermal cells. Dev Dyn 230, 216-228.
Park Y, Sugimoto M, Watrin A, Chiquet M & Hunziker EB. (2005). BMP-2
induces the expression of chondrocyte-specific genes in bovine
synovium-derived progenitor cells cultured in three-dimensional alginate
hydrogel. Osteoarthritis Cartilage 13, 527-536.
Parker E, Getting SJ, Hucklebridge F, Vleck VE & Kerrigan MJP. (2008). The
effects of REV5901 on chondrocyte viability following mechanical trauma.
Proceedings of the British Pharmacological Society. Vol 7, Issue 4.
Pathi S, Rutenberg JB, Johnson RL & Vortkamp A. (1999). Interaction of Ihh and
BMP/Noggin signaling during cartilage differentiation. Dev Biol 209, 239-
253.
243
Peach CA, Carr AJ & Loughlin J. (2005). Recent advances in the genetic
investigation of osteoarthritis. Trends in molecular medicine 11, 186-191.
Penta K, Varner JA, Liaw L, Hidai C, Schatzman R & Quertermous T. (1999).
DEL1 induces integrin signaling and angiogenesis by ligation of
alphaVbeta3. J Biol Chem 274, 11101-11109.
Perkins GL, Derfoul A, Ast A & Hall DJ. (2005). An inhibitor of the stretch-
activated cation receptor exerts a potent effect on chondrocyte
phenotype. Differentiation 73, 199-211.
Pirttiniemi P & Kantomaa T. (1998). Effect of cytochalasin D on articular
cartilage cell phenotype and shape in long-term organ culture. Eur J
Orthod 20, 491-499.
Polak JM, Mantalaris S & Harding SE. (2008). Advances in Tissue Engineering:
Cartilage. London: Imperial College Press.
Pollard TD & Borisy GG. (2003). Cellular motility driven by assembly and
disassembly of actin filaments. Cell 112, 453-465.
Pritchard S & Guilak F. (2004). The role of F-actin in hypo-osmotically induced
cell volume change and calcium signaling in anulus fibrosus cells. Ann
Biomed Eng 32, 103-111.
Pullig O, Weseloh G, Ronneberger D, Kakonen S & Swoboda B. (2000).
Chondrocyte differentiation in human osteoarthritis: expression of
osteocalcin in normal and osteoarthritic cartilage and bone. Calcif Tissue
Int 67, 230-240.
Qusous A, Hook C, Nedelcheva Y & Kerrigan MJP. (2010). siRNA mediated
244
inhibition of Regulatory Volume Increase (RVI) in the chondrocyte cell line
C20/A4. In press.
Rajpurohit R, Koch CJ, Tao Z, Teixeira CM & Shapiro IM. (1996). Adaptation of
chondrocytes to low oxygen tension: relationship between hypoxia and
cellular metabolism. J Cell Physiol 168, 424-432.
Ramachandrula A, Tiku K & Tiku ML. (1992). Tripeptide RGD-dependent
adhesion of articular chondrocytes to synovial fibroblasts. J Cell Sci 101 ( Pt 4), 859-871.
Reginato AM, Iozzo RV & Jimenez SA. (1994). Formation of nodular structures
resembling mature articular cartilage in long-term primary cultures of
human fetal epiphyseal chondrocytes on a hydrogel substrate. Arthritis
Rheum 37, 1338-1349.
Reinhold MI, Kapadia RM, Liao Z & Naski MC. (2006). The Wnt-inducible
transcription factor Twist1 inhibits chondrogenesis. J Biol Chem 281, 1381-1388.
Renshaw MW, Toksoz D & Schwartz MA. (1996). Involvement of the small
GTPase rho in integrin-mediated activation of mitogen-activated protein
kinase. J Biol Chem 271, 21691-21694.
Reynolds A, Leake D, Boese Q, Scaringe S, Marshall WS & Khvorova A. (2004).
Rational siRNA design for RNA interference. Nat Biotechnol 22, 326-330.
Rezaee M, Penta K & Quertermous T. (2002). DEL1 mediates VSMC adhesion,
migration, and proliferation through interaction with integrin
alpha(v)beta(3). Am J Physiol Heart Circ Physiol 282, H1924-1932.
245
Roberts S. (1985). Collagen of the calcified layer of human articular cartilage.
Experientia 41, 1138-1139.
Roberts SR, Knight MM, Lee DA & Bader DL. (2001). Mechanical compression
influences intracellular Ca2+ signaling in chondrocytes seeded in agarose
constructs. J Appl Physiol 90, 1385-1391.
Roos EM, Roos HP, Lohmander LS, Ekdahl C & Beynnon BD. (1998). Knee
Injury and Osteoarthritis Outcome Score (KOOS)--development of a self-
administered outcome measure. J Orthop Sports Phys Ther 28, 88-96.
Rozen S & Skaletsky H. (2000). Primer3 on the WWW for general users and for
biologist programmers. Methods in molecular biology (Clifton, NJ 132, 365-386.
Ruoslahti E & Pierschbacher MD. (1987). New perspectives in cell adhesion:
RGD and integrins. Science 238, 491-497.
Ryan MC & Sandell LJ. (1990). Differential expression of a cysteine-rich domain
in the amino-terminal propeptide of type II (cartilage) procollagen by
alternative splicing of mRNA. J Biol Chem 265, 10334-10339.
Sackin H. (1995). Stretch-activated ion channels. Kidney Int 48, 1134-1147.
Sailor LZ, Hewick RM & Morris EA. (1996). Recombinant human bone
morphogenetic protein-2 maintains the articular chondrocyte phenotype in
long-term culture. J Orthop Res 14, 937-945.
246
Sanchez JC, Danks TA & Wilkins RJ. (2003). Mechanisms involved in the
increase in intracellular calcium following hypotonic shock in bovine
articular chondrocytes. Gen Physiol Biophys 22, 487-500.
Sanchez JC & Wilkins RJ. (2004). Changes in intracellular calcium
concentration in response to hypertonicity in bovine articular
chondrocytes. Comp Biochem Physiol A Mol Integr Physiol 137, 173-182.
Sandell LJ & Aigner T. (2001). Articular cartilage and changes in arthritis. An
introduction: cell biology of osteoarthritis. Arthritis Res 3, 107-113.
Sandell LJ, Morris N, Robbins JR & Goldring MB. (1991). Alternatively spliced
type II procollagen mRNAs define distinct populations of cells during
vertebral development: differential expression of the amino-propeptide. J
Cell Biol 114, 1307-1319.
Schaller MD, Borgman CA, Cobb BS, Vines RR, Reynolds AB & Parsons JT.
(1992). pp125FAK a structurally distinctive protein-tyrosine kinase
associated with focal adhesions. Proceedings of the National Academy of
Sciences of the United States of America 89, 5192-5196.
Schaller MD, Hildebrand JD, Shannon JD, Fox JW, Vines RR & Parsons JT.
(1994). Autophosphorylation of the focal adhesion kinase, pp125FAK,
directs SH2-dependent binding of pp60src. Mol Cell Biol 14, 1680-1688.
Schliwa M. (1982). Action of cytochalasin D on cytoskeletal networks. J Cell Biol
92, 79-91.
Schmid TM, Bonen DK, Luchene L & Linsenmayer TF. (1991). Late events in
chondrocyte differentiation: hypertrophy, type X collagen synthesis and
matrix calcification. In vivo (Athens, Greece) 5, 533-540.
247
Schmidhauser C, Casperson GF, Myers CA, Sanzo KT, Bolten S & Bissell MJ.
(1992). A novel transcriptional enhancer is involved in the prolactin- and
extracellular matrix-dependent regulation of beta-casein gene expression.
Molecular biology of the cell 3, 699-709.
Schnabel M, Marlovits S, Eckhoff G, Fichtel I, Gotzen L, Vecsei V & Schlegel J.
(2002). Dedifferentiation-associated changes in morphology and gene
expression in primary human articular chondrocytes in cell culture.
Osteoarthritis Cartilage 10, 62-70.
Schulze-Tanzil G, Mobasheri A, de Souza P, John T & Shakibaei M. (2004).
Loss of chondrogenic potential in dedifferentiated chondrocytes
correlates with deficient Shc-Erk interaction and apoptosis. Osteoarthritis
Cartilage 12, 448-458.
Scully SP, Lee JW, Ghert PMA & Qi W. (2001). The role of the extracellular
matrix in articular chondrocyte regulation. Clin Orthop Relat Res, S72-89.
Serra R & Chang C. (2003). TGF-beta signaling in human skeletal and
patterning disorders. Birth Defects Res C Embryo Today 69, 333-351.
Serra R, Karaplis A & Sohn P. (1999). Parathyroid hormone-related peptide
(PTHrP)-dependent and -independent effects of transforming growth
factor beta (TGF-beta) on endochondral bone formation. The Journal of
cell biology 145, 783-794.
Sgaglione NA. (2005). Biologic approaches to articular cartilage surgery: Future
trends. Orthop Clin North Am 36, 485-+.
248
Shakibaei M & De Souza P. (1997). Differentiation of mesenchymal limb bud
cells to chondrocytes in alginate beads. Cell Biol Int 21, 75-86.
Shakibaei M, De Souza P & Merker HJ. (1997). Integrin expression and collagen
type II implicated in maintenance of chondrocyte shape in monolayer
culture: an immunomorphological study. Cell Biol Int 21, 115-125.
Shrode LD, Klein JD, Douglas PB, O'Neill WC & Putnam RW. (1997).
Shrinkage-induced activation of Na+/H+ exchange: role of cell density
and myosin light chain phosphorylation. The American journal of
physiology 272, C1968-1979.
Silvestre JS, Thery C, Hamard G, Boddaert J, Aguilar B, Delcayre A, Houbron
C, Tamarat R, Blanc-Brude O, Heeneman S, Clergue M, Duriez M,
Merval R, Levy B, Tedgui A, Amigorena S & Mallat Z. (2005). Lactadherin
promotes VEGF-dependent neovascularization. Nat Med 11, 499-506.
Sock E, Pagon RA, Keymolen K, Lissens W, Wegner M & Scherer G. (2003).
Loss of DNA-dependent dimerization of the transcription factor SOX9 as
a cause for campomelic dysplasia. Hum Mol Genet 12, 1439-1447.
Soder S, Hambach L, Lissner R, Kirchner T & Aigner T. (2002). Ultrastructural
localization of type VI collagen in normal adult and osteoarthritic human
articular cartilage. Osteoarthritis Cartilage 10, 464-470.
Song HR, Lee KS, Li QW, Koo SK & Jung SC. (2003). Identification of cartilage
oligomeric matrix protein (COMP) gene mutations in patients with
pseudoachondroplasia and multiple epiphyseal dysplasia. J Hum Genet
48, 222-225.
249
Sorokin L, Sonnenberg A, Aumailley M, Timpl R & Ekblom P. (1990).
Recognition of the laminin E8 cell-binding site by an integrin possessing
the alpha 6 subunit is essential for epithelial polarization in developing
kidney tubules. The Journal of cell biology 111, 1265-1273.
Sosic D, Richardson JA, Yu K, Ornitz DM & Olson EN. (2003). Twist regulates
cytokine gene expression through a negative feedback loop that
represses NF-kappaB activity. Cell 112, 169-180.
Spicer DB, Rhee J, Cheung WL & Lassar AB. (1996). Inhibition of myogenic
bHLH and MEF2 transcription factors by the bHLH protein Twist. Science
272, 1476-1480.
Spirito S, Goldberg RL & Di Pasquale G. (1993). A comparison of chondrocyte
proteoglycan metabolism in monolayer and agarose cultures. Agents
Actions 39 Spec No, C160-162.
Stevens A & Lowe JS. (2000). Pathology. Elsevier Health Sciences.
Stockwell RA. (1971a). The interrelationship of cell density and cartilage
thickness in mammalian articular cartilage. J Anat 109, 411-421.
Stockwell RA. (1971b). The interrelationship of cell density and cartilage
thickness in mammalian articular cartilage. J Anat 109, 411-421.
Stockwell RA. (1971c). The ultrastructure of cartilage canals and the
surrounding cartilage in the sheep fetus. J Anat 109, 397-410.
Stockwell RA. (1978). Chondrocytes. J Clin Pathol Suppl (R Coll Pathol) 12, 7-
13.
250
Stockwell RA. (1979). The Biology of Catrilage Cells. Cambridge Univeristy
Press, Cambridge.
Stockwell RA. (1991a). Cartilage Failure in Osteoarthritis: Relevance of Normal
Structure and Function. A Review. Clinical Anatomy 4, 161-191.
Stockwell RA. (1991b). Morphometry of cytoplasmic components of mammalian
articular chondrocytes and corneal keratocytes: species and zonal
variations of mitochondria in relation to nutrition. J Anat 175, 251-261.
Stoker MG. (1973). Role of diffusion boundary layer in contact inhibition of
growth. Nature 246, 200-203.
Stokes DG, Liu G, Coimbra IB, Piera-Velazquez S, Crowl RM & Jimenez SA.
(2002). Assessment of the gene expression profile of differentiated and
dedifferentiated human fetal chondrocytes by microarray analysis.
Arthritis Rheum 46, 404-419.
Stokes DG, Liu G, Dharmavaram R, Hawkins D, Piera-Velazquez S & Jimenez
SA. (2001). Regulation of type-II collagen gene expression during human
chondrocyte de-differentiation and recovery of chondrocyte-specific
phenotype in culture involves Sry-type high-mobility-group box (SOX)
transcription factors. The Biochemical journal 360, 461-470.
Sung LY, Chiu HY, Chen YL, Chuang CK & Hu YC. (2009). Baculovirus-
mediated growth factor expression in dedifferentiated chondrocytes
accelerates redifferentiation: effects of combinational transduction. Tissue
Eng, 15, 1353-62.
Takigawa M, Takano T, Shirai E & Suzuki F. (1984). Cytoskeleton and
differentiation: effects of cytochalasin B and colchicine on expression of

251
the differentiated phenotype of rabbit costal chondrocytes in culture. Cell
Differ 14, 197-204.
Tallheden T, Karlsson C, Brunner A, Van Der Lee J, Hagg R, Tommasini R &
Lindahl A. (2004). Gene expression during redifferentiation of human
articular chondrocytes. Osteoarthritis Cartilage 12, 525-535.
Tallheden T, van der Lee J, Brantsing C, Mansson JE, Sjogren-Jansson E &
Lindahl A. (2005). Human serum for culture of articular chondrocytes. Cell
Transplant 14, 469-479.
Tamkun JW, DeSimone DW, Fonda D, Patel RS, Buck C, Horwitz AF & Hynes
RO. (1986). Structure of integrin, a glycoprotein involved in the
transmembrane linkage between fibronectin and actin. Cell 46, 271-282.
Tan K, Duquette M, Joachimiak A & Lawler J. (2009). The crystal structure of
the signature domain of cartilage oligomeric matrix protein: implications
for collagen, glycosaminoglycan and integrin binding. Faseb J 23, 2490-
2501.
Tattersall A, Meredith D, Furla P, Shen MR, Ellory C & Wilkins R. (2003).
Molecular and functional identification of the Na(+)/H(+) exchange
isoforms NHE1 and NHE3 in isolated bovine articular chondrocytes. Cell
Physiol Biochem 13, 215-222.
Tetlow LC, Adlam DJ & Woolley DE. (2001). Matrix metalloproteinase and
proinflammatory cytokine production by chondrocytes of human
osteoarthritic cartilage: associations with degenerative changes. Arthritis
Rheum 44, 585-594.
252
Tomar RS, Matta H & Chaudhary PM. (2003). Use of adeno-associated viral
vector for delivery of small interfering RNA. Oncogene 22, 5712-5715.
Trickey WR, Vail TP & Guilak F. (2004). The role of the cytoskeleton in the
viscoelastic properties of human articular chondrocytes. J Orthop Res 22, 131-139.
Trujillo E, Alvarez de la Rosa D, Mobasheri A, Gonzalez T, Canessa CM &
Martin-Vasallo P. (1999). Sodium transport systems in human
chondrocytes. II. Expression of NCX, Na+/K+/2Cl- cotransporter and
Na+/H+ exchangers in healthy and arthritic chondrocytes. Histology and
histopathology 14, 1023-1031.
Tsiakalos AP, Avgoustidis NK & Moutsopoulos HM. (2008). Rituximab therapy in
Greek patients with rheumatoid arthritis. Biologics 2, 911-916.
Tsuda M, Takahashi S, Takahashi Y & Asahara H. (2003). Transcriptional co-
activators CREB-binding protein and p300 regulate chondrocyte-specific
gene expression via association with Sox9. J Biol Chem 278, 27224-
27229.
Tufan AC, Satiroglu-Tufan NL, Jackson GC, Semerci CN, Solak S & Yagci B.
(2007). Serum or plasma cartilage oligomeric matrix protein concentration
as a diagnostic marker in pseudoachondroplasia: differential diagnosis of
a family. Eur J Hum Genet 15, 1023-1028.
Turner CE & Burridge K. (1991). Transmembrane molecular assemblies in cell-
extracellular matrix interactions. Current opinion in cell biology 3, 849-
853.
253
Tyler JA & Benton HP. (1988). Synthesis of type II collagen is decreased in
cartilage cultured with interleukin 1 while the rate of intracellular
degradation remains unchanged. Coll Relat Res 8, 393-405.
Ui-Tei K, Naito Y, Takahashi F, Haraguchi T, Ohki-Hamazaki H, Juni A, Ueda R
& Saigo K. (2004). Guidelines for the selection of highly effective siRNA
sequences for mammalian and chick RNA interference. Nucleic acids
research 32, 936-948.
Urban JP. (1994). The chondrocyte: a cell under pressure. British journal of
rheumatology 33, 901-908.
Urban JP, Hall AC & Gehl KA. (1993). Regulation of matrix synthesis rates by
the ionic and osmotic environment of articular chondrocytes. J Cell
Physiol 154, 262-270.
Uusitalo H, Hiltunen A, Ahonen M, Gao TJ, Lefebvre V, Harley V, Kahari VM &
Vuorio E. (2001). Accelerated up-regulation of L-Sox5, Sox6, and Sox9
by BMP-2 gene transfer during murine fracture healing. J Bone Miner Res
16, 1837-1845.
Valhmu WB, Stazzone EJ, Bachrach NM, Saed-Nejad F, Fischer SG, Mow VC &
Ratcliffe A. (1998). Load-controlled compression of articular cartilage
induces a transient stimulation of aggrecan gene expression. Arch
Biochem Biophys 353, 29-36.
Valsesia-Wittmann S, Magdeleine M, Dupasquier S, Garin E, Jallas AC,
Combaret V, Krause A, Leissner P & Puisieux A. (2004). Oncogenic
cooperation between H-Twist and N-Myc overrides failsafe programs in
cancer cells. Cancer Cell 6, 625-630.
254
van der Kraan PM, Buma P, van Kuppevelt T & van den Berg WB. (2002).
Interaction of chondrocytes, extracellular matrix and growth factors:
relevance for articular cartilage tissue engineering. Osteoarthritis
Cartilage 10, 631-637.
Van Inwegen RG, Khandwala A, Gordon R, Sonnino P, Coutts S & Jolly S.
(1987). REV 5901: an orally effective peptidoleukotriene antagonist,
detailed biochemical/pharmacological profile. J Pharmacol Exp Ther 241, 117-124.
Van Der Windt A, Jahr H, Farrell E, Verhaar J, Weinans H & van Osch G.
(2009). Calcineurin inhibitors promote chondrocgenic marker expressive
of dedifferentiated human adult chondrocytes via stimulation of TGF-ss1
production. Tissue Eng, ahead of print.
van Rossum DB & Patterson RL. (2009). PKC and PLA2: probing the
complexities of the calcium network. Cell Calcium 45, 535-545.
Venezian R, Shenker BJ, Datar S & Leboy PS. (1998). Modulation of
chondrocyte proliferation by ascorbic acid and BMP-2. J Cell Physiol 174, 331-341.
Verghese MW, Smith CD & Snyderman R. (1986). Role of guanine nucleotide
regulatory protein in polyphosphoinositide degradation and activation of
phagocytic leukocytes by chemoattractants. J Cell Biochem 32, 59-69.
Vojtek AB, Taylor J, DeRuiter SL, Yu JY, Figueroa C, Kwok RP & Turner DL.
(2003). Akt regulates basic helix-loop-helix transcription factor-coactivator
complex formation and activity during neuronal differentiation. Molecular
and cellular biology 23, 4417-4427.
255
Wang H & Kandel RA. (2004). Chondrocytes attach to hyaline or calcified
cartilage and bone. Osteoarthritis Cartilage 12, 56-64.
Wang MB & Metzlaff M. (2005). RNA silencing and antiviral defense in plants.
Curr Opin Plant Biol 8, 216-222.
Waymouth C. (1974). "Feeding the baby"--designing the culture milieu to
enhance cell stability. Journal of the National Cancer Institute 53, 1443-
1448.
Wenke AK, Grassel S, Moser M & Bosserhoff AK. (2009). The cartilage-specific
transcription factor Sox9 regulates AP-2epsilon expression in
chondrocytes. Febs J 276, 2494-2504.
Werb Z, Tremble PM, Behrendtsen O, Crowley E & Damsky CH. (1989). Signal
transduction through the fibronectin receptor induces collagenase and
stromelysin gene expression. The Journal of cell biology 109, 877-889.
Wilkins RJ, Browning JA & Ellory JC. (2000). Surviving in a matrix: membrane
transport in articular chondrocytes. The Journal of membrane biology
177, 95-108.
Williams GR, Robson H & Shalet SM. (1998). Thyroid hormone actions on
cartilage and bone: interactions with other hormones at the epiphyseal
plate and effects on linear growth. The Journal of endocrinology 157, 391-403.
Woods VL, Jr., Schreck PJ, Gesink DS, Pacheco HO, Amiel D, Akeson WH &
Lotz M. (1994). Integrin expression by human articular chondrocytes.
Arthritis Rheum 37, 537-544.
256
Wright M, Jobanputra P, Bavington C, Salter DM & Nuki G. (1996). Effects of
intermittent pressure-induced strain on the electrophysiology of cultured
human chondrocytes: evidence for the presence of stretch-activated
membrane ion channels. Clin Sci (Lond) 90, 61-71.
Wright MO, Nishida K, Bavington C, Godolphin JL, Dunne E, Walmsley S,
Jobanputra P, Nuki G & Salter DM. (1997). Hyperpolarisation of cultured
human chondrocytes following cyclical pressure-induced strain: evidence
of a role for alpha 5 beta 1 integrin as a chondrocyte mechanoreceptor. J
Orthop Res 15, 742-747.
Yamazaki N, Browning JA & Wilkins RJ. (2000). Modulation of Na(+) x H(+)
exchange by osmotic shock in isolated bovinearticular chondrocytes. Acta
physiologica Scandinavica 169, 221-228.
Yarmola EG & Bubb MR. (2004). Effects of profilin and thymosin beta4 on the
critical concentration of actin demonstrated in vitro and in cell extracts
with a novel direct assay. J Biol Chem 279, 33519-33527.
Yaron I, Meyer FA, Dayer JM, Bleiberg I & Yaron M. (1989). Some recombinant
human cytokines stimulate glycosaminoglycan synthesis in human
synovial fibroblast cultures and inhibit it in human articular cartilage
cultures. Arthritis Rheum 32, 173-180.
Yellowley CE, Jacobs CR & Donahue HJ. (1999). Mechanisms contributing to
fluid-flow-induced Ca2+ mobilization in articular chondrocytes. J Cell
Physiol 180, 402-408.
Yellowley CE, Jacobs CR, Li Z, Zhou Z & Donahue HJ. (1997). Effects of fluid
flow on intracellular calcium in bovine articular chondrocytes. The
American journal of physiology 273, C30-36.
257
Yoo JU, Barthel TS, Nishimura K, Solchaga L, Caplan AI, Goldberg VM &
Johnstone B. (1998). The chondrogenic potential of human bone-marrow-
derived mesenchymal progenitor cells. J Bone Joint Surg Am 80, 1745-
1757.
Yun K & Im SH. (2007). Lef1 regulates COX-2 transcription in chondrocytes.
Biochem Biophys Res Commun 364, 270-275.
Zemmyo M, Meharra EJ, Kuhn K, Creighton-Achermann L & Lotz M. (2003).
Accelerated, aging-dependent development of osteoarthritis in alpha1
integrin-deficient mice. Arthritis Rheum 48, 2873-2880.
Zhang M, Wang JJ & Chen YJ. (2006). Effects of mechanical pressure on
intracellular calcium release channel and cytoskeletal structure in rabbit
mandibular condylar chondrocytes. Life Sci 78, 2480-2487.
Zhong J, Eliceiri B, Stupack D, Penta K, Sakamoto G, Quertermous T, Coleman
M, Boudreau N & Varner JA. (2003). Neovascularization of ischemic
tissues by gene delivery of the extracellular matrix protein Del-1. J Clin
Invest 112, 30-41.
Zou H, Wieser R, Massague J & Niswander L. (1997). Distinct roles of type I
bone morphogenetic protein receptors in the formation and differentiation
of cartilage. Genes Dev 11, 2191-2203.
Zwicky R & Baici A. (2000). Cytoskeletal architecture and cathepsin B trafficking
in human articular chondrocytes. Histochem Cell Biol 114, 363-372.
Recommended