. Three USGS Mafic Rock Reference Samples, W-2, DNC-1, and BIR-1
' .
U.S. GEOlOGICAl SURVEY BUllETIN 1623

Three USGS Mafic Rock Reference Samples, W-2, DNC-1, and BIR-1
By F. J. Flanagan
Three mafic rock reference samples to furnish calibration points for trace-element data between mafic and ultramafic reference samples were prepared
U.S. GEOLOGICAL SURVEY BULLETIN 1623
DEPARTMENT OF THE INTERIOR WILLIAM P. CLARK, Secretary
U.S. GEOLOGICAL SURVEY
Dallas L. Peck, Director
UNITED STATES GOVERNMENT PRINTING OFFICE: 1984
For safe by Distribution Branch Text Products Section U.S. Geological Survey 604 South Pickett Street Alexandria, Virginia 22304
Library of Congress Cataloging in Publication Data Flanagan, F. j. (Francis James), 1915-Three USGS mafic rock reference samples, W-2, DNC-1, and BIR-1.
(U.S. Geological Survey bulletin; 1623) Bibliography: p. 1. Alkalic igneous rocks. I. Title. II. Title: Three U.S.G.S. mafic rock reference samples, W-2, DNC-1, and BIR-1. Ill. Series. QE75.B9 no. 1623 [QE462.A4] 557.3 s [552' .1] 84-10160
CONTENTS
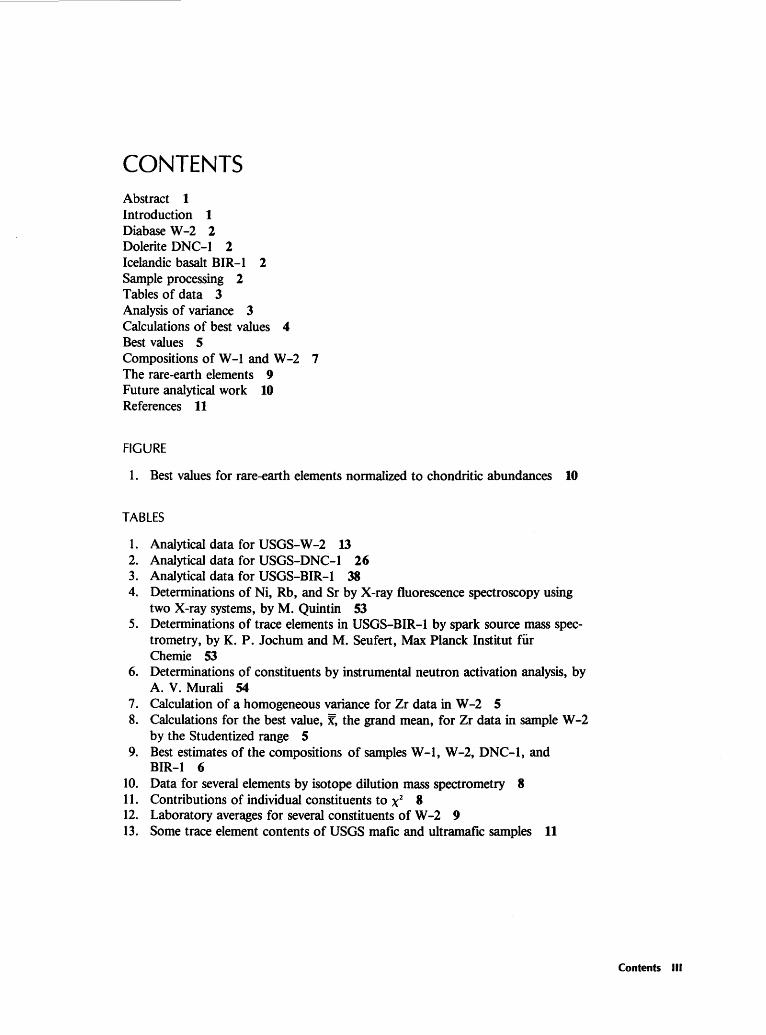
Abstract 1 Introduction 1 Diabase W-2 2 Dolerite DNC-1 2 Icelandic basalt BIR-1 2 Sample processing 2 Tables of data 3 Analysis of variance 3 Calculations of best values 4 Best values 5 Compositions of W -1 and W -2 7 The rare-earth elements 9 Future analytical work 10 References 11
FIGURE
1. Best values for rare-earth elements normalized to chondritic abundances 10
TABLES
1. Analytical data for USGS-W -2 13 2. Analytical data for USGS-DNC-1 26 3. Analytical data for USGS-BIR-1 38 4. Determinations of Ni, Rb, and Sr by X-ray fluorescence spectroscopy using
two X-ray systems, by M. Quintin 53 5. Determinations of trace elements in USGS-BIR-1 by spark source mass spec
trometry, by K. P. Jochum and M. Seufert, Max Planck lnstitut fiir Chemie 53
6. Determinations of constituents by instrumental neutron activation analysis, by A. V. Murali 54
7. Calculation of a homogeneous variance for Zr data in W -2 5 8. Calculations for the best value, X, the grand mean, for Zr data in sample W -2
by the Studentized range S 9. Best estimates of the compositions of samples W-1, W-2, DNC-1, and
BIR-1 6 10. Data for several elements by isotope dilution mass spectrometry 8 11. Contributions of individual constituents to X2 8 12. Laboratory averages for several constituents of W -2 9 13. Some trace element contents of USGS mafic and ultramafic samples 11
Contents Ill

Three USGS Mafic Rock Reference Samples, W-2, DNC-1, and BIR-1
By F. j. Flanagan
Abstract
Analytical data and best values are presented for three new U.S. Geological Survey mafic rock reference samples: W-2, another portion of the diabase at Centreville, Va., which replaces W-1; DNC-1, a dolerite from North Carolina; and BIR-1, an Icelandic basalt. The supplies of each powdered sample are expected to last 30 years or more. Best values for an oxide or element in a sample were calculated by the sequential procedure of (1) calculating a homogeneous variance for sets of six determinations for a constituent, (2) calculating from this variance the standard deviation of the means of six determinations, and (3) using this standard deviation to Studentize the range of means to decide which means could have been derived from the same population.
The chondrite-normalized abundances of rare-earth elements, calculated from best values for the three samples, show that the contents of light rare-earth elements are low in DNC-1 and are very low in BIR-1. Future data by isotope dilution mass spectrometry will result in smoother rare-earth element plots for the three samples. In addition to data for the light rare-earth elements, there are best values or magnitudes for other trace elements whose contents decrease with decreasing amounts of K20 in the samples. Data for other elements useful in geochemical studies are desirable, especially for samples DNC-1 and BIR-1. Determinations of several elements, including gold and the platinum group metals, were not reported.
INTRODUCTION
The three U.S. Geological Survey mafic rocks generally used as standards for low-level concentrations of residual or lithophilic trace elements are W -1, from the diabase at Centreville, Va., BCR-1 from the Columbia River Basalt Group, and BHV0-1, a Hawaiian basalt. The trace element contents of these three standards differ greatly from those of the ultramafic samples, peridotite PCC-1 and dunite DTS-1 (the Twin Sisters dunite; Ragan, 1963). Unfortunately, the supply of W-1 was exhausted in 1972, and supplies of BCR-1 and DTS-1 were so low that they were removed from the list
of available samples in late 1975. Because we needed not only to replace the mafic and ultramafic samples but also to provide trace element data in the compositional gap between mafic and ultramafic reference samples, we considered three gabbro samples that have been processed in the last decade.
The Mont-Royal Gabbro, MRG-1, was described by Perrault and others (1974); Abbey (1980) listed usable values for 38 trace elements, adding a question mark after data for 23 elements to indicate some uncertainty in the values. Perrault and others (1974) described the sample as an augite-olivine gabbro, but the sample appears not to be as petrologically important as other gabbros that have a greater geographic distribution.
Data for another gabbro, GOG-1 (Gruppo Ofioliti, Gabbro, 1), were published by Boy and Mazzucotelli (1976) and by Mazzucotelli and others (1976). Benedetti and others (1977) have summarized data for 10 major and minor oxides and for 17 trace elements as averages and standard deviations. Neither a description of the sample nor the location from which the sample was collected has been published. Sample GOG-1 is from a northern Appenine ophiolite sequence, the Bracco Massif (A. Mazzucotelli, written commun., 1980). Only limited analytical data, including those reported by Harris and others (1981), are available for this sample.
The third gabbro, USGS-GSM-1, is a sample of the San Marcos Gabbro (Miller, 1937) described by Larsen (1948). Most published data for GSM-1 appear in Harris and others (1981).
Thus, problems of some type are associated with all three gabbros. We therefore decided to recollect a large amount of the diabase at Centreville, which had been used by geochemists for three decades, and to collect large quantities of two other samples, which contained elemental concentrations similar to those in island-arc tholeiites, ocean-ridge basalts, and primitive continental tholeiites and hence could furnish two calibration points between the diabase at Centreville and the ultramafic rocks.
Introduction
DIABASE W-2
Diabase W -1 was a valuable reference sample until the supply was exhausted in 1972; it was decided to replace the sample with material from the same source. Eight hundred pounds (- 360 kg) of the rock was collected in late 1976 from the Bull Run (now Luck) Quarry on U.S. Route 29-211, about 3 mi (5 km) west-southwest of Centreville, Va. The sample was collected at the foot of the northeast wall of the quarry, about 650ft (200m) from Route 29-211. Care was taken to collect fresh material recently blasted from the wall of the quarry, avoiding any pieces that showed alteration products, such as chlorite, or small inclusions not part of the diabase.
Hand specimens of the rock for W -1 and for W -2, the present sample, are indistinguishable; the petrography of the rock was discussed by Chayes (1951). The entire lot of sample was processed and was numbered W -2. About 2500 1-oz (30-mL) bottles were filled for distribution; the rest of the powdered rock was stored in plastic bags placed inside cardboard boxes.
DOLERITE DNC-1
Another sample believed to be important because of the low levels of some lithophilic trace elements was one of the Triassic-Jurassic olivine-normative dolerites from North Carolina discussed by Ragland and others (1968). P. C. Ragland and J. R. Butler of the Department of Geology, University of North Carolina, Chapel Hill, collected and shipped about 500 lb (- 230 kg) of a homogeneous rock known locally as the Braggtown dolerite. The entire lot of sample was powdered, and the excess after filling 2500 bottles was stored in the same manner as the excess of W -2.
There may be a problem in the future for someone who wishes to duplicate this sample. J. R. Butler (written commun., 1980) noted that the Braggtown Quarry, the site of the sample, located immediately above the word Braggtown (78°53'45"W, 36°01 '55"N) in the southeast quarter of the Northwest Durham 7.5-min quadrangle (topographic), is on land owned by the State Museum of Life and Science. Since the material for DNC-1 was collected, the Museum has erected a fence around the quarry so that the enclosed area can be used as a natural habitat for bears.
ICELANDIC BASALT BIR-1
Shortly after the publication of "Reference samples for the earth sciences" (Flanagan, 1974), in which a primitive basalt standard was suggested, Karl Gronwold of the Nordic Volcanological Institute at
2 Three USGS Mafic Rock Reference Samples
Reykjavik volunteered to supply a basalt from Iceland; a sample of about 500 lb (- 230 kg) of a basalt was received and was processed as BIR-1. Gronwold furnished the following description of the sample:
"The chemical compositions of Icelandic basalts cover the range from typical abyssal tholeiites to alkali basalts. The sample was collected from that part of the chemical spectrum which is identical to abyssal tholeiites.
"The source of the sample is one of the interglacial lava flows often referred to as the Reykjavik dolerites. The sample locality is a low hill about 10 m above the surroundings at a height of 100 m a.s.l. [above sea level]. The site is about 12 km east of Reykjavik and 800 m from the main road.
"The Reykjavik dolerites are a group of lava flows most likely from shield volcanos dating from the youngest interglacial periods. The source crater for the sampled flow is buried by younger lavas. The rock is a coarsegrained olivine tholeiite, and the available data show that the individual flows are chemically heterogeneous.
"The sample was collected from three adjoining blocks found in situ within an area of 4m2
• The surface of the flow has been removed by glacial erosion. The large pieces of the sample were taken to the laboratory and were broken with a sledge hammer. The resulting pieces were trimmed and weathered surfaces were removed before shipment to the USGS."
After the rock was received by the USGS, I found that many pieces had to be broken by a small sledge hammer before they could fit between the plates of a jaw crusher. As with samples W-2 and DNC-1, all material shipped, except for a few hand specimens, was powdered, and the excess after filling 2500 bottles was stored.
SAMPLE PROCESSING
The supplies of samples DNC-1 and BIR-1 are expected to last about 30 years and the supply of W -2 somewhat longer because of the larger amount of rock. Because of the amount of analytical work that may be done over these anticipated lifetimes, extra precautions were introduced into the general procedure (Flanagan, 1967) for processing rock standards.
The primary contaminant of processed rock samples is free iron (Fe0
) from the jaw crusher. This can be introduced when the distance between the bottom edges of the crusher plates is set at the minimum (- 1/8 in., or 3 mm). If too much rock is added to the crusher, some partly crushed material will not pass between the bottom edges of the plates, and the addition of more rock will cause additional partly crushed material to accumulate above these edges. These partly crushed pieces will be scraped continuously by the plates until the material is released.
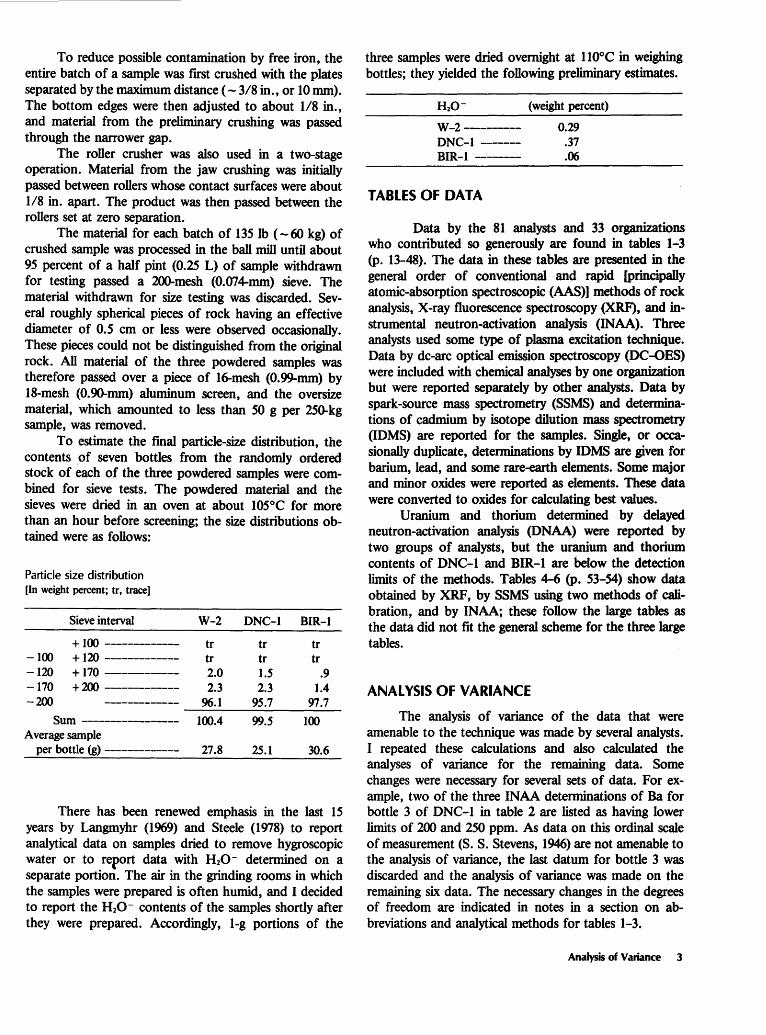
To reduce possible contamination by free iron, the entire batch of a sample was frrst crushed with the plates separated by the maximum distance (- 3/8 in., or 10 mm). The bottom edges were then adjusted to about 1/8 in., and material from the preliminary crushing was passed through the narrower gap.
The roller crusher was also used in a two-stage operation. Material from the jaw crushing was initially passed between rollers whose contact surfaces were about 1/8 in. apart. The product was then passed between the rollers set at zero separation.
The material for each batch of 135 lb ( -60 kg) of crushed sample was processed in the ball mill until about 95 percent of a half pint (0.25 L) of sample withdrawn for testing passed a 200-mesh (0.074-mm) sieve. The material withdrawn for size testing was discarded. Several roughly spherical pieces of rock having an effective diameter of 0.5 em or less were observed occasionally. These pieces could not be distinguished from the original rock. All material of the three powdered samples was therefore passed over a piece of 16-mesh (0.99-mm) by 18-mesh (0.90-mm) aluminum screen, and the oversize material, which amounted to less than 50 g per 250-kg sample, was removed.
To estimate the fmal particle-size distribution, the contents of seven bottles from the randomly ordered stock of each of the three powdered samples were combined for sieve tests. The powdered material and the sieves were dried in an oven at about 105°C for more than an hour before screening; the size distributions obtained were as follows:
Particle size distribution [In weight percent; tr, trace]
Sieve interval W-2 DNC-1 BIR-1
+ 100 ------------- tr tr tr -100 + 120 ------------- tr tr tr -120 +170 ------------- 2.0 1.5 .9 -170 + 200 ------------- 2.3 2.3 1.4 -200 ------------- 96.1 95.7 97.7
Sun1 ----------------- 100.4 99.5 100 Average sample
per bottle (g) ------------- 27.8 25.1 30.6
There has been renewed emphasis in the last 15 years by Langmyhr (1969) and Steele (1978) to report analytical data on samples dried to remove hygroscopic water or to report data with H20- determined on a separate portion. The air in the grinding rooms in which the samples were prepared is often humid, and I decided to report the H20- contents of the samples shortly after they were prepared. Accordingly, 1-g portions of the
three samples were dried overnight at ll0°C in weighing bottles; they yielded the following preliminary estimates.
(weight percent)
w -2 ----------DNC-1 ------BIR-1 --------
TABLES OF DATA
0.29 .37 .06
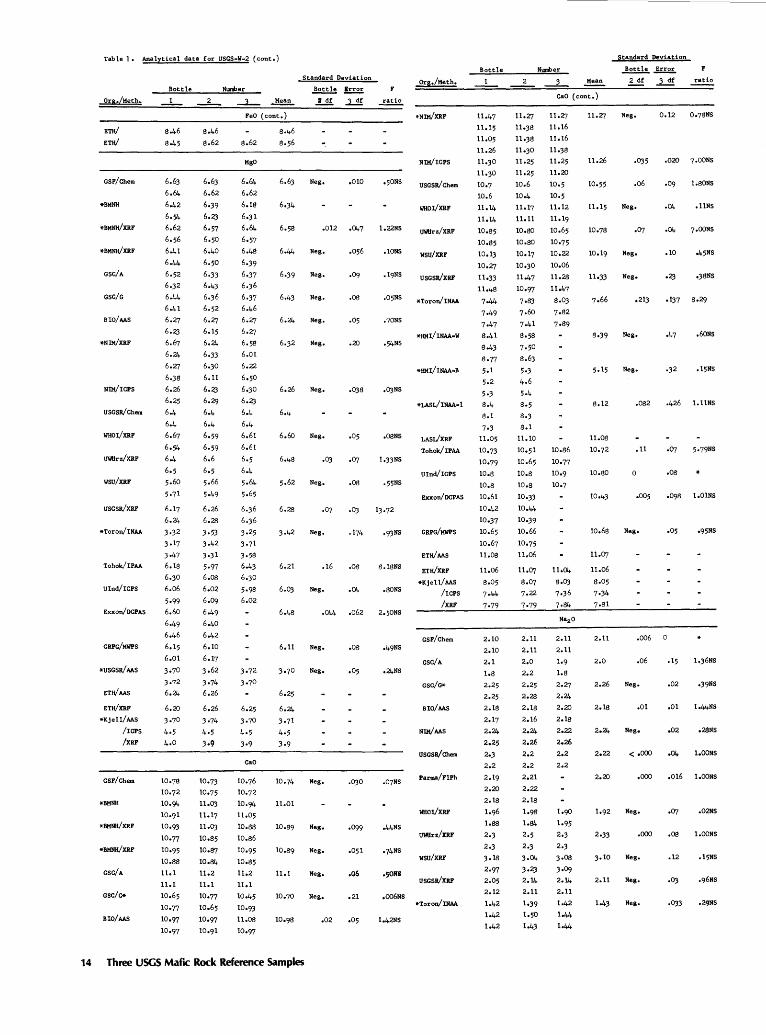
Data by the 81 analysts and 33 organizations who contributed so generously are found in tables 1-3 (p. 13-48). The data in these tables are presented in the general order of conventional and rapid [principally atomic-absorption spectroscopic (AAS)] methods of rock analysis, X-ray fluorescence spectroscopy (XRF), and instrumental neutron-activation analysis (INAA). Three analysts used some type of plasma excitation technique. Data by de-arc optical emission spectroscopy (DC-OES) were included with chemical analyses by one organization but were reported separately by other analysts. Data by spark -source mass spectrometry (SSMS) and determinations of cadmium by isotope dilution mass spectrometry (IDMS) are reported for the samples. Single, or occasionally duplicate, determinations by IDMS are given for barium, lead, and some rare-earth elements. Some major and minor oxides were reported as elements. These data were converted to oxides for calculating best values.
Uranium and thorium determined by delayed neutron-activation analysis (DNAA) were reported by two groups of analysts, but the uranium and thorium contents of DNC-1 and BIR-1 are below the detection limits of the methods. Tables 4-6 (p. 53-54) show data obtained by XRF, by SSMS using two methods of calibration, and by INAA; these follow the large tables as the data did not fit the general scheme for the three large tables.
ANALYSIS OF VARIANCE
The analysis of variance of the data that were amenable to the technique was made by several analysts. I repeated these calculations and also calculated the analyses of variance for the remaining data. Some changes were necessary for several sets of data. For example, two of the three INAA determinations of Ba for bottle 3 of DNC-1 in table 2 are listed as having lower limits of 200 and 250 ppm. As data on this ordinal scale of measurement (S. S. Stevens, 1946) are not amenable to the analysis of variance, the last datum for bottle 3 was discarded and the analysis of variance was made on the remaining six data. The necessary changes in the degrees of freedom are indicated in notes in a section on abbreviations and analytical methods for tables 1-3.
Analysis of Variance 3
One analyst reported three determinations of Ce on portions of three bottles of W -2 and each of the first determinations on the bottles is asterisked. The first determinations for bottles 1 and 3 obviously did not belong to the same population of data as the remaining data and were discarded. To achieve symmetry and maintain the simplicity of the analysis of variance, the frrst determination for the second bottle was also discarded and the calculations were made on the remaining six data.
One analyst formed a glass disc from two portions from each bottle of sample and counted the response of several elements or oxides from three exposures of each disc to X-rays. His data, therefore, had two variables of classification, the two bottles and the glass discs, and the error term in the analysis of variance is the error in the measurements of the discs.
One organization reported determinations by XRF on four portions from each of the three bottles of sample. This presented no problem in the analysis of variance because the abbreviation of the organization is asterisked to note the change in the degrees of freedom for error. However, rather than discard half the data when calculating best values, random numbers were used to determine which two of the four data for any bottle would be assigned to a first set of data and the remaining two data were assigned to the second set. Thus, two complete sets of data were available to be used for best values.
Some organizations reported fewer than the six determinations that would be required for the calculations of best values, and the averages of the five or fewer values were entered, followed by dashes for the standard deviations and the F ratio. Another organization reported the necessary six determinations, but three analysts made two determinations each. As the data lacked the necessary symmetry to sort out the effects of the three analysts, the average of the six data was entered and the six data were also used for best values.
The tabulation below for the three samples shows the number of sets of data for which a significant (S) or not significant (NS) F ratio was obtained when the calculated ratios were tested against the appropriate value for F'o.os·
W-2 DNC-1 BIR-1 Total
NS -------------------- 532 492 393 1417 No variation ----------- 10 17 20 47 No F test -------------- 20 14 13 47 s --------------------- 23 30 40 93
Total------------- 585 553 466 1604
Eighty eight percent (1417) of the calculated F ratios were found to be not significant (NS), and the constituent for
4 Three USGS Mafic Rock Reference Samples
each test may be said to be homogeneously distributed among the bottles of a sample; thus, the three samples are suitable for use as geochemical reference samples (GRS). The classification of "No variation" indicated that the determinations reported all had the same value and, therefore, a zero variance, whereas the classification of "No F test" indicates that a zero, or approximately zero, bottle or error standard deviation was obtained during the analysis of variance. For the latter classification, the calculation of an F ratio was impossible or inadvisable.
More than half of the 47 sets of data for which no variation was reported were for the minor oxides. Analysts might have reported the next uncertain digit in their data to prevent the occurrence of so many sample variances of zero. These zero variances tend to minimize the calculated homogeneous variances, which, in tum, may slightly inflate the Studentized ranges discussed in the next section.
CALCULATIONS OF BEST VALUES
Best values for the three samples were calculated in the same manner as those for the manganese nodule standards in U.S. Geological Survey Professional Paper 1155 (Flanagan and Gottfried, 1980). The method, briefly, is to fmd a homogeneous variance by Cochran's test and then to use the square root of this variance to Studentize the range of sets of means to determine which means belong to the same population. The method is briefly illustrated in example 1 of section 5.53 of Bennett and Franklin (1954).
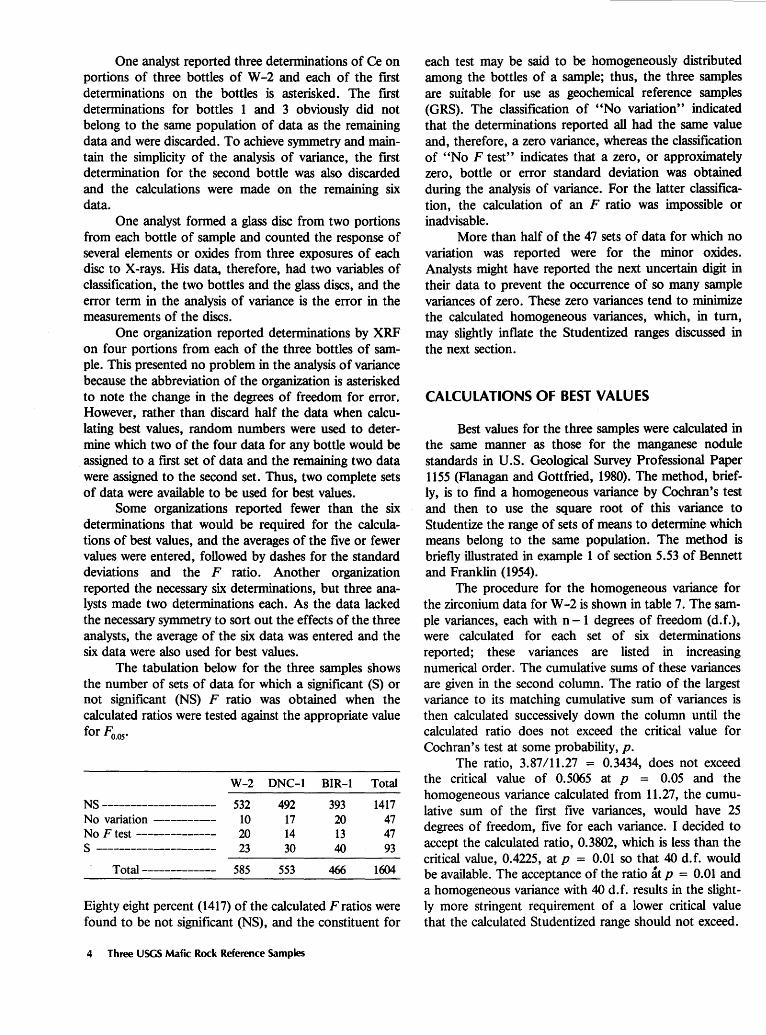
The procedure for the homogeneous variance for the zirconium data for W -2 is shown in table 7. The sample variances, each with n- 1 degrees of freedom (d. f.), were calculated for each set of six determinations reported; these variances are listed in increasing numerical order. The cumulative sums of these variances are given in the second column. The ratio of the largest variance to its matching cumulative sum of variances is then calculated successively down the column until the calculated ratio does not exceed the critical value for Cochran's test at some probability, p.
The ratio, 3.87/11.27 = 0.3434, does not exceed the critical value of 0.5065 at p = 0.05 and the homogeneous variance calculated from 11.27, the cumulative sum of the first five variances, would have 25 degrees of freedom, five for each variance. I decided to accept the calculated ratio, 0.3802, which is less than the critical value, 0.4225, at p = 0.01 so that 40 d. f. would be available. The acceptance of the ratio at p = 0.01 and a homogeneous variance with 40 d.f. results in the slightly more stringent requirement of a lower critical value that the calculated Studentized range should not exceed.
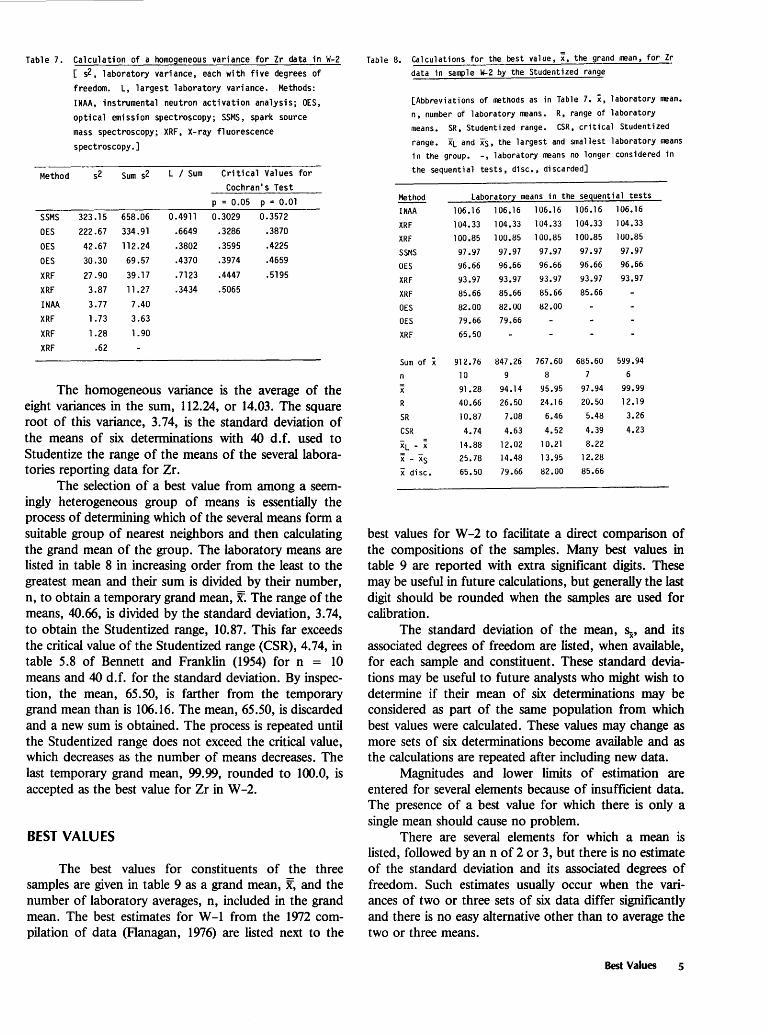
Table 7. Calculation of a homogeneous variance for Zr data in W-2
[ s2, 1 aboratory variance, each with five degrees of
freedom. L, largest laboratory variance. Methods:
INAA, instrumental neutron activation analysis; OES,
opti ca 1 emission spectroscopy; SSMS, spark source
mass spectroscopy; XRF, X- ray fluorescence
spectroscopy.]
Method s2 Sum s2 L I Sum Critical Values for
Cochran's Test
p = 0.05 p = 0.01
SSMS 323.15 658.06 0.4911 0.3029 0.3572
OES 222.67 334.91 .6649 .3286 .3870
OES 42.67 112.24 .3802 .3595 .4225
OES 30.30 69.57 .4370 .3974 .4659
XRF 27.90 39.17 . 7123 .4447 .5195
XRF 3.87 11.27 .3434 .5065
INAA 3.77 7.40
XRF 1.73 3.63
XRF 1.28 1.90
XRF .62
The homogeneous variance is the average of the eight variances in the sum, 112.24, or 14.03. The square root of this variance, 3. 74, is the standard deviation of the means of six determinations with 40 d.f. used to Studentize the range of the means of the several laboratories reporting data for Zr.
The selection of a best value from among a seemingly heterogeneous group of means is essentially the process of determining which of the several means form a suitable group of nearest neighbors and then calculating the grand mean of the group. The laboratory means are listed in table 8 in increasing order from the least to the greatest mean and their sum is divided by their number, n, to obtain a temporary grand mean, x. The range of the means, 40.66, is divided by the standard deviation, 3. 74, to obtain the Studentized range, 10.87. This far exceeds the critical value of the Studentized range (CSR), 4. 74, in table 5.8 of Bennett and Franklin (1954) for n = 10 means and 40 d.f. for the standard deviation. By inspection, the mean, 65.50, is farther from the temporary grand mean than is 106.16. The mean, 65.50, is discarded and a new sum is obtained. The process is repeated until the Studentized range does not exceed the critical value, which decreases as the number of means decreases. The last temporary grand mean, 99.99, rounded to 100.0, is accepted as the best value for Zr in W -2.
BEST VALUES
The best values for constituents of the three samples are given in table 9 as a grand mean, x, and the number of laboratory averages, n, included in the grand mean. The best estimates for W-I from the 1972 compilation of data (Flanagan, 1976) are listed next to the
Table 8. Calculations for the best value, x, the grand mean, for Zr
data in sample W-2 by the Studentized range
[Abbreviations of methods as in Table 7. x, laboratory mean.
n, number of laboratory means. R, range of laboratory
means. SR, Studentized range. CSR, critical Studentized
range. XL and xs, the largest and smallest laboratory means
in the group. -, laboratory means no longer considered in
the sequential tests, disc., discarded]
Method Laboratory means in the sequential tests
INAA 106.16 106.16 106.16 106.16 106.16
XRF 104.33 104.33 104.33 104.33 104.33
XRF 100.85 100.85 100.85 100.85 100.85
SSMS 97.97 97.97 97.97 97.97 97.97
OES 96.66 96.66 96.66 96.66 96.66
XRF 93.97 93.97 93.97 93.97 93.97
XRF 85.66 85.66 85.66 85.66
OES 82.00 82.00 82.00
OES 79.66 79.66
XRF 65.50
Sum of x 912.76 847.26 767.60 685.60 599.94
10 8 7 6
X 91.28 94.14 95.95 97.94 99.99
R 40.66 26.50 24.16 20.50 12.19
SR 10.87 7.08 6.46 5.48 3.26
CSR 4.74 4.63 4.52 4.39 4.23
XL - X 14.88 12.02 10.21 8.22
X - XS 25.78 14.48 13.95 12.28
x disc. 65.50 79.66 82.00 85.66
best values for W -2 to facilitate a direct comparison of the compositions of the samples. Many best values in table 9 are reported with extra significant digits. These may be useful in future calculations, but generally the last digit should be rounded when the samples are used for calibration.
The standard deviation of the mean, Sx' and its associated degrees of freedom are listed, when available, for each sample and constituent. These standard deviations may be useful to future analysts who might wish to determine if their mean of six determinations may be considered as part of the same population from which best values were calculated. These values may change as more sets of six determinations become available and as the calculations are repeated after including new data.
Magnitudes and lower limits of estimation are entered for several elements because of insufficient data. The presence of a best value for which there is only a single mean should cause no problem.
There are several elements for which a mean is listed, followed by ann of 2 or 3, but there is no estimate of the standard deviation and its associated degrees of freedom. Such estimates usually occur when the variances of two or three sets of six data differ significantly and there is no easy alternative other than to average the two or three means.
Best Values 5
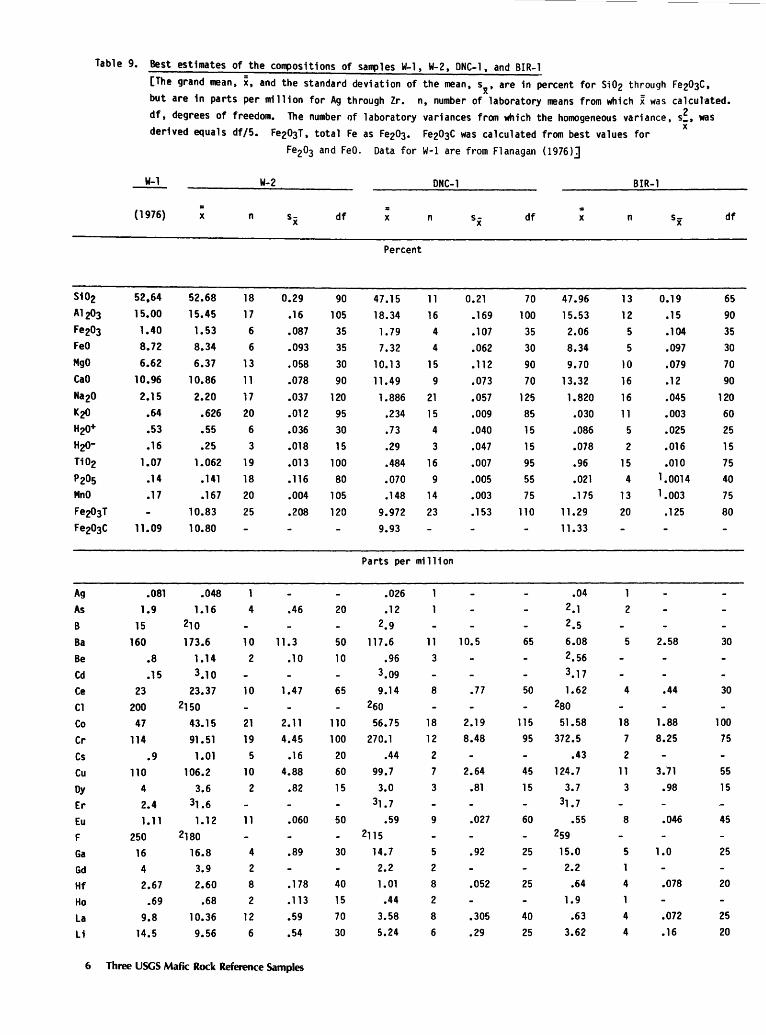
Table 9. Best estimates of the compositions of samples W-1, W-2, DNC-1, and BIR-1
Si02
A1~3
Fe203 FeO
MgO
CaO
Na20
K~
H2o+ H2ono2 P2o5 MnO
Fe203T
Fe203C
Ag
As
B
Ba Be
Cd Ce Cl
Co Cr
Cs Cu Dy
Er Eu F
Ga Gd Hf Ho La u
[The grand mean, x, and the standard deviation of the mean, sx, are in percent for Si02 through Fe203C,
but are in parts per million for Ag through Zr. n, number of laboratory means from which x was calculated.
df, degrees of freedom. The number of laboratory variances from which the homogeneous variance, s:, was X
derived equals df/5. Fe203T, total Fe as Fe203. Fe203C was calculated from best values for
W-1
(1976)
52.64 15.00 1.40 8.72
6.62
10.96
2.15
.64
.53
.16
1.07
.14
.17
11.09
.081 1.9
15 160
.8
.15
X
52.68
15.45
1.53 8.34
6.37
10.86
2.20
.626
.55
.25
1.062 .141
.167
10.83
10.80
.048
1.16 210
173.6
1.14 3.10
23 23.37 200 2150
47 43.15
114 91.51
.9 1.01
110 106.2 4 3.6 2.4 31 .6
1.11 1.12 250 2180 16 16.8 4 3.9 2.67 2.60 .69 .68
9.8 10.36 14.5 9.56
n
18 17
6
6
13
11
17 20
6
3
19 18 20
25
4
10 2
10
21 19
5
10 2
11
4
2
8
2
12 6
W-2
Fe203 and FeO. Data for W-1 are from Flanagan (1976)~
sx df
0.29 90
.16 105
.087 35
.093 35
.058 30
.078 90
.037 120
.012 95
.036 30
.018 15
.013 100
.116 80
.004 105
.208 120
X
Percent
47.15 18.34
1. 79 7.32
10.13
11.49
1.886 .234
.73
.29
.484
.070
.148
9.972
9.93
DNC-1
n
11
16 4 4
15
9
21 15 4
3
16 9
14
23
Parts per million
.46
11.3
.1 0
1.47
2.11 4.45
.16 4.88
.82
.060
.89
.178
.113
.59
.54
20
50 10
.026
.12 2.9
117.6 .96
3.09 65 9.14
260
110 56.75 100 270.1
20 .44 60 99.7
15 3.0 31.7
50 .59 2115
30 14.7 2.2
40 1.01 15 .44 70 3.58 30 5.24
11 3
8
18 12
2
7
3
9
5
2
8
2
8
6
sx
0.21 .169
.107
.062
.112
.073
.057
.009
.040
.047
.007
.005
.003
.153
10.5
.77
2.19 8.48
2.64 .81
.027
.92
.052
.305
.29
df
70
100 35
30
90 70
125 85
15 15
95 55
75
110
65
X
47.96
15.53 2.06 8.34
9.70 13.32
1.820 .030 .086
.078
.96
.021
.175
11.29
11.33
.04 2.1 2.5
6.08 2.56 3.17
50 1.62 28o
115 51.58 95 372.5
.43 45 124.7 15 3.7
31.7
60 .55 259
25 15.0 2.2
25 .64 1.9
40 .63 25 3.62
n
13
12 5
5
10 16
16 11
5
2
15 4
13 20
2
5
4
18 7
2
11 3
8
5
4
4
4
BIR-1
0.19 .15
.1 04
.097
.079
.12
.045
.003
.025
.016
.010 1.0014 1.003
.125
2.58
.44
1.88 8.25
3.71 .98
.046
1.0
.078
.072
.16
df
65
90 35 30
70
90
120 60 25
15 75 40 75
80
30
30
100 75
55 15
45
25
20
25 20
6 Three USGS Mafic Rock Reference Samples
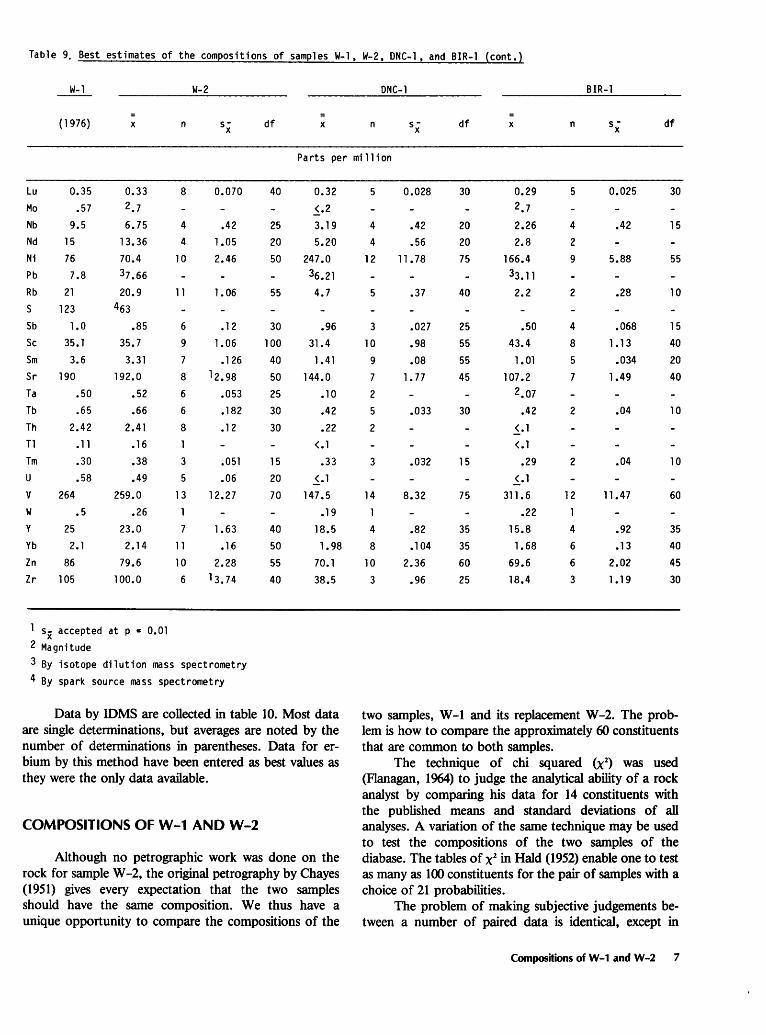
Table 9. Best estimates of the compositions of samples W-1, W-2, DNC-1, and BIR-1 (cont.)
W-1 W-2
( 1976) X n sx df X n
DNC-1
sx df X n
BIR-1
sx df
Parts per million
Lu 0.35
Mo .57
Nb 9.5
Nd 15
Ni 76
Pb 7.8
Rb 21
s 123
Sb 1.0
Sc 35.1
Sm 3.6
Sr 190
Ta .50
Tb .65
Th 2.42
T1 .11
Tm .30
u .58
v 264
w .5
y 25
Yb 2.1
Zn 86
Zr 105
0.33 2.7
6.75
13.36
70.4 37.66
20.9 463
.85
35.7
3.31
192.0
.52
.66
2.41
.16
.38
.49
259.0
.26
23.0
2.14
79.6
100.0
1 sx accepted at p = 0.01 2 Magnitude
8
4
4
10
11
6
9
7
8
6
6
8
1
3
5
13
1
7
11
10
6
0.070
.42
1.05
2.46
1.06
.12
1.06
.126 12.98
.053
.182
.12
.051
.06
12.27
1.63
.16
2.28 13.74
3 By isotope dilution mass spectrometry
4 By spark source mass spectrometry
40
25
20
50
55
30
100
40
50
25
30
30
15
20
70
40
50
55
40
0.32
~-2 3.19
5.20
247.0
36.21
4.7
.96
31.4
1.41
144.0
.10
.42
.22
< .1
.33
<.1 147.5
.19
18.5 1. 98
70.1
38.5
Data by IDMS are collected in table 10. Most data are single determinations, but averages are noted by the number of determinations in parentheses. Data for erbium by this method have been entered as best values as they were the only data available.
COMPOSITIONS OF W-1 AND W-2
Although no petrographic work was done on the rock for sample W -2, the original petrography by Chayes (1951) gives every expectation that the two samples should have the same composition. We thus have a unique opportunity to compare the compositions of the
5
4
4
12
5
3
10
9
7
2
5
2
3
14
4
8
10
3
0.028
.42
.56
11.78
.37
.027
.98
.08
1.77
.033
.032
8.32
.82
.1 04
2.36
.96
30
20
20
75
40
25
55
55
45
30
15
75
35
35
60
25
0.29 2.7
2.26
2.8
166.4
33.11
2.2
.50
43.4
1. 01
107.2 2.07
.42
< .1
<.1 .29
~.1
311.6
.22
15.8
1.68
69.6
18.4
5
4
2
9
2
4
8
5
7
2
2
12
1
4
6
6
3
0.025
.42
5.88
.28
.068
1.13
.034
1.49
.04
.04
11.47
.92
.13
2.02
1.19
30
15
55
10
15
40
20
40
10
10
60
35
40
45
30
two samples, W -1 and its replacement W -2. The problem is how to compare the approximately 60 constituents that are common to both samples.
The technique of chi squared (x2) was used
(Flanagan, 1964) to judge the analytical ability of a rock analyst by comparing his data for 14 constituents with the published means and standard deviations of all analyses. A variation of the same technique may be used to test the compositions of the two samples of the diabase. The tables of X2 in Hald (1952) enable one to test as many as 100 constituents for the pair of samples with a choice of 21 probabilities.
The problem of making subjective judgements between a number of paired data is identical, except in
Compositions of W-1 and W-2 7
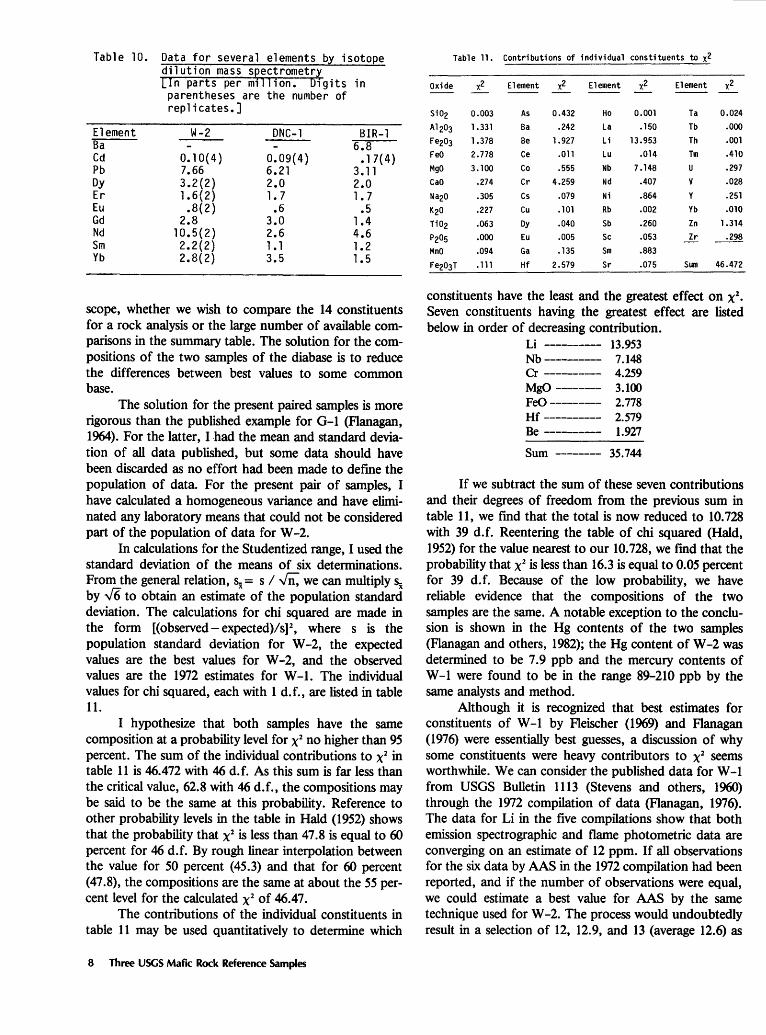
Table 10. Data for several elements by isotope dilution mass s~ectrometry [In parts per m1ll1on. D1gits in parentheses are the number of replicates.]
Element Ba Cd Pb Dy Er Eu Gd Nd Sm Yb
W-2
0.10(4) 7.66 3.2(2) 1.6(2) .8(2)
2.8 10.5(2) 2.2(2) 2.8(2)
DNC-1
0.09(4) 6.21 2.0 1. 7
.6 3.0 2.6 1 • 1 3.5
BIR-1 6.8
• 1 7( 4) 3.11 2.0 1.7
.5 1.4 4.6 1.2 1.5
scope, whether we wish to compare the 14 constituents for a rock analysis or the large number of available comparisons in the summary table. The solution for the compositions of the two samples of the diabase is to reduce the differences between best values to some common base.
The solution for the present paired samples is more rigorous than the published example for G-1 (Flanagan, 1964). For the latter, I had the mean and standard deviation of all data published, but some data should have been discarded as no effort had been made to defme the population of data. For the present pair of samples, I have calculated a homogeneous variance and have eliminated any laboratory means that could not be considered part of the population of data for W -2.
In calculations for the Studentized range, I used the standard deviation of the means of six determinations. From the general relation, 5x = s I Vll, we can multiply 5x by .J6 to obtain an estimate of the population standard deviation. The calculations for chi squared are made in the form [(observed- expected)/s)l, where s is the population standard deviation for W -2, the expected values are the best values for W -2, and the observed values are the 1972 estimates for W-1. The individual values for chi squared, each with 1 d. f., are listed in table 11.
I hypothesize that both samples have the same composition at a probability level for X2 no higher than 95 percent. The sum of the individual contributions to x2 in table 11 is 46.472 with 46 d. f. As this sum is far less than the critical value, 62.8 with 46 d.f., the compositions may be said to be the same at this probability. Reference to other probability levels in the table in Hald (1952) shows that the probability that X2 is less tban 47.8 is equal to 60 percent for 46 d.f. By rough linear interpolation between the value for 50 percent (45.3) and that for 60 percent (47.8), the compositions are the same at about the 55 percent level for the calculated X2 of 46.47.
The contributions of the individual constituents in table 11 may be used quantitatively to determine which
8 Three USGS Mafic Rock Reference Samples
Table 11. Contributions of individual constituents to x2
Oxide x2 Element x2 Element x2 Element x2
Si02 0.003 As 0.432 Ho 0.001 Ta 0.024
Al203 1.331 Ba .242 La .150 Tb .ooo Fe203 1.378 Be 1.927 Li 13.953 Th .001
FeO 2.778 Ce .011 Lu .014 Tm .410
MgO 3.100 Co .555 Nb 7.148 .297
cao .274 Cr 4.259 Nd .407 .028
Na20 .305 Cs .079 Ni .864 .251
K20 .227 Cu .101 Rb .002 Yb .010
Ti02 .063 Dy .040 Sb .260 Zn 1.314
P205 .000 Eu .005 Sc .053 _1:!. ~ MnO .094 Ga .135 Sm .883
Fe203T .111 Hf 2.579 Sr .075 Sum 46.472
constituents have the least and the greatest effect on X2•
Seven constituents having the greatest effect are listed below in order of decreasing contribution.
Li ---------- 13.953 Nb ---------- 7.148 Cr ---------- 4.259 MgO -------- 3.100 FeO --------- 2. 778 Hf ---------- 2.579 Be ---------- 1.927
Sum -------- 35.744
If we subtract the sum of these seven contributions and their degrees of freedom from the previous sum in table 11, we fmd that the total is now reduced to 10.728 with 39 d.f. Reentering the table of chi squared (Hald, 1952) for the value nearest to our 10.728, we fmd that the probability that X2 is less than 16.3 is equal to 0.05 percent for 39 d.f. Because of the low probability, we have reliable evidence that the compositions of the two samples are the same. A notable exception to the conclusion is shown in the Hg contents of the two samples (Flanagan and others, 1982); the Hg content of W -2 was determined to be 7.9 ppb and the mercury contents of W -1 were found to be in the range 89-210 ppb by the same analysts and method.
Although it is recognized that best estimates for constituents of W-1 by Fleischer (1969) and Flanagan ( 1976) were essentially best guesses, a discussion of why some constituents were heavy contributors to x2 seems worthwhile. We can consider the published data for W-1 from USGS Bulletin 1113 (Stevens and others, 1960) through the 1972 compilation of data (Flanagan, 1976). The data for Li in the five compilations show that both emission spectrographic and flame photometric data are converging on an estimate of 12 ppm. If all observations for the six data by AAS in the 1972 compilation had been reported, and if the number of observations were equal, we could estimate a best value for AAS by the same technique used for W -2. The process would undoubtedly result in a selection of 12, 12.9, and 13 (average 12.6) as
the group of nearest neighbors, rejecting the values of 17, 20, and 25 ppm. I can think of no reason why I should not have accepted the isotope dilution value of 12.6, the basis of the recommended value for Li from Bulletin 1113 through the 1969 compilation.
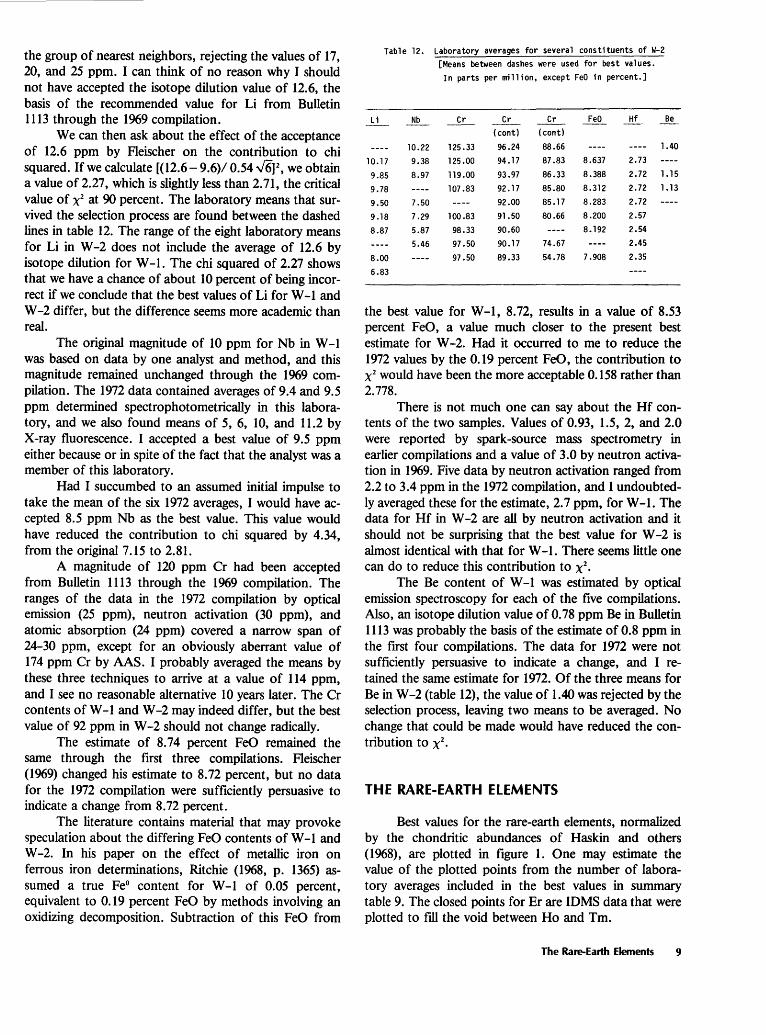
We can then ask about the effect of the acceptance of 12.6 ppm by Fleischer on the contribution to chi squared. If we calculate [(12.6- 9.6)/ 0.54 ..J6)2, we obtain a value of 2.27, which is slightly less than 2. 71, the critical value of X2 at 90 percent. The laboratory means that survived the selection process are found between the dashed lines in table 12. The range of the eight laboratory means for Li in W-2 does not include the average of 12.6 by isotope dilution for W -1. The chi squared of 2.27 shows that we have a chance of about 10 percent of being incorrect if we conclude that the best values of Li for W -1 and W-2 differ, but the difference seems more academic than real.
The original magnitude of 10 ppm for Nb in W-1 was based on data by one analyst and method, and this magnitude remained unchanged through the 1969 compilation. The 1972 data contained averages of 9.4 and 9.5 ppm determined spectrophotometrically in this laboratory, and we also found means of 5, 6, 10, and 11.2 by X-ray fluorescence. I accepted a best value of 9.5 ppm either because or in spite of the fact that the analyst was a member of this laboratory.
Had I succumbed to an assumed initial impulse to take the mean of the six 1972 averages, I would have accepted 8.5 ppm Nb as the best value. This value would have reduced the contribution to chi squared by 4.34, from the original 7.15 to 2.81.
A magnitude of 120 ppm Cr had been accepted from Bulletin 1113 through the 1969 compilation. The ranges of the data in the 1972 compilation by optical emission (25 ppm), neutron activation (30 ppm), and atomic absorption (24 ppm) covered a narrow span of 24-30 ppm, except for an obviously aberrant value of 174 ppm Cr by AAS. I probably averaged the means by these three techniques to arrive at a value of 114 ppm, and I see no reasonable alternative 10 years later. The Cr contents of W -1 and W -2 may indeed differ, but the best value of 92 ppm in W-2 should not change radically.
The estimate of 8. 74 percent FeO remained the same through the first three compilations. Fleischer (1969) changed his estimate to 8. 72 percent, but no data for the 1972 compilation were sufficiently persuasive to indicate a change from 8. 72 percent.
The literature contains material that may provoke speculation about the differing FeO contents of W -1 and W -2. In his paper on the effect of metallic iron on ferrous iron determinations, Ritchie (1968, p. 1365) assumed a true Fe0 content for W -1 of 0.05 percent, equivalent to 0.19 percent FeO by methods involving an oxidizing decomposition. Subtraction of this FeO from
Table 12. Laboratory averages for several constituents of W-2
[Means between dashes were used for best values.
In parts per million, except FeO in percent.]
Li Nb ~ ~ Cr _£!Q_ Hf Be
(cont) (cont)
10.22 125.33 96.24 88.66 1.40
10.17 9.38 125.00 94.17 87.83 8.637 2.73
9.85 8.97 119.00 93.97 86.33 8.388 2.72 1.15
9.78 107.83 92.17 85.80 8.312 2.72 1.13
9.50 7.50 92.00 85.17 8.283 2.72
9.18 7.29 100.83 91.50 80.66 8.200 2.57
8.87 5.87 98.33 90.60 8.192 2.54
5.46 97.50 90.17 74.67 2.45
8.00 97.50 89.33 54.78 7.908 2.35
6.83
the best value for W -1, 8. 72, results in a value of 8.53 percent FeO, a value much closer to the present best estimate for W -2. Had it occurred to me to reduce the 1972 values by the 0.19 percent FeO, the contribution to X2 would have been the more acceptable 0.158 rather than 2.778.
There is not much one can say about the Hf contents of the two samples. Values of 0.93, 1.5, 2, and 2.0 were reported by spark -source mass spectrometry in earlier compilations and a value of 3.0 by neutron activation in 1969. Five data by neutron activation ranged from 2.2 to 3.4 ppm in the 1972 compilation, and I undoubtedly averaged these for the estimate, 2. 7 ppm, for W -1. The data for Hf in W -2 are all by neutron activation and it should not be surprising that the best value for W -2 is almost identical with that for W -1. There seems little one can do to reduce this contribution to X2
•
The Be content of W -1 was estimated by optical emission spectroscopy for each of the five compilations. Also, an isotope dilution value of 0. 78 ppm Be in Bulletin 1113 was probably the basis of the estimate of 0.8 ppm in the first four compilations. The data for 1972 were not sufficiently persuasive to indicate a change, and I retained the same estimate for 1972. Of the three means for Be in W -2 (table 12), the value of 1.40 was rejected by the selection process, leaving two means to be averaged. No change that could be made would have reduced the contribution to X2
•
THE RARE-EARTH ELEMENTS
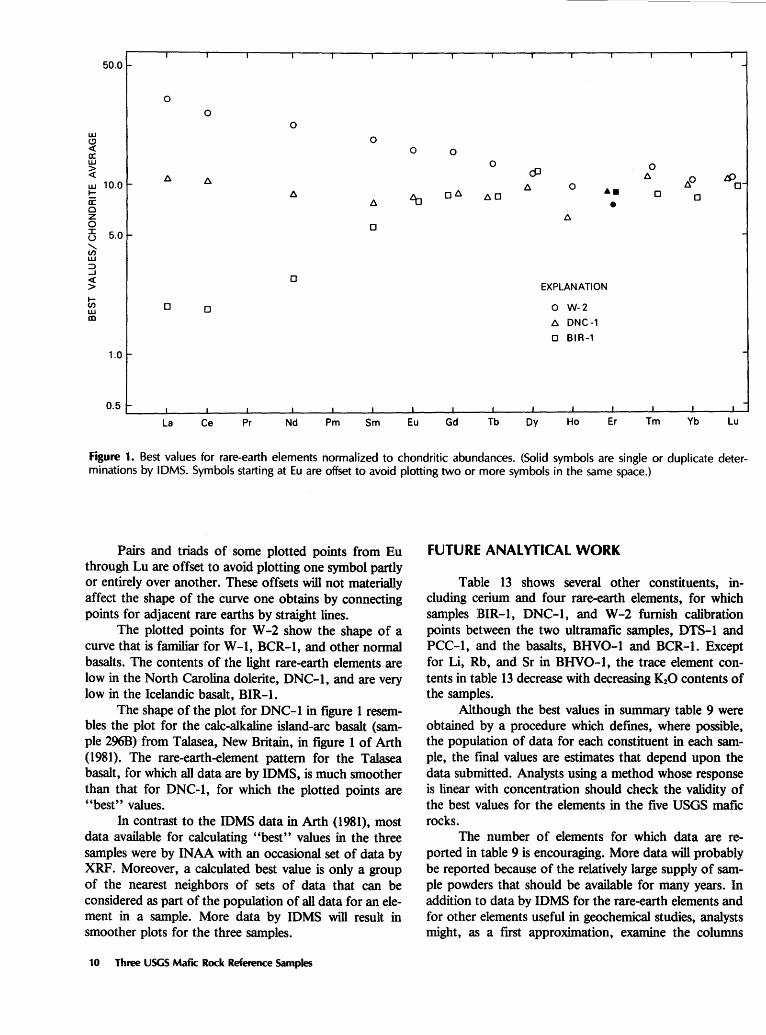
Best values for the rare-earth elements, normalized by the chondritic abundances of Haskin and others (1968), are plotted in figure 1. One may estimate the value of the plotted points from the number of laboratory averages included in the best values in summary table 9. The closed points for Er are IDMS data that were plotted to fill the void between Ho and Tm.
The Rare-Earth Elements 9
I I I I I I I I I 1 1 I I I I
50.0- -
0
0 0
w 0 (.!)
4: 0 0 ex: w 0 0 > dJ <( l::J. l::J.
l::J.o 6)0_ w 10.0 ~ l::J. 0 r-
Lb ol:J. !:J.O •• 0 0 a: l::J. • 0 z l::J. 0 0 J: 5.0 ~ -u ........ (f) w ::) ....J 4: 0 > EXPLANATION r-(/) 0 0 0 W-2 w m
1::J. DNC-1
0 BIR-1
1.0 ~ -
0.5L----~t---~·--~·-----~·---~·---~·--~·----~·----~·----~·----~·----~·----~·----~·----~·~~-La Ce Pr Nd Pm Sm Eu Gd Tb Dy Ho Er Tm Yb Lu
Figure 1. Best values for rare-earth elements normalized to chondritic abundances. (Solid symbols are single or duplicate determinations by IDMS. Symbols starting at Eu are offset to avoid plotting two or more symbols in the same space.)
Pairs and triads of some plotted points from Eu through Lu are offset to avoid plotting one symbol partly or entirely over another. These offsets will not materially affect the shape of the curve one obtains by connecting points for adjacent rare earths by straight lines.
The plotted points for W -2 show the shape of a curve that is familiar for W-1, BCR-1, and other normal basalts. The contents of the light rare-earth elements are low in the North Carolina dolerite, DNC-1, and are very low in the Icelandic basalt, BIR-1.
The shape of the plot for DNC-1 in figure 1 resembles the plot for the calc-alkaline island-arc basalt (sample 296B) from Talasea, New Britain, in figure 1 of Arth (1981). The rare-earth-element pattern for the Talasea basalt, for which all data are by IDMS, is much smoother than that for DNC-1, for which the plotted points are "best" values.
In contrast to the IDMS data in Arth (1981), most data available for calculating "best" values in the three samples were by INAA with an occasional set of data by XRF. Moreover, a calculated best value is only a group of the nearest neighbors of sets of data that can be considered as part of the population of all data for an element in a sample. More data by IDMS will result in smoother plots for the three samples.
10 Three USGS Mafic Rock Reference Samples
FUTURE ANALYTICAL WORK
Table 13 shows several other constituents, including cerium and four rare-earth elements, for which samples lBIR-1, DNC-1, and W-2 furnish calibration points between the two ultramafic samples, DTS-1 and PCC-1, and the basalts, BHV0-1 and BCR-1. Except for Li, Rb, and Sr in BHV0-1, the trace element contents in table 13 decrease with decreasing K20 contents of the samples.
Although the best values in summary table 9 were obtained by a procedure which defmes, where possible, the population of data for each constituent in each sample, the fmal values are estimates that depend upon the data submitted. Analysts using a method whose response is linear with concentration should check the validity of the best values for the elements in the five USGS mafic rocks.
The number of elements for which data are reported in table 9 is encouraging. More data will probably be reported because of the relatively large supply of sample powders that should be available for many years. In addition to data by IDMS for the rare-earth elements and for other elements useful in geochemical studies, analysts might, as a frrst approximation, examine the columns
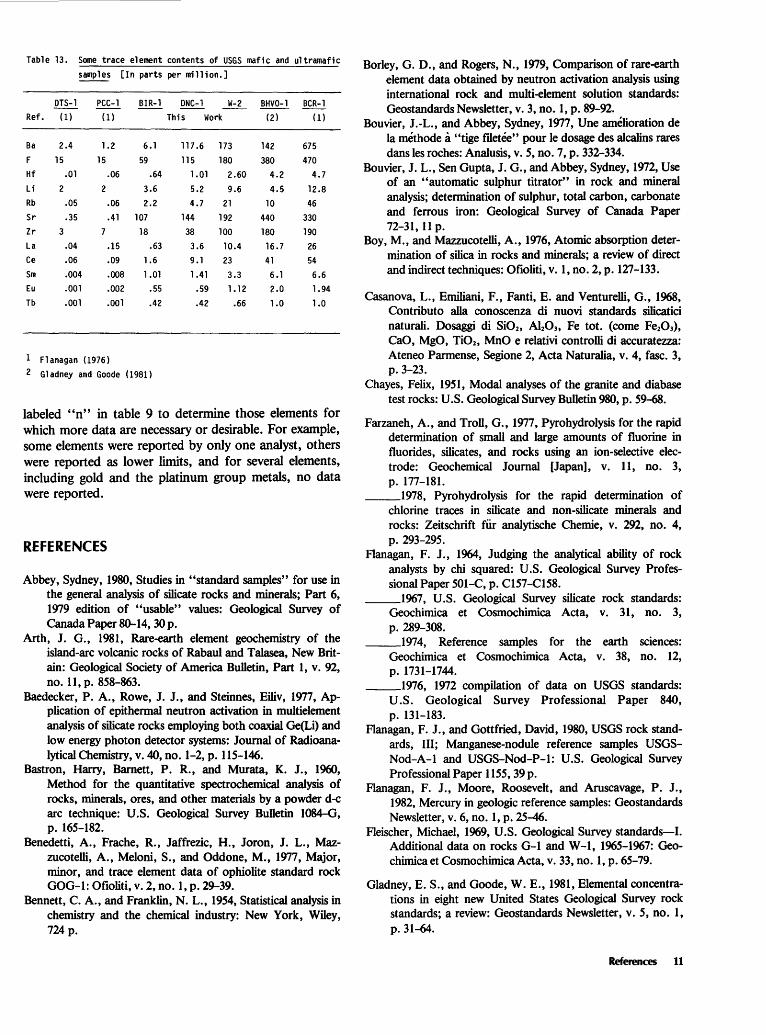
Table 13. Some trace element contents of USGS mafic and ultramafic
samples [In parts per million.]
DTS-1 PCC-1 BIR-1 ONC-1 W-2 BHV0-1 BCR-1
Ref. (1} (1) This Work (2) ( 1)
Ba 2.4 1.2 6.1 117.6 173 142 675
F 15 15 59 115 180 380 470
Hf .01 .06 .64 1.01 2.60 4.2 4.7
L i 2 2 3.6 5.2 9.6 4.5 12.8
Rb .05 .06 2.2 4.7 21 10 46
Sr .35 .41 107 144 192 440 330
Zr 3 18 38 100 180 190
La .04 .15 .63 3.6 10.4 16.7 26
Ce .06 .09 1.6 9.1 23 41 54
Sm .004 .008 1.01 1.41 3.3 6.1 6.6
Eu .001 .002 .55 .59 1.12 2.0 1.94
Tb .001 .001 .42 .42 .66 1.0 1.0
1 Flanagan ( 1976)
2 Gladney and Goode (1981)
labeled "n" in table 9 to determine those elements for which more data are necessary or desirable. For example, some elements were reported by only one analyst, others were reported as lower limits, and for several elements, including gold and the platinum group metals, no data were reported.
REFERENCES
Abbey, Sydney, 1980, Studies in "standard samples" for use in the general analysis of silicate rocks and minerals; Part 6, 1979 edition of "usable" values: Geological Survey of Canada Paper 80-14, 30 p.
Arth, J. G., 1981, Rare-earth element geochemistry of the island-arc volcanic rocks of Rabaul and Talasea, New Britain: Geological Society of America Bulletin, Part 1, v. 92, no. 11, p. 858-863.
Baedecker, P. A., Rowe, J. J., and Steinnes, Eiliv, 1977, Application of epithermal neutron activation in multielement analysis of silicate rocks employing both coaxial Ge(Li) and low energy photon detector systems: Journal of Radioanalytical Chemistry, v. 40, no. 1-2, p. 115-146.
Bastron, Harry, Barnett, P. R., and Murata, K. J., 1960, Method for the quantitative spectrochemical analysis of rocks, minerals, ores, and other materials by a powder d-e arc technique: U.S. Geological Survey Bulletin 1084-G, p. 165-182.
:Benedetti, A., Frache, R., Jaffrezic, H., Joron, J. L., Mazzucotelli, A., Meloni, S., and Oddone, M., 1977, Major, minor, and trace element data of ophiolite standard rock GOG-1: Ofioliti, v. 2, no. 1, p. 29-39.
Bennett, C. A., and Franklin, N. L., 1954, Statistical analysis in chemistry and the chemical industry: New York, Wiley, 724 p.
Borley, G. D., and Rogers, N., 1979, Comparison of rare-earth element data obtained by neutron activation analysis using international rock and multi-element solution standards: Geostandards Newsletter, v. 3, no. 1, p. 89-92.
Bouvier, J.-L., and Abbey, Sydney, 1977, Une amelioration de Ia methode a "tige fdetee" pour le dosage des alcalins rares dans les roches: Analusis, v. 5, no. 7, p. 332-334.
Bouvier, J. L., Sen Gupta, J. G., and Abbey, Sydney, 1972, Use of an "automatic sulphur titrator" in rock and mineral analysis; determination of sulphur, total carbon, carbonate and ferrous iron: Geological Survey of Canada Paper 72-31, 11 p.
Boy, M., and Mazzucotelli, A., 1976, Atomic absorption determination of silica in rocks and minerals; a review of direct and indirect techniques: Ofioliti, v. 1, no. 2, p. 127-133.
Casanova, L., Emiliani, F., Fanti, E. and Venturelli, G., 1968, Contributo alia conoscenza di nuovi standards silicatici naturali. Dosaggi di Si02, Al203t Fe tot. (come Fe203), CaO, MgO, Ti02, MnO e relativi controlli di accuratezza: Ateneo Parmense, Segione 2, Acta Naturalia, v. 4, fasc. 3, p. 3-23.
Chayes, Felix, 1951, Modal analyses of the granite and diabase test rocks: U.S. Geological Survey Bulletin 980, p. 59-68.
Farzaneh, A., and Troll, G., 1977, Pyrohydrolysis for the rapid determination of small and large amounts of fluorine in fluorides, silicates, and rocks using an ion-selective electrode: Geochemical Journal [Japan], v. 11, no. 3, p. 177-181.
__ 1978, Pyrohydrolysis for the rapid determination of chlorine traces in silicate and non-silicate minerals and rocks: Zeitschrift fiir analytische Chemie, v. 292, no. 4, p. 293-295.
Flanagan, F. J., 1964, Judging the analytical ability of rock analysts by chi squared: U.S. Geological Survey Professional Paper 501-C, p. Cl57-Cl58.
__ 1967, U.S. Geological Survey silicate rock standards: Geochimica et Cosmochimica Acta, v. 31, no. 3, p. 289-308.
__ 1974, Reference samples for the earth sciences: Geochimica et Cosmochimica Acta, v. 38, no. 12, p. 1731-1744.
__ 1976, 1972 compilation of data on USGS standards: U.S. Geological Survey Professional Paper 840, p. 131-183.
Flanagan, F. J., and Gottfried, David, 1980, USGS rock standards, III; Manganese-nodule reference samples USGSNod-A-l and USGS-Nod-P-1: U.S. Geological Survey Professional Paper 1155, 39 p.
Flanagan, F. J., Moore, Roosevelt, and Aruscavage, P. J., 1982, Mercury in geologic reference samples: Geostandards Newsletter, v. 6, no. 1, p. 25-46.
Fleischer, Michael, 1969, U.S. Geological Survey standards-!. Additional data on rocks G-1 and W -1, 1965-1967: Geochimicaet CosmochimicaActa, v. 33, no. 1, p. 65-79.
Gladney, E. S., and Goode, W. E., 1981, Elemental concentrations in eight new United States Geological Survey rock standards; a review: Geostandards Newsletter, v. 5, no. 1, p. 31-64.
References 11
Govindaraju, Kuppusami, Mevelle, Guy, and Chouard, Charles, 1976, Automated optical emission spectrochemical bulk analysis of silicate rocks with microwave plasma excitation: Analytical Chemistry, v. 48, no. 9, p. 1325-1331.
Hald, Anders, 1952, Statistical tables and formulas: New York, Wiley, 97p.
Hancock, R. G. V., 1976, Low flux multielement instrumental neutron activation analysis in archaeometry: Analytical Chemistry, v. 48, no. 11, p. 1443-1445.
Harris, J. L., Schwarz, L. J., D'Angelo, W. M., and Flanagan, F. J., 1981, Additional analytical data for gabbro, GOG-1: Geostandards Newsletter, v. 5, no. 2, p. 125-128.
Haskin, L. A., Haskin, M. A., Frey, F. A., and Wildeman, T. R., 1968, Relative and absolute terrestrial abundances of the rare earths, in Ahrens, L. H., ed., Origin and distribution of the elements: New York, Pergamon, p. 889-912.
Hooper, P. R., and Atkins, Lynne, 1969, The preparation of fused samples in X-ray fluorescence analysis: Mineralogical Magazine, v. 37, no. 287, p. 409-413.
Kato, Toyoaki, Sato, Nobuyoshi, and Suzuki, Nobuo, 1977, Multielement analysis of deep-sea sediments by photon activation: Chemical Society of Japan Bulletin, v. 50, no. 8, p. 1930-1933.
Langmyhr, F. J., 1969, The reporting of analytical results for reference minerals and rocks: Geochimica et CosmochimicaActa, v. 33, no. 12, p. 1561-1562.
Larsen, E. S., Jr., 1948, Batholith and associated rocks of Corona, Elsinore, and San Luis Rey quadrangles, southern California: Geological Society of America Memoir 29, 182 p.
Leake, B. E., and others, 1969, The chemical analysis of rock powders by automatic X-ray fluorescence: Chemical Geology,v.5,no. 1,p. 7-86.
Ledger, E. B., Tieh, T. T., and Rowe, M. W., 1980, Delayedneutron activation determination of uranium in thirteen French rock reference samples: Geostandards Newsletter, v. 4, no. 2, p. 5-8.
Masumoto, Kazuyoshi, Kato, Toyoaki, and Suzuki, Nobuo, 1978, Activation yield curves of photonuclear reactions for multielement photon activation analysis: Nuclear Instruments and Methods, v. 157, no. 3, p. 567-577.
Maxwell, J. A., 1968, Rock and mineral analysis: New York, Wiley Interscience, 584 p.
Mazzucotelli, Ambrogio, Frache, Roberto, Dadone, Arduino, and Baffi, Franca, 1976, Ion-exchange separation and atomic absorption determination of fifteen major, minor, and trace elements in silicates: Talanta, v. 23, no. 11-12, p. 879-882.
Millard, H. T., Jr., 1976, Determination of uranium and thorium in USGS standard rocks by the delayed neutron technique: U.S. Geological Survey Professional Paper 840, p. 61-65.
Miller, F. S., 1937, Petrology of the San Marcos Gabbro, Southern California: Geological Society of America Bulletin, v. 48, no. 10, p. 1397-1425.
12 Three USGS Mafic Rock Reference Samples
Norrish, K., and Hutton, J. T., 1969, An accurate X-ray spectrographic method for the analysis of a wide range of geological samples: Geochimica et Cosmochimica Acta, v. 33, no. 4, p. 431-453.
Perrault, G., Hebert, P., and Kubat, V., 1974, MRG-1: un nouveau materiau de reference de gabbro a pyroxene et olivine duMont-Royal, P. Q., Canada: Canadian Journal of Spectroscopy, v. 19, no. 2, p. 63-67.
Quintin, M., Martin, A., and de Kersabiec, A. M., 1978, Analyse de 47 echantillons geochimiques de reference par fluorescence-X (Cu, Ga, Ni, Zn) et par absorption atomique (Cu, Ni, Zn): Geostandards Newsletter, v. 2, no. 2, p. 199-209.
Ragan, D. M., 1963, Emplacement of the Twin Sisters Dunite, Washington: American Journal of Science, v. 261, no. 6, p. 549-565.
Ragland, P. C., Rogers, J. J. W., and Justus, P. S., 1968, Origin and differentiation of Triassic dolerite magmas, North Carolina, USA: Contributions to Mineralogy and Petrology, v. 20, no. 1, p. 57-80.
Rantala, R. T. T., and Loring, D. H., 1973, New low-cost Teflon decomposition vessel: Atomic Absorption Newsletter, v. 12, p. 97-99.
___ 1975, Multi-element analysis of silicate rocks and marine sediments by atomic absorption spectrophotometry: Atomic Absorption Newsletter, v. 14, p. 117-120.
Ritchie, J. A., 1968, Effect of metallic iron from grinding on ferrous iron determinations: Geochimica et Cosmochimica Acta, v. 32, no. 12, p. 1363-1366.
Rose, H. J., Jr., Adler, Isidore, and Flanagan, F. J., 1963, X-ray fluorescence analysis of the light elements in rocks and minerals: Applied Spectroscopy, v. 17, no. 4, p. 81-85.
Rosman, K. J. R., and de Laeter, J. R., 1980, Mass spectrometric isotope dilution determination of cadmium in geochemical reference samples: Geostandards Newsletter, v. 4, no. 1, p. 1-3.
Shapiro, Leonard, 1975, Rapid analysis of silicate, carbonate, and phosphate rocks-Revised edition: U.S. Geological Survey Bulletin 1401, 76 p.
Shapiro, Leonard, and Brannock, W. W., 1962, Rapid analysis of silicate, carbonate, and phosphate rocks: U.S. Geological Survey Bulletin 1144-A, 56 p.
Steele, T. W., 1978, A guide to the reporting of analytical results relating to the certification of geological reference materials: Geostandards Newsletter, v. 2, no. 1, p. 31-33.
Stevens, R. E., and others, 1960, Second report on a cooperative investigation of the composition of two silicate rocks: U.S. Geological Survey Bulletin 1113, 126 p.
Stevens, S. S., 1946, On the theory of scales of measurement: Science, v. 103, no. 2684, p. 677-680.
Voldet, P., and Haerdi, W., 1978, Determination of rare-earth elements in rocks by neutron activation followed by highresolution X-ray spectrometry or -y-spectrometry: Analytica Chimica Acta, v. 97, no. 1, p. 185-189.
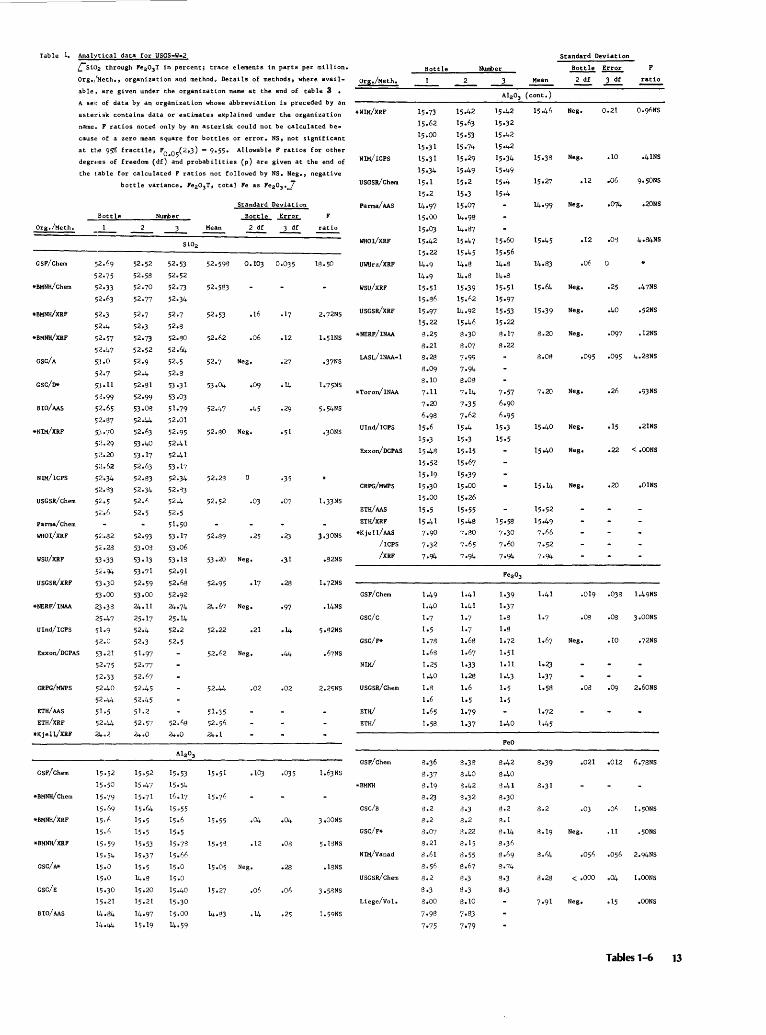
Table 1, Anabtical data for USGS·W-2 Standard Deviation
["sw2 through Fe203T in percent; trace elements in parts per million. Bottle Nunber ~~ F
Org./Meth., organization and method, Details of methods, where avail- Org./Heth, Mean 2 df 3 df ratio
able, are given under the organization name at the end of table 3 • ..;;;:====---===:......-===-__;=.::Al.::2;..03_(.::co=n=t=,)=--...:::::::::.......:::::::::_.....::::::::~ A se1: of data by an organization whose abbreviation is preceded by an
Org./Meth.
GSF/Chem
*BMNH/Chem
*BMNH/XRF
GSC/A
GSC/D*
BIO/AAS
NIM/ICPS
USGSR/Chem
Parma/Chem
WHOI/XRF
wsu/xRF
USGSR/XRF
*NERF/INAA
Ulnd/ICPS
astedsk contains data or estimates explained under the organization
name .. F ratios noted only by an asterisk could not be calculated be
causE! of a zero mean square for bottles or error, NS, not significant
at the 9'5% fractile, F0 ,05
(2,3) = 9·55• Allowable F ratios for other
degnes of freedom (df) and probabilities (p) are given at the end of
the table for calculated F ratios not followed by NS, Neg., negative
Bottle
52.69
52·75
52•33
52.6)
52·3
52·4
52·57
52·47
5:J•O
52·7
5:l·ll
s:2.99 s:<.6s s:~.s7
5:!.70
5:!.29
5:!.20
5:!.62
5:~.34
s:~.~
5;!.5
s::,6
bottle variance, Fe2 o3 r, total Fe as Fe2 o3 .J
Nunber
Mean
Standard Deviation
~Error
2 df 3 df
52·53 52·598 0.10) 0.0)5
52.52
52·73 52.583
52.)4
52·7 52·53 .16 .17
52.8
52.62 .o6 .12
52•7 Neg, .27
53·04 .09
52·47 ·45 ·29
52.'30 Neg.
52.2'3 ·35
52.52 .03
52.89 .25 ·23
53.20 Neg. .J.l
52·95 .17
24.67 Neg. ·97
52.22 .21
ratio
lo51NS
·37NS
5·54NS
.)ONS
1.3)NS
),JONS
,82NS
l,72NS
.14NS
5.82NS
Exxon/DCPAS 52.62 Neg,
CRPG/HWPS
ETH/AAS
ETH/XRF
*Kjell/XRF
csF/Chem
*BMNH/Chem
*BMNH/XRF
GSC/A*
GSC/E
BIO/AAS
52.~ .02
.10)
15·55 .04
l5o58 .12
15.05 Neg,
15.27 .06
.02 2.25NS
·035 1,63NS
.04 3 ,OONS
.08 5.l8NS
.28 ,l8NS
.06 3 o58NS
.25 1.5oNs
NIM/ICPS
USGSR/Chem
Parma/AAS
WHOI/XRF
UWIIrz/XRF
wsu/XRF
USGSR/XRF
LASL/INAA•l
*Toron/INAA
Ulnd/ICPS
Exxon/DCPAS
CRPG/HWPS
ETH/AAS
ETH/XRF
*Kjelt/AAS
/reps /XRF
GSF/Chem
GSC/C
GSC/F*
NIM/
uscsR/Chem
ETH/
ETH/
GSF/Chem
GSC/B
GSC/F*
NIM/Vanad
USGSR/Chem
Liege/Vol.
Neg. 0.21
Neg. .10 .41NS
.12 .06 9•50NS
Neg. ·074 .20NS
15o45 .12 4o84NS
14.8) .06
15.64 Neg. .25 .47NS
15•39 Neg. o52NS
8.20 Neg. .097 , 12NS
8.08 .095 .095 4.28NS
Neg, ,26 •9JNS
Neg. ,15 ,21NS
Neg, .22 < ,OONS
Neg, .20 ,01NS
l5o52
15·58 15.49
7·30 7.66
7·r,o 7·52
7·94 7·94
1·39
lo37
1.8
1.8
1o72
lo5l
1.11
1o43
lo5
1o5
1.40
FeO
1.2)
1.)7
1.58
8o)9
8.31
,08 .08 3 ,OONS
Neg, .10 o72NS
.oa ·09 2.6oNs
,021 ,012 6.78NS
8.2 .0) ,Q6 l.50NS
8.19 Neg, .11 .50NS
8,28 < .000 .04 l,OONS
7•91 Neg, .15 ,OONS
Tables 1-6 13
Table]. Analytical data for USGS-W-2 (cont.)
Ors./Meth.
ETH/ ETJI/
GSF/Chem
*BMNII
GSC/A
GSC/G
BIO/AAS
NIM/ICPS
USGSR/Chem
WHOI/XRF
Ullllrz/XRF
wsu/XRF
USGSR/XRF
*Toron/INAA
Tohok/IPAA
Ulnd/ICPS
Exxon/DCPAS
CRPG/MWPS
*USGSR/AAS
ETJI/AAS
ETJI/XRF
*Kje11/AAS
/I CPs
/XRF
GSF/Chem
*BMNII
*BMNII/XRF
GSC/A
GSC/G*
BIO/AAS
Standard Deviation
----~Bo-t~t~le~ ____ _.N~wW~e-r_____ ~ ~
6.63
6.62
6o39
6.2)
6-57
6.50
6.40
6.50
6.33
6.43
6.36
6.52
6.27
6.15
6.24
6o33
6.30
6.11
6.2)
6.29 6.4
6.4
6.59
6o59
6.6
6.5
5.66
5·49
6.26
6.28
3·53
3·42
3·31
5·97 6.08
6.02
6.09
6.49
6.40
6.42
6.10
6.17
3•62
3·74 6.26
6.26
3·74
4·5
3·9
10o73
10.75
11.03
11.17
11.03
10.85
10.87
10.84
11.2
11.1
10·77
10.65
10.97
10.91
__1_ Mean ll df ..1...!!! ratio
FeO (cont.)
8.62
MgO
CaO
10.76
10.72
10.94
11.05
10.88
10.86
10.95
10.85
11.2
ll.l
10-45
10.9)
11.08
10·97
Neg. .010 .50NS
.012 o047 1.22NS
6.44 Neg. .056 .lONS
6.39 Neg. .09
6.43 Neg. .08
Neg. .05 .70NS
6.32 Neg. .20 o54NS
Neg. ·038 .03NS
6.60 Neg. .05 .08NS
5.62 Neg. .08 ·55NS
3.42 Neg. .174 •93NS
6.21 .16 .08 8.18NS
6.03 Neg. .04 .SONS
6.48 .044 .062 2.50NS
6.11 Neg. .08 .49NS
3•70 Neg. .05 e24NS
Neg. .030
11.01
Neg. .44NS
10.89 Neg. •74NS
11.1 Neg. .06
Neg. .21 .006NS
.02 .05
14 Three USGS Mafic Rock Reference Samples
Org./Meth.
NIM/ICPS
USGSR/Chem
WHOI/XRF
UWUrz/XRF
wsu/XRF
USGSR/XRF
*Toron/INAA
*HMI/INAA-W
*HMI/INAA-B
*LASI)INAA-1
Bottle
11.47
11.15
11.05
11.26
11.30
11.30
10.7
10.6
11.14
11.14
10.85
10.85
10.13
10.27
lle33
ll.48
7.44
7·49
7·47
8.41 8o43
8o77
5·1
5·2
5·3
8.4
8.1
7·3 LASI)XRF 11.05
Tohok/IPAA 10.73
10·79
Uind/ICPS 10.8
10.8
Exxon/DCPAS 10.61
CRPG/MWPS
ETJI/AAS
ETWXRF
*Kjell/AAS
/I CPS
/xRF
GSF/Chem
esc/A
GSC/G*
BIO/AAS
NIM/AAS
USGSR/Chem
Parma/F1Ph
WHOI/XRF
Ullllrz/XRF
WSU/XRF
10.42
10e37
10.65
10.67
11.08
11.06
8.05
7·44
7·79
2.10
2.10
2.1
1.8
2.25
2.25
2.18
2.17
2.24
2.25
2·3
2.2
2.19
2.20
2.18
1.96
1.88
2.3
2.3
3ol8
2-97
2.05
2.12
1.42
1o42
1.42
Standard Deviation
Number ~.!!!:.2!:. Mean 2 df 3 df ratio
CaO (cont.)
11.27
11.38
11.38
11.30
11o25
11.25
10.6
10.4
llel7
11.11
10.80
10.80
10.17
10.30
11-47
10·97
7•83
7·60
7·41
8·58
7·50
8.63
5·3
4.6
5·4
8.5
8.3
8.1
11.10
10.51
10.65
10.8
10.8
10.33
10.44
10·39
10.66
10·75
11.06
2.11
2.11
2.0
2.2
2.25
2.28
2.18
2.16
2.24
2.26
2.2
2.2
2.21
2.22
2.18
1.98
1.84
2.5
2.3
3·04
3·2'.3 2.14
2.11
lo39
1.50
1.43
11.27
11.16
11.16
11.38
11.25
11.20
10.5
10.5
11.12
11.19
10.65
10.75
10.22
10.06
11.28
11-47
8.03
7·82
7·89
10.86
10.77
10.9
10.7
2.11
2.ll
1.9
1.8
2.27
2.24
2.20
2.18
2.22
2.26
2.2
2.2
11.27 Neg.
11.26 ·035
10.55 .o6
11.15 Neg.
10.19 Neg.
l1.33 Neg.
7.66 .213
8•39 Neg.
5.15 Neg.
8.12 .082
11.08
10.72
10.80
10.43
.11
.005
10.68 Neg.
11.07
11.06
8.05
7·34
7o81
2.11
2.0
.006
.06
2.26 Neg.
2.18 .01
2.24 Neg.
2.22 < .ooo
2.20 .ooo
Neg.
2o33 .ooo
3.10 Neg.
2.11 Neg.
Neg.
0.12 0.78NS
.020 7.00NS
.09 1.80NS
.04 .11NS
.04 7•00NS
.10 o45NS
•2'.3 •38NS
.137 8.29
o47 .60NS
.32 o15NS
.426 1.11NS
•07 5·79NS
.08
•098 1.01NS
.05 •95NS
.15
.02 •39NS
.01 1o44NS
.02 .28NS
.04 l.OONS
.016 1.00NS
.02NS
.08 l.OONS
.12 .l5NS
·03
·033 .2!)NS
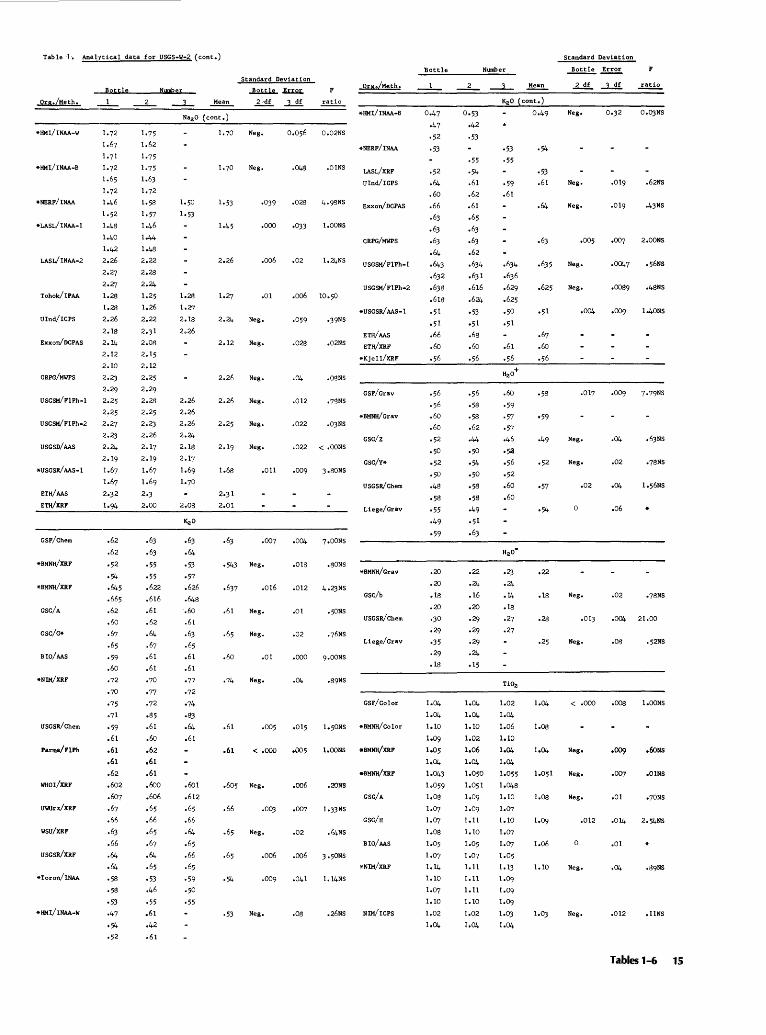
Table h Analytical data for USGS-W-2 (cont.)
Standard Deviation Org,/Meth.
Org./Meth.
*IIMI/INAA-W
*IIMI/INAA-B
*NERF/INAA
*LASL/INAA-1
LASI/INAA-2
Tohok/IPAA
Ulnd/ICPS
Exxon/DCPAS
CRPG/MWPS
Bottle
1.72
1.67
1.71
1.72
1.65
1.72
1.46
1.52
1.48
1.40
1.42
2.26
2.27
2-27 1.28
1.28
2.26
2.18
2.14 2.12
2.10
2.2J
2.29
USGSM/FlPh-1 2.25
2.25
USGSM/FlPh-2 2.27
2.23
USGSD/AAS 2.24
2.19
*USGSR/AAS-1 1.67
ETH/AAS
ETH/XRF
GSF/Chem
*BMNH/XRF
*BMNH/XRF
GSC/A
GSC/G*
BIO/ AAS
USGSR/Chem
Parma/FlPh
WHOI/XRF
UWUrz/XRF
wsu/xRF
USGSR/XRF
*Toron/INAA
*IIMI/INAA·W
1.67
.62
.62
·52
·54 .645
.665
• 62
.60
.67
.65
·59
.60
·72
·70 ·75
·71
·59
.61
.61
.61
.62
• 602
.607
.67
.66
.63
.66
.64
.64
·58
·58
·53 ·47
·54
Number
.63
.63
·55
·55
.622
.616
.61
.62
.64
.67
.61
.61
·70
·77
·72
.85
.61
.60
.62
.61
.61
.600
.606
.65
.66
.65
.67
.64
.65
·53
.46
·55
.61
.42
___.l,_ Mean
NazO (cont.)
1.28
1.27
2.18
2.26
2.08
KzO
.63
.64
·53 ·57
.626
.648
.60 .61
.63
.65
.61
.61
·77
·72
·74
·83 .64
.61
.601
.612
.65
.66
.64
.65
.66
.65
·59
·50
·55
Neg.
Neg.
1.45 .ooo
2.26 .006
1.27 .01
2.24 Neg.
2.12 Neg.
2.26
2.26
2.25
1.68
2.31
2.01
Neg.
Neg.
Neg.
Neg.
.011
·543 Neg.
.637 .016
.61 Neg •
.65 Neg.
.60 .01
•74 Neg.
.61 .005
.61 < .ooo
.605 Neg •
.66 .OOJ
.65 Neg.
.65 .oo6
·54 .009
·53 Neg.
ratio
0.02NS
.048 .OlNS
*NERF/INAA
LASL/XRF
Ulnd/ICPS
•028 4.9SNS Exxon/DCPAS
.033 1.00NS
CRPG/MWPS
•02 1•24NS USGSM/FlPh-1
USGSM/FlPh-2 .oo6 10.50
*USGSR/ AAS-1 .059 •39NS
ETH/AAS .028 .02NS ETH/XRF
*Kjell/XRF
.04 .OI'!NS
GSF/Grav .012 •7'lNS
*BMNH/Grav .022 .03NS
csc/z .022 < .OONS
GSC/Y* .009 3o80NS
USGSR/Chem
Liege/Grav
.004 7o00NS
.018 .SONS *BMNH/Grav
.012 4.2JNS GSC/b
.01 .50NS USGSR/Chem
.02 Lieg_e/Grav
.ooo 9.00NS
·04
GSF/Co1or
.015 *BMNH/Color
a005 l.OONS
*BMNH/XRF
.oo6 ,20Ns GSC/A
.007 1.33NS
GSC/H
.02 .64NS BIO/ AAS
.006 3 .50NS
.041 1.14NS
.08 .26NS NIM/ICPS
'Bottle
·52
.64
.60
• 66
.63
.63
.63
.64
-643
.632
.638
.618
·51
·51
.66
.60
·56
·56
·56
.60
.60
·52
·50
·52
·50
-48
·58
·55
·49
·59
.20
.20
.18
.20
.JO
·29
·35
.29
.18
Standard Deviation
Nwnber ~1!:!.2::.
____l.__ Mean 2 df --1..£. ratio
KzO (cont.)
Oo53 0.49 Neg. 0.32 O.OJNS
.42
·53
·55
·54 .61
.62
.61
.65
.63
.63
.62
• 634
.631
.616
.624
·53 ·51
.68
.60
·56
.22
·24
.16
.20
.29
.29
.29
·24
.15
·53
·55
·59
.61
.61
·56
.60
·59
·57
·57
.46
·52
·56
·52
.60
.60
.2J
·24
• u. .18
.27
.27
TiOz
·54
·53
.61 Neg.
.64 Neg •
.635 Neg •
.625 Neg.
.017
•59
Neg.
Neg.
·57 .02
0
.22
.18 Neg •
.013
• 25 Neg •
1.04 < .ooo
1.08
Neg.
Neg.
1.08 Neg.
.012
1.06
1.10 Neg.
Neg.
.019 .62NS
.019 .43NS
.007 2.00NS
o0089 .48NS
.009 lo40NS
7•79NS
.04 .6JNS
.02 •78NS
·04
.06
.02 •78NS
·004 21.00
.08 ·52NS
.008 1.00NS
·009 .60Ns
.01NS
.01 o70NS
.ou. 2.54NS
.01
.04
.012 .llNS
Tables 1-6 15
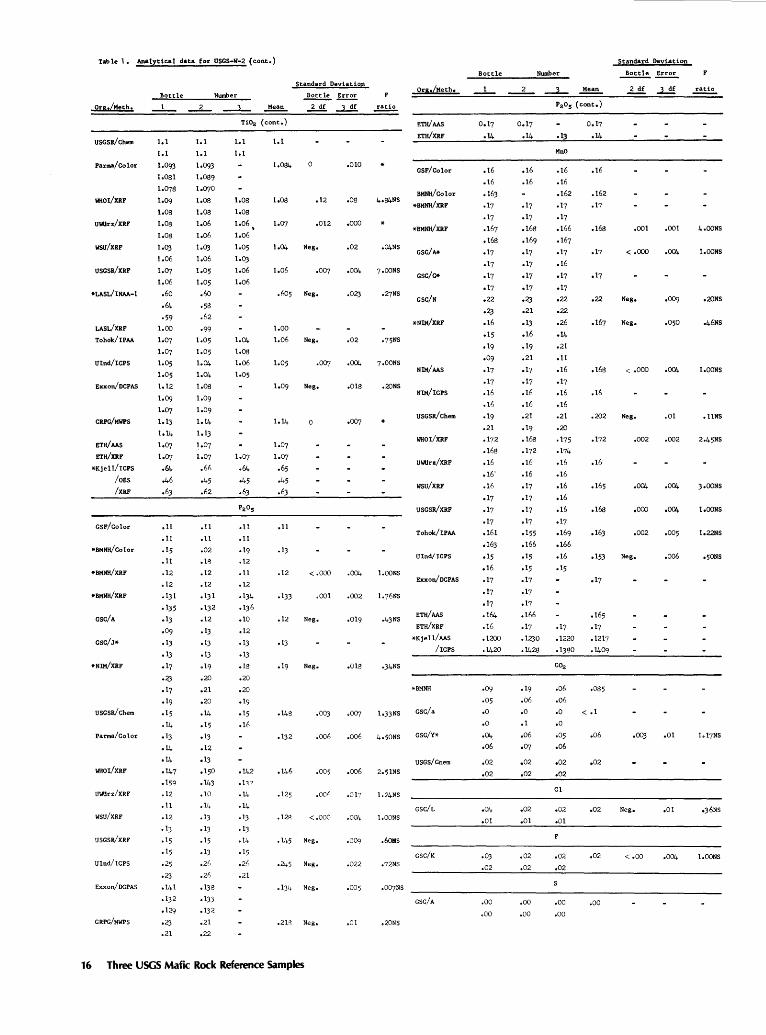
Table 1. Analytical data for USGS-W•2 (cont.)
Standard Deviation
Bottle Number ~ !!!:2!. Org./Meth. Mean 2 df ~ ratio
USGSR/Chem
Parma/Color
WHOI/XRF
UWrz/XRF
WSU/XRF
USGSR/XRF
*LASL/INM-1
LASL/XRF
Tohok/IPM
Ulnd/ICPS
Exxon/DCPAS
CRPG/MWPS
ETH/MS
ETH/XRF
*Kje11/ICPS
/OES
/xRF
CSF/Color
*BMNH/Color
*BMNH/XRF
esc/A
esC/J*
*NIM/XRF
1.1
1.1
1.093
1.081
1.078
1.09 1.08
1.08
1.08
l.OJ 1.06
1.07
1.06
.60
.64 ·59
1.00
1.07
1.07
1.05
1.05
1.12
1.09
1.07
1.13
lo14
1o07
1.07
.64
.46
.63
1.1
1.1
1o093
1.089
lo070
1.08
1.08
1.06
1.06
1.03 1.06
1.05
1.05
.6o
·58
.62
·99
1.05
1.05
1.04
1.04
1.08
lo09
1.09
1.14
1.13
1.07
1o07
.66
o45
.62
.11
.11
.02
.18
.12
.12
.131
.132
.12
.13
.13
.13
o19
TiOz (cont.)
1.1 1.1
1.1
1.08
1.08
1.06'
1.06
1.05
1.0J 1.06
1.06
1.04
1.08
1.06
1.05
.11
.11
.19
.12
.11
.12
.134
o1J6
1.084
1.08
1.04
1.06
1.00
1.06
1.05
.11
.1J
.12
.133
.12
.13
.12
.012
Neg,
Neg.
Neg,
Neg.
< .000
.001
Neg.
Neg •
.010
.08 4o84NS
.ooo
.02 o04NS
.004 7.00NS
.023
.02 •75NS
.004 7.00NS
.018 .20NS
.004 1.00NS
.002 l.76NS
.019 .43NS
.ot~ •34NS
Org./Meth.
F.TH/AAS
ETH/XRF
esF/Color
BMNH/Co1or
*BMNH/XRF
esc/A*
esc/G*
esc/N
NIM/AAS
NIM/ICPS
usesa/Chem
WHOI/XRF
UWrz/XRF
wsu/xRF
usesa/XRF
Tohok/IPAA
Ulnd/ICPS
Exxon/DCPAS
ETH/AAS
ETH/XRF
*Kje11/MS
/rePs
*BMNH
usesa/chem
.11
.11
.15
• 11
.12
.12
.1Jl
.135
olJ
.09
.lJ
.13
.17
·23
.17
.19
.15
.14
.1J
·14
·14
·147 .tsq
.12
.11
.12
.13
.15
• 20
.21
.20
.14
.15
.13
.12
.13
.150
.143
.10
.14
.13
.13
.15
.13
.2h
.2h
.138
.133
.132
.21
.10
.12
.13
.13
.18
.20
.20
o19
o15
.1(,
.148 .OOJ .007 1.33 Ns esc/a
Parma/Color
WHOI/XRF
UWUrz/XRF
wsu/XRF
USeSR/XRF
Ulnd/ICPS
Exxon/DCPAS
CRPG/MWPS
• 15
o25
·23
o141
.132
.129
·23 .21 .22
.132 .ooli
.005
.125 .00h
.12P <.000
.145 Neg,
.245 Neg.
.134 Neg.
.21~ Neg.
16 Three USGS Mafic Rock Reference Samples
.006 4.50NS esc/Y*
USGS/Cnem .oo6 2.51NS
.017 1.24NS
csc/L .004 l.OONS
.009 .60HS
esc/K .022 •72NS
.005
esc/A
.o1 .20NS
Bottle
.16
.16
.163
.17
.17
.167
.168
.17
.17
.17
.17
.22
·23 .16
.15
.19
.09
.17
.17
.16
.16
.19
.21
.172
.168
.16
.16'
.16
.17
.17
.17
.161
.163
.15
.16
·17
.17
.17
.164
.16
.1200
.1420
.09
.05
.o
.o ·04 .06
.02
.02
.04
.01
·03 .02
.oo
.oo
Nwnber
0.17
.14
.16
.16
.17
.17
.168
.169
.17
.17
.17
.17
·23 .21
.13
.16
.19
.21
.17
.17
.16
.16
.21
.19
.168
.172
.16
.16
.17
.17
.17
o17
.155
.166
.15
.15
.17
.17
.17
.166
.17
.1230
.1428
.19
.06
.o
.1
.06
·07
.02
.02
.02
.01
.02
.02
.oo
.oo
~ Mean
P2o5 (cont.)
MnO
.16
.16
.162
o17
.17
.166
.167
ol7
.16
.17
.17
• 22
.22
.26
·14
.21
.n
.16
o17
.16
.16
.21
.20
.175
.174
.16
.16
.16
.16
.16
o17
.169
.166
.16
.15
.17
.1220
.1380
CO;a
.o6
.06
.o
.o
.05
.o6
.02
.02
C1
.02
.o1
.02
.02
.oo
.oo
0.17
.14
.16
.162
.17
.168
.17
.22
.167
.168
.16
.202
.172
.16
.168
.153
.165
.17
.1217
.1409
.085
< .1
.o6
.02
.02
.02
.oo
Standard Deviation
...!2ill!. ~ 2df ~ ratio
.001 .001 4.00NS
<.000 .004 1.00NS
Neg • ·009 .20NS
Neg. .050 o46NS
<•000 .004 1.00NS
Neg. .01 .UNS
.002 .002
.004 .004 3•00NS
.ooo 1e00NS
.002 .005 1e22NS
Neg • .oo6 o50NS
·003 .01 lol7NS
Neg. .o1 e36NS
< .oo .004 1.00NS
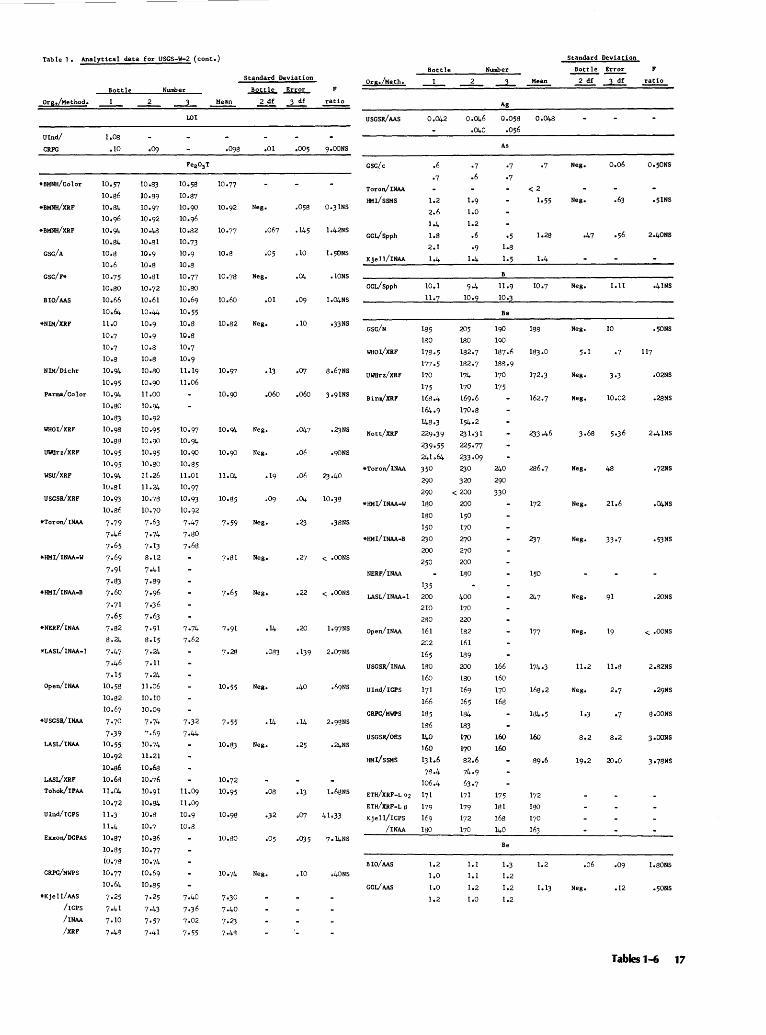
Table J, Analytical data for USGS-W-2 (cont.)
Ors./Method.
Ulnd/
CRPG
*BMNH/Color
*BMNH/XRF
*BMNH/XRF
GSC/A
csc/F•
BIO/AAS
•NIM/XRF
NIM/Dichr
Parma/Color
WHOI/XRF
UWilrz/XRF
wsu/XRF
USGSR/XRF
*Toron/INAA
*HMI/INAA-W
*HMI/INAA-B
*NERF/INAA
*LASL/INAA-1
Bott1e
1.08
.10
10.57
10.86
10.84
10.96
10.94 10.84
10.8
10.6
10,75
10.80
10.66
10.64
11.0
10.7
10.7
10.8
10.94 10.95
10.94
10.80
10.8)
10.98
10.88
10.95
10.95
10.94
10.81
10.9J 10.86
7·79
7·46
7·65
7·69
7·91
7·83 7·60
7·71
7·65
7o82
8.24
7·47
7o46
7·15
Open/INAA 10.58
10.82
10.67
*USGSR/INAA 7.70
7·39 LASL/INAA 10,55
10.92
10.86
LASI/XRF 10.68
Tohok/IPAA 11.04
10.72
Ulnd/ICPS 11,3
11-4
Exxon/DCPAS 10o87
CRPG/MWPS
*Kjell/AAS
/I CPS
/INAA
/XRF
10.8)
10.89
10.97
10.92
10.48
10.81
l0o9
10.8
10.81
10o72
10.61
10o44
10.9
10o9
10.8
10.8
10.80
10.90
11.00
10.94 10.92
10·95
10·90
10.95
10.80
11.26
11.24
10.78
10.70
7·63
7·74
7·13
8.12
7·41
7·89
7·96
7·36
7·63
7·91
8.15
7·24
7·11
7·'2A 11.06
10.10
10.09
7·74
~.69
10.74
11.21
10.68
10.76
10.91
10.84
10.8
10.7
10.86
Number
LOI
Standard Deviation
Botqe .!£.1.:2!:_
Mean 2df 3df ~
.01 9•00NS
10.77
Neg, .058 Q.JlNS
.1.45 1.42NS
10.8 .05 .10
Neg, .IONS
10.60 ,01
10.82 Neg, .10 •33NS
10.97 .13 ·07
10.90 .060 .o6o 3•91NS
10.94 Neg. ·047 .23NS
10.90 Neg. .06 .90NS
11.04 .19 .06 23·40
10.85 .04
7·59 Neg, ·38NS
Neg, .27 < .OONS
Neg, .22 < ,OONS
.1.4 .20 1.97NS
.083
10,55 Neg,
7·55 .1.4 ,14 2.9'lNS
10.8) Neg. .25 ,?J.NS
10o72
10·95 .08 ,13 1.68NS
o07 4lo33
10.80 .05 ·0'35 7•14NS
10,74 Neg, .10 .40NS
Ors./Meth,
USGSR/AAS
csc/c
Toron/INAA
HMI/SSMS
GGI/Spph
Kje11/INAA
GCL/Spph
csc/N
WHOI/XRF
UWUrz/XRF
Birm/XRF
Nott/XRF
*Toron/INAA
*HMI/INAA-W
*HMI/INAA-B
NERF/INAA
Bottle
0.042
,6
·7
1.2
2.6
1.4
1.8
2.1
1.4
185
180
178·5
177·5
170
175
168.4
164.9
1.48.3
229·39
239·55
241.64
350
290
290
180
180
150
230
200
250
135
LASL/INAA-1 200
210
280
Open/INAA 161
202
165
USGSR/INAA 180
160
Ulnd/ICPS 171
166
CRPG/MWPS 185
186
USCSR/OES 140
160
HMI/SSMS 131,6
73.4
106.4
ETH/XRF-L "'2 171
ETH/XRF-L B 179
Kje 11/ICPS !69
/INAA 180
BIO/ AAS
GCL/ AAS
1,2
1.0
1,0
1.2
Number
Mean
Ag
0.046 0.058 0.048
.040 .056
·7 .6
1.9
1.0
1.2
.6
·9 1.4
205
180
182.7
182.7
174
170
169.6
170.8
154.2
231·31
225·77
233·09
230
320
<200
200
150
170
270 270
200
180
400
170
220
182
161
189
As
Ba
240
290
330
200 166
180 160
169 170
165 168
184
183
170 160
170 160
82.6
74·9
63·7
171 175
179 181
172 168
170 140
1.1
1,1
1.2
1.0
Be
l.J
1.2
1.2
1.2
·7
<2
1,55
10.7
188
l83.0
237
?A7
177
168.2
160
1,2
1.13
Standard Deviation
~~ 2.£. ..1-2!.. .!!!!.2..
Neg, o.o6 0.50NS
Neg. .63 •51NS
·47 2.40NS
Neg, 1.11 o41NS
Neg, 10 .5QNS
Neg. .02NS
Neg, 10.02 .28NS
3·68 2.41NS
Neg, 48 •72NS
Neg. 21.6
Neg. .5JNS
Neg. .20NS
Neg, < .OONS
11.2 11.8 2.82NS
Neg, 2,7
g,OONS
8.2 8.2 3o00NS
3•78NS
.06 1.80NS
Neg, .12 •50NS
Tables 1-6 17
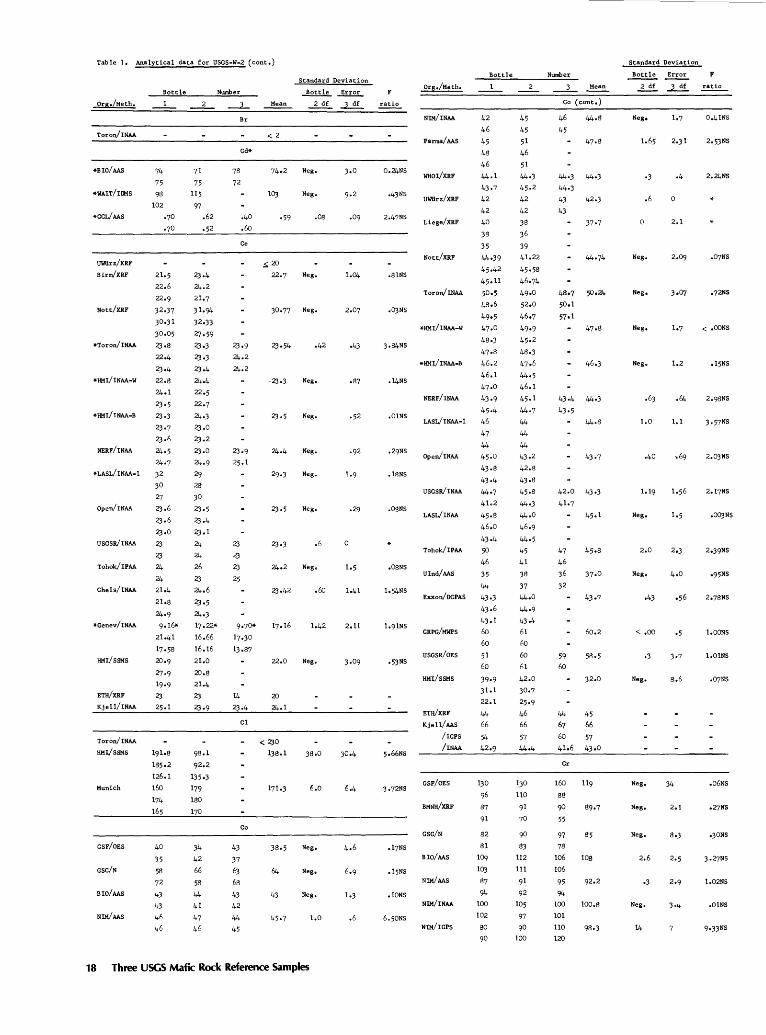
Table 1. Analytical data for USGS-W-2 (cont.)
Standard Deviation
Bottle Nwnber ~ ..!!!2!:_ Org./Meth, Mean 2 df ..1..2!.. ~
Toron/INAA
*BIO/AAS
*WAIT/IIMS
*CCL/ AAS
UWUrz/XRF
Birm/XRF
Nott/XRF
*Toron/INAA
*HMI/INAA•W
*HMI/INAA-B
NERF/INAA
*LASL/INAA-1
Open/INAA
USGSR/INAA
Tohok/IPAA
Chels/INAA
*Cenev/INAA
HMI/SSMS
ETH/XRF
Kjell/INAA
Toron/INAA
HMI/SSMS
Munich
GSF/OES
csc/N
BIO/AAS
NIM/AAS
74
75
98
102
·70
·70
21.5
22.6
22.9
32·37
30.31
30o05
2'3·8
22.4
2'3·4
22.8
24ol
23o5
2'3·3
23·7
23.6
24·5
24·7
32
30
27
2J .6 2).6
ZJ.O
2J
2J 24
24
21.4
21.8
24·9
9ol6*
21.41
17·58
20o9
27·9
19·9
2J 25.1
191·8
185o2
126.1
160
174
165
40
35
58
72
43
43
46
46
71
75
115
97 .62
·52
2'3·4
24.2
21.7
31·94
32·33
27·59
2'3·3
2'3·3
2'3·4
24.4
22.5
22.7
24·3 2).0
2).2
2).0
24·9
29
28
30
2'3·5
2).4
2J.l
24
24
26
2J 24.6
2'3·5
24o3
17.22*
16.66
16.16
21.0
20.8
21.4
2J
2'3·9
34
42
66
58
44
41
47
46
Br
<2
78 74.2 Neg,
72
lOJ Neg,
.40 ·59 .08
2J 2J
2J 25
.60
Ce
.::; 20
22.7 Neg,
30.77 Neg.
.42
Neg.
Neg.
Neg.
Neg,
2'3·5 Neg,
2'3·3 .6
24.2 Neg.
2).42 .60
9·70* 17.16 1.42
17,30
13.87
22.0 Neg.
14 20
2'3·4 24.1
C1
< 2)0
1)8.1 38.0
171•3 6,0
Co
43 38•5 Neg.
37
63 64 Neg,
68
43 43 Neg.
42
44 45·7 1.0
45
18 Three USGS Mafic Rock Reference Samples
3•0 0.24NS
,43NS
1.04 .81NS
.OJNS
·43
.87 .14NS
,01NS
,18NS
.29 .O<lNS
.08NS
1.41 1o54NS
2.11
•53NS
5.66NS
3 •72NS
1.3 .lONS
.6 6. 50NS
Org,/Meth.
NIM/INAA
Parma/AAS
WHOI/XRF
UWUrz/XRF
Liege/XRF
Nott/XRF
Toron/INAA
*HMI/INAA-W
*HMI/INAA-B
Bottle
42
46
45
48
46
44.1
43·7
42
42
40
38
35
44·39
45o42
45.11
50·5
4$.6
49·5
47.0
48·3
47·8
46.2
46.1
47·0
NERF/INAA 43 •9
45·4
LASL/INAA-1 46
Open/INAA
USGSR/INAA
LASL/INAA
Tohok/IPAA
Ulnd/AAs
47
44
45.0
43·8
43·4
44·7
41.2
45.8
46.0
43o4
50
46
35
44
Exxon/DCPAS 43 •3
CRPG/MWPS
uscsR/oEs
HMI/SSMS
ETH/XRF
Kje11/ AAS
/IGPS
/INAA
GSF/OES
BMNH/XRF
csc/N
BIO/AAS
NIM/AAS
NIM/INAA
NIM/ICPS
43.6
43.1
60
60
51
60
39·9 31.1
22.1
44
66
54 42.9
130
96
87
91
82
81
109
10J 87
94
100
102
80
90
45
45
51
46
51
44·3
45.2
42
42
38
36
39
41.22
45·58
46.74
49·0
52.0
46·7
49·9
45·2
48·3
47·6
44·5
46.1
45·1
44·7
44
44
44
43.2
42.8
43·8
45·8
44·3
44o0
46·9
44·5
45
41
38
37
44.0
44·9
43·4
61
60
60
61
42.0
30·7
25·9
46
66
57
44·4
130
110
91
70
90
8J 112
111
91
92
105
97
90 100
Nwnber
Mean
Co (cont.)
46 44o8
45
44·3 44·3
44·3
43 42.3
43
46.3
43·4 44·3
43·5
42.0 43·3
41·7
47 45.8
46
36 J7.0
32
43·7
60.2
59 58·5
60
32.0
44 45
67 66
60 57
41.6 43·0
Cr
160 119
88
90 89·7
55
97 85
78
106 108
106
95 92.2
94 100 100.8
101
110 98·3
120
Standard Deviation
~~ ~~
Neg, 1.7
2.31
·3
.6 0
2.1
Neg,
Neg,
Neg.
Neg. 1.2
.64
1.0 1.1
.40
1.19
Neg.
2.0 2.3
Neg.
·43
< .oo
·3
Neg, 8.6
Neg, 34
Neg, 2.1
Neg, 8o3
2.6
·3
Neg.
14
0.41NS
2.53NS
2,24NS
< ,OONS
.15NS
3 •57NS
2.03NS
2.17NS
.OOJNS
•95NS
2o78NS
1.00NS
l.01NS
.06NS
o27NS
•30NS
1.02NS
,Q1NS
9•33NS

Table 1. Analytical data for USGS·W-2 (cont.)
Org 1/Meth.
Parma/AAS
WHOI/XRF
UWUrz/XRF
Birm/XRF
Nott/XRF
Toron/INAA
*HMI/INAA-W
*HMI/INAA-B
NERF/INM
USGSR/INAA
*LASL/INAA
Bottle
96
90
94 86.0
85·5
96
100
92·9
94·1 94.8
93·97
97·54
97·66
94
95
92
88.0
39.0
90.0
124
125
128
88.5
91·4
87.0
84.1
91
89
85
Tohok/IPAA 37
107
Exxon/DCPAS 72o8
CRPG/MWPS
USGSR/OES
HMI/SSMS
ETH
ETWXRF
Kje11/ AAS
GSC/M
/I CPS
/INAA
Toron/INAA
HMI/INAA-W
HMI/INAA•B
NERF/INM
LASL/INAA-1
USGSR/INAA
HMI/SSMS
Kje11/INAA
100.3
101.6
101
101
120
150
63·5
61.6
42.1
95
96 102
105
112
1.0
1.0
·93
·98
.81
1.0<]
·94
·9 1.2
1.0
.a
.8
.12
.15
.22
·95
95
96
94
85·5
86.5
88
90
92.6
93·8
95·6
96.69
96.81
94·59 98
100
93
91.0
84.0
90·0 130
120
125
90.1
91.1
88.1
3r..5
80
97
94 92
104
99·1
75•5
77·7
102
102
120
120
59·4
48.6
53·5
95
95 107
106
119
1.1
·7
·95
o89
1ol3
1.01
lo07
1.2
1.4
1.1
1.1
1.1
1.0
·079
1.18
.091
·90
Number
Mean
Cr (cont.)
lOJ
98
105
99
96
120
120
93
108
Cs
1.4
1.1
.6
·9 1.0
94·1
92
?£>.0
125
125
54o8
95
94
104
101
115
1.0
1.01
·9
1.12
·93
·31
Standard Deviation
~~ 2df ~ ratio
Neg. 2.27 0,81NS
.6
13.50
Neg.. 1.27 .004NS
Neg, .06NS
5·59
Neg. 2.8
Neg.
Neg. .04NS
Neg. 2.2
Neg. 6.8 .l3NS
Neg. < .OONS
Neg. .38NS
<..0 12 1.00NS
Neg, .06NS
.11 .20 1.56NS
Neg. .08 .42NS
Neg, .11
.16
.12 .06 9•50NS
Neg. .61NS
GSF/OES
GSC/N
BIO/AAS
Parma/AAS
WHOI/XRF
UWUrz/XRF
Nott/XRF
Curie/XRF
LASL/XRF
Ulnd/ICPS
Exxon/DCPAS
CRPG/MWPS
USGSR/OES
HMI/SSMS
USGSR/MS
ETH/AAS
ETH/XRF
Kjell/AAS
/rePs /OES
Toron/INAA
NERF/INM
Genev/INM
Kje11/I!Ils
Kjell/III!S
NIM/INAA
*Toron/INAA
Toron/INAA
HMI/INM•W
HMI/INAA-B
Bottle Number
120
120
125
100
105
105
114
108
Ill
98·5
97·7
108
110
92.82
10J.87
104.58
98·45
97·49
130
115
115
110
106
105
101
105
98
102.1
99·0
108
108
101.17
100.54
100.15
101.ll
99·41
95·49 99·07
77 78
103 104
102 lOJ
107.6 115.0
112.7
113.0
101
106
120
140
70·5
69·4
61.8
109
ll7
100
102
84 ll2
70
1.6
1.3
1.5
1.05
1.08
·99
1.18
1.12
1.01
1.16
1.24
1.14
1.10
1.10
1.11
112.6
106.4
102
102
140
140
64-7 76.6
56.4
116
115
lOJ
10J
84
113
66
1.3
1.3
·93
o87
r.oo 1.12
1.10
1.22
1.23
1.09
1.20
1.09
1.06
1.09
140
llO
ll5
120
105
lOJ
Cu
10J.4
104.1
108
109
10J
98
140
130
115
ll3
106
83
114
75
Dy
Er
Eu
1.3
1.1,.
1.J2
1.22
1.24
1.06
1.08
1.12
Standard Deviation
.A2!.W. ~ Mean ~ ..:LSL ..£!tis_
122.5
114
106.2
100.8
78
102.2
111.2
102.8
135
66.6
102
104
84
113
70
6.66
3·2
1.6
1.)5
1.08
1.11
1.18
Neg. 0.07NS
Neg. 10.6 ol5NS
1.40NS
6.6 3 ·3 13.14
2.67 1.34
Neg. •9 .6oNS
Neg. 2.25
6.39MS
·3 2.1
Neg. ,006NS
Neg. .J6NS
Neg. .60NS
Neg. .04NS
Neg. .28NS
Neg.
·97 6.MNs
Neg. o52NS
Neg. .6oNs
.16 .055 27·30
Neg. .06
Neg. .06 o02NS
.015 .013
Tables 1-6 19
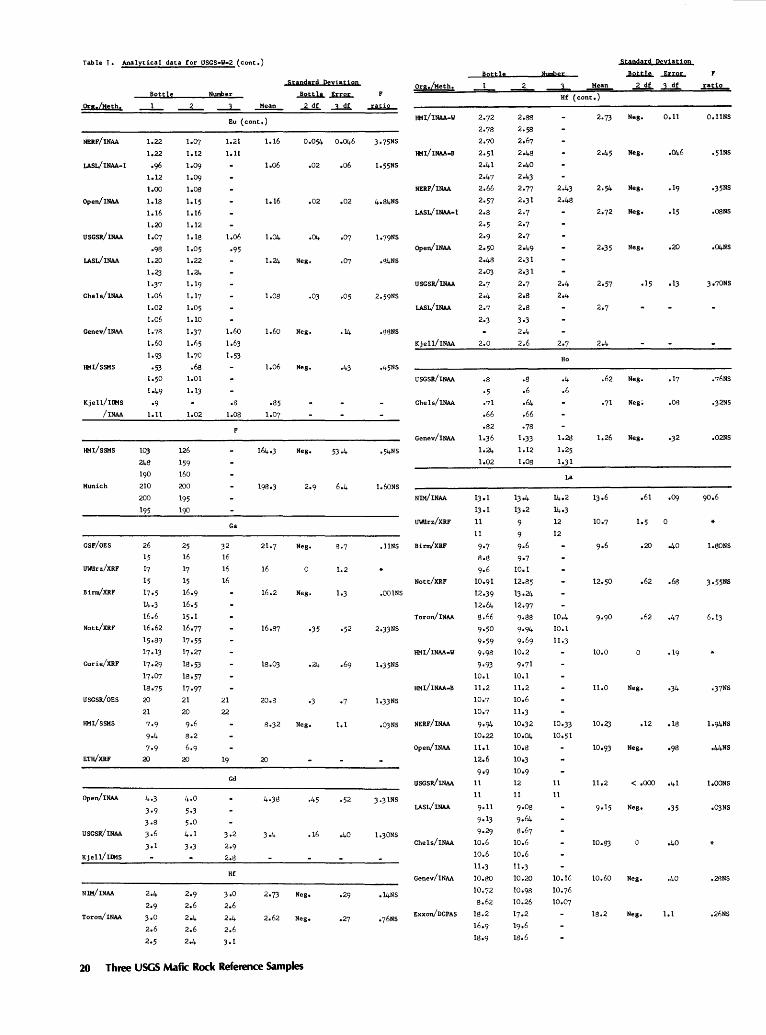
Table], Analytical data for USGS·W-2 (cont.)
Standard Qcyiation
Bottle Nunper ..!2.W.t. .J.u:.2L. Org.(Meth. Mean ..l..!!L ....l...!!.f. ..t!.U2...
NERP/INAA
LASL/INAA-1
Open/INAA
USGSR/INAA
LASL/INAA
Chels/INAA
Genev/INAA
HMI/SSMS
Kjell/III1S
/INAA
HMI/SSMS
Munich
GSF/OES
UWllrz/XRF
Birm/XRF
Nott/XRF
Curie/XRF
USGSR/OES
HMI/SSMS
ETH/XRF
Open/INAA
USGSK/INAA
Kjell/11115
NIM/INAA
Toron/INAA
1.22
1.22
·'~> 1.12
1.00
1.18
1.16
1.20
1.07
·98
1.20
1.2)
l.J7
1.06
1.02
1.06
1:78
1.60
1:93
·53 1.50
1:49
·9 loll
10J 248
190
210
200
195
26
15
17
15
17:5
14:3 16.6
16.62
15:89
17o lJ
17.29
17.07
18:75
20
21
7·9
9·4
7·9
20
1.07
1.12
1:09
1.09
1.03
1.15
1.16
1.12
1.18
1:05
1.22
1.24
1:19
1.17
1:05
1.10
1:37
1.fi5
1.70
.68
1.01
1.1J
1.02
126
159
160
200
195
190
2:9
2.6
2:4
2.6
2.4
Eu (cont.)
1.21
1.11
1.06
·95
.8
1.08
32
16
16
16
21
22
Ga
Gd
Hf
3:0
2.6
2:4
2.6
J.l
1.16
1.06
1.16
1.04
1.24
1.08
1.60
1.06
:85
1:07
16
16.2
20.8
20
3:4
2:73
2.62
0.054 0.046
.02 .o6
.02 .02
.04
Neg,
.OJ :05
Neg, .14
Neg. :43
Neg, 53·4
Neg.
0 1.2
Neg.
·35
·3
Neg, 1.1
·45
.16 .40
Neg.
Neg. .27
20 Three USGS Mafic Rock Reference Samples
3·75NS
1:55NS
,<34NS
2.59NS
.88NS
·45NS
•54NS
1.60NS
.11NS
.001NS
2o)JNS
1oJ5NS
loJJNS
,OJNS
3 .J1NS
1.JONS
.14NS
Org./Meth.
HMI/INAA-W
HMI/INAA·B
NERP/INAA
LASL/ INAA-1
Open/INAA
USGSR/INAA
LASL/INAA
Kjell/INAA
USGSR/INAA
Chels/INAA
Genev/INAA
NIM/INAA
UWllrz/XRF
Birm/XRF
Nott/XRP
Toron/INAA
HMI/INAA-W
HMI/INAA·B
NERF/INAA
Open/INAA
uscsR/INAA
LASL/INAA
Che1s/INAA
Genev/INAA
Exxon/DCPAS
Bottle
2.0
1).1
1Jo1
11
11
9·7
8:8
9·6
10:91
12:39
12.64
8.66
9·50
9·59
9·98
9·93
10.1
11.2
10:7
10.7
9·94 10.22
11.1
12.6
9•9 11
11
9·11
9•13
9·29 10.6
10.6
10.80
l0o72
8.62
18.2
16.9
18:9
• 8
.6
.64
.66
·78
1oJJ
1.12
1.08
1Jo4
1Jo2
9
9
9·6
9·7 10.1
12.85
13:24
12:97
9:88
9·94
9·69 10.2
9·71
10.1
ll.2
10.6
ll.J
10:32
10:04
10.8
10:3
10.9
12
ll
9:08
9·64
8:67 10.6
10.6
10.20
10:98
10.26
17:2
19.6 18.6
Number
J Mean
Hf (cont.)
2.4
2:4
Ho
.4
.6
1.28
1:25
1.)1
14:2
14·3 12
12
10.4
10.1
11.)
11
11
2:45
2:35
2:57
.62
1.26
lJ.6
10.0
11.0
10:93
11.2
lO.SJ
10.60
Standard Qeyiation
ratio
Neg, 0.11 Q,llNS
Neg. .046 :51NS
Neg. o)5NS
Neg, :15 .08NS
Neg. .20 o04NS
:15 o1J 3o70NS
Neg • :17
Neg~ .08 .J2NS
Neg. ·32 .02NS
.61 ·09
1:5 0
.20 :40 l.SONS
.62 .68 3•55NS
.62 ·47 6.1)
0
Neg, ·34 •J7NS
.12 .18 lo94NS
Neg. o44NS
< .ooo :41 loOONS
Neg. •35 oOJNS
:40
Neg, .40 .28NS
Neg. 1.1 ,2/)NS
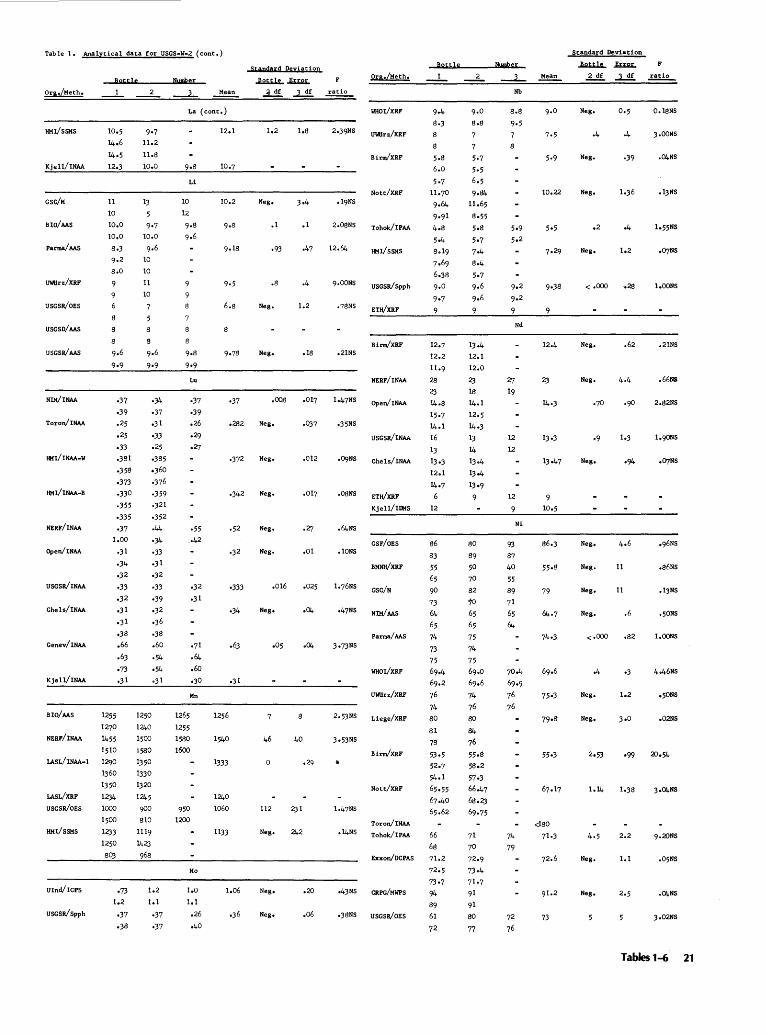
Table 1. Analytical data for USGS-W-2 (cont.)
HMI/SSKS
Kjell/INAA
GSc/M
BIO/AAS
Parma/AAS
UWilrz/XRF
USGSR/OES
USGSD/AAS
USGSR/AAS
NIM/INAA
Toron/INAA
HIH/INAA-W
NERF/INAA
Open/INAA
USGSR/INAA
Che1s/INAA
Genev/INAA
Kjell/INAA
BIO/AAS
NERF/INAA
LASL/ lNAA-1
LASL/XRF
USGSR/OES
HHI/SSKS
Uind/ICPS
USGSR/Spph
11
10
to.o
to,O
So3
9·2
s.o
·37
·39
.25
o25
·33
o3S1
·35S
·373
·330
·355
·335
·37 1.00
·31
o34
o32
·33
·32
o31
·31
o3S
.66
.63
·73 o31
9·7
11.2
u.s to.o
13
5 9·7
to.O
9•6
to
10
1l
to
·34
·37
o31
•33
o25
o3S5
•360
·376
·359
·321
·352
·44 ·34
·33
·31
·32
·33
•39
•32
·36
·3S
.60
·54
·54
o3l
1255 1250
1270 1240
1455 1500
15to 1580
1290 1350
1360 1330
1350 1320
1234 1245
tooo 900 1500 8to
1233 1119
1250 1423
80) 968
·73 1.2
1,2 1.1
·37 ·37
o3S •37
Nutpber
Mean
La (cont.)
9oS
Li
to
12
9·S
9·6
Lu
12.1
to.2
9olS
6.s
·37
StandArd Deyiation
1.2 loS
Neg, 3•4
.1 .1
·93 .47
.s .4
Neg. 1.2
Neg, .Is
.oos .017 ·37
·39
.26
o29
·27
o282 Neg, ·037
·55 ..42
·32
·31
o71
.64
.6o o30
Mn
1265 1256
1255
1580 1540
1600
1333
1240
950 to60
1200
1133
Ho
•372 Neg,
•342 Neg.
.52 Neg.
Neg.
·333 .016
·34 Neg,
o31
46
112
Neg.
1.0 1,06 Neg,
1,1
o26 o36 Neg,
o40
.012
.017
.01
.025
·04
o04
s
40
231
242
.20
.06
Bottle
WHOI/XRF
UWUrz/XRF
BirnJXRF
Nott/XRF
2o0SNS Tohok/IPAA
12•64 HMI/SSKS
9.00NS USGSR/Spph
Nwpber
___L Mean
Nb
s
5·9
5o2
9o2
9·2
10.22
Standard Deviation
.A.I!lllL .ID:2.t., F
~ ..1...2!. .!!lli_
Neg. O.ISNS
3.00NS
Neg. ·39 ,Q4NS
Neg, 1.36 .13NS
.2 ·4
Neg, 1,2 o07NS
< .ooo .28 l,OONS
·7SNS ~E~T=W~X=R~F------~----~~----~9----~~-----------------------
BirnJXRF o21NS
NERF/INAA
1o47NS Open/INAA
•35NS
USGSR/INAA
oOjNS Che1s/INAA
.OSNS ETH/XRF
Kjell/lrt!S
.64NS
GSF/OES .toNS
BHNWXRF
1,76NS GSC/N
•47NS NIH/ AAS
3•73NS
2.53NS
3•53NS
o14NS
o43NS
•3SNS
Parma/AAS
WHOI/XRF
UWUrz/XRF
Liege/XRF
BirnJXRF
Nott/XRF
Toron/INAA
Tohok/IPAA
Exxon/DCPAS
CRPG/MWPS
USGSR/OES
12.7
12.2
11.9
28
23 14-S
15·7
14.1
16
13
13o3
12.1
14·7
12
S6
S3
55
65
90
73
64 65
74
73
75
69.4
69.2
76
74
so Sl
7S
53·5 52o7
54o1
65·55
67.40
65.62
66
6S
71.2
72·5
73·7
94 S9
61
72
13.4
12.1
12.0
23 1S
14.1
12.5
14·3
13
14
13o4
13o4
13•9
9
Nd
12
12
12
93 S7
40
55
S9
71
65
64
74
79
72
76
Ni
12.4 Neg, .62 .21NS
Neg. 4.4 .66NS
2.S2NS
13•3 ·9 1,9QNS
13o47 Neg, ·94
too5
Neg, 4,6
Neg. 11 .S6NS
79 Neg, 11 .13NS
Neg. .6 .50NS
<•000 .82 1.00NS
·4 ·3 4o46NS
75·3 Neg, 1.2 o50NS
79·S Neg, ,02NS
55·3
1.14 3•04NS
4.5 2.2
Neg. 1.1
Neg, ,Q4NS
73 3.02NS
Tables 1-6 21
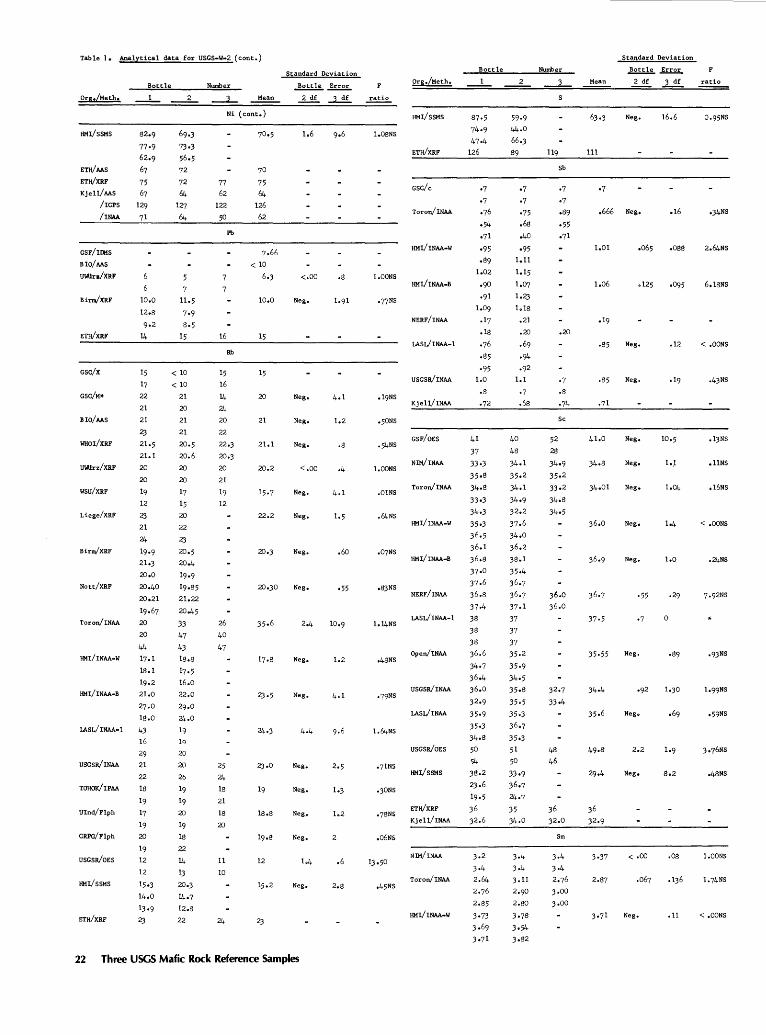
Table 1. Analytical data for USGS-W-2 (cont.)
Org./Metho
HMI/SSMS
ETH/AAS
ETH/XRF
Kjell/AAS
/I CPS
/INAA
GSF/II!iS
BIO/AAS
UWI!n/XRF
Birn/XRF
ETH/XRF
GSC/X
GSC/M*
BIO/AAS
WHOI/XRF
UWI!rz/XRF
WSU/XRF
Liege/XRF
Birn/XRF
Nott/XRF
Toron/INAA
HMI/INAA-W
HMI/INAA-B
LASL/INAA-1
USGSR/INAA
TOHOK/IPAA
Ulnd/F1ph
CRPG/Flph
USGSR/OES
HMI/SSMS
ETH/XRF
Bottle
10.0
12.8
9·2
u.
15
17
22
21
21
23 21.5
21.1
20
20
19
12
23 21
24
19·9
21.3
20.0
20.40
20.21
19.67
20
20
44 17.1
18.1
19.2
21.0
27.0
18.0
43
16
29
21
22
18
19
17
19
20
19
12
12
15·3
14.0
13•9
23
<10
< 10
21
20
21
21
20.5
20.6
20
20
17
15
20
22
23 20.5
20.4
19·9
19.85
21.22
20.45
33 47
43
18.8
17·5
16.0
22.0
29.0
24.0
19
1q
20
20
26
19
19
20
19
18
22
u. 13
20.3
U.o7
12.8
22
Number
Mean
Ni (cont.)
70
77 75
62 64
122 126
50 62
Pb
16
Rb
15
16
u. 24 20
22
22.3
20.3
20
21
19
12
26
40
47
25
24 18
21
18
20
11
10
24
7.66
< 10
6.3
10.0
15
15
20
21
21.1
20.2
22.2
20.3
20.30
18.8
12
Standard Deviation
~~ 2df ~
1.6
<.00 .8
Neg.
Neg.
Neg. 1.2
Neg. .8
<.oo .4
Neg. 4.1
Neg. .60
Neg. •55
Neg. 1.2
Neg.
Neg.
Neg. 1.3
Neg. 1.2
Neg.
.6
Neg. 2.8
22 Three USGS Mafic Rock Reference Samples
ratio
1.08NS
1.00NS
o50NS
.S4NS
1.00NS
.OlNS
.64NS
.07NS
oBJNS
o48NS
1.64NS
.30NS
o78NS
.06NS
HMI/SSMS
ETWXRF
GSC/c
Toron/INAA
HMI/INAA-W
HMI/JNAA-B
NERF/INAA
LASL/INAA-1
USGSR/INAA
Kjell/INAA
GSF/OES
NJM/INAA
Toron/INAA
HMI/INAA-W
HMI/INAA-B
NERF/INAA
LASL/INAA-1
Open/INAA
USGSR/INAA
LASL/INAA
USGSR/OES
HMI/SSMS
ETH/XRF
Kjell/INAA
NJM/INAA
Toron/INAA
HMI/INAA-W
Bott 1e
·95
1.0
.8
·72
59·9
44.0
66.3
89
·7
·7 ·75
.68
o40
·95
1.11
1.15
1.07 1.23 1.18
.21
.20
.69
·92
1.1
·7 .68
Number
Sb
.20
·7 .8
·74
Sc
36.o 36.0
48
46
36 32.0
Sm
Standard Deviation
~Error
Mean 2 df 3 df
63.3 Neg. 16.6
111
.666 Neg. .16
1.01 o088
1.06 .125
Neg. .12
.85 Neg.
41.0 Neg.
Neg. 1 •. 1
34o01 Neg.
36.0 Neg. lo4
Neg. 1.0
·55
37·5 0
35·55 Neg.
Neg.
3·37 < .oo .o8
.067
Neg. .11
F
ratio
0.95NS
•34NS
6.18NS
< .OONS
.43NS
.13NS
ollNS
.16NS
< .OONS
.24NS
•93NS
o59NS
3o76NS
o48NS
l.OONS
< .OONS

Table l. Analytical data for USGS-W-2 (cont.)
Org./Meth.
HMI/INAA-B
NERF/INAA
Open/INAA
USGSR/INAA
LASL/INAA
Chels/INAA
Genev/INAA
Kjel1/II!!s
/INAA
GSC/N
BIO/AAS
NWAAS
Parma/AAS
WHOI/XRF
UWUrz/XRF
wsu/xRF
Liege/XRF
Birm/XRF
Nott/XRF
LASL/XRF
Tohok/IPAA
Ulnd/ICPS
CRPG/HWPS
USGSR/OES
HMI/SSHS
Bottle
205
225
180
170
191
200
213
213
192
188
190
196.1
195·8
186
187
192
186
204 202
202
193·9
194-4
192-4
192·57
194·24
191·74
198
187
195
197
192
198
202
310
320
152.8
140.1
119·4
ETH/AAS 200
ETH/XRF 201
Kjell/INAA 180
235 250
172
178
202
192
208
210
187
192
190
196-4
195·3
186
188
192
197 203
201
202
194.6
194-2
190·9
l9J.32
193·10
194·39
195
185
185
195
191
198
202
330
300
182.7
158.0
175·3
209
199 200
·54 .61
Number
Mean
Sm (cont.)
Sr
255
260
168
158
190
191
213
215
300
290
Ta
·38
-47
3·45
3·45
2.2
3·55
2)8
194
212
202.3
308
205
200
177
Standard Deviation
..!2ll!!.. ..!ll2!:.. 2df ~ ratio
Neg. o.cm O.OlNS
Neg. .158
Neg. .21
.15 .04 27
Neg. .08
Neg. ·34 .9lNS
Neg. ·33 .04NS
20 10 8·58NS
Neg. 5·5
Neg. 2.3 .OJNS
.6 ·5
6.20NS
Neg. 4.6 •74NS
Neg. 1.1 •57NS
Neg. 1.61 .o6Ns
Neg. .SINS
.22Ns
0
2).0
.067 ·047 5.22NS
Org./Meth.
HMI/INAA-W
HMI/INAA-B
LASL/ INAA-1
Open/INAA
USGSR/INAA
Kjel1/INAA
HMI/INAA-W
HMI/INAA-B
NERF/INAA
Open/INAA
USGsR/INAA
Chels/INAA
Kjel1/INAA
NWINAA
UWUrz/XRF
Birm/INAA
Toron/INAA
HMI/INAA-W
HMI/INAA-B
NERF/INAA
LASL/INAA-1
Open/INAA
USGSR/INAA
Ulnd/ICPS
USGSD/DNAA
ETH/XRF
Kjell/INAA
Bott.le
0.61
·59
·58 ·57
.62
·52
·45
·45
.46
·45
o43
·43
·58
·51
·50
.64
.66
·70
·45
·51
·51
·94 1.01
.65
.69
.61
.62
·55
·54 ·54 .62
·58
2.0
2.2
3
3 2.8
6.5
4.0
1.9
1.8
1.9
2.41
2.54 2o45
2.19
2.14
2.30
2-39
2.96
2.2
2.2 2.0
2.22
2.31
2.05
2.2
2.2
0.62
·58
·55
·55
·50
·52
·38
.48
.28
·45
·44
·44
.81
.61
·45
·71
.so
.64 ·57
·59
·50
·83 ·93
.66
.66
.65
.68
·55 ·57
·59
.6o
·56
2.3
2.2
4
5·2
4-8
4-5
1.8
1.8
1.5
2.66
2o31
2.57
2.38
2.15
2.21
3·37
2.65
1.9
2.0
2.0
2.17
2.29
2.22
2.3
2.2 2
Number
~ Mean
Ta (cont.)
1.06
·83
·55
Th
2.1
2.3
3
.48
2.68
2.1
2.1
2
Oo588
·547
.42
·44
·59
·45
•93
·58
2.18
2.05
2.21
2.18
2
1.64
Standard Deviation
...A2llk ...§!.!.2!:.. F
.2..!!!- ..J..!!!.. ~
Neg. 0.027 0.20NS
.024 .040 2.08NS
1.61NS
Neg. •009 .8()HS
2.48NS
.005 .061 1.02NS
.038 .041
Neg. .11 e42NS
Neg. .029 .08NS
Neg. o44NS
Neg. o51NS
Neg. .12 •78NS
1.40NS
.13NS
1.12NS
Neg. o17NS
Neg. .10
·97 1.18NS
.10 ·09
Neg. .10 .16NS
.07 7.00NS
Neg. ·58
Neg. o28 .SONS
Tables 1-6 23
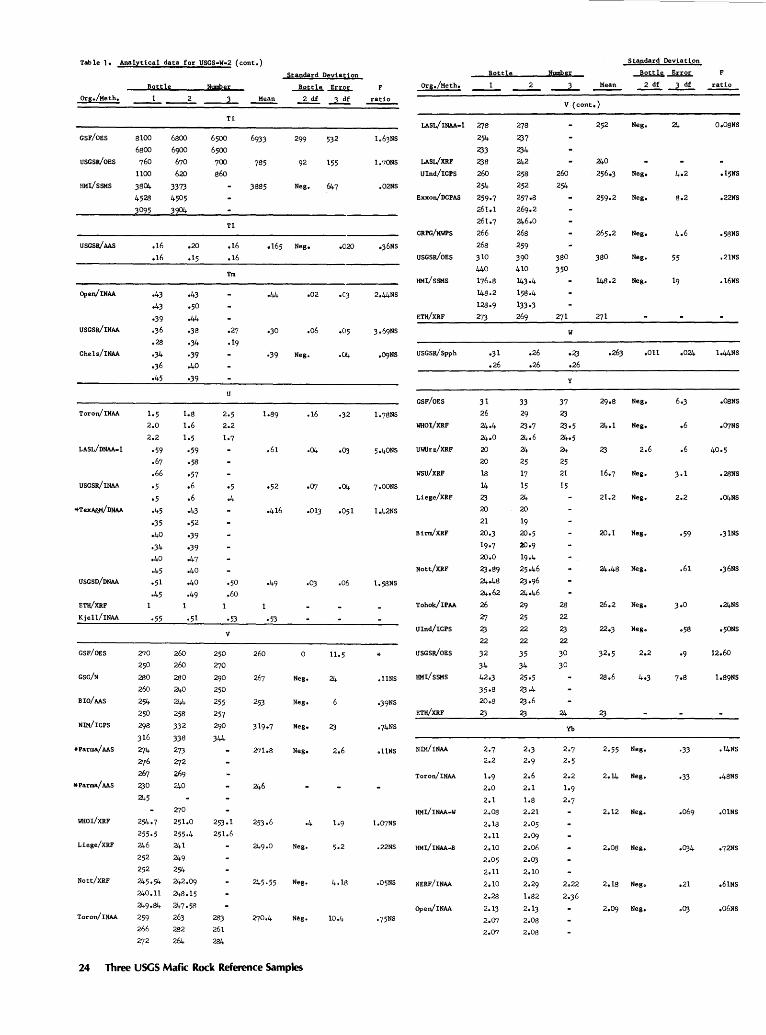
Tab 1e 1• Analytical data for USGS•W•2 ( cont,)
Org,/Meth,
GSF/OES
USGSR/OES
HMI/SSMS
USGSR/MS
OperVINAA
USGSR/INAA
Chels/INAA
Toron/INAA
LASL/DNAA-1
USGSR/INAA
*TexA&M/DNAA
USGSD/DNAA
ETH/XRF
Kjell/INAA
GSF/OES
csc/N
BIO/AAS
NIM/ICPS
*Parma/AAS
*Parma/AAS
WIIOI/XRF
Liege/XRF
Nott/XRF
Toron/INAA
Bottle
!3100
6!300
760
llOO
3!304
452!3
3095
.16
.16
·43
·43
·39
·36 .2!3
·34 o36
·45
1,5
2.0
2.2
2!30
260
254
250
29!3
316
274 276 267 2'.30
245
·59
.67
,66
·5
·5 o45
·35
.40
·34 .40
·45
·51
-45
240.ll
249·!34
259
266
272
6!300
6900 670
620
3373
4505
3904
.20
ol5
·43
·50
o44
·3!3
·34
·39 .40
·39
l,g
1.6
1.5
2!30
240
244
25!3
332
33!3
273
Z(2
41>9 240
·59
·5!3
·57
.6
.6
·43
·52
•39
·39
·47
o40
.40
·49
z;o 251.0
255·4
241
249
24!3.15
247o5!3
263
2!32
264
Number
2!33 261
2!34
Ti
Tl
.16
• 16
Tm
.27
.19
u
·50 .60
·53
v
Mean
6933
7!35
3!3!35
,165
·30
·39
.61
·52
.416
260
253
245·55
Standard Deviation
~~ 2 df ...l..!!!.
299 532
92 155
Neg, 647
Neg. .020
.02
.06
Neg. .(4
.16 ·32
·OJ
.013
·03 .06
0
Neg. 24
Neg.
Neg.
Neg,
Neg.
Neg.
Nag.
24 Three USGS MafiC Rock Reference Samples
F
ratio
l,63NS
,02NS
2.44NS
,Q9NS
5o40NS
7.00NS
lo42NS
,llNS
•74NS
.llNS
.22NS
•75NS
Org,/Meth.
LASL/INAA•l
LASL/XRF
Uind/ICPS
Exxon/DCPAS
CRPG/MWPS
USGSR/OES
HMI/SSMS
ETH/XRF
USGSR/Spph
GSF/OES
WIIOI/XRF
UWUrz/XRF
wsu/xRF
Liege/XRF
BirnVXRF
Nott/XRF
Tohok/IPAA
Uind/ICPS
USGSR/OES
HMI/SSMS
ETH/XRF
NIM/INAA
Toron/INAA
HMI/INAA•W
HMI/INAA·B
NERF/INAA
Open/INAA
Bottle
z;s 254
2'.33
2'.3!3
260
254
259·7
261.1
261.7
266
26!3
310
440
176.!3
14!3.2
12!3.9
273
31
·31
.26
26
24·4
24.0
20
20
1!3
14
2'.3
20
21
20.3
19·7
20.0
2'.3·!39
24-4!3
24.62
26
27
2'.3
22
32
34 42o3
35·!3
20.!3
2'.3
1.9
2.0
2.1
2.0!3
2.1!3
2.11
2.10
2.05
2oll
2,10
2.2!3
2.13
2.07
2.07
2
z;s 2'.37
2'.34
242
25!3
252
257·!3
269.2
246.0
26!3
259
390 410
143·4
15!3·4
133·3
269
33
.26
.26
29
2'.3·7
24.6
24
25
17
15
24
20
19
20.5
20o9
19,4
25o46
2'.3·96
24o46
29
25
22
22
35
34
25·5
2'.3·4
2J.6
2'.3
2.3 2.9
2.6
2.1
1.!3
2.21
2.05
2.09 2.06
2.0)
2.10
2o29
1.!32
2o13
2.08
2.0!3
NUD!ber
Mean
Standard Deviation
Bottle Error
2df ~
V (cont,)
260
254
3130
350
271
w
·23 .26
y
37
2'.3
2'.3·5
24·5
24
25 21
15
2!3
22
2'.3
22
30
30
24
Yb
Neg,
Neg,
259·2 Neg.
Neg.
3130 Neg •
Neg,
271
.on
29o!3 Neg,
Neg,
2.6
Neg,
21.2 Neg,
20.1 Neg,
24,413 Neg,
26.2 Neg,
Neg.
2.2
2.55 Neg,
2.14 Neg,
2,12 Neg,
2,0!3 Neg,
2,1!3 Neg.
Neg,
!3.2
55
.6
.6
3·1
2.2
·59
.61
o5!3
•9
·33
.069
.21
F
ratio
O.OSNS
ol5NS
.22NS
·5SNS
.21NS
.16NS
1.44NS
.OSNS
e07NS
o2SNS
,CJ4NS
.31NS
,36NS
o24NS
o50NS
12.60
.14NS
o4!3NS
,OlNS
o72NS
,61NS
,06NS
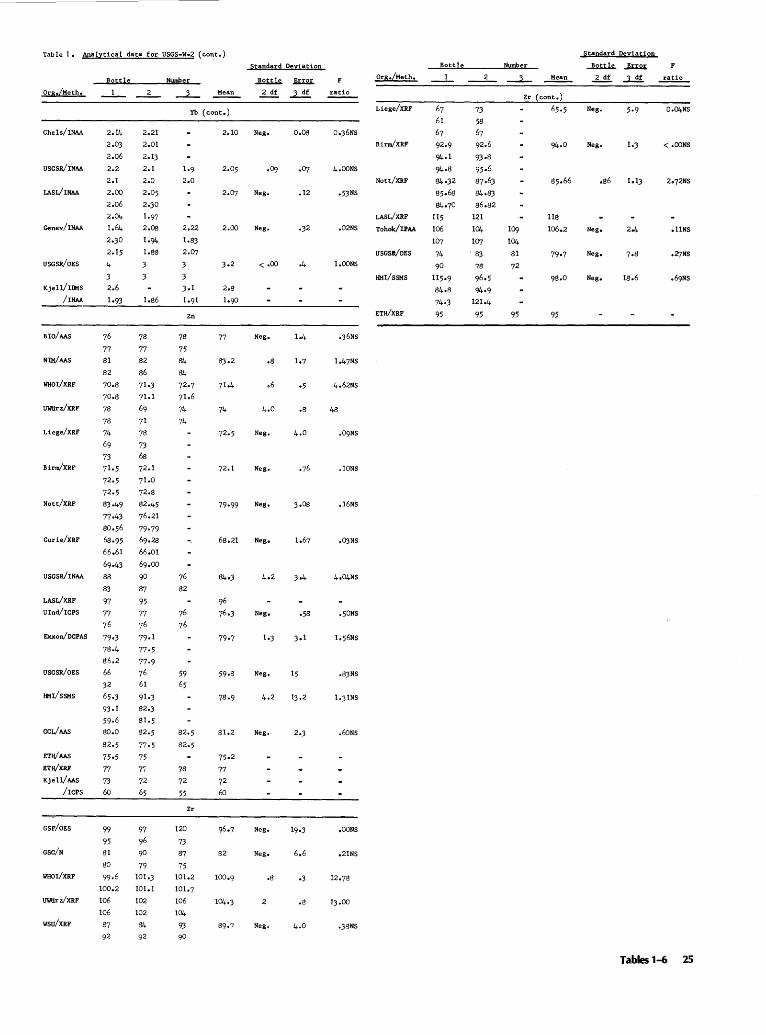
Table 1. Analytical data for USGS·W-2 (cont.)
Org./Meth.
Chels/INAA
USGSR/INM
IASI/INAA
Genev/INAA
USGSR/OES
Kjell/IIMS
/INAA
BIO/AAS
NIM/AAS
WHOI/XRF
UWUrz/XRF
Liege/XRF
BirnVXRF
Nott/XRF
Curie/XRF
USGSR/INAA
LASL/XRF
Ulnd/ICPS
EXxon/DCPAS
USGSR/OES
HMI/SSMS
CCL/AAS
ETWAAS
ETWXRF
Kjell/AAS
/I cPs
GSF/OES
GSC/N
WHOI/XRF
UWUrz/XRF
wsu/XRF
Bott1e
_1 __ 2_
2.14 2.21
2.0J 2.01
2.06 2.13
2.2 2.1
2.1 2.0
2.00 2.05
2.06 2.30
2.04 1·97
1.64 2.08
2.30 1.94
2.15 1.88
4 3
3 2.6
lo93 1.86
76
77 81
82
70.8
70·8
78
78
74
69
73
71·5
72·5
72·5
83-49
77·43
80.56
68-95
78
77
82
86
71·3
71.1
69
71
78
73 68
72.1
71.0
72.8
82.45
76.21
79·79
69.28
66.61 66.01
69-43 69.00
88
83
97
77
76
79·3
90
87 95
77
76
79·1
78.4 77·5
86.2
66
32
65·3
93·1
59·6 80.0
82.5
75·5
77
73
6o
99
95
81
80
99·6 100.2
106
106
87
92
77·9
76
61
91·3
82.3
81.5
82.5
77·5
75
71
72
65
97
96
90
79
101.3
101.1
102
102
84
92
Number
__1__ Mean
Yb (cont.)
2.10
1.9 2.05
2.0
2.22 2.00
1.83
2.07 3 3·2
Zn
78
75
84
84
72·7
71.6
74
74
76
82
59
65
78
72
55
120
73
87
75
Zr
101.2
101.7
106
104
93 90
77
74
72.1
79·99
68.21
59·8
81.2
75·2
77
72
6o
82
104.3
Standard Deviation
Neg. o.oa
·09 ·07
Neg. .12
Neg. ·32
< .oo
Neg.
.a
.6
.8
Neg.
Neg.
Neg.
Neg.
Neg. ·58
Neg.
13.2
Neg.
Neg.
Neg. 6.6
.s ·3
.8
Neg. 4.0
F
ratio
0.36NS
4.00NS
·53NS
.02NS
l.OONS
.36Ns
4.62NS
48
.IONS
.16NS
.OJNS
o50NS
.83NS
1.3lNS
.60NS
.OONS
o21NS
13.00
·38NS
Org./Meth.
Liege/XRF
BirnVXRF
Nott/XRF
LASL/XRF
Tohok/IPAA
USGSR/OES
HMI/SSMS
ETH/XRF
Bottle
67
61
67
92·9
94·1
94·8
84·32
85.68
84·70
115
106 107 74
90
115·9
84.8
74·3
95
73
58
67
92.6
93·8
95•6
87.63
84·83
86.82
121
104
107 .83
78
96·5
94·9 121.4
95
Number ___J__ Mean
Zr (cont.)
94·0
118
109 106.2
104
81 79·7
72
98.0
95 95
Standard Deviation
F
ratio
Neg, 0.04NS
Neg. 1.3 < .OONS
.86 1.13 2o72NS
Neg. ollNS
Neg. 7·8 o27NS
Neg. 18.6
Tables 1-6 25
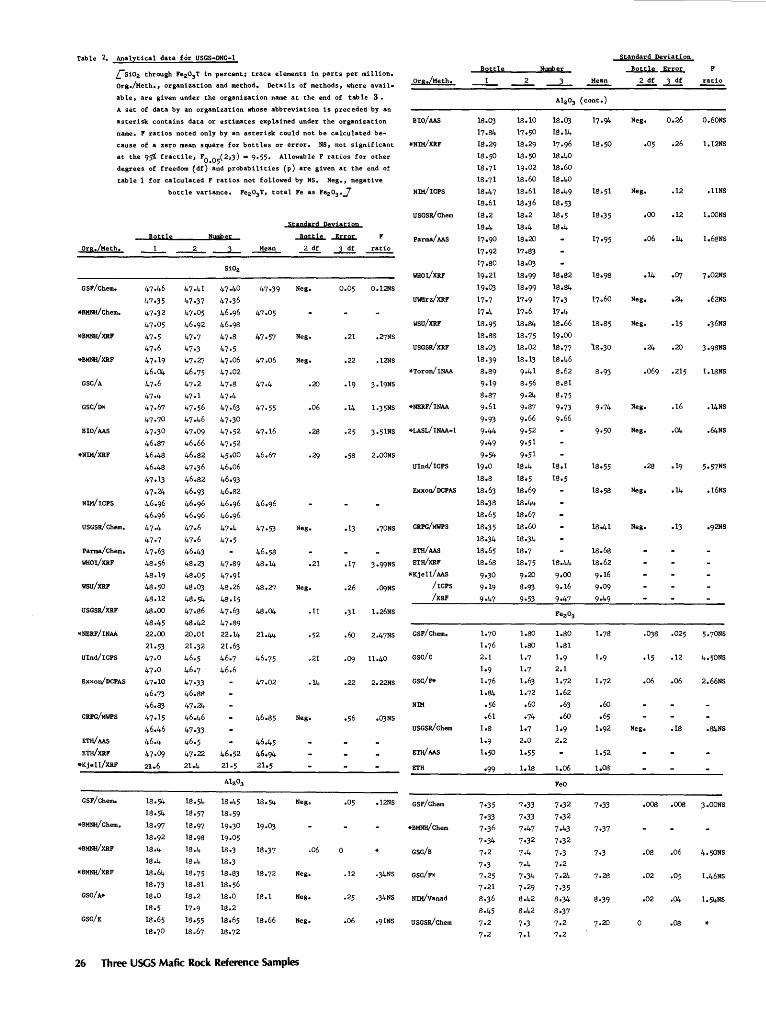
Table 2, Analytical data for USGS-DNC-1
["siOa through Fea03T in percent; trace elements in parts per million,
Ors./Meth, 1 organization and method, Details of methods 1 where avail
able, are given under the organization name at the end of table 3.
Org./Meth.
A set of data by an organization whose abbreviation is preceded by an
asterisk contains data or estimates explained under the organization BIO/AAS
name. F ratios noted only by an asterisk could not be calculated be•
cause of a zero mean square for bottles or error, NS, not significant •NIM/XRF
at the 9'5% fractile, F0 ,05
(2 13) = 9·55· Allowable F ratios for other
degrees of freedom (df) and probabiliti:es (p) are given at the end of
table 1 for calculated F ratios not followed by NS, Neg, 1 negative
Ors./Meth,
GSF/Cherno
*BMNH/ Chern,
GSC/A
GSC/D*
BIO/AAS
NIM/ICPS
USGSR/ Chern,
Parma/Chem,
WHOr/XRF
WSU/XRF
USGSR/XRF
*NERF/INAA
Uind/ICPS
Exxon/DCPAS
CRPG/MWPS
ETa/AAS
ETa/XRF
*Kjell/XRF
GSF/Chem..
*BMNa/Chem,
*BMNa/XRF
GSC/A*
GSC/E
bottle variance. Fea03 T, total Fe as Fea03 .J NIM/ICPS
BgttJe
47.46
47·35
47·32
47·05
47·5
47·6
47.19
46.04
47·6
47·4
47.67
47·70
47·30
46.87
46.48
46.48
47.13
47·24
46.96
46.96
47o4
47·7
47.63
48.56
48.19
48o50
48.12
48.00 48.45
22.00
21.53
47o0
47·0
47ol0
46·73
46.83
47.15
46.46
46.4
47·09
21.6
18.54
18.54
18.97
18.92
18.4
18.4
18.64
18.73
18.0
18.5
18.65
18.70
47.41
47·37
47.05
46.92
47·7
47·3
47·2:7
46·75
47.2
47.1
47o56
47o46
47.09
46.66
46.82
47·36
46.82
46.93
46.96
46.96
47o6
47.6
46.43
48.2)
48.05
48.0)
48.54
47o86
48.42
20.01
21.32
46.5
46.7
47·33
46.88
47o24
46.46
47·33
46·5
47o22
21.4
Number
SiOa
47·40
47·36
46.96
46.98
47o8
47·5
47o06
47o02
47.8
47·4
47.63
47·30
47·52
47·52
45o00
46.06
46·93
46o82
46.96
46.96
47·4
47·5
47o89
47·91
48.26
48ol5
47.63
47·89 22.14
21.63
46·7
46.6
46o52
21·5
Mean
47.06
47·55
48.27
21.44
47.02
18.37
18.1
18.66
USGSR/Chem Standard Qgyiatiop
..l.iU..UL ~ F Parma/AAS 2 df ~ ratio
WHOr/XRF
Neg. 0,05 O.l2NS
UWUrz/XRF
wsu/xRF Neg. .21 o27NS
USGSR/XRF
Neg, .22 .12NS
*Toron/INAA
.20
.06 .14 1.35NS *NERF/INAA
.28 .25 3•51NS *LASL/INAA-1
•58 2.00NS Uind/ICPS
Exxon/DCPAS
Neg, .13 o70NS CRPG/MWPS
ETa/AAS
.21 .17 3 o99NS ETa/XRF *Kjell/AAS
Neg. .26 .Q9NS /ICPS /XRF
.11 •31 1.26NS
.60 2.47NS GSF/Chern,
.21 ·09 11.40 csc/c
.22 2,22NS GSC/F*
NIM
Neg. USGSR/Chern
ETa/AAS
ETH
Neg, .12NS GSF/Chern
*BMNH/Chem
.06 0 GSC/B
Neg. .12 •34NS GSC/F*
Neg, .25 ·34NS NIM/Vanad
Neg, .06 •91NS USGSR/Chem
26 Three USGS MafiC Rock Reference Samples
Bottle
18.0)
17.84
18.29
18.50
18.71
18.71
18.47
18.61
18.2
18o4
17o90
17,92
17o80
19,21
19·03
17·7
17,4
18.95
18.88
18.0)
18.39
8.89
9·19
8.87
9o61
9•93
9·44
9·49
9·54 19.0
18.8
18.63
18.38
18.65
18.35
18.34
18.65
18.68
9·30
9·19
9·47
18.10
l7o50
18.29
18.50
19.02
18.60
18.61
18.36
18.2
18.4
18.20
17·83
lSoOJ
1So99
18.99
17·9
17.6
18.84
18.75
18.02
18.13
9o41
s.s6 9·24
9·87
9.66
9·52
9·51
9•51
18.4
18o5
18.69
18.44
18.67
18.60
18.34
18.7
18.75
9•20
8.93
9·53
1.80
1.80
1.7
1.7
1.63
1.72
.60
·74
1o7
2.0
1o55
1.18
Nup#!er
18.0)
18.14
17,96
18.40
18.60
18.40
18.49
18.53
18.5
18.4
18.82
18.84
17·3
17.4
18.66
19.00
18.77
18.46
8.62
8.81
8o75
9·73 9,66
18.44
9·00
9ol6
9·47
1.80
1.81
1.9
2.1
1.72
1.62
.63
.60 lo9
2.2
1,06
FeO
Mean
18o35
'18.30
8o93
9·74
1So55
18o58
18.41
18.68
18.62
9o16
9·09
9·49
1o52
1.08
7•33
8o39
Standard Deviation
...!2lll.L~
2 df ..l...!!!
Neg. 0.26
.05 .26
Neg, .12
.oo .12
.06
.14 ·07
Neg, •24
Neg. .15
.24 .20
.069 .215
Neg. .16
Neg. .04
.28 .19
Neg. .14
Neg. .13
.038 ,025
.15 .12
.06 .06
Neg. ,18
F
ratio
0,60NS
1,12NS
,llNS
l,OONS
1,6SNS
7o02NS
.62NS
o36NS
3o98NS
1,1SNS
.14NS
.64NS
,16NS
4,50NS
2.66NS
,84NS
,008 .008 3 ,OONS
.OS .06 4,50NS
.02 ,05 1.46NS
.02 .04 1,54NS
0 .os
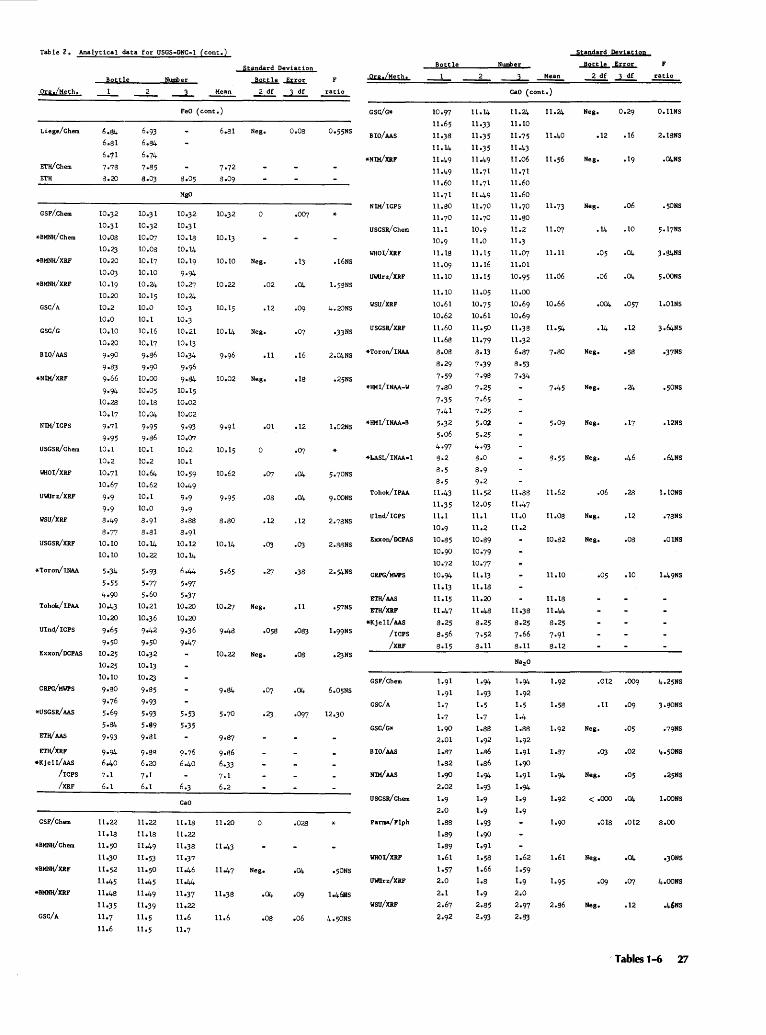
Table Z, Analytical data for USGS-DNC-1 (cont.)
Bottle Number
Standard Deviation
~Error On.fMetho
Org./Meth, Mean 2 df ~ ratio
Liege/Chem
ETH/Chem
ETH
GSF/.Chem
*BMNH/Chem
GSC/A
GSC/G
BIO/MS
NIM/ICPS
USGSR/Chem
WIIOI/XRF
UWilrz/XRF
WSU/XRF
USGSR/XRF
*Toron/INM
Tohok/IPM
Ulnd/ICPS
Exxon/DCPAS
CRPG/KWPS
*USGSR/AAS
ETH/AAS
ETH/XRF
*Kjell/AAS
/I CPS
/XRF
GSF/Chem
GSC/A
10.32
10.31
10.08
10.2J
10,20
10.0J
10.19
10.20
10.2
10.0
10,10
10.20
9•90
9·83 9o66
9·94
10.28
10.17
9·71
9·95 10.1
10.2
10.71
10.67
9·9
9·9 8-49
8·77
10.10
10.10
10.31
10.32
10.07
10,08
10.17
10,10
10.24
10.15
10,0
10.1
10.16
10,17
9o86
9•90
10,00
10.05
10.18
10.04
9·95
9·86
10.1
10.2
10.64
10.62
10,1
10.0
8.91
8.81
10.14
10.22
5·93
5·77
5o60
10.21
10.36
9o42
9o50
10o32
10,13
10.2J
9·85
9·93
5·93
5·99 9o8l
9·8~
6.20
7·1
6.1
FeO (cont.)
MgO
10.32
10.31
10.18
10.14
10.19
9·94
10.27
10.24
10,3
10.3
10.21
10,13
10,34
9·96
9·84 10.15
10.02
10.02
9·93 10,07
10.2
10.1
10,59
10o49
9·9
9·9 8.88
8.91
10.12
10.14
6-44
5·97
5•37
10.20
10.20
9o36
9-47
6.3
CaO
u.l8
ll.22
llo38
11o37
llo46
11-44
llo37
11.22
11.6
11.7
6.81
10.32
10.13
10.10
10.22
10.15
10.14
10.02
10.15
10.62
9·95
8.80
10.14
10.27
9o48
10.22
11.20
11o43
11o47
11.6
GSC/G*
Neg, o.os BIO/MS
NIH/I CPS ·007
USGSR/Chem
WIIOI/XRF Neg. .13 .16NS
UWilrz/XRF .02 .04
.12 ·09 4.20NS wsu/XRF
Neg, •33NS USGSR/XRF
.u .16 2.04NS *Toron/INM
Neg, .18 o25NS *HHI/INM-W
.01 .12 1,02NS
*LASL/INM-1
·07 ·04
.08 .04 9.00NS Tohok/IPM
.12 .12 2.78NS Ulnd/ICPS
.OJ .OJ 2.88NS Exxon/DCPAS
·38 CRPG/KWPS
ETH/AAS Neg, .u •57NS ETH/XRF
*Kje11/Ms ,058 .08) 1.99NS /ICPS
/XRF Neg, .as .2JNS
GSF/Chem .04 6,05NS
GSC/A 12.30
GSC/G*
BIO/AAS
NJM/AAS
USGSR/Chem
.028 Parma/F1ph
WHOI/XRF
Neg, ·04 o50NS UWilrz/XRF
·04 ·09 WSU/XRF
.os .06
Bottle
11.10
10.61
10.62
11.60
ll.68
8.08
8-29
7·59
7·80
7·35
7·41
5·32
5o06
4·97
8.2
8·5
8o5
11-43
11,35
11.1
10.9
l0o85
10.90
10o72
10.94
11.13
11.15
11-47
8-25
8.56
8o15
llo14
11o33
11,35
11o35
llo49
11.71
11.71
11.49
11.70
llo70
10.9
11.0
ll. 15
ll.16
llo15
llo05
10-75
10.61
11.50
llo79
8.13
7·39
7·98 7·25
7·65
7o25
5·~
5·25
4·93 s.o
8·9
9·2
11.52
12.05
ll.1
ll.2
10.89
10o79
10.77
llo13
11.18
11.20
11.48
8.25
7·52
8.11
Number
cao (cont.)
11.24
ll.10
llo75
llo43
11.06
11.71
11.60
11.60
11.70
11.80
11.2
11.3
ll.07
11.01
10-95
11.00
10.69
10.69
llo38
11.32
6.87
8o5J
7·34
ll.88
llo47
11.0
ll.2
11o38
8.25
7-66
s.u
llo24
ll.ll
11.06
10.66
11.54
11.62
n.os
10.82
11.10
11.18
11.44
8-25
7·91
8.12
1.61
2.86
Standard Deviatiop
ratio
Neg, 0.29 O.llNS
.12 .16 2.18NS
Neg, .04NS
Neg. .06 .50NS
.14 .10
.os .04
.o6 .04 5,00NS
·004 .057 l,01NS
o14 o12
Neg, •58 •37NS
Neg, ,24 .50NS
Neg, .17 .12NS
Neg, .46 .64NS
.06 .28 1,10NS
Neg, .12 •78NS
Neg, .08 .01NS
o05 .10
.012 .009
.11 .09
Neg. .05 •79NS
.OJ .02
Neg, o05 o25NS
< .ooo ·04 1,00NS
.018 ,012 8.00
Neg, o04 o30NS
4.00NS
Neg, .12
Tables 1-6 27
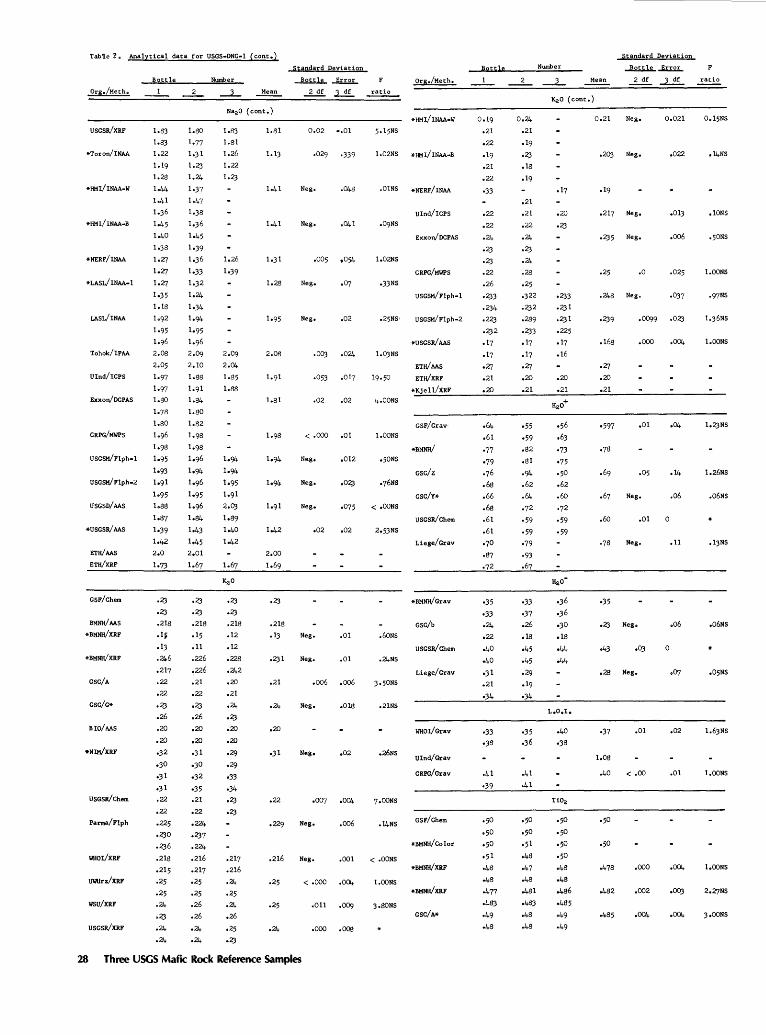
Table 2. Analytical data for USGS-DNC•l (cont.)
Org./Meth.
USGSR/XRF
*Toron/INAA
*HMI/INAA-W
*IIMI/INM•B
*NERF/INAA
*LASL/INM-1
LASL/INM
Tohok/IPM
Ulnd/ICPS
Exxon/DCPAS
CRPG/MWPS
USGSM/Flph-1
USGSM/Flph-2
USGSD/MS
*USGSR/MS
ETH/MS
ETH/XRF
GSF/Chem
BMNH/AAS
*BMNH/XRF
*BMNH/XRF
esc/A
GSC/G*
BIO/AAS
USGSR/Chem
Parma/Flph
WHOI/XRF
UW\Irz/XRF
WSU/XRF
USGSR/XRF
Bottle
·23
·23
.218
.rs
.13
,2J+6
.217
.22
.22
·23 .26
.20
.20
·32
•30
·31
·31
.22
.22
.225
·230
·236
.218
.215
.25
.25
.24
·23
.24
.24
·23
·23 .218
.15
.11
.226
.226
.21
.22
·23 .26
.20
.20
·31
•30
·32
·35 .21
.22
• 224
·237
.224
.216
.217
.25
.25
.26
.26
·24
·24
Number
1.83 1.81
1.26
1.22
1.23
·23
·23
.218
.12
.12
.228
.242
.20
.21
·24
·23
.20
.20
.29
.29
•33
·34
·23
·23
.217
.216
·24
.25
.24
.26
.25
·23
Mean
1.81
1.13
1-41
1.31
1.28
1o95
2.08
1.81
1-42
.218
.13
.21
.24
.20
·31
.22
.216
.25
.25
Standard Deviation
~ ..!!:!:.2L 2df ~
0.02 -.01
.029 ·339
Neg. .048
Neg, .041
Neg. •07
Neg. .02
.OOJ .024
.053 .017
.02 .02
< .000 ,01
Neg. .012
Neg. o02J
Neg. •075
.02 .02
Neg, .01
Neg, .01
.oo6 .oo6
Neg, .018
Neg, ,02
.007 .004
Neg • .006
Neg. .001
< .ooo .004
.011 .009
.ooo .008
28 Three USGS Mafic Rock Reference Samples
Org,/Meth.
ratio
,01NS *NERF/INM
Ulnd/ICPS
Exxon/DCPAS
1.02NS
CRPG/MWPS
•33NS
USGSM/Flph-1
.25NS· USGSM/Flph-2
*USGSR/AAS
l,OJNS
ETH/MS
19,50 ETH/XRF
4.00NS
1,00NS
e50NS
< ,OONS
2.53NS
.60NS
.24NS
.21NS
,26NS
.l4NS
< .OONS
l.OONS
3.80NS
*Kjell/XRF
GSF/Grav·
csc/z
GSC/Y*
USGSR/Chem
Liege/Grav
*BMNH/Grav
GSC/b
USGSR/Chem
Liege/Grav
WHOI/Grav
Ulnd/Grav
CRPG/Grav
GSF/Chem
*BMNH/ Co lor
*BMN!f/XRF
GSC/A*
Bottle
Ool9
.21
.22
o19
.21
.22
•33
o22
.22
·24
·23
·23
.22
.26
·233
·234
.223
·232
.17
o17
·27 .21
.20
.64
.61
•77
•79
·76
.68
.66
.68
.61
.61
·70
·87 ·72
·35
•33
·24
.22
·40
·40 ·31
.21
·34
•33
•38
-41
·39
0.24
.21
.19
·23
.18
o19
.21
.21
.22
.24
·23
.24
.28
.25
·322
-232
.289
·233
.17
.17
·27 .20
.21
·55
·59
.82
.81
·94
.62
.64 ·72
·59
·59
·79
·93
.67
·33
•37
.26
.18
·45
·45
o29
o19
·34
.41
.41
·50
·50
·51
.48
·47
.48
-481
·483 .48
.48
Number
ol7
.20
·23
·233
·231
·231
.225
o17
.16
.20
.21
Mean
Standard Deviation
~Error
2df ~
0.21 Neg, 0.021
.20J Neg. .022
.217 Neg, ,013
·235 Neg. .oo6
.25 .o .025
.248 Neg. .037
·239 .0099 .023
.168 .ooo .004
·27 .20
.21
·597 ,01
.67 Neg,
.60 .01
.78 Neg.
·35
•23 Neg.
.28 Neg.
·37 .01
1.08
.40 < .oo
·478 .ooo
-482 .002
.485
.04
.06
0
.11
.o6
0
.02
.01
.004
.OOJ
·004
ratio
O.l5NS
.l4NS
,IONS
,50NS
l.OONS
1.00NS
1,23NS
1,26NS
.06NS
.1JNS
,06NS
,05NS
1.6JNS
l.OONS
l,OONS
3e00NS
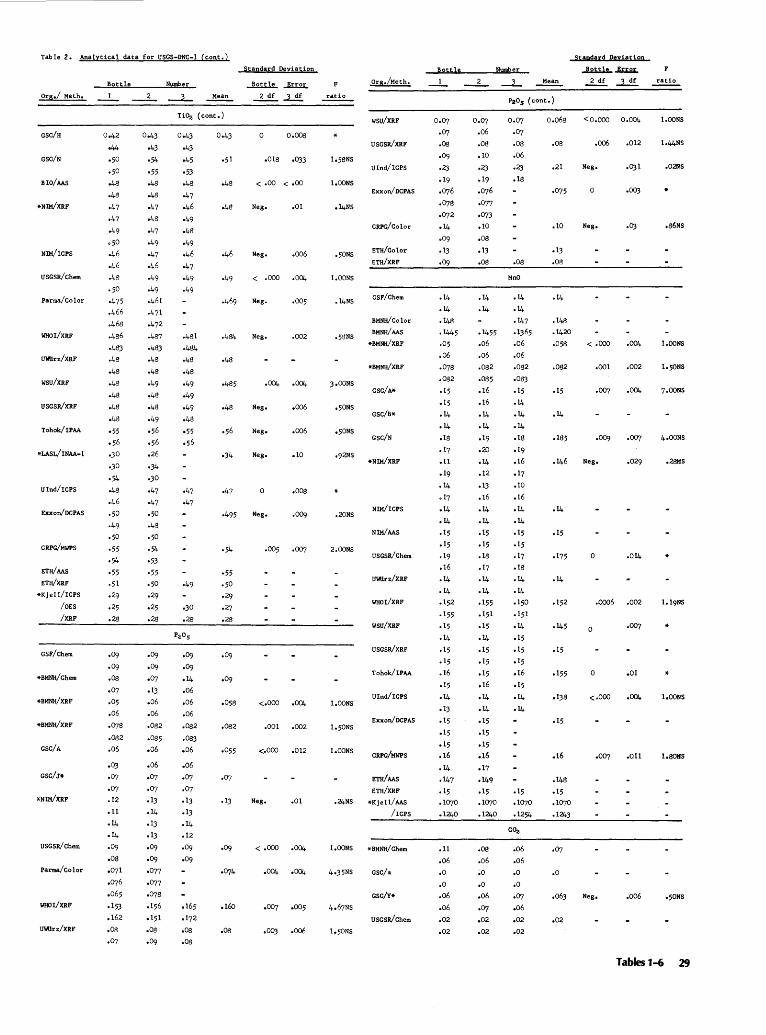
Table 2. Analytical data for USGS-DNC-1 (cont.)
Org,/ Meth,
GSC/H
GSC/N
BIO/MS
NIM/ICPS
USGSR/Chem
Parma/Color
WHOI/XRF
UWUrz/XRF
wsu/XRF
USGSR/XRF
Tohok/IPAA
Ulnd/ICPS
Exxon/DCPAS
CRPG/MWPS
ETH/AAS
ETH/XRF
*Kje11/ICPS
/OES
/XRF
GSF/Chem
*BMNH/Chem
*BMNH/XRF
GSC/A
USGSR/Chem
Parma/Color
WHOI/XRF
UWUrz/XRF
Bottle
Oo42
o44
·50
·50
o48 o48
·47
·47
·49
·50
o46
o46
.48
·50
·475 .466
.468
·486
·483 .48
o48
.48
o48
o48
o48
·55
·56
o30
o30
·54 o48
o46
·50
·49 ·50
·55
·54 ·55
·51 o29
o25
.28
·09 ·09 .08
o07
.05
.06
·078
.082
.06
.OJ
o07
,07
.12
.11
·14
·14
·09 .08
o071
·076
,065
ol5J
.162
.08
·07
Oo43
·43
·54 ·55
.48
.48
o47
o48
o47
o49
·47
.46
·49
·49 .461
·471
·472
.487
.483
.48
.48
·49 o48
o48
o49
o56
·56
.26
·34 o30
·47
·47
·50
.48
·50
·54 ·53
·55 ·50
.29
o25
.28
·09 ·09 ·07
.lJ
.06
.06
.082
.085
.o6
.06
o07
.07
.13
·14
.13
.13
.09
·09 .077
·077
·078
ol56
ol5l
.08
·09
Standard Deviation
Num!?er ~~ F
Mean 2 df ~ ratio
TiOz (cont.)
Oo43 Oo43
·43
o45 ·51
·53
.48 .48
·47
o46 ·48
·49 .48
·49 o46 o46
·47
·47
o47
o30
.28
·09 ·09 ·14
.06
.o6
.o6
.082
.08)
.o6
.06
.07
.07
.13
.13
·14 .12 o09
o09
.165
ol72
.as
.08
.48
o485
·48
•34
·495
·54
·55 ·50
.29
·27 .28
o058
.082
.13
.16o
.08
0 0.008
.018 ·OJ3 lo58NS
< .oo < .oo 1,00NS
Neg. .or o14NS
Neg. ,006 o50NS
< .ooo .004 1.00NS
Neg. .005 .14NS
Neg. .002 .5SNS
,OQ4 ·004 3.00NS
Neg, ,006 •50NS
Neg, .006 o50NS
Neg. .10 o92NS
.008
Neg, ·009 ,20NS
.005 2.00NS
.OQ4 1,00NS
,001 .002
.012 1.00NS
Neg, .01 .24NS
<·000 1,00NS
.004 4o35NS
·007 .005
.00) .006
Org./Meth.
wsu/xRF
USGSR/XRF
Uind/ICPS
Exxon/DCPAS
CRPG/Go1or
ETH/Co1or
ETH/XRF
GSF/Chem
BMNH/Co1or
BMNHIMS
*BMNH/XRF
*BMNH/XRF
GSC/A*
GSC/B*
csc/N
NIM/ICPS
NIM/AAS
USGSR/Chem
UWUrz/XRF
WHOI/XRF
wsu/xaF
USGSR/XRF
Tohok/IPAA
Ulnd/ICPS
Exxon/DCPAS
CRPG/MWPS
ETH/AAS
ETH/XRF
*Kjell/MS
/rePs
*BMNH/Chem
GSC/a
GSC/Y*
USGSR/Chem
Rattle
0.07
·07
.08
.09
·23 .19
.076
·078
.072
·14
.09
.13
·09
.14
·14 .148
·1445 .05
.06
.078
.082
.15
.15
·14
·14
.18
.17
.11
.19
.14
.17
·14
·14
.15
,15
.19
.16
.14
·14
.152
.155
.15
·14
.15
.15
.16
o15
·14
.13
.15
.15
o15
.16
.14
·147
.15
.1070
.1240
.11
.06
.o
.o
.06
.06
.02
,02
Number
_L., Mean
PzOs (cont.)
0,07 Oo07
.o6 ·07
.08 .08
.10 .06
·23 ·23 .19 .18
.076
.077
.073
.10
.08
ol3
.o8 .os
·1455 .06
.06
.082
.085
.16
.16
·14
·14 o19
.20
o14
.12
o13
.16
·14
·14
.15
.15
.18
.17
·14
·14
.155
.151
o15
.14
.15
.15
o15
.16
·14
·14
o15
.15
ol5
.16
ol7
·149 .15
.1070
.1240
.08
.06
~0
.a
.06
·07 .02
.02
MnO
·14
.14
·147
.1365
.06
.06
.082
.08)
.15
·14 ·14
·14
.18
.19
.16
.17
.10
.16
·14
·14
.15
.15
.17
.18
·14
·14
.150
.151
·14
.15
o15
.15
.16
o15
·14
·14
.15
.1070
.1254
COz
.06
.06
.o
.a ·07 .o6 .02
.02
o.o6s
.08
.21
.075
.10
o13
.08
.148
.1420
.058
.082
.15
.14
.185
.15
.175
.152
·145
.15
ol55
o138
.15
.16
.148
.15
.1070
.1243
.o
.063
.02
Standard Deyiation
ratio
<o.ooo o.o04 1.00NS
.006 .012 1.44NS
Neg. .OJ1 ,Q2NS
0 .003
Neg. .OJ o86NS
<·000 .004 1.00NS
.001 .002
.004 7.00NS
.009 .007 4o00NS
Neg, ,029 .28MS
0 .014
.0006 .002
0 ·007
0 .01
<·000 .004 1,QONS
.011 1o801fS
Neg, .oo6 o50NS
Tables 1-6 29
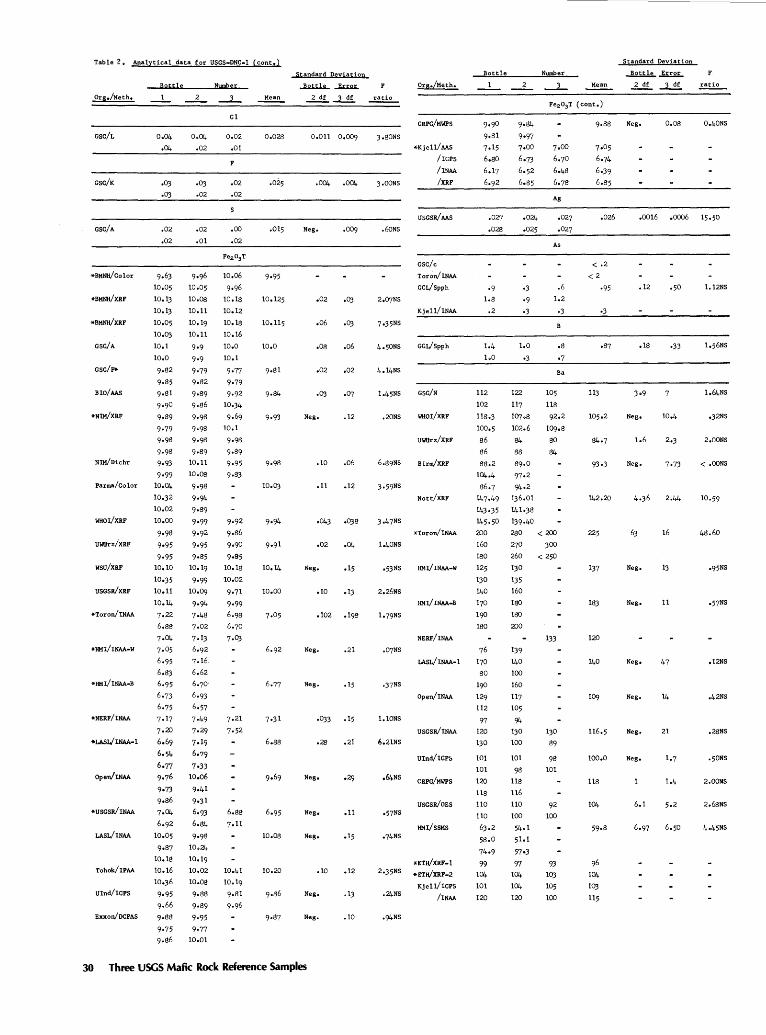
Table 2. Analytical data for USGS-DNC-1 (cont.)
Org./Metho
csc/L
GSC/K
GSC/A
*BMNH/Color
GSC/A
GSC/F*
BIO/AAS
*NIM/XRF
NIM/Dichr
Parma/ Co lor
WHOI/XRF
UWUrz/XRF
wsu/xRF
USGSWXRF
*Toron/INAA
*IIMI/INAA-W
*HMI/INAA-B
*NERF/INAA
*LASW INAA•l
Open/INAA
*USGSWINAA
LASL/INAA
Tohok/IPAA
Ulnd/ICPS
Exxon/DCPAS
Bgttle
.02
.02
2
0.04
.02
·OJ .02
.02
.o1
9•96
10.05
10.08
10.11
10.19
10.11
9•9
9•9
9·79
9·82
9·89
9·86
9·98
9·98
9·98
9·89
10.11
10.08
9·98
9·94 9·89
9•99
9•92
9•95
9·85
10.19
9·99
10.09
9·94
7·48
7·02
7·13
6.92
7o16
6.62
6.70-
6.93
6.57
7·49
7·29
7·19
6.?9
7·33 10.06
9·41
9·31
6.93
6.84
9·98
10.21,.
10.19
10.02
10.08
9·88
9·89
9·95
9·77
9·86 10.01
Number
Cl
0.02
.01
.02
.02
.00
.02
6.88
7·11
Mean
0.028
.o25
.015
10.125
10.115
10.0
9·81
9·93
9·94
10.14
10.00
7·31
6.88
10.08
10.20
Standard Deviation
o.o11 o.oo9
.004 .004
Neg,
.02 ·03
.06
.08 .06
.02 .02
·07
Neg. • 12
.10 .06
.11 .12
·043 ·038
.02
Neg, .15
.10 .13
.102
Neg. .21
Neg. .15
.033 .15
.28 .21
Neg. ·29
Neg. .11
Neg. .15
.10 .12
Neg. .13
Neg. .10
30 Three USGS MafiC Rock Reference Samples
Bottle Nwnber
Org./Meth. _1_ _2_ ---..L ratio
CRPG/MWPS 9·90 9·84
3·80NS 9·81 9•97
*Kje11/AAS 7•15 7.00 7•00 7•05
/rePs 6,80 6.73 6.70 6.74
/INAA 6.17 6.52 6.48 6,39
Standard Deviation
Bottle~
~~
Neg. 0.08 0.40NS
3.00NS ____ f_XR __ F ______ 6_.~92 _____ 6_.8~5 ____ 6_._7_8 ______ 6._8~5-----------------------
.60NS
7 •35NS
4.50NS
.20NS
•53NS
2.26NS
,07NS
·37NS
l,lONS
6.21NS
.64NS
•57NS
•74NS
,21,.NS
USGSR/AAS
GSC/c
Toron/INAA
CCL/Spph
Kje11/INAA
GCJ/Spph
GSC/N
WHOI/XRF
UWUrz/XRF
BirnVXRF
Nott/XRF
*Toron/INAA
HMI/INAA•W
HMI/INAA-B
NERF/INAA
LASL/ INAA-1
Open/INAA
USGSR/INAA
Ulnd/ICPS
CRPG/MWPS
USGSR/OES
HMI/SSMS
*ETJ:I/XRF-1
*ETWXRF-2
Kjell/ICPS
/INAA
.027
.028
·9 1.8
.2
1.4
1.0
112
102
118.3
100.5
86
86
88.2
104.4
86.7
147.49
143·35
145·50
200
160 180
125
130
140
170
190
180
76
170
80
190
129
112
97
120
130
101
101
120
118
110
110
63.2
58.0
74·9
99 104
101
120
.021,.
.025
1.0
•3
122
117
107o8
102.6
84
88
89.0
97·2
94·2 136.01
141.38
139·40
280
270
260
130
135
160
180
180 200
139
140
100
160
117
105
94 130
100
101
98
118
116
110
100
54o1
51.1
57·3
97 104
104
120
Ag
.027
.027
As
.6
1.2
·3
.8
•7
Ba
<200
300
< 250
133
130
89
98
101
92
100
93 103 105
100
.026
< .2
<2
·95
·3
113
93·3
142.20
225
137
183
120
140
109
116.5
100.0
118
104
59·8
96
104
103 115
.0016 .ooo6 15.50
.12 1.12NS
.18 ·33
3•9 1.64NS
Neg • •32NS
1.6 2.3 2.00NS
Neg. 7·73 < ,OONS
2.44
16 48.60
Neg, 13 •95NS
Neg. 11 •57NS
Neg. 47 .12NS
Neg. .42NS
Neg, 21 .28NS
Neg. .50NS
2.00NS
6.1 2.68NS
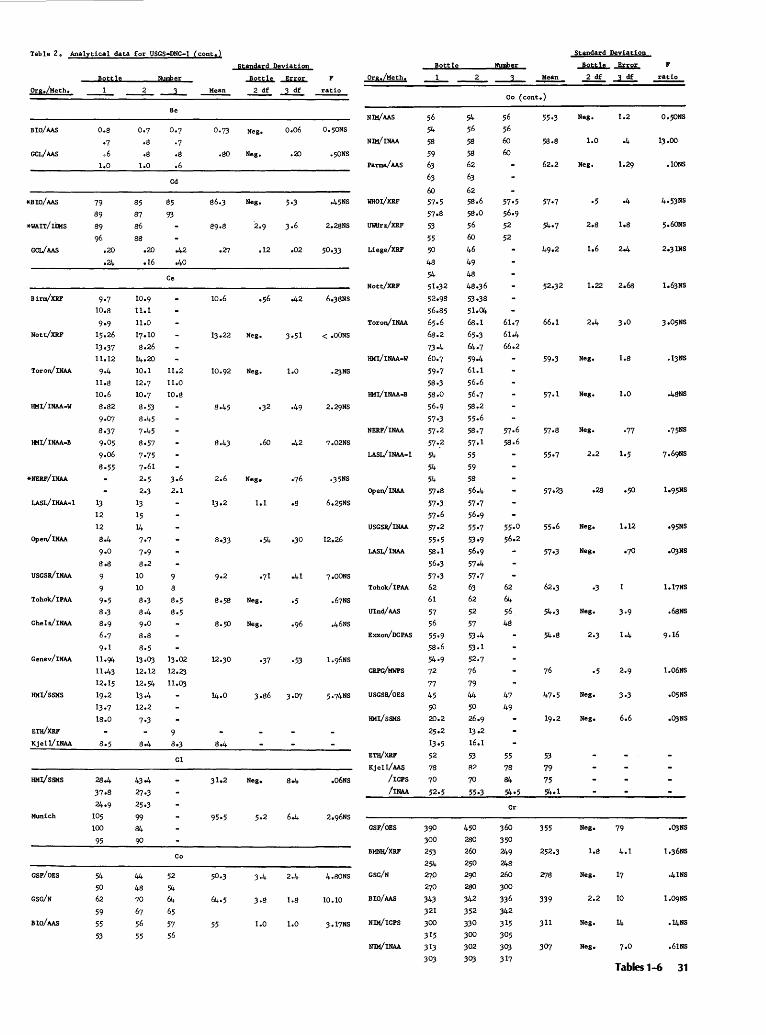
Table 2, Analytical data for USGS•DNC-1 (cont,)
Org,/Meth,
BIO/AAS
GCL/AAS
*BIO/AAS
*WAIT/riMS
Nott/XRF
Toron/INAA
HMI/INAA-W
HHI/ INAA-B
LASL/INAA-1
Open/INAA
USGSR/INAA
Tohok/IPAA
Che1s/INAA
Genev/INAA
HMI/SSMS
ETH/XRF
Kjelt/INAA
HMI/SSMS
Munich
GSF/OES
GSC/N
BIO/AAS
Bottle
0.8
·7 .6
1.0
13
12
12
.20
·24
8-4
9·0
8.8
28.4
37·8
24·9 105
100
95
54 50
62
59
55
53
Number
Be
Oo7 Oo7
.8 ·7
.s .s 1.0 .6
Cd
85 85
87 93 86
88
.20 o42
o16 o40
10.9
11.1
u.o 17.10
8.26
14o20
Ce
10.1 ll.2
12.7 ll.O
10o7 10o8
8·53
8·45
7·45
8·57
7·75
7•61
2.5
2·3
13
15
14
7•7
7•9
8.2
10
10
8o3
8.4
9•0
8.8
8·5
13·03
12.12
12.54
13o4
12.2
7•3
8-4
44
48
70
67
56
55
2.1
C1
Co
52
54
64 65
57
56
Standard Deyiation
Mean
o.o6
.80 Neg, .20
86.3 Neg.
·2:7 .12 .02
10.92 Neg, 1.0
8.43 .60 o42
2.6 Neg.
1.1 .s
8o33 ·30
.41
Neg.
Neg.
12.30 •37 ·53
Neg, 8-4
6-4
1.8
55 1.0 1.0
F
ratio
.50NS
o45NS
2,28NS
6.38NS
< ,OONS
.2JNS
7o02NS
6,25NS
12.26
7o00NS
.67NS
,46NS
5·74NS
,06NS
4.80NS
10.10
3•17NS
Standard Deviation
-£BlL!oto.~;tJ..!1e.._ __ ..JNumb!lllll.!.lieili.r_ .A2W.L. ..!u.2£. F
Org./Meth,
NIH/AAS
NIH/INAA
Parma/AAS
WHOI/XRF
UliUrz/XRF
Liege/XRF
Nott/XRF
Toron/INAA
56
54 58
59
63
63
60
57·5
57·8
53
55
50
48
54
51o32
52·98
56.85
65.6
68.2
73·4 HMI/INAA•W 60.7
59·7
58·3
HHI/INAA·B 58•0
56·9
57·3
NERF/INAA 57•2
57·_2
LASL/INAA-1 54
Open/INAA
USGsR/INAA
LASL/INAA
Tohok/IPAA
Uind/AAS
Exxon/ DC PAS
CRPG/MWPS
USGSR/OES
HMI/SSMS
ETH/XRF
Kje11/AAS
/I CPS
/I.NAA
GSF/OES
BMNH/XRF
GSC/N
BIO/AAS
NIH/ICPS
NIH/INAA
54 54
390 300
253
254
2:70 270
343
321
300 315
313
303
2 __l_ ~ 2 df ...J..1L ratio
Co (cont.)
54 56
58
58 62
63
62
58·6
58·0 56
60
46
49
48
48-36
53·38
51.~
52
52
68.1 61.7
65·3 61.4
64.7 66.2
450
280
260
250
290 280
342
352
330
300 302
303
62
64 56
48
47
49
55
78
84
54·5
Cr
58.8
62.2
66.1
55o6
57·3
53
79
75
54·1
355
2:78
339
307
Neg, 1.2 0,5QNS
1.0
Neg. 1.29 ,IONS
2.8 1.8 5e60NS
2e31NS
Neg, 1.8 .13NS
Neg, 1.0 o48NS
Neg, ·77 •75NS
2.2
le95NS
Neg, 1.12
Neg. e03NS
.68NS
l,06NS
Neg,
Neg, 6.6 e03NS
Neg, 79
Neg. 17 .41NS
2.2 10
Neg, 14 o14NS
Neg, ,61NS
Tables 1-6 31

Table 2. Analytical data for USGS-DNC-1 (cont.)
Parma/ AAS 3 26
322
)OS
WHOI/XRF 243 .8
236.6
UWrz/XRF ,308
312
BirnVXRF 229•3
245·7
2}2.0
Nott/XRF 275.10
283·25 267-40
Toron/INAA 310
302
308
HMI/INAA-W 2?6
269
265
HMI/INAA-B 390
375
370
NERF/INAA 2?S
2?6
LASL/INAA-1 283
281
289
USGSR/INAA 278
281
LASL/INAA 250
243
2?1
Tohok/IPAA 255
252
Exxon/DCPAS 307•2
222.9
225·9
CRPG/MWPS 297
297 USGSR/OES 490
HMI/SSMS 490
117·7
1$3.6
S3·5 ETH/XRF 267
Kjell/AAS 320
/ICPS 295
/INAA 347
GSC/M
Toron/INAA
LASVlNAA-1
USGSR/INAA
HMI/SSMS
Kjell/INAA
GSF/OES
GSC/N
120
97
97
lOJ
.6
·5
.4
.20
.08
306
315
319
2JS.O
2J4.1 310
310
2'.37·8
2'Jlo5
2'.31·5
2?4·28
2?7.61
273·63
31S
307
313
268
281
256
375
395
360
281
273
283
304
301
283 2?6
272
269
266
262
254
295·3
295·7
295·9
297
294 490
530
171·5
101.8
152.8
274
325
295
361
1.0
120
100
97
114
.24
.14
.11
Nugi>er
Mean
Cr (cont.)
316
233·3 234.2
228.8
312 310.2
309
2}6.2
275-21
300 307.7
295
316
378
279 2?8 280
275
2?8
243
247
490
400
2?1
298
355
Cs
·5
.o
.22
Cu
110
92
89
104
262
2?3·8
< 1.4
.42
< .8
.15
·2'.3
101
32 Three USGS Mafic Rock Reference Samples
Standard Deviation
Neg. 8.18
2.2 2.5
Neg. 2.0
Neg. 7.0
Neg. 5.8
Neg. 9•7
Neg. 14
Neg. 3·4
6.6 8.6
Neg. 3·3
6.0 3·8
2'.3•9 33•S
o.o 1.5
17 40
Neg. 44
.11 .oa
Neg. .064
Neg. 14
Neg.
ratio
0.64NS
2.52NS
.04NS
.03NS
< .OONS
1.12NS
.04NS
.02NS
•54NS
2o78NS
l.OONS
1.37NS
o15NS
1.46NS
.20NS
.22NS
o45NS
Bottle
Org./Meth.
BIO/AAS 97
97
Parma/ AAS 95
88
95
WHOI/XRF 85•9
82.6
UWrz/XRF 97
98
Nott/XRF 89•29
90.90
89·49
Curie/XRF 86.05
S5o05
85.65
Ulnd/ICPS 96
99 Exxon/DCPAS 10J .8
10J.J
99·5
CRPG/MWPS 99
93 USGSR/OES 110
110
HMl/SSMS 51•73
USGSR/AAS
ETH/AAS
ETH/XRF
Kje11/AAS
/ICPS
/OES
Toron/INAA
NERF/INAA
Genev/INAA
Kjell/liMS
Kjell/IIMS
NIM/INAA
Toron/INAA *
Toron/INAA
HMI/INAA•W
HMI/INAA•B
NERF/INAA
LASL/INAA-1
USGSR/INAA
57·51
43·64
130
102
95
S4
75
10J
47
•77
·71
.61
.68 ·51
.64
·5S .60
.621
.634
o583
.601
·578
·558
.65
.64
o49
·52 o51
·58
·56
Standard Deviation
Nwnber ~ Error F
Mean 2 df 3 df ratio
Cu (cont.)
98 95
96 96
100
100
94 88.6 85·4
85.1 80.7
97 100
97 98
$4.66
87·79
89o06
87·09
88.37
87·09
98 95
98 99
100.8
105·3
106.9
92
94 110 110
120 110
69·36
41.62
46o24
108 104
109 106
93 91 S4
77 75
105 lOJ 55 74
Dy
).21 3·2'.3
2.60 2o53
2.25 3.00
2.8 2.1
2.4 2.5
3·39 4.41
.65
·5S
.6J
.61
-~7 .62
o72
·6? .614
.615
·564
·537
·545
·553
·58
·59 .61
·54
·54
.65
·51
Er
Eu
.61
·75
·74
.60
·71
o4S
·55 ·53
.62
.62
95·3
.06 ,2•7
.8 ·9
88.53
Neg. 2.0
Neg. 2.8
Neg. 3.2
112 < .o 4
Neg. 11.6
110 Neg. 11.5
94 a6
76
104
59
2.2 .42 .24
4.16 Neg. •74
2.0
.068
.629 .026
·599 .040
.605 Neg. .028
·562 .022 .016
.62 .006
·535 .0)6 .OJO
•573 Neg. o058
1.80NS
J.OlNS
1.00NS
2.60NS
3•77NS
.12NS
.SSNS
.90NS
l,OONS
.02NS
o48NS
1.18NS
7.00NS
.25NS
1.46Ns
.4JNS
5.l6NS
.02NS
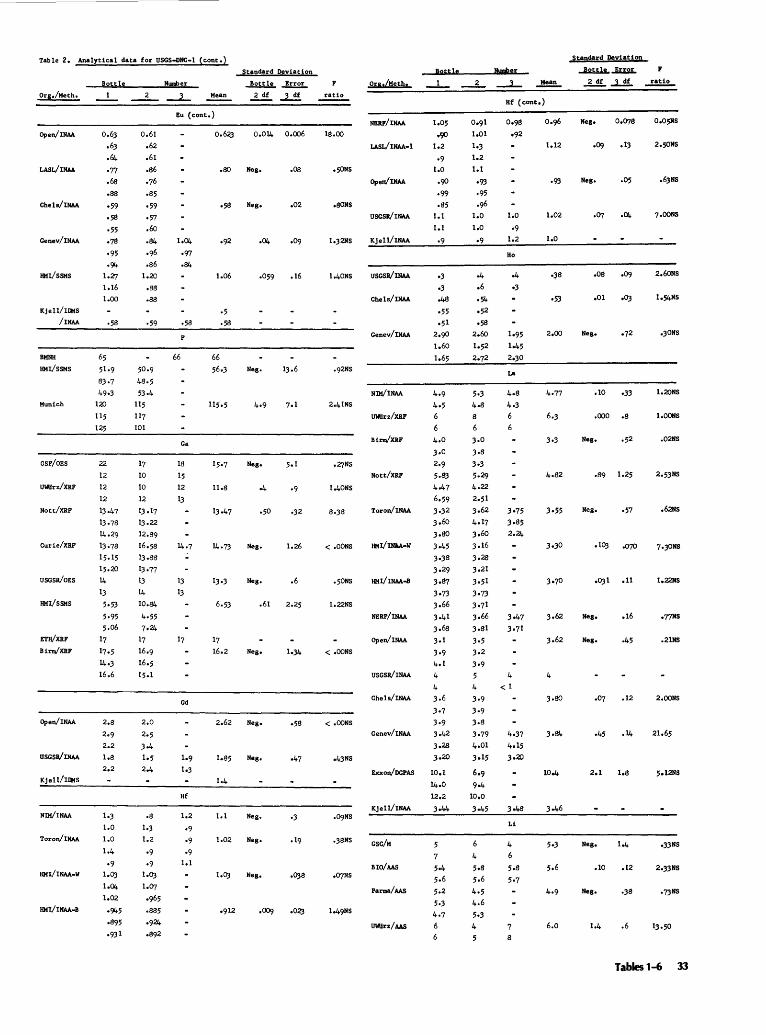
Table 2. Analytical data for USGS-DNC-1 (cont.)
Org,/Meth.
Open/INAA
LASL/INAA
Chels/INAA
Genev/INAA
HMI/SSMS
Kjell/IIMS
/INAA
BMNH
HMI/SSMS
Munich
GSF/OES
UWUrz/XRF
Nott/XRF
Curie/XRF
USGSR/OES
HMI/SSMS
ET!f/XRF
BirnVXRF
Open/INAA
USGSR/INAA
Kjell/IIMS
NIM/INAA
Toron/INAA
HMI/INAA-W
HMI/INAA-B
Bottle
Oo63
.63
.64 •77 .68 .sa ·59
·58 ·55 ·78
·95
·94 1.27 1.16
1.00
·58
2.8
2.9
2.2
1.8
2.2
loJ
1.0
1.0
1.4
·9 1.0J 1.04 1.02
·945 ·895 ·931
0.61
.62
.61
.s6 ·76
o85
·59 ·57
.60
·84
·96 .s6
1.20
.ss
.ss
·59
17
10
10
12
13.17
13.22
12.89
16.58
13.88
13·77
13
14 10.84
4-55
7·24 17
16.9
16.5
15ol
Number
Mean
Standard Deviation
Bottle ~
2 df 3 df
Eu (cont,)
F
66
Ga
18
15
12
13
13
13
Gd
Hf
0.62;3 o.ou. o.oo6
• so Neg • .os
Neg. .02
1.06 .16
Neg. 13.6
u.s
13-47 ·32
Neg. 1.26
13·3 Neg. .6
6.53 .61 2.25
Neg.
Neg. ·58
lo85 Neg. ·47
1.1 Neg. ·3
1.02 Neg.
l.OJ Neg,
·009
F
ratio
18.00
r50NS
,gONS
1.40NS
2.41NS
1.40NS
< ,OONS
.50NS
1.22NS
< oOONS
< ,OONS
.Q9NS
.38NS
Ora,/Meth.
LASL/INAA-1
Open/INAA
USGSR/INAA
Kjell/INAA
USGSR/INAA
Chels/INAA
Genev/INAA
NIM/INAA
UWUrz/XRF
BirnVXRF
Nott/XRF
Toron/INAA
HMI/nw.-w
NERF/INAA
Open/INAA
USGSR/INAA
Che1s/INAA
Genev/INAA
Exxon/DCPAS
Kjell/INAA
GSC/M
BIO/AAS
Parma/AAS
UWUrz/AAS
Bgt:tlg
1,05
..r;o 1.2
·9 1.0
·90 ·99 .85
1.1
1.1
·9
·3 ·3 .48
·55 •51
2.90 1.60
1.65
10,1
1.4.0 12.2
3·44
Standard Deviation
Nwpber ...l2lllL ..JI.I!IL .,
Mean 2 df ....l.l!. ratio
Hf (cont,)
Or98
·92
1.0
•9 1.2
Ho
La
4 < 1
4·37 4o15
3·20
Li
4
8
1.12
1.0
·53
2.00
4·77
6.3
4.82
3o62
4
10.4
3.46
6.0
Neg, 0,078 Oo05NS
·09 .13 2,5QNS
Neg. .05
·04 7•00NS
.os .09 2.60NS
.ot •OJ
Neg, ,30NS
.to ·33 1.20NS
.ooo .s t.OONS
Neg. .52 .02NS
.89 1.25 2.53NS
Neg. •57 .62Ns
.lOJ .070 7•30NS
.OJl .11 t,22Ns
Neg, ,16 •77NS
Neg. ·45 .21NS
.12 2.00NS
.1.4 21.65
2.1 1.8 5e12NS
Neg, 1.4
.10 .12 2,33NS
Neg. •73NS
.6
Tables 1-6 33
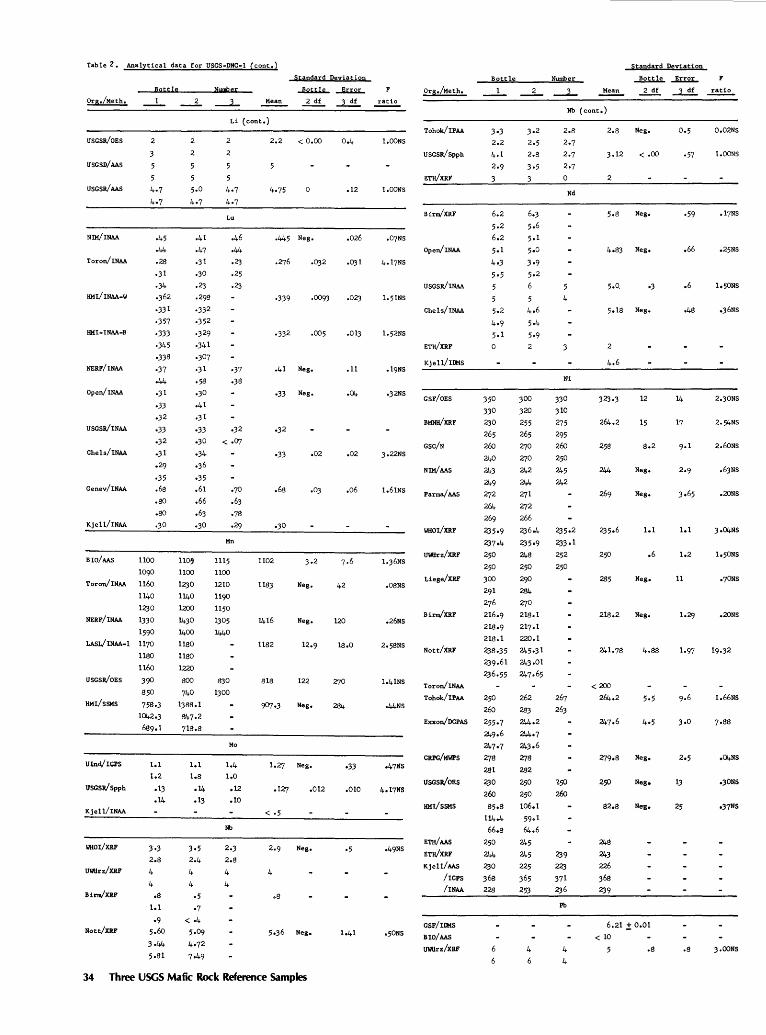
Tab 1e 2 , Ana 1ytica 1 data for USGS-DNC-1 (cont.)
Standard Deviation
Bqtt:le Number
_1_ __2_ _..l_ ..1!2llk. ~
~~~~
USGSR/OES 2
USGSD/AAS
USGSR/AAS
NIM/JNAA
Toron/INAA
HMI/ INAA-W
HMI-INAA-B
NERF/INAA
·45
.44
.28
·31
·34
·362
·331
·357
·333 ·345
·338
·37
.44
Open/INAA .31
·33 ·32
USGSR/INAA •33
·32
Che1s/INAA .31
.29
·35 Genev/INAA .68
.so
.so Kjel1/INAA .30
B IO/ AAS 1100
1090
Toron/INAA 1160
1140
1230
NERF/INAA 1330
1590
LASL/INAA-1 11?0
USGSR/OES
HMI/SSMS
Ulnd/ICPS
USGSR/Spph
Kje11/JNAA
WHOI/XRF
UWilrz/XRF
Birn/XRF
Nott/XRF
11SO
1160
390
850
758·3
1042.3
689.1
l.l
1.2
.13
.14
3·3 2.8
4
4 .8
1.1
·9 5.6o
3·44
5.81
Li (cont.)
2
2
2 2.2 < o.oo
.41
·47
·31
·30
·23 .298
·332 ·352
·329
·341
·30?
·31
·58
·30 o41
·31
Lu
.46
·44 ·23 .25
·23
·37
·38
·33 ·32
·30 < ·07
·34
·36
·35
.61 ·70
.66 .63
.63 ·78
·30 .29
Mn
1105 1115
1100 1100
1230 1210
1140 1190
1200
1430
1400
1180
11SO
1220
800
?40
1388.1
84?o2
?18.8
l.l
1.8
-14
.13
3·5
2.4
4
4
·5
·7 < ·4 5·09 4.72
7·49
1150
1305
1440
830
1300
Mo
1.4
1.0
.12
.10
Nb
2.3
2.8
4
4
.445 Neg,
·339 .0093
.005
.41 Neg.
•33 Neg.
·32
·33 .02
.68 ·03
·30
1102 3·2
1183 Neg,
1416 Neg.
1182
818 122
Neg.
1,27 Neg,
.12? .012
< ·5
Neg,
4
.a
5,36 Neg,
34 Three USGS Mafic Rock Reference Samples
l,OONS
.12 l,OONS
.026 .O?NS
.OJ1 4•1?NS
.023
.013
.11
.C\4 o32NS
.02 3o22NS
.o6 1,61NS
1.36NS
42 .08NS
120 ,26NS
18.0 2o58NS
1o41NS
284 .44NS
·33 o4?NS
.010
•49NS
•50NS
Org./Meth,
Tohok/IPAA
USGSR/Spph
ETH/XRF
Birn/XRF
Open/INAA
USGSR/INAA
Chels/INAA
ETH/XRF
Kje11/Jli1S
GSF/OES
BMNH/XRF
GSC/N
NIM/AAS
Parma/AAS
WHOI/XRF
UWilrz/XRF
Liege/XRF
Birn/XRF
Nott/XRF
Toron/INAA
Tohok/IPAA
Exxon/DCPAS
CRPG/MWPS
USGSR/OES
HMI/SSMS
ETH/AAS
ETH/XRF
Kje11/AAS
/I CPS
/INAA
GSF/Ili1S
BIO/AAS
UWilrz/XRF
Bottle
6.2
5·2 6.2
5·1
4·3
5·5
5·2
4·9
5·1
0
350
330
230
265
26o
240
243
249
2?2
2€.4
269
235·9
237·4
250
250
300
291
2?6
216.9
218.9
218.1
238.35
239o61
236·55
250
26o
255·7
249·6
247·7
2?8
281
230
260
85.8
114.4
66.8
250
244 230
368
228
2
300
320
255
265
2?0
2?0
242
244 2?1
2?2
266
236·4
235•9
248
250
290
284
2?0
218.1
21?.1
220.1
245·31
243.01
247·65
262
283 244.2
244·7 243·6
2?8
282
250
250
106.1
59·1
€.4.6
245
245
225
365
253
4 6
Nwnber
Standard Deviation
~ Error
_.L Mean 2df ~ ~
Nb (cont.)
Nd
4
Ni
330 310
2?5
295
260
250
245
242
235·2
233·1
252
250
239
223 371
236
Pb
4
4
2.8 Neg,
3.12 < .oo
2
Neg,
4•83 Neg,
5o0. ·3
5,13 Neg,
258
285
218.2
<200
2€.4.2
279·8
250
82.8
248
243
226
368
239
12
15
8.2
Neg,
Neg,
1.1
.6
Neg.
Neg,
Neg,
Neg.
Neg,
6.21 :!: 0.01
<10
.8
0.02NS
·57 1.00NS
·59
.66 ,25NS
.6 1.50NS
·48 ,36NS
14 2,30NS
1? 2.54NS
2.60NS
,63NS
,20NS
1.1 3•04NS
1.2 1,50NS
11 •?ONS
,20NS
1.66NS
3·0
2o5 o04NS
13 •30NS
25 •37NS
.a 3.00NS

Table 2. Analytical data for USGS-DNC-1 (cont.)
Org./Meth.
Birm/XRF
ETH/XRF
BIO/AAS
WHOI/XRF
UWrz/XRF
wsu/XRF
Birm/XRF
Nott/XRF
LASL/ INAA-1
Tohok/IPAA
Ulnd/ ICPS
USGSR/OES
HMI/SSMS
ETH/XRF
GSC/c
Toron/INAA
HMI/INAA•W
HMI/INAA·B
NERF/INAA
LASL/INAA-1
USGSR/INAA
Kje11/INAA
GSF/OES
NIM/INAA
Toron/INAA
HMI/INAA-W
HMI/INAA·B
Bottle
10
12
4.0
4·4
1
1.98
1o35
1.99
7
·9
·7 .81
.64 ·77
·95
·93 •93
o98
1.00
•91
.22
·24 ·98
1.08
1.29
1.0
1.0
.88
8.0
6.8
6.8
13
10
5o1
3•9
·7 .8
.82
•77
·83 ·87
1.oo ·97
o87
1.09
·90 o25
1.02
1.08
1.08
1.2
.8
·91
.31.0 30.1
Standard Deviation
Number ~~
Mean 2 df ....l..!!!,
Pb (cont.)
Rb
0
.8
·7
·55
·57
.69
.21
1.1
·7 •75
Sc
OoZ?
10
10 ·3
4.4 Neg.
4•9 Neg.
3·44 Neg.
8.8 Neg.
4.0 .2
5·23 Neg.
1.2 ,()()
1.94 .11
.8 Neg,
•942 Neg.
o85
Neg.
Neg.
.6
·55
.2
o40
o4
·35
.1
:0?0
.11
1.0
.81
F
ratio
1o48NS
1ol7NS
,21NS
.27NS
,2QNS
o81NS
o38NS
1.00NS
.17NS
.06NS
o02NS
•37NS
,12NS
3o80NS
2.61NS
< oOONS
o.31NS
Bottle Number
Org./Meth. __ 1_ _ __ 2_ __,L ~
NERF/INAA
LASL/ INAA-1
Open/INAA
USGSR/INAA
LASL-INAA
USGSR/OES
HMI/SSMS
ETH/XRF
Kjell/INAA
NIM/INAA
Toron/INAA
HMI/INAA-W
HMI/INAA-B
NERF/INAA
Open/INAA
USGSR/INAA
LASI/INAA
Che1s/INAA
Genev/INAA
Kje11/IDMS
/INAA
GSF/OES
GSC/N
lfiM/AAS
BJJJ/AAS
Parma/AAS
WHOI/XRF
UWrz/XRF
32.0
32·3
31
31
31
.32.1
30.6
32·5
31·7
30.1
30.2
30.8
31·3
41
44
21.11
18.59
12.47
29
26.8
160 165
180 128
145
152
15.3
145
14.3
124 117
118
144o4 145o2
1.38
138
Sc (cont.)
32o2
31o8
31
34
34
31.0
3lo8
30.0
30•3 29·9
29.6 31·.3
31.1
31•9
31·4
45 42
42 43
19·93
11.02
17.01
28 29
28,6 28o4
1.30
185 l90 110
108
154 154 157
145
117
119
117
143·7
142o9
138
140
Sm
1o7
1.6
1.20
1o25
1o29
1o57
Sr
150
195
195
91
94 15.3
154 1.39
148
141.1
143·.3
1.35
137
.32
31•33
31.1
43
1o53
1.266
1o55
1o34
1oJ4
2.61
11.3
153
146
143o4
Standard Deviation
~.!!!:2!.... ~ ~ ratio
0.20 0.22 2o72NS
1.2 1.2 4o00NS
.13 ·95 l.06NS
Neg. •91
.41 .48
Neg. 1.8 .21NS
Neg, 4,5 .15NS
·09 .o6
Neg. •.35NS
0 ·045
Neg, .037 ,2QNS
Neg, ,()42 .63NS
Neg, .14
.()4 1.40NS
Neg. o48NS
Neg. .06 •77NS
Neg. o15 ollNS
22
.6 .6 3o50NS
Neg. 6.2 ·92NS
Neg. 2.8
1.1 1.0 .3•34NS
1.2 3o50NS
Tables 1-6 35
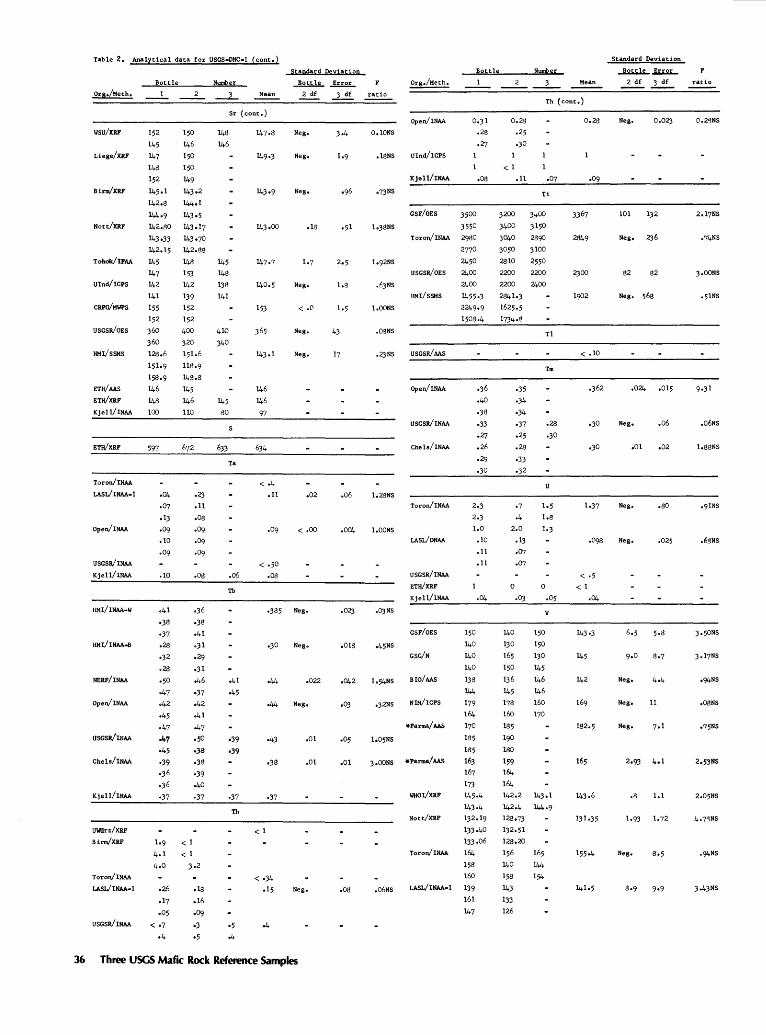
Table 2, Analytical data for USGS-DNC-1 (cont,)
Standard Deviation
Org,/Meth,
wsu/XRF
Liege/XRF
Birm/XRF
Nott/XRF
Tobok/IPAA
Ulnd/ICPS
CRPG/MWPS
USGSR/OES
HMI/SSMS
ETH/AAS
ETH/XRF
Kjell/INAA
ETH/XRF
Toron/INAA
LASVINAA-1
Open/INAA
USGSR/INAA
Kjell/INAA
HMI/INAA-W
HMI/INAA-B
NERF/INAA
Open/INAA
USGStVINAA
Chels/INAA
Kjell/INAA
UWrz/XRF
Birm/XRF
Toron/INAA
LASL/INAA-1
USGSR/INAA
Bottle
152
145
147
148
152
145ol
142.8
144o9
142.80
143·33
142.15
145
147
142
141
155
152
360 360
128,6
151·9
158·9
146
148 100
597
·04
·07 o13
·09 .to
.09
.to
o41
·38
•37
.28
·32 .28
·50
·47
o42
·45
·47
.4? ·45
·39
•36
150
146
150
150
149
143o2
144.1
143·5
143·17
143·70
142.88
148 153 142
139
152
152
400
320
151.6
118.9
148o8
145
146
110
.os
·36
·38
o4l
·31 .29
·31
o46
•37
o42 o4l
o47
·50 ·38
o3S
·39
o36 Jt,O
·37 ·37
1o9 < 1
4.1 < 1
4o0 3o2
.26 ol7
o05
< •7
·4
o18
,16
·09 ·3 ·5
Number
Mean 2 df
Sr (cont.)
148 147o8 Neg,
146
145
148
138
141
410
340
145
80
Ta
,06
Tb
o41
o45
•39
•39
·37
Th
·5 o4
143•9
143o00
153
143ol
146
146
97
634
< o4
.u
.09
<.so .os
Neg,
Neg,
.18
1.7
Neg,
< ,()
Neg.
Neg.
.02
< .oo
•385 Neg,
o30 Neg.
·44 .022
o44
.43
·37
< 1
< ·34
.15
o4
Neg,
.ot
.01
Neg,
36 Three USGS MafiC Rock Reference Samples
3 df
2o5
1.8
43
.06
.004
.02J
.018
o042
.os
,01
.os
Standard Deviation
Bott1e Number ...!.2lllL .k!.2L.. 1 ____ 2___ ____3 __ Mean ~ ~ ratio
ratio Th (cont.)
O,lONS
.18NS
•73NS
lo33NS
1.92NS
.63NS
1.00NS
,Of!NS
.2JNS
Open/INAA
Ulnd/lCPS
Kjell/INAA
0.31
.28
.27
1
.os
GSF/OES 3500
3550
Toron/INAA 2930
2770
2450
USGSR/OES 2400
2400
HMI/SSMS 1455•3
USGSR/AAS
Open/INAA
USGSR/lNAA
Che1s/INAA
2249·9
1508.4
·36
.40
·38
·33 .27
.26
o29
0.23
.25
•30
< 1
.u 1
o07
Ti
3200 3400
3400 3150
3040 2890
3050 3100
2810 2550
2200 2200
2200 2400
2B41o3
1625·5
1734·8
Tl
·35
·34
·34
·37
.25
.28
·33
Tm
.28
o30
.30 •32
1,28NS
l,OONS
.OJNS
o45NS
1,54NS
o32NS
lo05NS
Toron/INAA
LASL/DNAA
USGSR/INAA
ETH/XRF
Kjell/INAA
GSF/OES
GSC/N
BIO/AAS
NIM/ICPS
•Parma/AAS
2.3
2o3
1.0
.10
.11
.11
1
.04
150
140
140
140
138
144
179
164
170
185
3 ,OONS *Parma/ AAS
135
163
167
,06NS
173
WHOI/XRF 145•4
143·4
Nott/XRF 132,19
133.40
133.06
Toron/INAA 164
158
160
LASL/INAA-1 139
161
147
·7 .4
2.0
.13
·07 o07
0
140
130
165
150
136
145
178
16o
185
190 180
159
164
164
.OJ
u
0
.05
v
150
150
130
145
146
146
160
170
142,2 143ol
142.4 144·9
128.73
132.51
128.20
156 165
140 144
158
143
133
126
154
0.28 Neg. 0.02)
101 132
2849 Neg, 236
82 32
Neg, 563
< .10
·362 .024 .015
o30 Neg, ,06
o30
< ·5 < 1
.04
143·3
145
142
182.5
165
143·6
131·35
14lo5
.01 .02
Neg, .so
Neg. .025
Neg, 4•4
Neg, 11
Neg, 7,1
2.93 4.1
.s 1.1
Neg. 8.5
0,2f!NS
2o17NS
•74NS
•51NS
,06NS
o91NS
.68NS
o94NS
o08NS
2o53NS
3·43NS
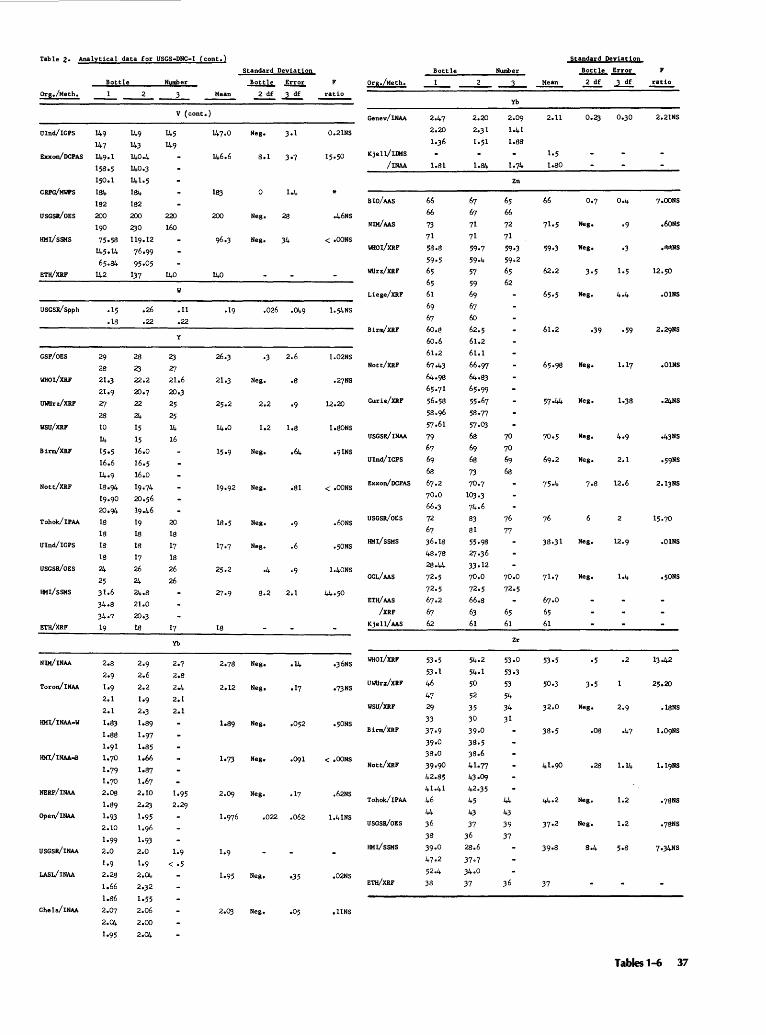
Table z. Analytical data for USGS-DNC-1 (cont.)
Bottle Number 1 __ 2 ___ 3_
Uinci/ICPS 149
147
Exxon/DCPAS 149.1
l5So5
150.1
CRPG/MWPS 184
USGSR/OES
HMI/SSMS
ETH/XRF
USGSR/Spph
GSF/OES
WHOI/XRF
UWUrz/XRF
wsu/XRF
Birm/XRF
Nott/XRF
Tohok/IPAA
Ulnd/ICPS
USGSR/OES
HMI/SSMS
ETH/XRF
NDf/INAA
Toron/INAA
HMI/ INAA·W
NERF/INAA
Open/INAA
USGSR/INAA
LASI./INAA
Chels/INAA
1S2
200
190
75o5S
145·14
65.84 142
29
.15
.Is
28
21.3
21.9
27
28
10
14
15·5
16.6
14o9
1S.94
19·90
20.94
18
lS
lS
IS
24
25
31.6
34oS
34·7
19
V (cont.)
149
143
140·4
140·3
141·5
184 1S2
145
149
200 220
2JO 160
119.12
76·99
95·05
137 140
w
.26 .11
.22 .22
y
28 2J
2J 27 22.2 21.6
20.7 20o3
22 25
24 25
15 14
15 16 16.0
16.5
16.0
19·74
20.56
19o46
19
lS
lS
17
26
24 24oS
21.0
20.3
lS
20
lS
17
18
26
26
Yb
2.7
2.S
2.4
2.1
2.1
Standard Deviation
Bottle Error F
Mean ~ .1....!!!.. ratio
Neg. 3•1 0.21NS
146.6 Sol 3•7
l8J 0 1.4
200 Neg, 28 o46NS
Neg. 34 < .OONS
140
.026 ·01.9
26.3 ·3 2.6 1.02NS
2lo3 Neg. .s .27NS
2.2 ·9 12.20
1.2 l,S 1o80NS
Neg. .64 •91NS
19o92 Neg, .st < .OONS
Neg. .60NS
Neg. .6 o50NS
1.40NS
S.2 2.1
lS
2o7S Neg, •14 •36NS
2.12 Neg. .17 •73NS
1.89 Neg. ,052 o50NS
lo73 Neg. .091 < ,OONS
2.09 Neg. .17 .62NS
lo976 .022 .062 1.41NS
1.95 Neg, •35 .02NS
Neg, ,llNS
Bottle Number __ 1 ___ 2_ --L- ~
Genev/INAA
Kjell/IIItS
/INAA
BIO/AAS
WHOI/XRF
WUrz/XRF
Liege/XRF
Birm/XRF
Nott/XRF
Curie/XRF
USGSR/INAA
Ulnd/ICPS
l.Sl
66 66
73 71
58-8
59·5
65
65
61
69
67
6o.s 60.6
61.2
67-43
64o9S
65o7l
56o5S
5S·96
57o6l
79
67
69
6s Exxon/DCPAS 67.2
USGSR/OES
HMI/SSHS
GCL/AAS
ETH/AAS
/XRF
Kjell/AAS
WHOI/XRF
UWUrz/XRF
wsu/XRF
Birm/XRF
Nott/XRF
Tohok/IPAA
USGSR/OES
HMI/SSMS
70.0
66.3
72
67
36.1S
4So7S
28.44
72·5
72·5
67.2
67
62
53·5
53.1
46
47
29
33
37·9
39·0
38.0
39·90 42.S5
41.41
46
44
36
3S
39·0
47o2
52.4
3S
1.84
67
6? 71
71
59·7
59·4
57
59
69
67
60
62.5
61.2
61.1
66.97
64.8J 65•99
55·67
58·77
57·03
6S
69
68
73
70·7
l0Jo3
74.6
83
Sl
55·98
27·36
33ol2
70.0
72·5
66.s
63
61
54o2
54ol
50
52
35
30
39·0
38·5
3S.6
41·77
43·09
42·35
45
43
37
36
28.6
37·7
34o0
37
Yb
2.09
1.41
l.ss
76
77
Zn
Zr
53o0
53·3
53
54
34
31
44
43
39
37
lo5
1.so
66
61.2
57-44
3S·31
53·5
32.0
37•2
37
Standard Deviation
..!2ill!.. .!.£!:.2!.. 2df ~ ratio
0.2] 0.30 2.21NS
7o00NS
.6oNS
Neg. ·3 .~~NS
12.50
Neg. .01NS
·39 ·59
Neg. 1.17 ,01NS
Neg. 1.3S o24NS
Neg. •43NS
Neg. 2.1
12.6 2.13NS
Neg. .OlNS
Neg. o50NS
·5 .2
25o20
Neg, .lSNS
.os
.28
Neg. 1.2 ·7SNS
Neg. 1.2 •7SNS
5oS
Tables 1-6 37
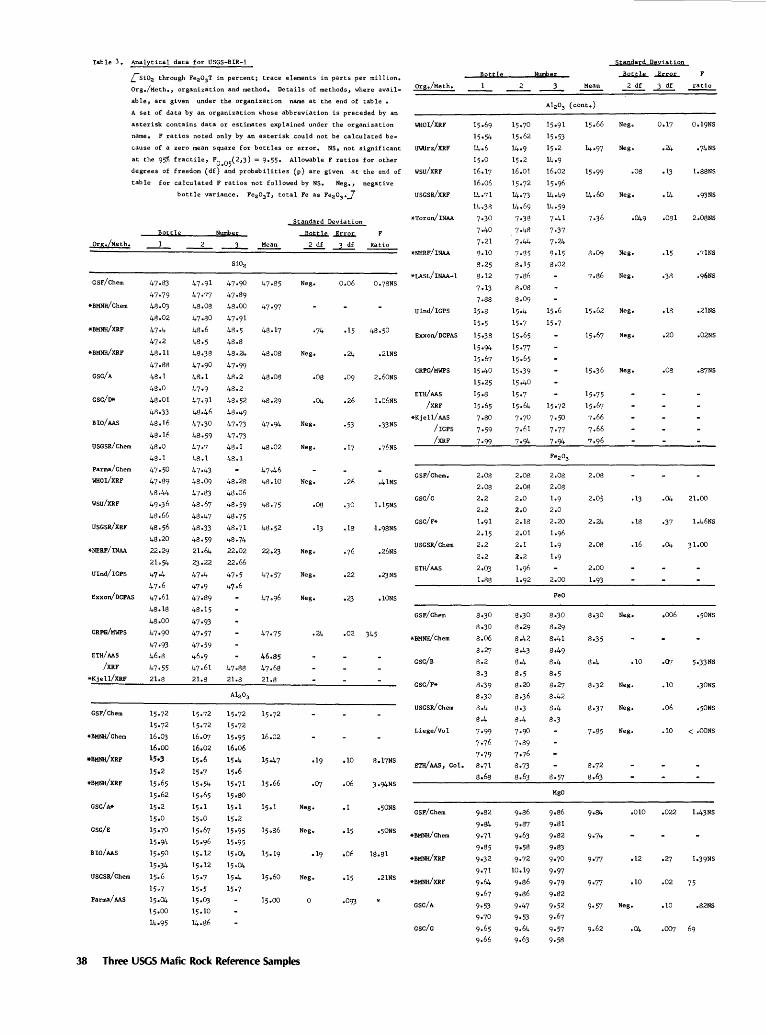
Table 3, Analytical data for USGS-BIR-1
LSiOz through Fez03T in percent; trace elements in parts per million,
Or g./Me tho, organization and method. Details of methods, where avail-
able, are given under the organization name at the end of table ,
A set of data by an organization whose abbreviation is preceded by an
Org,/Meth.
asterisk contains data or estimates explained under the organization WHOI/XRF
Org./Meth.
GSF/Chem
*BMNH/Chem
*BMNH/XRF
GSC/A
GSC/D*
BIO/AAS
USGSR/Chem
Parma/Chem
WHOI/XRF
wsu/xRF
USGSR/XRF
*NERF/INAA
Ulnd/ICPS
name, F ratios noted only by an asterisk could not be calculated be-
cause of a zero mean square for bottles or error, NS, not significant UWrz/XRF
at the 9')'/o fractile, F0 ,05
(2,3) = 9•55• Allowable F ratios for other
degrees of freedom (df) and probabilities (p) are given at the end of wsu/XRF
table for calculated F ratios not followed by NS. Neg,, negative
bottle variance, Fez03 T, total Fe as Fez03 .J USGSR/XRF
Bot;tle
47·83
47·79
48·03
48.02
47·4
47o2
48oll
47.88
48.1
48.0
48.01
48·33
48.16
48.16
48.0
48.1
47·50
47·89
48.44
49·36
48.66
48.56
48.20
22.29
21.54
47·4
47·6
Number
SiOz
47·90
47·89
48.00
47·91
48·5
48.8
48·24
47·99
48·2
48.2
48.52
48.49
47·73
47·73
48.1
48.1
Mean
48.08
48.08
48.02
47·46
48.28 48.10
48.06
48·59 48.75
48·75
48.71 48.52
48.74
22.02 22.2J
22.66
47·5 47·57
41·6
Standard Deviation
Ratio
Neg. 0.06 0.78NS
·74 .15
Neg. .24 ,21NS
.os .09 2,60NS
.04 .26 l.06Ns
Neg, ·53 •3JNS
Neg. .17
Neg. .26 .41NS
.08
.13 .18
Neg, .26NS
Neg, .22 ,2JNS
•Toron/INAA
*NERF/INAA
*LASL/INAA-1
Ulnd/ICPS
CRPG/MWPS
ETH(AAS
/XRF
*Kjell/ AAS
/rePs /XRF
GSF/Chem,
csc/c
GSC/F•
USGSR/Chem
ETH/MS
2.08
2.08
2.2
2.2
1.91
2.15
2.2
2.2
2.0)
1.88
Exxon/DCPAS 47,61
47·91
47·77
48.08
47.80
48.6
48·5
48.38
47·90
48.1
47·9
47·91
48.46
47·30
48·59
47·7
48.1
47.43
48.09
47·83
48.67
48.47
48·33
48·59
21.64
2).22
47·4
47·9
47·89
48.15
47·93
47·57
47·59
46.9
47.61
21.8
Neg. ,lONS
CRPG/MWPS
ETH/MS
/XRF
*Kjell/XRF
GSF/Chem
*BMNH/XRF
GSC/A*
GSC/E
BIO/AAS
USGSR/Chem
Parma/Ms
48.18
48.00
47·90
47·93
46.8
47·55
21.8
46.85
47o88 47,68
21.8 21.8
15·72 15·72
15·72
15·95 16.02
16.06
15o4 15,47
15.6
15o7l 15,66
l5o80
15.1
15.2
15·95
15·95
.02 345
,10 8o17NS
·07 .06 3•94NS
Neg. .1 o50NS
Neg, .15 o50NS
.06 18.81
Neg. .15 .21NS
.093
GSF/Chem 3,30
8o30
*BMNH/Chem 8.06
8.27
GSC/B 8.2
8.3
GSC/F* 8.39
8.30
USGSR/Chem 8.4
8.4
Liege/Vel 7 •99
7·76
7·79
ETH/AAS, Col, 8.71
s.68
GSF/Chem
*BMNH/Chem
*BMNH(XRF
esc/A
GSC/G
38 Three USGS Mafic Rock Reference Samples
2.08
2.08
2.0
2.0
2.18
2.01
2.1
a.2
1.96
1.92
Number
J
2.00
FeO
MgO
Standard Deviation
Mean 2 df 3 df ratio
15.66 Neg. 0.17
14 •97 Neg. .24 •74NS
15 •99 .os • 13 1.88NS
14.60 Neg, .14 o93NS
2.08
2.05
2.08
2.00
lo93
8.30
8o35
8.32
8·37
9•77
9·77
Neg,
Neg.
Neg,
Neg.
Neg.
.13
.18
.16
Neg,
.10
Neg.
Neg.
Neg,
.010
.12
.to
9·57 Neg.
.081 2.08NS
.15 ,71NS
·38
.18 ,21NS
.20 .02NS
.os o87NS
.04 21.00
·37
.04 31.00
,006 o50NS
•CJ7 5•33NS
.10 .30NS
.06 .50NS
.10 < .OONS
,022 1o43NS
•27 lo39NS
.02 75
,10 .82NS
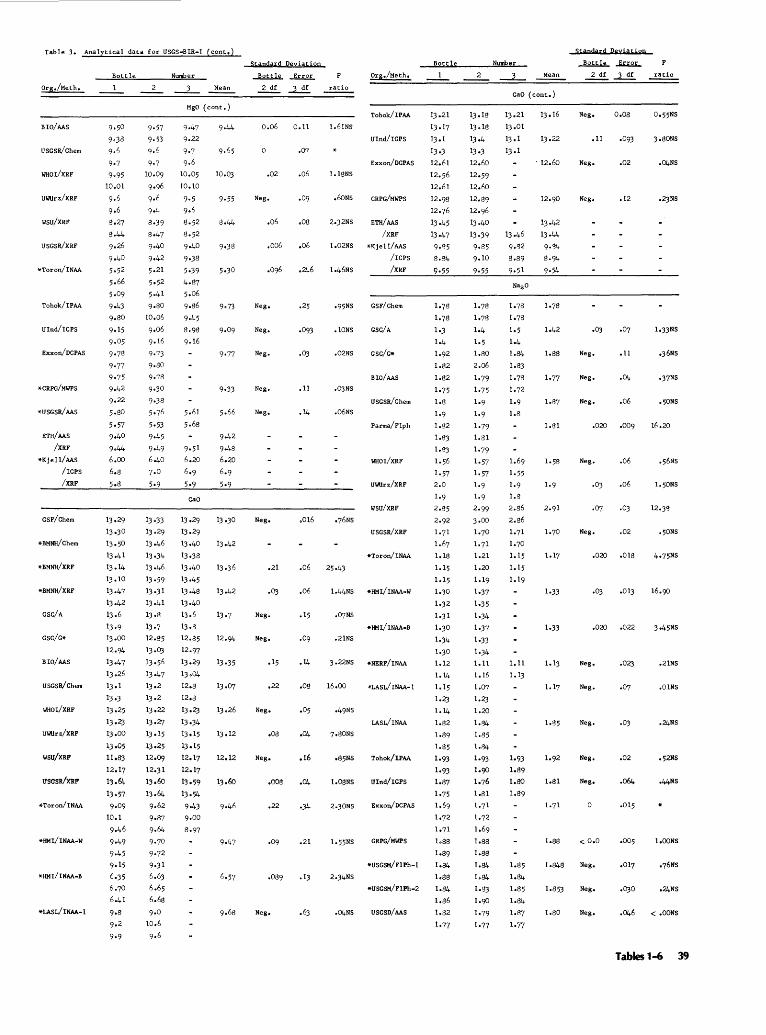
Table 3. Analytical data for USGS-BIR-1 (cont.)
Org,/Meth.
BIO/AAS
uscsR/Chem
WHOI/XRF
UWUrz/XRF
wsu/XRF
uscsR/x~
*Toron/INAA
Tohok/IPAA
Ulnd/ICPS
Exxon/DCPAS
*CRPG/MWPS
*USGSR/AAS
ETH/AAS
/XRF
*Kjel1/ AAS
/ICPS
/XRF
GSF/Chem
*BMNH/Chem
*BMNH/XRF
GSC/A
GSC/G*
BIO/AAS
USGSR/Chem
WHOI/XRF
UWUrz/XRF
wsu/XRF
uscsR/XRP'
*Toron/INAA
*HMI/INAA-W
*HMI/INAA-B
*LASL/ INAA-1
Bottle
1).29
13.30
1).50
1).41
1).14
1).10
13.47
1).42
1).6
13·9
1).00
12.94
1).47
1).26
1).1
13·3
1).25
13·23
1).00
1).05
11.83
12.17
13.64
13·57
9·09
10.1
9·46
9·49
9·45
9·15
6.35
6.70
6.41
9·8
9·2
9·9
13•33
1).29
1Jo46
13·34
1Jo46
13·59
13-31
1).41
1).8
13·7
12.85
13·03
13·56
13.47
1).2
1Jo2
1).22
1).27
13.15
1).25
12.09
12.)1
13.6o
13.64
9-62
9·87
9·64
9·70
9·72
9·31
6.6) 6.65
6.68
9·0
10.6
9·6
Number
Mean
MgO (cont.)
GaO
13.29
1).29
1).40
13·38
1).40
1).45
1).48
1).40
1).6
1).8
12.85
12.97
1).29
lJo04
12.8
12.8
13·23
13·34
1).15
1).15
12.17
12.17
13·59
1).~
9·43
9o00
8·97
10.03
8.44
9·38
9·73
9·33
9·42
9·48
6.20
6.9
5·9
13 ·30
1).42
1).42
12.94
13·35
13·07
1).26
13.12
12.12
13.6o
9·68
Standard Deviation
~ Error
2df ~
0.06 0.11
.07
.02 .06
Neg, .09
.o6 .o8
.oo6 .o6
.096 .246
Neg, .25
Neg. .093
Neg. .03
Neg. .11
Neg. .14
Neg. ,016
.21 .o6
.OJ .06
Neg. .15
Neg. .09
.15
.22 .08
Neg. .05
.08 .04
Neg. .16
.oos .04
.22 ·34
.09 .21
.089 .1)
Neg.
Bottle Number
Org./Meth, Mean
ratio GaO (cont.)
Tohok/IPAA 1).21 1).18 1).21 1).16
1.61NS 1).17 1).18 1).01
Ulnd/ICPS 1).1 1Jo4 13.1 13.22
13·3 13·3 1).1
Exxon/DCPAS 12.61 12.60 . 12.6o
1.18NS 12.56 12.59
12.61 12.60
.60NS CRPG/MWPS 12.98 12.89 12.90
12.76 12.96
2.)2NS ETH/AAS 13.45 13,40 13.42
/XRF 13,47 13.39 13.46 13.44
1.02NS *T<jell/AAS 9·85 9·85 9•82 9•B4
/rePs 8.84 9.10 8.89 8·94
Standard Deyiatign
~ Error
2 df .....l...!!!..
Neg. o.o8
.11 .093
Neg. .02
Neg. .12
ratio
3o80NS
,04NS
1.46NS ____ /_x_~----~9-·~55~---9~·~55~--~9~·5_1 __ ~9-·~~----------------------
•95NS GSF/Chem
.lONS GSC/A
.02NS GSC/G*
BIO/AAS
.OJNS
USGSR/Chem
.06NS
Parma/F1ph
WHOI/XRF
UWUrz/XRF
wsu/XRF
o76NS
USGSR/XRF
*Toron/INAA
lo44NS *HMI/INAA-W
.07NS
*HMI/INAA-B
.21NS
3 .22NS *NERF/INAA
16.00 ~LASL/INAA-1
LASL/INAA
7o80NS
o85NS Tohok/IPAA
l.OSNS Ulnd/ICPS
2.)0NS Exxon/DCPAS
1.55NS CRPG/MWPS
*USGSM/F1Ph-1
2.)4NS
*USGSM/F1Ph-2
.04NS USGSD/ AAS
1.78
1.78
1.4
1.5
1.80
2.06
1-79
1·75
1.9
1.9
1-79
1.81
1-79
1-57
1.57
1.9
1.9
2-99
3.00
1.70
1.71
1.21
1.20
1.19
1-37
1.35
1.J4
1oJ7
1oJJ
1.)4
1.11
1.16
1.07
1.23
1.20
1.84
1.85
1.84
1•93 1.90
1.76
1.81
1.71
1.72
1.69
1.88
1.88
1.84
1.84
1.8)
1.90
1o79
1.77
1.78 1-78
1.78
1.5 1.42
1.4
1.84 1.88
1.83
1.78 1.77
1.72
1.9 1.87
1.8
1.69
1.55
1.9
1.8
2.86
2.86
1.71
1.70
1.15
1.15
1.19
1.11
1.1)
1.85
1.84
1.85
1.84
1.87
1o77
1.81
1.9
1-33
1-33
1.1J
1.17
1.92
1.81
1.88
1.853
1.80
1oJJNS
Neg. .11 .J6NS
Neg. .04 •J7NS
Neg. .06 .50NS
.020 .009 16.20
Neg. .06 .56NS
.OJ .06
Neg. .02 .50NS
.020 .018
.03 .013 16.90
.020 .022
Neg. .023 .21NS
Neg. .07 .01NS
Neg. .03 .24NS
Neg. .02 o52NS
Neg. .064 o44NS
.015
< o.o .005 1.00NS
Neg. .017
Neg. .OJO •24NS
Neg. .046 < ,OONS
Tables 1-6 39
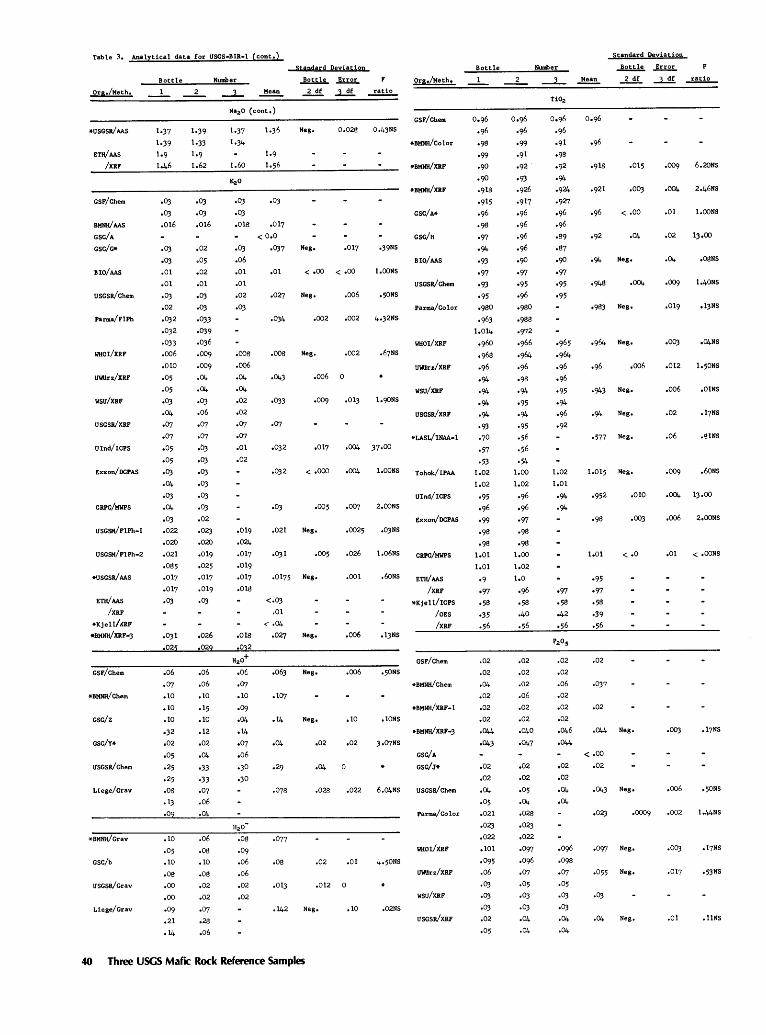
Table 3. Analytical data for USGS-BIR-1 (cont.)
Ors./Meth.
*USeSR/AAS
ETH/AAS
/XRF
esF/Chem
BMNH/AAS
esc/A
esc/G*
BIO/AAS
usesR/Chem
Parma/FlFh
WHOI/XRF
UWIIrz/XRF
wsu/XRF
USeSR/XRF
Ulnd/lCPS
Exxon/DCPAS
CRPG/MWPS
UseSH/FlPh-1
USGSH/FlPh-2
*USeSR/AAS
ETH/AAS
/XRF
*Kjell/ICRF
•BMNH/XRF-3
esF/Chem
•BHNH/Chem
esc/z
esC/Y*
UsesR/Chem
Liege/erav
*BMNH/erav
esc/b
usesR/erav
Liege/erav
Standard Deyiation
Bottle Number ..!2ll.!!. Error Org./Metho
.OJ
.OJ
.01
.01
.OJ • 02
• OJ2
.032
·OJ3 .006
.010
.05
.05
·OJ .04
·07 .07
o05
.05
.OJ
.04
.OJ
.04
.OJ • 022
.020
.021
.085
• 017
.017
.OJ
.06
·07 .10
.10
.10
o32
.02
o05
.25
.25
.08
.13
.o
.10
.05
.10
.08
.oo
.00
o09
.21
·14
lo39
1-33
1.9
1.62
.026
• 029
.06
.o&
.10
ol5
.10
.12
.02
·04
·33 ·33 o07
.06
.04
.06
.08
.10
.08
.02
.02
o07
.28
.06
Mean 2 df ..l..!!!. ratio
Na2 o (cont.) esF/Chem
1.37 1.36 Neg. 0.028 Oo43NS
1.34 *BMNH/Color
1.9
1.60 1.56 •BHNH/XRF
KaO
.OJ .03
•OJ esC/A*
.018 .017
< 0.0 esc/H
.OJ •OJ7 Neg. .017 •39NS
.06 BIO/AAS
.01 .01 < .00 < .00 l.OONS
.01 USGSR/Chem
o02 .027 Neg. .006 o50NS
.008
.006
.04
.04
.02
.02
·07
·07 .01
.02
•034 .002 .002 4.32NS .
.008 Neg. .002 .67NS
·043 .006 0
Parma/Color
WHOI/XRF
uwuu/XRF
wsu/XRF
USeSR/XRF
*LASL/INAA-1
.OJ2 < .000 •004 l.OONS Tohok/IPAA
Ulnd/ICPS
•OJ .005 •007 2.00NS
.019
.024
.017
.019
.021 Neg •
.017 .0175 Neg •
.018
<·OJ .01
< .04
.018 .027 Neg •
.OJ2
.06
·07 .10
·09 ·04
o14
o07
.o6 ·30
·30
.08
.09
.06
.06
.02
.02
.063
.107
.04
·078
.on
.08
.142
Neg.
Neg.
.02
.04
.028
.02
.012
Neg.
Exxon/DCPAS
.0025 .OJNS
.026 l.06NS CRPG/MWPS
.001 .60NS ETH/AAS
.006 .13NS
.006 o50NS
.10 .IONS
.02 3o07NS
.022 6.04NS
.01 4o50NS
.10 .02NS
/XRF
*Kjell/ICPS
/OES
/XRF
eSF/Chem
*BMNH/Chem
11-BMNH/XRF-3
esc/A
esc/J•
USeSR/Chem
Parma/Color
WHOI/XRF
UWIIrz/XRF
wsu/xaF
USGSR/XRF
40 Three USGS Mafic Rock Reference Samples
Bottle
Oo96
·96
·98
·99
·90
·90 ·918
·915
·96
·98
·97
·94
·93 ·97
·93 ·95
·980
·963
1.014
·960
·968
·96
·94
·94
·94
·94 ·93 ·70
·57
·53 1.02
1.02
·95
·96
·99
·98
o98
1.01
1.01
·9 •97
·58
·35
·56
.02
.02
.04
.02
.02
.02
.044
o043
.02
.02
.04
.05
.021
.023
.022
.101
.095
.06
.OJ
.OJ
.03
.02
.05
0.96 ·96
·99 ·91
·92
·93 ·926
·917
·96
·96
·96
·96
·90 ·97
•95
•96
·980
·988
·972
·966
·964
·96
·98
·94 ·95
·94
·95
·56
·56
·54 1.00
1.02
·96
·96
·97
·98
·98 1.00
1.02
1.0
·96 ·58 .40
·56
.02
.02
.02
.06
.02
.02
• 040
·047
.02
.02
.05
.04
.028
.02)
.022
·097 .096
·07 .05
.03
.OJ
.04
.04
Standard Deviation
Number ...!.2ll!!. .!ll2!.. ___1_ Mean 2 df ~ ratio
TiOa
0.96
·96
·91
·98
·92
·94
·924
·927 ·96
·96
o89
o87
·90 ·97
•95
·95
1.02
1.01
·94
·94
•97
·58 o42
o56
.02
.02
.06
.02
.02
.02
.921 .OOJ
·96 < .oo
•94 Neg.
·948 .004
•983 Neg •
•964 Neg.
·943 Neg.
·94 Neg.
·577 Neg.
1.015 Neg.
·952 .010
·95
•97
o58
·39
·56
.02
.037
.02
< .o
.046 .044 Neg •
.044
.02
.02
• 04
.04
< .oo .02
·043 Neg •
.097 Neg.
.055 Neg.
.04 Neg.
•009 6.20NS
.004 2.46NS
.01 l.OONS
.02 13.00
.04 .08NS
•009 1.40NS
.019 o13NS
.OOJ o04NS
.012 1.50NS
.006 .01NS
.02 .l7NS
.06 .SINS
.009 .60NS
.004 13.00
.006 2.00NS
.01 < .CONS
.006 o50NS
.002 lo44NS
.OOJ .17NS
.017 •53NS
.01 .llNS

Table 3. Analytical data for USGS-BIR-1 (cont.)
Org,/Meth.
Ulnd/ICPS
Exxon/DCPAS
ETH/AAS
/XRF
GSF/Color
BMNH/Color
*BMNH/XRF-1
GSC/A*
GSC/G*
GSC/N
USGSR/Chem
WHOI/XRF
UWUrz/XRF
wsu/XRF
USGSR/XRF
Tohok/IPAA
Ulnd/ICPS
CRPG/MWPS
ETH/AAS
/XRF
*Kjell/AAS
/I cps
*BMNH/Chem
GSC/a
GSC/Y*
USGSR/Chem
GSC/L
GSC/K
Ulnd/Grav
CRPG/Grav 11
Bottle
0.21
.15 ,()JJ
,028
.024
,I
.04
.17
.17
.176
.17
.17
.170
.170
.17
,19
.17
.IS
.22
,22
.21
.19
.172
.171
.16
,16
.16
.16
.17
.17
.170
.187
.16
.16
.IS
.IS
.18
.16
.14
.I6S
.17
.1250
.1453
.oo
.oo
.o
.1
.OJ
,02
,01
.or
.04
.01
.OJ
.02
Number
0.21 0.15
.16 .17
.021
.028
.029
.104
.04 ·04
.17
.17
.17
.17
.170
.171
.Is
.17
.17
.Is
.22
·24 .20
.19
.175
.172
.16
.16
.17
.17
.17
.17
.177
.177
.16
.16
.rs
.Is
.rs ·14 .16
.168
,17
.1250
·1490
·07 .05
.o ,I
.04
.OJ
.01
.or
·07 .01
.OJ
.02
-·47
-·51
MnO
.17
.17
.174
.17
.17
• 169
.171
.Is
.rs
.17
.17
.21
.22
.20
.19
.173
.171
.16
.16
.16
.16
.17
.17
.177
.166
.15
.16
.17
.1240
·1485
C02
.04
·OJ .o .o ·OJ
.OJ
.01
.or
C1
,01
.or
.02
.02
L.O.I.
11 Gain on ignition,
Mean
0.175
.027
,102
.04
.175
,17
.178
.173
.222
,197
.16
,17
.15S
.1S
.15
.16S
,17
.1246
·1476
.01
.02
.02
Standard Deviation
..!ill..!!.~ 2 df --l..!!!. ratio
Org,/Metho
Neg,
Neg.
Neg,
Neg.
Neg,
.004
Neg,
Neg,
.006
Neg,
< .ooo
Neg.
,OOJ
Neg.
Neg,
Neg,
*BMNH/Chem
O,OJ3 O.J2NS
*BMNH/XRF-1
.004 o42NS
GSC/A
BIO/AAS
Parma/Color
,0009 ,20NS WHOI/XRF
,009 ,2QNS UWUrz/XRF
,006 , 50NS WSU/XRF
,009 1.40NS USGSR/XRF
.01 .l7NS *Toron/INAA
.002 •92NS
*HMI/INAA-W
*HMI/INAA-B
*NERF/INAA
.oos o40NS *LASL/INAA-1
.004 l.OONS
Open/INAA
.01 *USGSR/INAA
LASL/INAA
Tohok/IPAA
Ulnd/ICPS
Exxon/DCPAS ,06 •50NS
.006 1, 50NS CRPG/MWPS
,60NS
.006 ·50NS
.Q9NS
*Kjell/AAS
/ICPS
/INAA
/XRF
USGSR/AAS
GSC/c
Toron/INAA
GCL/Spph
Kjell/INAA
Bottle
11.13
llo35
ll.06
11.04
11.1S
11.13
llo3
11.4
ll.2.J
llo37
llo32
llol5
llo32
llo46
llo37
11,36
llo39
11,30
l1,30
l0.9S
ll.22
11,25
ll.27
7oS2
Sol5
s.l7
s.oo 7·87
7·S9
7·76
7·79
7·65 s.21
s.I6
7·59
7oS2
7•S6
11.35
ll.06
ll.28
7·S9
7·65
11.36
11.56
11,30
11,55
llo72
11.3
llo5
11.16
llo52
11.39
11.30
11.27
7·80 7·09
7·14
7·76
.6 1,2
·3
Number
2 ~ Mean
·OJ3
.OJ2
1.2
1.2
·3
11.14
11o37
l1,30
ll.32
11.10
11.09
11.2
ll.4
11,39
11.26
11.12
10o95
11,35
ll.46
11o35
llo40
llo31
llo3l
llo40
llo25
8.17
s.26
8.19
7·11
s.I6
ll,31
ll.54
ll.3
ll.2
Ag
As
11.28
11.21
ll.11
llo3S
llo38
ll.28
s.06
s.26
llol5
11o35
llo37
< .2
<2
·9S
Standard Deviation
..D.2lll!. Error
2 df ....l..J!L F
ratio
•039 ,026 5·45NS
Neg, ,l .l7NS
Neg. .OS .O~NS
·07 ,10 l.S2NS
.OSl
Neg • ,30NS
,020 27·00
,16 2e77NS
Neg, ,13 ,21NS
.104 2,04NS
.093 .17
.15 .16 3.66NS
.osr ,084 2.84NS
.06
Neg, ·44
Neg. ,12NS
Neg, ,89NS
.11 4.12NS
.u 3.SONS
Neg, .14 .OJNS
.10
.002 lol3NS
Neg, ·3S .5lNS
Tables 1-6 41
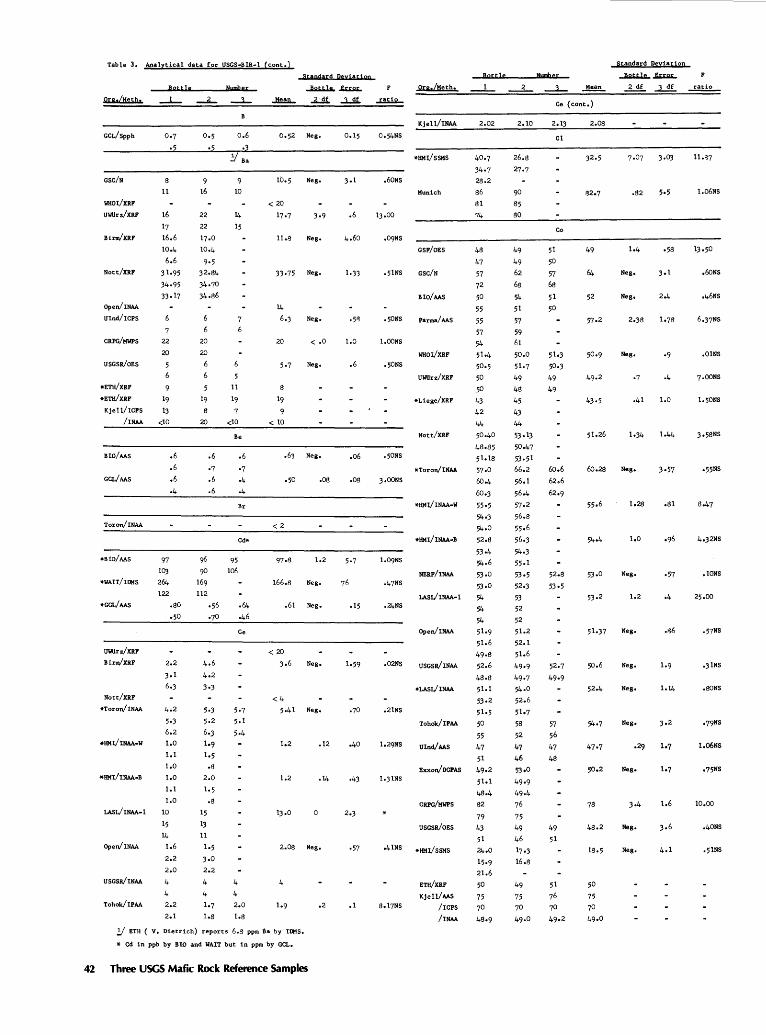
Table 3. Analytical data for USGS•BlR·l (cont.)
§tandard pgyiatioo Bottle
8 etth; ~~ on./Meth.
_1_ --L ~ ...HWl.. ~ ..l...£L ..t!W-
GCL/Spph
GSC/N
WIIOI/XRF
UWUrz/XRF
Birm/XRF
Nott/XRF
Open/INAA
Ulnd/ICPS
CRPG/MWPS
11
16
17
16.6
10.4
6.6
31·95
34·95
33·17
22
20
USGSR/OES 5
6
*ETH/XRF
*ETWXRF 19
Kjell/ICPS 13
/INAA <10
BIO/AAS
GCL/AAS
Toron/INAA
*BIO/AAS
.6
.6
.6
.4
16
20
20
20
.6
·7 .6 .6
10
11
19
7 <10
Be
.6
·7
·4
·4
Br
96 95
90 106
0.52 Neg,
Neg.
< 20
17·7
11.8 Neg.
33·75 Neg,
14
6.3 Neg.
20
s 19
9 <10
<2
< .o
Neg,
.63 Neg,
·50 .os
Ool5
.6
4.60
loJJ
1.0
.6
.06
.os
*WAIT/IIIIS
97
103 264
122
169 166.S Neg, 76
112
*GCL/AAS .so ·50
•56 .64, .61 Neg. .15
lJWrz/XRF
Birm/XRF
Nott/XRF
*Toron/INAA
*HMI/INAA·B
LASL/ INAA-1
Open/INAA
USGSR/INAA
Tohok/IPAA
2.2
3ol
6.3
4.2
5·3
6.2 1.0
1.1
1.0
1.0
1.1
1.0
10
15
14
1.6
2.2
2.0
4
4 2.2
2.1
•70 o46
15
13
11
lo5
3•0
2.2
4
4 1.7
loS
Ce
4
4 2.0
r.s
<20
3,6 Neg,
<4
5o41 Neg,
1.2 .12
1.2 .14
13.0
2.08 Neg.
.2
;J ETH ( v. Dietrich) reports 6.8 ppm Ba by lii!S.
* Cd in ppb by 810 and WAIT but in ppm by GCL,
42 Three USGS MafiC Rock Reference Samples
lo59
.40
·57
.I
Kjell/INAA
0.54,NS
*HMI/SSMS
,60NS
Munich
13.00
GSF/OES
.5lNS GSC/N
BlO/AAS
.50NS Parma/AAS
l.OONS
WIIOI/XRF
.50NS
UWUrz/XRF
*Liege/XRF
Nott/XRF
,50NS
•Toron/INAA
3,00NS
*HMI/INAA•W
*HMI/INAA•B
NERF/INAA o47NS
LASUINAA-1 .24,NS
Open/INAA
,02NS USGSR/INAA
,21NS
Tohok/IPAA
lo29NS Ulnd/AAS
40·7
34·7
28.2
86
Bl
74
4S
47
57
72
50
55
55 57
54
51·4
50·5
50
50
43
42
44
50.40
51 Exxon/DCPAS 49o2
l.JlNS 51.1
48·4 CRPG/MWPS 82
79
USGSR/OES 43
51
o4lNS *HMI/SSMS 24,.0
8o17NS
ETH/XRF
Kjell/AAS
/I CPS
/INAA
15·9
21.6
Standard Deviation
Nnr®er Mean
Ce (cont.)
2.10
26.s
27·7
90
S5
80
49
49
62
6s
54
51
57
59
61
50.0
51·7
49
48
45
43
44
53·13
53·51
2.13
Cl
Co
51
50
57
68
51
50
66.2 6o.6
56.1 62.6
56o4 62o9
57·2
56.s
55·6
56·3
54·3
55·1
53·5
52·3
53
52
52 51.2
52.1
51.6
49·9
49·7
54·0
52.6
51·7
58
52
47
46
53o0
49·9
49·4
76
75
49
46
17·3
16.8
49
75
70
49.0
57
56
47
4S
49
51
2.08
82o7 .S2
49
Neg. 3•1
52 Neg, 2.4
43·5 .41 1.0
51.26 lo34
Neg. 3•57
1.28 .s1
1.0
53·0 Neg. ·57
53·2 1.2
51.37 Neg. .86
50.6 Neg. 1.9
52.4 Neg. 1,14
54•7 Neg. 3.2
78
4S.2
18.5
50
75
70
49o0
Neg. lo7
1.6
Neg.
Neg.
ratio
1.06NS
,6oNS
o46NS
.OINS
7,00NS
3•5SNS
·55NS
4o32NS
,lQNS
·57NS
.JlNS
.SONS
1,o6NS
•75NS
10,00
.40NS
.51NS
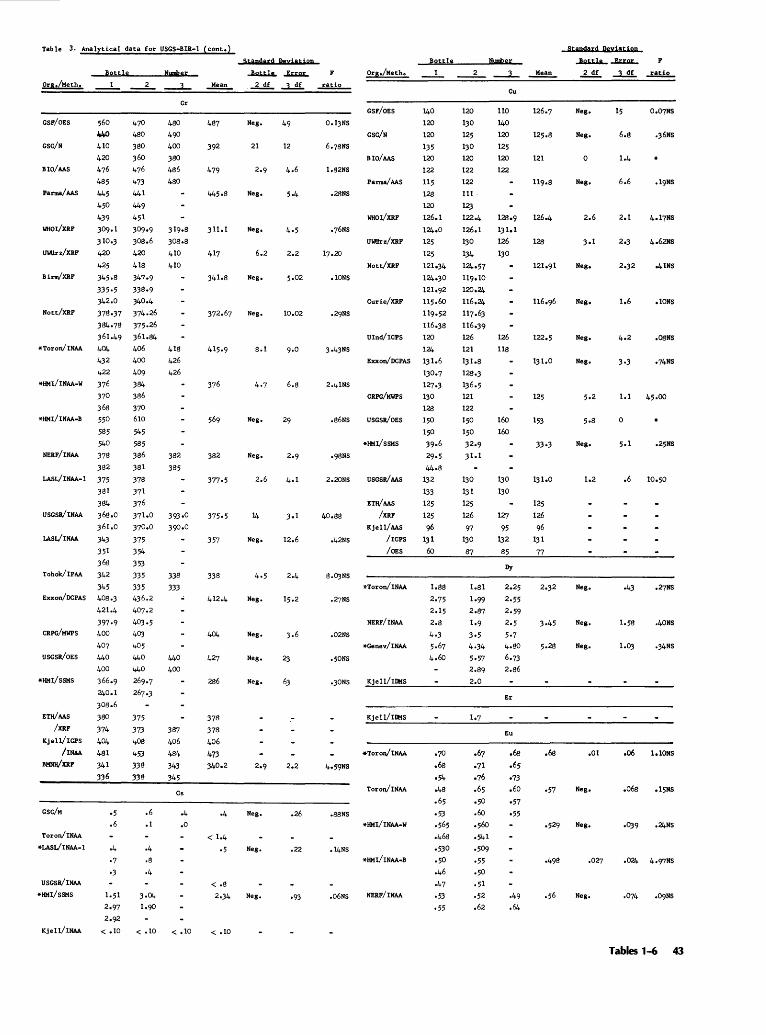
Table 3. Analytical data for USGS-BIR-1 (cont.}
Ora./Meth.
GSF/OES
GSC/N
BIO/AAS
Parma/AAS
WHOr/XRF
UWUrz/XRF
Birm/XRF
Nott/XRF
*Toron/INAA
*HMI/INAA-W
*HMl(lNAA•B
NERF(INAA
LASL/INAA-1
USGSR/INAA
LASL/INAA
Tohok/IPAA
Exxon/DCPAS
CRPG(MWPS
USGSR/OES
*HMI/SSMS
ETH/AAS
/XRF
Kjell/lGPS
/INAA
BMNlf/XRF
GSC/M
Toron/INAA
*LASVINAA-1
USGSR/INAA
*HMI/SSMS
Kjell(INAA
Bottle
560
lt40 410
420
476
485
445
450
439
309·1
310•3
420
425
345o8
335·5 )42.0
378·37
384·78
361.49
404
432
422
376
370
368
550
585
540
378
382
375
381
384
368.0
361.0
343
351
368
342
345
408.3
421.4
397·9 400
407
440
400
366.9
240.1
308.6
380
374
404 481
341 336
·5 .6
·4 ·7
•3
Nupi!er
Cr
470 480
480 490
380 400
360 380
476 486
473 480
441
449
451
309•9 319o8
308.6 308o8
420 410
418
347·9
338·9
340.4
374.26
375-26
361.84
406
400
409
384
386
370
610
545 585
386
381
378
371
376
371.0
370o0
375
354
353
335
335
436.2
407.2
403·5
403
405
440
440
269·7
267·3
375
373 408
453
338
338
.6 • 1
·4 .8
·4
< .10
410
418
426
426
382
385
39Jo0
390·0
338
333
440
400
387 406
48'~
343
345
Cs
.4
.o
< .10
Mean
487
392
479
311ol
341.8
376
382
377·5
375·5
357
338
412.4
404
427
286
378
378
406
473 340.2
< .8
2o34
< .10
Stapdard Peyiatign
Neg. 49
21 12
Neg. 5·4
Neg. 4o5
6.2 2.2
Neg. 5o02
Neg. 10.02
8.1
6.8
Neg.
Neg.
2.6
14 3ol
Neg. 12.6
Neg.
Neg. 3·6
Neg.
Neg.
Neg. .26
Neg. .22
Neg. ·93
ratio
O.l3NS
1.82NS
.28NS
17.20
.IONS
3·43NS
2.41NS
.86NS
•98NS
2.20NS
40.88
o42NS
8.0JNS
.27NS
.02NS
o50NS
o30NS
.88NS
.14NS
• 06NS
Org./Meth.
GSF/OES
GSC/N
BIO/AAS
Parma/AAS
WHOr/XRF
UWUrz(XRF
Nott(XRF
Curie(XRF
Ulnd/ICPS
Exxon/DCPAS
CRPG/MWPS
USGSR/OES
USGSR/AAS
ETH/AAS
/XRF
Kje11/AAS
/ICPS
/OES
·•Toron/INAA
NERF/INAA
*Genev/INAA
Kjell(lllfS
Kje11/IIMS
Toron/INAA
*HMI/INAA·B
NERF/INAA
Bottle
140 120
120
135
120
122
115
128
120
126.1
124.0
125
125
121.34
124o30
121.92
115.60
ll9o52
116.38
120
124
131.6
130·7
127·3
130
128
150
150
39·6
29·5
44·8
132
133
125
125
96 131
60
2
120
130
125
130
120
122
122
111
12)
122.4
126.1
130
134
124·57
119ol0
120.24
ll6.24
ll7.63
ll6.39
126
121
13lo8
128o3
136·5
121
122
150
150
32·9
31.1
130
131
125
126
97 130
87
1o7
Nwpber
Cu
110
140 120
125
120
122
128o9
13lo1
126
130
126
118
160
160
130
130
127
95
132
85
Dy
Er
Eu
.68
.65
·73 .60
·57
·55
·49
.64
Mean
121
126.4
128
122o5
131.0
125
153
33·3
131o0
125
126 96
131
77
2.32
3·45
·57
SJ;Mdard Dcyiat,igp
F
2 df ~ ratio
Neg. 15
Neg. 6.8 .36NS
0
Neg. 6.6
2.6 2.1 4o17NS
3o1 2.3
Neg. 2o32 o41NS
Neg. 1.6 .IONS
Neg. 4.2 .OSNS
Neg. 3•3 •74NS
1.1 45.00
0
Neg.
1.2 .6 10.50
Neg. o43 o27NS
Neg. 1.58 .40NS
Neg. l.OJ ·34NS
.01 .06 lolONS
Neg. .068 ol5NS
Neg • •039 o24NS
.027
Neg • -074
Tables 1-6 43
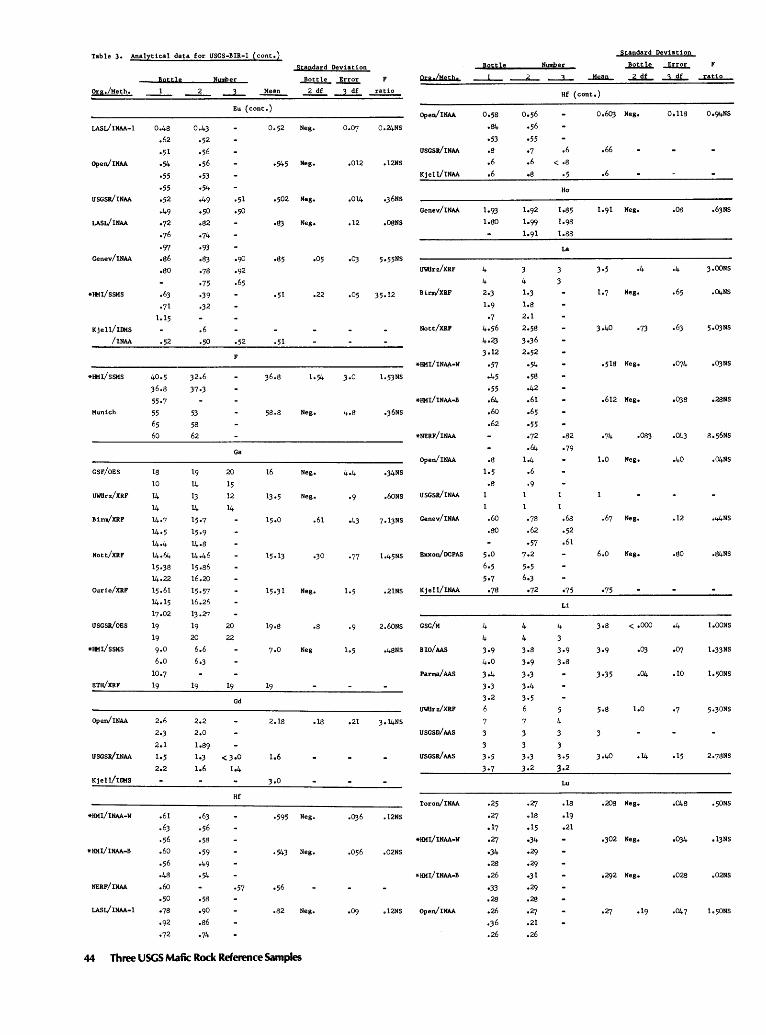
Table 3. Analytical data for USGS-BIR-1 (cont.)
Bgttls Nwpber
Standard Deviation
Bottle ...!ll2£. Org./Meth. Mean 2 df ~ ratio
LASL/ lNAA·l
Open/INAA
USGSR/INAA
LASL/INAA
Genev/INAA
*HMI/SSMS
Kjell/IIMS
/INAA
*HMI/SSMS
Munich
GSF/OES
UWrz/XRF
Birm/XRF
Nott/XRF
Curie/XRF
USGSR/OES
*HMI/SSMS
ETH/XRF
Open/INAA
USGSR/INAA
Kjell/IIMS
*HMI/INAA-W
*HMI/INAA-B
NERF/INAA
LASL/INAA•l
0.48
• 62
·51
·54
·55
·55
·52
·49
·72
·76
·97
.s6
.so
40-5
36.s
55·7
55 65
60
2.6
2.)
2.1
lo5
2.2
.61
.63
·56
.60
·56
.48
.6o ·50
·78
·92
·72
Eu (cont.)
.6
·50
32.6
37·3
53
58
62
19
14
13
14
15·7
15·9
14·8
14.46
15.86
16.20
15·57 16.26
13-27
19
20
6.6
6.3
2.2
2.0
1.89
20
15
12
14
20
22
Ga
Gd
1.3 < 3·0
1.6 1.4
·58
·90 .86
·74
Hf
·57
Neg •
·545 Neg.
.502 Neg.
•83 Neg,
·85 .05
.22
58.8 Neg.
16 Neg.
13·5 Neg.
.61
.JO
Neg,
.s
Neg
2.18 .18
1.6
·595 Neg.
·543 Neg.
.82 Neg.
44 Three USGS Mafic Rock Reference Samples
0.24NS
.012 .12NS
.014 .36NS
.12 .OSNS
·03 5•55NS
• 05 35-12
3•0
.36NS
•34NS
.60NS
7•lJNS
·77 1.45NS
.21NS
2.60NS
o48NS
.21 3•14NS
.12NS
.02NS
.12NS
Orp /Met,h,
Open/INAA
USGSR/INAA
Kjell/INAA
Genev/INAA
UWIJrz/XRF
Birm/XRF
Nott/XRF
*HMI/INAA•W
*HMI/INAA•B
*NERF/INAA
Open/INAA
USGSR/INAA
Genev/INAA
Exxon/DCPAS
Kjell/INAA
GSG/M
BIO/AAS
Parma/AAS
UWUrz/XRF
USGSD/AAS
USGSR/AAS
Toron/INAA
* HMI/INAA·B
Open/INAA
Bottle
0.58
.84
·53
4
.s
.6
.6
4
2.3
1.9
·7 4-56
4·2.3 3o12
·57
·45
·55 .64 .60
.62
.s 1.5
.s
1
.6o
.so
4
4
3·9
4.0
3·4
3·3 3·2
6
7
3
.25
.27
.17
.27
·34
.28
.26
·33 .28
.26
·36 .26
4 1.3
1.8
2.1
2.58
3·36
2.52
·54
·58
.42
• 61
.65
·55
·72
.64 1.4
.6
·9
4
4
3·8
3•9
3·3 3·4
3·5 6
·27
.18
.15
·34
.29
.29
o31
.29
.28
·27 .21
.26
Standard Deviation
NU!Dber ~ Error
.Jidn.. ..z...2L -l..!!L ....1!1!£_
Hf (cont.)
.6
< .s ·5
Ho
1.85
1.98
1.88
.82
·79
• 68
·52
.61
·75
Li
4
4
3
3 '3·5
3-2
Lu
• 18
.19
.21
0.6QJ Neg.
.66
.6
.4
Neg •
3-40
•518 Neg.
.612 Neg •
·74 .083
1.0 Neg.
.67 Neg •
6.0 Neg.
·75
3·8 <•000
.208 Neg •
.302 Neg.
.292 Neg.
o.us Oo94NS
.os .63NS
·4 3.00NS
.Q4NS
5•03NS
.03NS
.28NS
·043
.40 .04NS
.12 .44NS
.so .84NS
1.00NS
·07 1.33NS
.to 1.50NS
5·30NS
.15
.048 o50NS
·034 .13NS
.028 .02NS
1.50NS
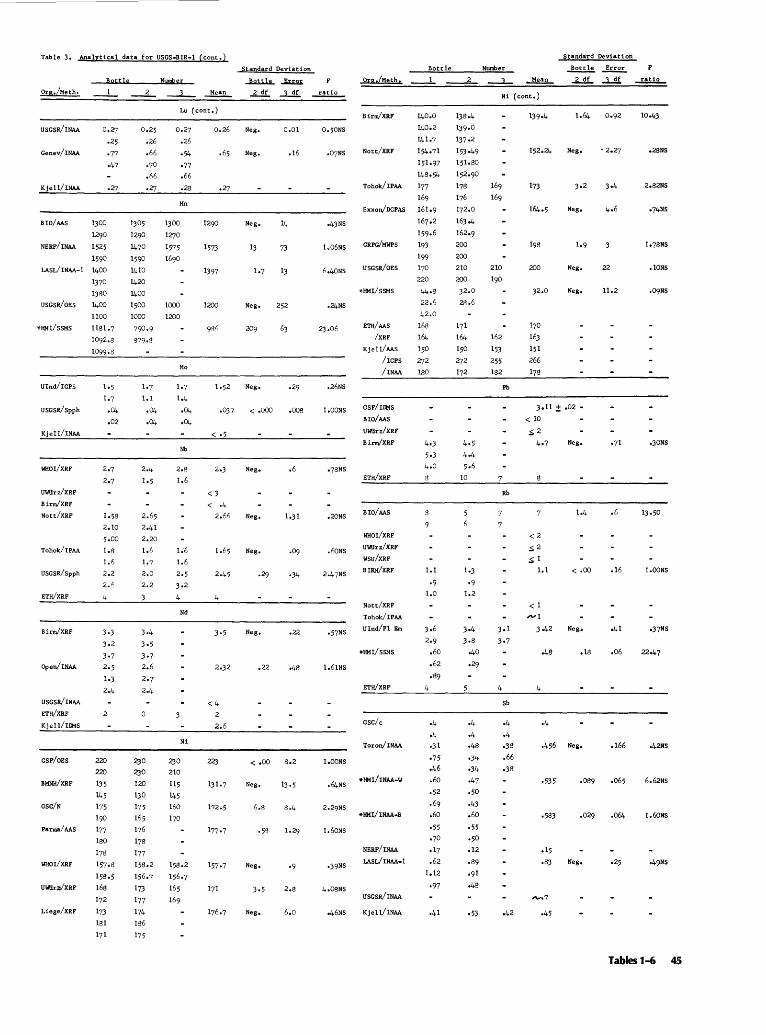
Table 3. Analytical data for USGS-BIR-1 (cont.)
a9 ttte Number
Org./Meth. __ 1_ __2_ ___.l_ Mean
USGSR/INAA
Genev/INAA
Kjell/INAA
BIO/AAS
NERF/rNAA
0.27
.25
·77
·47
1300
1290
1525
·27
1590
LASL/rNAA-1 1400
0.25
.26
.66
·70
.66
.27
1305
1290
1470
1590
1410
1420
1400
Lu (cont.)
0.27 0.26
.26
·54 .65
·77
.66
.28
Mn
1300
1573
1397
USGSR/OES
1370
1380
1400
1100
ll8lo7
1092.8
1099·8
1500 1000 1200
*HMI/SSMS
Uind/rCPS
USGSR/Spph
Kjell/rNAA
WIIOI/XRF
UWI!rz/XRF
Birm/XRF
Nott/XRF
Tohok/IPAA
USGSR/Spph
ETH/XRF
Birm/XRF
Open/INAA
USGSR/INAA
ETH/XRF
Kjell/rDMS
GSF/OES
BMNH/XRF
GSC/N
Parma/AAS
WIIOI/XRF
UWUra/XRF
Liege/XRF
1000 1200
1.5
1.7
.a.
.02
2o7
2o7
1o58
2.10
5o00
1.8
1.6
2.2
2.6
4
220
220
135
145
175
190
177
180
178
157·8
158·5
168
172
173
1.7
1.1
·04 ·04
2.4
lo5
2)0
2)0
120
130
175
165
176
178
177
l58o2
156·7
173
177
174
181 186
171 175
Mo
Nb
2.8
1.6
1.6
1.6
2·5
3·2
4
Nd
2)0
210
115
145
160
170
Ni
98~·
·037
< ·5
<3 < ·4
2.66
4
2.)2
<4 2
2.6
22)
Standard Deviation
ratio
Neg, 0.01
Neg. .16
Neg, o43NS
13 73 1.06NS
6.40NS
Neg. 252 .24NS
2J.06
Neg. .26NS
< .ooo .008 1,00NS
Neg, .6 o78NS
Neg, .20NS
Neg, ·09 .60NS
.29
Neg, .22 •57NS
.22 o48 1,61NS
< .oo 8.2 l,OONS
Neg. 13 ·5 .64NS
1.60NS
Neg, ·9
2.8 4o08NS
Neg, 6.0 o46NS
Org./Meth.
Birm/XRF
Nott/XRF
Tohok/IPAA
Bottle
140.0
140.2
141·7
154,71
151·97
148·54
177
169
Exxon/DCPAS 161,9
167.2
159·6
CRPG/MWPS 193
USGSR/OES
*l!MI/SSMS
ETH/AAS
/XRF
Kjell/ AAS
/rePs
/rNAA
GSF/IDMS
BIO/AAS
UWI!rz/XRF
Birm/XRF
ETH/XRF
BIO/AAS
WHOI/XRF
UWUrz/XRF
wsu/xRF
BIRM/XRF
Nott/XRF
Tohok/IPAA
Uind/F1 Em
*HMI/SSMS
ETH/XRF
GSC/c
Toron/INAA
NERF/INAA
LASL/INAA-1
USGSR/INAA
Kje11/INAA
199
170
220
44.8 22.6
42.0
168
164 150
272
180
1.1
·9 1.0
3·6
2.9
.60
.62
o89
4
·4 .4
·31
·75 .46
.60
·52
.69
.60
·55 ·70
.17
.62
1,12
•97
138·4
139·0
137·2
153 o49
151.80
l52o90
178
176
172.0
163o4
162.9
200
200
210
200
)2.0
2$.6
1.)
·9 1.2
.4
·4 o48
•J4
·34
·47
·50
o43
.60
·55 ·50 ,12
o89
·91
o48
·53
Standard Deviation
Number ~~ 2df ~
Ni (cont.)
210
190
162
153
255
182
4
Pb
Rb
Sb
.4
.4 o38
.66
·38
o42
Neg. • 2.27
173 3o2
Neg,
1.9
200 Neg,
)2.0 Neg.
3·11 ± ,02 -
<10
.::;2
4•7 Neg,
<2
.::;2
.::; 1
1,1
< 1
""1
4
.48
.4
< .oo
Neg,
.18
.456 Neg,
Neg,
,.....,7
·45
3•4
22
11.2
.6
.16
o41
.06
.166
.065
.064
ratio
o28NS
2o82NS
o74NS
1o78NS
.IONS
o)ONS
l.OONS
•37NS
22o47
o42NS
6.62NS
t.60NS
Tables 1-6 45
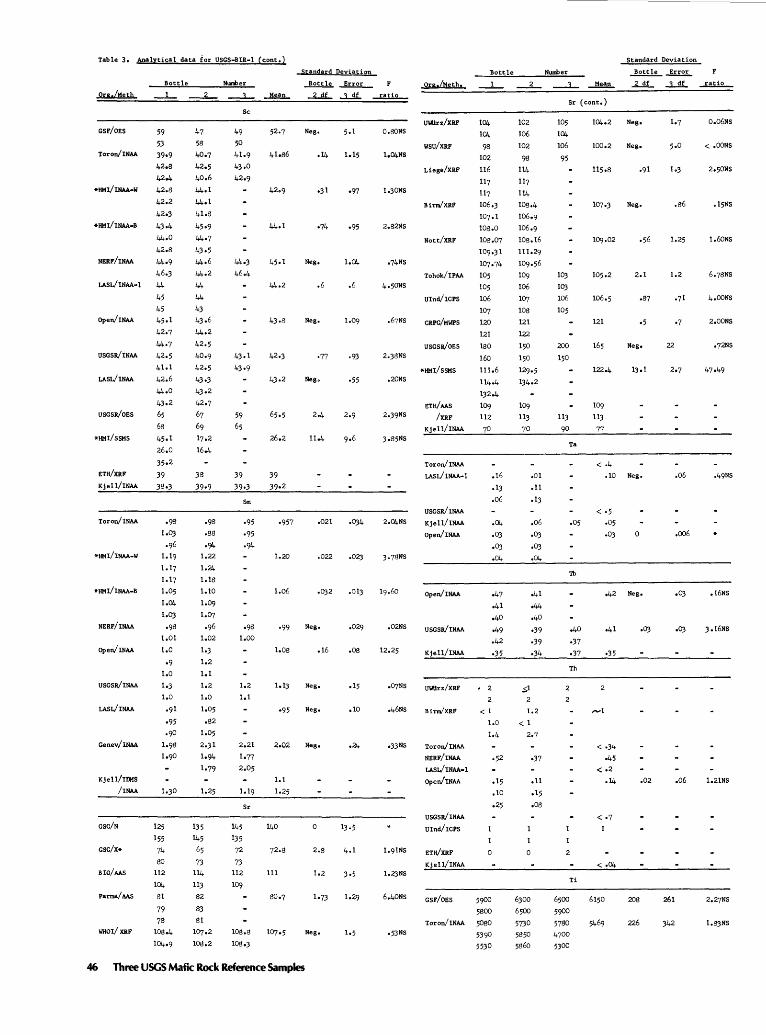
Table 3, Analytical data for USGS-BIR·l (cont.)
St,andard Deviation Bottle
Bottle Number ~ ..ki.2L_ Org./Meth, Ors./Meth 2 ~ ..l!!L --Wi2_
GSF/OES
Toron/INAA
*HMI/INAA•W
NERF/INAA
59
53
39•9
42.8
42o4
42.8
42.2
42o3
43·4
44o0
42.8
44·9
46·3
LASUINAA•l 44
45
45
Open/INAA 45ol
42·7
44·7
USGSR/INAA 42,5
41.1
LASL/INAA 42,6
USGSR/OES
*HMI/SSMS
ETH/XRF
Kjell/INAA
Toron/INAA
*!IMI/INAA-W
44.0
4Jo2
65
68
45·1
26,0
35·2
39
38·3
47
58
40o7
42o5
40.6
44.1
44ol
41.8
45·9
44·7
43·5
44o6
44.2
44
44
43
4J.6
44o2
42.5
40.9
42.5
43·3
4Jo2
42.7
67
69
17.2
16.4
38
39·9
·98
.88
·94 1.22
1.24
1.17 1.18
*HMI/INAA-B
NERF/INAA
Open/INAA
USGSR/INAA
LASL/INAA
Genev/INAA
Kjell/IIMS
/INAA
GSC/N
BIO/ AAS
Parma/AAS
WHOI/XRF
1.30
125
155
74
80
112
104
81
79
78
108.4
104o9
1.25
135
145
65
73
114
113
82
83 81
107.2
108.2
Sc
49
50
41.9
43.0
42o9
59
65
39
39·3
Sm
·95
·95
·94
·98 1.00
1,2
1.1
2.21
lo77
2.05
145
135
72
73 112
109
Sr
52.7 Neg.
42o9
45ol
42·3
39
39·2
·957
1.06
·99
1.08
lolJ
•95
oJl
·74
Neg,
.6
Neg,
·77
Neg.
.021
.022
.OJ2
Neg.
.16
Neg,
Neg.
2.02 Neg,
1.1
1.25
140
111
2.8
1•73
Neg,
46 Three USGS Mafic Rock Reference Samples
·97
·95
.6
·93
·55
·OJ4
.02J
.013
.029
.08
.15
,10
lo5
UWUrz/XRF O.SONS
wsu/XRF lo04NS
Liege/XRF
l,JONS
Birm/XRF
2.82NS
Nott/XRF
o74NS
Tohok/IPAA 4,50NS
Ulnd/ICPS
.67NS CRPG/MWPS
2.J8NS
,20NS
3•85NS
2,04NS
.02NS
12.25
o07NS
o46NS
•JJNS
1,2JNS
6,40NS
USGSR/OES
*!IMI/SSMS
ETH/AAS
/XRF
Kje11/INAA
Toron/INAA
LASL/INAA•l
uscsR/INAA
Kje11/INAA
Open/INAA
Open/INAA
USGSR/INAA
Kje11/INAA
UWUrz/XRF
Birm/XRF
Toron/INAA
NERF/INAA
LASUINAA-1
Open/INAA
USGSR/INAA
Ulnd/ICPS
ETH/XRF
Kjell/INAA
GSF/OES
104
104
98
102
116
117
117
106.3
107.1
108.0
108.07
109·31
107.74
105
105
106
107
120
121
180
160
111.6
114.4
lJ2o4
109 112
70
• 2
.16
.1J
.o6
·47
o41
o40
·49
.42
·35
< l
1.0
1.4
5900 5800
.15
,10
.25
Toron/INAA 5080 •5JNS 5390
5530
102
106
102
98
114
117
114
108.4
106.9
106.9
108.16
111.29
109·56
109
106
107
108
121
122
150
150
129·5
134·2
109 113
70
~1
• 01
.11
.1J
.06
.OJ ,OJ
.04
o41
o44
·40
·39
·39
·34
1.2
< 1
2.7
6300
6500
5730
5850
5860
•37
.11
.15
.08
Standard Deviation
Number ~~ Mean ..L.!!L ..L!!L ~
Sr ( cont,)
105
104
106
95
10J 10J 106
105
200
150
113
90
Ta
.05
Tb
o40
·37
·37
Th
Ti
6500
5900 5780
4700
5300
Neg,
100.2 Neg,
107.3 Neg.
121
122.4
109
113
77
< ·4
2.1
o87
·5
Neg.
1J.l
.10 Neg •
< ·5 o05
·OJ 0
o42 Neg.
o41 •OJ
·35
< ·34
·45
< .2
·14
< •7
< ·04
.02
208
226
lo7 o.o6Ns
< ,OONS
1.3 2,50NS
.86 .15NS
1.25 1.60NS
1.2 6.78NS
4,00NS
2,00NS
22
47·49
.06
.006
,16NS
J,l6NS
,06 1,21NS
261
342 l.SJNS
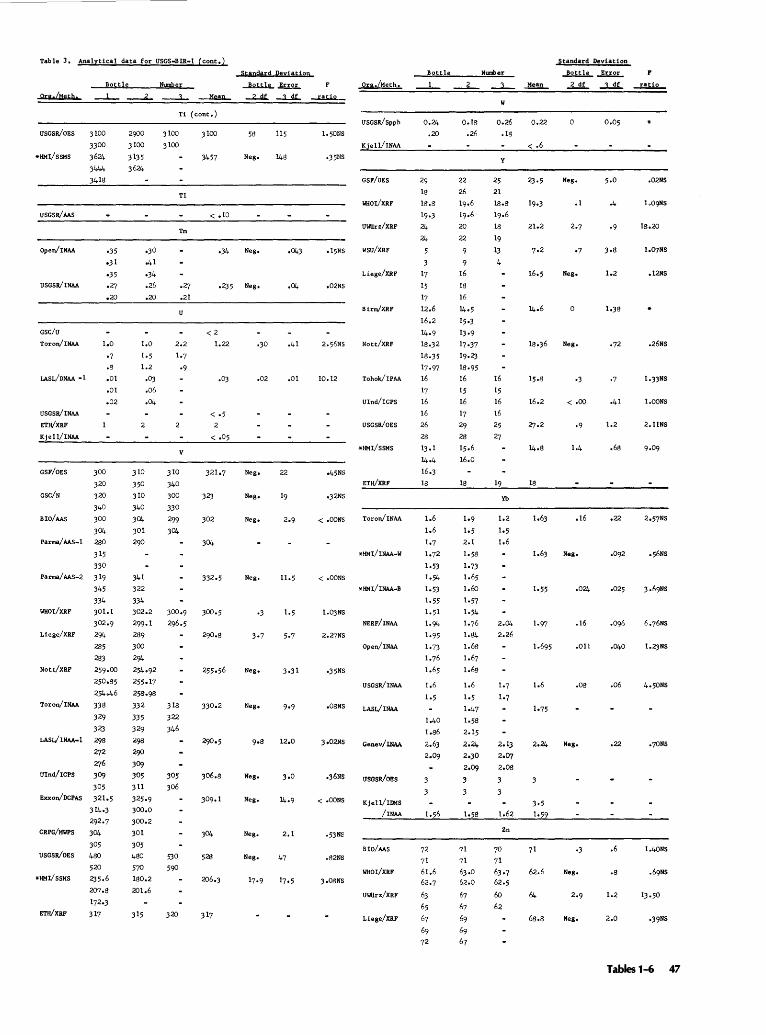
Table 3, Analytical data for USGS•BIR-1 (cont,)
Bottle
Org t'Meth.
USGSR/OES 3100
3300
*IIMVSSMS 3621<.
USGSR/AAS
Open/INAA
USGSR/INAA
GSC/U
Toron/INAA
IASL/DNAA -1
USGSR/INAA
ETWXRF
Kjell/INAA
GSF/OES
3444 3418
·35
o3l
·35
.27
.20
1.0
·7 .s .01
.01
.02
300
320
GSC/N 320
340
BIO/AAS 300
304
Parma/AAS-1 280
315
330
Parma/ AAS-2 319
345
334
WHOI/XRF 301,1
302.9
Liege/XRF 294
Nott/XRF
285
283
259·00
250·85
254.46
Toron/INAA 338
329
323
LASUINAA·l 298
272 276
Uind/ICPS 309
305
Exxon/DCPAS 321.5
314·3 292·7
CRPG/MWPS 304
305
USGSR/OES 480
520
*IIMVSSMS 235,6
207o8
172·3
ETWXRF 317
Nu!nber
Ti (cont,)
3100 3100
3100
3457
T1
<•10
Tm
·34
Standard Deviation
~Error
58 115
Neg, 148
Neg. .043 ·30
o4l
·34
.26
.20
·27 ·235 Neg, .04
.21
u
1,0
1.5
1.2
2
310
350
310
340
304
301
290
.OJ
.06
.04
341
322
334
302.2
299.1
289
300
294
254.92
255·17
258-98
310
340
300
330
299
304
332 318
335 322
329 346
298 290
309
305 305
311 306
325·9
300,0
300.2
301
305
480 530
570 590 180.2
201.6
v
<2
1.22
< ·5 2
< .05
323
302
304
330.2
306.8
528
·30 .41
.02 .01
Neg. 22
Neg.
Neg.
Neg.
Neg.
Neg. 9·9
9•8 12.0
Neg.
Neg,
Neg. 2.1
Neg. 47
Org,/Heth,
USGSR/Spph
Kjell/INAA
·35NS
GSF/OES
WHOI/XRF
UW\Irz/XRF
.15NS wsu/XRF
Liege/XRF
,Q2NS
Birm/XRF
Nott/XRF
10.12 Tohok/IPAA
Ulnd/ICPS
USGSR/OES
•HMI/SSMS
o45NS
ETH/XRF
•32NS
< .OONS Toron/INAA
< .OONS
2o27NS
•35NS
.08NS
3o02NS
.36NS
<.CONS
·53NS
.82NS
3•08NS
*IIMI/INAA-W
NERF/INAA
Open/INAA
USGSR/INAA
LASUINAA
Genev/INAA
USGSR/OES
Kjell/IIIlS
/INAA
BIO/AAS
WHOI/XRF
UWIIrz/XRF
Liege/XRF
Bottle
0.21.
,20
29
18
18.8
19·3
21.
21.
17
15
17
12.6
16.2
14-9 18.32
18.35
17·97
16
17
16
16
26
28
13.1
14-4
16.3
18
0.18
.26
16
18
16
14·5
15·3
13·9
17·37
19·23
18·95
16
15
16
17
29
28
15.6
16.0
18
1.58
Number
~ Mean
w
0.26
.18
y
25
21
18.8
19.6
18
19
13
4
16
15 16
16
25
27
Yb
1.2
1.5
1.6
2.04
2.26
2.13
2·07 2.08
1.62
Zn
70
71
63·7 62.5
60
62
0.22
< .6
21.2
16.2
18
1.6
1o75
71
62.6
68.8
Standard Deviation
...!2ll!!.. ~ F
2 df ...J....2L ratio
0.05
Neg. ,Q2NS
.1
Neg. 1.2 .12NS
Neg, .26NS
< .oo .41 1.00NS
1.2 2.11NS
.68
.16 .22
Neg,
.021. .025
.16
.011 .Q40 1.23NS
.08 .06 4.50NS
Neg, .22 .70NS
.6 1.40NS
Neg. ,g
1.2
Neg. 2.0
Tables 1-6 47
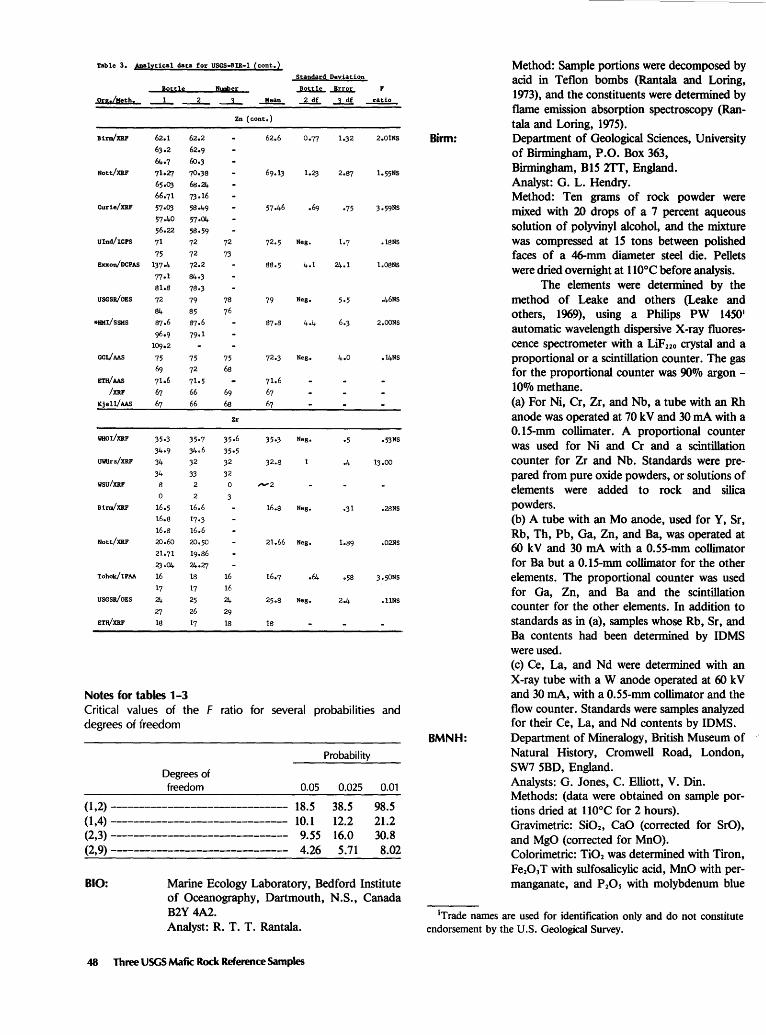
Table 3. Anal%tical data for USGS-BIR-1 (cont.l
Sta!ldard Deviation
!o,tll f!BEer ~~
!2Ea.[tteth• ~ Mean 2 df ~ ratio
Zn (cont.)
BiraVXIlF 62.1 62.2 62.6 0.77 lo32 2.01NS
63.2 62.9
64.7 60.3
Nott/XIlF 71·27 70o38 69.13 l.ZJ 2.87 lo55NS
65·03 68.24
66-71 73o16
Curie/XIlF 57·03 58·49 57·46 ·69 ·75 3 •59NS
57o40 57·04 56.22 58·59
Uind/ICPS 71 72 72 72·5 Neg. 1.7 .18NS
75 72 73 Exxon/DCPAS 137·4 72.2 88.5 4.1 24.1 l.OSNS
77·1 84·3 8lo8 78·3
USGSR/OES 72 79 78 79 Neg, 5·5 .46Ns
84 85 76
*HKI/SSMS 87·6 87·6 87o8 4.4 6.3 2.00NS
96•9 79·1 1Q9o2
GCL/AAS 75 75 75 72·3 Neg, 4.0 ol4NS
69 72 68
ETH/AAS 7lo6 71·5 71.6
/XRF 67 66 69 67
Kjell/AAS 67 66 68 67
Zr
WHOI/XIlF 35·3 35·7 35·6 35·3 Neg, ·5 o53NS
34·9 34·6 35·5 UWilrz/XRF 34 32 32 32.8 ·4 13.00
34 33 32 wsu/XRF 8 0 -2
0 2 3 BiraVXIlF 16.5 16.6 16.8 Neg. ·31 .28NS
16.8 17·3 16.8 16.6
Nott/XRF 20.60 20.50 21.66 Neg, los<} .02NS 2lo7l 19o86
23·04 24·27 Tohok/IPAA 16 18 16 16.7 .64 o58 3o50NS
17 17 16
USGSR/OES 24 25 24 25o8 Neg, 2.4 ,llNS
27 26 29 ETH/XIlF 18 17 18 18
Notes for tables 1-3 Critical values of the F ratio for several probabilities and degrees of freedom
Degrees of freedom 0.05
(1,2) ------------------------------- 18.5 ( 1 ,4) ------------------------------- 10.1 (2,3) ------------------------------- 9.55 (2,9) ------------------------------- 4.26
Probability
0.025
38.5 12.2 16.0 5.71
0.01
98.5 21.2 30.8 8.02
810: Marine Ecology Laboratory, Bedford Institute of Oceanography, Dartmouth, N.S., Canada B2Y 4A2. Analyst: R. T. T. Rantala.
48 Three USGS Mafic Rock Reference Samples
Birm:
BMNH:
Method: Sample portions were decomposed by acid in Teflon bombs (Rantala and Loring, 1973), and the constituents were determined by flame emission absorption spectroscopy (Rantala and Loring, 1975). Department of Geological Sciences, University of Birmingham, P .0. Box 363, Birmingham, B15 2TI, England. Analyst: G. L. Hendry. Method: Ten grams of rock powder were mixed with 20 drops of a 7 percent aqueous solution of polyvinyl alcohol, and the mixture was compressed at 15 tons between polished faces of a 46-mm diameter steel die. Pellets were dried overnight at 110°C before analysis.
The elements were determined by the method of Leake and others (Leake and others, 1969), using a Philips PW 14501
automatic wavelength dispersive X -ray fluorescence spectrometer with a LiF 220 crystal and a proportional or a scintillation counter. The gas for the proportional counter was 900Jo argon -100Jo methane. (a) For Ni, Cr, Zr, and Nb, a tube with an Rh anode was operated at 70 k V and 30 rnA with a 0.15-mm collimater. A proportional counter was used for Ni and Cr and a scintillation counter for Zr and Nb. Standards were prepared from pure oxide powders, or solutions of elements were added to rock and silica powders. (b) A tube with an Mo anode, used for Y, Sr, Rb, Th, Pb, Ga, Zn, and Ba, was operated at 60 kV and 30 rnA with a 0.55-mm collimator for Ba but a 0.15-mm collimator for the other elements. The proportional counter was used for Ga, Zn, and Ba and the scintillation counter for the other elements. In addition to standards as in (a), samples whose Rb, Sr, and Ba contents had been determined by IDMS were used. (c) Ce, La, and Nd were determined with an X-ray tube with a W anode operated at 60 kV and 30 rnA, with a 0.55-mm collimator and the flow counter. Standards were samples analyzed for their Ce, La, and Nd contents by IDMS. Department of Mineralogy, British Museum of Natural History, Cromwell Road, London, SW7 5BD, England. Analysts: G. Jones, C. Elliott, V. Din. Methods: (data were obtained on sample portions dried at 110°C for 2 hours). Gravimetric: Si02, CaO (corrected for SrO), and MgO (corrected for MnO). Colorimetric: Ti02 was determined with Tiron, Fe203T with sulfosalicylic acid, MnO with permanganate, and P 20s with molybdenum blue
1Trade names are used for identification only and do not constitute endorsement by the U.S. Geological Survey.
Chels:
in either (a) a solution of a KHS04 fusion of the ignited R203 precipitate or (b) an H2S04 solution of the rock sample after removal of SiF4 by HF and H2S04. Al201 was found by difference after either type of solution. Titrimetric: The sample was dissolved in HF-H2SO. in a sealed polycarbonate bottle and, after adding H1BOh ferrous iron was titrated with standardized KMn04. C, H, N elemental analyzer: Total C and total H were calculated to C02 and H20, respectively. Ion-selective electrode: After pyrohydrolytic separation from a rock sample mixed with a flux, F was determined. Atomic absorption: Constituents were determined in HF-H3B01 solutions containing 200 mg of rock sample in 100 mL. Synthetic or reference samples prepared similarly were used for calibration. X-ray fluorescence: Constituents were determined in glass discs prepared in pairs from one fusion mixture of 1000 mg of rock sample with 4000 mg of lithium metaborate. All discs were analyzed against reference samples prepared similarly.
* BMNH/Chem: Three analysts each made two of the six determinations. The average was used for best values but the data were not used for the analysis of variance.
* BMNH/XRF: The separate sets of data were made by different analysts. Department of Geology, Chelsea College, 271 King Street, London, W6 9LZ, England (Gill); Department of Geology, Imperial College, Prince Consort Road, London, SW7, England (Rogers). Analysts: R. C. 0. Gill and N. W. Rogers. Method: 200-mg portions of W -2 and DNC-1, and 100-mg portions of BCR-1, were weighed into capsules. Other capsules contained 100 JLL of standard solutions evaporated onto a 1-cm filter paper (Borley and Rogers, 1979). Standard solutions contained rare-earth elements in the same proportions as those in BCR-1. The set of capsules was divided into two groups of 12 for irradiation, preserving random order. Capsules with standard solutions were placed at the bottom, middle, and top of each group of 12 capsules to correct for neutron flux gradients.
Samples were irradiated simultaneously in the "Consort Mk II" reactor at the University of London Reactor Centre, Silwood Park, Ascot, Berkshire, for 40 hr at a thermal flux of 1012 n cm- 2 s- 1• A Princeton Gamma-Tech (Li) detector of 42 cm3 active volume, with a resolution of 1.81 keY FWHM (full width-half maximum) at 1.33 meY, was used for energies >200 keY, and a Princeton Gamma-Tech
CRPG:
Curie:
ETH:
Exxon:
GCL:
ultrapure Ge detector with an active area of 200 mm2 and 5 mm thick, with a resolution of 520 eY at 122 keY, was used for energies <210 keY.
La, Lu, Ho, and Sm were determined about 3 days after irradiation when short-lived isotopes had decayed, and the remaining elements were determined after another delay of 3 weeks when other interfering isotopes had decayed. Centre de Recherches Petrographiques et Geochimiques, C. 0. No. 1, 54500 Y andoeuvre-les-Nancy, France. Analyst and method: K. Govindaraju and others (1976). Laboratoire de Geologie Appliquee, Universite Pierre et Marie Curie, 4, Place Jussieu, 75230 Paris, CEDEX 05, France. Analyst: M. Quintin. Method: Quintin and others (1978). Synthetic standards were made from CuO, Ga20, and ZnO (Johnson Matthey Chemicals Limited). Eidg. Technische Hochschule, ETH-Zentrum, CH-8092, Ziirich, Switzerland. Analysts: B. Ayranci, major and minor oxides, plus Cr, Cu, Ni, Sr, and Zn by atomic absorption and H20 by Penfield; Y. Dietrich, major and minor oxides plus trace elements by X-ray fluorescence, and Ba by IDMS. Exxon Production Research Co., P.O. Box 2189, Houston, Texas 77001. Analyst: P. E. Drez. Method: Spectrametric's Spectrascan IliA DC arc plasma emission spectrometer was used in the multielement mode with a 3-electrode spectrajet. 50-mg portions of rock in sealed polypropylene centrifuge tubes were dissolved with 3 mL HF and 2.8 g H1B03. Solutions were diluted so that the fmal concentration was 500 ppm of whole rock. 2000 ppm of Cs was added as an ionization buffer. Nineteen reference rocks were treated the same as the unknowns and were used as standards. Government Chemical Laboratories, 30 Plain Street, Perth, Western Australia 6000. Analysts: C. J. Dood (Cd and Zn); R. S. Y. Pepper (Be); and E. J. Tovey (As and B). Methods: Cd and Zn-AAS. Sample portions were dissolved with HF, HN01, and HOO. and taken to fumes. The residue was diluted to volume and Zn determined by atomic absorption. Cd was complexed with diethyl dithiocarbamate and extracted into chloroform. After evaporating the chloroform, the residue was dissolved in HC104 and diluted to volume before determining Cd by atomic absorption. An air-C2H2 flame was used for both elements. Be-AAS. Samples were fused with KHF2 and the fusion treated with H2S04 and brought to fumes. The residue was taken up with HCl and
Tables 1-6 49
Genev:
GSC:
diluted to volume to determine Be by atomic absorption ~than N20-C2H2 flame. B-Spectrophotometry. Samples were decomposed by sintering with Na2C03-ZnO and an aqueous extract was acidified with HO. After complexing fluorine with zirconyl chloride, the boron was extracted into a chloroform solution of 2-ethylhexane-1 ,3 diol (EHD). The chloroform was evaporated from the organic extract, leaving a residue containing the boron. After adding curcumin in acetic acid solution to the EHD residue, H2SO .. was also added, resulting in a boron complex (rosocyanin) in about 75 min. This solution was diluted to volume with ethanol and boron determined spectrophotometrically at 555 nm. As-Spectrophotometry. Sample portions were fused with Na2C03-Na202 and a water extract taken. After adding HO and Kl, the As was reduced with SnCl2 and further reduced to arsine by hydrogen generated by HO on Zn metal. After removing any H2S, the arsine was absorbed into a solution in which it was oxidized to arsenate by iodine. The arsenate was converted to arsenomolybdate, which was reduced by hydraziDe sulfate to a molybdenum blue whose absorbance was measured. Department of Mineralogy, University of Geneva, 13, rue des Marafchers, 1211 Geneva 4, Switzerland. Analyst: P. Voldet. Method: Voldet and Haerdi (1978). Geological Survey of Canada, 601 Booth Street, Ottawa, Canada KIA OES. An asterisk (*) following a letter for a method in the tables indicates the method preferred by GSC. Methods:
A: Sample portions were fused with lithium tetraborate-fluoride mixture and were cast into discs. The discs were irradiated in a programmable wavelength-dispersive X-ray fluorescence spectrometer. Peak and background intensities were processed by an off-line computer, referred to stored calibrations, and corrected for interelement effect and instrumental drift.
B: Modified Wilson vanadate method (Maxwell, 1968, p. 419-421).
C: By difference between total Fe (method A) and Fe(II) (method B).
D: Sample was fused with lithium metaborate and the fusion was disintegrated with dilute HCl. The solution was evaporated with HCl and methanol to dehydrate silica and volatilize boron. Silica was determined gravimetrically as Si02. The residue from the HF treatment was fused with pyrosulfate and set aside for the Ti
50 Three USGS MafiC Rock Reference Samples
determination. Unprecipitated silica was determined colorimetrically in the filtrate with molybdenum blue.
E: Determined in the ftltrate from D by atomic absorption spectroscopy with an N20-C2H2 flame.
F: Pratt method with potentiometric titration (Maxwell, 1968, p. 419, 423).
G: Same method as E, with an air-C2H2 flame. H: The pyrosulfate fusion from D was dissolved in
dilute sulfuric acid. The corresponding aliquots from that solution and the main ftltrate from D were combined, A103 and HCl were added, and Ti was determined as in E.
J: Determined in the ftltrate from D with molybdenum blue.
K: Sample was fused with Na2C03 and the fused melt leached with water. F was determined by an ion-selective electrode in the presence of a buffer.
L: Colorimetric determination with mercuric thiocyanate and ferric iron on an aliquot from K.
M: Determined by atomic absorption spectroscopy on a solid sample by a "screw-rod" method (Bouvier and Abbey, 1977).
N: Sample was mixed with buffer and graphite and excited in an air-jet controlled de arc. The emitted radiation was dispersed in a directreading optical spectrometer. The signals generated in individual photomultiplier tubes were processed automatically by an on-line mini-computer.
U: Uranium was separated by solvent extraction and determined fluorimetrically.
X: Rb and Sr were determined on unfused powders by comparison with similar standards in a manual X-ray fluorescence spectrometer.
Y: The sample was mixed with V 20s and then heated in a stream of oxygen. Evolved gases were analyzed by the integration of the signals generated in non-dispersive infrared detectors.
Z: Sample was mixed with lead oxide and heated in a Penfield tube (Maxwell, 1968, p. 426). The evolved water was dissolved in an organic solvent and titrated with Karl Fisher reagent.
a: Gases evolved by treating a sample with HO were passed through traps to remove interferences. C02 was absorbed in an organic solvent and determined by non-aqueous acidimetric titration in a modified sulfur titrator (Bouvier and others, 1972).
b: Conventional drying in an oven.
c: As and Sb were determined as hydrides by atomic absorption spectroscopy after leaching the sample with aqua regia and diluting an aliquot with 0.5 M HCl.
GSF:
HMI:
Analysts and methods used
Analyst Method
J. L. Bouvier------------------- D,F,Y,b V. E. Grushman --------------- K,L A. G. Douma----------------- A,M R. M. Rousseau --------------- A,X N. Bertrand-------------------- B,C F. J. Watson ------------------ a,Z P. G. Belanger --------------- N Gillis Gauthier------------------ c Serge Courville ---------------- U R. J. Guillas ------------------- X K. A. Church------------------ N R. A. Meeds------------------ N
Geological Survey of Finland, SF-02150 Espoo IS, Finland. Analysts: Chemical analysis, Risto Saikonen (W-2), Mervi Wiik (DNC-1), Christer Ahlsved (BIR-1); optical emission spectroscopy, A. Puisto and R. Danielson; isotope dilution mass spectroscopy, 0. Kuovo. Methods for chemical analysis (pages refer to Maxwell, 1968): Gravimetric: Si02 (p. 323-332, 348-350); CaO (p. 363-367); MgO (p. 372-374); H2o+ (p. 426-430). Colorimetric: Ti02 (p. 379-383); MnO (p. 387-389); P20s (p. 392-394); Fe203 as the yellow 1.14-HO complex. Titrimetric: FeO (p. 416-418). Atomic absorption: Al203, MgO, CaO, K20. Flame emission: Na20. Hahn-Meitner Institut, Postfach 39 01 28, D-1000 Berlin 39, Federal Republic of Germany. Analysts: INAA-F. Schley, Bereich Kemchemie und Reaktor. SSMS-J. Luck and W. Szacki, Department of Geochemistry. Methods: INAA: Samples were dried at l00°C and 100-150 mg portions were sealed in highpurity quartz ampoules. Samples were irradiated for 48 hr in a flux of -s x 1012 n cm- 2
s -I. Elements were measured, against either W-1 (INAA-W) or BCR-1 (INAA-B) as standards, by gamma-ray spectroscopy for 2000 s after a decay of 4-S days and for 7000 s after a decay of 30 days. Resolution of the detector was 1.9 keV at 1332 keV. SSMS: The operating conditions for the mass spectrometer were: spark voltage, 40 kV; high tension, 20 kV; magnet current, 300 rnA; source pressure, I0-6-I0-7 Torr; and analysis pressure, 2-4 x Io-s Torr. The determinations were made on a MS 702 with photoplate detection on IIford Q-2 plates with 16 exposures per plate from
Kjell:
LASL:
Liege:
Munich:
NERF:
NIM:
0.02 nC to 100 nC. Photoplates were developed by a modified ID 13 developer and measured with an Optronics S 3000 densitometer with an a-16 microcomputer and a Kennedy tape machine. Institute for Energy Technology, '1lX17 Kjeller, Norway. Analysts: A. Folio and E. Steinnes. University of California, Los Alamos National Laboratory, P.O. Box 1663, Los Alamos, New Mexico 87545. INAA-1 and DNAA-1, analyst, Ernest S. Gladney. INAA and XRF, analysts, T. J. Bornhorst and J. p. Balanga. Geologie, Petrologie, et Geochimie, Universite de Liege, B-4000 Sart-Tillman par Liege I, Belgium. Analysts: G. Bologne and I. Roelandts. Methods: FeO was determined volumetrically and H20+ and H20- gravimetrically on three portions of sample from each bottle. X-ray fluorescence: three measurements were made for each trace element on one pressed powder pellet from each bottle. The error term for FeO, H20+, and H20- is the error within separate portions of sample whereas the error term for the trace elements is the error within the triplicate measurements of each pressed powder pellet. Mineralogisch-Petrologisches Institut, Universitit Miinchen, Theresienstrasse 41, 8 Munich 2, Federal Republic of Germany. Analysts: G. Troll and A. Farzaneh. Reference: Farzaneh and Troll (1977, 1978). Research Centre, Netherlands Energy Research Foundation, 3, Westerduinweg, Petten (NH), The Netherlands. Analysts: H. A. van der Sloot and H. A. Das. Method: Si was determined by 14-meV neutron activation with a Sames neutron generator. An irradiation for 10 min at 1011 n cm-2s- 1 was used for Na, K, Mn, and Dy, and an irradiation for 1 min at the same flux for AI. For other elements, samples of about 1 g were irradiated for 2 hr at a flux of 3 x 10'2 n cm-2 s-r. National Institute for Metallurgy, Private Bag X3015, Randburg, 2125, South Africa. Methods: X-ray fluorescence spectroscopy. A subsample of 1 g was fused with a mixture of lithium tetraborate, sodium tetraborate, and sodium carbonate. A glass disc was cast and the sample evaluated using influence factors. (There are 9 d.f. for the error standard deviation for these data.) Atomic emission spectroscopy: A subsample of
Tables 1-6 51
Nott:
Open:
Parma:
0.2 g was fused with a mixture of LiB02, LiNOh and Bz03. After the fusion was put into solution, the solution was analyzed with a Hilger spectrometer using inductively coupled plasma excitation. Atomic absorption spectroscopy: A subsample of 1 g was attacked with HzS04, HC104, and HF in a platinum dish and the residue was dissolved in HCl and HN03. The elements were measured on a Varian-Techtron AAS using a NzO-CzHz flame. Neutron activation analysis: Subsamples of 0.5 g were irradiated for 3 hours and counted at decay times ranging from 3 to 30 days. The data were processed with a modified version of the Yule program. Flux variations were corrected by normalizing counts against monitor wires around standard vials. Ferrous oxide: Subsamples of 0.15 g were fused with sodium metafluoborate and sodium vanadate in an atmosphere of Nz. Fusions were leached in water and HzS04 and the solutions were titrated with ferrous ammonium sulfate. Total iron: Subsamples of 0.5 g were fused in sodium peroxide, the fusions were leached with water, and the resulting solutions were acidified with HCl after an Rz03 precipitation and dissolution of the hydroxides. The iron was determined by titration with potassium dichromate. Department of Geology, University of Nottingham, University Park, Nottingham, NG7 2RD, England. Analyst: P. K. Harvey. Method: The determinations were made on pressed powder pellets, and a modified Compton scatter ratio technique was used. Department of Earth Sciences, The Open University, Walton Hall, Milton Keynes, MK7 6AA, England. Analysts: P. J. Potts and 0. W. Thorpe. Method: Instrumental neutron-activation analysis. Istituto di Mineralogia, Universita degli Studi di Parma, Via A. Gramsci 9, 43100 Parma, Italy. Analysts: G. Di Battistine, F. Gallo, G. Venturelli, L. Vernia, L. Beccaluva, and F. Emiliani. Methods: Gravimetric: SiOz. Colorimetric: TiOz and Fez03 (Casanova and others, 1968); PzOs (Shapiro and Brannock, 1962). Flame photometric: Na, K. Atomic absorption spectroscopy: AI, Co, Cr, Cu, Li, Ni, Sr, and V. Two analysts determined v.
52 Three USGS Mafic Rock Reference Samples
TexA&M:
Tohok:
Toron:
Ulnd:
USGSM:
USGSD:
USGSR:
UWi.irz:
Department of Geology, Texas A&M University, College Station, Texas 77843. E. B. Ledger, T. T. Tieh, and M. W. Rowe determined uranium in W -2 by delayed neutron activation analysis. The uranium contents of DNC-1 and BIR-1 were below the limit of estimation (Ledger and others, 1980). Department of Chemistry, Tohoku University, Sendai, Japan 980. Instrumental photon activation analysis by T. Kato and H. Yo kobayashi. Method: Kato and others (1977); Masumoto and others ( 1978). SLOWPOKE Reactor Office, University of Toronto, Toronto, Canada M5S 1A4. Analyst: R. G. V. Hancock. Method: Hancock (1976). The third line of data was discarded for the analysis of variance of Ba data in W-2, and there are 3 d.f. for the error s.d. The first set of Eu data was obtained using 152mEu. Department of Geology, University of Indiana, Bloomington, Indiana 47405. Analyst: P. L. Lechler. U.S. Geological Survey, 345 Middlefield Road, Menlo Park, California 94025. Flame photometric determinations by P. R. Klock and B. Lai. U.S. Geological Survey, Federal Center, Denver, Colorado 80225. Determinations of NazO and Li by atomic absorption spectroscopy by V. M. Merritt. Determination of U and Th by delayed neutron activation analysis by H. T. Millard, Jr. (Millard, 1976). U.S. Geological Survey, Reston, Virginia 22092. Instrumental neutron activation analysis (Baedecker and others, 1977) by L. J. Schwarz. Atomic absorption spectrometry: Mg, Na, K, and Cu by W. M. d'Angelo; Li by A. K. Neuville. Flameless atomic absorption spectrometry: Ag and Ti by W. M. d' Angelo. Spectrophotometry: Mo and W by W. M. d'Angelo; Nb by E. Y. Campbell. Rapid rock analysis (Shapiro, 1975) by Z. A. Hamlin. Optical emission spectroscopic determinations by N. Rait using methods modified from Bastron and others (1960). X-ray fluorescence determinations by R. B. Johnson using methods modified from Rose and others (1963). Institut fiir Mineralogie und Kristallstrukturlehre, Universitiit Wiirzburg, Federal Republic of Germany.
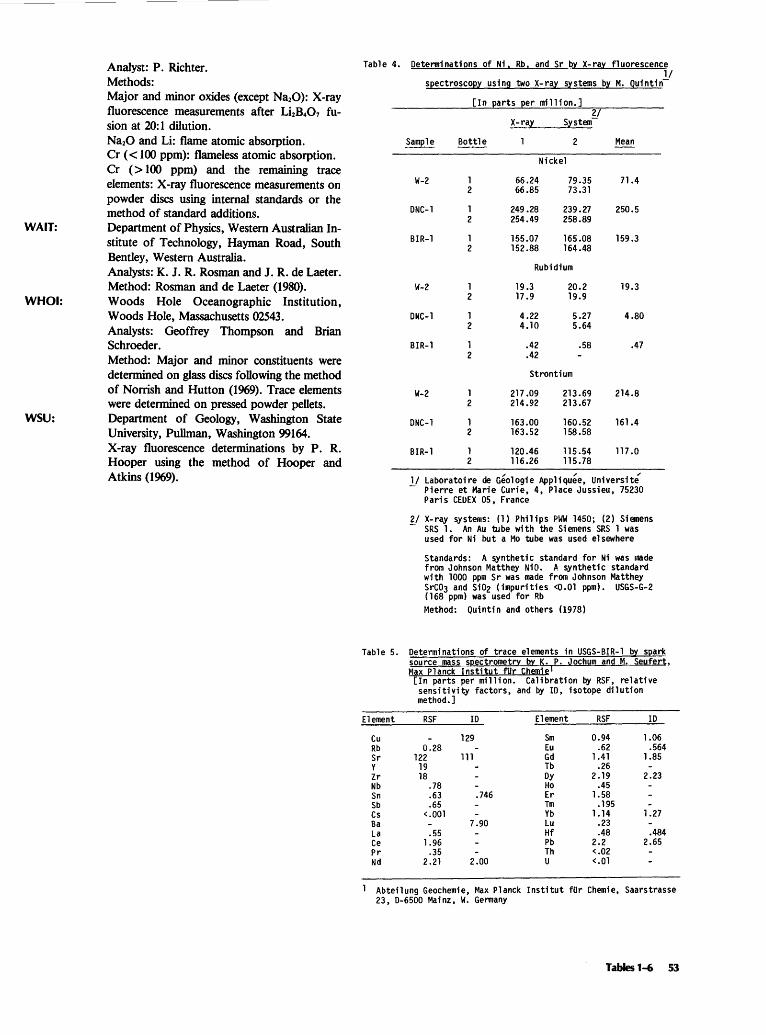
WAIT:
WHOI:
WSU:
Analyst: P. Richter. Methods: Major and minor oxides (except Na20): X-ray fluorescence measurements after Li2B401 fu·· sion at 20: 1 dilution. Na20 and Li: flame atomic absorption. Cr ( < 100 ppm): flameless atomic absorption. Cr ( > 100 ppm) and the remaining trace: elements: X-ray fluorescence measurements on powder discs using internal standards or the method of standard additions. Department of Physics, Western Australian Institute of Technology, Hayman Road, South Bentley, Western Australia. Analysts: K. J. R. Rosman and J. R. de Laeter. Method: Rosman and de Laeter (1980). Woods Hole Oceanographic Institution, Woods Hole, Massachusetts 02543. Analysts: Geoffrey Thompson and Brian Schroeder. Method: Major and minor constituents were determined on glass discs following the method of Norrish and Hutton (1969). Trace elements were determined on pressed powder pellets. Department of Geology, Washington State University, Pullman, Washington 99164. X-ray fluorescence determinations by P. R. Hooper using the method of Hooper and Atkins (1969).
Table 4. Detenninations of Ni, Rb, and Sr by X-ray fluorescence 1/
spectroscopy using two X- ray systems by M. Quintin-
Table 5.
Element
Cu Rb Sr y Zr Nb Sn Sb Cs Ba La Ce Pr Nd
W-2
DNC-1
BIR-1
W-2
[In parts per million.] 2/
Bottle
1 2
1 2
1 2
1 2
X-ray System-
2
Nickel
66.24 79.35 66.85 73.31
249.28 239.27 254.49 258.89
155.07 152.88
165.08 164.48
Rubidium
19.3 17.9
20.2 19.9
Mean
71.4
250.5
159.3
19.3
DNC-1 1 2
4.22 4.10
5.27 5.64
4.80
BIR-1
W-2
DNC-1
BIR-1
1 2
1 2
1 2
1 2
.42 .58
.42
Strontium
217.09 214.92
163.00 163.52
120.46 116.26
213.69 213.67
160.52 158.58
115.54 115.78
.47
214.8
161.4
117.0
1/ Laboratoire de Geologie Appliquee, Universite" - Pierre et Marie Curie, 4, Place Jussieu, 75230
Paris CEUEX 05, France
2/ X-ray systems: (l) Philips PWW 1450; (2) Siemens - SRS 1 • An Au tube with the Siemens SRS 1 was
used for Ni but a Mo tube was used elsewhere
Standards: A synthetic standard for Ni was made from Johnson Matthey NiO. i1 synthetic standard with 1000 ppm Sr was made from Johnson Matthey SrC03 and Si02 (impurities <0.01 ppm). USGS-G-2 (168 ppm) was used for Rb
Method: Quintin and others (1978)
RSF ID Element RSF ID
129 Sm 0.94 1.06 0.28 Eu .62 .564
122 111 Gd 1.41 1.85 19 Tb .26 18 Dy 2.19 2.23
.78 Ho .45
.63 .746 Er 1.58
.65 Tm .195 <.001 Yb 1.14 1.27
7.90 Lu .23 .55 Hf .48 .484
1.96 Pb 2.2 2.65 .35 Th <.02
2.21 2.00 u <.01
Abteilung Geochemie, Max Planck I nsti tut fllr Chemie, Saarstrasse 2 3 , D-6500 Ma i nz, W. Gennany
Tables 1-6 53
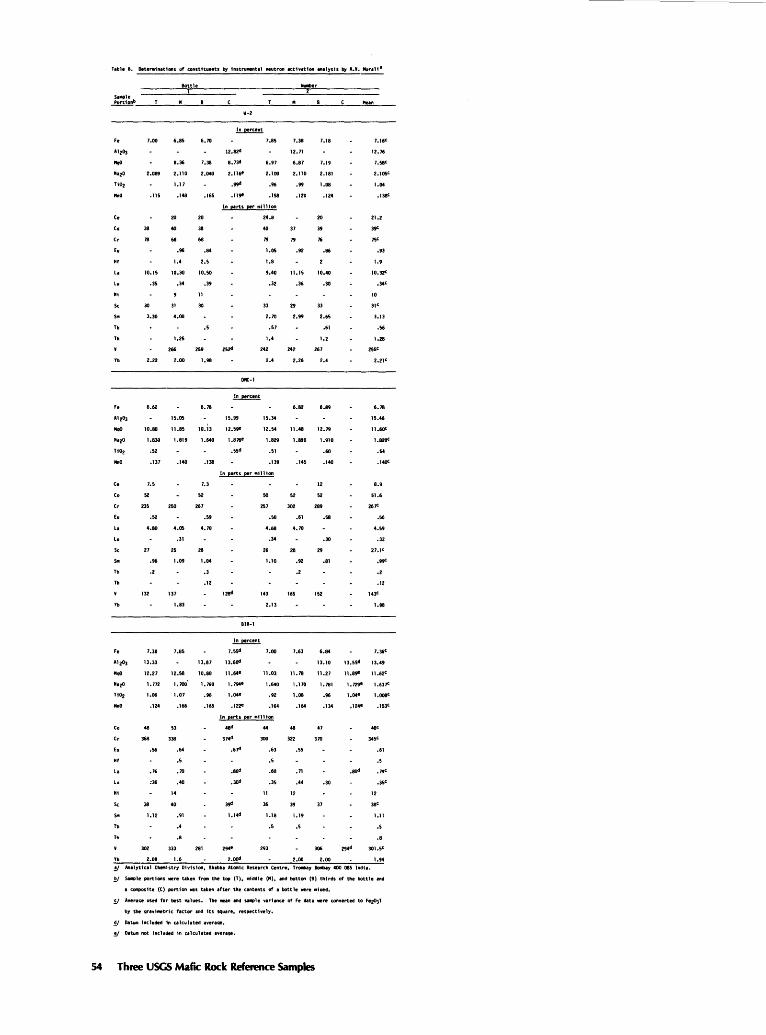
Tlble 6. Deteminattons of constttuMtts by instrUNntal neutron activation analysis by A.Y. Mura1i 1
l!ott1e
S.IIP10 Port1onb_---''----.:.:.----=---........:'-----__:..----'"----=---"---"'""==n~-
Fe
Na2o
T10z
MnO
Ce
Co
Cr
Eu
Hf
La
Lu
M1
Sc
Sol
Tb
Th
Yb
Fe
A1 20]
llq()
NazO
no2
MnO
Ce
Co
Cr
Eu
La
Lu
Sc
Tb
Th
Yb
Fe
A1 2o3
NqO
Ma2o
no2
MnD
Co
Cr
Eu
Hf
La
lu
N1
Sc
s..
Tb
Th
7.00 6.85
8.36
6.711
7.38
12.82'1
8.73d
W-2
2.089 2.110 2.040 2.116e
.115
1.17
.148 .165
.99'1
.1190
7.85
6.97
7.38
12.71
6.87
7.18
7.19
2.100 2.110 2.181
.96
.158
.99
.120
1.118
.124
7.16<
12.76
7.58C
2.105'
1.04
.138<
In erts eer •illion
38
78
20
40
68
.96
1.4
20
38
68
.84
2.5
10.15 10.30 10.50
.35 .34 .39
30
3.30
2.22
6.62
31
4.00
1.25
266
2.00
15,05
11
30
.s
259
1.98
6,78
2szd
15.99
10.80 11.85 1D.l3 12.590
Dr«:-1
1.830 1.819 1.640 1.876e
.52
.137 .140
,5sd
.138
24.8
40
79
1.05
1.8
37
79
.92
20
39
16
.86
9.40 11.15 10.40
.32 .36 .30
33
2.711
.57
1.4
242
2.4
15.34
29
2.99
242
2.26
6.82
33
2.65
.61
1.2
267
2.4
6.89
12.54 11.48 12.79
1.829 1.890 1.910
.51
.139 .145
.60
.140
21.2
39<
.93
1.9
10.32'
.34<
10
31°
3.13
.56
1.28
zss<
2.21'
6.78
15.46
11.60'
1.820'
.54
.140'
In ptrts per 11i11ton
7.5
52
235
.52
4.80
250
4.05
.31
7.3
52
267
.59
4.70
27 25 28
132
.96 1.09 1.04
.2
137
1.83
.3
.12
BIR-1
7.30
13.33
7.85
In percent
7.5sd
13,87 13.61Jd
12.27 12.58 10.80 11.64e
1.1n 1.roo· 1.11io 1,194e
1.06 1.07 .96 1.040
.124 .166 .165 .1220
so 257
.so
4.68
.34
52
302
.61
4.711
12
52
289
.58
.30
26 28 Z9
1.10 .92 .81
.2
143
2.13
7.00
165
7.63
152
6.84
8.9
51.6
267'
.56
4.59
.32
27.1'
.99<
.2
.12
143'
1.98
7.]6<
13.10 13,55'1 13.49
11.03 11.78 11.27 11.890 11.62<
1.640 1.170 1.781 l.n9" 1.637'
.92 1.08 .96 1.04e 1.008'
.164 .164 .134 .124e .153'
In earts per 11tll1on
48
368
.56
.16
:30
38
1.12
302
53
338
14
40
333
.64
.5
.70
.40
.91
.4
.8
281
.86'1
.JOd
44
300
11
.63
.5
.60
.35
36
1.18
.5
293
48
322
12
,55
.71
,44
39
1.19
.5
47
3711
37
306
.aod
.30
345<
12
.61
.5
1.11
.5
.8
301.5'
Yb 2.118 1.6 z.ood z.oo 2.00 1.94
!J Anllytfcal CMM1stry Division, Bhlbha Atat.~tc Research centre, TI"OIIIbay Bowlbly 400 085 lndi1.
!I S..Oie portions ,.. .. taken r...,. the totJ (T), middle (N), and bott.., (R) tll1rds of tlle bottle and
a composite (C) portion wu taken after the contents of a bottle wre •hed.
Sl Averac;e used for best values. The liNn and SIIIIP1e ·vtrianc.e of Fe data wre converted to FezOJT
by the gravt•t-ric. factor and tts square, respectively.
~ DatURt included in ca leu lated averaqe.
!f Datum not included in alculated averaqe.
54 Three USGS Mafic Rock Reference Samples


Recommended