Tillage Studies with a Corn-Soybean Rotation: Surface Runoff ChemistryL. B. Owens* and W. M. Edwards
ABSTRACTWhen soybean [Glycine max (L.) Meir.] is grown on sloping soils,
there is a high potential for soil and nutrient losses. The purpose ofthis study was to compare nutrient losses in surface runoff across arange of watershed conditions when tillage practice was a variable.For 6 yr in east-central Ohio, nutrient concentrations and transportin surface runoff were measured from six small (<l-ha) watershedsplanted to a corn (Zea mays L.)-soybean rotation. Two watershedswere chisel plowed each year, two were paraplowed, and two receivedno-tillage. Rye (Secale cereale L.) provided winter cover followingsoybean harvest. Nitrate-N and K concentrations in surface runoffwere greater during corn years than soybean years, but there was nosignificant difference among tillage treatments. There were no con-sistent differences between crops or among tillage practices for thetransport of soluble P, soluble K, and total organic C (TOC). Mostof the NO3-N loss was in the runoff from a small percentage of runoffevents. Although NO,-N concentrations in surface runoff frequentlyexceeded 10 mg/L during the corn years, the actual amount of N lostwas small. But because of year-to-year variation in runoff, whichmasked most of the differences resulting from cropping or tillage prac-tice, there is a need for long-term research (>6 yr) to assess theenvironmental risks associated with a particular management prac-tice.
SOME OF THE EARLY WORK, as well as more recentresearch, relating nutrients in surface runoff to
tillage and cropping practices was accomplished withrainfall simulators on plots (1, 4, 6, 7, 13, 16, 21).Timmons et al. (21) concluded that the nutrient con-tent of both runoff water and sediment needed to be
USDA-ARS North Appalachian Experimental Watershed, P.O.Box 478, Coshocton, OH 43812. Received 10 Apr. 1992. "Corre-sponding author.
Published in Soil Sci. Soc. Am. J. 57:1055-1060 (1993).
evaluated to determine the nutrient loss in surface run-off. The sediment fraction was the major carrier of Pfor conventional tillage, chisel plow, till-plant, andno-tillage (4). The sediment fraction was also foundto be the major source of plant nutrient loss whenevaluating six tillage practices with corn plots (7). Thenutrient losses in the water portion of the runoff weresmall compared with the amount of fertilizer appliedand total nutrient discharge. Similar results were re-ported for plow, chisel, and no-tillage practices withcorn-soybean rotations (13).
Residue left on the surface by various conservationtillage practices helped reduce runoff and soil loss andsubsequent nutrient loss. As actual nutrient loss de-creased, nutrient concentrations were observed to in-crease. At high residue rates, more P was leachedfrom the crop residue to elevate the P concentration(11, 16). Baker and Laflen (6) found very little, ifany, increase in nutrient concentrations as a directresult of the residue but attributed the concentrationincreases to unincorporated surface-applied fertilizer.Alberts et al. (1) reported that residue reduced thenutrient transport by reducing the denser sedimentfraction. However, the less dense particles, composedof a greater proportion of small silt and clay particles,increased nutrient concentrations.
Results from natural rainfall plots were generallybased on longer research periods but were often sim-ilar to the simulated rainfall plot studies. Burwell etal. (9) reported that the nutrient losses in surface run-off were low from continuous corn and a corn-oat—hay rotation. The average annual quantities of NH4-N and NO3-N received in precipitation were greaterthan the annual losses in surface runoff, but ortho-PAbbreviations: ANOVA, analysis of variance; TOC, total or-ganic carbon; WS, watershed.
1056 SOIL SCI. SOC. AM. J., VOL. 57, JULY-AUGUST 1993
Table 1. Phosphorus and K applications to the six conservationtillage watersheds (WS). Levels were based on soil tests.
Chisel Paraplow No-tillageWS 109 WS 123 WS 115 WS 127 WS 113 WS 118
PhosphorusOct. 1983Nov. 1984Oct. 1985Oct. 1986Jan. 1987Oct. 1988
PotassiumOct. 1983Nov. 1984Oct. 1985Oct. 1986Jan. 1987Oct. 1988
2060527700
2698811213400
206261037700
37023513413400
ImKg/
283261037700
40323513413400
Tia
155261037700
4702351341341340
180261037700
23523513413400
180261037700
23523513413400
losses in surface runoff were greater than the amountsreceived in precipitation. Nutrient losses in surfacerunoff from continuous soybean in a no-tillage systemwere lower than with conventional tillage, but nutrientconcentrations increased (15, 24). In contrast to sim-ulated rainfall studies, natural rainfall research doesnot have reproducible rainfall events. Pesant et al.(18) noted that the relative difference between tillagetreatments and nutrient loss may depend on the yearthat the comparison was made.
Nitrogen losses in surface runoff from small wa-tersheds cropped to corn in Georgia (14) were low.The difference in losses from watersheds with andwithout conservation practices was related primarilyto differences in sediment loss. Similarly, N and Plosses in surface runoff from corn watersheds in Iowa(2, 3, 8, 11) and Maryland (5) were low and mostlyassociated with the sediment.
There is considerable evidence that nutrient lossesin surface runoff are low with conservation tillagepractices, especially with corn. With the availabilityof herbicides to control weeds in soybean without cul-tivation, there is some plot work showing that nutrientlosses in runoff from soybean grown with limited til-lage are also low. But studies on a watershed scale ofnutrient losses in runoff from soybean, particularlysoybean in rotation, are limited. The purpose of thisstudy was to evaluate a corn-soybean/rye rotation sys-tem in terms of nutrient loss from surface runoff withdifferent conservation tillage practices on small wa-tersheds.
MATERIALS AND METHODSThe study was conducted at the North Appalachian Exper-
imental Watershed near Coshocton, OH. Six watersheds, each<0.8 ha, were farmed in a corn-soybean rotation for 6 yr.The dominant soil type in four of the six watersheds is Cosh-octon silt loam (fine-loamy, mixed, mesic Aquultic Haplu-dalf). Keene silt loam (fine-silty, mixed, mesic Aquic Hapludalf)and Rayne silt loam (fine-loamy, mixed, mesic Typic Haplu-dult) are the dominant soil types on a watershed described byEdwards et al. (10). Two of the watersheds were chisel plowedeach spring to 25-cm depth at 30-cm spacing, two watershedswere paraplowed each fall to 35-cm depth at 50-cm spacing,and two watersheds received no-tillage. A rye winter cover
crop was seeded in the soybean prior to leaf drop. The rye wasdesiccated with herbicides each spring. Ammonium nitrate wasapplied in the spring of the corn years at 224 kg N/ha. Lime,P, and K were fall applied at levels based on soil tests (Table1). All six watersheds received the same crop each year, be-ginning with corn in 1984.
Preparations for this watershed study, as well as the oper-ating procedures and description of the watershed soils, havealready been presented (10). Greater details on the soils, cli-mate, geology, and geomorphology of the area were describedby Kelley et al. (12).
Precipitation was measured with four standard recording raingauges located adjacent to WS 109, 113, 118, and 123. Theaverage of these gauges is reported. Surface runoff from thewatersheds was automatically measured with 0.90-m H-flumesand sampled with Coshocton wheels (17) modified to contin-uously deliver a proportional sample of runoff water and sus-pended sediment to a refrigerated container during each runoffevent.
Runoff and water samples were analyzed for NH4-N by anautomated phenate method and for NO3-N plus NO2-N by anautomated Cd-reduction method (22). After sample digestionin a block digester, total N was determined in both water andsediment by an automated phenate method (20) modified toinclude NO3-N and NO2-N. Organic N was obtained by dif-ference between total N and mineral N; mineral N is the sumof NH4-N, NOp-N, and NO2-N. Total P and soluble P weremeasured colorimetrically in acid-treated samples by modifiedphosphomolybdate procedures for samples of unfiltered andfiltered runoff water, respectively (22). Sediment-attached Pwas the difference between total P and soluble P. Total organicC was the difference between total C and total inorganic C asdetermined with an infrared C analysis system (OceanographyInternational Corp., College Station, TX).
The chemical data were tabulated on an annual basis (May-April) and for the 6-yr study period (May 1984-April 1990).The annual transport of each chemical was the sum of thetransport for all runoff events during the year. Flow-weightedaverage concentration values were weighted averages based ontotal chemical transport and total water flow for that period.Statistically significant differences were determined by AN-OVA (19).
RESULTS AND DISCUSSIONDuring the 6-yr study period, annual precipitation var-
ied from 828 to 987 mm (10), but values were wellwithin the long-term recorded extremes for the NorthAppalachian Watershed. The precipitation average wasless during the corn years (904 mm) than during thesoybean/rye years (956 mm).
The average annual runoff value for the soybean/ryeyears was 81.2 mm and was =80% greater than theaverage annual runoff for the corn years (45.7 mm). Thisdifference was significant even though there was a highdegree of runoff variability from year to year. Edwardset al. (10) discussed the variability of the individual wa-tersheds and the assignment of each tillage treatment toa high-runoff-producing watershed and a low-runoff-pro-ducing watershed. It was recognized that this pairingcould produce large variances, but an important objec-tive was the documentation of runoff, sediment, and nu-trient losses from three conservation practices over a rangeof watershed conditions. Edwards et al. (10) also pointedout that the soils in WS 109 have a relatively constantor even increasing permeability with depth. This is incontrast to the soils of the other watersheds, which havedecreasing permeabilities with depth, and helps to ex-
OWENS & EDWARDS: TILLAGE STUDIES WITH A CORN-SOYBEAN ROTATION 1057
Table 2. Annual (May-April) transport of NO3-N in surface runoff from the six conservation tillage watersheds (WS).Chisel Paraplow No-tillage
WS 109 WS 123 WS 115 WS 127 WS 113 WS 118
t Numbers followed by different letters within the same row are significantly different at the 0.05 probability level.
Avg.
Corn yearsMay 1984-Apr. 1985May 1986-Apr. 1987May 1988-Apr. 1989Treatment avg.
Soybean/rye yearsMay 1985-Apr. 1986May 1987-Apr. 1988May 1989-Apr. 1990Treatment avg.
0.10.30.0
0.00.01.1
2.318.04.6
4.2at
2.00.53.9
Uabf
———————— kg/ha -
2.715.92.6
11. 6a
1.60.31.4
3.6a
6.135.27.3
7.84.06.3
2.911.81.3
6.7a
1.00.50.8
I.Ob
12.110.31.8
1.50.31.7
4.415.22.97.5*
2.30.92.51.9*
plain why the runoff for WS 109 is much lower than forthe other watersheds.
Average annual transport of NO3-N in surface runoff(Table 2) was nearly four times greater during the cornyears than the soybean/rye years. This difference wassignificant in spite of a high degree of variation in sur-face runoff and nutrients carried in the runoff. Althoughthis variation was influenced by the designed variablesof crop and tillage as well as individual watershed char-acteristics, weather was a major, if not the most impor-tant, contributing factor. Nitrate-N transport was ~1.5to 3.5 times greater with the paraplow tillage than thechisel or no-tillage, but the only significant differencewas between the paraplow and no-tillage treatments dur-ing the soybean years.
Several other watershed studies compared manage-ment practices that produce greater differences in runoff,sediment, and nutrient loss, e.g., conventional tillage vs.no-tillage (5); conventional tillage vs. till-plant and ridge-plant (11); or conventional tillage-contour vs. mulch til-lage with level terraces (2, 3, 8). These comparisonsproduced differences that were great enough that theywere not overshadowed by annual weather variations.Earlier research has shown that runoff and erosion fromthe Coshocton watersheds under conventional tillage weretoo great for such management to be a viable practice inthis corn-soybean rotation study.
Even though some trends concerning nutrient loss insurface runoff can be noted, a 6-yr study was not longenough for firm conclusions to be drawn about tillageand cropping practice comparisons. A longer period ofstudy would not reduce the variability of watershed char-acteristics, but would increase the data base for weatherimpacts on tillage and cropping practices. Even thougha longer study period may not show more significantdifferences among the conservation tillage practices, itcould strengthen the conclusion that nutrient losses insurface runoff during a corn-soybean rotation are at anacceptable level when one of these tillage practices isused.
Nevertheless, nutrient losses via surface runoff in theseconservation tillage systems were small, especially whencompared with fertilizer inputs, e.g., <5% of the 224kg/ha of surface-applied N was lost in the runoff andsediment. Annual NO3-N losses in runoff were greaterduring the corn years, the years of fertilizer application,but averaged < 8 kg/ha. The above-cited watershed stud-
ies (2, 3, 5, 8, 11), many of which had unreplicatedconservation tillage practices, were conducted with cornbeing the only crop. The combined N loss from surfacerunoff and sediment ranged from 0.1 to 15 kg/ha, butmost of the N loss was associated with the sediment.
In contrast to the Iowa watersheds, soil loss from theCoshocton watersheds was low, and the sediment-at-tached N constituted only a small proportion of the com-bined N loss. The N loss via sediment was a little greaterduring the soybean/rye years than the corn years (1.8 vs.0.6 kg N/ha per year), and the variation followed thevariation in soil loss (Table 3). The use of soybean inrotation reduced the total surface N loss even though thesoluble N and sediment-attached N quantities were sim-ilar during the soybean years.
Although annual N losses were below major economicloss, 11 of the 17 annual NO3-N concentration valuesduring the corn years exceeded 10 mg/L (Table 4), themaximum level allowed for potable water (23). Greateraverage annual runoff and lower annual NO3-N transportduring the soybean years than during the corn years pro-duced approximately an eightfold difference in averageannual NO3—N concentrations in surface runoff from thetwo crops, which was statistically significant. None ofthe annual flow-weighted NO3-N concentrations for thewatersheds during the soybean/rye years reached a levelabove one-half of the 10 mg/L threshold.
Because of variations due to weather and differences
Table 3. Loss of sediment-attached N and sediment-attachedP._______________________________
Sediment- Sediment-Avi- attached N loss attached P loss
sediment _______ _________loss Avg. Ranget Avg. Ranget
Corn yearsMay 1984-Apr. 1985May 1986-Apr. 1987May 1988-Apr. 1989
Soybean/rye yearsMay 1985-Apr. 1986May 1987-Apr. 1988May 1989-Apr. 1990
6-yr avg.Com-yr avg.Soybean/rye-yr avg.
5769066
284181
1881526270779
0.11.40.2
0.50.54.61.30.61.8
- kg/ha -
O.O-fl.30.2-3.70.0-0.4
0.0-1.60.1-1.41.1-7.80.4-1.60.1-1.30.5-2.9
0.060.450.10
0.210.191.430.410.200.61
0.01-0.160.07-1.250.00-0.18
0.01-0.580.05-0.380.45-2.270.15-0.620.03-0.480.24-0.92
t Range of annual totals for the six watersheds.
1058 SOIL SCI. SOC. AM. J., VOL. 57, JULY-AUGUST 1993
Table 4. Flow-weighted annual (May-April) concentrations of NO,-N in surface runoff from the six conservation tillage watersheds(WS).
Chisel Paraplow No-tillageWS 109f WS 123 WS 115 WS 127 WS 113 WS 118 Avg.
Corn yearsMay 1984-Apr. 1985May 1986-Apr. 1987May 1988-Apr. 1989Treatment avg.
Soybean/rye yearsMay 1985-Apr. 1986May 1987-Apr. 1988May 1989-Apr. 1990Treatment avg.
4.814.1—
lO.laf
1.60.72.8
1.7af
5.217.29.3
1.50.62.8
——————— mg/L -
19.829.656.5
25.9b
4.80.92.2
3.4b
8.726.614.1
5.03.73.7
18.916.74.8
12.6ab
2.40.80.8
1.2a
15.914.25.2
1.80.31.3
12.219.718.016.6*
2.81.22.32.1*
t Numbers followed by different letters within the same row are significantly different at the 0.05 probability level.
Table 5. Growing (May-October) and dormant (November-April) season comparisons of runoff, NO3-N transport, and flow-weighted NO.,-N concentration.
NO3-NRunoff Transport Concentration
Growing Dormant Growing Dormant Growing Dormant
Corn yearsMay-Oct.May-Oct.May-Oct.3-yr avg.
Soybean/ryeMay-Oct.May-Oct.May-Oct.3-yr avg.
1984/Nov.1986/Nov.1988/Nov.
years1985/Nov.1987/Nov.1989/Nov.
1984-Apr.1986-Apr.1988-Apr.
1985-Apr.1989-Apr.1989-Apr.
198519871989
198619881990
———————————— Ill
4402
15
7124321
|tll ————————————
33332631
68486561
——————— "-B/
1.612.81.15.2
0.80.31.10.8
lid ————————
2.82.51.82.4
1.50.61.41.1
uij
40.229.057.641.4
12.33.02.76.0
yL- —————
7.67.08.47.7
2.00.91.91.6
in watershed characteristics, variation of NO3—N con-centrations in surface runoff with the same tillage treat-ment was great. Nevertheless, flow-weighted annual NO3-N concentrations in surface runoff from paraplow-treatedwatersheds were significantly greater than from the chiseland no-tillage treatment watersheds during the soybean/rye years and significantly greater than the chisel-treatedwatershed during the corn years (Table 4).
When the year was divided into a growing season(May-October) and a dormant season (November-April),
Table 6. Amounts of surface runoff and NO3-N transportoccurring with the large runoff and transport events fromthe six conservation tillage watersheds (WS).
Runoff NO3-N transport
Tillage
No-tillWS 113WS118
ParaplowWS 115WS127
ChiselWS 123WS 109f
Totalrunoffevents
113334
100336
10783
Totalrunoff
mm
325480
197689
54648
10largestrunoffevents
10 largestN-transport
events
10 largestrunoffevents
10 largestN-transport
events———————— % of total ————————
54.541.9
57.435.6
50.585.4
26.529.0
39.626.0
29.879.2
48.437.8
61.347.8
57.676.8
82.060.6
82.458.8
75.681.2
t Only the four largest events are presented.
more than twice as much runoff occurred during the dor-mant season than during the growing season regardlessof crop (Table 5). Differences in runoff between cropsand between these two seasons were significant. Nearly70% of the NO3-N transport during the corn years oc-curred during the growing season, but there was no greatseasonal difference in NO3-N transport during the soy-bean/rye years. Because of the variation in NO3-N trans-port, no significant differences were shown betweenseasons or crops. Nitrate-N concentration in the runoffwas significantly greater during the growing seasons, es-pecially during the corn years when the average flow-weighted concentration for NO3-N was 41.4 mg/L.
These higher concentrations present a potential surfacewater quality problem. It would be useful to assess theeffectiveness of grass filter strips or riparian zones inreducing NO3-N concentration in surface runoff beforeit enters streams or ponds. Nitrogen management op-tions, which could be quite useful and deserve furtherstudy on a watershed scale, are split N applications, re-duced N applications to economically optimum levels (orjust below), a slow-release N source, nitrification inhib-itors, or a combination of these.
Most of the surface runoff and most of the transportof NO3-N occurred with a small number of storms (Ta-ble 6). The 10 largest surface runoff events from eachwatershed (3-10% of the runoff events) produced 36 to57% of the surface runoff. These same events trans-ported 38 to 61% of the NO3-N removed in runoff. The10 largest runoff events in terms of NO3-N transport are
OWENS & EDWARDS: TILLAGE STUDIES WITH A CORN-SOYBEAN ROTATION 1059
not quite the same events as already discussed and car-ried 59 to 82% of the NO3-N in 26 to 40% of the surfacerunoff. Watershed 109 had the fewest number of runoffevents and least amount of total runoff. Four storms con-tributed >75% of the surface runoff and NO3-N trans-port from this watershed.
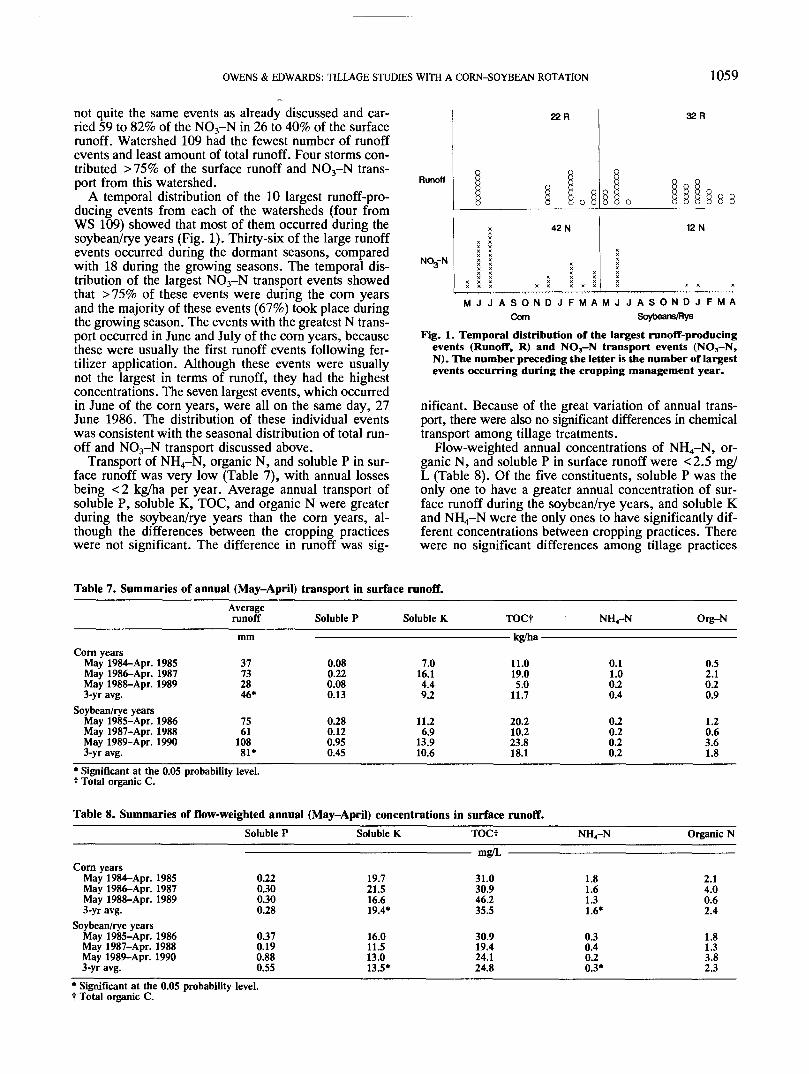
A temporal distribution of the 10 largest runoff-pro-ducing events from each of the watersheds (four fromWS 109) showed that most of them occurred during thesoybean/rye years (Fig. 1). Thirty-six of the large runoffevents occurred during the dormant seasons, comparedwith 18 during the growing seasons. The temporal dis-tribution of the largest NO3-N transport events showedthat >75% of these events were during the corn yearsand the majority of these events (67%) took place duringthe growing season. The events with the greatest N trans-port occurred in June and July of the corn years, becausethese were usually the first runoff events following fer-tilizer application. Although these events were usuallynot the largest in terms of runoff, they had the highestconcentrations. The seven largest events, which occurredin June of the corn years, were all on the same day, 27June 1986. The distribution of these individual eventswas consistent with the seasonal distribution of total run-off and NO3-N transport discussed above.
Transport of NH4-N, organic N, and soluble P in sur-face runoff was very low (Table 7), with annual lossesbeing <2 kg/ha per year. Average annual transport ofsoluble P, soluble K, TOC, and organic N were greaterduring the soybean/rye years than the corn years, al-though the differences between the cropping practiceswere not significant. The difference in runoff was sig-
Runoff
N03-N
22 R
42 N
32R
12 N
M J J A S O N D J F M A M J J A S O N D J F M ACom Soybeans/Rye
Fig. 1. Temporal distribution of the largest runoff-producingevents (Runoff, R) and NO3-N transport events (NO3-N,N). The number preceding the letter is the number of largestevents occurring during the cropping management year.
nificant. Because of the great variation of annual trans-port, there were also no significant differences in chemicaltransport among tillage treatments.
Flow-weighted annual concentrations of NH4-N, or-ganic N, and soluble P in surface runoff were < 2.5 mg/L (Table 8). Of the five constituents, soluble P was theonly one to have a greater annual concentration of sur-face runoff during the soybean/rye years, and soluble Kand NH4-N were the only ones to have significantly dif-ferent concentrations between cropping practices. Therewere no significant differences among tillage practices
Table 7. Summaries of annual (May-April) transport in surface runoff.
Corn yearsMay 1984-Apr. 1985May 1986-Apr. 1987May 1988-Apr. 19893-yr avg.
Soybean/rye yearsMay 1985-Apr. 1986May 1987-Apr. 1988May 1989-Apr. 19903-yr avg.
Averagerunoffmm
37732846*
7561
10881*
Soluble P
0.080.220.080.13
0.280.120.950.45
Soluble K
7.016.14.49.2
11.26.9
13.910.6
TOCtb-fT/hl———— Kg/na ———
11.019.05.0
11.7
20.210.223.818.1
NH4-N
0.11.00.20.4
0.20.20.20.2
Org-N
0.52.10.20.9
1.20.63.61.8
* Significant at the 0.05 probability level.t Total organic C.
Table 8. Summaries of flow-weighted annual (May-April) concentrations in surface runoff.Soluble P Soluble K TOCt NH4-N Organic N
Corn yearsMay 1984-Apr. 1985May 1986-Apr. 1987May 1988-Apr. 19893-yr avg.
Soybean/rye yearsMay 1985-Apr. 1986May 1987-Apr. 1988May 1989-Apr. 19903-yr avg.
* Significant at the 0.05t Total organic C.
0.220.300.300.28
0.370.190.880.55
probability level.
19.721.516.619.4*
16.011.513.013.5*
———— mg/L ———
31.030.946.235.5
30.919.424.124.8
1.81.61.31.6*
0.30.40.20.3*
2.14.00.62.4
1.81.33.82.3
1060 SOIL SCI. SOC. AM. J., VOL. 57, JULY-AUGUST 1993
for soluble K, NH4-N, and organic N. There were sig-nificant differences between paraplow and no-tillage forsoluble P and between paraplow and chisel for TOC.
Sediment-attached P losses were also small (Table 3).Although these losses tended to be greater during thesoybean/rye years, no annual loss exceeded 2.3 kg P/ha,and the difference was approximately proportional to theratio of sediment loss, i.e., more P was lost becausemore sediment was lost. More P was lost with the sed-iment than in the water (Table 7). As with the NO3-N,variability in the transport and concentration of the othernutrients was great.
Because of great variability in nutrient concentrationsand transport, continued research on the effects of con-servation tillage management systems on surface runoffquality is warranted. Nevertheless, 6 yr of a corn-soy-bean rotation study indicated that N concentrations andlosses were less with no-tillage than with paraplow til-lage. The highest NO3-N concentrations in the runoffoccurred during the growing seasons of the corn years.It may be necessary to incorporate other conservationpractices to reduce the potential degradation of surfacewaters from high NO3-N runoff during these periods.
Recommended