Netherlands Journal of Geoscienceshttp://journals.cambridge.org/NJG
Additional services for Netherlands Journal of Geosciences:
Email alerts: Click hereSubscriptions: Click hereCommercial reprints: Click hereTerms of use : Click here
Towards an improved geological interpretation of airborneelectromagnetic data: a case study from the Cuxhaven tunnel valley andits Neogene host sediments (northwest Germany)
D. Steinmetz, J. Winsemann, C. Brandes, B. Siemon, A. Ullmann, H. Wiederhold and U. Meyer
Netherlands Journal of Geosciences / FirstView Article / January 2015, pp 1 - 27DOI: 10.1017/njg.2014.39, Published online: 30 December 2014
Link to this article: http://journals.cambridge.org/abstract_S0016774614000390
How to cite this article:D. Steinmetz, J. Winsemann, C. Brandes, B. Siemon, A. Ullmann, H. Wiederhold and U. Meyer Towards an improvedgeological interpretation of airborne electromagnetic data: a case study from the Cuxhaven tunnel valley and its Neogenehost sediments (northwest Germany). Netherlands Journal of Geosciences, Available on CJO 2014 doi:10.1017/njg.2014.39
Request Permissions : Click here
Downloaded from http://journals.cambridge.org/NJG, IP address: 194.95.112.91 on 14 Jan 2015

Netherlands Journal of Geosciences — Geologie en Mijnbouw page 1 of 27 doi:10.1017/njg.2014.39
Towards an improved geological interpretation of airborneelectromagnetic data: a case study from the Cuxhaven tunnelvalley and its Neogene host sediments (northwest Germany)
D. Steinmetz1, J. Winsemann1,∗, C. Brandes1, B. Siemon2, A. Ullmann2,3, H. Wiederhold3
& U. Meyer2
1 Institut fur Geologie, Leibniz Universitat Hannover, Callinstr. 30, 30167 Hannover, Germany
2 Bundesanstalt fur Geowissenschaften und Rohstoffe, Stilleweg 2, 30655 Hannover, Germany
3 Leibniz-Institut fur Angewandte Geophysik, Stilleweg 2, 30655 Hannover, Germany∗ Corresponding author. Email: [email protected]
Abstract
Airborne electromagnetics (AEM) is an effective technique for geophysical investigations of the shallow subsurface and has successfully been
applied in various geological settings to analyse the depositional architecture of sedimentary systems for groundwater and environmental purposes.
However, interpretation of AEM data is often restricted to 1D inversion results imaged on resistivity maps and vertical resistivity sections. The
integration of geophysical data based on AEM surveys with geological data is often missing and this deficiency can lead to uncertainties in the
interpretation process. The aim of this study is to provide an improved methodology for the interpretation of AEM data and the construction
of more realistic 3D geological subsurface models. This is achieved by the development of an integrated workflow and 3D modelling approaches
based on combining different geophysical and geological data sets (frequency-domain helicopter-borne electromagnetic data (HFEM), time-domain
helicopter-borne electromagnetic data (HTEM), three 2D reflection seismic sections and 488 borehole logs). We used 1D inversion results gained from
both HFEM and HTEM surveys and applied a 3D resistivity gridding procedure based on geostatistical analyses and interpolation techniques to create
continuous 3D resistivity grids. Subsequently, geological interpretations have been performed by combining with, and validation against, borehole
and reflection seismic data. To verify the modelling results and to identify uncertainties of AEM inversions and interpretation, we compared the
apparent resistivity values of the constructed 3D geological subsurface models with those of AEM field measurements. Our methodology is applied
to a test site near Cuxhaven, northwest Germany, where Neogene sediments are incised by a Pleistocene tunnel valley. The Neogene succession is
subdivided by four unconformities and consists of fine-grained shelf to marginal marine deposits. At the end of the Miocene an incised valley was
formed and filled with Pliocene delta deposits, probably indicating a palaeo-course of the River Weser or Elbe. The Middle Pleistocene (Elsterian)
tunnel valley is up to 350 m deep, 0.8–2 km wide, and incised into the Neogene succession. The unconsolidated fill of the Late Miocene to
Pliocene incised valley probably formed a preferred pathway for the Pleistocene meltwater flows, favouring the incision. Based on the 3D AEM
resistivity model the tunnel-valley fills could be imaged in high detail. They consist of a complex sedimentary succession with alternating fine- and
coarse-grained Elsterian meltwater deposits, overlain by glaciolacustrine (Lauenburg Clay Complex) and marine Holsteinian interglacial deposits.
The applied approaches and results show a reliable methodology, especially for future investigations of similar geological settings. The 3D resistivity
models clearly allow a distinction to be made between different lithologies and enables the detection of major bounding surfaces and architectural
elements.
Keywords: 3D subsurface model, airborne electromagnetics, Cuxhaven, Neogene incised valley, Pleistocene tunnel valley, uncertainties, workflow
Introduction
Airborne electromagnetics (AEM) is an effective techniqueto investigate the shallow subsurface. It has successfullybeen applied in various geological settings to analyse the
depositional architecture (e.g. Jordan & Siemon, 2002; Huuseet al., 2003; Sandersen & Jørgensen, 2003; Paine & Minty, 2005;Jørgensen & Sandersen, 2006, 2009; Bosch et al., 2009; Steueret al., 2009; Pryet et al., 2011; Burschil et al., 2012a,b; Klimkeet al., 2013). AEM enables a fast geological overview mapping
C© Netherlands Journal of Geosciences Foundation 2015 1

Netherlands Journal of Geosciences — Geologie en Mijnbouw
of subsurface structures and allows different lithologies andpore water conditions to be distinguished (Siemon, 2005; deLouw et al., 2011; Burschil et al., 2012a). Inversion proce-dures are carried out to create resistivity-depth models (e.g.Siemon et al., 2009a,b), which are the basis for resistivity-depth sections and maps. Although this technique is a well-established method to improve geological interpretations of thesubsurface architecture, there is a substantial need for an ef-ficient and reliable methodology to image the results in threedimensions.
Progress in imaging the results in three dimensions was madeby combining 1D inversion models into 3D gridded data models(e.g. Lane et al., 2000; Jørgensen et al., 2005; Bosch et al., 2009;Palamara et al., 2010; Jørgensen et al., 2013). However, this in-tegration gave limited consideration to uncertainties related tothe interpolation procedure (e.g. Pryet et al., 2011). To min-imise these uncertainties different approaches were developed,including an integrated geophysical and geological interpreta-tion based on AEM surveys, reflection seismic sections, bore-hole data and logs. This provides the most reliable results andleads to a minimisation of interpretational uncertainties (e.g.Gabriel et al., 2003; Jørgensen et al., 2003a; BurVal WorkingGroup, 2009; Jørgensen & Sandersen, 2009; Høyer et al., 2011;Jørgensen et al., 2013). However, little attention has been paidto developing methodologies with an integrated interpretationusing different geological and geophysical data sets for theshallow subsurface.
The aim of this paper is to provide a methodology to con-struct a 3D subsurface model with reduced interpretation un-certainties by integrating AEM, borehole and seismic data. Themethod was applied and tested with data sets 6 km south fromCuxhaven, northwest Germany. The study area comprises Neo-gene sediments that are incised by an Elsterian tunnel valley.Previous studies focused on overview mapping of Neogene andPalaeogene marker horizons and Pleistocene tunnel valleys from2D reflection seismic sections and borehole logs (Gabriel et al.,2003; BurVal Working Group, 2009; Rumpel et al., 2009). Largerconductive structures within the valley fill were identified from1D inversion results of frequency-domain helicopter-borne elec-tromagnetic data (HFEM) and time-domain helicopter-borneelectromagnetic data (HTEM) inversion results (Rumpel et al.,2009; Steuer et al., 2009). Using the previous results and inter-pretations as well as our new data sets, we provide a detailedanalysis of the seismic facies and sedimentary systems includedin a 3D geological subsurface model, resolving architectural ele-ments in much greater detail. We generated 3D resistivity gridsbased on the geostatistical analysis and interpolation of 1D AEMinversion results. The 3D resistivity grids combine the advan-tage of volumetric computations with the visualisation of wideresistivity ranges and allow the direct comparison and imple-mentation of additional data sets such as borehole and seismicdata to improve the geological interpretation of the shallowsubsurface.
Geological setting and previous research
The study area is 7.5 km by 7.5 km and is located in northwestGermany, between Cuxhaven in the north and Bremerhavenin the south (Fig. 1A). The study area belongs to the CentralEuropean Basin System that evolved from the Variscan forelandbasin in the Late Carboniferous (Betz et al., 1987).
In Permian times a wide continental rift system developed,resulting in N–S trending graben structures (Gast & Gundlach,2006). During the Late Permian, repeated marine transgressionsflooded the subbasins and thick evaporite successions formed(Pharaoh et al., 2010). Extensional tectonics during the Mid-dle to Late Triassic led to the formation of NNE–SSW trendinggraben structures, following the orientation of major basementfaults. The main extensional phase in the Late Triassic was ac-companied by strong salt tectonics and rim-syncline develop-ment (Kockel, 2002; Grassmann et al., 2005; Maystrenko et al.,2005a). During the Late Cretaceous to Early Palaeogene, thearea was tectonically reactivated, an event that is related tothe Alpine Orogeny (Maystrenko et al., 2005a) and was accom-panied by local subsidence and ongoing salt tectonics (Bald-schuhn et al., 1996, 2001; Kockel, 2002; Grassmann et al., 2005;Maystrenko et al., 2005a; Rasmussen et al., 2010).
Palaeogene and Neogene marginal-marine deposits
Since the Late Oligocene, sedimentation in the North Sea Basinhas been dominated by a large clastic depositional system, fedby the Baltic River System (Huuse & Clausen, 2001; Overeemet al., 2001; Huuse, 2002; Kuster, 2005; Møller et al., 2009; Knoxet al., 2010; Anell et al., 2012; Rasmussen & Dybkjær, 2013;Thole et al., 2014). Initially the Baltic River System, drainingthe Fennoscandian Shield and the Baltic Platform, progradedfrom the northeast, and then the sediment transportation di-rection rotated clockwise to southeast (Sørensen et al., 1997;Michelsen et al., 1998; Huuse et al., 2001).
Early Miocene deposits in the study area consist of fine-grained glauconite-rich marine outer shelf deposits boundedat the base by an unconformity (Gramann & Daniels, 1988;Gramann, 1989; Overeem et al., 2001; Kuster, 2005). K–Ar ap-parent ages of these sediments range from 24.8 to 22.6 Ma(Odin & Kreuzer, 1988), indicating that the basal unconformitycorrelates with the marked climatic deterioration and eustaticsea-level fall at the Palaeogene–Neogene transition (Huuse &Clausen, 2001; Zachos et al., 2001; Miller et al., 2005; Ras-mussen et al., 2008, 2010; Anell et al., 2012).
The lower boundary of the Middle to Late Miocene depositsis the intra Middle Miocene unconformity. The unconformitycan be traced as a strong seismic reflector or as a prominentdownlap surface in most parts of the North Sea Basin (Cameronet al., 1993; Michelsen et al., 1995; Huuse & Clausen, 2001;Rasmussen, 2004; Møller et al., 2009; Anell et al., 2012) andcoincides with a significant depositional hiatus in the southern,
2

Netherlands Journal of Geosciences — Geologie en Mijnbouw
Fig. 1. (A) Location of the study area and maximum extent of the Pleistocene ice sheets (modified after Jaritz, 1987; Baldschuhn et al., 1996, 2001;
Scheck-Wenderoth & Lamarche, 2005; Ehlers et al., 2011). (B) Hill-shaded relief model of the study area, showing the outline of the Hohe Lieth ridge.
(C) Close-up view of the study area showing the location of Pleistocene tunnel valleys (light yellow) and the location of boreholes (coloured dots).
Boreholes used in the seismic and cross-sections are indicated by larger dots; seismic sections S1 (Fig. 4), S2 and S3 (Fig. 5) are displayed as black lines.
Cross-section A–B is visualised in Fig. 6; C–D is visualised in Fig. 7. (D) HFEM surveys are displayed as grey lines; HTEM surveys are displayed as dark grey
dots.
central and northern North Sea Basin (Rundberg & Smalley,1989; Huuse & Clausen, 2001; Stoker et al., 2005a,b; Eidvin &Rundberg, 2007; Kothe, 2007; Anell et al., 2012).
The Middle Miocene hiatus is characterised by sediment star-vation and/or condensation, and might have resulted from
a relative sea-level rise, either eustatic or in combinationwith tectonic subsidence (Gramann & Kockel, 1988; Cameronet al., 1993; Anell et al., 2012). In the study area the ageof the Middle Miocene unconformity is dated to 13.2–14.8 Ma(Kothe et al., 2008). The overlying fine-grained, glauconite-rich
3

Netherlands Journal of Geosciences — Geologie en Mijnbouw
Middle Miocene shelf deposits are characterised by an overallfining-upward trend (Gramann & Daniels, 1988; Gramann, 1989;Overeem et al., 2001; Kuster, 2005).
The Middle Miocene climatic optimum corresponds to a sea-level highstand, which was followed by a climatic cooling andan associated sea-level fall during the late Middle Miocene (Haqet al., 1987; Jurgens, 1996; Zachos et al., 2001; Kuster, 2005;Miller et al., 2005). In the study area, Late Miocene depositsconsist of shelf and storm-dominated shoreface deposits withan overall coarsening-upward trend (Gramann & Kockel, 1988;Gramann, 1988, 1989; Kuster, 2005) and K–Ar apparent agesranging between 9.5 and 11 Ma (Odin & Kreuzer, 1988).
The Pliocene was characterised by several cycles of trans-gression and regression, resulting in the formation of uncon-formities, which can be traced in most areas of the North SeaBasin (Mangerud et al., 1996; Konradi, 2005; Kuhlmann & Wong,2008; Thole et al., 2014).
Pleistocene deposits
The Early Pleistocene was characterised by marine to fluvio-deltaic sedimentation in the study area (Gibbard, 1988;Kuhlmann et al., 2004; Streif, 2004). Subsequently, the MiddlePleistocene (MIS 12 to MIS 6) Elsterian and Saalian ice sheetscompletely covered the study area (Fig. 1A); the Late Pleis-tocene Weichselian glaciation did not reach the study area (e.g.Caspers et al., 1995; Streif, 2004; Ehlers et al., 2011; Roskoschet al., 2014).
During the Elsterian glaciation, deep tunnel valleys weresubglacially incised into the Neogene and Pleistocene depositsof northern Central Europe (Huuse & Lykke-Andersen, 2000;Lutz et al., 2009; Stackebrandt, 2009; Lang et al., 2012; van derVegt et al., 2012; Janszen et al., 2012, 2013). In this period, the0.8–2 km wide and up to 350 m deep Cuxhaven tunnel valleyformed (Kuster & Meyer, 1979; Ortlam, 2001; Wiederhold et al.,2005a; Rumpel et al., 2009). The valley is filled with Elsterianmeltwater deposits and till (Gabriel, 2006; Rumpel et al., 2009),overlain by the Late Elsterian glaciolacustrine Lauenburg ClayComplex and marine Holsteinian interglacial deposits, whichconsist of interbedded sand and clay (Kuster & Meyer, 1979,1995; Linke, 1993; Knudsen, 1988, 1993a,b; Muller & Hofle,1994; Litt et al., 2007). 2D resistivity sections based on AEMsurveys indicate that depositional units of the valley fill canvary in thickness over a short distance (Siemon et al., 2002;Gabriel et al., 2003; Siemon, 2005; Rumpel et al., 2009; Steueret al., 2009; BurVal Working Group, 2009). The Elsterian andinterglacial Holsteinian deposits of the tunnel-valley fill andthe adjacent Neogene host sediments are overlain by Saaliansandy meltwater deposits and till (Kuster & Meyer, 1979; Ehlers,2011). The morphology of the study area is characterised by anup to 30 m high Saalian terminal moraine complex, the HoheLieth ridge (Fig. 1B; Ehlers et al., 1984). Eemian tidal salt marshdeposits together with Holocene fluvial deposits, peats and soils
characterise the lowland on both sides of the Hohe Lieth ridge(Fig. 1B; Hofle et al., 1985; Binot & Wonik, 2005; Panteleit &Hammerich, 2005; Siemon, 2005).
Database
The database includes 488 borehole logs, three 2D reflectionseismic sections and two AEM surveys, comprising both HFEMand HTEM data (Fig. 1C and D). Most of the data sets were ac-quired between 2000 and 2005 by the BurVal project (Blindow &Balke, 2005; Wiederhold et al., 2005a,b; BurVal Working Group,2009; Tezkan et al., 2009).
Borehole data and geological depth maps
ParadigmTM GOCAD R© software (Paradigm, 2011) was used toconstruct an initial 3D geological subsurface model from aDigital Elevation Model (DEM) with a resolution of 50 m andpublished depth maps of the Cenozoic succession (Baldschuhnet al., 1996; Rumpel et al., 2009; Hese, 2012). Lithology logsof 488 boreholes were used to analyse the subsurface architec-ture of the Cenozoic deposits and to define major geologicalunits. The commercial software package GeODin R© (Fugro Con-sult GmbH, 2012) was used for the data management.
Borehole location data were corrected for georeferencing er-rors. The interpretation of the tunnel-valley fill is based onfive borehole logs penetrating all five lithologic facies units(Fig. 1C). A resistivity log was only available for borehole Hl9Wanhoeden located in the centre of our test site, penetratingthe Cuxhaven tunnel valley (Fig. 1C).
Seismic sections
The seismic surveys were acquired by the Leibniz Institute forApplied Geophysics Hannover (LIAG, formerly the GGA Insti-tute) in 2002 and 2005. The three 2D reflection seismic sectionswere used to map the large-scale subsurface architecture of thestudy area (black lines in Fig. 1C). The 2D reflection seismicsections include a 6 km long WNW–ESE oriented seismic line S1and a 2.4 km long W–E trending seismic line S2 that is located1 km further to the south (Fig. 1C). Seismic line S2 intersectswith the 0.4 km long, N–S trending seismic line S3. The sur-vey design and the processing of the seismic sections, lines S1(Wanhoeden), S2 (Midlum 3) and S3 (Midlum 5), are describedby Gabriel et al. (2003), Wiederhold et al. (2005b) and Rumpelet al. (2006a,b; 2009).
Data processing was carried out using ProMax R© Landmarksoftware. Processing followed the workflow for vibroseis datadescribed by Yilmaz (2001). The seismic vibrator operated witha sweep ranging from 50 to 200 Hz. The survey design led toa maximum target depth of 1600 m with a common-midpointspacing of 5 m for seismic line S1 and 2.5 m for seismic lines
4

Netherlands Journal of Geosciences — Geologie en Mijnbouw
S2 and S3. Assuming a velocity of 1600 m/s and a maximumfrequency of about 150 Hz, wavelengths of about 10 m are ex-pected and thus the minimum vertical resolution should be inthe range of a quarter of a wavelength but at least about 4 m forthe shallow subsurface. Increasing velocity and decreasing fre-quency with depth leads to a decrease in resolution with depth(wavelength of about 22 m in 1000 m depth). For migration aswell as for depth conversion a simple smooth velocity functionis used with a start velocity of 1500 m/s increasing to about2200 m/s at 1000 m depth.
Acquisition, processing and visualisation of AEMdata
Frequency-domain helicopter-borne electromagnetics The HFEMsurvey covering the entire study area (Fig. 1D) was conductedby the Federal Institute for Geosciences and Natural Resources(BGR) in 2000. The survey grid consisted of parallel WNW–ESEflight lines with an average NNE–SSW spacing of 250 m, con-nected by tie lines perpendicular to the flight lines with a WNW–ESE spacing of 1000 m (grey lines in Fig. 1D). The distancebetween consecutive values was 3–4 m, assuming an averageflight velocity of about 140 km/h during the survey (Siemonet al., 2004). The HFEM system comprised a five-frequency de-vice (Siemon et al., 2002). The transmitter/receiver coil con-figuration was horizontal co-planar for all frequencies. Thetransmitter coils operated at frequencies of 0.4 kHz, 1.8 kHz,8.6 kHz, 41.3 kHz and 192.6 kHz (Siemon et al., 2004). Themaximum penetration depth was about 150 m, depending onthe subsurface resistivity distribution. The sampling rate was0.1 s and the signal was split into its in-phase I and out-of-phase Q components relative to the transmitter signal. Becauseof the relatively small system footprint (about 100–150 m), i.e.the lateral extent of the main inductive response beneath thesystem, the data set is characterised by a rather high spatialresolution, which decreases with depth (Siemon et al., 2004).The inversion of HFEM data to resistivity and depth values fol-lowed the workflow developed in Sengpiel & Siemon (2000) andSiemon (2001). It depended on an initially unknown subsurfaceresistivity distribution. Initially the resistivity was calculatedbased on a half-space model (Fraser, 1978). If the resistivityvaries with depth, the uniform half-space model will yield dif-ferent ‘apparent resistivity’ and ‘apparent distance’ values ateach HFEM frequency (Siemon, 2001). The centroid depth isa measure for the penetration of the electromagnetic fieldsand represents the centre of the half-space. This depth valuedepends on the individual HFEM frequencies and on the resis-tivity distribution in the subsurface: the higher the ratio ofresistivity and frequency, the greater the centroid depth. Theapparent resistivity and centroid depth data pairs were usedto determine a set of sounding curves at each data point. Theapparent resistivity vs centroid depth-sounding curves are asmooth approximation of the vertical resistivity distribution
and were also used to define an individual six-layer startingmodel at each data point for an iterative Marquardt–Levenberginversion. The model parameters were modified until a satisfac-tory fit between the survey data and the calculated field datafrom the inversion model was achieved (Sengpiel & Siemon,2000; Siemon et al., 2009a,b). Based on the low number ofinput parameters available (two per frequency), which can beresolved by 1D inversion, the number of individual model lay-ers is limited. The 1D HFEM inversion results were extracted asa set of data points (reduced to approximately one soundingor 1D model every 7 m along the flight lines). The apparentresistivities are displayed separately at each frequency.
Time-domain helicopter-borne electromagnetics An HTEM surveywas conducted by the University of Aarhus (BurVal WorkingGroup, 2009; Rumpel et al., 2009) on behalf of the LeibnizInstitute for Applied Geophysics (LIAG, formerly the GGA Insti-tute). The HTEM soundings are restricted to an area of about3.96 km by 2.8 km (grey dots in Fig. 1D). The HTEM system op-erated with a transmitter loop on a six-sided frame (Sørensen& Auken, 2004). In the Cuxhaven survey, the distance betweenconsecutive soundings was about 75 m, assuming an averageflight velocity of 18 km/h during the survey (Fig. 1D).
The system operated with low and high transmitter mo-ments. A low transmitter moment of approximately 9000 Am2
was generated by a current of 40 A in one measurement cycle.The received voltage data were recorded in the time intervalsbetween 17 and 1400 μs. A current of 40–50 A in four loopturns generated a high moment of approximately 47,000 Am2.The voltage data of high moment measurements were recordedin the time interval of 150–3000 μs. Acquisition for both thelow and high transmitting moments were carried out in cy-cles for the four data sets (320 stacks per data set for lowand 192 stacks per data set for high moment measurement).Subsequently, the arithmetic mean values of the low and highmoments were averaged for each of the data sets to generateone data set. This merged data set was interpreted as one geo-physical model. The resolution of the uppermost part of thesubsurface is limited by the recording lag time of the HTEMsystem, which does not start until about 17 μs, and stronglydepends on the near surface conductivity and thus on lithologyand the pore water content (Steuer et al., 2009). This resultsin near-surface layers being commonly merged into one layerin the model.
The maximum penetration depth is about 250 m and dependson the subsurface resistivity. Because the method cannot re-solve thin depositional units (<5 m), individual depositionalunits may be merged into thicker model layers. With increasingdepth the resolution decreases, thus restricting the vertical res-olution to approximately 15–20 m in the shallow subsurface anddecreasing to 20–50 m at 100 m depth. The horizontal resolu-tion capability also decreases with depth. At about 25 m depth,the diameter of the footprint from which data are obtained is
5

Netherlands Journal of Geosciences — Geologie en Mijnbouw
Fig. 2. Workflow.
about 75–100 m and it exceeds 300–400 m at 100 m depth (West& Macnae, 1991; Jørgensen et al., 2005, 2013). Small-scale spa-tial variations in geology are therefore less well resolved atdeeper levels than at shallower levels (Newman et al., 1986).
Aarhus Workbench software was used to process the HTEMdata (Steuer, 2008; Steuer et al., 2009). This software inte-grates all steps in the processing workflow from managementof the raw data to the final visualisation of the inversion re-sults. The software provides different filtering and averagingtools, including the correction of GPS signal, tilt and altitudevalues. HTEM data were inverted with a five-layer model us-ing a spatially constrained inversion (SCI) option of em1dinv(Steuer, 2008; Viezzoli et al., 2008; Steuer et al., 2009; HGG,2011). SCI takes many adjacent data sets into account, whichare connected by distant dependent lateral constraints to im-pose continuity in areas with sparser data coverage. The lateralconstraints were defined by the expected geological continu-ity of each layer. The inversion results strongly depended onthe starting model used and the SCI settings, especially thestrength of constraints.
The 1D HTEM inversion results were extracted as a set ofmodels, which were characterised by a limited spatial resolutiondue to the large distance between soundings and the relativelylarge lateral extent of the main inductive response beneath thesystem.
Methodology of combined geological andgeophysical analysis
To improve the interpretation of the subsurface architecturewe developed a workflow in which the interpretation re-sults of borehole lithology logs, 2D reflection seismic sectionsand 3D resistivity grids based on 1D AEM inversion resultswere integrated (Figs 2 and 3). In order to achieve this we
used ParadigmTM GOCAD R© software for 3D subsurface modelling(Paradigm, 2011).
Construction of an initial 3D geological subsurfacemodel based on the interpretation of borehole andseismic data
In the first step a basic subsurface model of the Cuxhaventunnel valley and its Neogene host sediments was constructedby integrating borehole lithology logs and 2D reflection seis-mic sections (Tables 1 and 2; Figs 3A and 4–7). For the anal-ysis of seismic sections we used the scheme of Mitchum et al.(1977). Each seismic unit is defined by the external geometry,the internal reflector configuration and seismic facies param-eters, such as amplitude, continuity and density of reflectors(Tables 1 and 2; Figs 4 and 5). The 2D seismic interpretationresults combined with borehole lithology analysis defined 15stratigraphic marker horizons, which represent the tops of eachdepositional unit (Tables 1 and 2).
In GOCAD we applied a discrete modelling approach thatcreates triangulated surfaces from points, lines, and open andclosed curves (Mallet, 2002). With the Discrete Smooth Inter-polation (DSI) algorithm the roughness of the triangulated sur-faces was minimised (Mallet, 2002). The 3D subsurface modelconsists of a series of triangulated surfaces representing thebounding surfaces of the depositional units (cf. Tables 1 and 2;Fig. 3).
Construction of 3D resistivity grids based on AEMdata
The best technique to transform subsurface resistivity data froma set of 1D vertical inversion models into a 3D model is 3Dinterpolation. The applied 3D interpolation algorithm requiresdiscrete data in all directions, discarding the layered approachused in the inversion, and leads to a smoothing effect betweenpreviously defined layer boundaries of 1D AEM inversion.
In the first step, the 1D AEM inversion models were im-ported into the GOCAD modelling software (Fig. 3B). Subse-quently, each AEM data set was transformed in a regular spacedvoxel grid with rectangular hexahedral cells.
The large differences in AEM data distribution and penetra-tion depths required the construction of two independent gridmodels with different resolutions. For the data set of 1D HFEMinversion results we choose a grid with horizontal and verticalcell sizes of 10 m and 1 m, respectively, which provides a goodcompromise between data resolution and model handling. Forthe data set of 1D HTEM inversion results an enlarged grid withhorizontal and vertical cell sizes of 20 m and 2.5 m, respec-tively, provides the best results.
The arithmetic mean was used to transform and estimatethe resistivity value of a cell based on each 1D AEM inversionmodel. The estimation of resistivity at unsampled locations to
6

Netherlands Journal of Geosciences — Geologie en Mijnbouw
Fig. 3. Workflow of the construction of combined geological/geophysical subsurface models, illustrated by HFEM data. (A) Construction of the 3D geo-
logical subsurface model based on borehole and seismic data. (B) Construction of a continuous 3D resistivity voxel grid based on 1D HFEM inversion
results. The resistivity data were integrated into a regular structured grid, analysed by means of geostatistical methods and subsequently interpolated.
(C) The selection of specific resistivity ranges provides a first estimate of the large-scale depositional architecture. Shown is the clay distribution in the study
area, indicated by HFEM resistivity values between 3 and 25 Ωm. (D) Adjustment of the 3D geological subsurface model by integrating information of the
3D resistivity grid.
get a continuous 3D resistivity grid model of the subsurfacewas achieved by the ordinary kriging method (Krige, 1951). A1D vertical analysis combined with a 2D horizontal analysis ofthe 1D AEM inversion models was carried out since sedimentarysuccessions tend to be more variable in the vertical than in thehorizontal direction and this often results in zonal anisotropy.Kriging uses semivariogram models to infer the weighting givento each data point and therefore takes both distance and di-rection into account. Variography was performed in differentdirections (azimuths of 0°, 45°, 90° and 135°) with a toleranceof 22.5° and an adjusted bandwidth to survey the resistivityisotropy in each resistivity model (Fig. 8). For each AEM dataset, best results in block weighting were obtained by using anexponential function. The analysis of HFEM data results in avertical range of 25 m and a horizontal major principal axis
with an angle of 19° and a range of 1000 m, and a perpendic-ular minor principal axes with a range of 780 m (Fig. 8). Theanalysis of HTEM data results in a vertical range of 50 m anda horizontal major principal axes with an angle of 130° and arange of 1500 m, and a perpendicular minor principal axes witha range of 1300 m (Fig. 8). The 3D interpolation results for eachvoxel over the whole study area in an estimated value for theresistivity.
Uncertainties of 3D resistivity grid modelling
1) Data processing of vintage 1D AEM inversion models didnot focus on the elimination of anthropogenic effects (suchas the airport Cuxhaven/Nordholz in the northwest of thestudy area). Hence, the processed AEM databases contained
7

Netherlands Journal of Geosciences — Geologie en Mijnbouw
Table 1. Seismic and sedimentary facies of the Oligocene and Neogene marine to marginal marine deposits
Seismic pattern
Sedimentary facies
Interpretation Seismic
unit
Thick-ness(m)
ρ (Ωm)
B + S AEM Lith.
Pliocene
Hummocky, high-amplitude reflectors
and sub-parallel, partly
hummocky and U-shaped, low-amplitude and
transparent reflectors
Fine sand and silt
Estuarine deposits (Gramann, 1989;
Kuster, 2005) of an incised valley
U4 30–120 99 97 100
Mio
cene
L
ate
Mess. Sub-parallel, partly hummocky, low-
amplitude reflectors
Fine sand
Open shelf to storm-dominated deposits
of the upper and lower shoreface (Gramann, 1989; Rasmussen et al.,
2010; Rasmussen & Dybkjær, 2013)
U3
15–40 88 90 100
Tort.
Continuous, sub-parallel, partly
hummocky, high-amplitude reflectors
Clay and silt coarsening
upwards into fine sand
30–85 73 75 40
Mid
dle Serra.
Continuous, parallel, partly hummocky,
high-amplitude reflectors
Glauconitic clay and silt
Transgressive shelf deposits
(Gramann, 1989; Kuster, 2005; Köthe, 2008; Rasmussen
et al., 2010)
U2 10–70 – – –
Lang. Continuous, sub-horizontal, parallel, partly hummocky,
high-amplitude reflectors
Glauconitic clay, silt and fine sand
Marine outer shelf deposits
(Gramann, 1989; Overeem et al.,
2001; Kuster, 2005)
U1 10–85 – – –
Ear
ly Burg.
Aquit.
Oligocene
Continuous, sub-horizontal, high-
amplitude reflectors and discontinuous,
partly inclined, low-amplitude reflectors,
partly transparent
Clay, silt and fine sand
Marine deposits (Gramann, 1989; Kuster,
2005) U0 ~220 – – –
Median resistivity values are extracted from the HFEM grid model and are related to the 3D geological subsurface model based on borehole andseismic data (B + S), the adjusted 3D geological subsurface model derived from the 3D AEM resistivity grids (AEM) and the adjusted 3D geologicalsubsurface model with manually adjusted resistivity values based on lithology log information (Lith.).
erroneous data from anthropogenic noise (Siemon et al.,2011).
2) 1D AEM inversion models are always simplified realisationsof the subsurface resistivity distribution, particularly if onlymodels with few layers are used to explain the AEM data.As AEM resolution capability decreases with depth, the
layer thicknesses generally increase with depth, which corre-sponds to the probability that several thin layers of variousdepositional units may be merged to a thicker resistivitylayer.
3) Uncertainties may originate from the interpolation method(Pryet et al., 2011). We focused on uncertainties caused by
8

Netherlands Journal of Geosciences — Geologie en Mijnbouw
Table 2. Seismic and sedimentary facies of the Pleistocene deposits
Seismic pattern
Sedimentary
facies Interpretation
Seismicunit
Thick-ness (m)
ρ (Ωm)
B + S AEM Lith.
Holocene
Thickness is below the seismic resolution Fine sand and
peat, contain clay and silt
Salt marsh deposits (Höfle et al., 1985;
Knudsen, 1988; Gabriel, 2006)
up to 9 64 64 60
Ple
isto
cene
L
ate Wei.
Eem.
Mid
dle
Saal
ian
Dre
nthe
Hummocky, low- to high-amplitude
reflectors passing laterally into continuous,
horizontal-parallel or parallel-inclined
reflectors
Fine to coarse sand
and diamicton
Diamicton, glaciofluvial and terminal moraine
deposits (Ehlers, 2011)
U5.8 sat.
unsat.
10–50
128
138 480
140 500
Hol
stei
nian
Discontinuous, hummocky to
inclined-parallel, high- to medium-
amplitude reflectors
Clay, silt and fine
sand with shells
Marine to marginal marine deposits
(Kuster & Meyer, 1979; Knudsen, 1988)
U5.7 U5.7*
6–45
24 69
32
30
Els
teri
an
Horizontal-parallel reflectors passing
laterally into discontinuous,
hummocky high- to medium-amplitude
reflectors
Clay and silt with some fine
sand
Glaciolacustrine deposits of the Upper Lauenburg
Clay Complex (Kuster & Meyer, 1979)
U5.6 U5.6*
10–45
16
14 52
10 10
Continuous to discontinuous,
hummocky, parallel, medium- to high-
amplitude reflectors
Fine to medium sand, silty
Glaciolacustrine deposits of the
Lower Lauenburg Clay Complex
(Kuster & Meyer, 1979)
U5.5 U5.5*
20–35
29 100
25 91
25 70
Discontinuous, hummocky, low- to
high-amplitude reflectors
Fine to medium sand, delta
deposit
Glaciolacustrine deposits of the
Lower Lauenburg Clay Complex
(Kuster & Meyer, 1979; Ortlam, 2001)
U5.4 up to 50 33 34 150
Discontinuous, parallel, hummocky,
medium- to low-amplitude reflectors,
partly transparent
Clay and silt
Glaciolacustrine deposits of the
Lower Lauenburg Clay Complex
(Kuster & Meyer, 1979)
U5.3 up to 55 31 27 15
Parallel-inclined, hummocky,
subhorizontal, low- to high-amplitude
reflectors
Fine sand fining upwards to silty
clay
Fine-grained glaciofluvial
deposits (Kuster & Meyer,
1979)
U5.2 U5.2*
25–65
38 66
35 58
35 35
Discontinuous, partly inclined and
hummocky, high- to medium-amplitude
reflectors
Coarse sand and gravel fining upwards into medium sand
Coarse-grained glaciofluvial
deposits, basal tunnel-valley fill (Kuster & Meyer,
1979)
U5.1 70–160 41 33 120
Thickness is below the seismic resolution Fine to medium
sand, silt, pebbles
Proglacial meltwater deposits
up to 10 67 66 70
Median resistivity values are extracted from the HFEM grid model and are related to the 3D geological subsurface model based onborehole and seismic data (B + S), the adjusted 3D geological subsurface model derived from the 3D AEM resistivity grids (AEM)and the adjusted 3D geological subsurface model with manually adjusted resistivity values based on lithology log information(Lith.). Seismic subunits U5.1–U5.8 refer to the Cuxhaven tunnel-valley fill. Values marked with ∗ refer to the small-scale tunnelvalley east of the Cuxhaven tunnel valley.
9

Netherlands
Journalof
Geosciences
—G
eologieen
Mijn
bouw
Fig. 4. 2D reflection seismic section S1 combined with airborne electromagnetic data. (A) 2D reflection seismic section S1. (B) Interpreted seismic section S1 with borehole logs. Seismic units are described in Tables 1
and 2. (C) 2D reflection seismic section S1 combined with resistivity data, extracted from the 3D HFEM resistivity grid. The dashed line indicates the groundwater table. (D) 2D reflection seismic section S1 combined
with resistivity data, extracted from the 3D HTEM resistivity grid. For location see Fig. 1C and D.
10

Netherlands Journal of Geosciences — Geologie en Mijnbouw
Fig. 5. 2D reflection seismic sections S2 and S3 combined with airborne electromagnetic data. (A) 2D reflection seismic sections S2 and S3. (B) Interpreted
seismic sections S2 and S3 with borehole logs. Seismic units are described in Tables 1 and 2. (C) 2D reflection seismic sections S2 and S3 combined with
resistivity data, extracted from the 3D HFEM resistivity grid. The dashed line indicates the groundwater table. (D) 2D reflection seismic sections S2 and S3
combined with resistivity data, extracted from the 3D HTEM resistivity grid. For location see Fig. 1C and D.
11

Netherlands Journal of Geosciences — Geologie en Mijnbouw
Fig. 6. 2D cross-section of the study area (A–B in Fig. 1C and D), showing major bounding surfaces and resistivity values based on borehole, seismic and
AEM data. The dashed line indicates the groundwater table. (A) 2D cross-section extracted from the 3D geological model based on borehole and seismic data.
Only the Pleistocene deposits are shown in colour. (B) 2D cross-section extracted from the adjusted 3D geological model and the corresponding resistivities
derived from the 3D HFEM voxel grid. (C) 2D cross-section extracted from the adjusted 3D geological model and the corresponding resistivities derived from
the 3D HTEM voxel grid. (D) 2D cross-section extracted from the adjusted 3D geological model. Only the Pleistocene deposits are shown in colour.
12

Netherlands Journal of Geosciences — Geologie en Mijnbouw
Fig. 7. 2D cross-section of the study area (C–D in Fig. 1C and D), showing major bounding surfaces and resistivity values based on borehole, seismic and
AEM data. The dashed line indicates the groundwater table. (A) 2D cross-section extracted from the 3D geological model based on borehole and seismic data.
Only the Pleistocene deposits are shown in colour. (B) 2D cross-section extracted from the adjusted 3D geological model and the corresponding resistivities
derived from the 3D HFEM voxel grid. (C) 2D cross-section extracted from the adjusted 3D geological model and the corresponding resistivities derived from
the 3D HTEM voxel grid. (D) 2D cross-section extracted from the adjusted 3D geological model. Only the Pleistocene deposits are shown in colour.
13

Netherlands Journal of Geosciences — Geologie en Mijnbouw
the kriging interpolation method of the 1D AEM inversionresults. A geostatistical uncertainty estimate is provided bythe kriging variance σ 2
KRI (x, y, z), which depends on thespatial variability of the parameter and the distance to indi-vidual data points. This leads to the construction of a 3D gridthat contains both resistivity values and their uncertainties(Pryet et al., 2011). Once the model is built, the analysis ofuncertainties between data points (i.e. between flight lines)is expressed by the standard deviation σ KRI (Fig. 9). Thestandard deviation can be used to evaluate the credibility ofthe interpolated data and to eventually exclude soundingsor groups of soundings with high uncertainty and insteademphasise high-quality soundings. A value close to zero in-dicates high probability and a value close to one indicateslow probability of resistivity values. This information can beused to evaluate the relationship between borehole lithologyand 3D resistivity data and hence to quantify uncertaintiesin the depositional architecture.
Relationship between lithology and resistivity
Borehole lithology and AEM resistivity were linked with the aimof using resistivity as a proxy for lithology (see: Bosch et al.,2009; Burschil et al., 2012b). The resistivity log from boreholeHl9 (Fig. 10) and sediment descriptions from 487 borehole logs(Fig. 1C) were used to combine these parameters (Fig. 11).
The electrical resistivity of sediments is mainly controlled bythe presence of clay minerals, the degree of water saturationand the pore water ion content. According to Archie (1942),resistivity for clay-free sediments is inversely proportional tothe pore water ion content. If the specific pore water ion con-tent is known throughout the different geological layers andstructures, estimates in lithology variations related to the claycontent and type can be obtained. Because saline groundwateris absent in the study area, at least at depths resolved by HFEM(Siemon, 2005), resistivity changes are related to changes inlithology.
The lithologies were divided into seven grain-size classesbased on the borehole descriptions. In accordance with dataresolution, we determined the representative lithology in eachborehole and extracted the corresponding interpolated resistiv-ity at this location from the 3D resistivity grids based on the twodifferent AEM data sets. We accept in this step that the lithol-ogy logs within the study area have varying resolutions rangingfrom 1 cm to 1 m, depending on the drilling method and datacollection. This may lead to a discrepancy between the lithologylog and the vertical resolution of the 3D AEM resistivity grids,resulting in insufficient resistivity–grain size relationships. Toreduce the uncertainty between the lithology logs and resistiv-ity grid we analysed all logs and calculated mean and medianresistivity values for each class that allowed derivation of grainsize from resistivity (Fig. 11). Grouping the data into resistivityclasses and counting the number of occurrences of each lithol-
Fig. 8. Experimental vertical and horizontal semivariograms derived from
the 1D HFEM and HTEM inversion results of the study area. Variography
was performed in different directions (azimuths of 0°, 45°, 90° and 135°)
with a tolerance of 22.5°. The manually fitted exponential models are also
indicated.
14
Netherlands Journal of Geosciences — Geologie en Mijnbouw
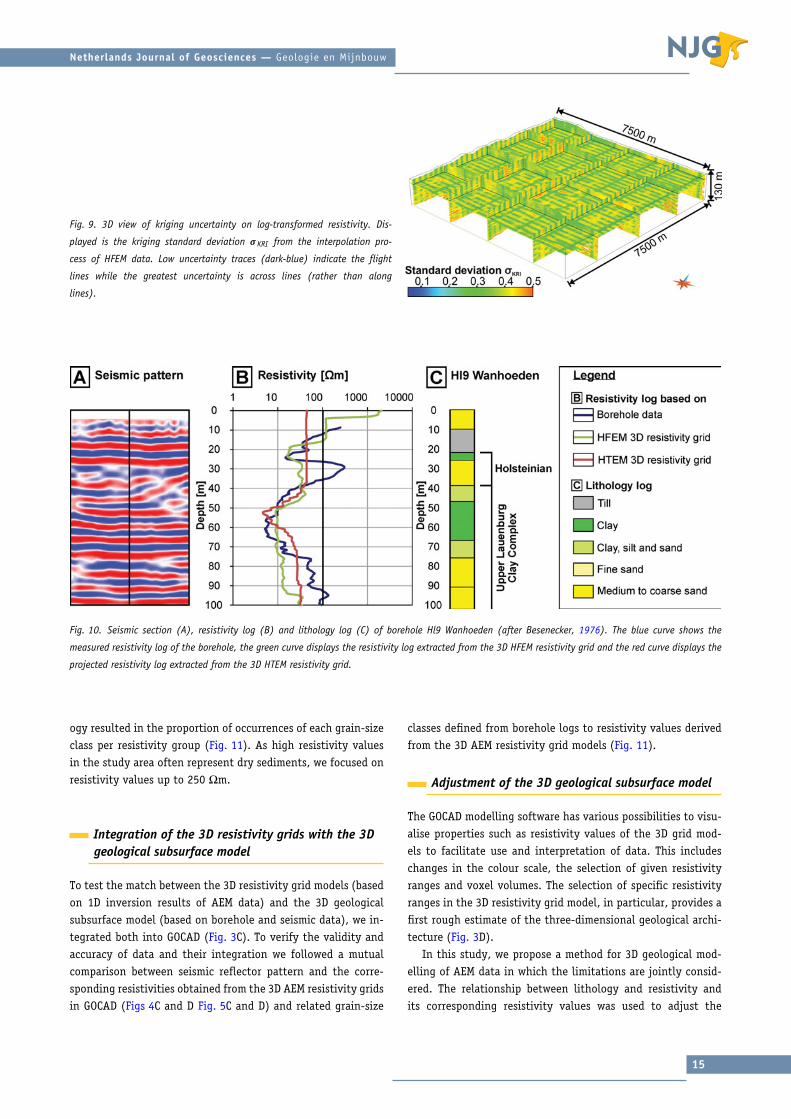
Fig. 9. 3D view of kriging uncertainty on log-transformed resistivity. Dis-
played is the kriging standard deviation σ KRI from the interpolation pro-
cess of HFEM data. Low uncertainty traces (dark-blue) indicate the flight
lines while the greatest uncertainty is across lines (rather than along
lines).
Fig. 10. Seismic section (A), resistivity log (B) and lithology log (C) of borehole Hl9 Wanhoeden (after Besenecker, 1976). The blue curve shows the
measured resistivity log of the borehole, the green curve displays the resistivity log extracted from the 3D HFEM resistivity grid and the red curve displays the
projected resistivity log extracted from the 3D HTEM resistivity grid.
ogy resulted in the proportion of occurrences of each grain-sizeclass per resistivity group (Fig. 11). As high resistivity valuesin the study area often represent dry sediments, we focused onresistivity values up to 250 Ωm.
Integration of the 3D resistivity grids with the 3Dgeological subsurface model
To test the match between the 3D resistivity grid models (basedon 1D inversion results of AEM data) and the 3D geologicalsubsurface model (based on borehole and seismic data), we in-tegrated both into GOCAD (Fig. 3C). To verify the validity andaccuracy of data and their integration we followed a mutualcomparison between seismic reflector pattern and the corre-sponding resistivities obtained from the 3D AEM resistivity gridsin GOCAD (Figs 4C and D Fig. 5C and D) and related grain-size
classes defined from borehole logs to resistivity values derivedfrom the 3D AEM resistivity grid models (Fig. 11).
Adjustment of the 3D geological subsurface model
The GOCAD modelling software has various possibilities to visu-alise properties such as resistivity values of the 3D grid mod-els to facilitate use and interpretation of data. This includeschanges in the colour scale, the selection of given resistivityranges and voxel volumes. The selection of specific resistivityranges in the 3D resistivity grid model, in particular, provides afirst rough estimate of the three-dimensional geological archi-tecture (Fig. 3D).
In this study, we propose a method for 3D geological mod-elling of AEM data in which the limitations are jointly consid-ered. The relationship between lithology and resistivity andits corresponding resistivity values was used to adjust the
15

Netherlands Journal of Geosciences — Geologie en Mijnbouw
Fig. 11. Grain-size classes and related resistivity histograms extracted from the interpolated 3D HFEM and HTEM resistivity grid. A. Grain-size classes
and related resistivity extracted from the interpolated 3D HFEM and HTEM resistivity grid. Shown are mean values, standard deviation, median values
and number of counts for common resistivity (logarithmic values). B. Histogram showing resistivity classes of HFEM and HTEM data for each grain-
size class as stacked bars (linear scale). C. Histogram showing resistivity classes of HFEM and HTEM data for each grain-size class as stacked bars
(logarithmic scale). The absence of resistivity values lower than 1 log10 Ωm indicates that the influence of anthropogenic noise and saltwater can be
excluded.
bounding surfaces of the geological framework model. Afteradjusting the geologic framework the updated 3D geologicalsubsurface models were combined with the 3D HFEM voxel grid.Voxel grids can hold an unlimited number of attributes anddifferent parameters can be added to the grid structure as at-tributes such as lithology, facies or model uncertainty. Thehigh resolution of the regular voxel model allows the subsur-face structure to be maintained. The result is a more reliable re-construction of the shallow subsurface architecture (Figs 4–7).Nevertheless, internal lithology variations as identified on seis-
mic sections and the heterogeneity of sediments represented byoverlapping resistivity ranges often leads to ambiguous litho-logical interpretation.
Verification of the 3D geological subsurface modelsby means of HFEM forward modelling
We compared the apparent resistivity values at each frequencyof the HFEM survey (Fig. 12A) with the apparent resistivityvalues derived from the initial 3D geological subsurface model
16

Netherlands Journal of Geosciences — Geologie en Mijnbouw
Fig. 12. Apparent resistivity images at different frequencies, corresponding to centroid depths, which increase from left to right. A. Apparent resistiv-
ity images of measured HFEM data. B. Apparent resistivity images extracted from the 3D geological subsurface model based on borehole and seismic
data. C. Apparent resistivity images extracted from the adjusted 3D geological subsurface model derived from AEM data. D. Apparent resistivity images
extracted from the adjusted 3D geological subsurface model derived from AEM data with manually adjusted resistivity values based on lithology log
information.
17

Netherlands Journal of Geosciences — Geologie en Mijnbouw
based on borehole and seismic data (Fig. 12B) and the adjusted3D geological subsurface model derived from the 3D AEM resis-tivity grids (Fig. 12C). This allowed identification of differencesand uncertainties in each data set.
At each HFEM data point the thickness and median resis-tivity value of each geological unit derived from the different3D geological subsurface models (Tables 1 and 2) were used tocreate a 1D resistivity model. For all 1D models, synthetic HFEMdata were derived and transformed to apparent resistivity val-ues at each HFEM frequency (Siemon, 2001). To verify the HFEMdata, apparent resistivities were used to compare the measuredand modelled HFEM data for two reasons: (1) the apparent re-sistivities are almost always independent of altitude variationsof the HFEM system (Siemon et al., 2009a) and (2) they rep-resent an approximation to the true resistivity distribution inthe subsurface. The corresponding depth levels, however, varyas the centroid depth values depend on the penetration depthof the electromagnetic fields.
Results
The depositional architecture of the Cuxhaventunnel valley and its Neogene host sedimentsdefined by seismic and borehole data analysis
Neogene marine and marginal marine deposits The Neogene suc-cession is 360 m thick and unconformably overlies open marineto paralic Oligocene deposits (Kuster, 2005). On the basis of pre-vious investigations of the Neogene sedimentary successions(Gramann & Daniels, 1988; Odin & Kreuzer, 1988; Gramann,1988, 1989; Overeem et al., 2001; Kuster, 2005; Kothe et al.,2008; Rumpel et al., 2009) four seismic units were mappedwithin the Neogene deposits, each bounded at the base by anunconformity. These seismic units can be correlated to seismicunits in the North Sea Basin (Michelsen et al., 1998; Mølleret al., 2009; Anell et al., 2012). The main characteristics ofseismic units, including seismic facies, sedimentary facies andmean resistivity values are summarised in Table 1. The over-all thickening observed in the westward dip direction of theseismic units is interpreted as an effect of the salt rim syn-cline subsidence creating accommodation space (cf. Maystrenkoet al., 2005a,b; Grassmann et al., 2005; Brandes et al., 2012).The deposits consist of fine-grained shelf to marginal marinesediments.
At the end of the Miocene an incised valley formed thatwas subsequently filled with Pliocene delta deposits, probablyindicating a palaeo-course of the River Weser or Elbe (Figs 4,5 and 6). This is confirmed by the sub-parallel pattern of thelower valley fill onlapping reflector terminations onto the trun-cation surface observed in seismic lines S1 and S2. This is inter-preted as transgressive backstepping (seismic lines S1 and S2;Table 1; Figs 4A and B, and 5A and B; Dalrymple et al., 1992).
The upper part of the incised-valley fill is characterised in theseismic by mound- and small-scale U-shaped elements, whichare interpreted as prograding delta lobes (seismic lines S1 andS2; Figs 4A and B, and 5A and B).
Pleistocene and Holocene deposits Pleistocene deposits uncon-formably overly the marginal-marine Neogene sediments andare separated at the base by an erosional surface characterisedby two steep-walled tunnel valleys passing laterally into sub-horizontal surfaces (Fig. 4A and B). The large tunnel valley isup to 350 m deep and 2 km wide (seismic line S1 and S2,Figs 4A and B, and 5A and B) and has previously been de-scribed by Kuster & Meyer (1979), Siemon et al. (2002, 2004),Gabriel et al. (2003), Siemon (2005), Wiederhold et al. (2005a),Gabriel (2006), Rumpel et al. (2009) and BurVal Working Group(2009). The smaller tunnel valley in the east is up to 200 mdeep and 1 km wide (seismic line S1, Fig. 4A and B). In to-tal, eight seismic subunits were mapped within these tunnelvalleys and the marginal areas (U5.1–U5.8; cf. Table 2; Figs 4Band 5B). The main characteristics of seismic subunits, includingseismic facies, sedimentary facies and mean resistivity values,are summarised in Table 2.
The dimension, geometry, internal reflector pattern and sed-imentary fill of the troughs correspond well to Pleistocenetunnel-valley systems described from northern Germany (Ehlers& Linke, 1989; Stackebrandt, 2009; Lang et al., 2012; Janszenet al., 2013), Denmark (Jørgensen & Sandersen, 2009), theNetherlands (Kluiving et al., 2003) and the North Sea Basin(Wingfield, 1990; Huuse & Lykke-Andersen, 2000; Praeg, 2003;Lutz et al., 2009; Kehew et al., 2012; Moreau et al., 2012). Thebasal fill consists of Elsterian meltwater deposits overlain byglaciolacustrine deposits of the Lauenburg Clay Complex. Thesedeposits are unconformably overlain by marine Holsteinian in-terglacial deposits. Saalian meltwater deposits and till coverthe entire study area and unconformably overly the Neogene,Elsterian and Holsteinian deposits (Table 2; Figs 4A and B, and5A and B).
Integration of the resistivity grid model and thegeological subsurface model
Comparison of borehole resistivity logs with model resistivity dataThe borehole Hl9 Wanhoeden penetrates the western marginaltunnel-valley fill (cf. Figs 1C and 4B). The lowermost fill consistsof Elsterian glaciolacustrine fine- to medium-grained sand andsilt alternations of the Lower Lauenburg Clay Complex (U5.2–5.4). This succession is overlain by the Upper Lauenburg ClayComplex, which consists of clay, silt and fine-grained sand al-ternations (U5.5–5.6) and marine Holsteinian interglacial de-posits (U5.7; Figs 4B and 10). The resistivity log of borehole Hl9displays strong resistivity variations, which can be correlatedwith the alternation of clay- and sand-rich beds (Fig. 10). The3D resistivity grid model based on 1D HFEM inversion results
18

Netherlands Journal of Geosciences — Geologie en Mijnbouw
displays a similar resistivity log as the one in the borehole andthus a good lithological match. The upper bounding surface ofthe Upper Lauenburg Clay Complex and the marine interglacialHolsteinian clay can also be identified on the 3D resistivitygrid model (Fig. 10). The interpolated 3D resistivity grid modelbased on 1D HTEM inversion results, however, reveals only oneconductor. While the Upper Lauenburg Clay Complex is nearlyfully imaged, the interglacial marine Holsteinian clay is notwell defined, which may be caused by the limited resolution ofthe transient electromagnetic (TEM) method. The highly con-ductive sediments of the Upper Lauenburg Clay Complex lead toa reduced penetration of the electromagnetic fields and henceresistivities of the sediments below the Upper Lauenburg ClayComplex are not detectable with the transmitter moments usedin this survey.
An important difference between resistivity values of themeasured resistivity log of borehole Hl9 and the extracted val-ues from the 3D resistivity grid models based on 1D AEM inver-sion results is the amplitude of high resistivity values, which isconsiderably lower in the 3D resistivity grid models (Fig. 10).This difference can be explained by the applied AEM methods,which are more sensitive to conductive sediments (Steuer et al.,2009). In addition, the AEM system predominantly generateshorizontal currents, whereas electromagnetic borehole systemsuse vertical currents for measuring the log resistivity. Sedimentanisotropy as well as scaling effects has also to be taken intoaccount.
Relationship between borehole lithology logs and AEM model resis-tivities Our analysis shows that resistivity generally increaseswith grain size and permeability, as also shown by Burschilet al. (2012b) and Klimke et al. (2013) for HTEM data. However,there are substantial differences between the borehole lithol-ogy and resistivity values derived from the two interpolated3D AEM resistivity grids (Fig. 11). The 3D HFEM resistivity gridindicates that clay (grain-size class 1) has an average resistivityof 30 Ωm in the study area. This value corresponds to previousresults of AEM data commonly reported in the literature for clay(Burschil et al., 2012b; Klimke et al., 2013). In comparison toborehole resistivity (commonly between 5 and 20 Ωm) the 3DHFEM resistivity value is slightly to high and may be caused (1)by a certain silt and sand content or (2) by the limited resolu-tion of the HFEM method providing an over- or underestimatedthickness or merging of lithological units. The average resistiv-ity value for deposits mainly consisting of clay to silt is 31 Ωm(grain-size class 2), for clay- and silt-rich fine sand is 31 Ωm(grain-size class 3), for diamicton is 80 Ωm (grain-size class 4),for fine sand is 105 Ωm (grain-size class 5), for silt-rich fine tocoarse sand is 125 Ωm (grain-size class 6) and for fine to coarsesand with gravel is 125 Ωm (grain-size class 7).
The relationship between borehole lithology and resistivitydata extracted from the grid based on 1D HTEM inversion re-sults does not allow the lithology to be clearly defined in 3D
(Fig. 11). The average resistivity value for clay from our dataset (grain-size class 1) is 56 Ωm and may be skewed due to thesmall sample number. The average resistivity value for depositsmainly consisting of clay to silt is 62 Ωm (grain-size class 2),for clay- and silt-rich fine sand is 53 Ωm (grain-size class 3),for diamicton is 115 Ωm (grain-size class 4), for fine sand is107 Ωm (grain-size class 5), for silt-rich fine to coarse sandis 55 Ωm (grain-size class 6) and for fine to coarse sand withgravel is 85 Ωm (grain-size class 7).
The histograms for both resistivity data sets (see Fig. 11)demonstrate that the measured values for sand are higher thanfor deposits with certain clay content. However, overlappingresistivity values for sand-dominated sediments and depositswith clay content are generally found to have a lower resistivityrange, especially for the HTEM resistivity data set. The coarser-grained sediments (grain-size class 4 to 7) have a wide variety ofresistivity values and seem too low, especially for the HTEM dataset. Fig. 11 displays these large resistivity ranges. The variancein values is interpreted to result from the mixed lithologicalcomponents, the limited resolution of the AEM system and theless distinctive imaging of low-conductive sediments.
The larger overlaps of HTEM resistivity values can be ex-plained as an effect of restricted HTEM data coverage and theprojection of interpolated resistivity values onto the boreholelocations. Similar HTEM resistivity values were found at theisland of Fohr (Burschil et al., 2012a,b) and for the region ofQuakenbruck, southwestern Lower Saxony (Klimke et al., 2013).Nonetheless, discrimination of different lithologies with a widerange of resistivity values is possible by integrating with otherdata sets, for example borehole or seismic reflection data.
Correlation of the HFEM resistivity model with thegeological model
Neogene marine and marginal marine deposits At depths between10 and 120 m the spatial resistivity pattern is characterisedby an elongated structure with gradual large-scale variations(100–300 m) of medium to high resistivity values that indi-cate the heterogeneous infill of the Late Miocene incised valley(seismic unit U4; Figs 4C and 5C). A positive correlation withthe hummocky seismic reflector pattern and borehole lithologyindicates that the resistivity pattern images grain-size varia-tions of vertically and laterally stacked delta lobes (cf. Figs 4Cand 5C).
Pleistocene deposits The difference in lithology between thefine-grained glacigenic Pleistocene deposits of the uppertunnel-valley fill and the coarser-grained Neogene marginal-marine sediments is expressed as a distinct resistivity contrast,which can be clearly traced in depth (Figs 4C, 5C and 6B).
The margin of the Cuxhaven tunnel valley is indicated bya gradual shift from low to medium resistivity values of Pleis-tocene deposits (seismic subunits U5.5, U5.6 and U5.7; Figs 4C,
19

Netherlands Journal of Geosciences — Geologie en Mijnbouw
5C, 6B and 7B) to higher resistivity values of the Pliocene hostsediments (seismic unit U4; Figs 4C, 5C, 6B and 7B). The resis-tivity pattern of the HFEM model enables a good 3D imagingof the internal tunnel-valley fill. Large- and small-scale, elon-gated, wedge-shaped or lens-shaped variations in the resistivitypattern can be correlated with major seismic units and smaller-scale architectural elements, such as individual channels (cf.Fig. 4C: U5.7 between 3800 and 4000 m) and lobes (cf. Fig. 4C:U5.6 and U5.7 between 3600 and 3700 m).
The overall tabular geometry of the glaciolacustrine depositsof the Lauenburg Clay Complex (seismic subunit U5.6) and themarine Holsteinian interglacial deposits (seismic subunit U5.7)are both characterised by low resistivity values in the tunnel-valley centre (Figs 4C, 5C, 6B and 7B) and gradually into higherresistivity values towards the tunnel-valley margin. The higherresistivity values towards the tunnel-valley margin have beeninterpreted to be the result of bleeding of higher resistivity val-ues from the neighbouring Pliocene sediments. Alternatively,they could be interpreted as an indicator for coarse-grained ma-terial (e.g. delta foresets at the margin of the tunnel valley inFig. 5C: U5.2 and U5.4 between 700 and 800 m; in Fig. 4C: U5.5at 4300 m and U5.6 at 4500 m). The comparison with lithol-ogy data from boreholes proves that the Lauenburg Clay Com-plex (seismic subunit U5.6) and the marine Holsteinian deposits(seismic subunit U5.7) are approximately imaged at the correctdepths. The HFEM resistivity pattern, however, does not image adistinct boundary between the glaciolacustrine Lauenburg ClayComplex and the marine Holsteinian interglacial deposits dueto their similar grain sizes.
Within the tunnel-valley centre thick conductive fine-grained beds of the Lauenburg Clay Complex limit the pene-tration depth of the HFEM system, leading to a decrease inresolution and a less distinct resistivity pattern of underlyingfine- to medium-grained sand (cf. Fig. 5C, seismic subunit U5.5in seismic line S2). Similar results have also been observed bySteuer et al. (2009).
In the eastern part of the study area lower resistivity val-ues in HFEM data are identified, which differ from the Neogenehost sediments. Its geometry and resistivity values suggest asmaller-scale tunnel valley and probably indicate a fill of fine-grained glaciolacustrine (Lauenburg Clay Complex) and/or in-terglacial marine (Holsteinian) deposits (Fig. 4C). The low resis-tivity contrast between this tunnel-valley fill and the Neogenehost sediments probably indicates relatively similar grain sizes,but this remains speculative because no borehole log control isavailable.
In the uppermost part of the Pleistocene succession between0 and 10 m depth (seismic subunit U5.8; Figs 4C and 5C) a dis-tinct shift from low to very high resistivity values indicates astrong increase in electrical resistivity. This resistivity shift isinterpreted to represent the transition between water saturatedand unsaturated sediments – it represents the groundwater ta-ble contact. This strong resistivity contrast allows the detection
of the groundwater table within a range of approximately 2 mand clearly outlines the Hohe Lieth ridge as the most importantgroundwater recharge area, which has also been documented byBlindow & Balke (2005).
Correlation of the HTEM resistivity model with thegeological model
Neogene marginal-marine deposits At depths between 180 and150 m (seismic unit U3) the resistivity pattern is characterisedby a sharp contrast from low to medium resistivity values(Figs 4D, 5D, 6B and 7B). This upward increase in resistivityis interpreted as an abrupt facies change from finer-grainedshelf deposits to coarser-grained shoreface deposits, which isalso recorded in borehole data (Kuster, 2005) and might be re-lated to the rapid onset of progradation during the highstandsystems tract.
Correlation of the resistivity pattern with borehole data in-dicates that the low resistivity values link to marine Early Tor-tonian clays (seismic unit U3). At depths between 120 and80 m, large-scale, lateral variations of low to medium resistivityvalues, parallel to seismic reflections, can be identified. Alto-gether, resistivity contrast and seismic pattern, characterisedby strong reflectivity contrasts, are interpreted to result fromgrain-size variations, which probably indicate the Tortonianto Messinian storm-dominated shoreface deposits (seismic unitU3; Table 1; Figs 4D and 5D; Walker & Plint, 1992; Catuneanu,2002; Kuster, 2005; Catuneanu et al., 2011). Gradual verticaltransitions from low to high resistivity values within the up-per Neogene unit (seismic unit U4; Figs 4D and 5D) correspondto borehole lithology data with an overall coarsening-upwardtrend are interpreted as prograding delta lobes (e.g. Dalrympleet al., 1992; Plink-Bjorklund, 2008). This interpretation is fur-ther supported by the seismic pattern of lobate units (Figs 4Aand B and 5A and B).
Pleistocene deposits The lithology contrast between the fine-grained glacigenic Pleistocene deposits at the base and the un-derlying coarser-grained Neogene marginal-marine sedimentsis expressed as a distinct change in resistivity, which can beclearly traced in the shallow subsurface between 20 and 30 mdepth and corresponds to the lower boundary of seismic unitU5 (Figs 4D and 5D). The tunnel-valley margin can be identi-fied in borehole data, but in the deeper subsurface is not clearlyimaged by the HTEM resistivity data. At the tunnel-valley mar-gin the resistivity resembles that of the adjacent Neogene hostsediments and therefore its boundary may not be as easilydistinguished (Figs 4D, 5D, 6C and 7C). The inability for theHTEM data to have contrasting resistivity values to define thetunnel-valley boundary is probably caused by the large lateralfootprint of the HTEM system, the inversion approach (SCI) andthe kriging method, which leads to a smooth transition betweenindividual resistivity values.
20

Netherlands Journal of Geosciences — Geologie en Mijnbouw
The upper Cuxhaven tunnel-valley fill is characterised bydifferent vertically stacked resistivity patterns. The highly con-ductive sediments of the Lauenburg Clay Complex lead to a re-duced penetration of the EM field and the resistivity of the sed-iments below are not detectable with the transmitter momentsused in this survey. This suggests that the medium resistivityvalues imaged at depths between 160 and 80 m do not neces-sarily show the true resistivities of Pleistocene sand within thetunnel valley recorded in borehole data (seismic subunits U5.1to U5.4; Figs 4D and 5D). However, the distinct shift towardshigher resistivity values in the unit below the highly conduc-tive sediments of the Lauenburg Clay Complex probably indi-cates coarser-grained deposits of seismic subunit U5.5 (Figs 4Dand 5D). At depths between 80 and 10 m low resistivity valuescan be correlated with fine-grained glaciolacustrine sedimentsof the Lauenburg Clay Complex and interglacial Holsteinian de-posits (seismic subunit U5.6 and U5.7; Figs 4D and 5D). Thecomparison of the resistivity data with the borehole logs andseismic data (Fig. 5B) indicates that resistivity changes reflectlithological changes.
Verification of apparent resistivity values extractedfrom the 3D subsurface models
The comparison of the apparent resistivity values derived fromthe HFEM data (Fig. 12A), the initial geological subsurfacemodel based on borehole and seismic data (Fig. 12B), and theadjusted geological subsurface model derived from the 3D AEMresistivity grids (Fig. 12C) generally show a relationship in-dicating that both geological models are able to explain theprincipal resistvity distribution at several HFEM frequencies.The apparent resistivity images of the initial 3D geologicalsubsurface model show a relatively sharp resistivity contrastbetween the Pleistocene tunnel valley and the adjacent Neo-gene deposits (Fig. 12B), particularly at the lower frequencies(at greater depths) defining a simple tunnel-valley geometrywith a low sinuosity. The apparent resistivity map derived fromthe initial 3D geological subsurface model (Fig. 12B), however,does not image the tunnel-valley fill at the highest frequency(at shallow depths). The difference between the apparent re-sistivity images can be explained by the limited coverage ofborehole and seismic data, which leads to restricted informa-tion about the subsurface architecture. The apparent resistivityimages of the adjusted 3D geological subsurface model derivedfrom the 3D AEM resistivity grids (Fig. 12C) show a more com-plex tunnel-valley geometry characterised by a higher sinuos-ity and smaller-scale variations of the resistivity pattern. Thismore complex interpretation of the tunnel valley can be bet-ter aligned with the apparent resistivity images of HFEM data(Fig. 12A) and the lithology variations recorded by boreholedata. Nevertheless, uncertainties remain and are caused by thedecreasing resolution with depth, which may lead to less con-trast in the resistivity images. This is especially apparent at the
lowest frequency, whereby the resistivity images are influencedby underlying sediments. This often leads to the bottom layerof the 1D inversion models being represented by incorrect re-sistivity values. To reduce this problem we manually adjustedthe resistivity values of bottom units in the adjusted 3D ge-ological subsurface model derived from the 3D AEM resistivitygrids based on lithology information (i.e. in particular the re-sistivity value for the lower part of unit U3 representing clayand silt was reduced by a factor of about 2; cf. Table 1). Theresistivities of the valley infill were adjusted if the calculatedmean values were misleading for the sediment type (i.e. toohigh resistivities attributed to clay and silt units were reduced,e.g. seismic subunit U5.3, and too low resistivities attributedto sandy units were increased, e.g. seismic subunits U5.1 andU5.4; cf. Table 2). Some other values were rounded.
We re-calculated the apparent resistivity values after correc-tion (Fig. 12D). These resistivity images better represent thesubsurface architecture and are closer to the apparent resis-tivity maps represented in the HFEM data, i.e. the adjustedgeological model better explains the HFEM data. Nevertheless,differences in the images of the apparent resistivity patterns re-main. This is caused by a too low resolution of the 3D geologicalsubsurface model, which does not represent detailed sedimentvariability, and incorrectly estimated resistivities attributed tothe geological units. A good example of this effect is the areaof the smaller tunnel valley in the eastern part of the studyarea (Fig. 12D), where the clay and silt deposits (lower partof U3) are obviously thinner or/and resistive, and the centralpart of the valley fill U5.5∗ was estimated as too broad and tooconductive. On the other hand, the low apparent resistivitiesin the northwest of the study area, which occur particularly atlow frequencies, are caused by anthropogenic sources (airportCuxhaven/Nordholz).
Discussion
Our results show that AEM data provide excellent opportunitiesto map the subsurface geology as previously demonstrated by,for example, Newman et al. (1986), Jordan & Siemon (2002),Danielsen et al. (2003), Jørgensen et al. (2003b, 2013), Auken &Christiansen (2004), Auken et al. (2008), Viezzoli et al. (2008),Bosch et al. (2009), Christensen et al. (2009), Klimke et al.(2013) and Gunnink & Siemon (2014). A good relationship be-tween resistivity values and lithology enables the 3D imagingof the subsurface architecture. This allows a hitherto unseenamount of geological detail using AEM data in areas of lowborehole coverage. This approach provides an advanced 3D ge-ological model of the study area with new geological insights.Although the presented approach is more time-consumingthan an automated approach that relies on statistics-basedmethods (Bosch et al., 2009; Gunnink et al., 2012), the
21

Netherlands Journal of Geosciences — Geologie en Mijnbouw
end results compensate for the limitations of the AEMmethod.
Geological and geophysical models and their interpretationscontain limitations and uncertainties resulting from limitationsin the input information (Ross et al., 2005). Several studies fo-cussed on the analysis of such limitations and uncertaintiesin order to minimise risk, e.g. exploration risks (Bardossy &Fodor, 2001; Pryet et al., 2011; Wellmann & Regenauer-Lieb,2012; Jørgensen et al., 2013). Uncertainties and limitations inthe integrated interpretation of AEM and ground-based dataare mainly caused by the restricted availability and limitedvertical and lateral resolution of data (e.g. boreholes, seismicsections, airborne surveys), modelling errors caused by a mis-interpretation of geophysical, lithological and hydrogeologicalproperties, anthropogenic noise effects, missing software inter-operability (Mann, 1993; Bardossy & Fodor, 2001; Ross et al.,2005; Pryet et al., 2011) and irreducible, input-geology related,uncertainty. In general there are several limitations in the in-terpretation caused by the applied AEM systems and the chosendata analysis.
The penetration depth and resolution of both AEM systemsused is controlled by lithology and their conductivity. Thepenetration depth is limited to approximately 100 m for HFEMand 250 m for HTEM, and both systems are subject to decreasingresolution capability with depth and require an increasingthickness/depth ratio for the detection of varying depositionalunits (Jørgensen et al., 2003b, 2005; Høyer et al., 2011). Be-cause of the wide range of lithologies a significant uncertaintyremains in the final interpretation of the resistivity pattern.Hence, thin-bedded sedimentary units are only resolved if theircorresponding conductance, i.e. the ratio of thickness andresistivity, is sufficiently high. Otherwise they will be mergedinto a single unit with an average resistivity (Jørgensen et al.,2003b, 2005), which results in a limited resistivity resolution.The limitations in lateral and vertical resolution can lead toincorrect interpretations of thin-bedded sand/mud couplets,smaller-scale architectural elements and bounding surfaces, ashas been also shown by, for example, Jørgensen et al. (2003a,2005), Viezzoli et al. (2008), Christensen et al. (2009) andKlimke et al. (2013). This problem is distinctly seen in ourstudy area in the Pleistocene tunnel valley and Late Mioceneincised valley. The Saalian till at 20 m depth with a thicknessbetween 5 and 10 m and a wide resistivity range (cf. Fig. 11)could not be differentiated from the surrounding lithologyand is beyond the possible AEM resolution. The Pleistocenetunnel-valley margins and the Late Miocene incised-valleymargin could not be detected because of a low resistivitycontrast to the adjacent Neogene host sediments.
For our study only an existing 1D AEM inversion data set(from 2002) was available, in which noise effects were notsignificantly minimised, as commonly applied for new datasets (e.g. Tølbøll, 2007; Siemon et al., 2011). However, thenoise effects of anthropogenic structures and soundings in the
airborne electromagnetic data can hinder a proper geologicalinterpretation, e.g. the airport Cuxhaven/Nordholz located inthe northwest of the study area. In the case of the study areaanthropogenic noise effects cause unrealistic low resistive os-cillations, which conically increase downwards.
We used a geostatistical approach to analyse and interpo-late the 1D AEM inversion results to create a continuous 3Dresistivity subsurface grid. We used ordinary kriging, and incontrast to Pryet et al. (2011) we discarded the layered ap-proach used in the 1D inversion of AEM data, leading to asmoothing effect between previously defined layer boundaries.The advantage of this method is that the kriging algorithm in-dicates the most likely resistivity value at each grid cell. Theresult is an effectively smoothed resistivity grid, leading toa significant improved geological interpretation of continuouslithofacies. However, a loss of heterogeneity that is probablyobserved in the subsurface by AEM has to be taken into account.If the aim is to generate fluid-flow models it is important topreserve the porosity and permeability of varying lithologies asthese strongly determine fluid-flow behaviour through porousmedia (e.g. Koltermann & Gorelick, 1996; Janszen, 2012). Itis therefore preferred to base fluid-flow simulations on gridsthat are interpolated using algorithms that are able to preservethe heterogeneity, such as modified kriging methods like thesequential indicator simulation used by Venteris (2007), Boschet al. (2009) and Janszen (2012).
A common limitation of the presented workflow is the highdegree of subjectivity that causes uncertainties that are hard toevaluate. To test the reliability of the 3D geological subsurfacemodel and evaluate uncertainty, we followed a new approach toderive synthetic HFEM data from the geological model resultsbased on a relationship of calculated or assumed geologicalunits and resistivities. The comparison between correspondingapparent resistivity images of the subsurface based on AEM fieldmeasurements and 3D geological models leads to the identifi-cation of uncertainties and limitations of 1D AEM inversion andvice versa. The results of such analyses will offer the advan-tage of using a priori information to improve the inversion ofAEM data, comparable to investigations made by, for example,Zhdanov (2010) and Gunnink et al. (2012).
Conclusions
Resistivity data derived from AEM surveys can provide a fast andefficient overview mapping of the shallow subsurface geology. Amethodology for the interpretation, analysis and imaging of re-sistivity data gained by AEM surveys, based on 3D modelling ap-proaches, was developed. We used 1D HFEM and HTEM inversionresults and applied a 3D resistivity gridding procedure based ongeostatistical analyses and interpolation techniques to createcontinuous resistivity models of the subsurface. Subsequently,we integrated results of seismic facies and borehole lithology
22

Netherlands Journal of Geosciences — Geologie en Mijnbouw
analysis to construct a combined 3D geological subsurface modeland to reduce uncertainties. This approach allows for an im-proved interpretation of AEM data and imaging of the 3D sub-surface architecture, if the relationship between lithology andresistivity was known and the site was only slightly influencedby noise effects (e.g. infrastructural networks, settlements).
The 3D resistivity models clearly allow discrimination be-tween different lithologies and enable the detection of Cenozoicsequence boundaries and larger-scale architectural elementssuch as incised valleys and subglacial tunnel valleys. Varia-tions in the resistivity pattern allowed the detection of indi-vidual delta lobes and smaller-scale channels as well as lateraland vertical grain-size variations. In the Neogene successiona low resistive pattern can be correlated with Tortonian andMessinian marine clays. The lowest values probably correspondwith the zone of maximum flooding. From seismic interpreta-tion we conclude that at the end of the Miocene an incisedvalley formed as a response to a major sea-level fall that sub-sequently became filled with Pliocene-delta deposits, probablyindicating the palaeo-course of the Rivers Weser or Elbe. Theresistivity models clearly image the outline of the Pleistocenetunnel valleys. The unconsolidated fill of the Late Miocene toPliocene incised valley probably formed a preferred pathway forthe Pleistocene meltwater flows, favouring the incision of a sub-glacial tunnel valley. Based on the 3D HFEM resistivity grid thefills of the tunnel valleys could be imaged in much more detailin comparison to previously published descriptions based on the2D seismic sections and 2D AEM profiles and maps. The appliedapproaches and results show a reliable methodology, especiallyfor future investigations of similar geological settings.
Acknowledgements
The AIDA project is part of the joint research program ofGEOTECHNOLOGIEN. Financial support is gratefully acknowl-edged from the German Federal Ministry of Education and Re-search (BMBF) grant 03G0735. We thank two anonymous re-viewers for very careful and constructive reviews, which helpedto improve the manuscript. Many thanks are due to Hajo Gotzeand Peter Menzel for discussion, and Guillaume Martelet forhelpful comments on an earlier version of the manuscript andAriana Osman for discussion and improving the English. We aregrateful to the State Authority for Mining, Energy and Geology(LBEG) for providing borehole data, to Fugro for providing theGeODin software and Paradigm for GOCAD software support.
References
Anell, I., Thybo, H. & Rasmussen, E., 2012. A synthesis of Cenozoic sedimenta-
tion in the North Sea. Basin Research 24: 154–179.
Archie, G.E., 1942. The electrical resistivity log as an aid in determining some
reservoir characteristics. Trans AIME 146: 54–62.
Auken, E. & Christiansen, A.V., 2004. Layered and laterally constrained 2D in-
version of resistivity data. Geophysics 69(3): 752–761.
Auken, E., Christiansen, A.V., Jacobsen, L.H. & Sorensen, K.I., 2008. A resolu-
tion study of buried valleys using laterally constrained inversion of TEM data.
Journal of Applied Geophysics 65(1): 10–20.
Baldschuhn, R., Frisch, U. & Kockel, F. (eds), 1996. Geotektonischer Atlas
von NW-Deutschland 1 : 300000. Bundesanstalt fur Geowissenschaften und
Rohstoffe (Hannover).
Baldschuhn, R., Binot, F., Fleig, S. & Kockel, F., 2001. Geotektonischer Atlas
von Nordwestdeutschland und dem deutschen Nordsee-Sektor. Geologisches
Jahrbuch A153: 3–95.
Bardossy, G. & Fodor, J., 2001. Traditional and new ways to handle uncertainty
in geology. Natural Resources Research 10(3): 179–187.
Besenecker, H., 1976. Bohrdatenbank Niedersachsen, Bohr-ID: 3028HY0304, Lan-
desamt fur Bergbau, Energie und Geologie (LBEG) (Hannover).
Betz, D., Fuhrer, F., Greiner, G. & Plein, E., 1987. Evolution of the Lower Saxony
Basin. Tectonophysics 137: 127–170.
Binot, F. & Wonik, T., 2005. Lithologie und Salz-/Sußwassergrenze in der
Forschungsbohrung Cuxhaven Ludingworth 1/1A. Zeitschrift fur Angewandte
Geologie 1: 14–23.
Blindow, N. & Balke, J., 2005. GPR-Messungen zur Bestimmung der Grundwasser-
oberflache im Bereich des Geestruckens sudlich von Cuxhaven. Zeitschrift fur
Angewandte Geologie 1: 39–44.
Bosch, J.H.A., Bakker, M.A.J., Gunnink, J.L. & Paap, B.F., 2009. Airborne elec-
tromagnetic measurements as basis for a 3D geological model of an Elsterian
incision. Zeitschrift der deutschen Gesellschaft fur Geowissenschaften 160(3):
249–258.
Brandes, C., Pollok, L., Schmidt, C., Riegel, W., Wilde, V. & Winsemann, J.,
2012. Basin modelling of a lignite-bearing salt rim syncline: insights into
rim syncline evolution and salt diapirism in NW Germany. Basin Research 24:
699–716.
Burschil, T., Wiederhold, H. & Auken, E., 2012a. Seismic results as a-priori
knowledge for airborne TEM data inversion – A case study. Journal of Applied
Geophysics 80: 121–128.
Burschil, T., Scheer, W., Kirsch, R. & Wiederhold, H., 2012b. Compiling geo-
physical and geological information into a 3-D model of the glacially-affected
island of Fohr. Hydrology and Earth System Sciences 16: 3485–3498.
BurVal Working Group, 2009. Buried Quaternary valleys - a geophysical approach.
Zeitschrift der deutschen Gesellschaft fur Geowissenschaften 160(3): 237–247.
Cameron, T.D.J., Buat, J. & Mesdag, C.S., 1993. High resolution seismic profile
through a Late Cenozoic delta complex in the southern North Sea. Marine and
Petroleum Geology 10: 591–599.
Caspers, G., Jordan, H., Merkt, J., Meyer, K.-D., Muller, H. & Streif, H., 1995.
III. Niedersachsen. In: Benda, L. (ed.): Das Quartar Deutschlands. Gebruder
Borntrager (Berlin): 23–58.
Catuneanu, O., 2002. Sequence stratigraphy of clastic systems: concepts, merits,
and pitfalls. Journal of African Earth Sciences 35: 1–43.
Catuneanu, O., Galloway, W.E., Kendall, C.G.St.C., Miall, A.D., Posamentier,
H.W., Strasser, A. & Tucker, M.E., 2011. Sequence Stratigraphy: Methodology
and Nomenclature. Newsletters on Stratigraphy 44(3): 173–245.
Christensen, N.B., Reid, J.E. & Halkjær, M., 2009. Fast, laterally smooth inversion
of airborne time-domain electromagnetic data. Near Surface Geophysics 7:
599–612.
23

Netherlands Journal of Geosciences — Geologie en Mijnbouw
Dalrymple, R.W., Zaitlin, B.A. & Boyd, R., 1992. Estuarine facies models: concep-
tual basis and stratigraphic implications. Journal of Sedimentary Petrology
62: 1130–1146.
Danielsen, J.E., Auken, E., Jørgensen, F., Søndergard, V. & Sørensen, K.I., 2003.
The application of the transient electromagnetic method in hydrogeological
surveys. Journal of Applied Geophysics 53: 181–198.
de Louw, P.G.B., Eeman, S., Siemon, B., Voortman, B.R., Gunnink, J., van
Baaren, E.S. & Oude Essink, G.H.P., 2011. Shallow rainwater lenses in deltaic
areas with saline seepage. Hydrology Earth System Sciences 15: 3659–3678.
Ehlers, J., 2011. Geologische Karte von Hamburg 1: 25 000: Erlauterungen zu
Blatt Nr. 2326 Fuhlsbuttel. Behorde fur Stadtentwicklung und Umwelt, Geol-
ogisches Landesamt Hamburg (Hamburg).
Ehlers, J. & Linke, G., 1989. The origin of deep buried channels of Elsterian age
in northwest Germany. Journal of Quaternary Science 4: 255–265.
Ehlers, J., Meyer, K.-D. & Stephan, H.-J., 1984. Pre-weichselian glaciations of
north-west Europe. Quaternary Science Reviews 3: 1–40.
Ehlers, J., Grube, A., Stephan, H.-J. & Wansa, S., 2011. Pleistocene Glaciations
of North Germany – New Results. In: Ehlers, J., Gibbard, P.L. & Hughes,
P.D. (eds): Quaternary Glaciations – Extent and Chronology – A Closer Look.
Developments in Quaternary Science 15. Elsevier (Amsterdam): 149–162.
Eidvin, T. & Rundberg, Y, 2007. Post-Eocene strata of the southern Viking
Graben, northern North Sea; integrated biostratigraphic, strontium isotopic
and lithostratigraphic study. Norwegian Journal of Geology 87: 391–450.
Fraser, D.C., 1978. Resistivity mapping with an airborne multicoil electromagnetic
system. Geophysics 43: 144–172.
Fugro Consult GmbH, 2012. GeODin 7, http://www.geodin.com. Berlin, Germany.
Gabriel, G., 2006. Gravity investigation of buried Pleistocene subglacial valleys.
Near Surface Geophysics 4: 321–332.
Gabriel, G., Kirsch, R., Siemon, B. & Wiederhold, H., 2003. Geophysical investi-
gations of buried Pleistocene subglacial valleys in Northern Germany. Journal
of Applied Geophysics 53: 159–180.
Gast, R. & Gundlach, T., 2006. Permian strike slip and extensional tectonics in
Lower Saxony, Germany. Zeitschrift der Deutschen Gesellschaft fur Geowis-
senschaften 157(1): 41–55.
Gibbard, P.L., 1988. The history of the great northwest European rivers during
the past three million years. Philosophical Transactions of the Royal Society
of London B318: 559–602.
Gramann, F., 1988. Major palaeontological events and biostratigraphical correla-
tions. Geologisches Jahrbuch A100: 410–423.
Gramann, F., 1989. Forschungsbohrung Wursterheide. Benthonische
Foraminiferen und verwandte Mikrofossilien. Biostratigraphie, Faziesanalyse.
Geologisches Jahrbuch A111: 287–319.
Gramann, F. & Daniels, C.H. von, 1988. Benthic foraminifera: the description of
the interregional zonation (B zones). Geologisches Jahrbuch A100: 145–151.
Gramann, F. & Kockel, F., 1988. Palaeogeographical, lithological, palaeoecologi-
cal and palaeoclimatic development of the Northwest European Tertiary Basin.
Geologisches Jahrbuch A100: 428–441.
Grassmann, S., Cramer, B., Delisle, G., Messner, J. & Winsemann, J., 2005.
Geological history and petroleum system of the Mittelplate oil field, Northern
Germany. International Journal of Earth Sciences 94: 979–989.
Gunnink, J.L. & Siemon, B., 2014. Applying airborne electromagnetics in
3D stochastic geohydrological modelling for determining groundwater pro-
tection. Near Surface Geophysics, 12 (early online), doi: 10.3997/1873-
0604.2014044. EAGE Publications (Houten).
Gunnink, J.L., Bosch, J.H.A., Siemon, B., Roth, B. & Auken, E., 2012. Com-
bining ground-based and airborne EM through artificial neural networks for
modelling hydrogeological units under saline groundwater conditions. Hy-
drology and Earth System Sciences 16: 3061–3074.
Haq, B.U., Hardenbol, J. & Vail, P.R., 1987. Chronology of fluctuating sea levels
since the Triassic (250 million years ago to present). Science 235: 1156–1167.
Hese, F., 2012. 3D Modellierungen und Visualisierung von Untergrundstrukturen
fur die Nutzung des unterirdischen Raumes in Schleswig-Holstein. PhD thesis,
Christian-Albrechts-Universitat zu Kiel (Kiel).
HGG, 2011. Guide to processing and inversion of SkyTEM data in the Aarhus
Workbench. Technical report, Hydro-Geophysical Group, Department of Earth
Sciences, University of Aarhus (Aarhus).
Hofle, H.C., Merkt, J. & Muller, H., 1985. Die Ausbreitung des Eem-Meeres in
Nordwestdeutschland. Eiszeitalter und Gegenwart 35: 49–59.
Høyer, A.-S., Lykke-Andersen, H., Jørgensen, F. & Auken, E., 2011. Combined
interpretation of SkyTEM and high-resolution seismic data. Journal of Physics
and Chemistry of the Earth 36(16): 1386–1397.
Huuse, M., 2002. Late Cenozoic palaeogeography of the eastern North Sea Basin
climatic vs. tectonic forcing of basin margin uplift and deltaic progradation.
Bullettin of the Geological Society of Denmark 49: 145–170.
Huuse, M. & Clausen, O.R., 2001. Morphology and origin of major Cenozoic
sequence boundaries in the eastern North Sea Basin: top Eocene, near-top
Oligocene and the mid-Miocene unconformity. Basin Research 13: 17–41.
Huuse, M. & Lykke-Andersen, H., 2000. Overdeepened Quaternary valleys in the
eastern Danish North Sea: morphology and origin. Quaternary Science Reviews
19: 1233–1253.
Huuse, M., Lykke-Andersen, H. & Michelsen, O., 2001. Cenozoic evolution of the
eastern North Sea Basin – new evidence from high-resolution and conven-
tional seismic data. Marine Geology 177: 243–269.
Huuse, M., Piotrowski, J.A. & Lykke-Andersen, H., 2003. Geophysical investi-
gations of buried Quaternary valleys in the formerly glaciated NW European
lowland: significance for groundwater exploration. Journal of Applied Geo-
physics 53: 153–157.
Janszen, A., 2012. Tunnel valleys: genetic models, sedimentary infill and 3D
architecture. PhD thesis, Delft University of Technology (Delft).
Janszen, A., Spaak, M. & Moscariello, A., 2012. Effects of the substratum on the
formation of glacial tunnel valleys: an example from the Middle Pleistocene
of the southern North Sea Basin. Boreas 41: 629–643.
Janszen, A., Moreau, J., Moscariello, A., Ehlers, J. & Kroger, J., 2013. Time-
transgressive tunnel-valley infill revealed by a three-dimensional sedimentary
model, Hamburg, north-west Germany. Sedimentology 60(3): 693–719.
Jaritz, W., 1987. The origin and development of salt structures in Northwest
Germany. In: Lerche, I. & O’Brian, J.J. (eds): Dynamical Geology of Salt and
Related Structures. Academic Press (Orlando): 479493.
Jordan, H. & Siemon, B., 2002. Die Tektonik des nordwestlichen Harzrandes
– Ergebnisse der Hubschrauber-Elektromagnetik. Zeitschrift der Deutschen
Geologischen Gesellschaft 153(1): 31–50.
Jørgensen, F. & Sandersen, P.B.E., 2006. Buried and open tunnel valleys in
Denmark – erosion beneath multiple ice sheets. Quaternary Science Reviews
25: 1339–1363.
24

Netherlands Journal of Geosciences — Geologie en Mijnbouw
Jørgensen, F. & Sandersen, P.B.E., 2009. Buried valley mapping in Denmark:
evaluating mapping method constraints and the importance of data density.
Zeitschrift der deutschen Gesellschaft fur Geowissenschaften 160(3): 211–229.
Jørgensen, F., Lykke-Andersen, H., Sandersen, P.B.E., Auken, E. & Nørmark, E.,
2003a. Geophysical investigations of buried Quaternary valleys in Denmark:
an integrated application of transient electromagnetic soundings, reflection
seismic surveys and exploratory drillings. Journal of Applied Geophysics 53:
215–228.
Jørgensen, F., Sandersen, P.B.P. & Auken, E., 2003b. Imaging buried valleys
using the transient electromagnetic method. Journal of Applied Geophysics
53: 215–228.
Jørgensen, F., Sandersen, P.B.P., Auken, E., Lykke-Andersen, H. & Sørensen,
K., 2005. Contributions to the geological mapping of Mors, Denmark – A
study based on large-scale TEM survey. Bulletin of the Geological Society of
Denmark 52: 53–75.
Jørgensen, F., Rønde Møller, R., Nebel, L., Jensen, N.-P., Christiansen, A.V. &
Sandersen, P.B.E., 2013. A method for cognitive 3D geological voxel mod-
elling of AEM data. Bulletin of Engineering Geology and the Environment
72(3–4): 421–432.
Jurgens, U., 1996. Mittelmiozane bis pliozane Randmeer-Sequenzen aus dem
deutschen Sektor der Nordsee. Geologisches Jahrbuch A146: 217–232.
Kehew, A.E., Piotrowski, J.A. & Jørgensen, F., 2012. Tunnel valleys: Concepts
and controversies – A review. Earth-Science Reviews 113: 33–58.
Klimke, J., Wiederhold, H., Winsemann, J., Ertl, G. & Elbracht, J., 2013.
Three-dimensional mapping of Quaternary sediments improved by airborne
electromagnetics in the case of the Quakenbruck Basin, Northern Germany.
Zeitschrift der deutschen Gesellschaft fur Geowissenschaften 164(2): 369–384.
Kluiving, S.J., Bosch, J.H.A., Ebbing, J.H.J., Mesdag, C.S. & Westerhoff, R.S.,
2003. Onshore and offshore seismic and lithostratigraphic analysis of a deeply
incised Quaternary buried valley-system in the Northern Netherlands. Journal
of Applied Geophysics 53: 249–271.
Knox, R.W.O.B., Bosch, J.H.A., Rasmussen, E.S., Heilmann-Clausen, C., Hiss,
M., De Lugt, I.R., Kasinksi, J., King, C., Kothe, A., Słodkowska, B., Standke,
G. & Vandenberghe, N., 2010. Cenozoic. In: Doornenbal, J.C. & Stevenson,
A.G. (eds): Petroleum Geological Atlas of the Southern Permian Basin Area.
EAGE Publications b.v. (Houten): 211–223.
Knudsen, K.L., 1988. Marine Interglacial Deposits in the Cuxhaven Area, NW
Germany: A Comparison of Holsteinian, Eemian and Holocene Foraminiferal
Faunas. Eiszeitalter und Gegenwart 38: 69–77.
Knudsen, K.L., 1993a. Foraminiferal Faunas in Holsteinian Deposits of the Neuw-
erk Area, Germany. Geologisches Jahrbuch A138: 77–95.
Knudsen, K.L., 1993b. Late Elsterian-Holsteinian Foraminiferal Stratigraphy in
Boreholes in the Lower Elbe Area, NW Germany. Geologisches Jahrbuch A138:
97–119.
Kockel, F., 2002. Rifting processes in NW-Germany and the German North Sea
Sector. Netherlands Journal of Geosciences/Geologie en Mijnbouw 81: 149–
158.
Koltermann, C.E. & Gorelick, S.M., 1996. Heterogeneity in sedimentary de-
posits: a review of structure-imitating, process-imitating, and descriptive
approaches. Water Resources Research 32: 2617–2658.
Konradi, P., 2005. Cenozoic stratigraphy in the Danish North Sea Basin. Geologie
en Mijnbouw 84: 109–111.
Kothe, A., 2007. Cenozoic biostratigraphy from the German North Sea sector (G-
11-1 borehole, dinoflagellate cysts, calcareous nannoplankton). Zeitschrift
der deutschen Gesellschaft fur Geowissenschaften 158(2): 287–327.
Kothe, A., Gaedicke, C. & Rudiger, L., 2008. Erratum: The age of the Mid-
Miocene Unconformity (MMU) in the G-11-1 borehole, German North Sea
sector. Zeitschrift der deutschen Gesellschaft fur Geowissenschaften 159(4):
687–689.
Krige, D.G., 1951. A statistical approach to some basic mine valuation problems
on the Witwatersrand. Journal of the Chemical, Metallurgical and Mining
Society of South Africa 52(6): 119–139.
Kuhlmann, G., de Boer, P., Pedersen, R.B. & Wong, Th.E., 2004. Provenance of
Pliocene sediments and paleoenvironmental changes in the southern North
Sea region using Samarium-Neodymium (Sm/Nd) provenance ages and clay
mineralogy. Sedimentary Geology 171: 205–226.
Kuhlmann, G. & Wong, T.E., 2008. Pliocene paleoenvironment evolution as in-
terpreted from 3D-seismic data in the southern North Sea, Dutch offshore
sector. Marine and Petroleum Geology 25: 173–189.
Kuster, H., 2005. Das jungere Tertiar in Nord- und Nordostniedersachsen. Geolo-
gisches Jahrbuch A158: 0–194.
Kuster, H. & Meyer, K.-D., 1979. Glaziare Rinnen im mittleren und nordostlichen
Niedersachsen. Eiszeitalter und Gegenwart 29: 135–156.
Kuster, H. & Meyer, K.-D., 1995. Quartargeologische Ubersichtskarte von Nieder-
sachsen und Bremen, 1 : 500 000. Niedersachsisches Landesamt fur Boden-
forschung (Hannover).
Lane, R., Green, A., Golding, C., Owers, M., Pik, P., Plunkett, C., Sattel, D. &
Thorn, B., 2000. An example of 3D conductivity mapping using the TEMPEST
airborne electromagnetic system. Exploration Geophysics 31: 162–172.
Lang, J., Winsemann, J., Steinmetz, D., Polom, U., Pollok, L., Bohner, U.,
Serangeli, J., Brandes, C., Hampel, A. & Winghart, S., 2012. The Pleis-
tocene of Schoningen, Germany: a complex tunnel valley fill revealed from
3D subsurface modelling and shear wave seismics. Quaternary Science Reviews
39: 86–105.
Linke, G., 1993. Zur Geologie und Petrographie der Forschungsbohrungen qho
1–5, der Bohrung Hamburg-Billbrook und des Vorkommens von marinem Hol-
stein im Gebiet Neuwerk-Scharhorn. Geologisches Jahrbuch A138: 35–76.
Litt, T., Behre, K.-E., Meyer, K.-D., Stephan, H.-J. & Wansa, S., 2007. Strati-
graphische Begriffe fur das Quartar des norddeutschen Vereisungsgebietes.
Eiszeitalter und Gegenwart 56: 7–65.
Lutz, R., Kalka, S., Gaedicke, C., Reinhardt, L. & Winsemann, J., 2009. Pleis-
tocene tunnel valleys in the German North Sea: spatial distribution and mor-
phology. Zeitschrift der deutschen Gesellschaft fur Geowissenschaften 160(3):
225–235.
Mallet, J.-L., 2002. Geomodeling. Oxford University Press (New York): 624 pp.
Mangerud, J., Jansen, E. & Landvik, J.Y., 1996. Late Cenozoic history of the
Scandinavian and Barents Sea ice sheets. Global and Planetary Change 12:
11–26.
Mann, C.J., 1993. Uncertainty in geology. In: Davis, J.C. & Herzfeld, U.C. (eds):
Computers in geology – 25 years of progress. Oxford University Press (Oxford):
241–254.
Maystrenko, Y., Bayer, U. & Scheck-Wenderoth, M., 2005a. The Glueckstadt
Graben, a sedimentary record between the North- and Baltic Sea in North
Central Europe. Tectonophysics 397: 113–126.
25
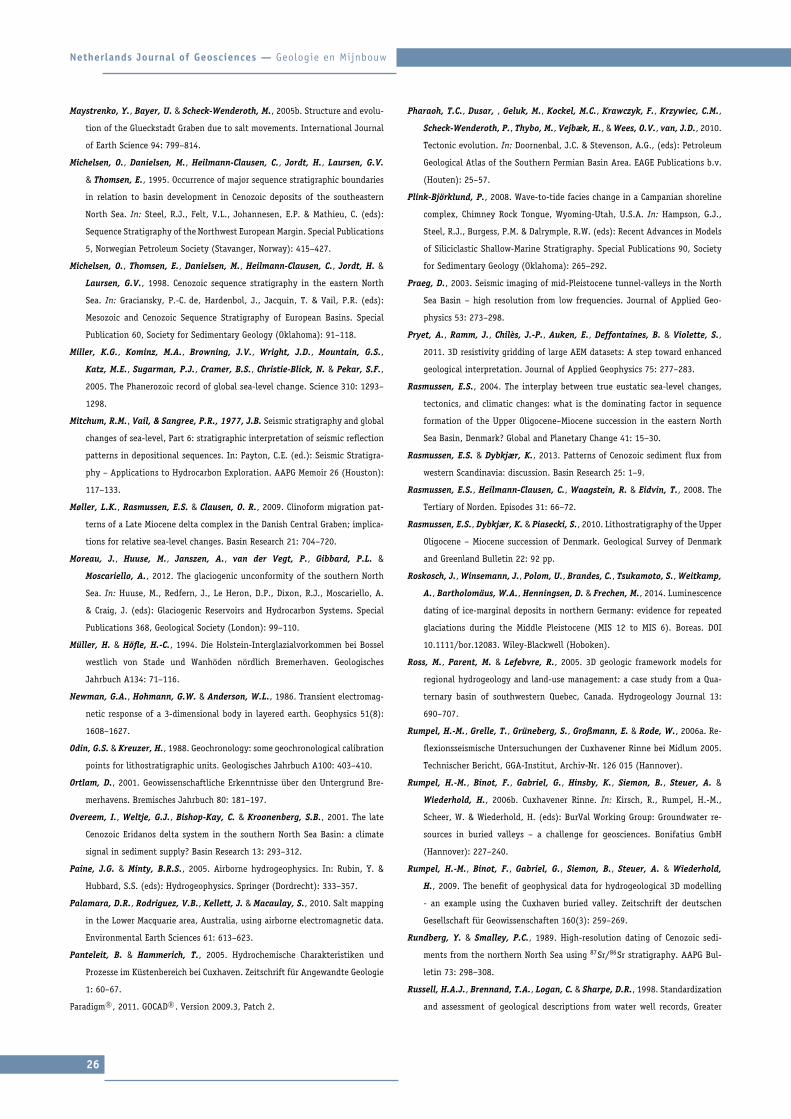
Netherlands Journal of Geosciences — Geologie en Mijnbouw
Maystrenko, Y., Bayer, U. & Scheck-Wenderoth, M., 2005b. Structure and evolu-
tion of the Glueckstadt Graben due to salt movements. International Journal
of Earth Science 94: 799–814.
Michelsen, O., Danielsen, M., Heilmann-Clausen, C., Jordt, H., Laursen, G.V.
& Thomsen, E., 1995. Occurrence of major sequence stratigraphic boundaries
in relation to basin development in Cenozoic deposits of the southeastern
North Sea. In: Steel, R.J., Felt, V.L., Johannesen, E.P. & Mathieu, C. (eds):
Sequence Stratigraphy of the Northwest European Margin. Special Publications
5, Norwegian Petroleum Society (Stavanger, Norway): 415–427.
Michelsen, O., Thomsen, E., Danielsen, M., Heilmann-Clausen, C., Jordt, H. &
Laursen, G.V., 1998. Cenozoic sequence stratigraphy in the eastern North
Sea. In: Graciansky, P.-C. de, Hardenbol, J., Jacquin, T. & Vail, P.R. (eds):
Mesozoic and Cenozoic Sequence Stratigraphy of European Basins. Special
Publication 60, Society for Sedimentary Geology (Oklahoma): 91–118.
Miller, K.G., Kominz, M.A., Browning, J.V., Wright, J.D., Mountain, G.S.,
Katz, M.E., Sugarman, P.J., Cramer, B.S., Christie-Blick, N. & Pekar, S.F.,
2005. The Phanerozoic record of global sea-level change. Science 310: 1293–
1298.
Mitchum, R.M., Vail, & Sangree, P.R., 1977, J.B. Seismic stratigraphy and global
changes of sea-level, Part 6: stratigraphic interpretation of seismic reflection
patterns in depositional sequences. In: Payton, C.E. (ed.): Seismic Stratigra-
phy – Applications to Hydrocarbon Exploration. AAPG Memoir 26 (Houston):
117–133.
Møller, L.K., Rasmussen, E.S. & Clausen, O. R., 2009. Clinoform migration pat-
terns of a Late Miocene delta complex in the Danish Central Graben; implica-
tions for relative sea-level changes. Basin Research 21: 704–720.
Moreau, J., Huuse, M., Janszen, A., van der Vegt, P., Gibbard, P.L. &
Moscariello, A., 2012. The glaciogenic unconformity of the southern North
Sea. In: Huuse, M., Redfern, J., Le Heron, D.P., Dixon, R.J., Moscariello, A.
& Craig, J. (eds): Glaciogenic Reservoirs and Hydrocarbon Systems. Special
Publications 368, Geological Society (London): 99–110.
Muller, H. & Hofle, H.-C., 1994. Die Holstein-Interglazialvorkommen bei Bossel
westlich von Stade und Wanhoden nordlich Bremerhaven. Geologisches
Jahrbuch A134: 71–116.
Newman, G.A., Hohmann, G.W. & Anderson, W.L., 1986. Transient electromag-
netic response of a 3-dimensional body in layered earth. Geophysics 51(8):
1608–1627.
Odin, G.S. & Kreuzer, H., 1988. Geochronology: some geochronological calibration
points for lithostratigraphic units. Geologisches Jahrbuch A100: 403–410.
Ortlam, D., 2001. Geowissenschaftliche Erkenntnisse uber den Untergrund Bre-
merhavens. Bremisches Jahrbuch 80: 181–197.
Overeem, I., Weltje, G.J., Bishop-Kay, C. & Kroonenberg, S.B., 2001. The late
Cenozoic Eridanos delta system in the southern North Sea Basin: a climate
signal in sediment supply? Basin Research 13: 293–312.
Paine, J.G. & Minty, B.R.S., 2005. Airborne hydrogeophysics. In: Rubin, Y. &
Hubbard, S.S. (eds): Hydrogeophysics. Springer (Dordrecht): 333–357.
Palamara, D.R., Rodriguez, V.B., Kellett, J. & Macaulay, S., 2010. Salt mapping
in the Lower Macquarie area, Australia, using airborne electromagnetic data.
Environmental Earth Sciences 61: 613–623.
Panteleit, B. & Hammerich, T., 2005. Hydrochemische Charakteristiken und
Prozesse im Kustenbereich bei Cuxhaven. Zeitschrift fur Angewandte Geologie
1: 60–67.
Paradigm R©, 2011. GOCAD R©. Version 2009.3, Patch 2.
Pharaoh, T.C., Dusar, , Geluk, M., Kockel, M.C., Krawczyk, F., Krzywiec, C.M.,
Scheck-Wenderoth, P., Thybo, M., Vejbæk, H., & Wees, O.V., van, J.D., 2010.
Tectonic evolution. In: Doornenbal, J.C. & Stevenson, A.G., (eds): Petroleum
Geological Atlas of the Southern Permian Basin Area. EAGE Publications b.v.
(Houten): 25–57.
Plink-Bjorklund, P., 2008. Wave-to-tide facies change in a Campanian shoreline
complex, Chimney Rock Tongue, Wyoming-Utah, U.S.A. In: Hampson, G.J.,
Steel, R.J., Burgess, P.M. & Dalrymple, R.W. (eds): Recent Advances in Models
of Siliciclastic Shallow-Marine Stratigraphy. Special Publications 90, Society
for Sedimentary Geology (Oklahoma): 265–292.
Praeg, D., 2003. Seismic imaging of mid-Pleistocene tunnel-valleys in the North
Sea Basin – high resolution from low frequencies. Journal of Applied Geo-
physics 53: 273–298.
Pryet, A., Ramm, J., Chiles, J.-P., Auken, E., Deffontaines, B. & Violette, S.,
2011. 3D resistivity gridding of large AEM datasets: A step toward enhanced
geological interpretation. Journal of Applied Geophysics 75: 277–283.
Rasmussen, E.S., 2004. The interplay between true eustatic sea-level changes,
tectonics, and climatic changes: what is the dominating factor in sequence
formation of the Upper Oligocene–Miocene succession in the eastern North
Sea Basin, Denmark? Global and Planetary Change 41: 15–30.
Rasmussen, E.S. & Dybkjær, K., 2013. Patterns of Cenozoic sediment flux from
western Scandinavia: discussion. Basin Research 25: 1–9.
Rasmussen, E.S., Heilmann-Clausen, C., Waagstein, R. & Eidvin, T., 2008. The
Tertiary of Norden. Episodes 31: 66–72.
Rasmussen, E.S., Dybkjær, K. & Piasecki, S., 2010. Lithostratigraphy of the Upper
Oligocene – Miocene succession of Denmark. Geological Survey of Denmark
and Greenland Bulletin 22: 92 pp.
Roskosch, J., Winsemann, J., Polom, U., Brandes, C., Tsukamoto, S., Weitkamp,
A., Bartholomaus, W.A., Henningsen, D. & Frechen, M., 2014. Luminescence
dating of ice-marginal deposits in northern Germany: evidence for repeated
glaciations during the Middle Pleistocene (MIS 12 to MIS 6). Boreas. DOI
10.1111/bor.12083. Wiley-Blackwell (Hoboken).
Ross, M., Parent, M. & Lefebvre, R., 2005. 3D geologic framework models for
regional hydrogeology and land-use management: a case study from a Qua-
ternary basin of southwestern Quebec, Canada. Hydrogeology Journal 13:
690–707.
Rumpel, H.-M., Grelle, T., Gruneberg, S., Großmann, E. & Rode, W., 2006a. Re-
flexionsseismische Untersuchungen der Cuxhavener Rinne bei Midlum 2005.
Technischer Bericht, GGA-Institut, Archiv-Nr. 126 015 (Hannover).
Rumpel, H.-M., Binot, F., Gabriel, G., Hinsby, K., Siemon, B., Steuer, A. &
Wiederhold, H., 2006b. Cuxhavener Rinne. In: Kirsch, R., Rumpel, H.-M.,
Scheer, W. & Wiederhold, H. (eds): BurVal Working Group: Groundwater re-
sources in buried valleys – a challenge for geosciences. Bonifatius GmbH
(Hannover): 227–240.
Rumpel, H.-M., Binot, F., Gabriel, G., Siemon, B., Steuer, A. & Wiederhold,
H., 2009. The benefit of geophysical data for hydrogeological 3D modelling
- an example using the Cuxhaven buried valley. Zeitschrift der deutschen
Gesellschaft fur Geowissenschaften 160(3): 259–269.
Rundberg, Y. & Smalley, P.C., 1989. High-resolution dating of Cenozoic sedi-
ments from the northern North Sea using 87Sr/86Sr stratigraphy. AAPG Bul-
letin 73: 298–308.
Russell, H.A.J., Brennand, T.A., Logan, C. & Sharpe, D.R., 1998. Standardization
and assessment of geological descriptions from water well records, Greater
26

Netherlands Journal of Geosciences — Geologie en Mijnbouw
Toronto and Oak Ridge Moraine areas, southern Ontario. In: Current Research,
part E, Geological Survey of Canada, Paper 1998-E: 89–102.
Sandersen, P.B.E. & Jørgensen, F., 2003. Buried Quaternary valleys in western
Denmark – occurrence and inferred implications for groundwater resources
and vulnerability. Journal of Applied Geophysics 53: 229–248.
Scheck-Wenderoth, M. & Lamarche, J., 2005. Crustal memory and basin evolution
in the Central European Basin System-new insights from a 3D structural model.
Tectonophysics 397: 143–165.
Sengpiel, K.-P. & Siemon, B., 2000. Advanced inversion methods for airborne
electromagnetics. Geophysics 65: 1983–1992.
Siemon, B., 2001. Improved and new resistivity-depth profiles for helicopter
electromagnetic data. Journal of Applied Geophysics 46: 65–76.
Siemon, B., 2005. Ergebnisse der Aeroelektromagnetik zur Grundwassererkun-
dung im Raum Cuxhaven-Bremerhaven. Zeitschrift fur Angewandte Geologie
1: 7–13.
Siemon, B., Stuntebeck, C., Sengpiel, K.-P., Rottger, B., Rehli, H.-J. & Eberle,
D., 2002. Characterisation of hazardous waste sites using the BGR helicopter-
borne geophysical system. Journal of Environmental and Engineering Geo-
physics 7: 169–181.
Siemon, B., Eberle, D.G. & Binot, F., 2004. Helicopter-borne electromagnetic
investigation of coastal aquifers in North-West Germany. Zeitschrift fur geol-
ogische Wissenschaften 32: 385–395.
Siemon, B., Christiansen, A.V. & Auken, E., 2009a. A review of helicopter-
borne electromagnetic methods for groundwater exploration. Near Surface
Geophysics 7: 629–646.
Siemon, B., Auken, E. & Christiansen, A.V., 2009b. Laterally constrained inver-
sion of helicopter-borne frequency-domain electromagnetic data. Journal of
Applied Geophysics 67: 259–268.
Siemon, B., Steuer, A., Ullmann, A., Vasterling, M. & Voß, M., 2011. Applica-
tion of frequency-domain helicopter-borne electromagnetics for groundwater
exploration in urban areas. Physics and Chemistry of the Earth 36: 1373–1385.
Sørensen, K. & Auken, E., 2004. SkyTEM - a new high-resolution helicopter
transient electromagnetic system. Exploration Geophysics 35: 191–199.
Sørensen, J.C., Gregersen, U., Breiner, M. & Michelsen, O., 1997. High-frequency
sequence stratigraphy of Upper Cenozoic deposits in the central and south-
eastern North Sea areas. Marine and Petroleum Geology 14(2): 99–123.
Stackebrandt, W., 2009. Subglacial channels of Northern Germany – a brief re-
view. Zeitschrift der deutschen Gesellschaft fur Geowissenschaften 160(3):
203–210.
Steuer, A., 2008. Joint application of ground based transient electromagnetics
and airborne electromagnetics. PhD thesis, University of Cologne (Cologne).
Steuer, A., Siemon, B. & Auken, E., 2009. A comparison of helicopter-borne
electromagnetics in frequency- and time-domain at the Cuxhaven valley in
Northern Germany. Journal of Applied Geophysics 67: 194–205.
Stoker, M.S., Hoult, R.J., Nielsen, T., Hjelstuen, B.O., Laberg, J.S., Shannon,
P.M., Praeg, D., Mathiesen, A., Weering, T.C.E. van & McDonnell, A., 2005a.
Sedimentary and oceanographic responses to early Neogene compression on
the NW European margin. Marine Petroleum Geology 22: 1031–1044.
Stoker, M.S., Praeg, D., Hjelstuen, B.O., Laberg, J.S., Nielsen, T. & Shannon,
P.M., 2005b. Neogene stratigraphy and the sedimentary and oceanographic
development of the NW European Atlantic margin. Marine Petroleum Geology
22: 977–1005.
Streif, H., 2004. Sedimentary record of Pleistocene and Holocene marine inun-
dations along the North Sea coast of Lower Saxony, Germany. Quaternary
International 112(1): 3–28.
Tezkan, B., Mbiyah, M.H., Helwig, S.L. & Bergers, R., 2009. Time domain elec-
tromagnetic (TEM) measurements on a buried subglacial valley in Northern
Germany by using a large transmitter size and a high current. Zeitschrift der
deutschen Gesellschaft fur Geowissenschaften 160(3): 271–278.
Thole, H., Gaedicke, C., Kuhlmann, G. & Reinhardt, L., 2014. Late Cenozoic
sedimentary evolution of the German North Sea – A seismic stratigraphic
approach. Newsletters on Sratigraphy 47(3): 299–329.
Tølbøll, R.J., 2007. The application of frequency-domain helicopter-borne electro-
magnetic methods to hydrogeological investigations in Denmark. PhD thesis,
Department of Earth Sciences, University of Aarhus (Aarhus).
van der Vegt, P., Janszen, A. & Moscariello, A., 2012. Glacial tunnel valleys
– current knowledge and future perspectives. In: Huuse, M., Redfern, J.,
Le Heron, D.P., Dixon, R.J., Moscariello, A. & Craig, J. (eds): Glaciogenic
Reservoirs and Hydrocarbon Systems, Special Publications 368, Geological
Society (London): 75–97.
Venteris, E.R., 2007. Three-dimensional modeling of glacial sediments using pub-
lic water-well data records: an integration of interpretive and geostatistical
approaches. Geospheres 3: 456–468.
Viezzoli, A., Christiansen, A.V., Auken, E. & Sørensen, K., 2008. Quasi-3D mod-
eling of airborne TEM data by spatially constrained inversion. Geophysics
73(3): F105–F113.
Walker, R.G. & Plint, A.G., 1992. Wave and storm-dominated shallow marine
systems. In: Walker, R.G. & James, N.P. (eds): Facies Models: Response
to Sea Level Change. Geological Association of Canada (St John’s): 219–
238.
Wellmann, J.F. & Regenauer-Lieb, K., 2012. Effect of geological data qual-
ity on uncertainties in geological model and subsurface flow fields. PRO-
CEEDINGS, Thirty-Seventh Workshop on Geothermal Reservoir Engineer-
ing Stanford University, Stanford, California, January 30–February 1, 2012
SGP-TR-194.
West, G.F. & Macnae, J.C., 1991. Physics of the electromagnetic induction ex-
ploration method. In: Nabighian, M.N. & Corbett, J.D. (eds): Electromagnetic
methods in applied geophysics. Investigations in geophysics, Society of Ex-
ploration Geophysicists 2: 5–45.
Wiederhold, H., Binot, F. & Kessels, W., 2005a. Die Forschungsbohrung Cuxhaven
und das ,,Coastal Aquifer Testfield (CATField)“ – ein Testfeld fur angewandte
geowissenschaftliche Forschung. Zeitschrift fur Angewandte Geologie 1: 3–5.
Wiederhold, H., Gabriel, G. & Grinat, M., 2005b. Geophysikalische Erkundung der
Bremerhaven-Cuxhavener Rinne im Umfeld der Forschungsbohrung Cuxhaven.
Zeitschrift fur Angewandte Geologie 1: 28–38.
Wingfield, R., 1990. The origin of major incisions within the Pleistocene deposits
of the North Sea. Marine Geology 91: 31–52.
Yilmaz, O., 2001. Seismic data analysis: processing, inversion and interpretation
of seismic data. Society of Exploration Geophysicists (Tulsa): 2027 pp.
Zachos, J., Pagani, M., Sloan, L., Thomas, E. & Billups, K., 2001. Trends,
rhythms, and aberrations in global climate 65 Ma to present. Science 292:
686–693.
Zhdanov, M.S., 2010. Electromagnetic geophysics: notes from the past and the
road ahead. Geophysics 75(5): 75A49–75A66.
27
Recommended