Towards competitive seed systems serving smallholder farmers.
Pilot Report presented by
Ed Mabaya, Ph.D.
Cornell International Institute for Food, Agriculture, and Development (CIIFAD)
Copyright © 2015, The African Seed Access Index TASAI March 2015

AGRICULTURE IS KEY TO AFRICA’S DEVELOPMENT
§ Africa has 33 million family farms of less than 2 hectares, accounting for 80% of farms (NEPAD, 2013).
§ Agriculture employs 65% of Africa’s labor force and accounts for 32% of gross domestic product (World Bank, 2014).
§ Agriculture is essential for sub-Saharan Africa’s growth and for achieving the Millennium Development Goal of halving poverty by 2015 (World Bank, 2014).
§ Agricultural productivity in Africa is very low and has not kept pace with population growth (NEPAD, 2013).
§ “Africa holds the key to humanity’s future, and agriculture holds the key to Africa’s future” (Strive Masiyiwa - Chairman of the Board of AGRA, 2014)
Copyright © 2015, The African Seed Access Index TASAI March 2015

THE CASE FOR IMPROVED SEED § Quality seed of improved varieties (hereafter called improved seeds)
deliver state of the art technology to farmers: higher yields, disease and pest resistance, climate change adaptation, improved nutrition, longer shelf life, etc.
§ Improved seed is highly compatible with other agricultural technologies and farming techniques.
§ All else constant, improved seed (e.g. hybrid maize) can increase farmer yield by over 40% compared to traditional landraces.
§ Improved seed does not require much technical expertise to utilize.
Copyright © 2015, The African Seed Access Index TASAI March 2015

WHAT IS TASAI?
§ The African Seed Access Index (TASAI) monitors 16 variables that are essential to the development of a national seed sector.
§ TASAI gives an annual scorecard on the vibrancy or competitiveness of a national seed sector.
§ TASAI is useful to government policy makers, development agencies, seed companies, seed sector investors and ultimately farmers.
Copyright © 2015, The African Seed Access Index TASAI March 2015

TASAI CONTEXT
§ In most African countries, formal seed systems are still developing.
§ Historically, formal seed systems in Africa have been dominated by government parastatals.
§ Over the last two decades, formal seed systems have been gradually liberalized resulting in increased participation of private seed enterprises (multinationals, regional and domestic companies).
§ In most African countries, the public sector enables, hinders and competes with private sector.
§ By comparing the various aspects of the enabling environments, African countries can learn best practices from each other and monitor progress.
Copyright © 2015, The African Seed Access Index TASAI March 2015

TASAI OBJECTIVE
To encourage African governments and development agencies to create and maintain enabling environments that will accelerate the development of competitive seed systems serving smallholder farmers.
Copyright © 2015, The African Seed Access Index TASAI March 2015

TASAI PRINCIPLES
§ Simplicity: The index is computed and reported in a way that allows easy interpretation without sacrificing rigour.
§ Accuracy: All data and information used in the index is accurate and cross-checked from multiple sources.
§ Transparency: We welcome any inquiries and updates to our data and information.
Copyright © 2015, The African Seed Access Index TASAI March 2015

TASAI INDICATORS A. RESEARCH AND DEVELOPMENT Impact on
seed access 1 Number of active breeders + 2 Varieties released in last 3 years + 3 Availability of foundation seed +
B. INDUSTRY COMPETITIVENESS 4 Number of active crop seed companies + 5 Time it takes to import/export seed from neighboring countries -‐ 6 Market share of top 1,2,3,4 companies -‐ 7 Market share of current or past government parastatal -‐
C. SERVICE TO SMALLHOLDER FARMERS 8 Concentration of rural agro-dealer network + 9 Availability of seed in small packages +
D. SEED POLICY AND REGULATIONS 10 Length of variety release process -‐ 11 Quality of seed policy framework + 12 Quality of regulatory and enforcement system + 13 Adequacy of seed inspectors + 14 Efforts to stamp out fake seed +
E. INSTITUTIONAL SUPPORT 15 Availability of extension services for smallholder farmers + 16 Quality of national seed trade association +

INDUSTRY SCORING OF INDICATOR IMPORTANCE
Copyright © 2015, The African Seed Access Index TASAI March 2015

TASAI THEORY OF CHANGE
Copyright © 2015, The African Seed Access Index TASAI March 2015
• Number of active breeders
• Varieties released in last 3 years • Availability of foundation seed • Length of variety release process • Quality of seed policy framework • Quality of regulations and enforcement • Adequacy of seed inspectors • Efforts to stamp out fake seed • Extension services to smallholder farmers • Quality of national seed trade association
Enabling Environment
• Number of active seed companies
• Market share of top companies
• Market share of current or past government parastatal
Increased Competition • Concentration of
rural agro-dealers • Availability of seed
in small packages • Adoption rate for
improved seed
Improved Seed Access
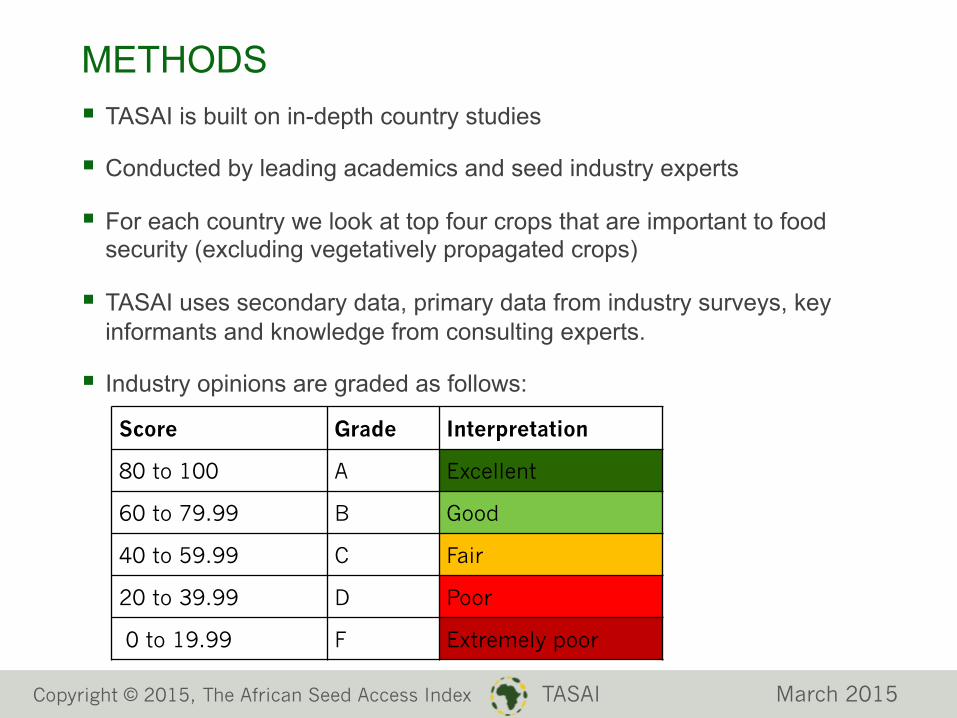
METHODS § TASAI is built on in-depth country studies
§ Conducted by leading academics and seed industry experts
§ For each country we look at top four crops that are important to food security (excluding vegetatively propagated crops)
§ TASAI uses secondary data, primary data from industry surveys, key informants and knowledge from consulting experts.
§ Industry opinions are graded as follows:
Score Grade Interpretation
80 to 100 A Excellent
60 to 79.99 B Good
40 to 59.99 C Fair
20 to 39.99 D Poor
0 to 19.99 F Extremely poor
Copyright © 2015, The African Seed Access Index TASAI March 2015

PILOT COUNTRY PROFILES
Kenya South Africa Uganda Zimbabwe
Focus crops Maize Sorghum Beans Cowpeas
Maize Soybean Sunflower Wheat
Maize Beans Millet Sorghum
Maize Cotton Soybean Sorghum
Population (Million) 43 51 36 13
Size (KM2) 569,250 1,214,470 197,100 390,760
Arable land (Million Ha) (% of size)
4.89 (9%)
14.8 (12%)
5.30 27%
3.58 (9%)
Ease of doing business rank (Rank out of 180) 136 43 150 171
Stage of Seed Sector development Growth Mature Growth Decline
Average Maize Yield (T/Ha) 1.67 4.2 2.50 1.04
Copyright © 2015, The African Seed Access Index TASAI March 2015

A. RESEARCH AND DEVELOPMENT 1: Number of active breeders
2: Varieties released in last 3 years
3: Availability of foundation seed
Copyright © 2015, The African Seed Access Index TASAI March 2015
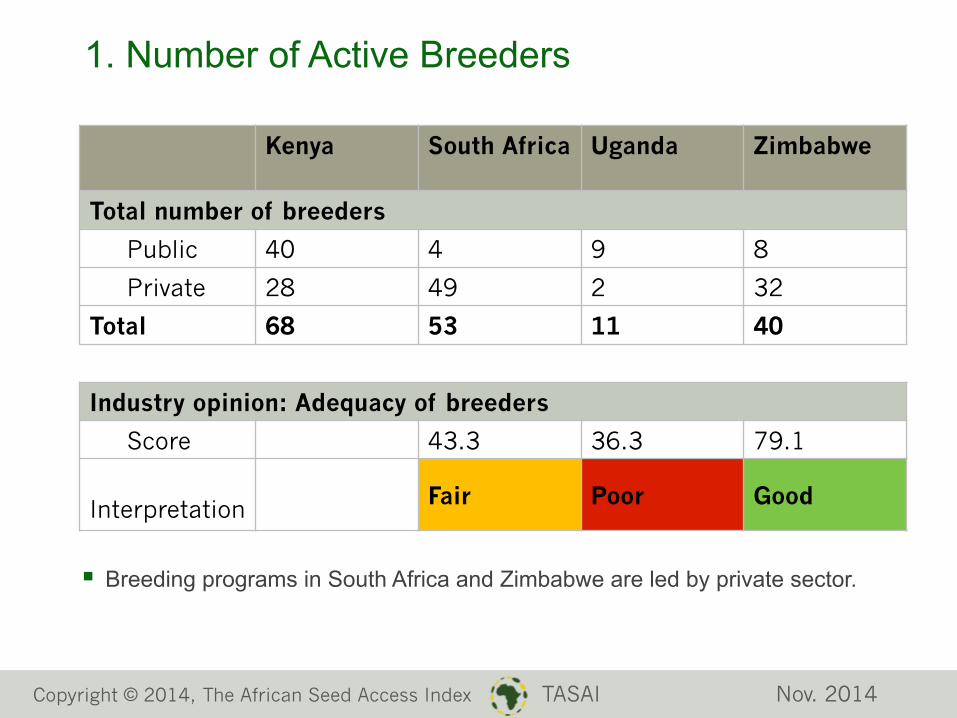
1. Number of Active Breeders
§ Breeding programs in South Africa and Zimbabwe are led by private sector.
Kenya South Africa Uganda Zimbabwe
Total number of breeders
Public 40 4 9 8
Private 28 49 2 32
Total 68 53 11 40
Industry opinion: Adequacy of breeders
Score 43.3 36.3 79.1
Interpretation Fair Poor Good
Copyright © 2014, The African Seed Access Index TASAI Nov. 2014

2. Varieties Released in the Last 3 Years (2011-2013)
Copyright © 2015, The African Seed Access Index TASAI March 2015
Kenya South Africa Uganda Zimbabwe
Crop 1 Maize 35 Maize 221 Maize 12 Maize 28
Crop 2 Sorghum 15 Soybean 26 Beans 7 Co6on 1
Crop 3 Beans 10 Sunflower 37 Millet 0 Soybean 3
Crop 4 Cowpeas 0 Wheat 26 Sorgh 0 Sorghum 3
Total 60 310 19 35
3 yr avg 20 103 6.3 11.7
§ South Africa released almost 3 fold the number of varieties than the other three countries combined.
§ More investment in maize and minimal activity with 2nd, 3rd and 4th crop

3. Availability of Foundation Seed (Industry opinion – score out of 100)
§ Seed companies in South Africa and Zimbabwe maintain their own foundation seed, as well as many companies in Kenya.
§ Companies in Kenya and Uganda that rely on public institutions for foundation seed gave much lower scores.
Copyright © 2015, The African Seed Access Index TASAI March 2015
Kenya South Africa Uganda Zimbabwe
Crop 1 Maize 67 Maize 100 Maize 68 Maize 97
Crop 2 Sorghum 65 Soybean 100 Beans 50 Co6on 100
Crop 3 Beans 62 Sunflowr 100 Millet 18 Soybean 100
Crop 4 Cowpeas 51 Wheat 65 Sorghum 35 Sorghum 100
Average 61.3 91.3 42.8 99.3
Interpretation Good Excellent Fair Excellent
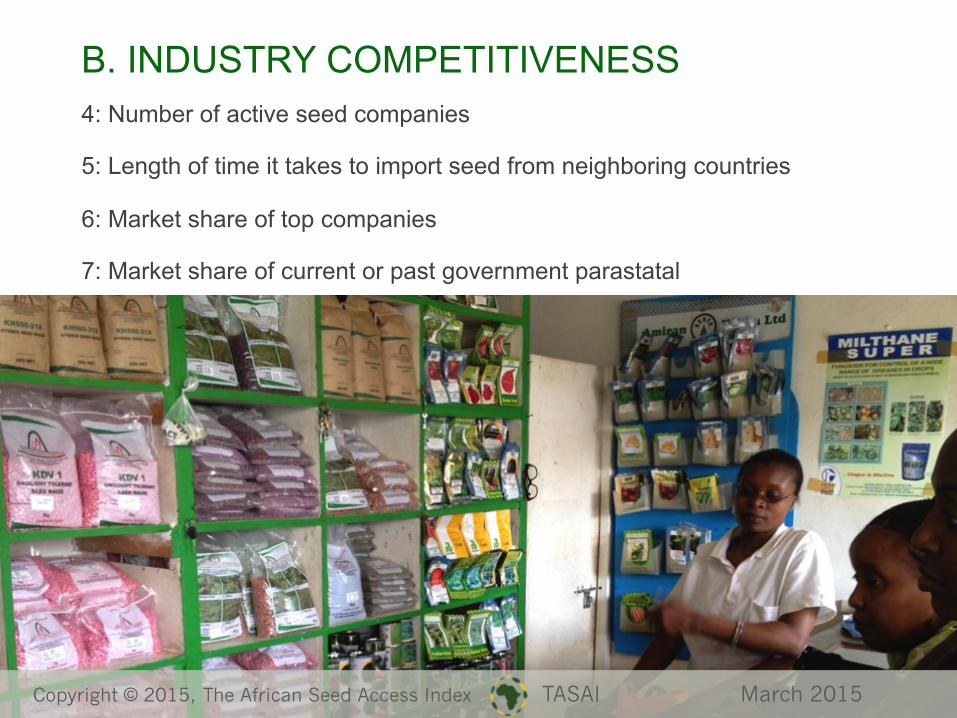
B. INDUSTRY COMPETITIVENESS 4: Number of active seed companies
5: Length of time it takes to import seed from neighboring countries
6: Market share of top companies
7: Market share of current or past government parastatal
Copyright © 2015, The African Seed Access Index TASAI March 2015
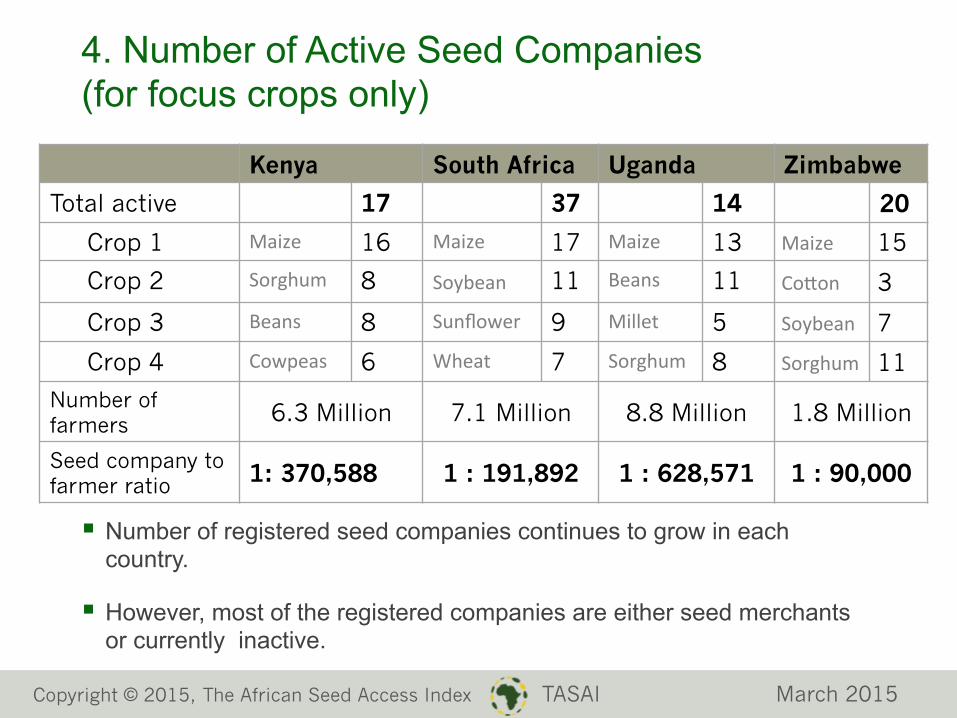
4. Number of Active Seed Companies (for focus crops only)
Copyright © 2015, The African Seed Access Index TASAI March 2015
Kenya South Africa Uganda Zimbabwe
Total active 17 37 14 20
Crop 1 Maize 16 Maize 17 Maize 13 Maize 15
Crop 2 Sorghum 8 Soybean 11 Beans 11 Co6on 3
Crop 3 Beans 8 Sunflower 9 Millet 5 Soybean 7
Crop 4 Cowpeas 6 Wheat 7 Sorghum 8 Sorghum 11
Number of farmers 6.3 Million 7.1 Million 8.8 Million 1.8 Million
Seed company to farmer ratio 1: 370,588 1 : 191,892 1 : 628,571 1 : 90,000
§ Number of registered seed companies continues to grow in each country.
§ However, most of the registered companies are either seed merchants or currently inactive.

5. Time it Takes to Import/Export Seed from Neighboring Countries
Copyright © 2015, The African Seed Access Index TASAI March 2015
Kenya South Africa Uganda Zimbabwe
Average number of days for seed import/export
Import seed 26 38 48 12
Export seed 12 No data 18 12
Industry opinion: Satisfaction with seed import process
Avg. Score 58.9 68.7 55.0 68.0
Interpretation Fair Good Fair Good

6. Market Share of Top Companies - Kenya
Copyright © 2015, The African Seed Access Index TASAI March 2015
80%
5%
4% 3%
8%
Maize Seed
A
G
H
I
Other
31%
28%
12%
10%
19%
Sorghum Seed
E
A
D
J
Other
49%
22%
17%
7% 5%
Bean Seed
B
D
C
A
Other
48%
22%
16%
14% 0%
Cowpea Seed
C
F
D
B
Other

6. Market Share of Top Companies - South Africa
Copyright © 2015, The African Seed Access Index TASAI March 2015
30%
30%
25%
8%
7%
Maize Seed
A
C
B
D
Other
55%
20%
10%
10% 5%
Soybean Seed
B
C
D
E
Other
40%
18%
18%
15%
9%
Sunflower Seed
B
G
D
C
Other 64%
24%
12% 0%
Wheat Seed
H
B
F
Other

6. Market Share of Top Companies - Uganda
Copyright © 2015, The African Seed Access Index TASAI March 2015
22%
20%
20%
15%
23%
Maize Seed
A
B
E
C
Other
20%
15%
15% 10%
40%
Bean Seed
A
B
C
D
Other
25%
20%
15%
10%
30%
Sorghum Seed
C
B
A
D
Other
30%
10%
5% 5%
50%
Millet Seed
C
A
E
B
Other

6. Market Share of Top Companies - Zimbabwe
Copyright © 2015, The African Seed Access Index TASAI March 2015
47%
16%
13%
10%
14%
Maize Seed
A
B
C
D
Other 100%
Cotton Seed
E
67%
30%
2% 1%
Soybean Seed
A
C
G
Other
39%
35%
16%
5% 5%
Sorghum Seed
D
F
H
G
Other

Herfindahl-Hirschman Index H4 Index: Key crops per country
Extremely Poor
Poor
Fair
Good
Excellent
Copyright © 2015, The African Seed Access Index TASAI March 2015
0
1000
2000
3000
4000
5000
6000
7000
8000
9000
10000
Maize Soybean Sunflower Wheat Beans Sorghum Millet Cowpeas Cotton
Kenya South Africa Uganda Zimbabwe

7. Market Share of Current or Past Government Parastatal
Kenya South Africa Uganda Zimbabwe
Crop 1 Maize 79.4% Maize 0 Maize 0 Maize 3.0%
Crop 2 Sorghum 34.4% Soybean 0 Beans 0 Co6on 0
Crop 3 Beans 73.6% Sunflow 0 Millet 0 Soybean 2.3%
Crop 4 Cowpeas 62.0% Wheat 0 Sorghum 0 Sorghum 4.7%
Average 62.4 0 0 2.5
Interpretation
Poor Excellent Excellent Excellent
§ Simple averages above do not reflect the dominance of maize seed.
§ Parastatals in Zimbabwe only supply seed to government farms and development programs.
Copyright © 2015, The African Seed Access Index TASAI March 2015

C. SERVICE TO SMALLHOLDER FARMERS 8: Concentration of rural agro-dealer network
9: Availability of seed in small packages (less than 5kg for maize)
Copyright © 2015, The African Seed Access Index TASAI March 2015

8. Concentration of Rural Agro-dealer Network (Industry opinion – score out of 100)
Kenya South Africa Uganda Zimbabwe
Crop 1 Maize Maize 64.3 Maize Maize 75.7
Crop 2 Sorghum Soybean 50.6 Beans Co6on 80.0
Crop 3 Beans Sunflwr 55.6 Millet Soybean 61.4
Crop 4 Cowpeas Wheat 49.4 Sorghum Sorghum 63.6
Average 55.0 49.0 70.2
Interpretation
Missing data Fair Fair Good
Copyright © 2015, The African Seed Access Index TASAI March 2015
§ For Kenya, the Seed Sector Platform (www.seedsectorplatformkenya.com) lists over 6,700 agro-dealer shops, many of which are licensed by KEPHIS. It is estimated that there are over 12,000 agricultural input stockists in total, but many of these are not licensed.

9. Availability of Seed in Small Packages
* Maize seed in South Africa is mostly sold by kernel count – usually 60K, 80K or 180K.
Kenya South Africa* Uganda Zimbabwe
Percent volume of seed sold in under 5kg packages
Crop 1 Maize 89.1 Maize 10 Maize 21.7 Maize 10.5
Crop 2 Sorghum 88.5 Soybean 0 Beans 36.1 Co6on 0
Crop 3 Beans 100 Sunflwr 0 Millet 55.0 Soybean 0
Crop 4 Cowpeas 100 Wheat 0 Sorghum 3.4 Sorghum 20.9
Average 94.4 2.5 29.1 7.8
Industry opinion: Score of availability of seed in small packages
Score 30.8 50.0 63.4 Interpretation
Excellent Poor Fair Good
Copyright © 2015, The African Seed Access Index TASAI March 2015

D. SEED POLICY AND REGULATIONS 10: Variety release process
11: Quality of seed policy framework
12: Quality of regulatory and enforcement system
13: Adequacy of seed inspectors
14: Efforts to stamp out fake seed
Copyright © 2015, The African Seed Access Index TASAI March 2015

10. Variety Release Process
Kenya South Africa
Uganda Zimbabwe
Time taken to release a variety (months)
Minimum 12 12 24 12
Maximum 60 24 60 24
Std dev 8.6 2.0 -- 4.2
Average 37 12 37 22
Industry opinion: Satisfaction with expediency of variety release process
Score 32.7 81 55.8 92.2
Interpretation
Poor Excellent Fair Excellent
Copyright © 2015, The African Seed Access Index TASAI March 2015

11. Quality of Seed Policy Framework (Industry opinion – score out of 100)
Kenya South Africa
Uganda Zimbabwe
Minimum 0 70 10 20
Maximum 100 100 100 100
Std dev 23.2 9.6 24.6
Average (Mean) 65.2 82.7 47.0 65.5
Interpretation Good Excellent Fair Good
Copyright © 2015, The African Seed Access Index TASAI March 2015

12. Quality of Seed Regulations and Enforcement System
Kenya South Africa
Uganda Zimbabwe
Industry opinion: Quality of seed law / regulations
Score 60.9 70.0 44.2 87.3
Interpretation Good Good Fair Excellent
Industry opinion: Quality of enforcement systems
Score 53.1 70.0 41.4 83.0
Interpretation Fair Good Fair Excellent
Copyright © 2015, The African Seed Access Index TASAI March 2015

13. Adequacy Of Seed Inspectors Kenya South
Africa Uganda Zimbabwe
Seed Inspectors by sector
Private 0 121* 0 44
Public 60 27 4 24
Total 60 148 4 68
Industry opinion: Satisfaction with adequacy of seed inspectors
Score 63.8 N/A* 43.5 82.3
Interpretation Good N/A* Fair Excellent
Copyright © 2015, The African Seed Access Index TASAI March 2015
§ Number of seed field inspectors is much lower as most inspectors work on import and phytosanitary issues.
§ *Most seed companies in South Africa have in-house inspectors that are certified by SANSOR.

14. Efforts to Stamp Out Fake Seed
Kenya South Africa
Uganda Zimbabwe
Number of fake seed cases in past 3 years
Total 36 17 No record 41
Industry opinion: Satisfaction with efforts to stamp out fake seed
Score 38.5 60.0 40.6 66.9
Interpretation Poor Good Fair
(almost poor) Good
Copyright © 2015, The African Seed Access Index TASAI March 2015
§ Number of cases is likely to be much higher as most cases are not reported and/or recorded.

E. INSTITUTIONAL SUPPORT 15: Extension services for smallholder farmers
16: Presence and quality of national seed trade association
Copyright © 2015, The African Seed Access Index TASAI March 2015

15. Extension Services Kenya South Africa Uganda Zimbabwe
Extension officers by sector
Private Unknown Unknown 700 Unknown
Public 6300 2155 2800 6000
Total 6300+ 2155+ 3500 6000+
Number of Farmers
6.3 Million 7.1 Million 8.8 Million 1.8 Million
Extension officer to farmer ratio 1 : 1000 1 : 3313 1 : 3140 1 : 300
Industry opinion: Satisfaction with availability of extension services
Score 35.2 45.0 63.6
Interpretation No data Poor Fair Good
Copyright © 2015, The African Seed Access Index TASAI March 2015
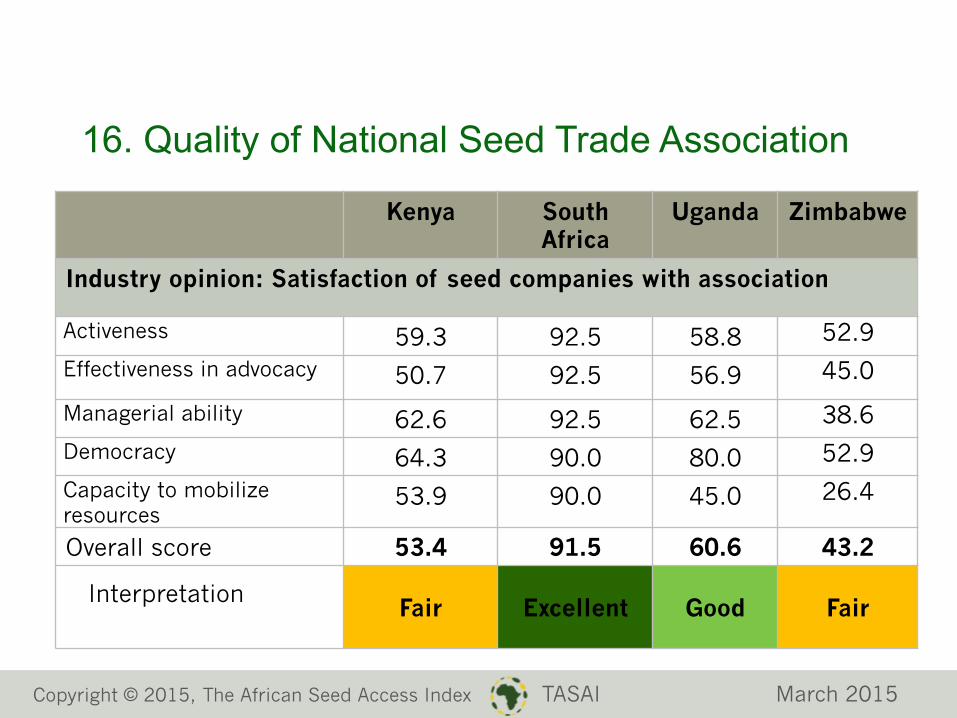
16. Quality of National Seed Trade Association
Kenya South Africa
Uganda Zimbabwe
Industry opinion: Satisfaction of seed companies with association
Activeness 59.3 92.5 58.8 52.9
Effectiveness in advocacy 50.7 92.5 56.9 45.0
Managerial ability 62.6 92.5 62.5 38.6
Democracy 64.3 90.0 80.0 52.9
Capacity to mobilize resources
53.9 90.0 45.0 26.4
Overall score 53.4 91.5 60.6 43.2
Interpretation Fair Excellent Good Fair
Copyright © 2015, The African Seed Access Index TASAI March 2015

EMERGING LESSONS
§ Seed sector in Africa is dynamic and moving towards liberalization.
§ Public sector has a very critical role to play in creating and maintaining an enabling environments – private sector cannot do it alone.
§ Some correlation on performance measures within category but significant variation across categories (enough good news and bad news for every country).
§ African countries can learn a lot from each other.
Copyright © 2015, The African Seed Access Index TASAI March 2015

NEXT STEPS
§ Refine methods
§ Roll out to more countries
§ Update regularly
§ Disseminate widely
Copyright © 2015, The African Seed Access Index TASAI March 2015

Website: www.tasai.org
Email: [email protected]
Follow us on Twitter: @TASAIndex
Like us on Facebook: The African Seed Access Index
Recommended