Tropospheric ozone columns from TROPOMI and BASCOE
K.-P. Heue1, D. Loyola1, W. Zimmer1, S. Chabrillat2, Q. Errera2,
1) Institut für Methodik der Fernerkundung am Deutschen Zentrum für Luft- und Raumfahrt (DLR), Germany
2) Koninklijk Belgisch Instituut voor Ruimte-Aeronomie / Institut royal d'Aéronomie Spatiale de Belgique, Belgium
CEOS AC-VC 16, June 10, 2020

Overview Method
DLR research product: S5P-BASCOE/MLS tropospheric column Combine the operational Copernicus S5P total columns with BASCOE/MLS
Sonde based validation
Results
Global Northern America Central Africa South America Europe

Method Tropospheric O3
TROPOMI NRTI total ozone column
TROPOMI Total ozone columns for cloud free observation (cloud fraction < 0.2) for one day

Method Tropospheric O3
TROPOMI NRTI total ozone column TROPOMI Total ozone columns
for cloud free observation for one day gridded
BASCOE/MLS stratospheric ozone mixing ratios and
tropopause pressure
Integrate mixing ratio above tropopause
Interpolate linear in time and place to S5P observations
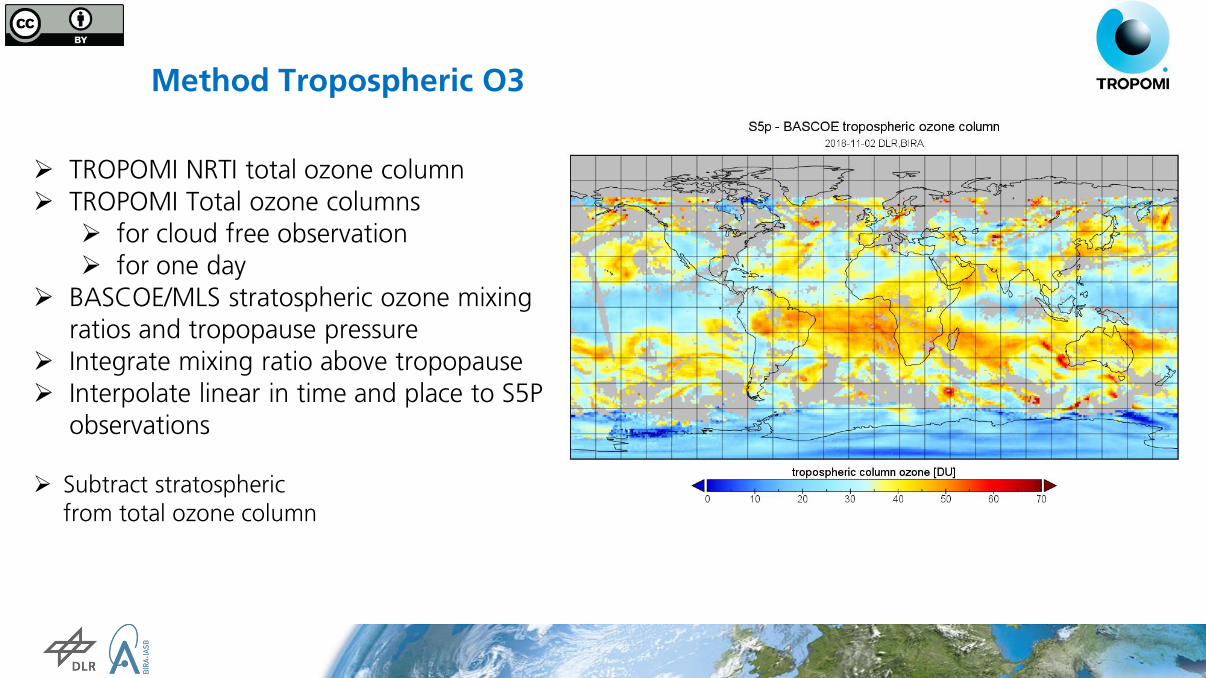
Method Tropospheric O3
TROPOMI NRTI total ozone column TROPOMI Total ozone columns
for cloud free observation for one day
BASCOE/MLS stratospheric ozone mixing ratios and tropopause pressure
Integrate mixing ratio above tropopause Interpolate linear in time and place to S5P
observations
Subtract stratospheric from total ozone column

Sondebased Validation (I)
S5P BASCOE Daily tropospheric ozone data and tropopause height
Integrate sonde data up to Tropopause level
Mean of TROPOMI tropospheric ozone within 100km around the station
Closest Measurement to station

Sonde based Validation (II)
Mean Validation for April 2018 to October 2019 - highest number of sonde data in
Northern mid-latitude - Mostly positive bias - Largest deviations in polar regions
Thanks to all the PIs of the Soundings stations for providing the data to SHADOZ and to the World Ozone and Ultraviolet Radiation Data Centre

Example results
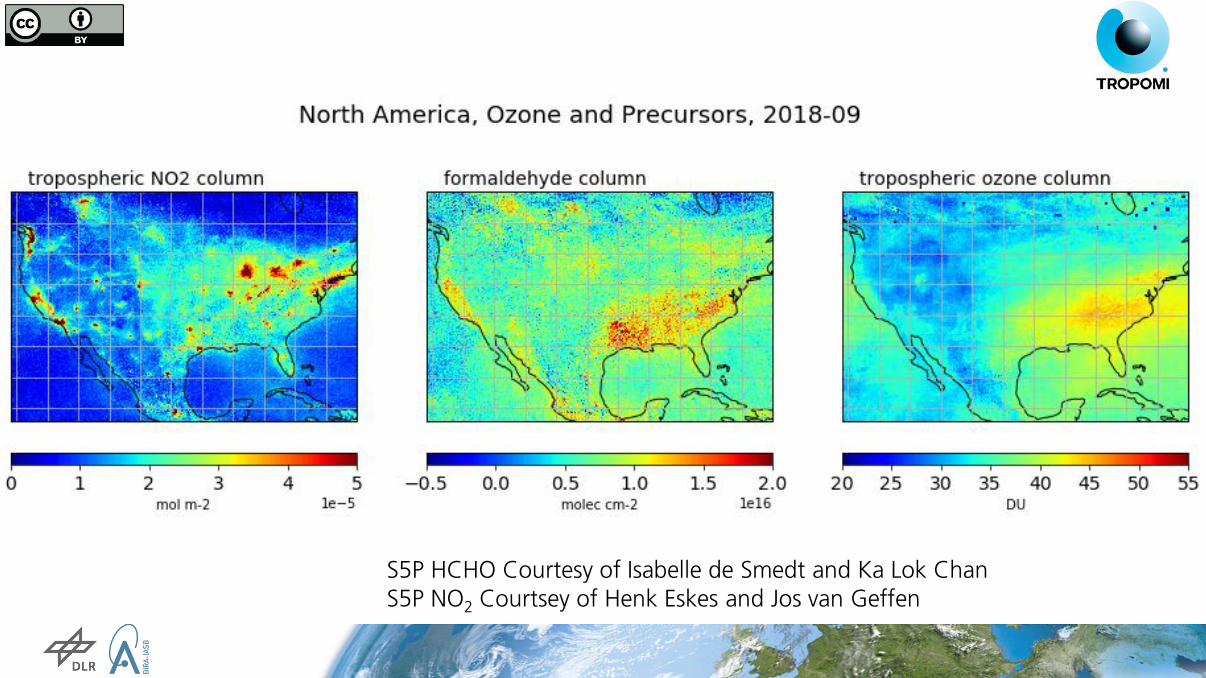
S5P HCHO Courtesy of Isabelle de Smedt and Ka Lok Chan S5P NO2 Courtsey of Henk Eskes and Jos van Geffen
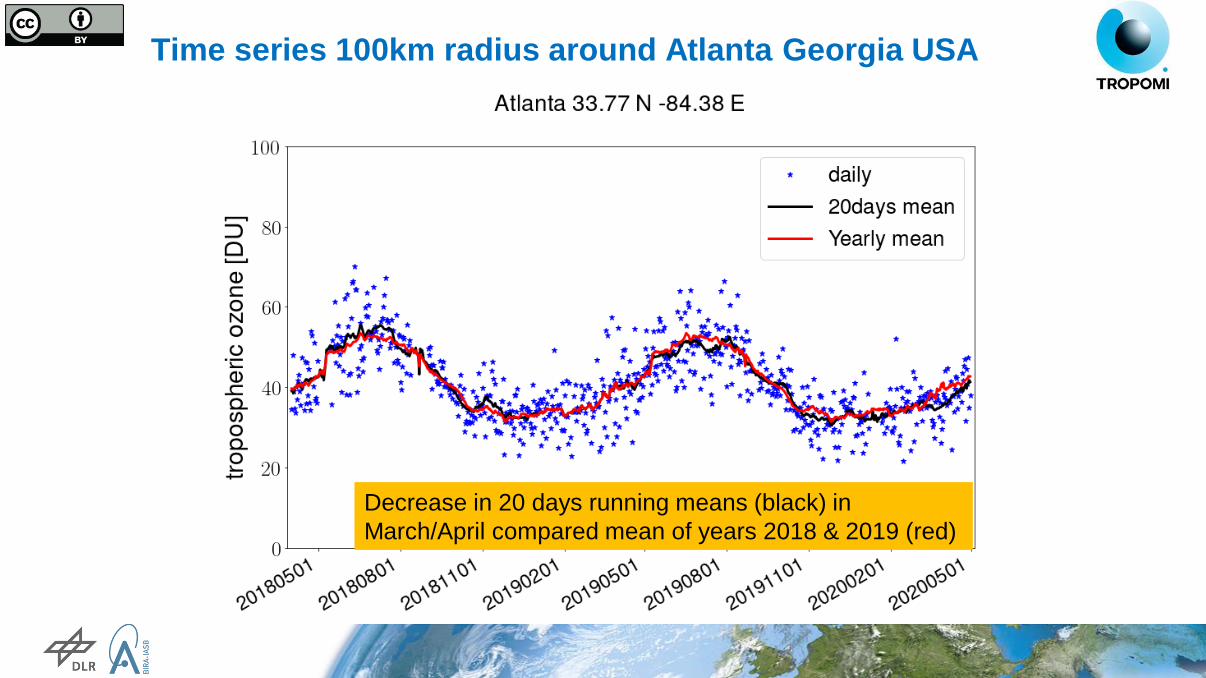
Time series 100km radius around Atlanta Georgia USA
Decrease in 20 days running means (black) in
March/April compared mean of years 2018 & 2019 (red)

Central Africa September 2018 and 2019
2018
2019

2018
2019

Europe and Mediterranean Sea in August

Decrease in 20 days running means (black) in
March/April compared mean of years 2018 & 2019 (red)
averaged over 100 km around the centre (Notre Dame)

Time series Europe

Conclusion
S5P BASCOE/MLS tropospheric ozone retrieval works fine
Bias with respect to soundings is partially caused by the albedo and the total column
High tropospheric ozone columns were observed over
South eastern US – transport to the east Atlantic
Mediterranean Sea
Correlations between NO2, HCHO and Tropospheric O3 for Africa and South America
Decrease in March/April around many cities
Corona virus effect? To be further investigated
Acknowledgment This analysis contains modified Copernicus Sentinel-5 Precursor data (2018-2020) processed by DLR.


Sondebased Validation (III)

East Asia September

Recommended