Windows Performance Monitor
Troubleshooting Guide
Document Owner - Support
Version Control – Alan Davis
Author – John Nuttall

Windows Performance counter troubleshooting guide
This document is designed to give an understanding of Windows performance counters and how they are
leveraged by Kaseya. Should you experience issues with results returned by Kaseya the following guide will
assist in diagnosing the problem.
1. On the target machine load “perfmon.exe”. Start -> Run -> “perfmon.exe”.
2. By default, this should be running, with “pages/sec”, “Avg. Disk Queue” and “%processor”. Ensure
that these are running. If they are not, it may indicate a problem with the counters on the system.

3. If you do not see them running, click the + symbol at the top of the window and add a counter,
ideally one that you are trying to monitor from Kaseya. In some circumstances perfmon will show no
counters available, or a long list of numbers. If you see this then you will need to correct the
situation. This is not a kaseya problem, but an error with Windows that will need to be corrected
before Kaseya is able to monitor this machine.

4. Expand the “performance Logs and Alerts”, and click the “Counter Logs”.
5. All the log names should be green. Green means that the counter log is running and successfully
collecting data.
6. Check the log location section looks correct.
7. NB. Windows will not allow performance counters to be saved in c:\windows\system32 or any
subdirectory. If the “Log Location” is set to such a directory, the counters will never start. To change
the directory used, go to the agent tab -> temp directory function in the kaseya interface.
8. If any of the log names are red, then there is a problem with that counter.

9. Right click on the red counter and select “start”. If there is a problem, you will see an error telling
you to check the application event logs. See below.
• The application event log will explain why Windows was not able to start the counter.
• Your expertise will be required to find out what is causing problems with Windows at this
point. As mentioned earlier, Kaseya is using the performance counters from windows, as
does perfmon. If perfmon is not able to run, then Kaseya will see the same problem.

10. If the counters are all green, go to the log location and open these CSV files – see what they
contain. Typically they will just be columns of numbers – the counter information that you have
requested.
13. You can see the counter information at the top, with the values below. Ensure that this
information looks correct – if you are monitoring “Available RAM Megabytes” for a machine, but the
log file shows “\\SERVER\Exchange\Mailbox Size”, then there is something wrong (this is very
unlikely).
14. Next we need to check if the values that you are collecting are within the collection threshold
range. Kaseya has 3 layers of log collection.
Collection Threshold. This is the point at which you want Kaseya to start collecting data. If you are
monitoring drive space, you may only want to start collecting data once the drive gets to 25% free.
Alarm Threshold. This is the point that the counter is required to alarm us of a problem.
Using the disk space scenario, we might say, “we don't care if the disk has more than 25% free
space. If the disk gets below 25%, we want Kaseya to start recording that data so that we can
monitor the situation. If the % free space falls below 10% then we want Kaseya to send us an alert.
If the counters value is in that “don't care” area, then no data will be returned from the agent to the
server. As far as the Kaseya server is concerned, there is no data being sent up from the agent and
therefore there is a problem.
15. In the Kaseya interface, go to the monitor tab -> Monitor Logs, click the + next to the counter
that is failing, you will see a summary of the counter.
16. I can see from my screen here, that I am collecting data on % Free space, and my collection
threshold is “Under 25%”
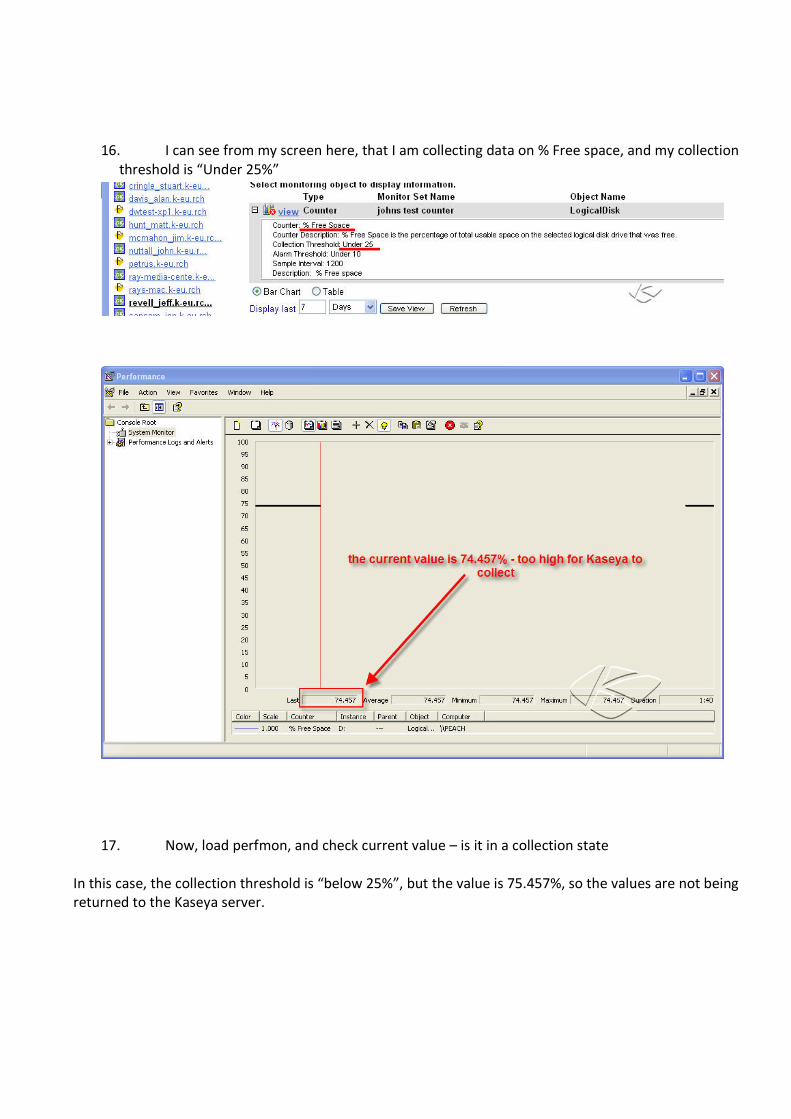
17. Now, load perfmon, and check current value – is it in a collection state
In this case, the collection threshold is “below 25%”, but the value is 75.457%, so the values are not being
returned to the Kaseya server.

18. If you have followed all this guide, but still don't have a resolution, please visit
http://www.kaseya.com/support and raise a ticket. Be sure to include the following information, as
well as any other relevant information.
- Customer ID
- example machine(s)
- the monitor set that you are using
Recommended