Turning Bank Financial Statements into Useful Ratios & Trends
November 2014
Presented by: Timothy P. Harrington, CPAT.E.A.M. Resources
7049 Tanque Verde Road, PMB 136
Tucson, AZ 85715
800-788-9542 e-mail: [email protected]

2
Disclaimer
This presentation is designed to provide accurate and authoritative information in regard to the subject matter covered. The handouts, visuals, and verbal information provided are current as of the webinar date. However, due to an evolving regulatory environment, Financial Education & Development, Inc. does not guarantee that this is the most-current information on this subject after that time.
Webinar content is provided with the understanding that the publisher is not rendering legal, accounting, or other professional services. Before relying on the material in any important matter, users should carefully evaluate its accuracy, currency, completeness, and relevance for their purposes, and should obtain any appropriate professional advice. The content does not necessarily reflect the views of the publisher or indicate a commitment to a particular course of action. Links to other websites are inserted for convenience and do not constitute endorsement of material at those sites, or any associated organization, product, or service.

3
Sponsors

• 26 years Financial Institution experience
• 34 years business/consulting experience
• Consulted on over 1,000 projects
• Speaker at over 1,000 events
• Faculty of 3 National Financial Schools
About Timothy Harrington, CPA
4

SAMPLE BANK 12/31/2012 12/31/2013
Balance Sheet
Assets (000)
Cash and Due from Banks 223,532 178,685Fed Funds Sold 2,994 109Deposits at Financial Institutions 315,053 611,224Other Cash & Cash Equivalents 2,208 405 Cash and Cash Equivalents 543,787 790,423Trading Account Securities 3,747 5,958Available for Sale Securities 2,625,229 1,790,978Held to Maturity Securities 4,541 5,563Other Securities 40,376 37,618 Total Cash & Securities 3,217,680 2,630,540
Gross Loans Held for Investment 7,176,433 7,728,166Loan Loss Reserve (103,666) (95,085)Loans Held for Sale, before Reserves 320,132 104,664 Total Net Loans 7,392,899 7,737,745
Real Estate Owned and Held for Investment 28,724 25,000
Goodwill 668,172 764,305Intangible Assets other than Goodwill 17,159 12,378 Total Intangible Assets 685,331 776,683
Loan Servicing Rights 27,428 47,765Fixed Assets 162,667 177,680Interest Receivable 26,998 23,720Prepaid Expense 12,307 610 Bank-owned Life Insurance 93,831 96,938Other Assets 147,080 119,431 Total Other Assets 442,883 417,769 TOTAL ASSETS 11,795,443 11,636,112
Balance Sheet
Assets
Earning Assets
5

SAMPLE BANK 12/31/2012 12/31/2013
Balance Sheet
Liabilities and Equity (000)Liabilities (000)
Transaction Deposits $2,529,590 $3,396,328MMDA and Sacings Deposits $3,794,855 $3,773,799Time Deposits $3,054,830 $1,946,594 Total Deposits $9,379,275 $9,117,660
FHLB Borrowings $390,680 $476,376Total Subordinated Debt $196,066 $189,173 Total Debt $586,746 $665,549
Total Other Liabilities $105,383 $125,477Total Liabilities $10,071,404 $9,908,686
Equity ($000)
Total Preferred Equity $0 $0
Common Stock $1,073,616 $1,073,616Surplus $406,514 $406,514Undivided Profits $219,839 $317,412 Total Shareholder Equity $1,699,963 $1,797,542Net Unrealized Gain $24,346 ($70,116) Total Equity $1,724,309 $1,727,426 TOTAL LIABILITIES AND EQUITY $11,795,713 $11,636,112
Balance Sheet
Liabilities and Equity (Capital)
6

SAMPLE BANK 12/31/2012 12/31/2013
Income Statement (000)
Interest Income 456,085$ 442,846$
Interest Expense (48,849)$ (37,881)$ Net Interest Income 407,236$ 404,965$
Provision for Loan Losses (29,201)$ (10,716)$
Compensation & Benefits 200,946$ 209,991$ Occupancy & Equipment 55,081$ 62,067$ Marketing and Promotion Expense 5,064$ 6,062$ Professional Fees $ 10,724 $ 10,114 Tech & Communications Expense 11,573$ 11,974$ Amrt of Intang & Goodwill Impair 4,816$ 4,781$ Foreclosure & Repo 12,655$ 1,248$ Other Expense 56,455$ 49,588$ Total Noninterest Expense (357,314)$ (355,825)$
Other IncomeTrading Account Income $ 6,137 $ 7,737 Service Charges on Deposits 28,299$ 30,952$ Gain on Sale of Loans 91,945$ 65,644$ Bank-owned Life Insurance Revenue 2,708$ $ 3,053 Insurance Revenue $ 739 $ 1,000 Investment Banking & Brokerage 12,967$ 14,736$ Other Noninterest Income (13,334)$ (3,690)$ Total Noninterest Income 129,461$ 119,432$ Realized Gain on Securities 3,868$ 209$ Nonrecurring Revenue 3,500$ 1,800$ Nonrecurring Expense (2,338)$ (8,836)$
Total Other Income 134,491$ 112,605$
Net Income before Taxes 155,212$ 151,029$ Provision for Taxes (53,321)$ (52,668)$ Effective Tax Rate (%) 34.35% 34.87%
406 Net Income 101,891$ 98,361$
37 Other Changes to Net Income (682)$ (788)$ 43 Net Income Avail to Common 101,209$ 97,573$ 5
12
Income Statement
Revenues and Expenses
7
Balance Sheet Income Statement ASSETS LIABILITIES & CAPITAL
Cash REVENUEMISCELLANEOUS
EARNING ASSETS LIABILITIES Loan Interest IncomeLoans
Less Allowance for Loan and
Lease Losses
Investment Interest Income
Fees and Other Non-Interest DEPOSITS Income
EXPENSES
Investments Held -to-Maturity Occupancy Available-for-Sale Personnel Trading Provision for Loan LossesLess allowance for unrealized
Gains or Losses in Invest's BORROWEDFUNDS COST OF FUNDS
Interest Expense
EQUITY CAPITAL Interest Paid in Deposits Interest Paid on Borrowed Funds
NON-EARNING ASSETS Perpetual Preferred StockCommon Stock (at par)
Building, Equipment, etc. Surplus (in excess of par) NET INCOME or LOSS
Other Assets Unidivided Profits 8

Balance Sheet Income Statement ASSETS LIABILITIES & CAPITAL
Cash REVENUEMISCELLANEOUS
EARNING ASSETS LIABILITIES Loan Interest IncomeLoans
Less Allowance for Loan and
Lease Losses
Investment Interest Income
Fees and Other Non-Interest DEPOSITS Income
EXPENSES
Investments Held -to-Maturity Occupancy Available-for-Sale Personnel Trading Provision for Loan LossesLess allowance for unrealized
Gains or Losses in Invest's BORROWEDFUNDS COST OF FUNDS
Interest Expense
EQUITY CAPITAL Interest Paid in Deposits Interest Paid on Borrowed Funds
NON-EARNING ASSETS Perpetual Preferred StockCommon Stock (at par)
Building, Equipment, etc. Surplus (in excess of par) NET INCOME or LOSS
Other Assets Unidivided Profits
Have Owe
Own
Earns
Pays
9

Balance Sheet Income Statement ASSETS LIABILITIES & CAPITAL
Cash REVENUEMISCELLANEOUS
EARNING ASSETS LIABILITIES Loan Interest IncomeLoans
Less Allowance for Loan and
Lease Losses
Investment Interest Income
Fees and Other Non-Interest DEPOSITS Income
EXPENSES
Investments Held -to-Maturity Occupancy Available-for-Sale Personnel Trading Provision for Loan LossesLess allowance for unrealized
Gains or Losses in Invest's BORROWEDFUNDS COST OF FUNDS
Interest Expense
EQUITY CAPITAL Interest Paid in Deposits Interest Paid on Borrowed Funds
NON-EARNING ASSETS Perpetual Preferred StockCommon Stock (at par)
Building, Equipment, etc. Surplus (in excess of par) NET INCOME or LOSS
Other Assets Unidivided Profits 10

ROA and Spread Analysis (aka: Net Interest Margin Analysis)
Measures: Profitability and how it was attained
Formula: Each of the key balances on the Income Statement is divided by Average Assets (for simplicity, we will use Total Assets in our example instead of Average Assets)
The Spread Analysis is a ratio of key balances on the Income Statement compared to the bank’s Average Total Assets. This allows a comparison between periods and between financial institutions based on their asset size.
Since banks earn most of their revenue from their major, earning assets (Loans and Investments) and one of their highest expenses is often from their major liability (Deposits), measuring the effect of the Income Statement against the size of the Assets makes sense. This is a standard banking measure.
1111

ProfitabilityHow we earn profit How we measure it
Spread Analysis:
Simply dividing the Income Statement amounts by Average Assets
12

Which bank is doing better?Why we use comparable ratios
10 Bil bank 100 Mil bankInterest income $ 496,000,000 4,630,000Cost of funds (175,000,000) (640,000)
Net Interest 321,000,000 3,990,000Operating costs (Burden) (329,000,000) (3,320,000)Provision for loan losses (111,000,000) (440,000) Net loss before other income (120,000,000) 230,000NII – Non-interest income 136,000,000 780,000 Tax Expense (2,000,000) (320,000)Net Profit or Loss $ 14,000,000 690,000
Total Equity $ 500,000,000 $10,000,00013

As a % of Average Assets $10 Bil $100 MilYield: Interest income 3.96% 4.63%Less: Cost of funds (0.75% ) (0.64%) Net Interest Margin (NIM-Spread) 3.21% 3.99%Less: Non-Interest Exp (Burden) (3.29%) (3.32%)Less: Provision for loan losses (1.11%) (0.44%)
Net loss before other income (1.20%) 0.23%Plus: NII-Non-interest income 1.36% 0.78%Less: Tax Expense (0.02%) (0.32%) Equals: Return on Assets (ROA) 0.14% 0.69%
Equity Ratio 5.00% 10.00%
Which bank is doing better?Spread with ROA (ROAA)
14

The ‘Banking’ Business
Banks make money 2 ways:• Interest Income• Non-Interest Income (Other Income)
Banks spend money 4 ways:• Cost of Funds, Deposits and Borrowings• Non-Interest Expenses (cost of people, buildings,
and systems)• Provision for Loan Losses (cost of building the
Allowance for Loan Losses)• Taxes
15
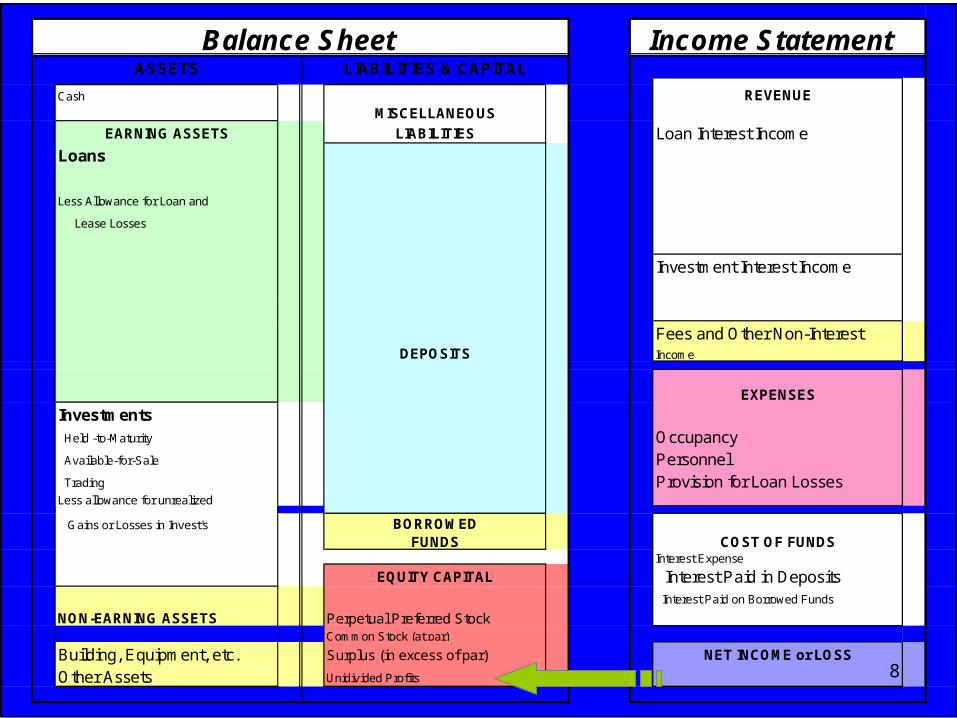
As a % of Average Assets 6/30/14 12/31/97
Yield: Interest income 4.21% 8.39Less: Cost of funds (0.48%) (3.70) Net Interest Margin 3.73% 4.69Less: Non-interest expense (3.05%) (3.56)Less: Provision for loan losses (0.12%) (0.29)
Net loss before other income 0.56% 0.84Plus: Non-interest income 0.66% 1.13 Less: Taxes (0.23%) (0.64)
Equals: Net Profit or Loss (ROA) 0.99% 1.33
SpreadCommercial Banks $1 Bil to $100 Mil
16

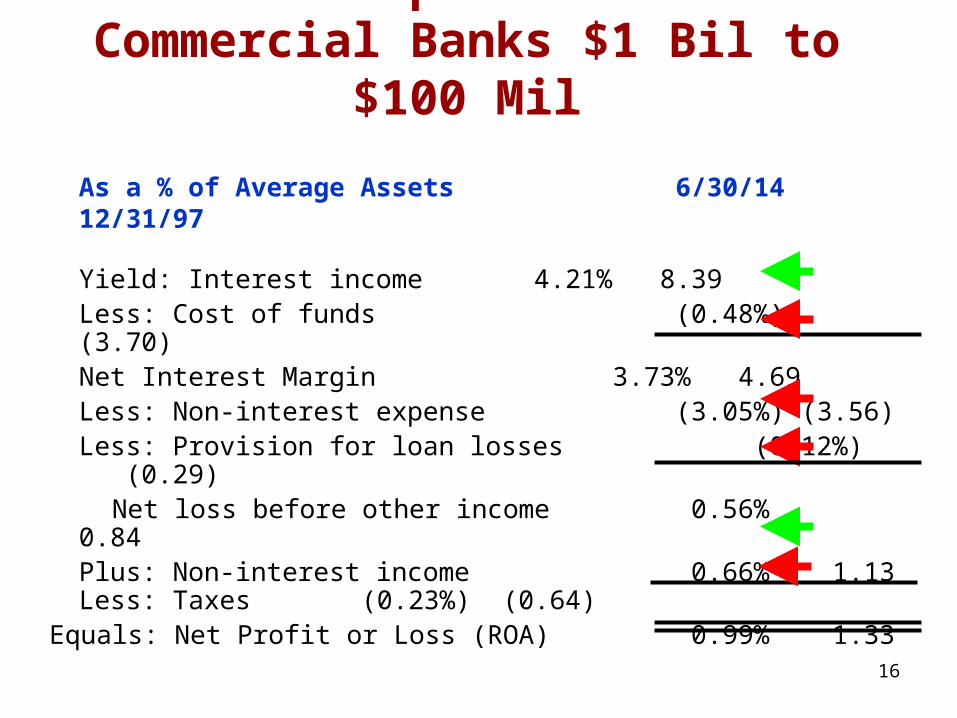
Source: FDIC
17

Net Interest Margin: All US Banks
18
19
Source: FDIC

ROA: All US Banks
20

21

SAMPLE BANK 12/31/2012 12/31/2013
Balance Sheet
Assets (000)
Cash and Due from Banks 223,532 178,685Fed Funds Sold 2,994 109Deposits at Financial Institutions 315,053 611,224Other Cash & Cash Equivalents 2,208 405 Cash and Cash Equivalents 543,787 790,423Trading Account Securities 3,747 5,958Available for Sale Securities 2,625,229 1,790,978Held to Maturity Securities 4,541 5,563Other Securities 40,376 37,618 Total Cash & Securities 3,217,680 2,630,540
Gross Loans Held for Investment 7,176,433 7,728,166Loan Loss Reserve (103,666) (95,085)Loans Held for Sale, before Reserves 320,132 104,664 Total Net Loans 7,392,899 7,737,745
Real Estate Owned and Held for Investment 28,724 25,000
Goodwill 668,172 764,305Intangible Assets other than Goodwill 17,159 12,378 Total Intangible Assets 685,331 776,683
Loan Servicing Rights 27,428 47,765Fixed Assets 162,667 177,680Interest Receivable 26,998 23,720Prepaid Expense 12,307 610 Bank-owned Life Insurance 93,831 96,938Other Assets 147,080 119,431 Total Other Assets 442,883 417,769 TOTAL ASSETS 11,795,443 11,636,112
Comparative Balance Sheets (2 years)
We will use this to prepare a Spread Analysis for SAMPLE BANK.
Let’s Calculate Spread
22

1. Calculate Average AssetsTotal Assets Beginning of Year + Total Assets End
of Period / 2
$11,795,443 + $11,636,112 / 2 = $11,715,778
There are other ways to calculate Average Assets, but this is a simple, common way of doing so
Spread Analysis or Net Interest Margin
2323
24
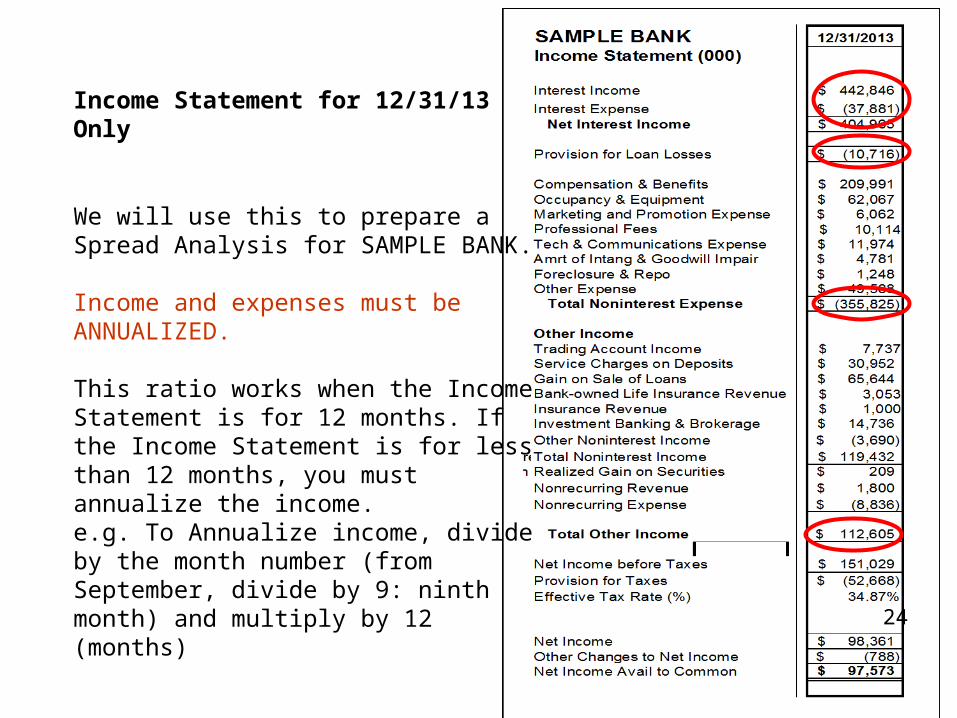
Income Statement for 12/31/13 Only
We will use this to prepare a Spread Analysis for SAMPLE BANK.
Income and expenses must be ANNUALIZED.
This ratio works when the Income Statement is for 12 months. If the Income Statement is for less than 12 months, you must annualize the income.e.g. To Annualize income, divide by the month number (from September, divide by 9: ninth month) and multiply by 12 (months)

2. Yield on Assets (Yield)Interest Income from loans and investments /
Average assets
$442,846 / $11,715,778 x 100 = 3.78%
3. Cost of Funds (COF)Dividends paid / Average assets
$37,881 / $11,715,778 x 100 = 0.32%
Subtract COF from Yield and you get
4. Net Interest Margin (NIM) = 3.46%
Spread Analysis or Net Interest Margin
= 25
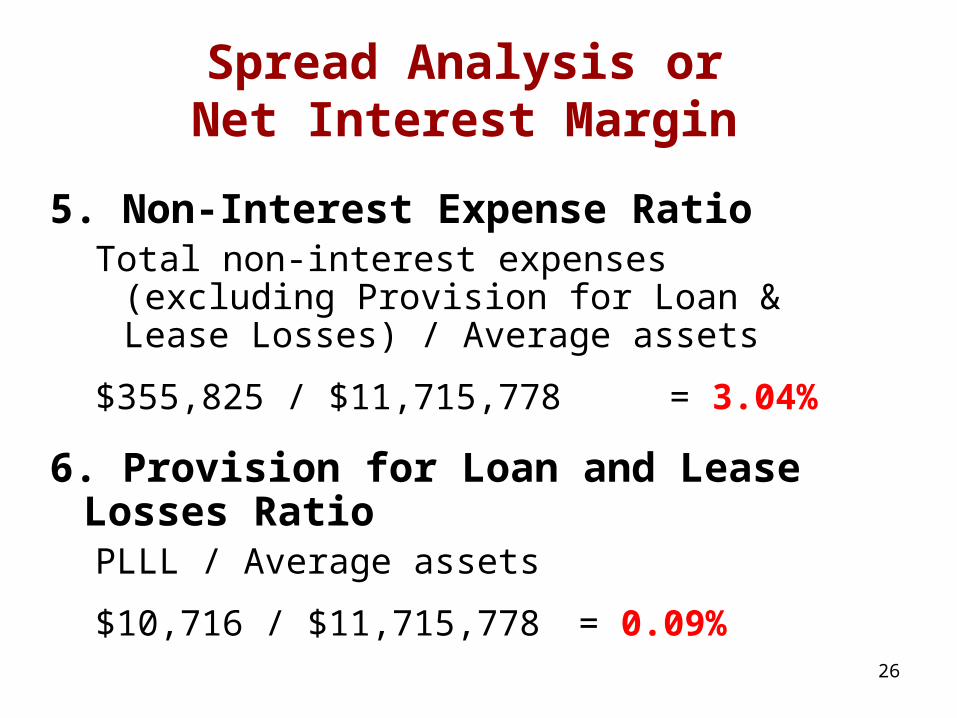
5. Non-Interest Expense RatioTotal non-interest expenses (excluding Provision for
Loan & Lease Losses) / Average assets
$355,825 / $11,715,778 = 3.04%
6. Provision for Loan and Lease Losses RatioPLLL / Average assets
$10,716 / $11,715,778 = 0.09%
Spread Analysis or Net Interest Margin
26

7. Non-Interest Income (NII) Ratio (OI-Other Income) (Service Revenues, Fees, Commissions, etc.)
Total NII / Average assets
$112,605 / $11,715,778 x 100 = 0.96%
8. Tax Expense RatioTotal Expense / Average assets
$52,668 / $11,715,778 x 100 = 0.45%
Spread Analysis or Net Interest Margin
2727

9. Return on Average Assets (ROA)Net income / Average assets
$97,573 / $11,715,778 x 100 = 0.83%(there will often be a 1 or 2 basis point difference between added ROA and Calculated ROA)
This number is also the sum of the items above it in the spread analysis: Yield – Cost of Funds + Non-interest Income – Non-Interest Expenses – Provision for Loan Losses = Return on Assets
Spread Analysis or Net Interest Margin
2828
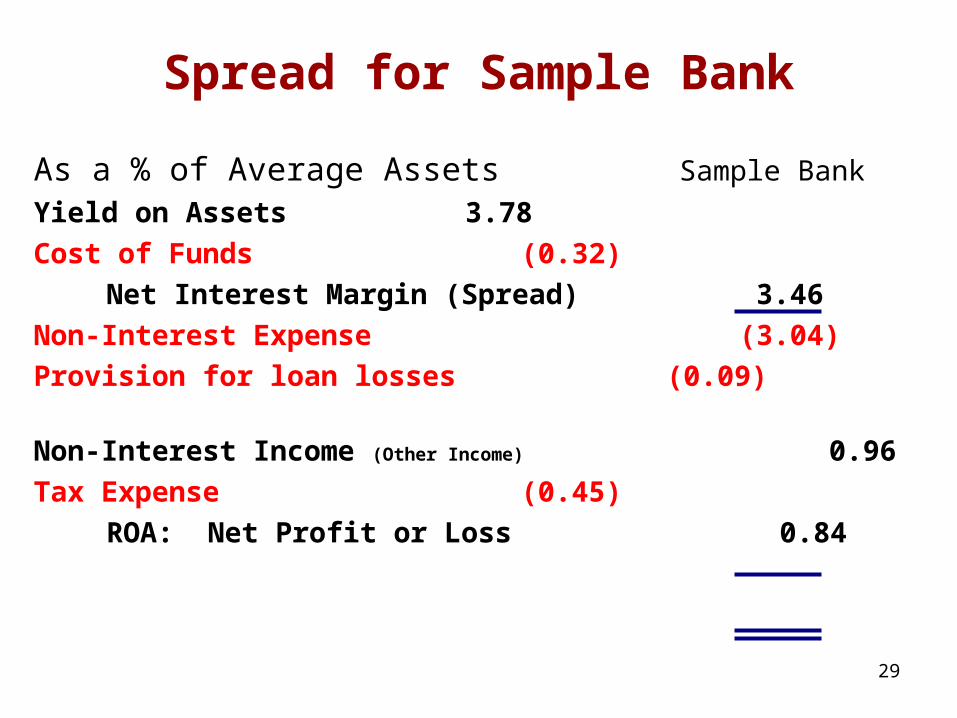
Spread for Sample Bank
As a % of Average Assets Sample Bank Yield on Assets 3.78
Cost of Funds (0.32)
Net Interest Margin (Spread) 3.46
Non-Interest Expense (3.04)
Provision for loan losses (0.09)
Non-Interest Income (Other Income) 0.96
Tax Expense (0.45)
ROA: Net Profit or Loss 0.84
29

30
Capital is Important to:
• Provides a cushion– For unexpected losses
• Provides Stability– The company’s ‘keel’
• Allows bank to take calculated risks• Allows bank to sustain growth in
assets• Ensures general public of safety and
soundness of institution3131
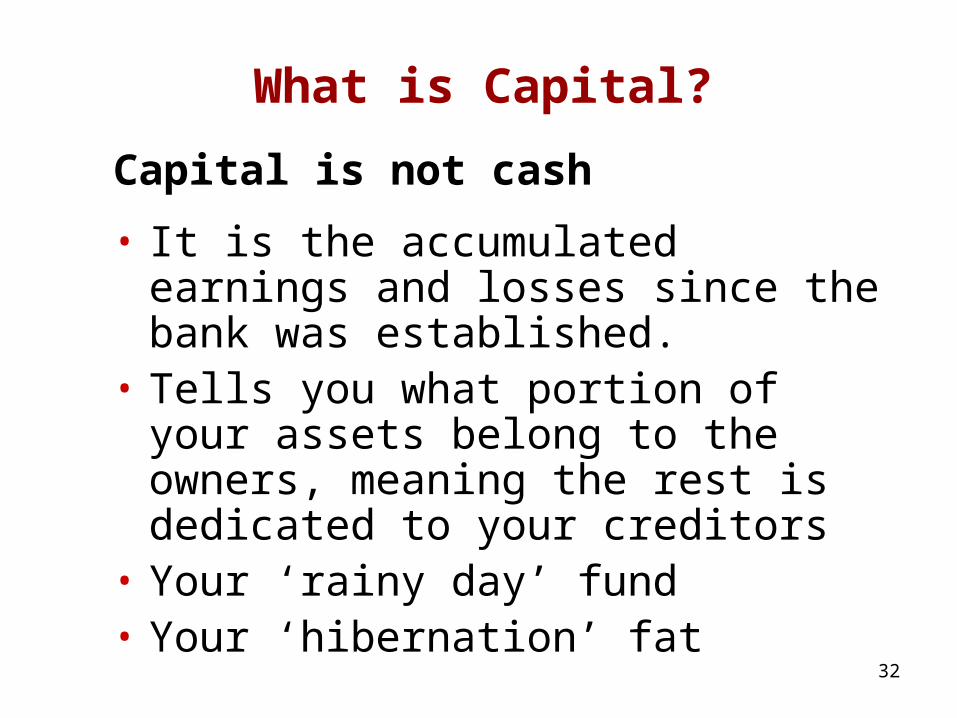
What is Capital?
Capital is not cash
• It is the accumulated earnings and losses since the bank was established.
• Tells you what portion of your assets belong to the owners, meaning the rest is dedicated to your creditors
• Your ‘rainy day’ fund• Your ‘hibernation’ fat
32

Balance Sheet Income Statement ASSETS LIABILITIES & CAPITAL
Cash REVENUEMISCELLANEOUS
EARNING ASSETS LIABILITIES Loan Interest IncomeLoans
Less Allowance for Loan and
Lease Losses
Investment Interest Income
Fees and Other Non-Interest DEPOSITS Income
EXPENSES
Investments Held -to-Maturity Occupancy Available-for-Sale Personnel Trading Provision for Loan LossesLess allowance for unrealized
Gains or Losses in Invest's BORROWEDFUNDS COST OF FUNDS
Interest Expense
EQUITY CAPITAL Interest Paid in Deposits Interest Paid on Borrowed Funds
NON-EARNING ASSETS Perpetual Preferred StockCommon Stock (at par)
Building, Equipment, etc. Surplus (in excess of par) NET INCOME or LOSS
Other Assets Unidivided Profits
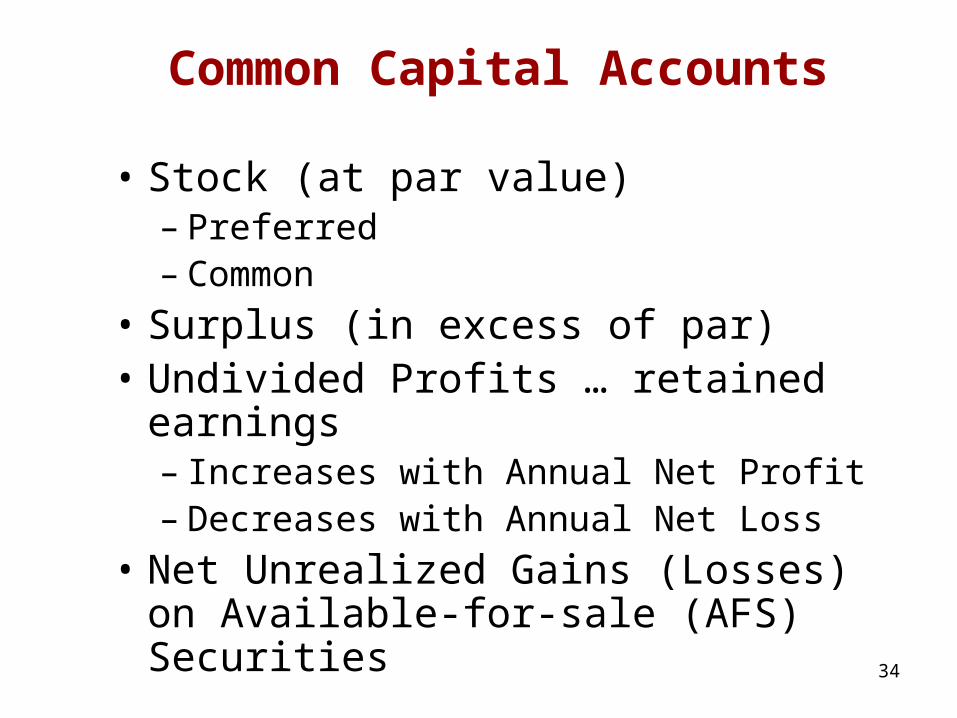
• Stock (at par value)– Preferred– Common
• Surplus (in excess of par)• Undivided Profits … retained earnings
– Increases with Annual Net Profit– Decreases with Annual Net Loss
• Net Unrealized Gains (Losses) on Available-for-sale (AFS) Securities
Common Capital Accounts
34
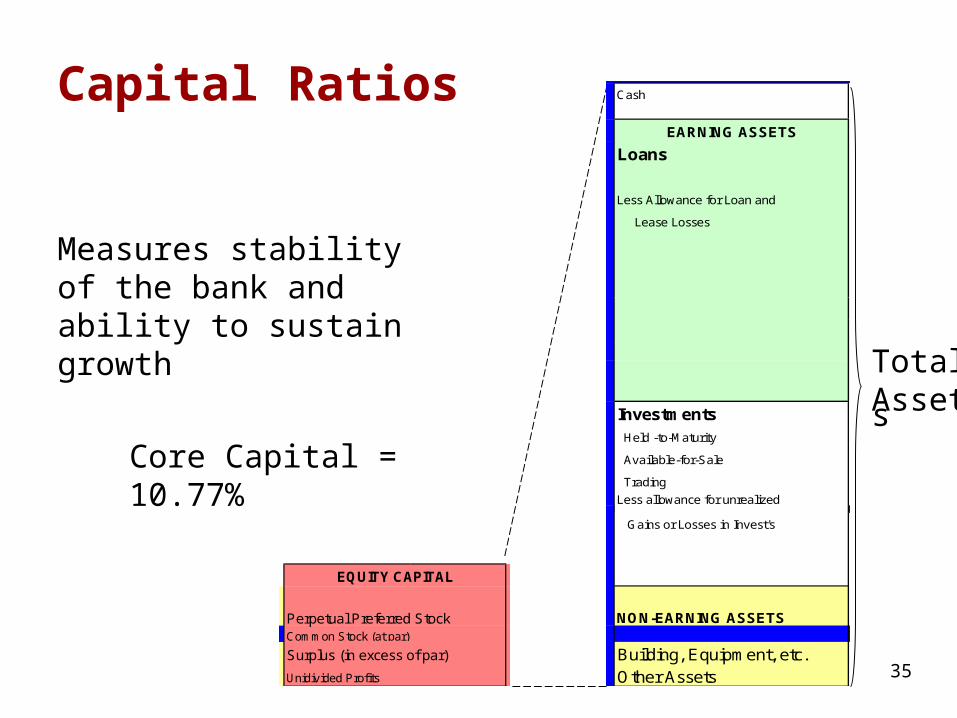
Capital Ratios
Core Capital = 10.77%
Measures stability of the bank and ability to sustain growth
TotalAssets
Balance Sheet Income Statement ASSETS LIABILITIES & CAPITAL
Cash REVENUEMISCELLANEOUS
EARNING ASSETS LIABILITIES Loan Interest IncomeLoans
Less Allowance for Loan and
Lease Losses
Investment Interest Income
Fees and Other Non-Interest DEPOSITS Income
EXPENSES
Investments Held -to-Maturity Occupancy Available-for-Sale Personnel Trading Provision for Loan LossesLess allowance for unrealized
Gains or Losses in Invest's BORROWEDFUNDS COST OF FUNDS
Interest Expense
EQUITY CAPITAL Interest Paid in Deposits Interest Paid on Borrowed Funds
NON-EARNING ASSETS Perpetual Preferred Stock
Building, Equipment, etc. Surplus (in excess of par) NET INCOME or LOSS
Other Assets Unidivided Profits
Balance Sheet Income Statement ASSETS LIABILITIES & CAPITAL
Cash REVENUEMISCELLANEOUS
EARNING ASSETS LIABILITIES Loan Interest IncomeLoans
Less Allowance for Loan and
Lease Losses
Investment Interest Income
Fees and Other Non-Interest DEPOSITS Income
EXPENSES
Investments Held -to-Maturity Occupancy Available-for-Sale Personnel Trading Provision for Loan LossesLess allowance for unrealized
Gains or Losses in Invest's BORROWEDFUNDS COST OF FUNDS
Interest Expense
EQUITY CAPITAL Interest Paid in Deposits Interest Paid on Borrowed Funds
NON-EARNING ASSETS Perpetual Preferred StockCommon Stock (at par)
Building, Equipment, etc. Surplus (in excess of par) NET INCOME or LOSS
Other Assets Unidivided Profits 35

Capital Ratios
Woops! Now 8.60%
TotalAssets
Balance Sheet Income Statement ASSETS LIABILITIES & CAPITAL
Cash REVENUEMISCELLANEOUS
EARNING ASSETS LIABILITIES Loan Interest IncomeLoans
Less Allowance for Loan and
Lease Losses
Investment Interest Income
Fees and Other Non-Interest DEPOSITS Income
EXPENSES
Investments Held -to-Maturity Occupancy Available-for-Sale Personnel Trading Provision for Loan LossesLess allowance for unrealized
Gains or Losses in Invest's BORROWEDFUNDS COST OF FUNDS
Interest Expense
EQUITY CAPITAL Interest Paid in Deposits Interest Paid on Borrowed Funds
NON-EARNING ASSETS Perpetual Preferred Stock
Building, Equipment, etc. Surplus (in excess of par) NET INCOME or LOSS
Other Assets Unidivided Profits
Balance Sheet Income Statement ASSETS LIABILITIES & CAPITAL
Cash REVENUEMISCELLANEOUS
EARNING ASSETS LIABILITIES Loan Interest IncomeLoans
Less Allowance for Loan and
Lease Losses
Investment Interest Income
Fees and Other Non-Interest DEPOSITS Income
EXPENSES
Investments Held -to-Maturity Occupancy Available-for-Sale Personnel Trading Provision for Loan LossesLess allowance for unrealized
Gains or Losses in Invest's BORROWEDFUNDS COST OF FUNDS
Interest Expense
EQUITY CAPITAL Interest Paid in Deposits Interest Paid on Borrowed Funds
NON-EARNING ASSETS Perpetual Preferred StockCommon Stock (at par)
Building, Equipment, etc. Surplus (in excess of par) NET INCOME or LOSS
Other Assets Unidivided Profits
If Assets grow, and Capital doesn’t grow proportionately, the Ratios will decline
36

If Assets grow and capital doesn’t keep up, the bank becomes unstable
37
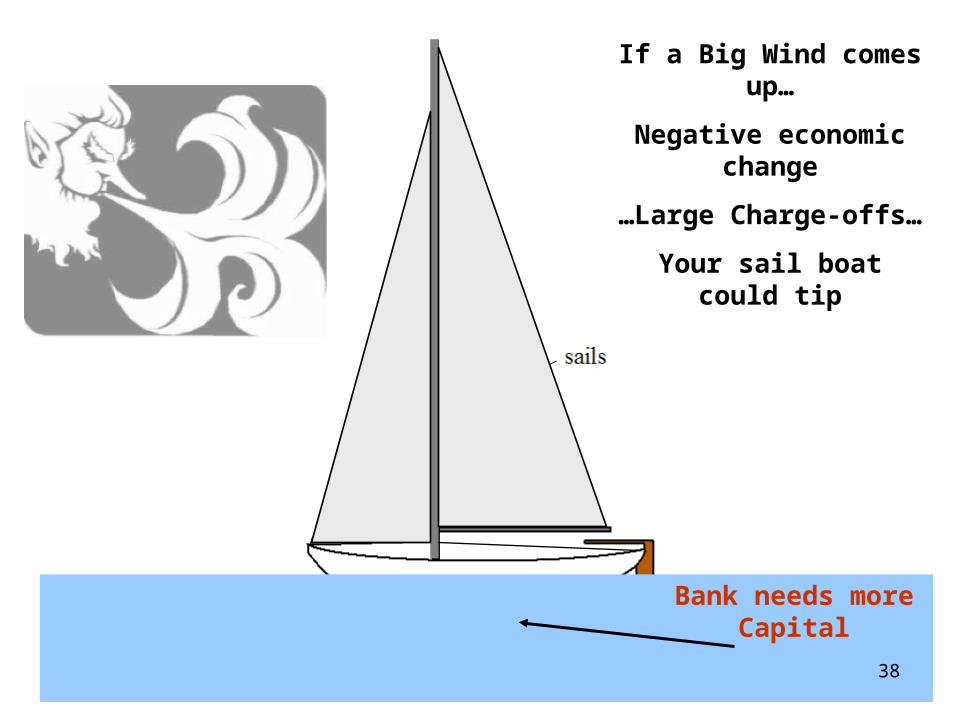
Bank needs more Capital
If a Big Wind comes up…
Negative economic change
…Large Charge-offs…
Your sail boat could tip
38

All US Banks Source: FDIC
39

Project worst 3 years possible (this is what ALM is all about)
Prompt Regulatory Action RulesNational or Peer AveragesDepends on how much risk your assets and
liabilities representDepends on level of growthDepends on level of profitabilityDepends on future plans
How much capital is enough?
40

Capital Can Disappear Fast
11.07 11.17
11.97
3.202.89
6.42
9.55
11.1810.96
4.76
0.00
2.00
4.00
6.00
8.00
10.00
12.00
14.00
2004 2005 2006 2007 2008 2009 2010 2011 2012 2013
41
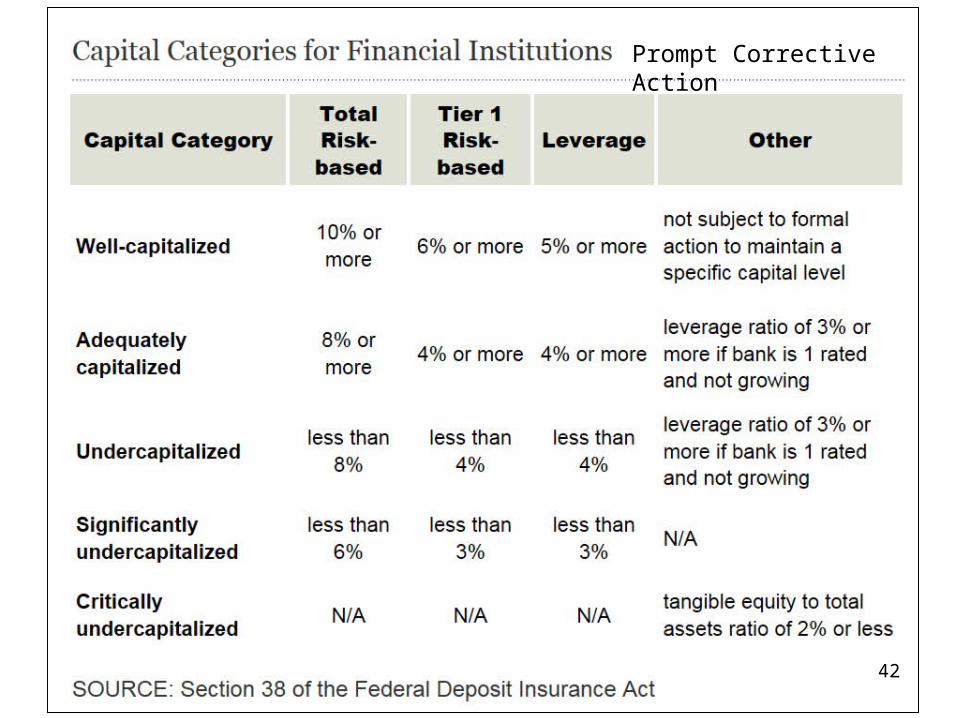
Prompt Corrective Action Prompt Corrective Action
42
Prompt Corrective Action
Adequately capitalized institutions
Such institutions must receive a waiver from the FDIC to accept, renew or roll over brokered deposits (banks sell these large-denomination deposits to brokerages). A waiver is granted on a case-by-case basis, upon a finding that acceptance of such deposits does not constitute an unsafe and unsound practice.
If granted, an institution may not pay an effective yield that exceeds by more than 75 basis points the effective yield paid on deposits of comparable size and maturity.
Institutions that are undercapitalized to varying degrees must take additional actions and have additional requirements:
43

Prompt Corrective Action
Undercapitalized institutions-must file an acceptable capital restoration plan; -cannot pay dividends or management fees;-may not accept, renew or roll over any brokered deposit; and
-may not solicit any other deposits by offering an effective yield that exceeds by more than 75 basis points the effective yield paid on deposits of comparable size and maturity.
Significantly undercapitalized institutions-are subject to the same actions as an undercapitalized bank;-cannot pay bonuses to, or increase compensation of, senior executive officers without prior regulator approval; and -are subject to other restrictions and actions as noted in the Federal Deposit Insurance Corporation Improvement Act (FDICIA).
44
Prompt Corrective Action
Critically undercapitalized institutions
-are subject to the same provisions as an undercapitalized bank and a significantly undercapitalized bank; and
-cannot pay interest or principal on subordinated debt (without FDIC waiver) after 60 days of becoming critically undercapitalized.
In addition, within 90 days of the bank becoming critically undercapitalized the chartering authority must:
-appoint a receiver; or
-take other such actions that the primary regulator, with the concurrence of the FDIC, determines would better serve the purposes of prompt corrective action (and review such determination every 90 days).
45
Regulatory Capital
Leverage Capital The minimum leverage ratio requirement consists only of Tier 1 (Core) Capital.
Tier 1 Capital or Core Capital is the sum of:
common stockholders' equity – the sum of common stock and related surplus, undivided profits, disclosed capital reserves that represent a segregation of undivided profits, and foreign currency translation adjustments, less net unrealized losses on available-for-sale equity securities with readily determinable fair values;
noncumulative perpetual preferred stock
minority interests in consolidated subsidiaries minus all intangible assets other than …
See Handout on Capital
46

Tier 1 Capital is calculated as follows: + Permanent shareholders’ equity
+ Undivided Profits (retained earnings)Less: Goodwill
Tier 2 Capital is calculated as follows: + General provisions/general loan-loss reserves
+ Revaluation reserves+ Hybrid (debt/equity) capital instruments+ Subordinated term debtLess: Investments in unconsolidated financial subsidiariesLess: Investments in the capital of other financial institutions
Total Capital = Tier 1 Capital + Tier 2 Capital
Regulatory Capital
47

Regulatory Capital
Tier 1 Risk-Based Capital: Tier 1 Capital / Risk Weighted Assets
Tier 2 Risk-Based Capital: Tier 2 Capital / RWA
Total Risk-Based Capital: Tier 1 plus Tier 2 Capital / RWA
Leverage Ratio: Tier 1 Capital / Total Assets – goodwill, other disallowed intangible assets and disallowed deferred tax assets
You have been provided a Regulatory Capital Estimation Tool as developed by FDIC
48

ROE – Return on Equity
Measures: Return to Investors
Formula: Net Income divided by Shareholder Equity
4949

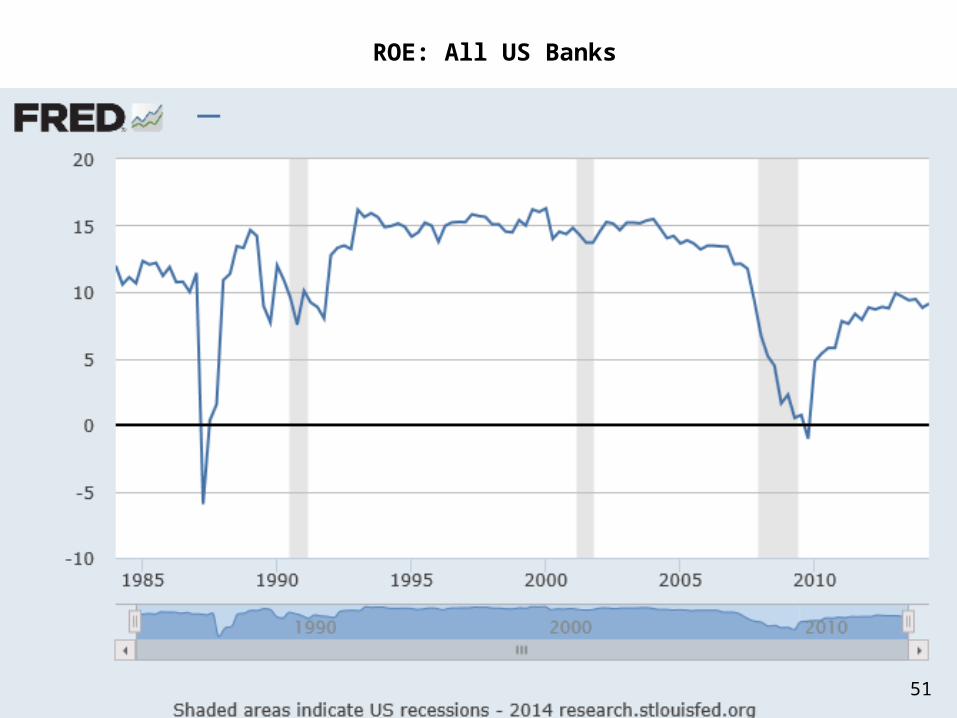
Source: FDIC
50
51/
69
ROE: All US Banks
51

Sources of Non-Interest Income
• Deposit service charges
• Fiduciary activities
• Trading revenue
• Investment, advisory and brokerage
• Insurance commission fees and income
• Servicing fees
• Net gains (losses) on sales of loans
• Other net gains of (losses)
52

As a % of Average Assets 6/30/14 12/31/97
Yield: Interest income 4.21% 8.39Less: Cost of funds (0.48%) (3.70) Net Interest Margin 3.73% 4.69Less: Non-interest expense (3.05%) (3.56)Less: Provision for loan losses (0.12%) (0.29)
Net loss before other income (0.56%) 0.84Plus: Non-interest income 1.78% 1.13 Less: Taxes 0.23% (0.64)
Equals: Net Profit or Loss (ROA) 0.99% 1.33
SpreadCommercial Banks $1 Bil to $100 Mil
53

54/
6954

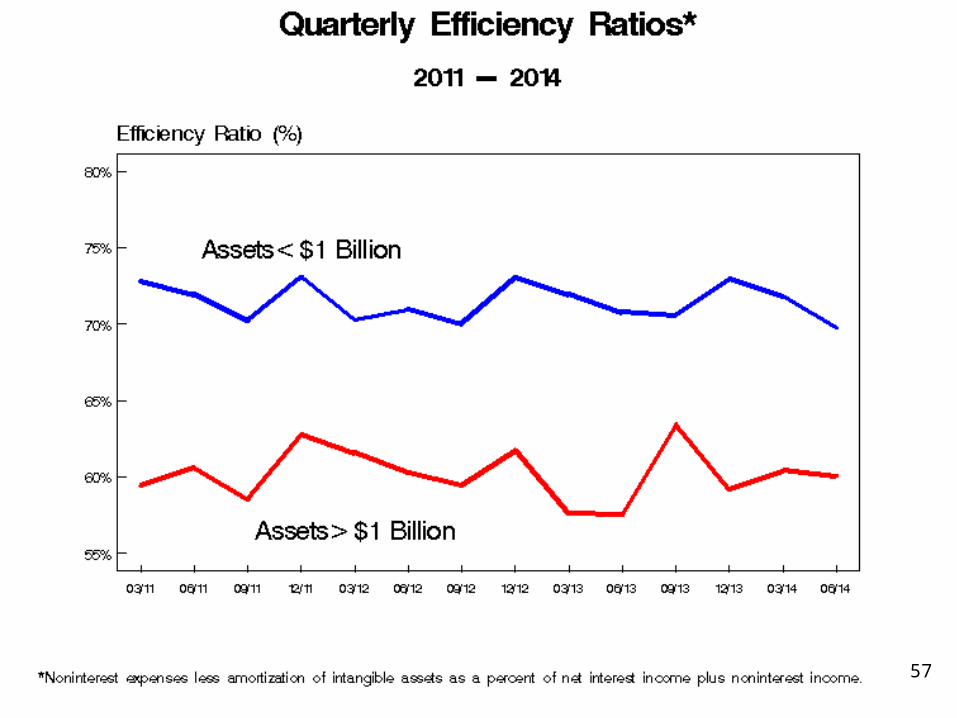
Efficiency Ratio
Measures: Percentage of Controllable Income that is used up by Operations OR “How much does it cost for you to earn $1 in Net Revenue”
Formula: Operating Costs – Amortization of Intangible Assets [Interest Income – Cost of Funds + Non-interest Income]
Industry Standard: Bank averages range between 55% and 70% depending on size and business model
How to Improve: – Increase Interest Income– Decrease Cost of Funds– Increase Non-interest Income– Decrease Operating Costs
Typically, the lower this ratio is, the better. This means your cost per dollar earned is less 5555

SAMPLE BANK 12/31/2013
Income Statement (000)
Interest Income 442,846$
Interest Expense (37,881)$ Net Interest Income 404,965$
Provision for Loan Losses (10,716)$
Compensation & Benefits 209,991$ Occupancy & Equipment 62,067$ Marketing and Promotion Expense 6,062$ Professional Fees $ 10,114 Tech & Communications Expense 11,974$ Amrt of Intang & Goodwill Impair 4,781$ Foreclosure & Repo 1,248$ Other Expense 49,588$ Total Noninterest Expense (355,825)$
Other IncomeTrading Account Income $ 7,737 Service Charges on Deposits 30,952$ Gain on Sale of Loans 65,644$ Bank-owned Life Insurance Revenue $ 3,053 Insurance Revenue $ 1,000 Investment Banking & Brokerage 14,736$ Other Noninterest Income (3,690)$ Total Noninterest Income 119,432$ Realized Gain on Securities 209$ Nonrecurring Revenue 1,800$ Nonrecurring Expense (8,836)$
Total Other Income 108,915$
Net Income before Taxes 151,029$ Provision for Taxes (52,668)$ Effective Tax Rate (%) 34.87%
406 Net Income 98,361$
37 Other Changes to Net Income (788)$ 43 Net Income Avail to Common 97,573$ 5
12
Operating Expenses – Amort of Intang AstsInterest Income - COF + Non-Interest Income
$355,825 - $4,781
($442,846 - $37,881 + $108,915)
Efficiency Ratio
$351,044 X 100 = 68.31%$513,880
57

Non-Performing Loans Ratio
Measures: Quality of Loan Portfolio based on what percentage is currently late by 90 days or more
Formula: Dollar Amount of Delinquent Loans (90+days) Total Loans
Industry Standard: Somewhere in the 0.50% to 1.50% range, depending on strategy. Banks that take more credit risk will have higher ratios.
5858
Net Charge-offs
Measures: Quality of Loan Portfolio based on the percentage of loans removed from the books (so far this year) as non-performing.
Formula: [Charge offs – Recoveries] Average Loans (Charge-offs and Recoveries must be annualized)
Industry Standard: Somewhere in the 0.25% to 0.75% range, depending on strategy.
59
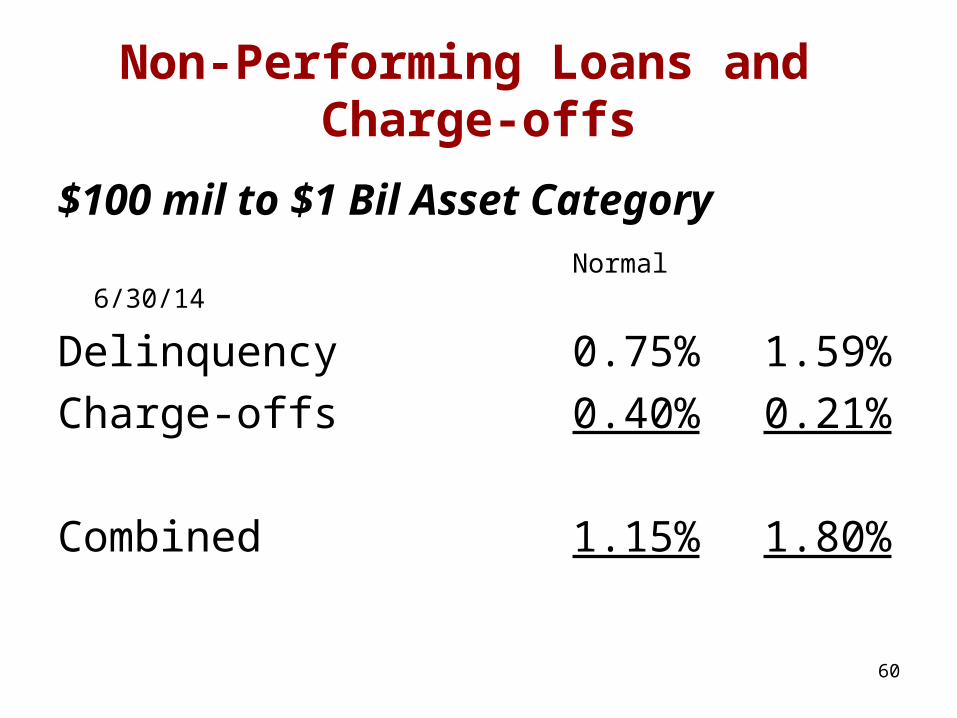
Non-Performing Loans and Charge-offs
$100 mil to $1 Bil Asset CategoryNormal 6/30/14
Delinquency 0.75% 1.59%
Charge-offs 0.40% 0.21%
Combined 1.15% 1.80%
60

61

Loan to Assets Ratio
Measures: Percentage of Assets funded by Deposits
Formula: Total Loans Total Assets
Industry Standard: 50% to 65%
Generally, the higher the ratio the better. However, ratios getting too high can create liquidity problems.
6262

Thank You!
Timothy Harrington, CPA
T.E.A.M. Resources7049 East Tanque Verde, PMB 136Tucson, AZ 85715(800) 788-9542 [email protected]
63
Recommended


![Dnevni avaz [broj 7049 djelimičan, 23.3.2015]](https://img.pdfslide.net/doc/110x75/577cba0e1a28aba7118d964c/dnevni-avaz-broj-7049-djelimican-2332015.jpg)