Types of Domestic ViolenceResearch Evidence
Michael P. Johnson, Ph.D.
Sociology, Women's Studies, and
African & African American Studies
Penn State
Photos from Donna Ferrato, Living with the Enemy. New York: Aperture, 1991
McKeesport, PA
New Directions ProgramCatholic Family Service OttawaFebruary 24, 2010
The Continuing Gender Debate Anti-feminist politics and conflicting data Explaining the ostensible contradictions
A Control-based Typology of Partner Violence The three major types (plus one or two) Gender differences and sampling biases
Dramatic Differences Among the Types Violence severity, frequency, mutuality, and escalation Health consequences Relationship consequences Miscellaneous other major differences
Preview of Policy ImplicationsScreening/triage, Primary prevention/education, Intervention with perpetrators, Intervention for survivors, Custody and access issues

The Anti-feminist Backlash Globe and Mail July 27, 2002 (Web site)
Men as likely to suffer spousal abuse, Statscan says. Baltimore Sun July 16, 2009
McNair tragedy underscores fact that men are often victimized by wives
Pittsburgh Post Gazette July 26, 2009 Feminist ideologues ignore research that shows domestic
violence is just as often started by women as by men The Men’s Project. February 2009. Submission to
Ontario Ministry of the Attorney General …the Ontario Government may be in violation of their
obligations… [because] the existing network of shelters for victims of family violence exclude men….
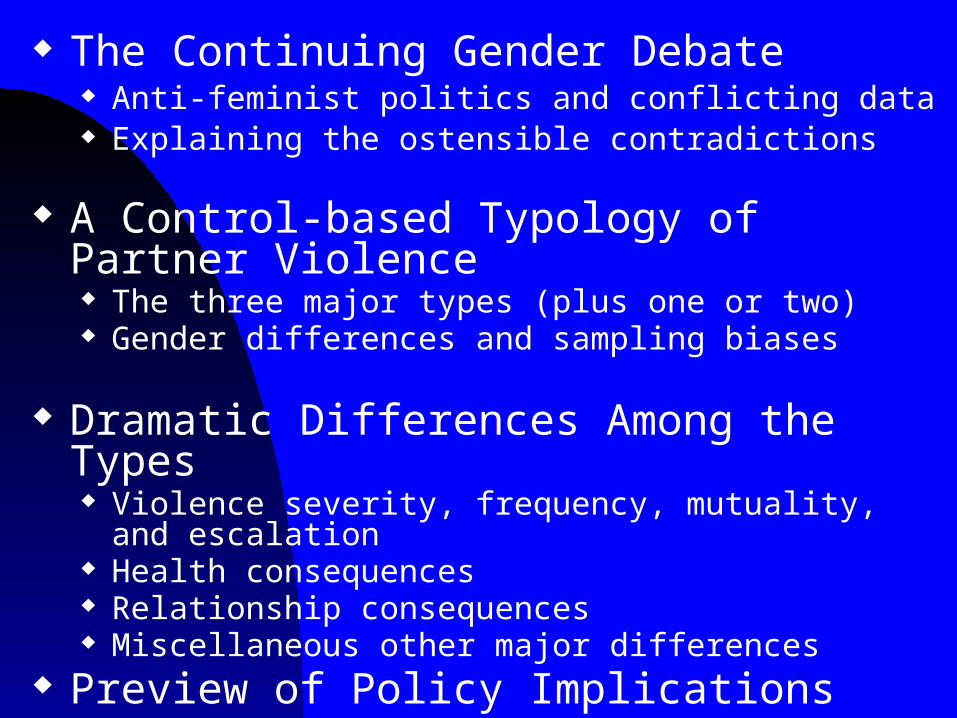
Heterosexual intimate partner violence by gender
Data Source Men Women
U.S., NFVS, 1975—the beginning 51% 49%
U.S., NSFH, 1988 53% 47%
North Carolina, 8th & 9th Grade, 1994 35% 65%
U. of Maine, students, 1997 39% 61%
New Zealand, young adults, 2002 39% 61%
Canada, GSS, 2004 54% 46%
General Surveys Indicate That Women Are as Violent as Men
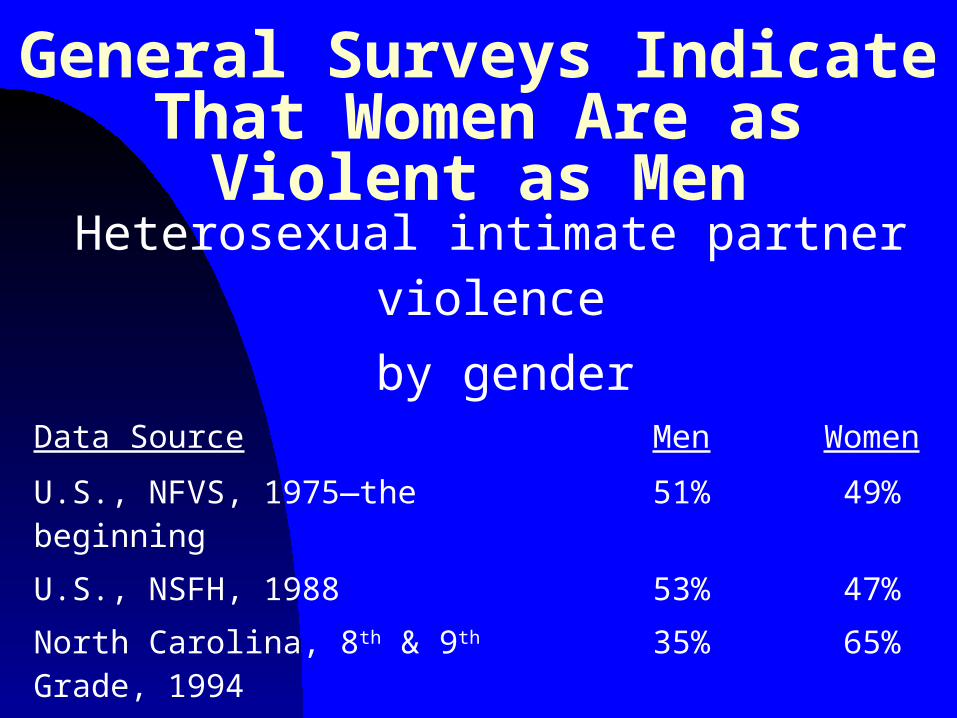
But Agency Studies Indicate ThatMen Are the Batterers
Heterosexual intimate partner violence
by genderData Source Men Women
Cleveland, Divorce Court, 1966 92% 8%
Ontario, Family Court, 1982 94% 6%
Santa Barbara, CA, Police, 1983 94% 6%
U.K., Emergency Rooms, 1988 83% 17%
U.S., FBI, 1996-2001 75% 25%
Canada, Spousal Homicide, 1995-2005 82% 18%

A Small Theorythat
Reconciles the Contradiction There is more than one type of partner violence The different types are differently gendered Both major sampling plans are biased
General survey studies are biased toward situationally-provoked violence, which women are as likely to perpetrate as are men
Agency studies are biased toward coercive controlling violence, perpetrated almost entirely by men
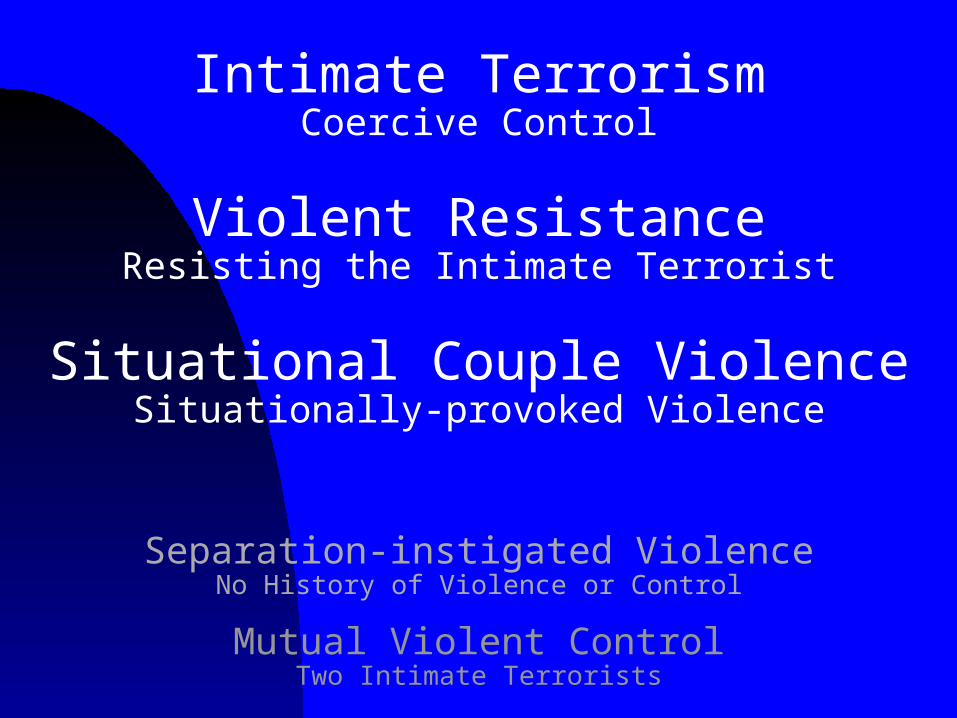
Intimate TerrorismCoercive Control
Violent ResistanceResisting the Intimate Terrorist
Situational Couple ViolenceSituationally-provoked Violence
Mutual Violent ControlTwo Intimate Terrorists
Separation-instigated ViolenceNo History of Violence or Control
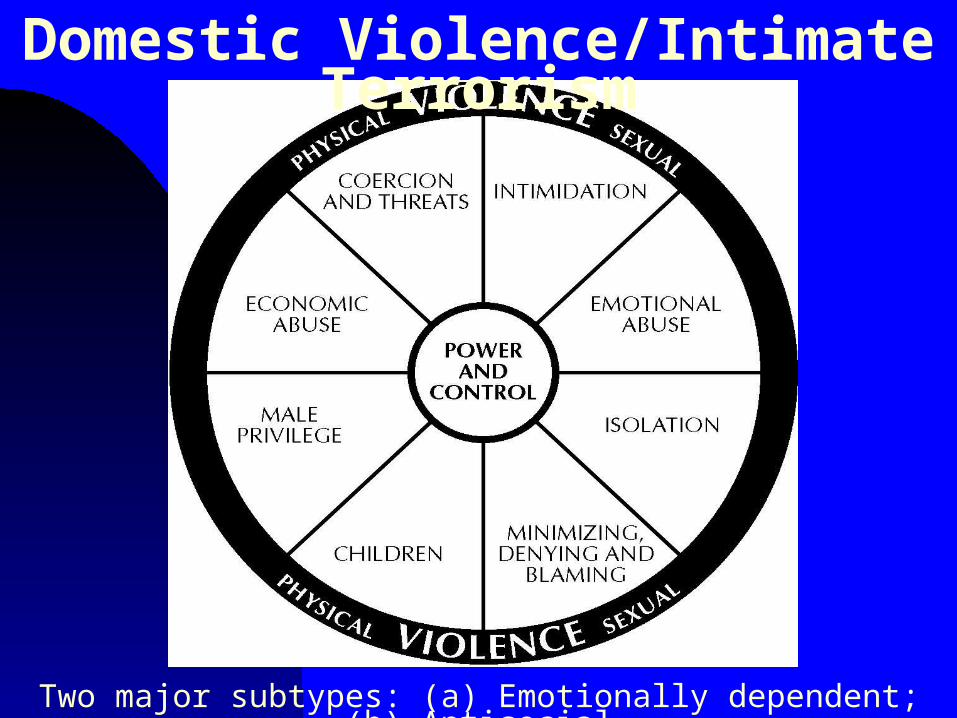
Domestic Violence/Intimate Terrorism
Two major subtypes: (a) Emotionally dependent; (b) Antisocial

Coercive Control ScaleThinking about your husband [yourself], would you say he [you]… is jealous or possessive? tries to provoke arguments? tries to limit your contact with family and friends? insists on knowing who you are with at all times? calls you names or puts you down in front of others? makes you feel inadequate? shouts or swears at you? frightens you? prevents you from knowing about or having access to the family
income even when you ask?
*These are items from the 1995 National Violence Against Women Survey (Tjaden & Thoennes, 1998). They should be asked regarding both partner and self (adapted as appropriate).
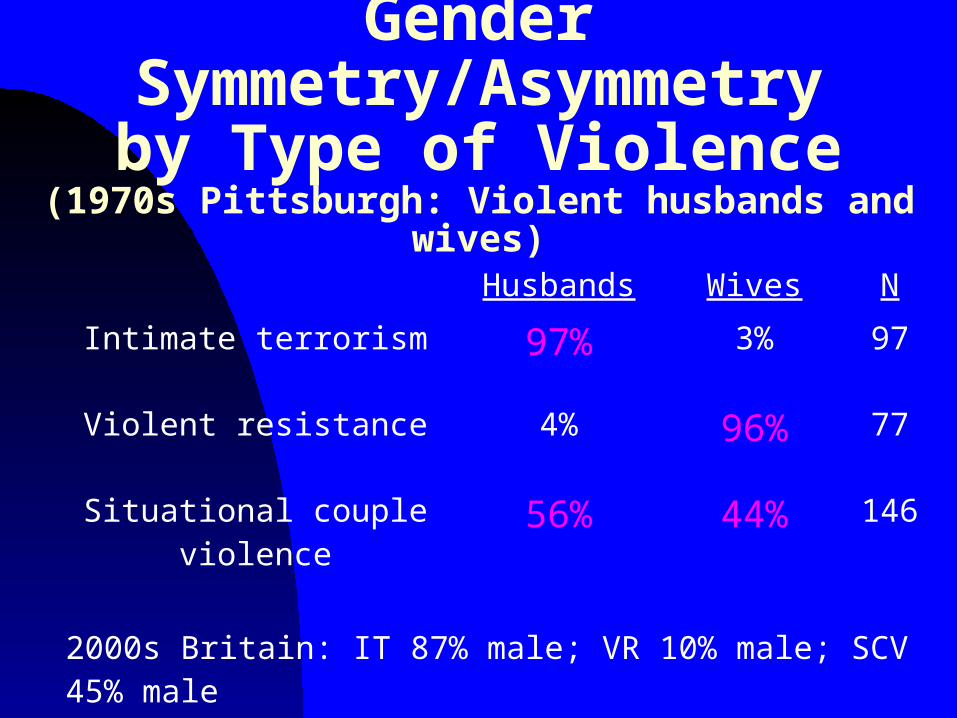
Gender Symmetry/Asymmetryby Type of Violence
(1970s Pittsburgh: Violent husbands and wives)
Husbands Wives N
Intimate terrorism 97% 3% 97
Violent resistance 4% 96% 77
Situational couple violence 56% 44% 146
2000s Britain: IT 87% male; VR 10% male; SCV 45% male
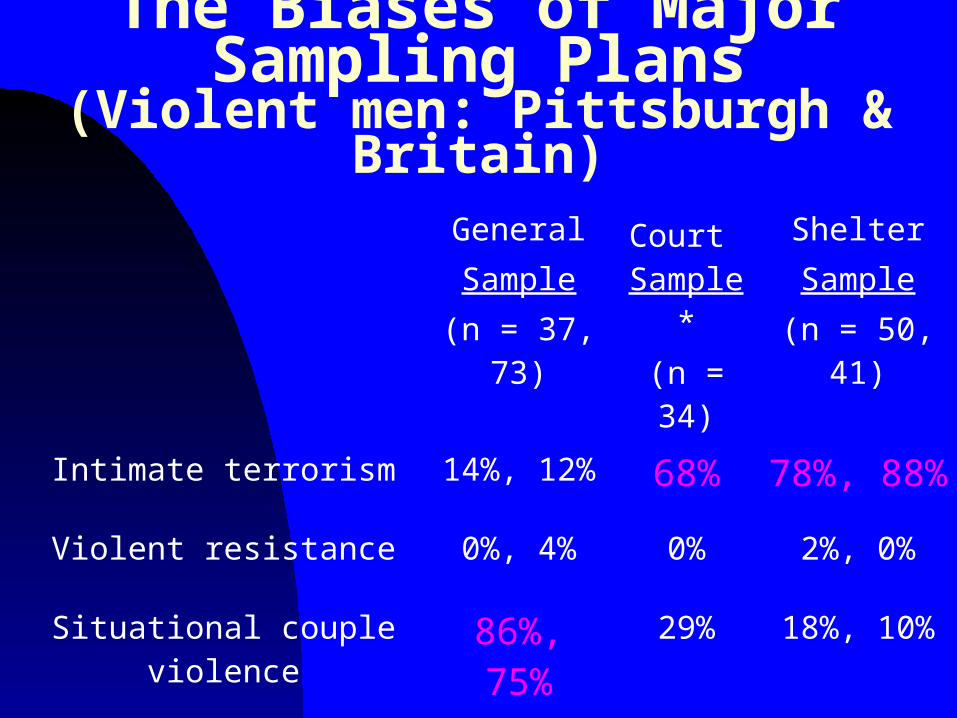
The Biases of Major Sampling Plans(Violent men: Pittsburgh & Britain)
GeneralSample
(n = 37, 73)
Court Sample*(n = 34)
ShelterSample
(n = 50, 41)
Intimate terrorism 14%, 12% 68% 78%, 88%
Violent resistance 0%, 4% 0% 2%, 0%
Situational couple violence 86%, 75% 29% 18%, 10%
*Pittsburgh only
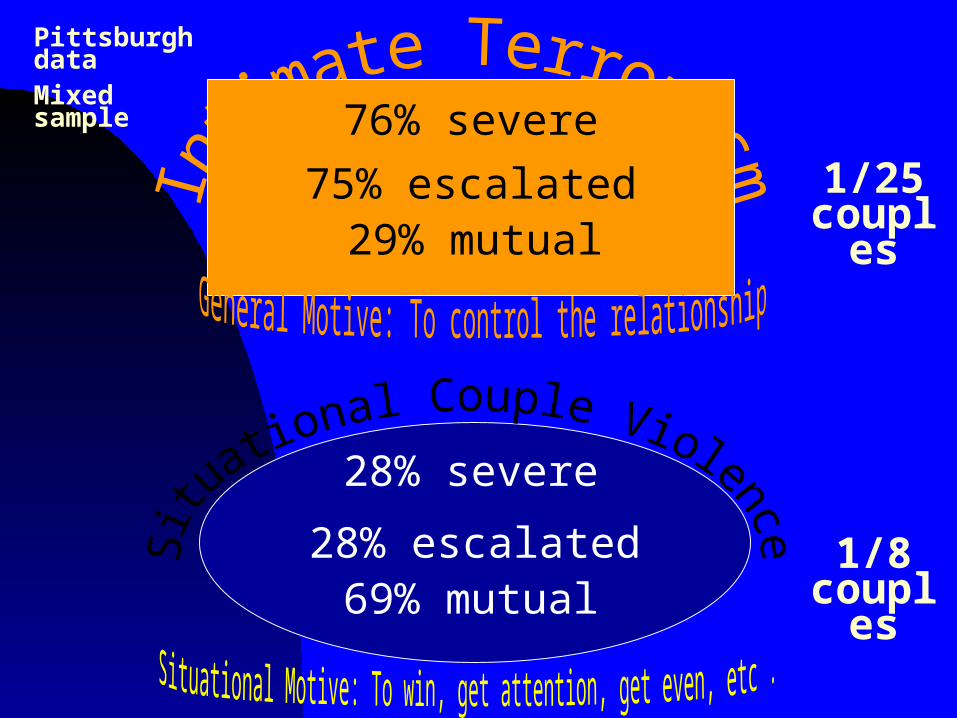
76% severe
75% escalated29% mutual
28% severe
28% escalated69% mutual
1/25 couples
1/8 couples
Pittsburgh dataMixed sample
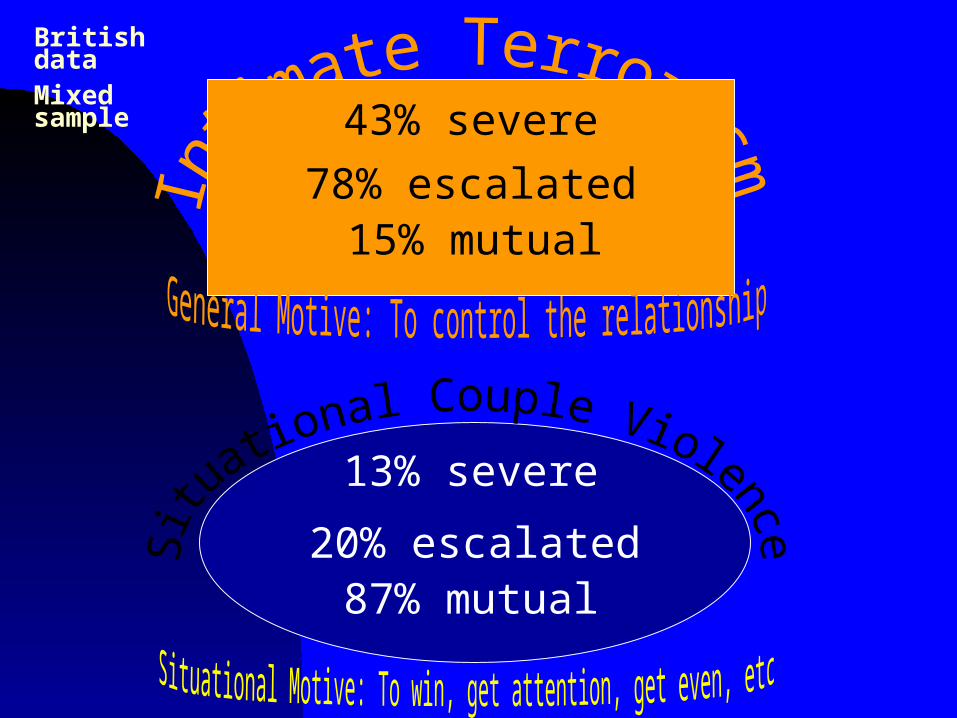
43% severe
78% escalated15% mutual
13% severe
20% escalated87% mutual
British dataMixed sample
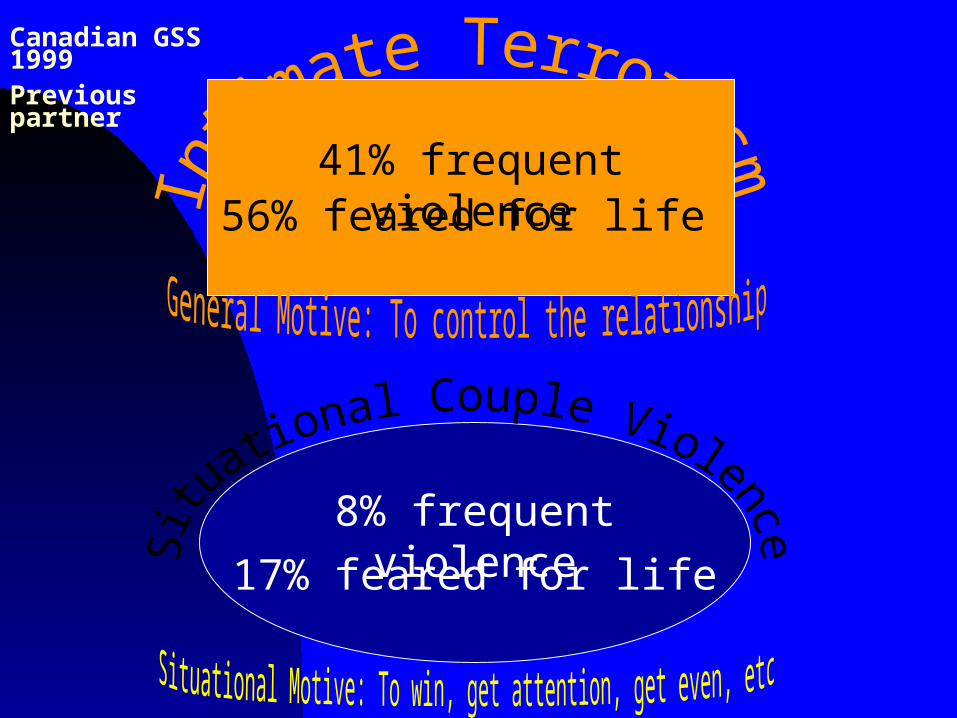
41% frequent violence56% feared for life
8% frequent violence
17% feared for life
Canadian GSS 1999Previous partner
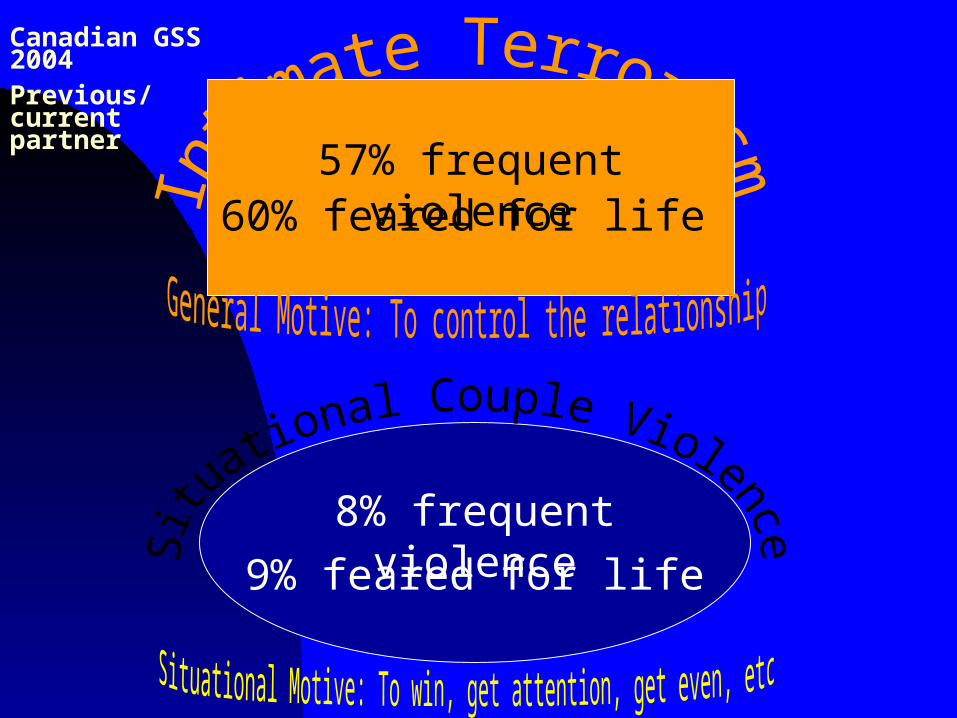
57% frequent violence60% feared for life
8% frequent violence
9% feared for life
Canadian GSS 2004Previous/current partner
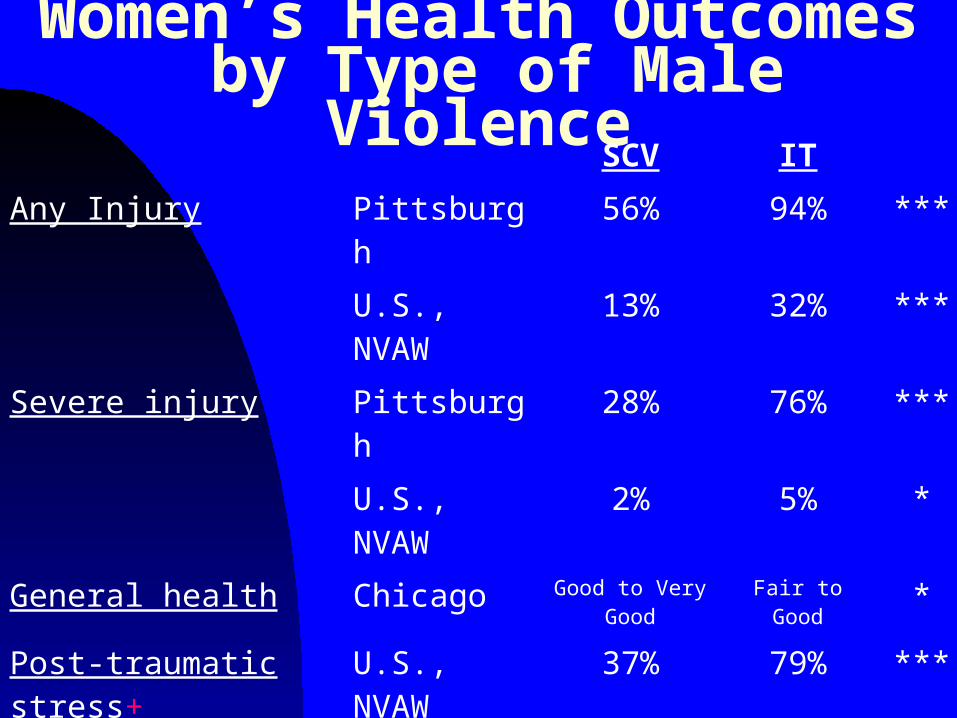
Women’s Health Outcomes by Type of Male Violence
SCV IT
Any Injury Pittsburgh 56% 94% ***
U.S., NVAW 13% 32% ***
Severe injury Pittsburgh 28% 76% ***
U.S., NVAW 2% 5% *
General health Chicago Good to Very Good
Fair to Good *
Post-traumatic stress+ U.S., NVAW 37% 79% ***
+ Percent above the median for female victims of partner violence
*.05 **.01 ***.001
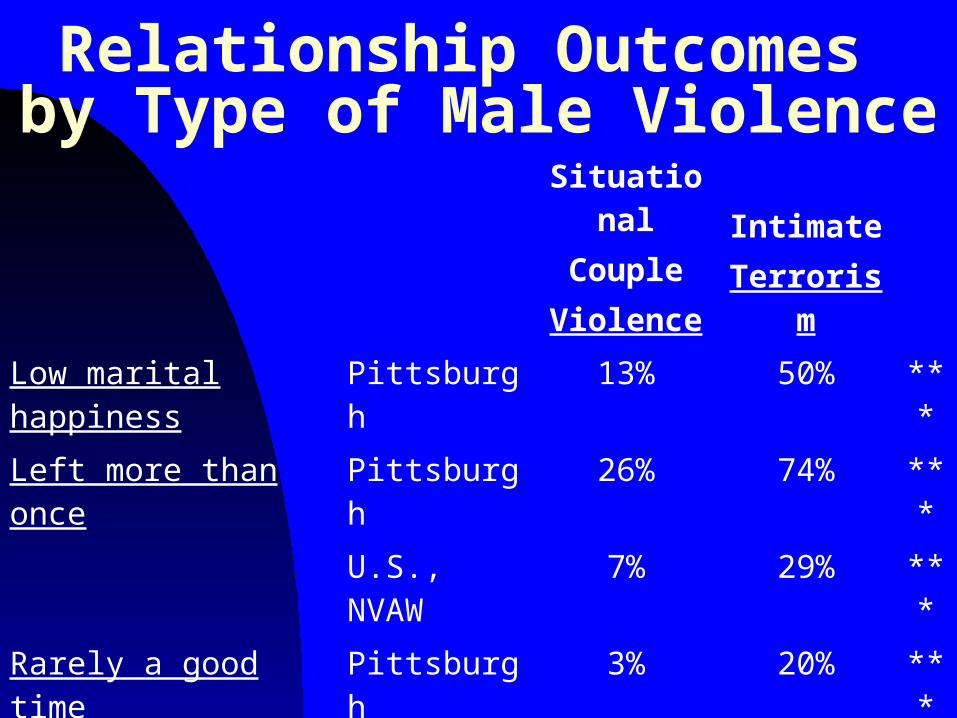
Relationship Outcomes by Type of Male Violence
SituationalCoupleViolence
IntimateTerrorism
Low marital happiness Pittsburgh 13% 50% ***
Left more than once Pittsburgh 26% 74% ***
U.S., NVAW 7% 29% ***
Rarely a good time Pittsburgh 3% 20% ***
Sex often unpleasant Pittsburgh 9% 23% ***
***.001

Need to Re-assess EverythingVarious Studies
Intergenerational “transmission” SCV d = .11; IT d = .35 SCV odds ratio = 2.40; IT odds ratio = 7.51
Marriage SCV b = -.62; IT b = .58
Gender traditionalism or hostility toward women Traditionalism: SCV d = -.14; IT d = .80 Hostility: non-viol., SCV, IT, IT = 154, 153, 135, 131
Gender, frequency, severity, escalation, mutuality, impact on victim, impact on children, etc.
Preview of Policy Implications Screening/triage
Primary prevention/education
Intervention with perpetrators
Intervention for survivors
Custody and access issues

We make big mistakes if we don’t make big distinctions.
Different types of partner violence have…
Different causes Different developmental trajectories Different effects Different successful intervention strategies

Support Your Local Women’s Shelter
Safety Support Information Advocacy
Philadelphia, PA shelter
Photos from Donna Ferrato, Living with the Enemy. New York: Aperture, 1991
Recommended