
Ubiquitous Solution CompanyUbiquitous Solution Company
KDDI CORPORATIONKDDI CORPORATION
Interim Financial Results of the Fiscal Year ending March 2005
Tadashi OnoderaPresident
October 28, 2004
IR Meeting
The figures included in the following brief, including the businessperformance target and the target for the number of subscribers are allprojected data based on the information currently available to the KDDIGroup, and are subject to variable factors such as economic conditions, acompetitive environment and the future prospects for newly introducedservices.Accordingly, please be advised that the actual results of businessperformance or of the number of subscribers may differ substantially fromthe projections described here.
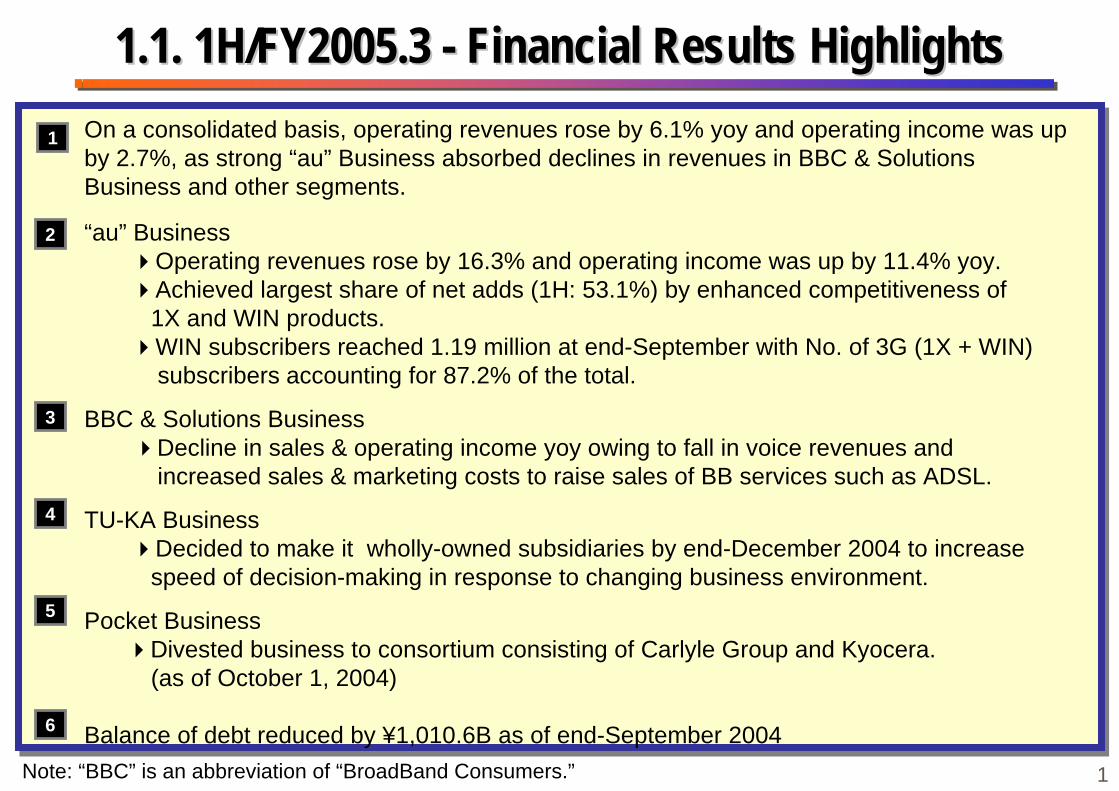
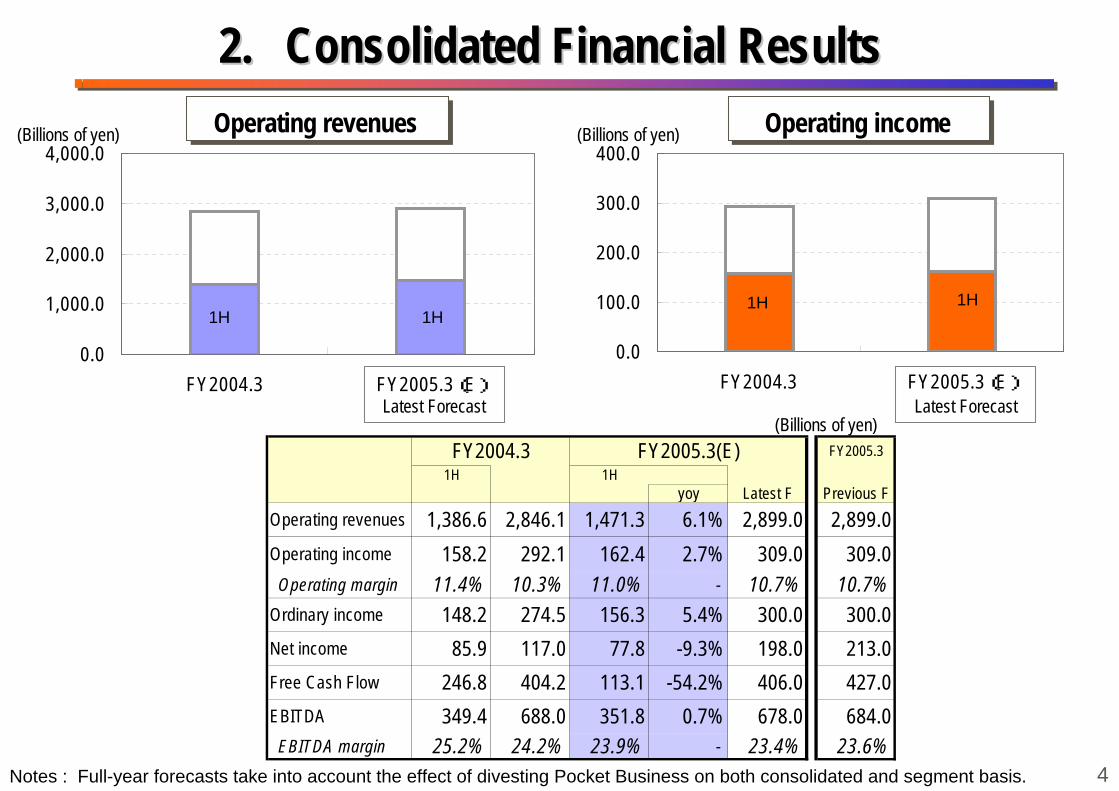
On a consolidated basis, operating revenues rose by 6.1% yoy and operating income was upby 2.7%, as strong “au” Business absorbed declines in revenues in BBC & SolutionsBusiness and other segments.
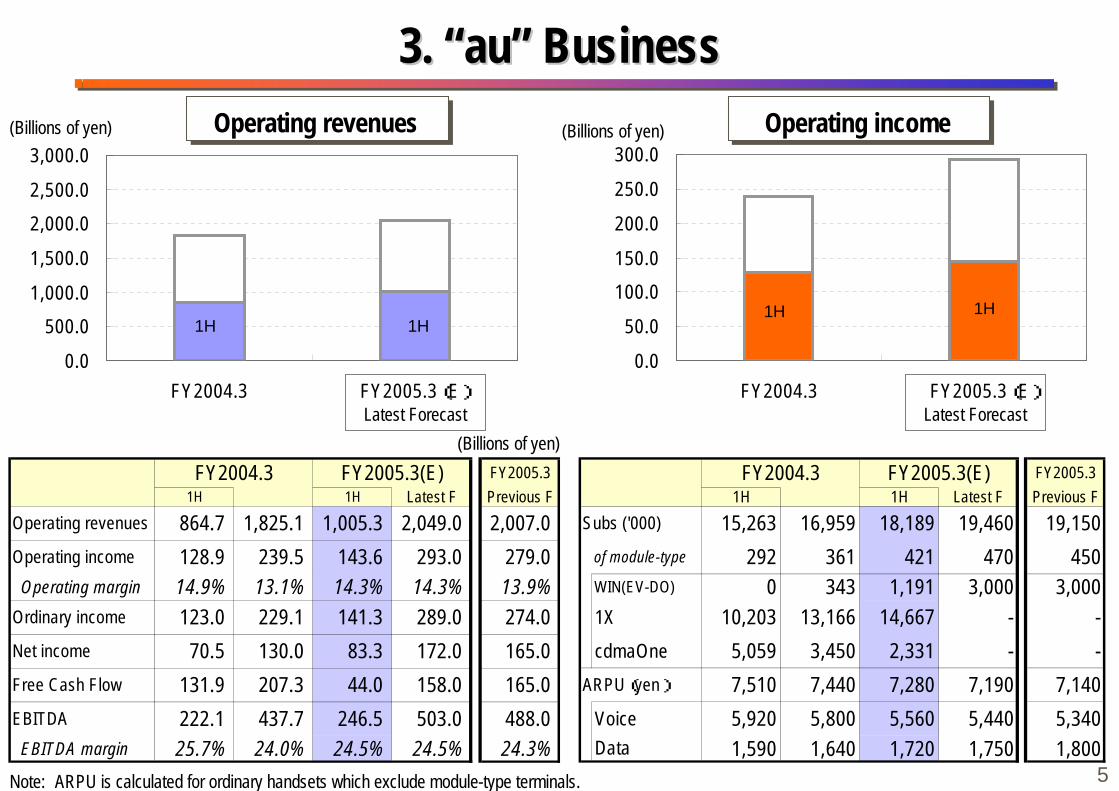
“au” Business Operating revenues rose by 16.3% and operating income was up by 11.4% yoy. Achieved largest share of net adds (1H: 53.1%) by enhanced competitiveness of 1X and WIN products. WIN subscribers reached 1.19 million at end-September with No. of 3G (1X + WIN) subscribers accounting for 87.2% of the total.
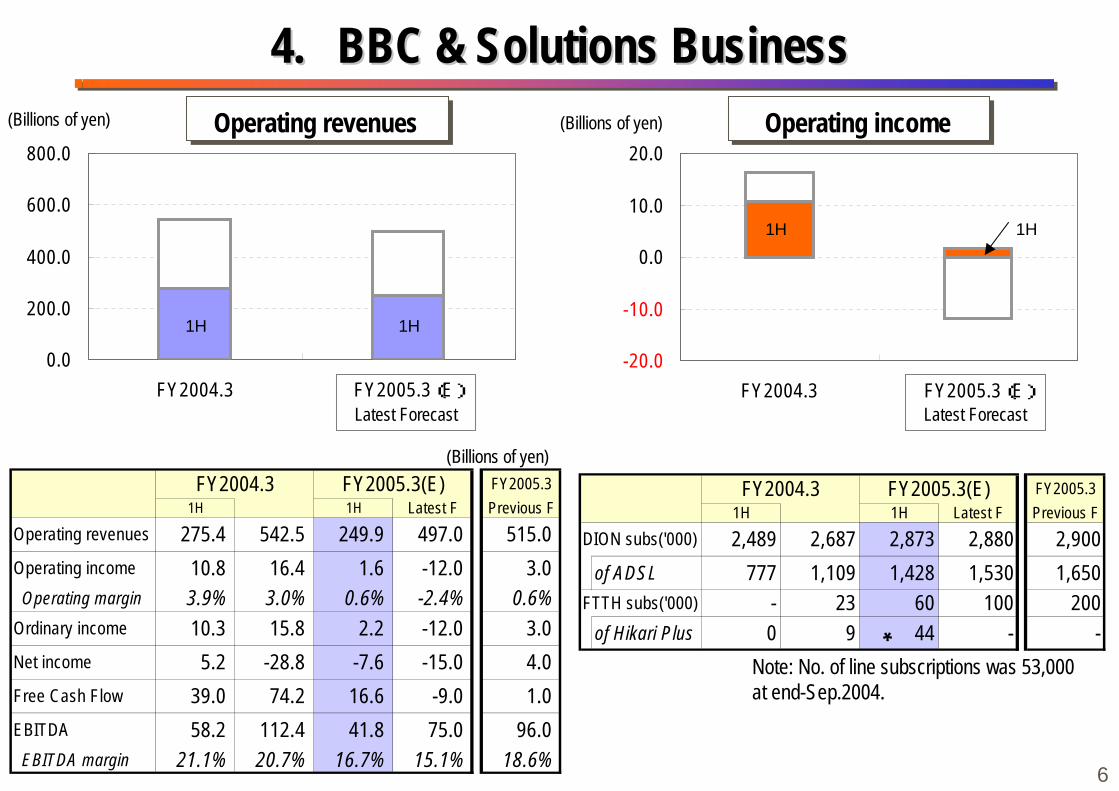
BBC & Solutions Business Decline in sales & operating income yoy owing to fall in voice revenues and increased sales & marketing costs to raise sales of BB services such as ADSL.
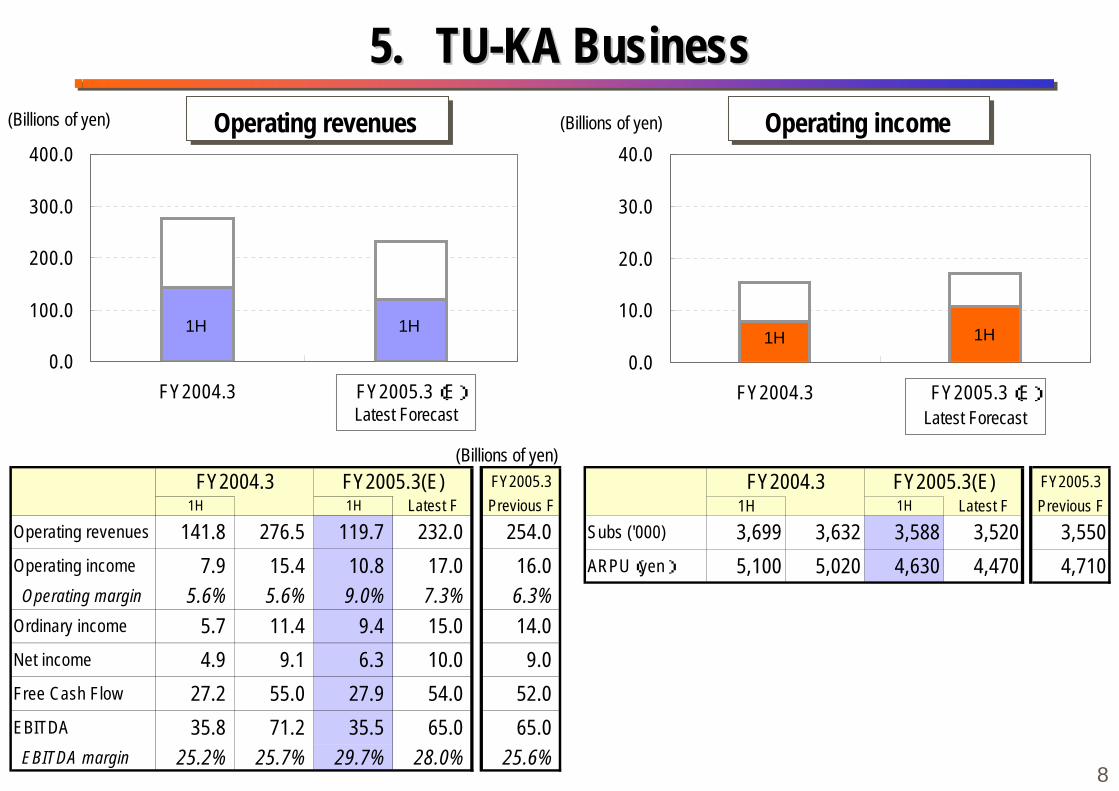
TU-KA Business Decided to make it wholly-owned subsidiaries by end-December 2004 to increase speed of decision-making in response to changing business environment.
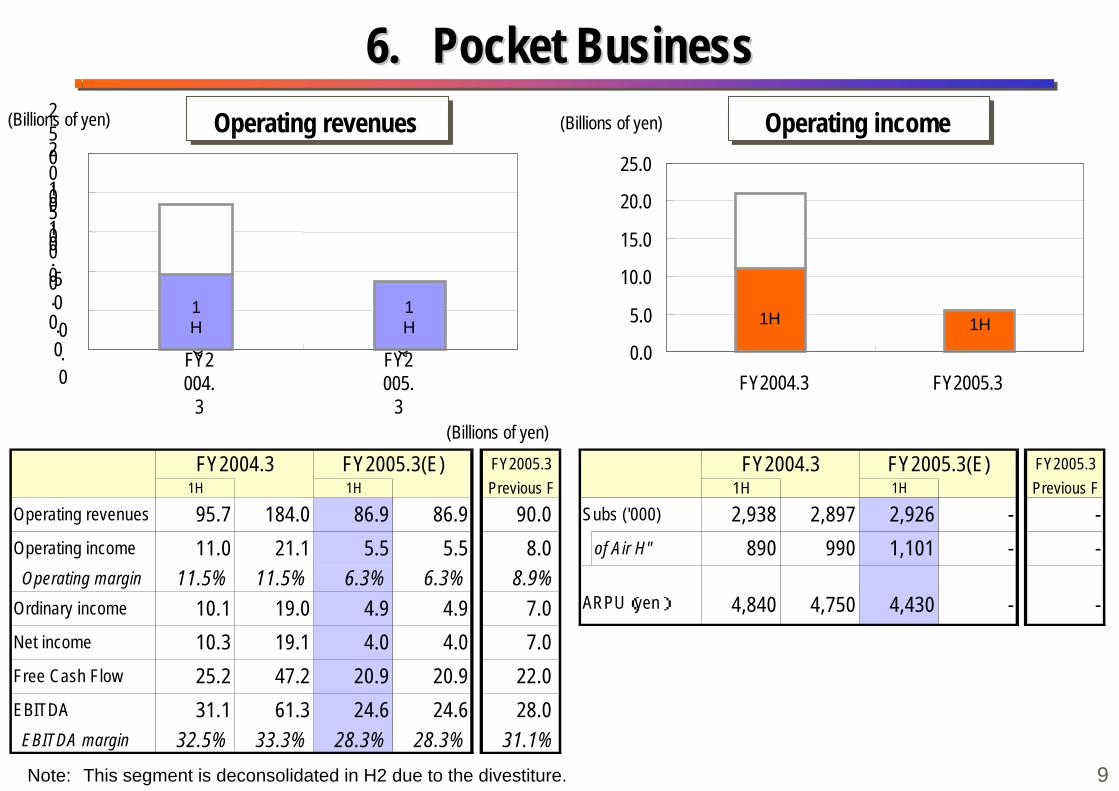
Pocket Business Divested business to consortium consisting of Carlyle Group and Kyocera. (as of October 1, 2004)
Balance of debt reduced by ¥1,010.6B as of end-September 2004Note: “BBC” is an abbreviation of “BroadBand Consumers.”
1
2
3
4
1.1. 11.1. 1H/FY2005.3 - Financial Results HighlightsH/FY2005.3 - Financial Results Highlights
5
6
1
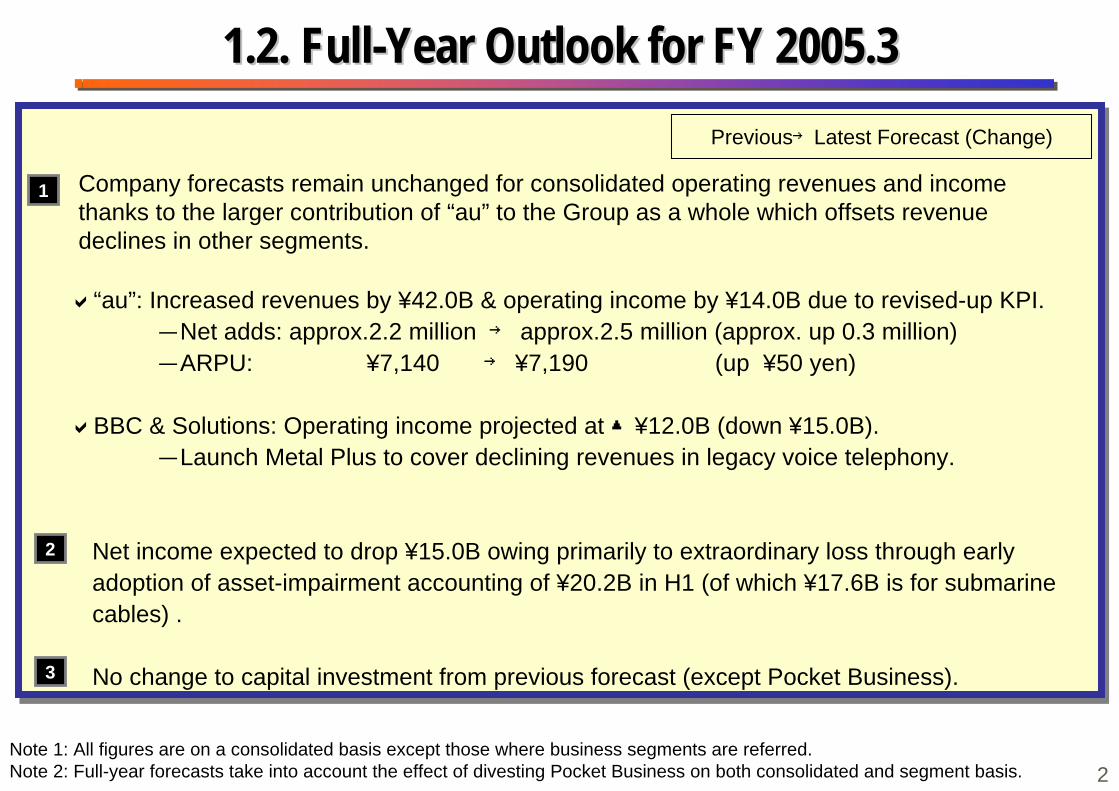
Company forecasts remain unchanged for consolidated operating revenues and income thanks to the larger contribution of “au” to the Group as a whole which offsets revenue declines in other segments.
“au”: Increased revenues by ¥42.0B & operating income by ¥14.0B due to revised-up KPI.-Net adds: approx.2.2 million → approx.2.5 million (approx. up 0.3 million)-ARPU: ¥7,140 → ¥7,190 (up ¥50 yen)
BBC & Solutions: Operating income projected at ▲¥12.0B (down ¥15.0B).-Launch Metal Plus to cover declining revenues in legacy voice telephony.
Net income expected to drop ¥15.0B owing primarily to extraordinary loss through earlyadoption of asset-impairment accounting of ¥20.2B in H1 (of which ¥17.6B is for submarinecables) .
No change to capital investment from previous forecast (except Pocket Business).
1.2. 1.2. Full-Year Outlook for FY 2005.3Full-Year Outlook for FY 2005.3
Note 1: All figures are on a consolidated basis except those where business segments are referred.Note 2: Full-year forecasts take into account the effect of divesting Pocket Business on both consolidated and segment basis.
Previous→Latest Forecast (Change)
1
2
3
2
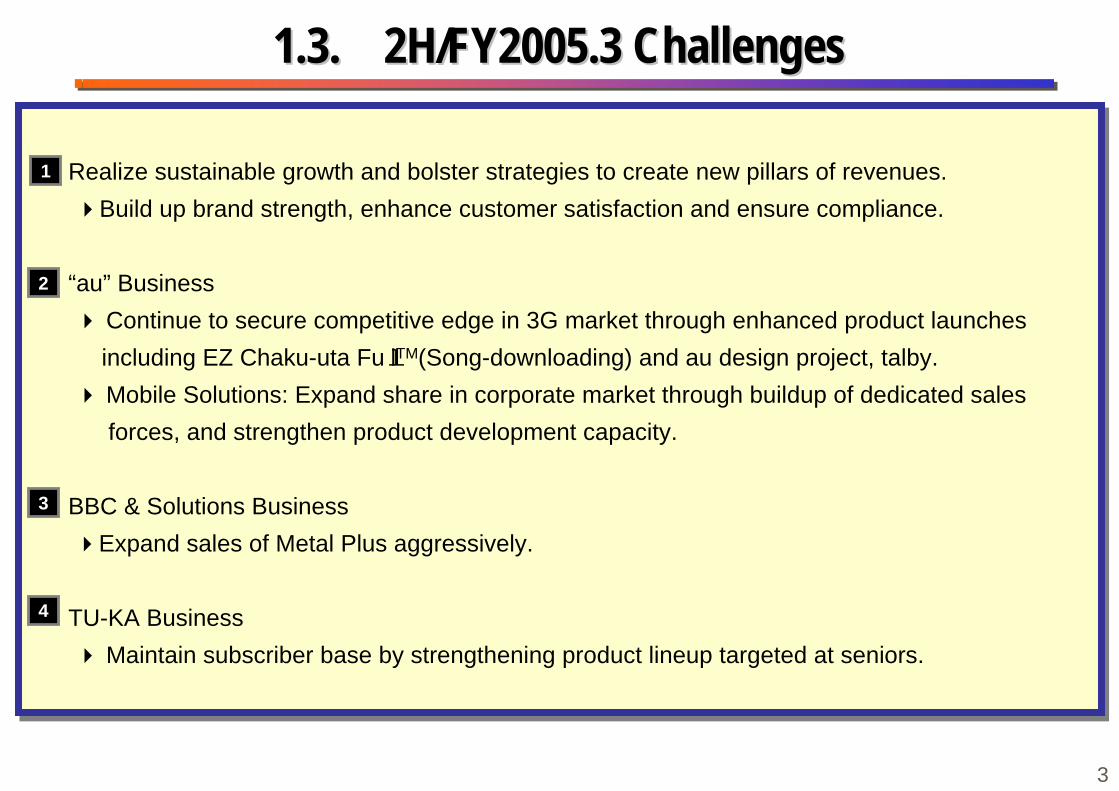
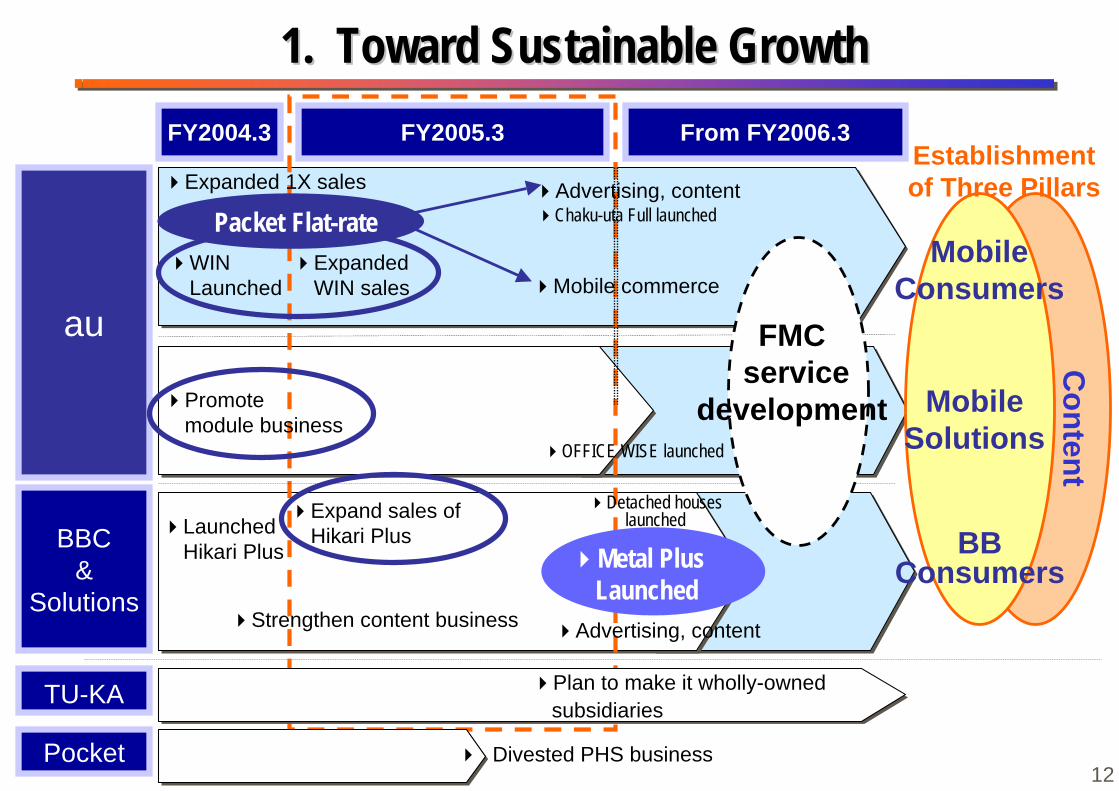
Realize sustainable growth and bolster strategies to create new pillars of revenues. Build up brand strength, enhance customer satisfaction and ensure compliance.
“au” Business Continue to secure competitive edge in 3G market through enhanced product launches including EZ Chaku-uta FullTM(Song-downloading) and au design project, talby. Mobile Solutions: Expand share in corporate market through buildup of dedicated sales forces, and strengthen product development capacity.
BBC & Solutions Business Expand sales of Metal Plus aggressively.
TU-KA Business Maintain subscriber base by strengthening product lineup targeted at seniors.
1.3. 1.3. 22H/FY2005.3 ChallengesH/FY2005.3 Challenges
1
2
3
4
3
0.0
100.0
200.0
300.0
400.0
FY2004.3 FY2005.3(E)0.0
1,000.0
2,000.0
3,000.0
4,000.0
FY2004.3 FY2005.3(E)Latest Forecast
(Billions of yen)
Operating revenues Operating income(Billions of yen) (Billions of yen)
2.2. Consolidated Financial ResultsConsolidated Financial Results
Latest Forecast
1H 1H1H 1H
FY2004.3 FY2005.3(E) FY2005.31H 1H
yoy Latest F Previous FOperating revenues 1,386.6 2,846.1 1,471.3 6.1% 2,899.0 2,899.0Operating income 158.2 292.1 162.4 2.7% 309.0 309.0 Operating margin 11.4% 10.3% 11.0% - 10.7% 10.7%Ordinary income 148.2 274.5 156.3 5.4% 300.0 300.0Net income 85.9 117.0 77.8 -9.3% 198.0 213.0Free Cash Flow 246.8 404.2 113.1 -54.2% 406.0 427.0EBITDA 349.4 688.0 351.8 0.7% 678.0 684.0 EBITDA margin 25.2% 24.2% 23.9% - 23.4% 23.6%
4Notes : Full-year forecasts take into account the effect of divesting Pocket Business on both consolidated and segment basis.
0.0
500.01,000.0
1,500.0
2,000.02,500.0
3,000.0
FY2004.3 FY2005.3(E)
(Billions of yen)
Operating revenues Operating income(Billions of yen) (Billions of yen)
Note: ARPU is calculated for ordinary handsets which exclude module-type terminals.
3. 3. ““auau”” Business Business
0.0
50.0
100.0150.0
200.0
250.0
300.0
FY2004.3 FY2005.3(E)
1H 1H1H 1H
Latest Forecast Latest Forecast
5
FY2004.3 FY2005.3(E) FY2005.31H 1H Latest F Previous F
Operating revenues 864.7 1,825.1 1,005.3 2,049.0 2,007.0Operating income 128.9 239.5 143.6 293.0 279.0 Operating margin 14.9% 13.1% 14.3% 14.3% 13.9%Ordinary income 123.0 229.1 141.3 289.0 274.0Net income 70.5 130.0 83.3 172.0 165.0Free Cash Flow 131.9 207.3 44.0 158.0 165.0EBITDA 222.1 437.7 246.5 503.0 488.0 EBITDA margin 25.7% 24.0% 24.5% 24.5% 24.3%
FY2004.3 FY2005.3(E) FY2005.31H 1H Latest F Previous F
Subs ('000) 15,263 16,959 18,189 19,460 19,150 of module-type 292 361 421 470 450
WIN(EV-DO) 0 343 1,191 3,000 3,0001X 10,203 13,166 14,667 - -cdmaOne 5,059 3,450 2,331 - -
ARPU(yen) 7,510 7,440 7,280 7,190 7,140Voice 5,920 5,800 5,560 5,440 5,340Data 1,590 1,640 1,720 1,750 1,800
FY2004.3 FY2005.3(E) FY2005.31H 1H Latest F Previous F
DION subs('000) 2,489 2,687 2,873 2,880 2,900 of ADSL 777 1,109 1,428 1,530 1,650FTTH subs('000) - 23 60 100 200 of Hikari Plus 0 9 44 - -
-20.0
-10.0
0.0
10.0
20.0
FY2004.3 FY2005.3(E)0.0
200.0
400.0
600.0
800.0
FY2004.3 FY2005.3(E)
(Billions of yen)
Operating revenues Operating income(Billions of yen) (Billions of yen)
4.4. BBC & Solutions BusinessBBC & Solutions Business
Note: No. of line subscriptions was 53,000 at end-Sep.2004.
*
1H 1H
1H 1H
Latest Forecast Latest Forecast
6
FY2004.3 FY2005.3(E) FY2005.31H 1H Latest F Previous F
Operating revenues 275.4 542.5 249.9 497.0 515.0Operating income 10.8 16.4 1.6 -12.0 3.0 Operating margin 3.9% 3.0% 0.6% -2.4% 0.6%Ordinary income 10.3 15.8 2.2 -12.0 3.0Net income 5.2 -28.8 -7.6 -15.0 4.0Free Cash Flow 39.0 74.2 16.6 -9.0 1.0EBITDA 58.2 112.4 41.8 75.0 96.0 EBITDA margin 21.1% 20.7% 16.7% 15.1% 18.6%
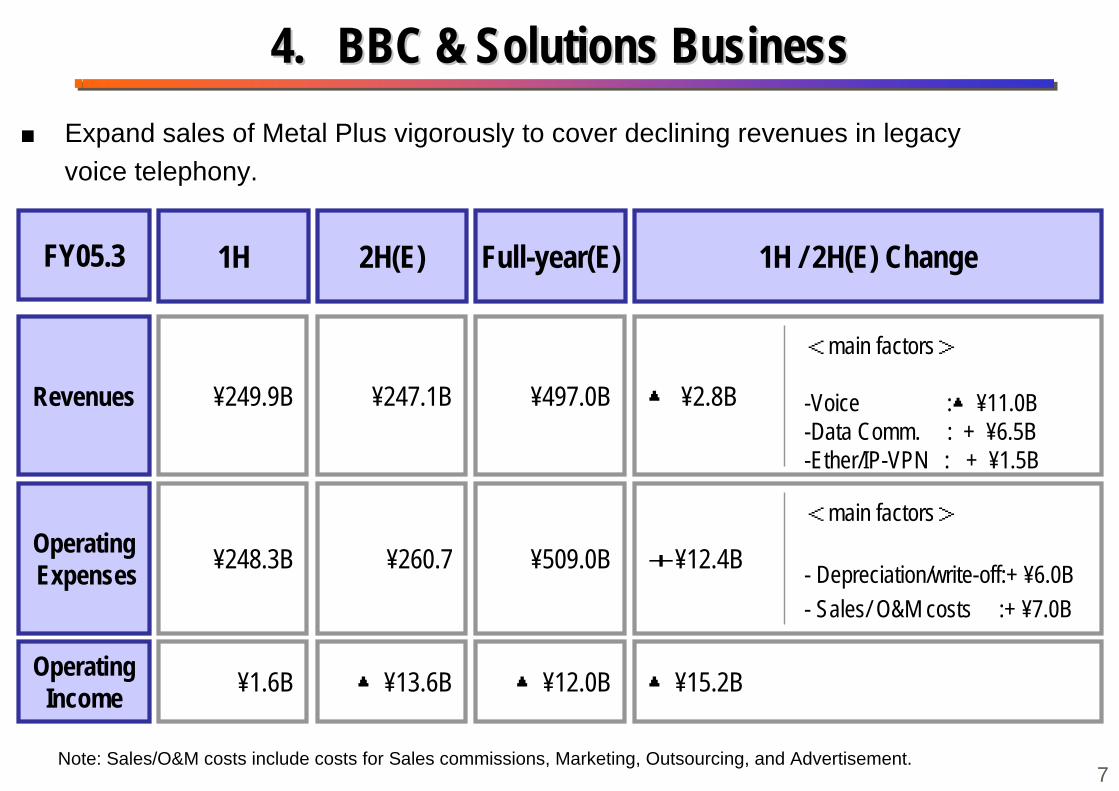
4.4. BBC & Solutions BusinessBBC & Solutions Business■ Expand sales of Metal Plus vigorously to cover declining revenues in legacy voice telephony.
1H Full-year(E)FY05.3
¥249.9BRevenues ¥497.0B
2H(E)
¥247.1B
1H / 2H(E) Change
▲ ¥2.8B
¥248.3BOperating Expenses ¥509.0B¥260.7 +¥12.4B
¥1.6BOperatingIncome ▲¥12.0B▲¥13.6B ▲¥15.2B
<main factors>
-Voice :▲¥11.0B-Data Comm. : + ¥6.5B-Ether/IP-VPN : + ¥1.5B
<main factors>
- Depreciation/write-off:+ ¥6.0B- Sales/ O&M costs :+ ¥7.0B
Note: Sales/O&M costs include costs for Sales commissions, Marketing, Outsourcing, and Advertisement.7
0.0
10.0
20.0
30.0
40.0
FY2004.3 FY2005.3(E)
(Billions of yen)
Operating revenues Operating income(Billions of yen) (Billions of yen)
5.5. TU-KA BusinessTU-KA Business
1Q 1Q0.0
100.0
200.0
300.0
400.0
FY2004.3 FY2005.3(E)
1H 1H1H 1H
Latest Forecast Latest Forecast
8
FY2004.3 FY2005.3(E) FY2005.31H 1H Latest F Previous F
Operating revenues 141.8 276.5 119.7 232.0 254.0Operating income 7.9 15.4 10.8 17.0 16.0 Operating margin 5.6% 5.6% 9.0% 7.3% 6.3%Ordinary income 5.7 11.4 9.4 15.0 14.0Net income 4.9 9.1 6.3 10.0 9.0Free Cash Flow 27.2 55.0 27.9 54.0 52.0EBITDA 35.8 71.2 35.5 65.0 65.0 EBITDA margin 25.2% 25.7% 29.7% 28.0% 25.6%
FY2004.3 FY2005.3(E) FY2005.31H 1H Latest F Previous F
Subs ('000) 3,699 3,632 3,588 3,520 3,550ARPU(yen) 5,100 5,020 4,630 4,470 4,710
(Billions of yen)
Operating revenues Operating income(Billions of yen) (Billions of yen)
6.6. Pocket BusinessPocket Business
1Q
1Q
0.0
50.0
100.0
150.0
200.0
250.0
FY2004.
3
FY2005.
3
1H
1H
0.0
5.0
10.0
15.0
20.0
25.0
FY2004.3 FY2005.3
1H 1H
9Note: This segment is deconsolidated in H2 due to the divestiture.
FY2004.3 FY2005.3(E) FY2005.31H 1H Previous F
Operating revenues 95.7 184.0 86.9 86.9 90.0Operating income 11.0 21.1 5.5 5.5 8.0 Operating margin 11.5% 11.5% 6.3% 6.3% 8.9%Ordinary income 10.1 19.0 4.9 4.9 7.0Net income 10.3 19.1 4.0 4.0 7.0Free Cash Flow 25.2 47.2 20.9 20.9 22.0EBITDA 31.1 61.3 24.6 24.6 28.0 EBITDA margin 32.5% 33.3% 28.3% 28.3% 31.1%
FY2004.3 FY2005.3(E) FY2005.31H 1H Previous F
Subs ('000) 2,938 2,897 2,926 - -of Air H" 890 990 1,101 - -
ARPU(yen) 4,840 4,750 4,430 - -
(Billions of yen)
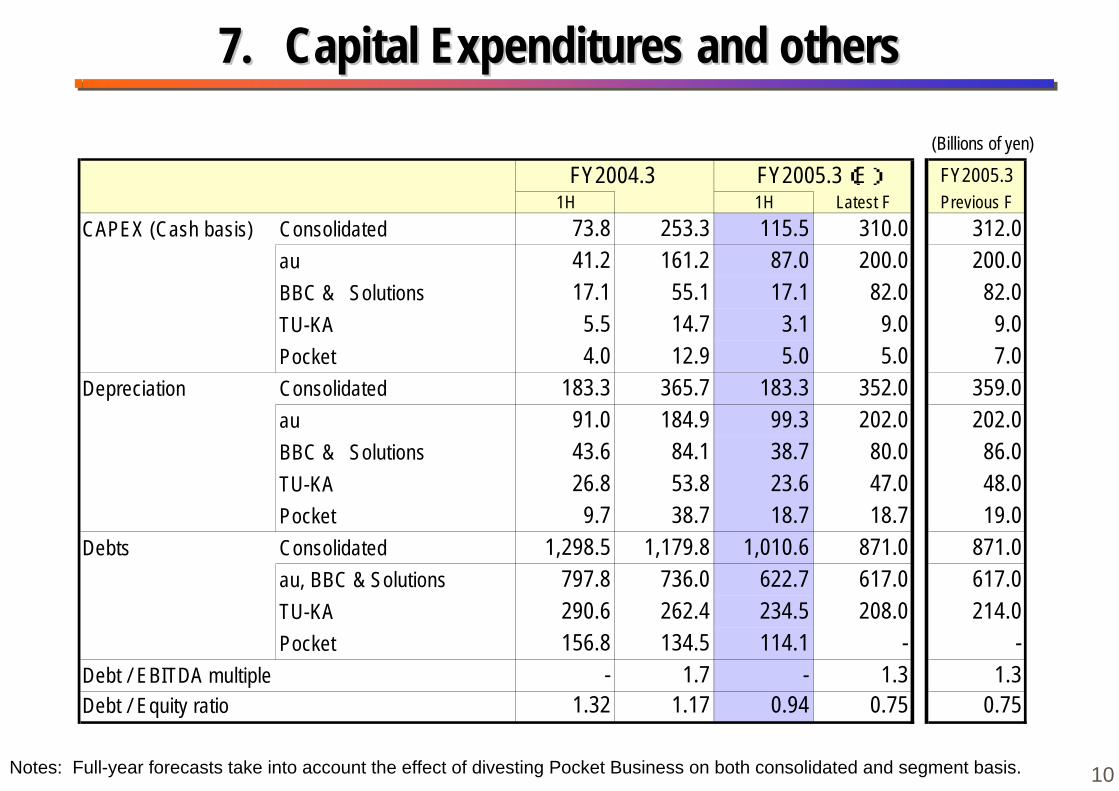
7.7. Capital Expenditures and othersCapital Expenditures and others
Notes: Full-year forecasts take into account the effect of divesting Pocket Business on both consolidated and segment basis. 10
FY2004.3 FY2005.3(E) FY2005.31H 1H Latest F Previous F
CAPEX (Cash basis) Consolidated 73.8 253.3 115.5 310.0 312.0au 41.2 161.2 87.0 200.0 200.0BBC & Solutions 17.1 55.1 17.1 82.0 82.0TU-KA 5.5 14.7 3.1 9.0 9.0Pocket 4.0 12.9 5.0 5.0 7.0
Depreciation Consolidated 183.3 365.7 183.3 352.0 359.0au 91.0 184.9 99.3 202.0 202.0BBC & Solutions 43.6 84.1 38.7 80.0 86.0TU-KA 26.8 53.8 23.6 47.0 48.0Pocket 9.7 38.7 18.7 18.7 19.0
Debts Consolidated 1,298.5 1,179.8 1,010.6 871.0 871.0au, BBC & Solutions 797.8 736.0 622.7 617.0 617.0TU-KA 290.6 262.4 234.5 208.0 214.0Pocket 156.8 134.5 114.1 - -
Debt / EBITDA multiple - 1.7 - 1.3 1.3Debt / Equity ratio 1.32 1.17 0.94 0.75 0.75
Segment Discussions & StrategiesSegment Discussions & Strategies
KDDI-wideKDDI-wideMeasuresMeasures ““auau”” Business Business
BBC BBC && SolutionsSolutionsBusinessBusiness TU-KATU-KA BusinessBusiness
11
FY2005.3
au
BBC&
Solutions
FY2004.3
Expand sales ofHikari Plus
MobileConsumers
MobileSolutions
BBConsumers
Promotemodule business
Mobile commerce
LaunchedHikari Plus
Strengthen content business
Advertising, content
Advertising, content
FMC service
development
From FY2006.3Establishmentof Three Pillars
1.1. Toward Sustainable GrowthToward Sustainable Growth
Expanded 1X sales
Content
Packet Flat-rateWINLaunched
ExpandedWIN sales
Chaku-uta Full launched
Detached houseslaunched
OFFICE WISE launched
TU-KA
Plan to make it wholly-owned subsidiaries
Divested PHS business
Metal Plus Launched
12
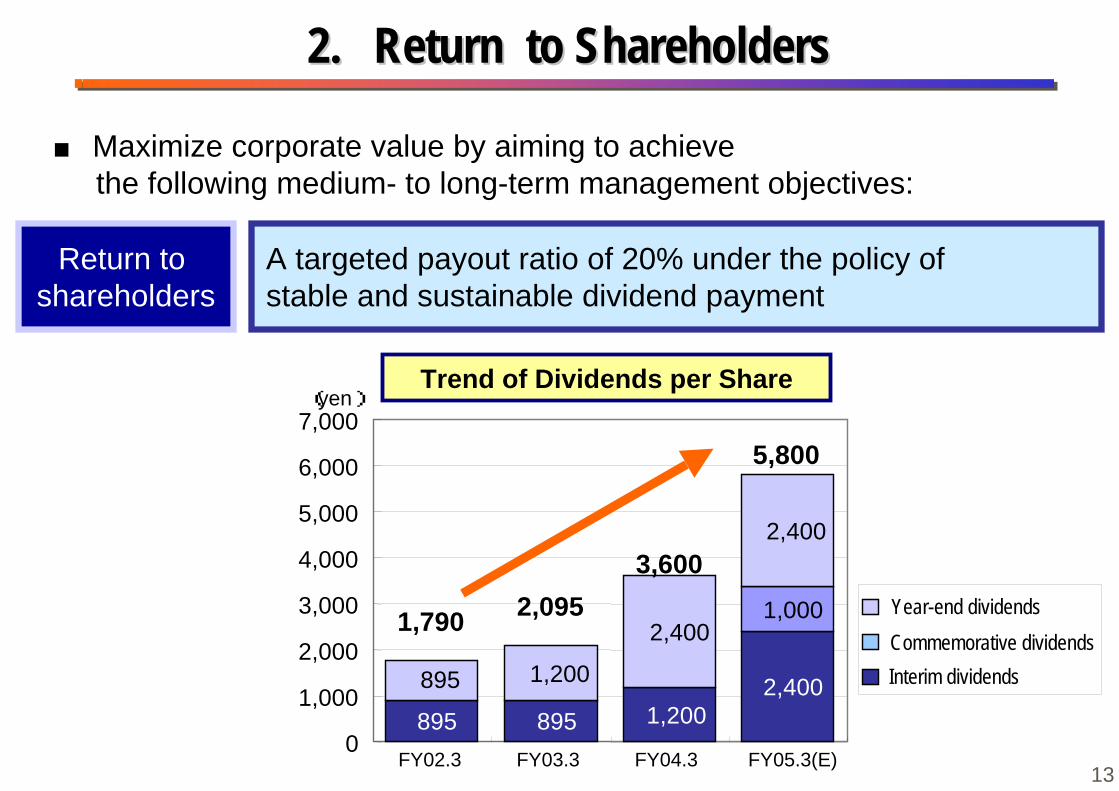
895 895 1,2002,400
1,000
895 1,200
2,400
2,400
0
1,000
2,000
3,000
4,000
5,000
6,000
7,000
FY02.3 FY03.3 FY04.3 FY05.3(E)
Year-end dividendsCommemorative dividendsInterim dividends
2.2. Return to ShareholdersReturn to Shareholders
Return to shareholders
A targeted payout ratio of 20% under the policy of stable and sustainable dividend payment
(yen)
1,790 2,0953,600
5,800
Trend of Dividends per Share
■ Maximize corporate value by aiming to achieve the following medium- to long-term management objectives:
13
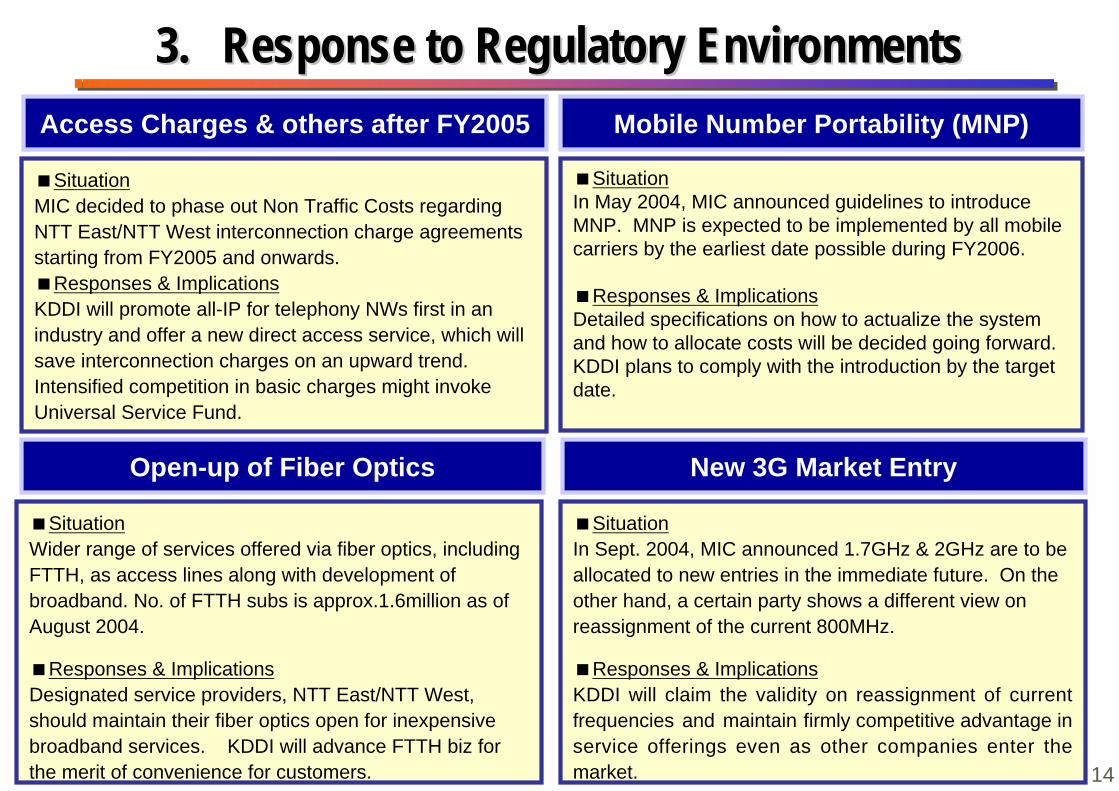
3.3. Response to Regulatory EnvironmentsResponse to Regulatory Environments
SituationMIC decided to phase out Non Traffic Costs regardingNTT East/NTT West interconnection charge agreementsstarting from FY2005 and onwards.
Responses & ImplicationsKDDI will promote all-IP for telephony NWs first in anindustry and offer a new direct access service, which willsave interconnection charges on an upward trend.Intensified competition in basic charges might invokeUniversal Service Fund.
Open-up of Fiber Optics
Access Charges & others after FY2005
SituationIn May 2004, MIC announced guidelines to introduceMNP. MNP is expected to be implemented by all mobilecarriers by the earliest date possible during FY2006.
Responses & ImplicationsDetailed specifications on how to actualize the systemand how to allocate costs will be decided going forward.KDDI plans to comply with the introduction by the targetdate.
SituationIn Sept. 2004, MIC announced 1.7GHz & 2GHz are to beallocated to new entries in the immediate future. On theother hand, a certain party shows a different view onreassignment of the current 800MHz.
Responses & ImplicationsKDDI will claim the validity on reassignment of currentfrequencies and maintain firmly competitive advantage inservice offerings even as other companies enter themarket.
New 3G Market Entry
Mobile Number Portability (MNP)
SituationWider range of services offered via fiber optics, includingFTTH, as access lines along with development ofbroadband. No. of FTTH subs is approx.1.6million as ofAugust 2004.
Responses & ImplicationsDesignated service providers, NTT East/NTT West,should maintain their fiber optics open for inexpensivebroadband services. KDDI will advance FTTH biz forthe merit of convenience for customers. 14
30,000
35,000
40,000
45,000
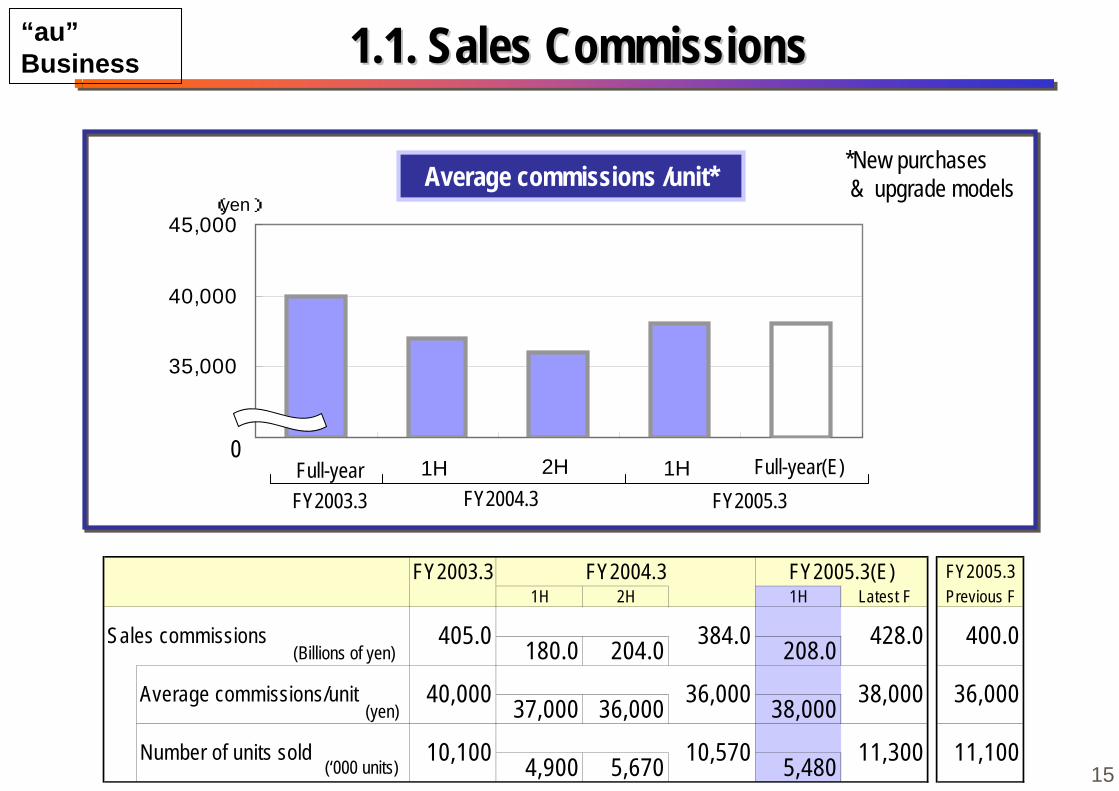
1.1. Sales Commissions1.1. Sales Commissions
(yen)
1H 2H 1H0
Full-year(E)
*New purchases & upgrade modelsAverage commissions /unit*
FY2005.3Full-yearFY2003.3 FY2004.3
FY2003.3 FY2004.3 FY2005.3(E) FY2005.31H 2H 1H Latest F Previous F
180.0 204.0 208.0
37,000 36,000 38,000
4,900 5,670 5,480 11,300Number of units sold 10,100 10,570
428.0
Average commissions/unit 40,000 36,000 38,000
Sales commissions 400.0
36,000
11,100
405.0 384.0(Billions of yen)
(yen)
(‘000 units)
“au”Business
15
0%
20%
40%
60%
80%
100%
0
100
200
300
400
500
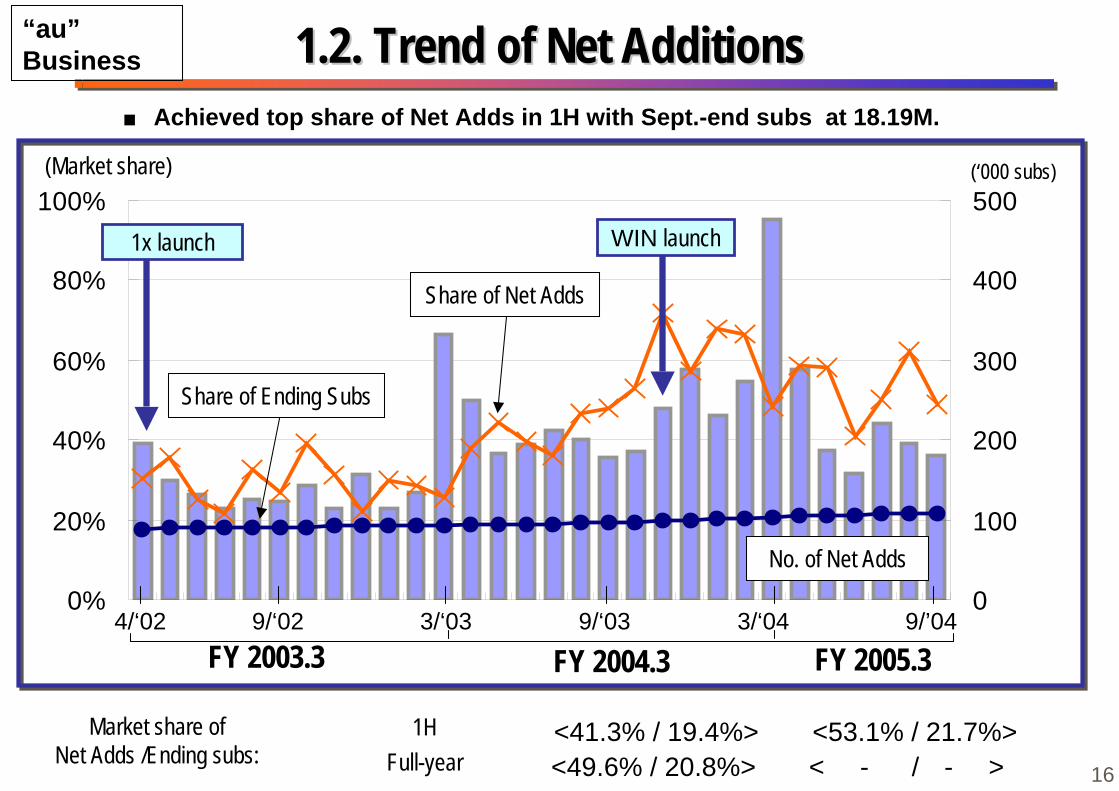
1.2. T1.2. Trend of Net Additionsrend of Net Additions
4/‘02 9/‘02 3/‘03 3/‘049/‘03
<49.6% / 20.8%>
9/’04
<53.1% / 21.7%> < - / - >
<41.3% / 19.4%>
■ Achieved top share of Net Adds in 1H with Sept.-end subs at 18.19M.
Market share of Net Adds /Ending subs: Full-year
1H
FY 2004.3FY 2003.3 FY 2005.3
1x launch
Share of Ending Subs
Share of Net Adds
WIN launch
No. of Net Adds
(‘000 subs)(Market share)
“au”Business
16
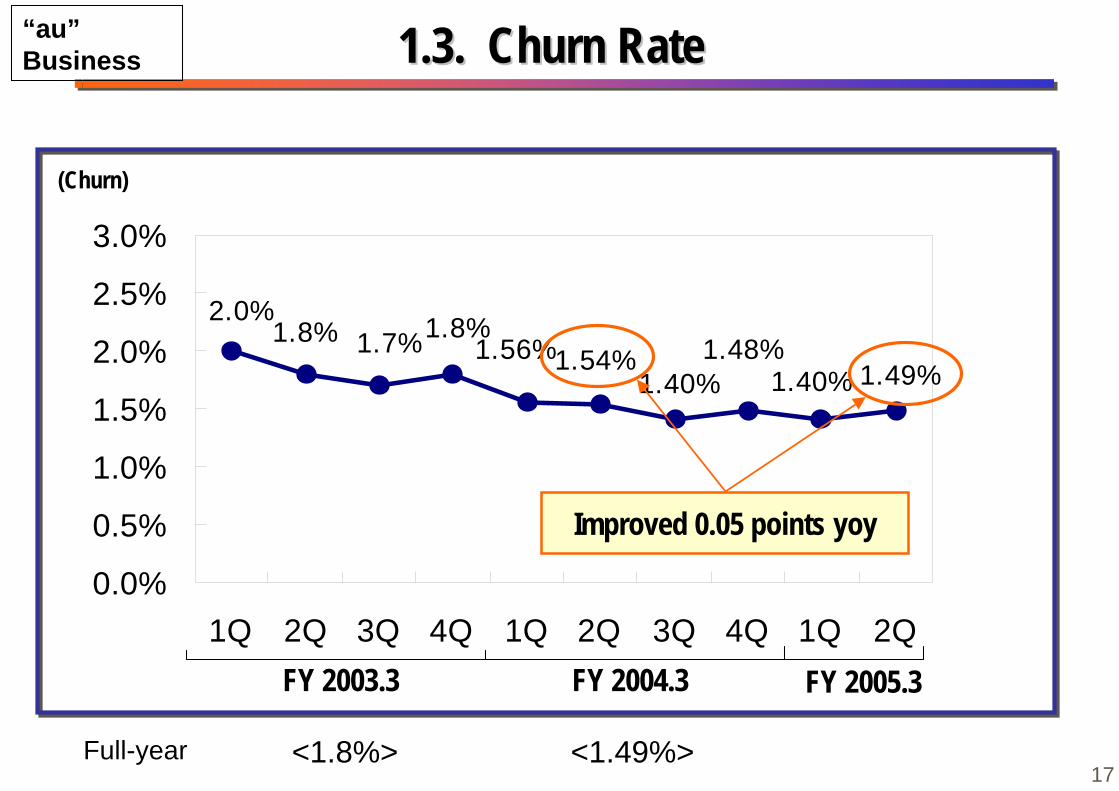
1.8% 1.56%1.49%1.40%
1.54%1.40%
1.48%1.7%1.8%2.0%
0.0%
0.5%
1.0%
1.5%
2.0%
2.5%
3.0%
1Q 2Q 3Q 4Q 1Q 2Q 3Q 4Q 1Q 2Q
<1.8%>
1.3. 1.3. Churn RateChurn Rate
<1.49%>
Improved 0.05 points yoy
FY 2003.3 FY 2004.3 FY 2005.3
(Churn)
Full-year
“au”Business
17
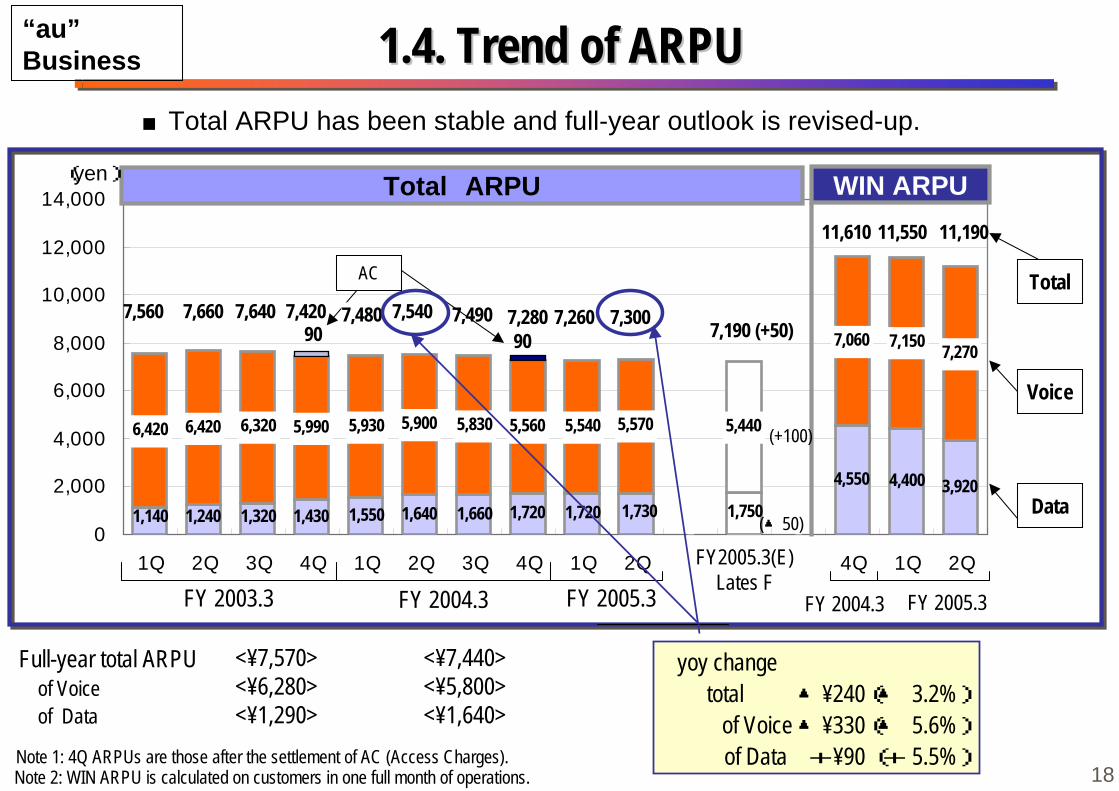
1,550 1,660
4,550 4,400 3,920
6,420 6,420 6,320 5,990 5,930 5,900 5,830 5,560 5,570 5,440
7,060 7,150 7,270
1,7501,7301,7201,4301,3201,2401,140 1,640 1,720
5,540
0
2,000
4,000
6,000
8,000
10,000
12,000
14,000
1Q 2Q 3Q 4Q 1Q 2Q 3Q 4Q 1Q 2Q 4Q 1Q 2Q
11,610
Total ARPU(yen) WIN ARPU
1.4. 1.4. Trend of ARPUTrend of ARPU■Total ARPU has been stable and full-year outlook is revised-up.
yoy change total ▲¥240(▲ 3.2%)
of Voice ▲¥330(▲ 5.6%) of Data +¥90 (+ 5.5%)
7,560 7,660 7,640 7,5407,4807,420 7,490 7,28090 90
11,550
7,260
AC
7,190 (+50)7,300
11,190
(+100)
(▲50)
<¥7,570><¥6,280><¥1,290>
Note 1: 4Q ARPUs are those after the settlement of AC (Access Charges).
<¥7,440><¥5,800><¥1,640>
Full-year total ARPU of Voice of Data
Note 2: WIN ARPU is calculated on customers in one full month of operations.
FY 2003.3 FY 2004.3 FY 2005.3
Voice
Total
Data
FY2005.3(E)Lates F
FY 2004.3 FY 2005.3
“au”Business
18
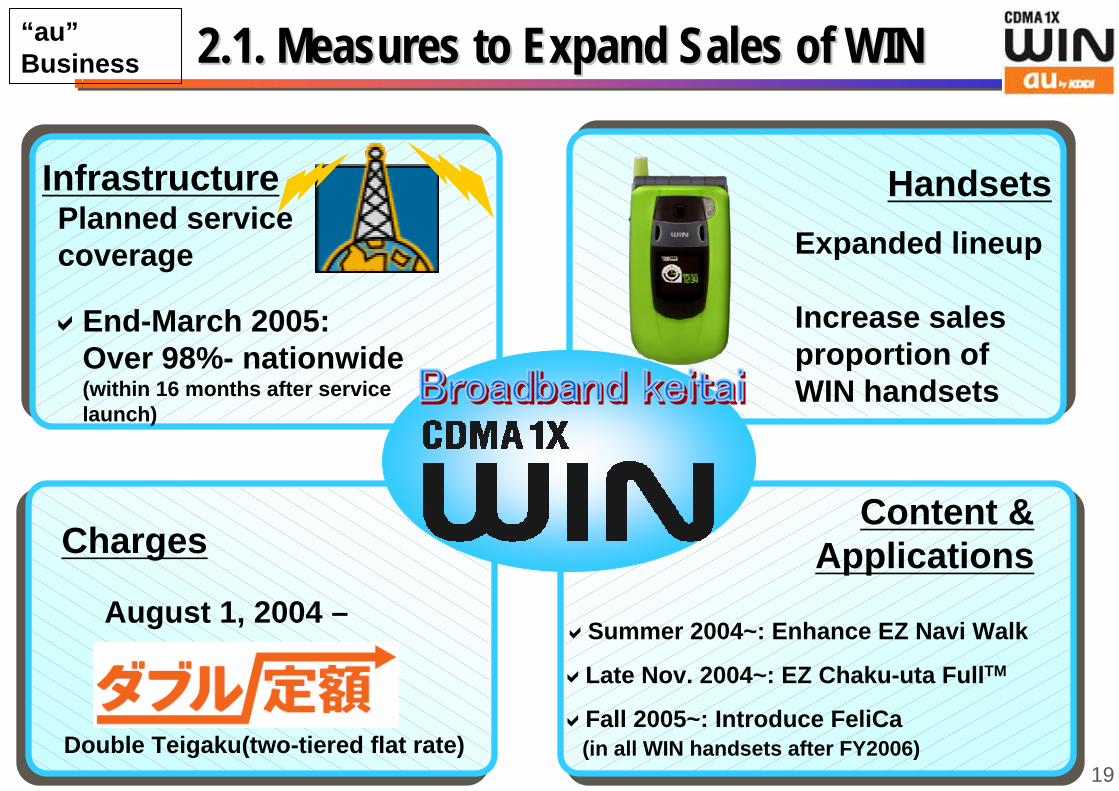
Infrastructure
Charges
Planned service coverage
August 1, 2004 –
End-March 2005:Over 98%- nationwide(within 16 months after servicelaunch)
Double Teigaku(two-tiered flat rate)
Handsets
Content &Applications
Expanded lineup
Increase salesproportion ofWIN handsets
Late Nov. 2004~: EZ Chaku-uta FullTM
Fall 2005~: Introduce FeliCa (in all WIN handsets after FY2006)
2.1. 2.1. Measures to Expand Sales of WINMeasures to Expand Sales of WIN
Summer 2004~: Enhance EZ Navi Walk
“au”Business
19
0
500
1,000
1,500
2,000
2,500
3,000
3,500
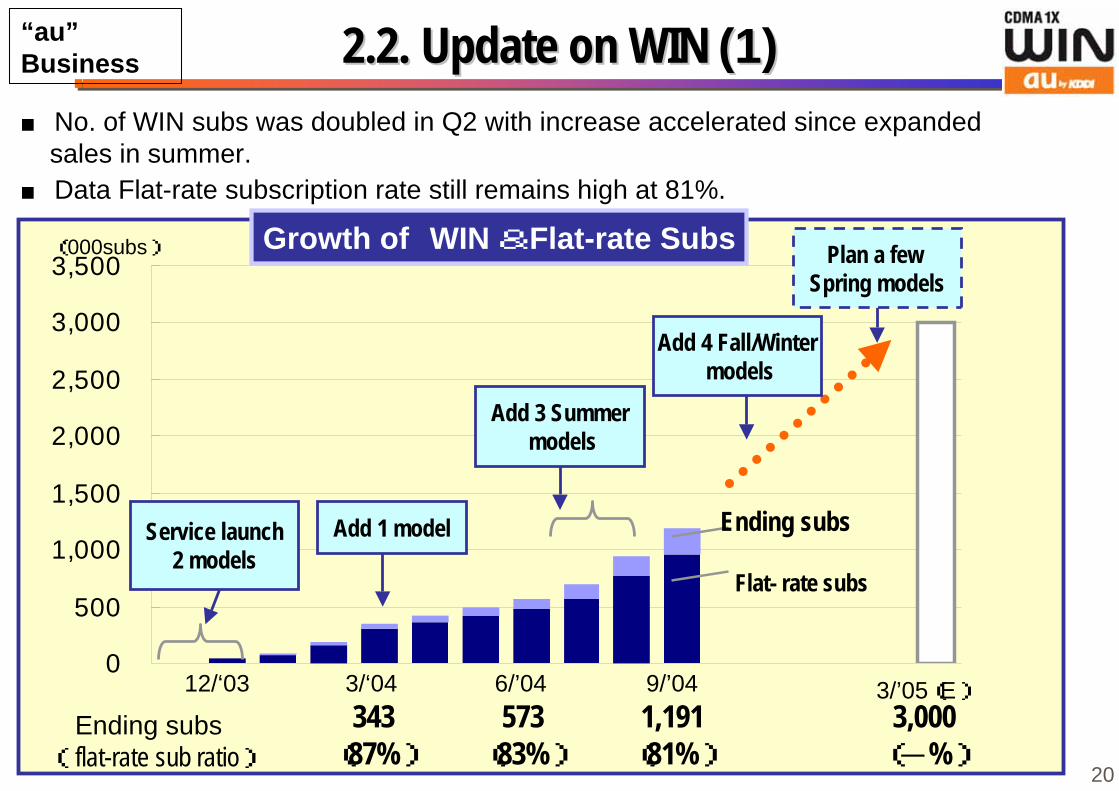
2.2. 2.2. Update on WINUpdate on WIN (1)(1)
Growth of WIN &Flat-rate Subs
3/‘0412/‘03 6/’04 9/’04 3/’05(E)573(83%)
343(87%)
1,191(81%)
3,000(-%)
■ No. of WIN subs was doubled in Q2 with increase accelerated since expanded sales in summer.■ Data Flat-rate subscription rate still remains high at 81%.
Service launch2 models
Add 1 model
Add 3 Summer models
Add 4 Fall/Winter models
Plan a few Spring models
Ending subs
Flat- rate subs
Ending subs(flat-rate sub ratio)
(‘000subs)
“au”Business
20
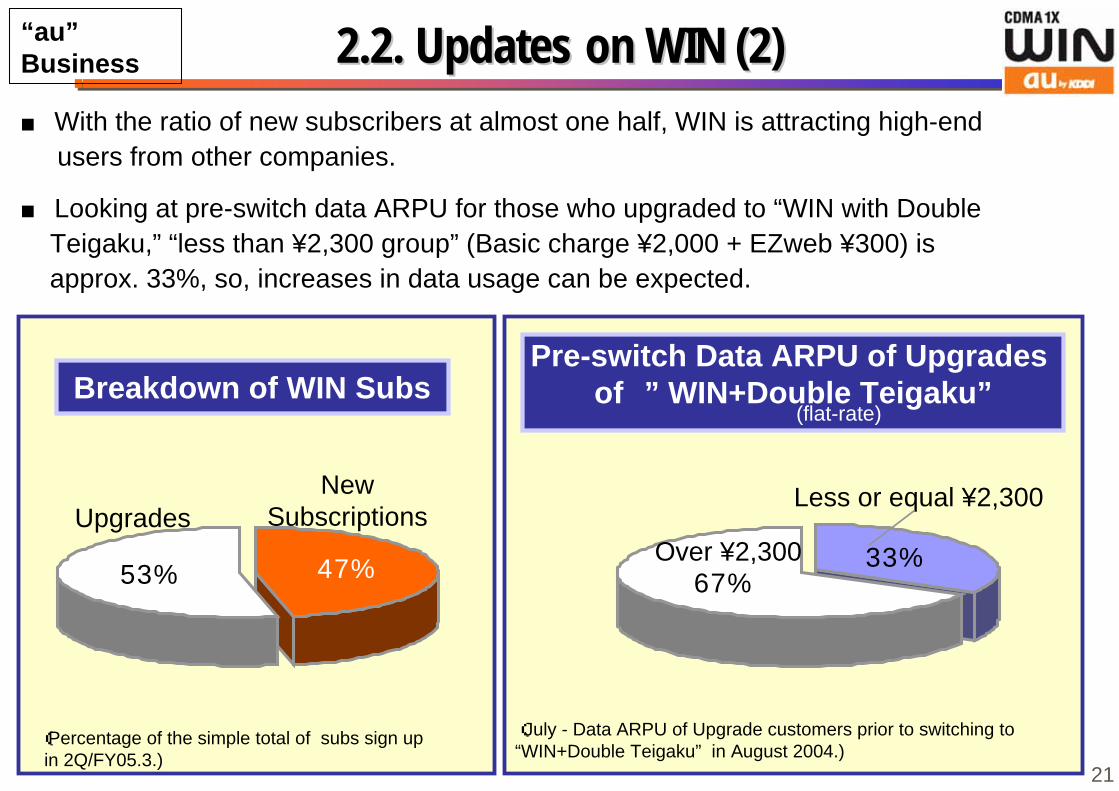
2.2. 2.2. Updates on WIN (2)Updates on WIN (2)■ With the ratio of new subscribers at almost one half, WIN is attracting high-end users from other companies.
■ Looking at pre-switch data ARPU for those who upgraded to “WIN with Double Teigaku,” “less than ¥2,300 group” (Basic charge ¥2,000 + EZweb ¥300) is approx. 33%, so, increases in data usage can be expected.
(July - Data ARPU of Upgrade customers prior to switching to“WIN+Double Teigaku” in August 2004.)
Breakdown of WIN SubsPre-switch Data ARPU of Upgrades
of ” WIN+Double Teigaku”
(Percentage of the simple total of subs sign up in 2Q/FY05.3.)
53% 47%
UpgradesNew
Subscriptions
67%33%Over ¥2,300
Less or equal ¥2,300
“au”Business
(flat-rate)
21
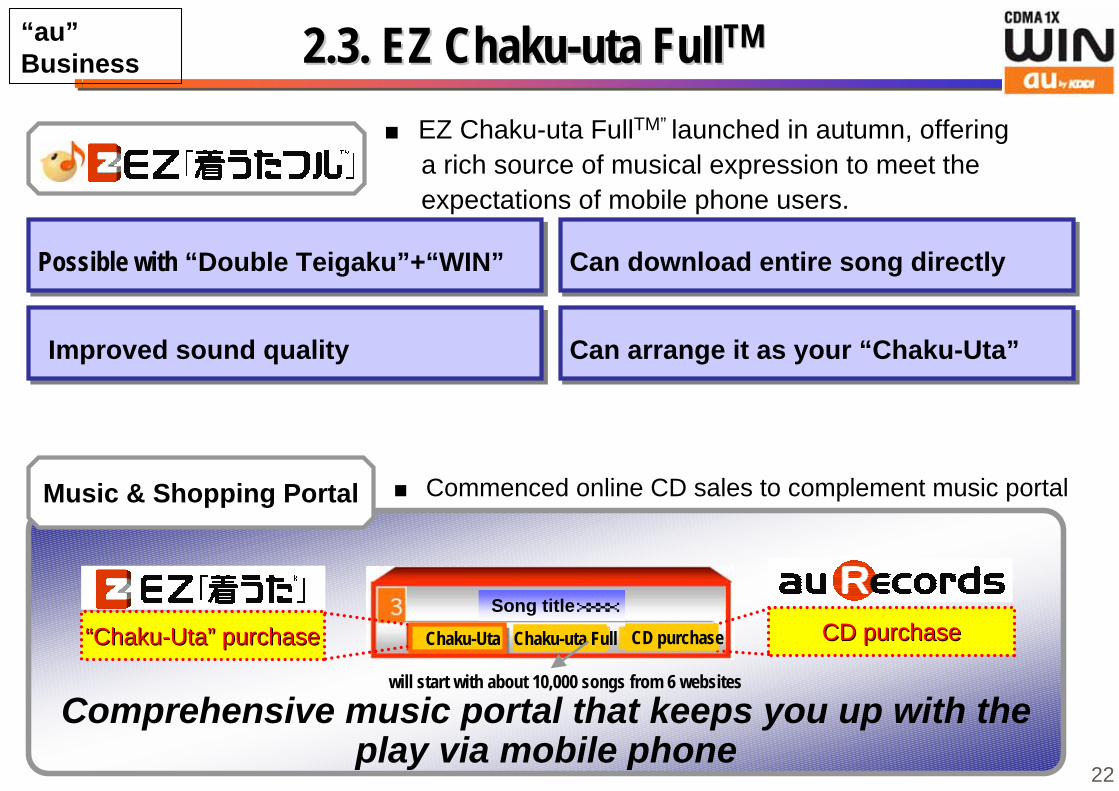
2.3. 2.3. EZ EZ Chaku-uta FullChaku-uta FullTMTM
■ EZ Chaku-uta FullTM” launched in autumn, offering a rich source of musical expression to meet the expectations of mobile phone users.
Possible with “Double Teigaku”+“WIN” Possible with “Double Teigaku”+“WIN” Can download entire song directly Can download entire song directly
Improved sound quality Improved sound quality Can arrange it as your “Chaku-Uta” Can arrange it as your “Chaku-Uta”
““Chaku-UtaChaku-Uta”” purchase purchase CD purchaseCD purchase
Comprehensive music portal that keeps you up with theplay via mobile phone
Music & Shopping Portal ■ Commenced online CD sales to complement music portal
Song titlexxxx
Chaku-Uta Chaku-uta Full CD purchase
will start with about 10,000 songs from 6 websites
“au”Business
22
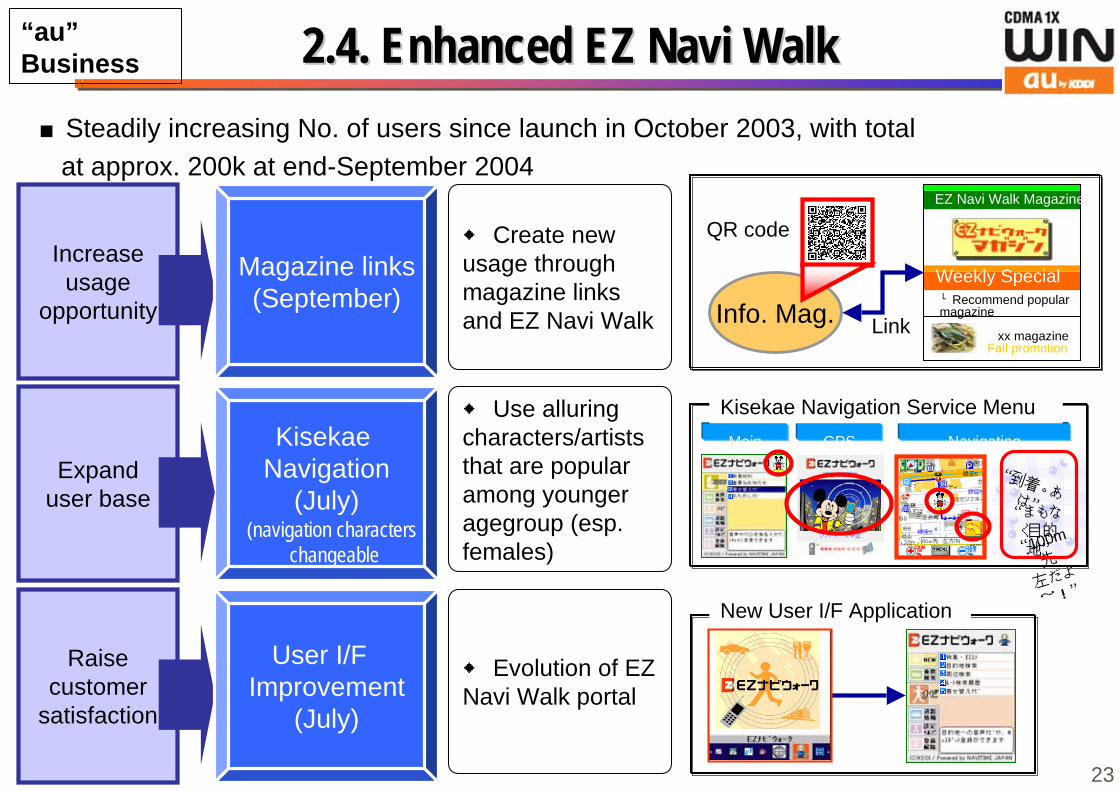
2.4. 2.4. Enhanced EZ Enhanced EZ NaviNavi Walk Walk■Steadily increasing No. of users since launch in October 2003, with total at approx. 200k at end-September 2004
◆ Use alluringcharacters/artiststhat are popularamong youngeragegroup (esp.females)
Kisekae Navigation
(July)“100m先
左だよ
~!”
“まもなく目的地”
“到着。あは”
MainMenu
GPS Navigating
Expanduser base
Raisecustomer
satisfaction
User I/F Improvement
(July)
◆ Evolution of EZNavi Walk portal
New User I/F Application
Kisekae Navigation Service Menu
Info. Mag.Weekly Special└Recommend popularmagazine
xx magazine Fall promotion
Increaseusage
opportunity
Magazine links(September)
◆ Create newusage throughmagazine linksand EZ Navi Walk
EZ Navi Walk Magazine
QR code
Link
“au”Business
(navigation characters changeable
23
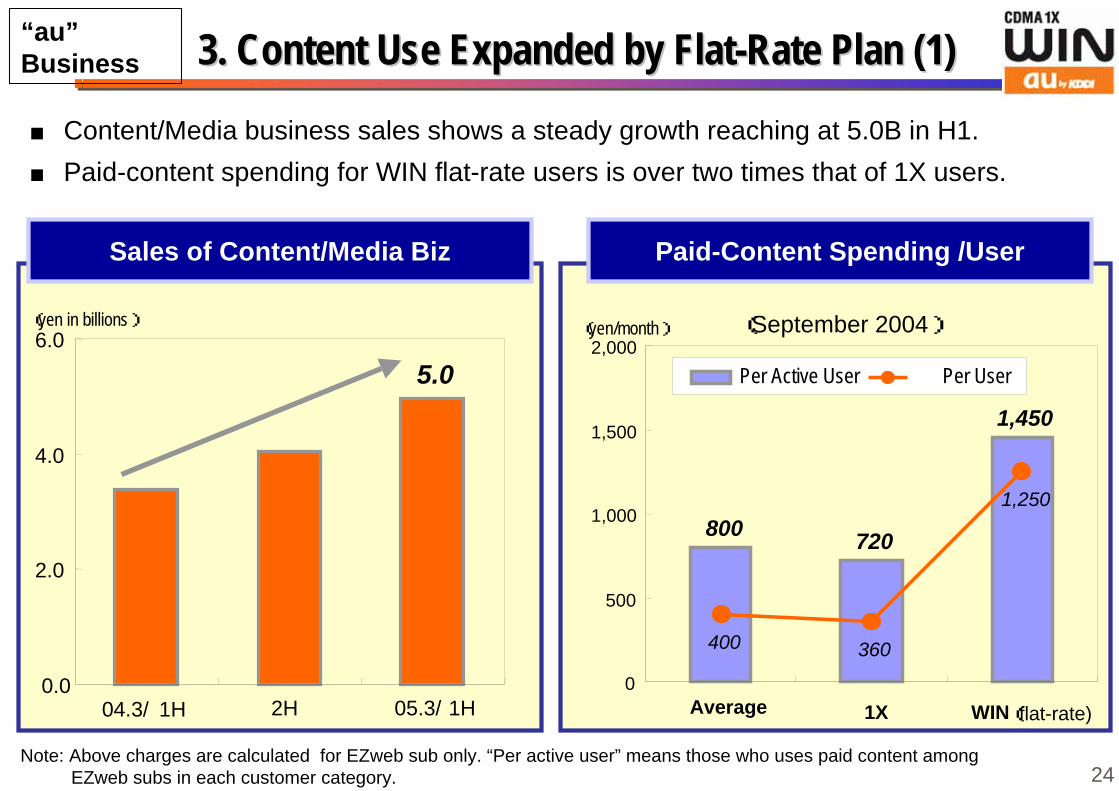
3. 3. Content Use Expanded by Flat-Rate Plan (1)Content Use Expanded by Flat-Rate Plan (1)
Note: Above charges are calculated for EZweb sub only. “Per active user” means those who uses paid content among EZweb subs in each customer category.
(September 2004)
Sales of Content/Media Biz
800 720
1,450
360
1,250
400
0
500
1,000
1,500
2,000
Average 1X WIN(flat-rate)
(yen/month)
Per Active User Per User
■ Content/Media business sales shows a steady growth reaching at 5.0B in H1.■ Paid-content spending for WIN flat-rate users is over two times that of 1X users.
5.0
0.0
2.0
4.0
6.0
04.3/ 1H 2H 05.3/ 1H
(yen in billions)
Paid-Content Spending /User
“au”Business
24
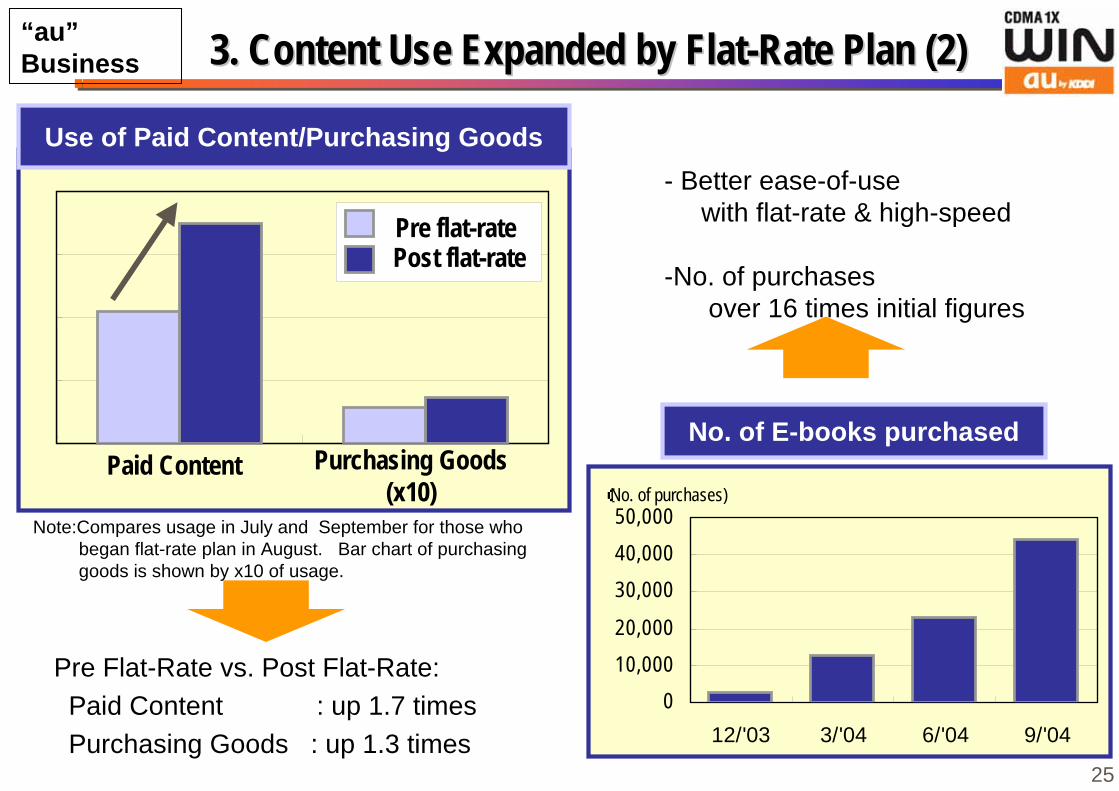
3. 3. Content Use Expanded by Flat-Rate Plan (2)Content Use Expanded by Flat-Rate Plan (2)
Paid Content Purchasing Goods(x10)
010,00020,000
30,00040,00050,000
12/'03 3/'04 6/'04 9/'04
No. of E-books purchased
(No. of purchases)
Use of Paid Content/Purchasing Goods
Pre flat-ratePost flat-rate
Note:Compares usage in July and September for those who began flat-rate plan in August. Bar chart of purchasing goods is shown by x10 of usage.
Pre Flat-Rate vs. Post Flat-Rate: Paid Content : up 1.7 times Purchasing Goods : up 1.3 times
“au”Business
- Better ease-of-use with flat-rate & high-speed
-No. of purchases over 16 times initial figures
25
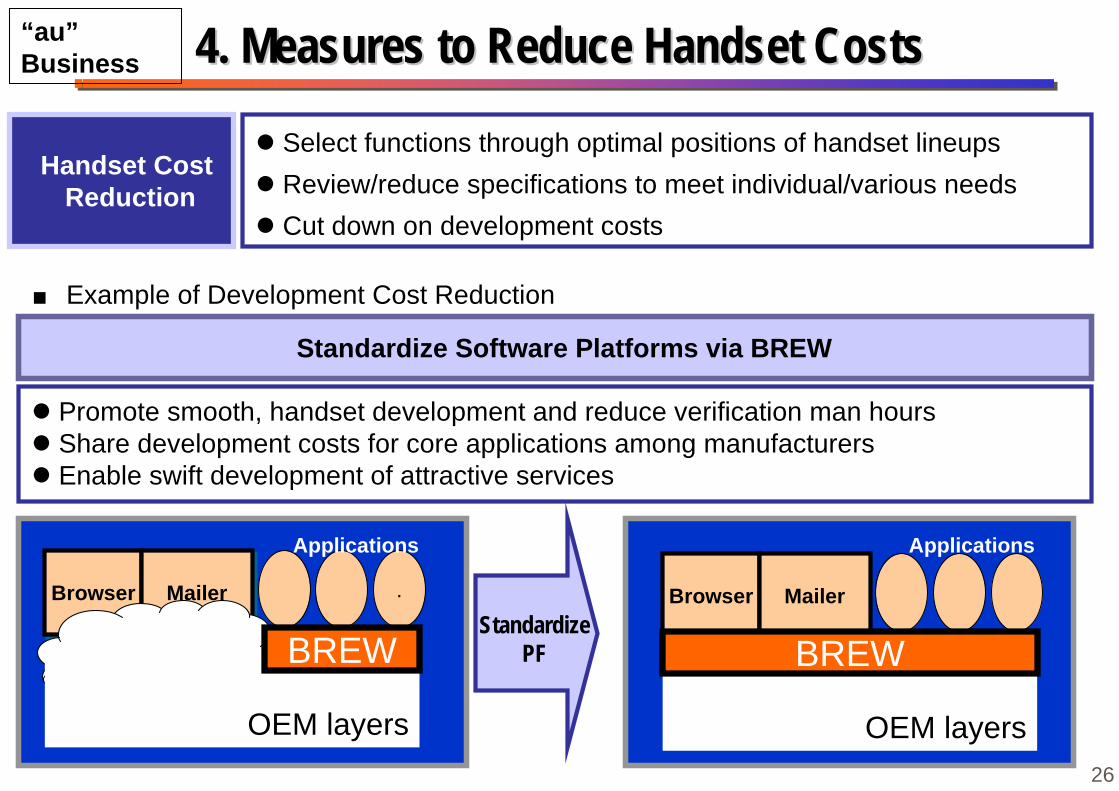
Select functions through optimal positions of handset lineups Review/reduce specifications to meet individual/various needs Cut down on development costs
4. 4. Measures to Reduce Handset CostsMeasures to Reduce Handset Costs
Standardize Software Platforms via BREW
Promote smooth, handset development and reduce verification man hours Share development costs for core applications among manufacturers Enable swift development of attractive services
PF共通化
■ Example of Development Cost Reduction
BrowserBrowser MailerMailer .
OEM layers
BREW
OEM layers
Browser Mailer
BREWStandardize
PF
Handset Cost Reduction
Applications Applications
“au”Business
26
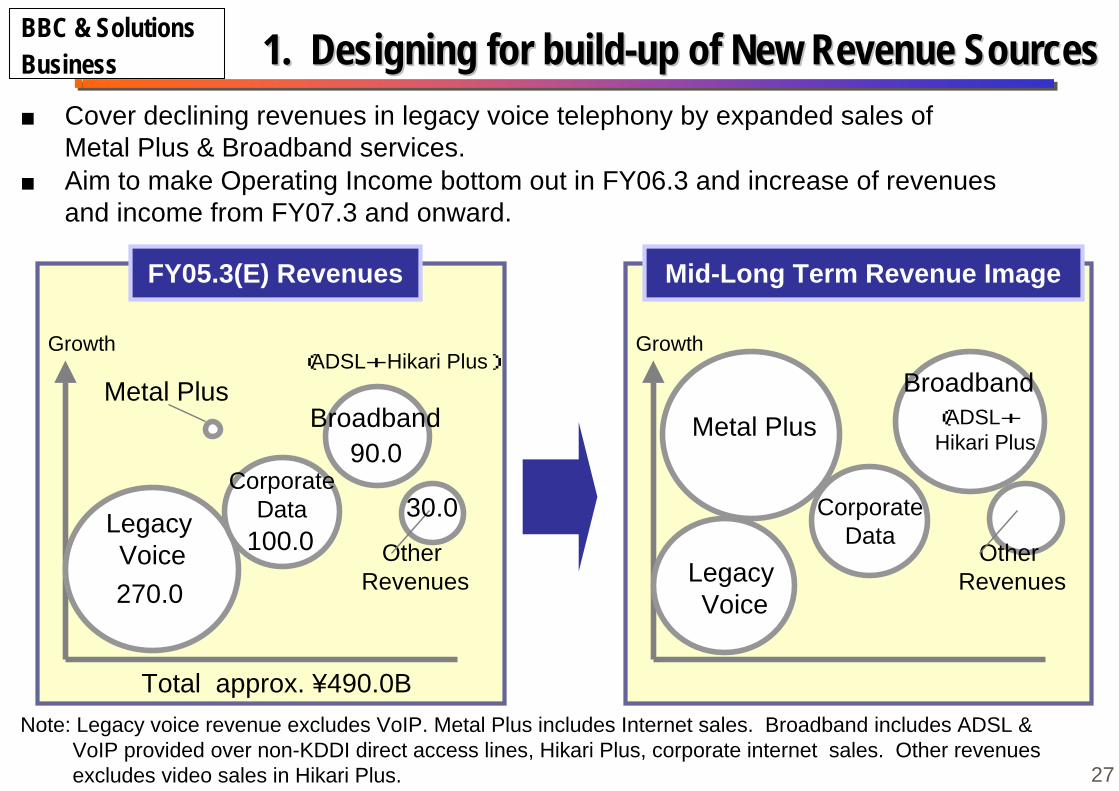
1. 1. Designing for build-up of New Revenue SourcesDesigning for build-up of New Revenue Sources
Metal Plus
Note: Legacy voice revenue excludes VoIP. Metal Plus includes Internet sales. Broadband includes ADSL & VoIP provided over non-KDDI direct access lines, Hikari Plus, corporate internet sales. Other revenues excludes video sales in Hikari Plus.
Growth
FY05.3(E) Revenues
Total approx. ¥490.0B
CorporateData
(ADSL+Hikari Plus)
270.0
100.0Legacy Voice Other
Revenues
30.0
Growth
Mid-Long Term Revenue Image
CorporateData
Other Revenues
Broadband(ADSL+Hikari PlusMetal PlusBroadband
90.0
Legacy Voice
■ Cover declining revenues in legacy voice telephony by expanded sales of Metal Plus & Broadband services.■ Aim to make Operating Income bottom out in FY06.3 and increase of revenues and income from FY07.3 and onward.
BBC & SolutionsBusiness
27
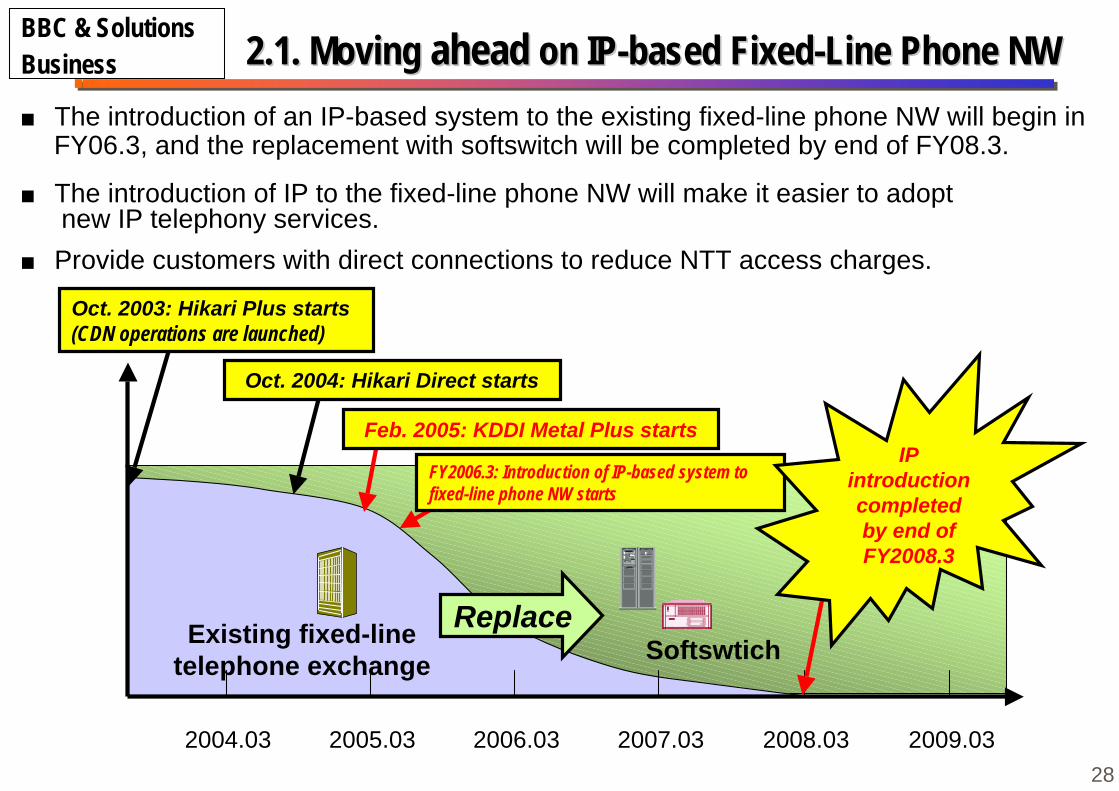
■ The introduction of an IP-based system to the existing fixed-line phone NW will begin inFY06.3, and the replacement with softswitch will be completed by end of FY08.3.
Existing fixed-linetelephone exchange Softswtich
2007.03 2008.032004.03 2005.03 2006.03
Replace
Oct. 2003: Hikari Plus starts(CDN operations are launched)
2009.03
Oct. 2004: Hikari Direct starts
Feb. 2005: KDDI Metal Plus starts
FY2006.3: Introduction of IP-based system tofixed-line phone NW starts
IPintroductioncompletedby end ofFY2008.3
2.1. 2.1. Moving Moving aheadahead on on IP-based Fixed-Line Phone NWIP-based Fixed-Line Phone NWBBC & SolutionsBusiness
■ The introduction of IP to the fixed-line phone NW will make it easier to adopt new IP telephony services.
■ Provide customers with direct connections to reduce NTT access charges.
28

2.2. 2.2. Cost Reduction by Cost Reduction by IP-based Fixed-Line Phone NWIP-based Fixed-Line Phone NW
Cost comparison - IP NW vs. current NW -
■Backbone NW: approx.50% down from current NW
■Subscriber lines: approx.20% down from current NW
KDDI’s high-quality IP NW (CDN)
Customer Customer
Softswitch for subscriber lines
Myline
NTT East / West’sfixed phone NW
Softswitch for backboneNW
NGW※
NTT office
※NGW=Network Gateway
Network After Switch toIP-based System(overview)
Network After Switch toNetwork After Switch toIP-based System(overview)IP-based System(overview)
BBC & SolutionsBusiness
NTT officeNTT East / West’sfixed phone NW
Metal Plus(dry copper)
29
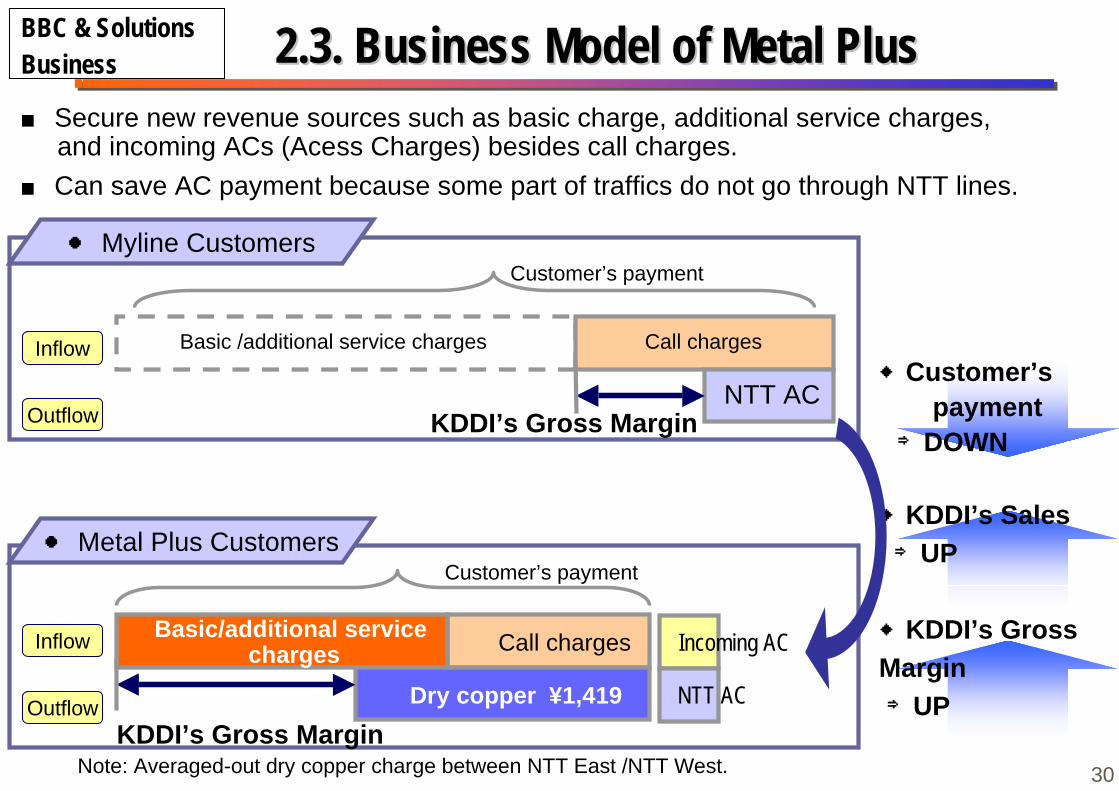
2.3. 2.3. Business Model of Metal PlusBusiness Model of Metal Plus■ Secure new revenue sources such as basic charge, additional service charges, and incoming ACs (Acess Charges) besides call charges.
Note: Averaged-out dry copper charge between NTT East /NTT West.
Inflow
Outflow
Inflow
Outflow
Customer’s payment
Customer’s payment
Basic /additional service charges Call charges
NTT AC
Call charges
Dry copper ¥1,419
KDDI’s Gross Margin
NTT AC
Incoming AC
● Myline Customers
● Metal Plus Customers
◆Customer’s payment ⇒DOWN
◆KDDI’s Sales ⇒UP
◆KDDI’s GrossMargin ⇒UP
BBC & SolutionsBusiness
■ Can save AC payment because some part of traffics do not go through NTT lines.
Basic/additional service charges
30
KDDI’s Gross Margin
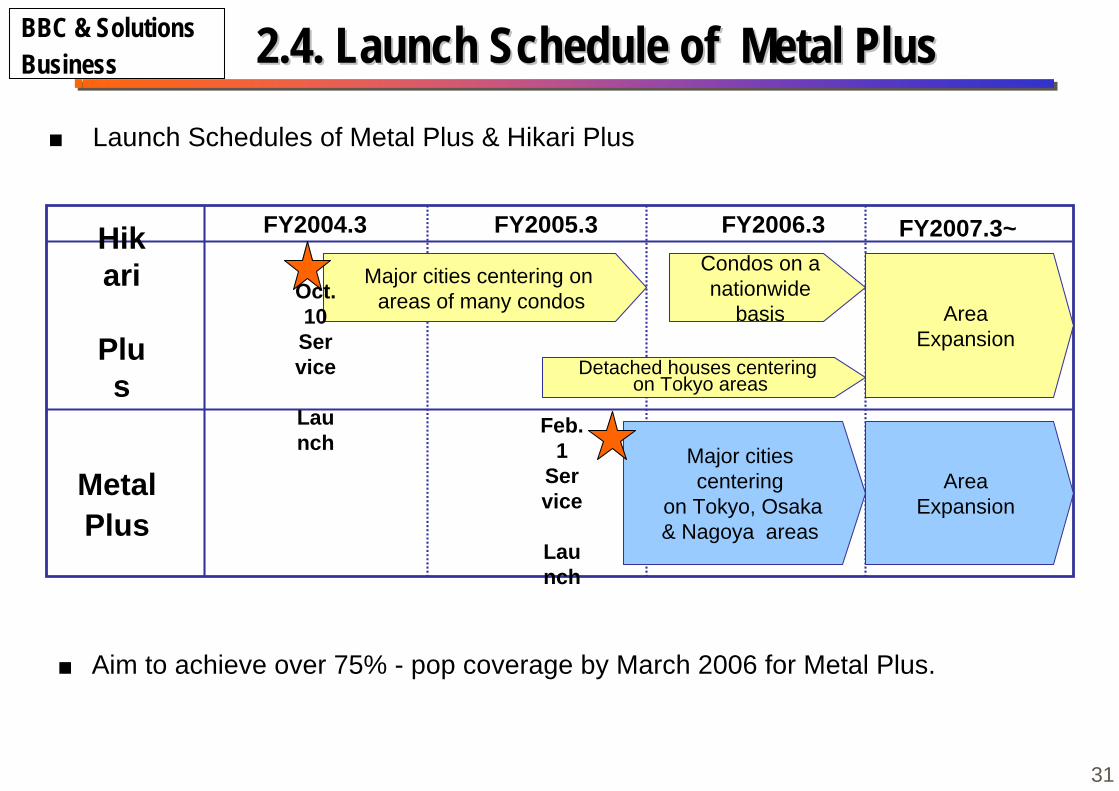
2.4. 2.4. Launch Schedule of Metal PlusLaunch Schedule of Metal Plus■ Launch Schedules of Metal Plus & Hikari Plus
■ Aim to achieve over 75% - pop coverage by March 2006 for Metal Plus.
FY2004.3
MetalPlus
Hikari
Plus
Major cities centering on areas of many condos
Condos on anationwide
basisOct.10Service
Launch
FY2005.3 FY2006.3 FY2007.3~
Detached houses centering on Tokyo areas
Major citiescentering
on Tokyo, Osaka& Nagoya areas
Feb.1
Service
Launch
AreaExpansion
AreaExpansion
BBC & SolutionsBusiness
31
0
10
20
30
40
50
03.12 04.3 04.6 04.9
Lines in service Line Subscriptions
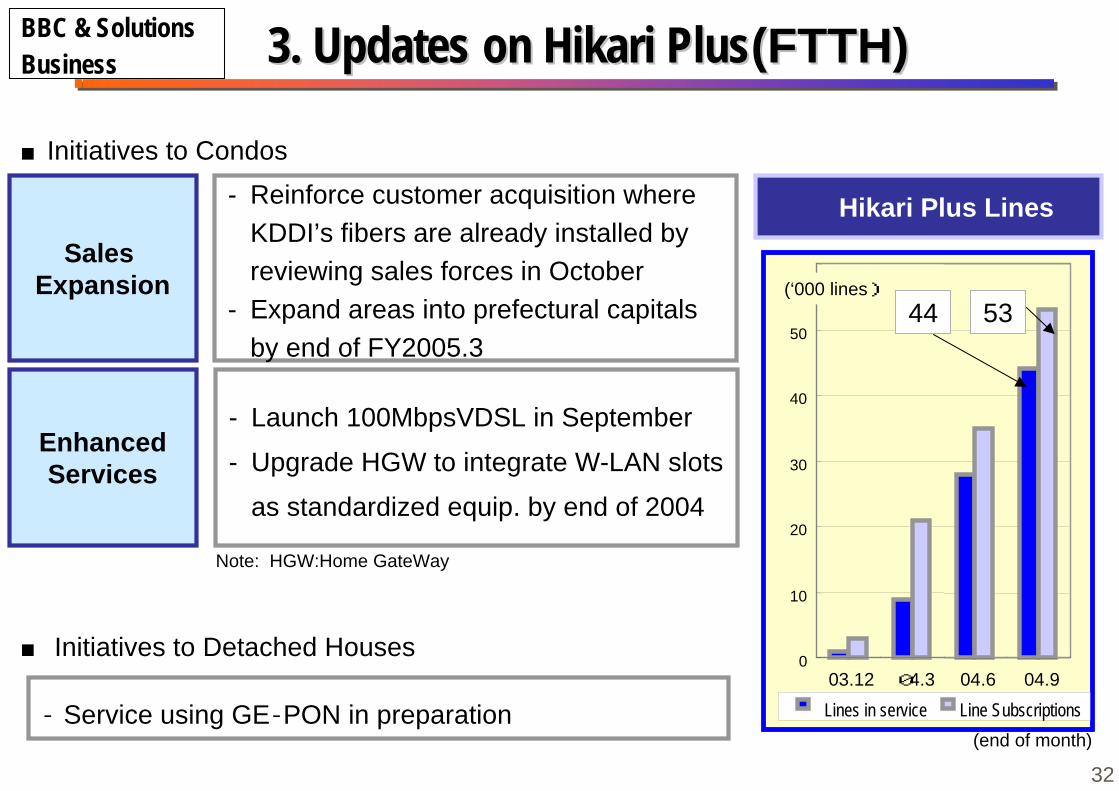
3. 3. Updates on Updates on Hikari Hikari PlusPlus((FTTH)FTTH)
‐ Service using GE‐PON in preparation
■ Initiatives to Detached Houses
Hikari Plus Lines- Reinforce customer acquisition whereKDDI’s fibers are already installed byreviewing sales forces in October
- Expand areas into prefectural capitalsby end of FY2005.3
Sales Expansion
■Initiatives to Condos
5344
EnhancedServices
- Launch 100MbpsVDSL in September
- Upgrade HGW to integrate W-LAN slots
as standardized equip. by end of 2004
(‘000 lines)
Note: HGW:Home GateWay
BBC & SolutionsBusiness
32
(end of month)
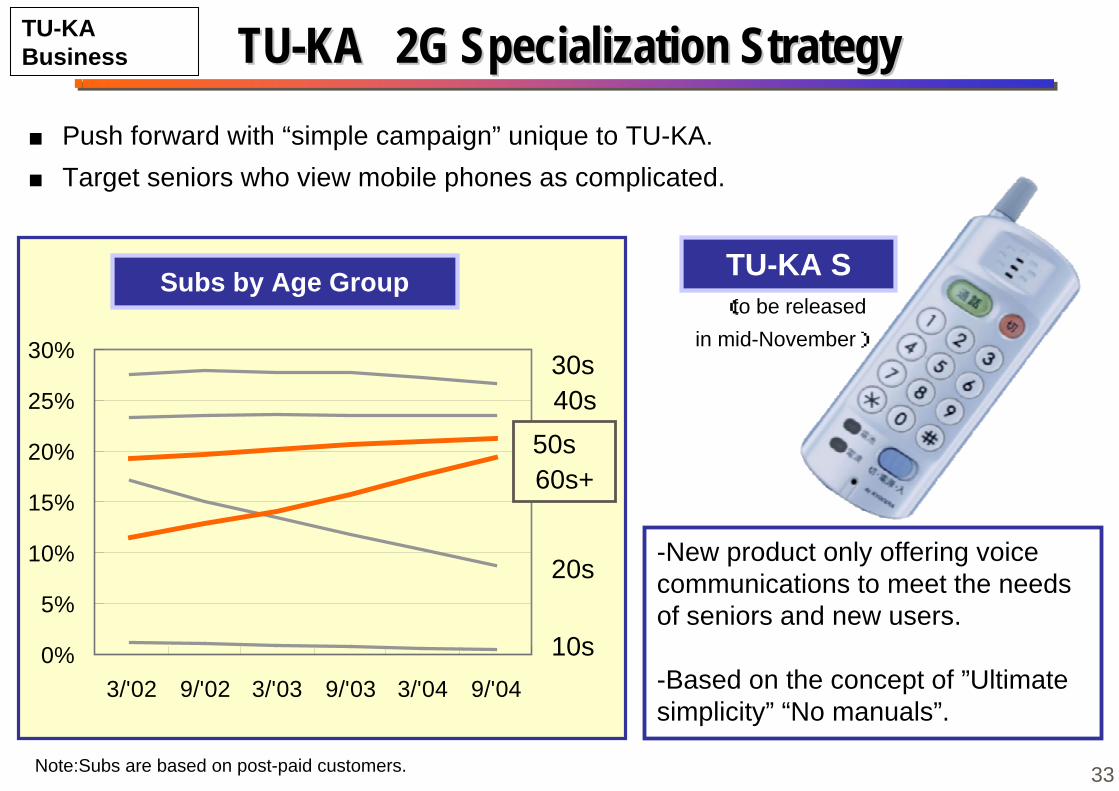
TU-KATU-KA 2G Specialization Strategy2G Specialization Strategy
Subs by Age Group
30s40s
20s
10s
Note:Subs are based on post-paid customers.
TU-KA S
-New product only offering voicecommunications to meet the needsof seniors and new users.
-Based on the concept of ”Ultimatesimplicity” “No manuals”.
(to be released in mid-November)
0%
5%
10%
15%
20%
25%
30%
3/'02 9/'02 3/'03 9/'03 3/'04 9/'04
50s60s+
TU-KABusiness
■ Push forward with “simple campaign” unique to TU-KA.■ Target seniors who view mobile phones as complicated.
33

Ubiquitous Solution CompanyUbiquitous Solution Company
Recommended