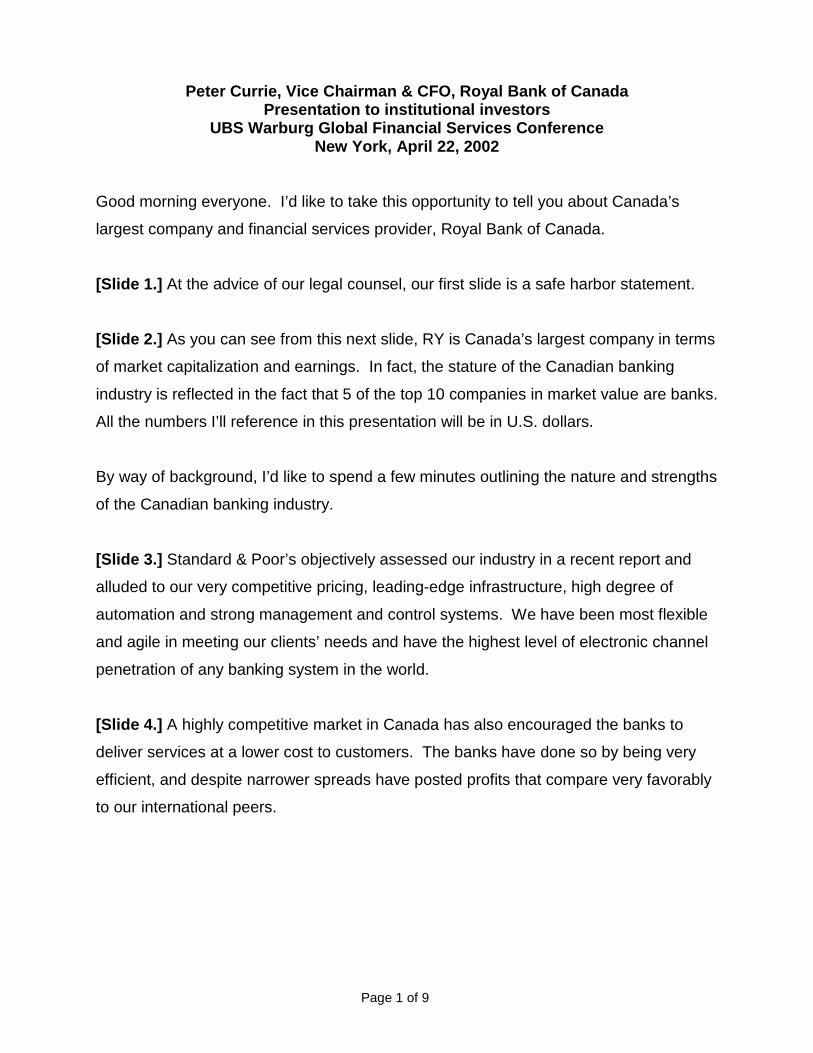
Peter CurrieVice Chairman & CFORoyal Bank of Canada
UBS Warburg’s GlobalFinancial Services Conference
UBS Warburg’s GlobalFinancial Services Conference
New YorkApril 22, 2002
“RY” on TSE & NYSE
Page 1 of 9
Peter Currie, Vice Chairman & CFO, Royal Bank of Canada Presentation to institutional investors
UBS Warburg Global Financial Services Conference New York, April 22, 2002
Good morning everyone. I’d like to take this opportunity to tell you about Canada’s
largest company and financial services provider, Royal Bank of Canada.
[Slide 1.] At the advice of our legal counsel, our first slide is a safe harbor statement.
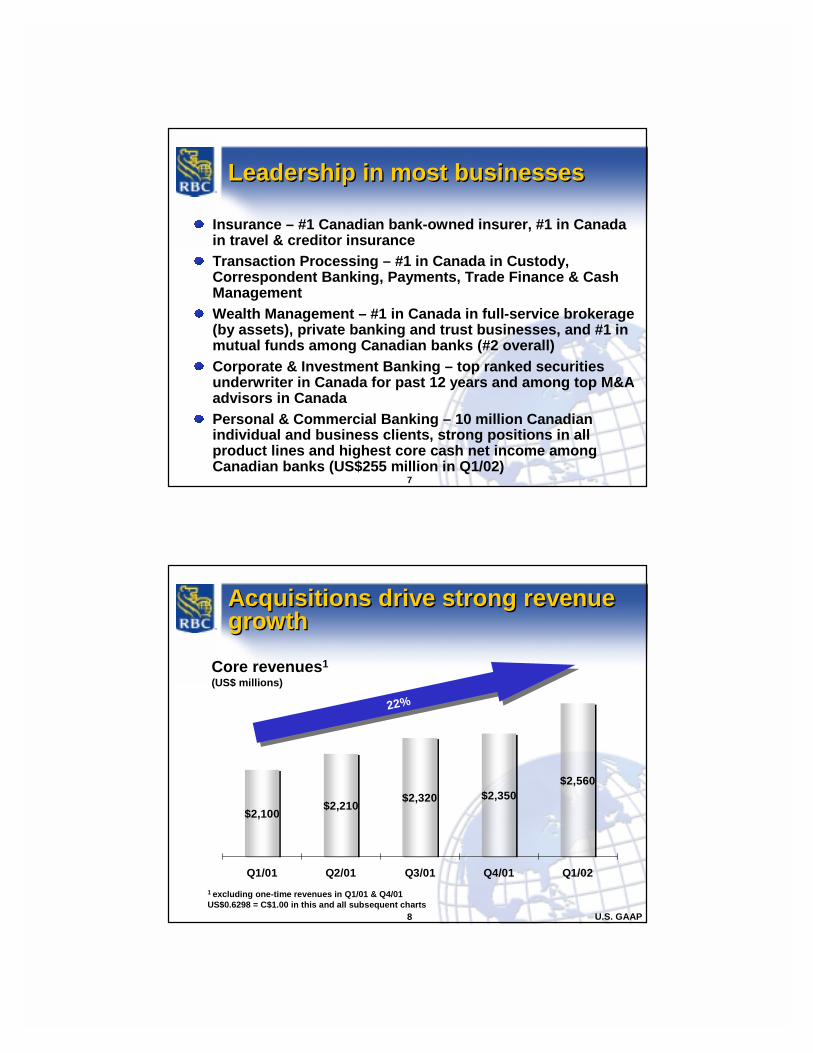
[Slide 2.] As you can see from this next slide, RY is Canada’s largest company in terms
of market capitalization and earnings. In fact, the stature of the Canadian banking
industry is reflected in the fact that 5 of the top 10 companies in market value are banks.
All the numbers I’ll reference in this presentation will be in U.S. dollars.
By way of background, I’d like to spend a few minutes outlining the nature and strengths
of the Canadian banking industry.
[Slide 3.] Standard & Poor’s objectively assessed our industry in a recent report and
alluded to our very competitive pricing, leading-edge infrastructure, high degree of
automation and strong management and control systems. We have been most flexible
and agile in meeting our clients’ needs and have the highest level of electronic channel
penetration of any banking system in the world.
[Slide 4.] A highly competitive market in Canada has also encouraged the banks to
deliver services at a lower cost to customers. The banks have done so by being very
efficient, and despite narrower spreads have posted profits that compare very favorably
to our international peers.
Page 2 of 9
[Slide 5.] We have a long history of nationwide banking and, since the 1980s, we have
offered a full range of financial services including investment banking, brokerage,
money management, trust and insurance. And we have a highly efficient clearing
system, which deprives us of float but provides quicker service to our clients.
So, all in all, Canadian banks are accustomed to delivering their customers quick, and
excellent service at very competitive prices. With that, and a number of other strengths,
we are very well positioned for success and growth in the U.S.
[Slide 6.] Royal Bank has a well-diversified business mix, which has resulted in
reasonably stable returns and reduced earnings volatility. Just over half of our earnings
come from our Personal & Commercial Banking operations. Corporate & Investment
Banking accounted for one-fifth of our net income in the first quarter ended January 31,
2002. And close to one-quarter of our earnings come from asset quality immune
businesses – Insurance, Wealth Management and Transaction Processing.
[Slide 7.] Among Canadian banks, we have by far the largest Insurance and
Transaction Processing businesses. In Wealth Management, we are #1 in most
products, as outlined on this chart. In mutual funds, we are #1 among banks and #2
among all mutual fund providers in Canada. And in Corporate & Investment Banking,
we’ve been the top-ranked securities underwriter in Canada for the past 12 years and
the top M&A advisor in the country. In Personal & Commercial Banking, we have strong
positions in all product lines and highest earnings among the Canadian banks. We also
have a sizeable customer base of 10 million Canadian individual and business clients.
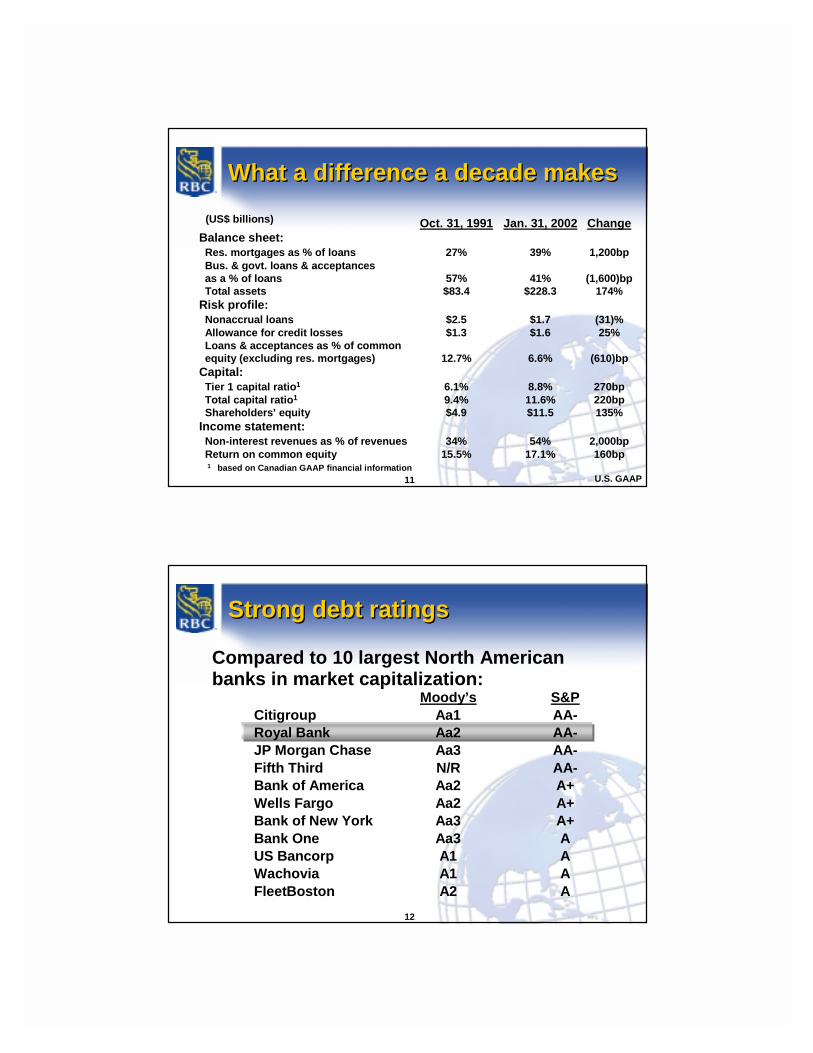
[Slide 8.] Our recent acquisitions have driven a 22% revenue growth in the past year.
Page 3 of 9
[Slide 9.] As for costs, our operating expenses, excluding U.S. acquisitions, were down
7% this past quarter. The Personal & Commercial Banking platform, which accounts for
a substantial share (about 51%) of our overall expenses, has shown a nearly 800 basis
point improvement in their efficiency ratio since 1999. It’s targeting further improvement
over the next few years. Some of you may recall the cost cutting program begun in
1999 that led to US$370 million of costs being taken out of our cost base by the end of
2000.
We are sustaining our focus on cost management, with our business platforms and
functions implementing steps in that regard.
[Slide 10.] As for risk management, the S&P report mentions that Canadian banks are
less risky due to the stability and diversification we derive from our broad geographic
coverage and our sophisticated risk management systems, which are also world class.
[Slide 11.] At Royal Bank, we have significantly enhanced our risk profile over the last
decade. Slide 11 shows where we stood entering the last recession and where we now
stand coming out of the most recent downturn. We’ve reduced our risk and leverage
while improving our profitability. We plan to continue to pay very close attention to risk
management.
[Slide 12.] It’s in recognition of our strong franchise and performance that rating
agencies have accorded us high debt ratings. When compared to the 10 largest banks
in North America in market value, we and Citigroup are the only two to be rated both
AA- by S&P and higher than Aa3 by Moody’s.
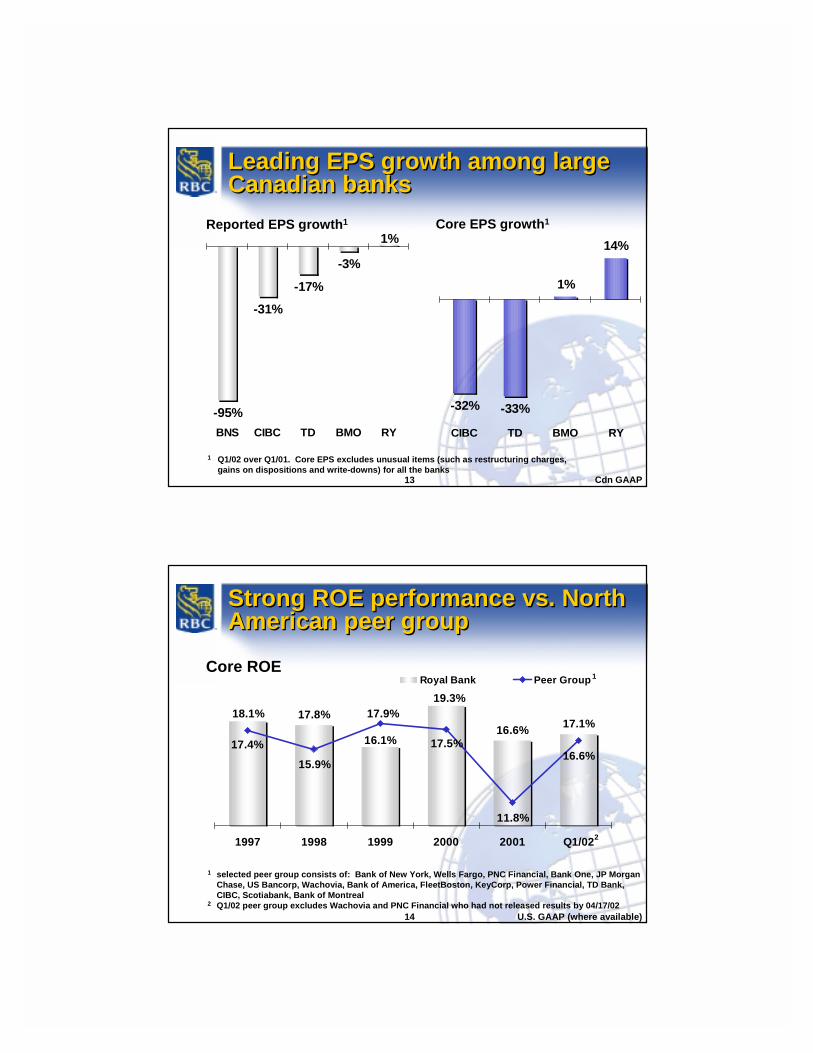
[Slide 13.] Our strong revenue growth and disciplined cost control in the first quarter
helped us produce the leading EPS growth among our Canadian banking peers.
Page 4 of 9
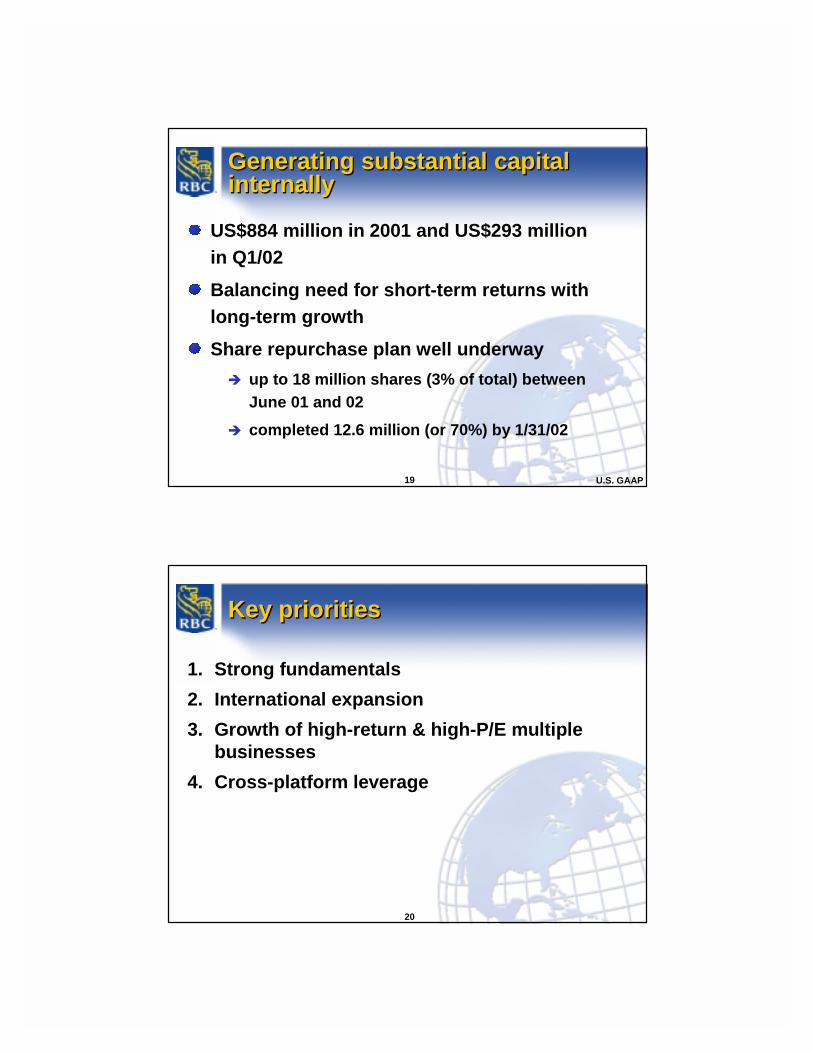
[Slide 14.] Additionally, our core ROE continues to surpass the average of our North
American peers.
[Slide 15.] With these strong results we met our objectives for 2002 during the first
quarter. As shown on slide 15, growth in core earnings per share of 14% was well
above our 5-10% objective, while revenue growth was similarly well in excess of our
target. Return on equity, the provision for credit losses ratio and capital ratios also met
our objectives.
[Slide 16.] Our targets for 2002 were set during the difficult market environment last fall,
so I’d like to emphasize that our 3-5 year performance targets are more aggressive.
The pursuit of these goals should continue to create shareholder value.
[Slide 17.] In fact, we’ve done a good job on that front, with our entrenched shareholder
focus. As you can see, our common share’s 5-year compound annual total return up to
the end of fiscal 2001 outperformed various indices in North America. Clearly,
shareholders have done well holding our shares, generating a 5-year return of over
19%. And between October 31, 2001 and April 17, 2002 our common shares have
advanced another 18%. [Slide 18.] We’ve been raising common share dividends as earnings have grown, with
dividends up 41% from just two years ago.
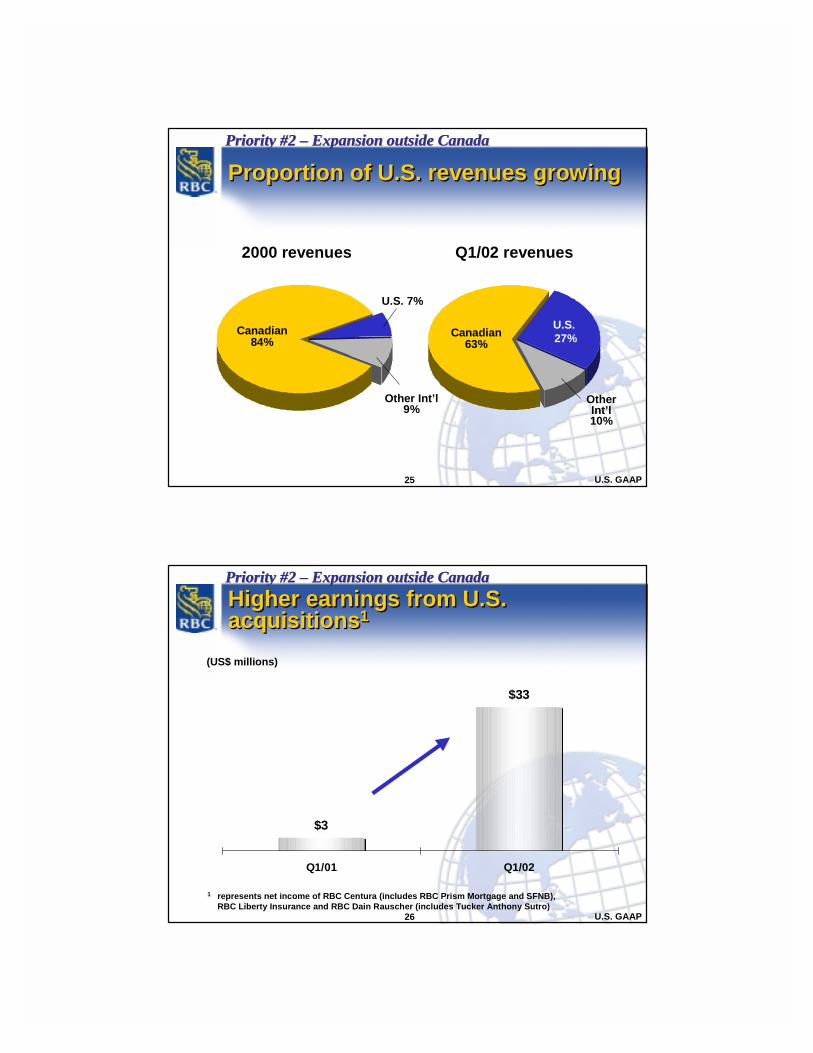
[Slide 19.] We are generating substantial capital internally (between $.95 and $1.25
billion U.S. dollars annually) and want to re-deploy it judiciously by balancing the need
for short-term returns with long-term growth. In addition to our dividend payout ratio
target of 30-40%, we have a share repurchase program that is well underway.
Page 5 of 9
[Slide 20.] We have been articulating our four priorities for some time. Those are
strong fundamentals (that is, financial performance), international expansion, growth of
high-return & high-P/E multiple businesses and cross-platform leverage (that is working
across business platforms to provide integrated financial solutions to customers). I’ve
just discussed our financial performance. I’ll go over our second priority in detail in a
minute, but I first want to discuss our two other priorities.
With regards to growth of high-return & high-P/E multiple businesses, our primary focus
is on Personal & Commercial Banking and Wealth Management, although all business
platforms have selected segments for priority growth. As for cross-platform leverage,
we are ideally positioned for cross-selling with our broadly diversified business mix, very
strong market positions in most businesses in Canada, sizeable customer base,
strengths in customer relationship management and philosophy of deepening customer
relationships. We have generated strong cross-selling results in Canada and plan, over
time, to succeed in the U.S. as well.
Now back to our second priority, international expansion.
[Slide 21.] We have expanded in the U.S. in a rollout approach, not a “bet-the-bank”
fashion. We’ve expanded in businesses that we know well and where we feel we have
a competitive advantage – full-service brokerage, Personal & Commercial Banking and
Insurance. In Corporate & Investment Banking, which has historically represented the
majority of the bank’s international operations, we have shrunk in markets such as Asia
and Latin America and reduced our overall lending activities in order to invest in non-
lending businesses. In all our businesses, we’ve pursued deals that were manageable
(that is, not too large in relation to our size), companies that generated healthy returns
and had good management that shared our culture.
Page 6 of 9
[Slide 22.] Our key criterion is that acquisitions be cash earnings accretive in 2-3
years. As you can see on slide 22, all of our transactions met this criterion when we
announced the deals.
[Slide 23.] This next chart shows the 7 key acquisitions we’ve made in the United
States since the spring of 2000. We started with Prism Financial, acquired in April 2000,
which had an excellent 2001 and Q1/02. It acquired a builder finance business in 2000,
which has continued to grow. That was followed by the purchase of South Carolina
headquartered Liberty Life and Life Insurance Services in November 2000, which
subsequently bought insurance software and outsourcing assets from Genelco. Liberty
gives us a stable earnings base, with revenue spread across agency sales, direct
business administrative services and software. We then bought Dain Rauscher a little
over a year ago, which gave us 1,100 brokers across largely the mid-west United States
and an expanded equity capital markets capability via Dain Rauscher Wessels. Which
has now been fully integrated into our capital markets business.
The acquisition of North Carolina based Centura Banks in June 2001 allowed us to
enter the attractive Southeast U.S. Personal & Commercial Banking market.
The purchase of Tucker Anthony Sutro, which closed last fall, makes RBC Dain
Rauscher the 9th largest U.S. retail brokerage firm with 2,100 brokers in the U.S. In
total, our Wealth Management division has over 3,500 brokers in North America.
And, just last month, we announced the acquisition of Eagle Bancshares, which offers
us a foothold in the very attractive Atlanta market. It will be integrated into RBC Centura
after closing expected by the end of July.
[Slide 24.] These acquisitions have given us more than 2 million customers in two
years, compared to the 10 million we’ve built up in Canada over a century. It
demonstrates the substantial size and potential of the U.S. market.
Page 7 of 9
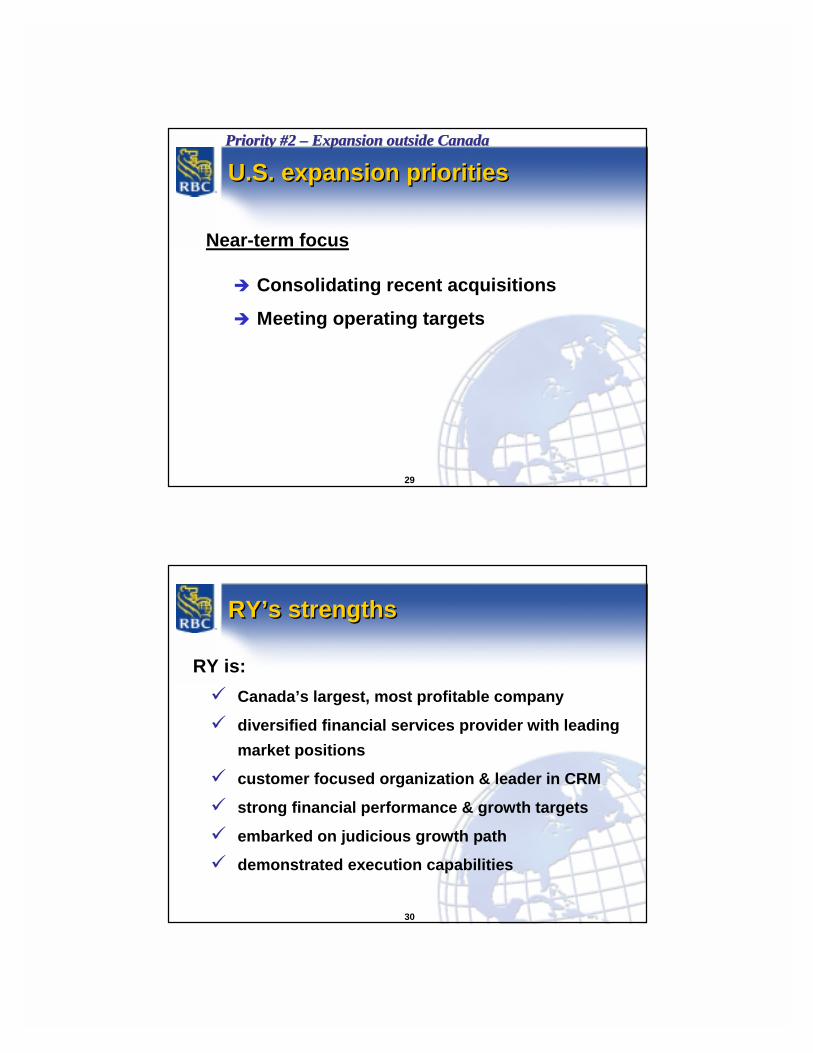
[Slide 25.] As a result of these purchases, U.S. revenues were up to 27% of the total
last quarter from 7% in 2000.
[Slide 26.] Net income from our recent U.S. acquisitions was US$33 million this past
quarter, up from US$3 million a year ago, largely reflecting the acquisition of Centura
Banks in June 2001.
[Slide 27.] The returns from our recent acquisitions should improve over time, all things
being equal, as the retention compensation payout and upfront costs associated with
the acquisitions start to decline.
[Slide 28.] With the purchase of Centura Banks and Tucker Anthony Sutro in the
second half of 2001, we entered the second phase of our U.S. expansion strategy. The
first phase represented putting together the original building blocks in each of the
businesses we wanted to extend into the United States. In this second phase, we will
be able to reap cost synergies. Now, Security First Network Bank and the functions of
RBC Prism and RBC Builder Finance have been merged into RBC Centura. This is
expected to result in US$70 million of cost savings. With Tucker Anthony Sutro being
the second retail brokerage firm to be acquired in the U.S., we can look forward to
substantial cost savings of over US$60 million as the firm has been merged into RBC
Dain Rauscher. Similarly, the integration of Eagle Bancshares into RBC Centura should
result in over US$7 million in savings (25% of Eagle Bancshares’ costs) within 12
months of the close.
Page 8 of 9
[Slide 29.] In the near term, we will be consolidating our recent acquisitions and
ensuring we meet operating targets by enhancing operating efficiencies and leveraging
each platform for revenue growth. To do so, we’re looking at opportunities on a North-
South basis - that is each platform is looking at its entire North American business and
determining ways to maximize its cost effectiveness and revenue potential. We’re also
looking on an East-West basis - that is, within the United States, where we are
reviewing opportunities for eliminating duplication and building revenue growth over
time by exporting our cross-selling experience into the U.S. While we are not expecting
to make large acquisitions in the short term, we will continue to look for disciplined add-
on investments that represent value and provide an attractive strategic fit.
[Slide 30.] So you can see that we have a significant position in Canada’s economy.
We are a diversified financial services provider with leading market positions in our
various business lines. We are a deeply customer focused organization and leader in
Customer Relationship Management. We have strong financial performance and
growth targets, and we are embarked on a judicious growth path. Bringing this all
together is our strong team based culture that has excellent execution capabilities,
which our track record and results attest to.
Having said all that, we would observe that our market valuation is currently low, based
on comparisons of our profitability with major indices. As a matter of fact, using a sum-
of-the-parts valuation (that is applying P/E multiples to our five business lines) shows
that we could be valued at least 20% higher.
Page 9 of 9
[Slide 31.] In conclusion, our organization will maintain its focus on the principles that
have served us well – growing the company in a disciplined manner, maintaining a
diversified business base, continuing our strong risk management, watching costs,
judiciously managing capital and maintaining leadership in our various businesses by
winning more of our customers’ business. We also want to continue to perform in the
top quartile of North American financial companies so that we can further generate
superior returns.
Thank you for your attention, and I’d be happy to take your questions now.
1
Caution regarding forward-looking statementsCaution regarding forward-looking statements
Royal Bank of Canada, from time to time, makes written and oral forward-looking statements, included in this presentation, in other filings with Canadian regulators or the U.S. Securities and Exchange Commission, in reports to shareholders and in other communications, which are made pursuant to the “safe harbor” provisions of the United States Private Securities Litigation Reform Act of 1995. These forward-looking statements include, among others, statements with respect to the bank’s objectives for 2002, and the medium and long terms, and strategies to achieve those objectives, as well as statements with respect to the bank’s beliefs, plans, expectations, anticipations, estimates and intentions. The words “may,” “could,” “should,” “would,” “suspect,” “outlook,” “believe,” “anticipate,” “estimate,” “expect,” “intend,” “plan,” and words and expressions of similar import are intended to identify forward-looking statements.By their very nature, forward-looking statements involve inherent risks and uncertainties, both general and specific, and risks exist that predictions, forecasts, projections and other forward-looking statements will not be achieved. The bank cautions readers not to place undue reliance on these statements as a number of important factors could cause actual results to differ materially from the plans, objectives, expectations, estimates and intentions expressed in such forward-looking statements. These factors include, but are not limited to, the strength of the Canadian economy in general and the strength of the local economies within Canada in which the bank conducts operations; the strength of the United States economy and the economies of other nations in which the bank conducts significant operations; the effects of changes in monetary and fiscal policy, including changes in interest rate policies of the Bank of Canada and the Board of Governors of the Federal Reserve System in the United States; changes in trade policy; the effects of competition in the markets in which the bank operates; inflation; capital market and currency market fluctuations; the timely development and introduction of new products and services by the bank in receptive markets; the impact of changes in the laws and regulations regulating financial services (including banking, insurance and securities); changes in tax laws; technological changes; the ability of the bank to complete strategic acquisitions and to integrate acquisitions; unexpected judicial or regulatory proceedings; unexpected changes in consumer spending and saving habits; and the bank’s anticipation of and success in managing the risks implicated by the foregoing.The bank cautions that the foregoing list of important factors is not exhaustive. When relying on forward-looking statements to make decisions with respect to the bank, investors and others should carefully consider the foregoing factors and other uncertainties and potential events. The bank does not undertake to update any forward-looking statement, whether written or oral, that may be made from time to time by or on behalf of the bank.
2
Market cap Net income - 2001
1. Royal Bank $23.6 $1.62. TD Bank $17.9 $0.93. Scotiabank $17.2 $1.44. EnCana Corp1 $14.5 $1.45. Manulife Financial $13.6 $0.76. Nortel Networks $13.5 $(27.3)7. CIBC $13.3 $1.18. Alcan Inc $12.8 $0.09. BCE Inc $12.5 $0.310. Bank of Montreal $11.9 $1.0
1 formed by the merger of AEC and PanCanadian – pro forma 2001 net incomesource: Bloomberg
As at April 17, 2002 (US$ billions)
Canada’s largest & most profitable companyCanada’s largest & most profitable company

3
The Canadian banking industry is world class…The Canadian banking industry is world class…
“… the domestic banks [have] dominant positions in the personal and commercial market, and very competitive pricing.”“Canada’s banking infrastructure is leading edge, with a high degree of automation and strong management and control systems.” “The banks have reacted flexibly to changes in the type of financial products demanded by their clients and to changing delivery channel.” “Canadian banks enjoy higher penetration of electronic channels, such as debit cards, Internet banking, and telephone banking, than any other banking system in the world.”- Standard & Poor’s “Bank Industry Risk Analysis: Canada”
March 15, 2002
4
… more efficient…… more efficient…
“An international comparison of the Canadian banks … shows they are able to provide and sell products and services in an efficient way at a lower cost, while at the same time turning in profits that are comparable with the industry average. Fees on consumer accounts have been low compared with those in the U.S… loan spreads are at the bottom end of the spectrum for mature systems. Rates charged on mortgages… are much thinner than in the U.S. Spreads on smaller business loans are substantially even lower.”- Standard & Poor’s “Bank Industry Risk Analysis: Canada”
March 15, 2002

5
… and more developed… and more developed
Long history of nationwide bankingIntegrated financial services since 1980s� investment banking� brokerage (full service and discount)� money management� trust� insurance
Highly efficient clearing systemRY is well positioned to leverage its strengths and leadership as it moves into the U.S.
6
Net income contribution – Q1/02
RY’s well diversified business mixRY’s well diversified business mix
U.S. GAAP
23% of earnings
from asset quality
immune businesses
Personal & Commercial
Banking53%
Corporate& Investment
Banking20%
WealthManagement
12%
Insurance6%
Transaction Processing
5%
7
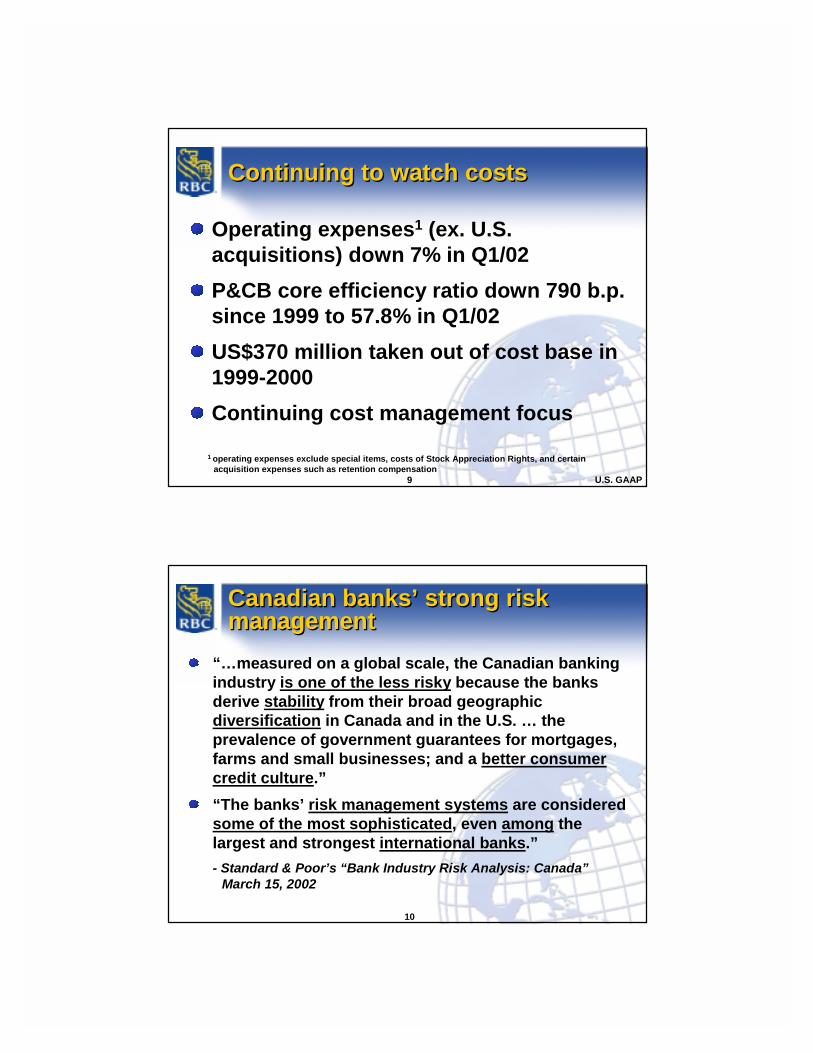
Leadership in most businessesLeadership in most businesses
Insurance – #1 Canadian bank-owned insurer, #1 in Canada in travel & creditor insuranceTransaction Processing – #1 in Canada in Custody, Correspondent Banking, Payments, Trade Finance & Cash ManagementWealth Management – #1 in Canada in full-service brokerage (by assets), private banking and trust businesses, and #1 in mutual funds among Canadian banks (#2 overall)Corporate & Investment Banking – top ranked securities underwriter in Canada for past 12 years and among top M&A advisors in CanadaPersonal & Commercial Banking – 10 million Canadian individual and business clients, strong positions in all product lines and highest core cash net income among Canadian banks (US$255 million in Q1/02)
8
Acquisitions drive strong revenue growthAcquisitions drive strong revenue growth
$2,560$2,350$2,320
$2,210$2,100
Q1/01 Q2/01 Q3/01 Q4/01 Q1/021 excluding one-time revenues in Q1/01 & Q4/01US$0.6298 = C$1.00 in this and all subsequent charts
Core revenues1(US$ millions)
22%
U.S. GAAP
9
Continuing to watch costsContinuing to watch costs
Operating expenses1 (ex. U.S. acquisitions) down 7% in Q1/02P&CB core efficiency ratio down 790 b.p. since 1999 to 57.8% in Q1/02 US$370 million taken out of cost base in 1999-2000Continuing cost management focus
U.S. GAAP
1 operating expenses exclude special items, costs of Stock Appreciation Rights, and certain acquisition expenses such as retention compensation
10
Canadian banks’ strong risk managementCanadian banks’ strong risk management
“…measured on a global scale, the Canadian banking industry is one of the less risky because the banks derive stability from their broad geographic diversification in Canada and in the U.S. … the prevalence of government guarantees for mortgages, farms and small businesses; and a better consumer credit culture.”“The banks’ risk management systems are considered some of the most sophisticated, even among the largest and strongest international banks.”- Standard & Poor’s “Bank Industry Risk Analysis: Canada”
March 15, 2002
11
What a difference a decade makesWhat a difference a decade makes
U.S. GAAP
Oct. 31, 1991 Jan. 31, 2002 ChangeBalance sheet:Res. mortgages as % of loans 27% 39% 1,200bpBus. & govt. loans & acceptancesas a % of loans 57% 41% (1,600)bpTotal assets $83.4 $228.3 174%
Risk profile:Nonaccrual loans $2.5 $1.7 (31)%Allowance for credit losses $1.3 $1.6 25%Loans & acceptances as % of commonequity (excluding res. mortgages) 12.7% 6.6% (610)bp
Capital:Tier 1 capital ratio1 6.1% 8.8% 270bpTotal capital ratio1 9.4% 11.6% 220bpShareholders’ equity $4.9 $11.5 135%
Income statement:Non-interest revenues as % of revenues 34% 54% 2,000bpReturn on common equity 15.5% 17.1% 160bp
(US$ billions)
1 based on Canadian GAAP financial information
12
Compared to 10 largest North American banks in market capitalization:
Moody’s S&PCitigroup Aa1 AA-Royal Bank Aa2 AA-JP Morgan Chase Aa3 AA-Fifth Third N/R AA-Bank of America Aa2 A+Wells Fargo Aa2 A+Bank of New York Aa3 A+Bank One Aa3 AUS Bancorp A1 AWachovia A1 AFleetBoston A2 A
Strong debt ratingsStrong debt ratings
13
Leading EPS growth among large Canadian banksLeading EPS growth among large Canadian banks
-95%
-31%-17%
-3%
1%
BNS CIBC TD BMO RY
1 Q1/02 over Q1/01. Core EPS excludes unusual items (such as restructuring charges, gains on dispositions and write-downs) for all the banks
Reported EPS growth1
Cdn GAAP
Core EPS growth1
-32% -33%
1%
14%
CIBC TD BMO RY
14
Strong ROE performance vs. North American peer groupStrong ROE performance vs. North American peer group
17.8%16.6% 17.1%
16.1%
19.3%18.1%
11.8%
15.9%
17.9%
17.5%16.6%
17.4%
1997 1998 1999 2000 2001 Q1/02
Royal Bank Peer Group
1 selected peer group consists of: Bank of New York, Wells Fargo, PNC Financial, Bank One, JP Morgan Chase, US Bancorp, Wachovia, Bank of America, FleetBoston, KeyCorp, Power Financial, TD Bank, CIBC, Scotiabank, Bank of Montreal
2 Q1/02 peer group excludes Wachovia and PNC Financial who had not released results by 04/17/02
Core ROE
U.S. GAAP (where available)
1
2

15
2002 objectives1 Q1/02 performance
EPS growth 5 - 10% 14%9% excluding goodwillamortization in Q1/01
ROE 17 - 19% 17.1%
Revenue growth 7 - 10% 22%
Expense growth Operating expense growth Op. exp. growth of 19%< operating revenue growth vs. op. rev. growth of 22%
Excl. U.S. acquisitions, op. exp.down 7% and op. rev. up 1%
Specific provision ratio2 0.45 - 0.55% .55%
Capital management2 Maintain strong 8.8% Tier 1 capital ratiocapital ratios 12.3% Total capital ratio
versus medium-term goals of 8%and 11-12%, respectively
1 based on on core results2 based on Canadian GAAP financial information
On-track for meeting 2002 objectivesOn-track for meeting 2002 objectives
U.S. GAAP
16
3 - 5 year goals1
ROE 20%+
EPS growth 15%+
Revenue growth 8 - 10%
Specific provision ratio 0.30 - 0.40%
Dividend payout ratio 30 - 40%
Capital managementTier 1 capital 8%Total capital 11 – 12%
1 based on on core results
Aggressive performance targetsAggressive performance targets
U.S. GAAP

17
Long-term shareholder value creationLong-term shareholder value creation
$100
$150
$200
$250
1996 1997 1998 1999 2000 2001
RY 19.4%TSE Banks & Trusts 17.8%
S&P 500 Index 13.8%
Five year annualized total return1
(October 31, 1996 – October 31, 2001)
1 in Canadian dollars, assuming dividends are reinvested
S&P Banks Index 11.9%
TSE 300 Index 5.8%
18
0.23 0.23 0.230.24
0.210.21
0.190.19
0.17
Q2/00 Q3/00 Q4/00 Q1/01 Q2/01 Q3/01 Q4/01 Q1/02 Q2/02
history of uninterrupted dividend paymentstarget payout range 30-40% (34% in Q1/02)
(US$ per share)Steady dividend increases
Dividends up 41% from Q2/00Dividends up 41% from Q2/00
U.S. GAAP
19
US$884 million in 2001 and US$293 million in Q1/02Balancing need for short-term returns with long-term growthShare repurchase plan well underway
� up to 18 million shares (3% of total) between June 01 and 02
� completed 12.6 million (or 70%) by 1/31/02
Generating substantial capital internallyGenerating substantial capital internally
U.S. GAAP
20
Key prioritiesKey priorities
1. Strong fundamentals2. International expansion3. Growth of high-return & high-P/E multiple
businesses4. Cross-platform leverage

21
U.S. expansion strategyU.S. expansion strategy
Roll-out, not “bet-the-bank” strategyExpanded in businesses where we have competitive advantageLooked for deals that are:
� manageable� generate healthy returns� strong performers with good management� good cultural fit� similar operating philosophies� share profitable growth aspirations
Priority #2 – Expansion outside CanadaPriority #2 – Expansion outside Canada
22
Cash EPS
Prism Financial In Year 1Liberty Insurance In Year 1Eagle Bancshares In Year 1Dain Rauscher In Year 2Centura Banks In Year 2Tucker Anthony Sutro In Year 31
Disciplined acquisitionsDisciplined acquisitions
Acquisitions should be cash earnings accretive in 2-3 years
1 neutral to cash EPS in Year 2 (2003)
Priority #2 – Expansion outside CanadaPriority #2 – Expansion outside Canada

23
Building sizeable U.S. platformBuilding sizeable U.S. platform
Tucker Anthony SutroUS$594 million
Personal & Commercial
BankingWealth
ManagementCorporate &Investment
BankingInsurance
Liberty Life & Liberty Insurance
Services US$580 million
Eagle Bancshares1
US$153 million
Centura Banks
US$2.2 billion
Genelco assets
Dain RauscherUS$1.2 billion
U.S. acquisitions since April 2000
Prism FinancialUS$115 million
1 expected to close by July 31, 2002
Priority #2 – Expansion outside CanadaPriority #2 – Expansion outside Canada
24
Approximate # of clients
RBC Liberty Insurance 700,000+ households
RBC Centura 700,000
RBC Dain Rauscher 500,000 accounts
Tucker Anthony 300,000 accounts
Eagle Bancshares 90,000 accounts
Recent U.S. acquisitions 2,290,000+
Growing U.S. client baseGrowing U.S. client basePriority #2 – Expansion outside CanadaPriority #2 – Expansion outside Canada
25
2000 revenues
Canadian84%
Other Int’l9%
Canadian63%
Proportion of U.S. revenues growingProportion of U.S. revenues growing
Q1/02 revenues
U.S. 7%
U.S. GAAP
OtherInt’l10%
U.S. 27%
Priority #2 – Expansion outside CanadaPriority #2 – Expansion outside Canada
26
(US$ millions)
Higher earnings from U.S. acquisitions1Higher earnings from U.S. acquisitions1
U.S. GAAP
1 represents net income of RBC Centura (includes RBC Prism Mortgage and SFNB), RBC Liberty Insurance and RBC Dain Rauscher (includes Tucker Anthony Sutro)
$33
$3
Q1/01 Q1/02
Priority #2 – Expansion outside CanadaPriority #2 – Expansion outside Canada

27
(US$ millions)
Retention compensation expenses to fallRetention compensation expenses to fall
U.S. GAAP
2001 2002F 2003F 2004F 2005F
Corporate & Investment
Banking
Wealth Management
$111 $111
$65
$42
$21
Priority #2 – Expansion outside CanadaPriority #2 – Expansion outside Canada
28
Entered phase II of U.S. expansion strategyEntered phase II of U.S. expansion strategy
Integration of SFNB and functions of RBC Prism and RBC Builder Finance into RBC Centura
� expected to result in US$70 million of cost savings on an annualized basis by end of 2002
Merger of Tucker Anthony into RBC Dain Rauscher� annualized cost savings of over US$60 million
expected to be realized (50% in 2002, remainder in 2003)
Integration of Eagle Bancshares into RBC Centura (to begin once closed – expected by July 31, 2002)
� expected to result in US$7+ million of cost savings on an annualized basis within 12 months of close
Priority #2 – Expansion outside CanadaPriority #2 – Expansion outside Canada
29
U.S. expansion prioritiesU.S. expansion priorities
Near-term focus
� Consolidating recent acquisitions
� Meeting operating targets
Priority #2 – Expansion outside CanadaPriority #2 – Expansion outside Canada
30
RY is:� Canada’s largest, most profitable company
� diversified financial services provider with leading market positions
� customer focused organization & leader in CRM
� strong financial performance & growth targets
� embarked on judicious growth path
� demonstrated execution capabilities
RY’s strengthsRY’s strengths

31
ConclusionConclusion
Will maintain clear focus on shareholders through unwavering commitment to:
� disciplined growth� diversification� continued strong risk management � improved efficiency� judicious capital management � business leadership� superior returns
Recommended