UNLV Theses, Dissertations, Professional Papers, and Capstones
5-2009
Uncertainty, sensitivity and geostatistical studies offlow and contaminant transport in heterogeneousunsaturated zoneFeng PanUniversity of Nevada, Las Vegas
Follow this and additional works at: https://digitalscholarship.unlv.edu/thesesdissertations
Part of the Hydrology Commons
This Dissertation is brought to you for free and open access by Digital Scholarship@UNLV. It has been accepted for inclusion in UNLV Theses,Dissertations, Professional Papers, and Capstones by an authorized administrator of Digital Scholarship@UNLV. For more information, please [email protected].
Repository CitationPan, Feng, "Uncertainty, sensitivity and geostatistical studies of flow and contaminant transport in heterogeneous unsaturated zone"(2009). UNLV Theses, Dissertations, Professional Papers, and Capstones. 1189.https://digitalscholarship.unlv.edu/thesesdissertations/1189

UNCERTAINTY, SENSITIVITY AND GEOSTATISTICAL STUDIES OF FLOW
AND CONTAMINANT TRANSPORT IN HETEROGENEOUS
UNSATURATED ZONE
by
Feng Pan
Bachelor of Engineering Sichuan University, China
2000
Master of Science University of Nevada Las Vegas
2005
A dissertation submitted in partial fulfillment of the requirements for the
Doctor of Philosophy Degree in Geoscience Department of Geoscience
College of Sciences
Graduate College University of Nevada Las Vegas
May 2009

UMI Number: 3383989
INFORMATION TO USERS
The quality of this reproduction is dependent upon the quality of the copy
submitted. Broken or indistinct print, colored or poor quality illustrations
and photographs, print bleed-through, substandard margins, and improper
alignment can adversely affect reproduction.
In the unlikely event that the author did not send a complete manuscript
and there are missing pages, these will be noted. Also, if unauthorized
copyright material had to be removed, a note will indicate the deletion.
UMI" UMI Microform 3383989
Copyright 2009 by ProQuest LLC All rights reserved. This microform edition is protected against
unauthorized copying under Title 17, United States Code.
ProQuest LLC 789 East Eisenhower Parkway
P.O. Box 1346 Ann Arbor, Ml 48106-1346

Dissertation Approval The Graduate College University of Nevada, Las Vegas
J a n u a r y ?? , 20jjg_
The Dissertation prepared by
Feng Pan
Entitled
Uncertainty, Sensitivity and Geostatistical Studies of Flow
and Contaminant Transport in Heterogeneous Unsaturated Zone
is approved in partial fulfillment of the requirements for the degree of
Ph.D in Geoscience
Examination Committee Co-Chair Examination Committee Chair
Examination Committee Member^
Dean of the Graduate College
Examination Committee Member
Graduate College Faculty Representative
1017-52 ii
ABSTRACT
Uncertainty, Sensitivity and Geostatistical Studies of Flow and Contaminant Transport in Heterogeneous Unsaturated Zone
by
Feng Pan
Dr. Zhongbo Yu, Examination Committee Chair Associate Professor of Hydrology University of Nevada Las Vegas
Dr. Jianting Zhu, Examination Committee Co-Chair Associate Professor of Hydrologic Science
Desert Research Institute
The objectives of this study are: (1) to develop a methodology of estimating
probability density functions (PDFs) of unsaturated hydraulic parameters when field
samples are sparse, (2) to evaluate the predictive uncertainties in flow and contaminant
transport due to parameter uncertainties in the layer- and local-scale heterogeneities of
hydraulic parameters in unsaturated zone (UZ), (3) to investigate the contributions of the
parameter uncertainties to the flow and transport uncertainties, and (4) to estimate the
spatial correlation structures of hydraulic parameters by incorporating prior information
and site measurements.
At layer scale, the uncertainty assessment of flow and contaminant transport in
UZ entails PDFs of the hydraulic parameters. A non-conventional maximum likelihood
(ML) approach is used in this study to estimate the PDFs of water retention parameters
(e.g., van Genuchten a and ri) for situations common in field scale applications where
core samples are sparse and prior PDFs of the parameters are unknown. This study also
investigates the effects of the uncertainties in the water retention parameters on the
predictive uncertainties in flow and transport in UZ. By comparing the predictive
uncertainties with and without incorporating the random water retention parameters, it is
found that the random water retention parameters have limited effects on the mean
predictions of the state variables including percolation flux, normalized cumulative mass
arrival, and contaminant travel time. However, incorporating the uncertainties in the
water retention parameters significantly increases the magnitude and spatial extent of
predictive uncertainties of the state variables.
The layer-scale uncertainty is specific to hydrogeologic layers, while the local-
scale heterogeneity refers to the spatial variation of hydraulic properties within a layer.
The local-scale heterogeneity is important in predicting flow path, velocity, and travel
time of contaminants, but it is often neglected in modeling practices. This study
incorporates the local-scale heterogeneity and examines its relative effects to the layer-
scale uncertainty on flow and transport uncertainties in UZ. Results illustrate that local-
scale heterogeneity significantly increases predictive uncertainties in the percolation
fluxes and contaminant plumes, whereas the mean predictions are only slightly affected
by the local-scale heterogeneity. Layer-scale uncertainty is more important than local-
scale heterogeneity for simulating overall contaminant travel time, suggesting that it
would be more cost-effective to reduce the layer-scale parameter uncertainty in order to
reduce predictive uncertainty in contaminant transport.
iv

The sensitivity analysis is an important tool to direct the future field
characterizations to reduce the predictive uncertainties in unsaturated flow and transport
modeling. This study presents an integrated approach to evaluate the contributions of the
uncertainties in input parameters to the predictive uncertainties in unsaturated flow and
contaminant transport with and without the consideration of parameter correlations. This
study also investigates the effects of parameter correlations on the sensitivity of flow and
transport. When the input parameters are independent, the parameter uncertainty in
permeability has the largest contributions to the uncertainties in percolation flux and mass
arrival of the reactive contaminants. The sorption coefficient of the reactive contaminant
becomes the dominant parameter in contributing to the uncertainty in overall contaminant
transport at late stage. When the input parameters are correlated, the uncertainties in van
Genuchten n and porosity have more contributions to the percolation flux and tracer
transport uncertainties due to their correlations with the van Genuchten a and
permeability, respectively. The rankings of parameter importance also change if the
parameter correlations are taken into account, indicating that the significant effects of
parameter correlations on the sensitivity of flow and contaminant transport in UZ.
Improving the heterogeneity characterizations of hydraulic parameters is critical
to reduce the predictive uncertainties in flow and contaminant transport. This study
presents a coupled method of Bayesian updating and the adjoint state maximum
likelihood cross validation (ASMLCV) to estimate the spatial correlation structures of
hydraulic parameters with the incorporation of prior information and site measurements.
The prior distribution is updated to yield the posterior distribution by the likelihood
function estimated from the on-site measurements and ASMLCV. The mean of posterior
v
probability distribution for spatial correlation scales can then be used for subsequent
heterogeneous field generations by kriging. The good agreement between measured and
kriged hydraulic data indicates that the coupled approach may improve the estimation of
spatial correlation structure with sparse measurements and known prior information in
the heterogeneous UZ.
vi
ABSTRACT
TABLE OF CONTENTS
in
LIST OF TABLES x
LIST OF FIGURES xi
ABBREVIATIONS xiv
ACKNOWLEDGEMENTS xvi
CHAPTER 1 INTRODUCTION 1 1.1 Introduction 1 1.2 Objectives 9 1.3 Study Site, Conceptual Model and Numerical Model 10
1.3.1 Study Site 10 1.3.2 Conceptual Model 13 1.3.3 Numerical Model 16
1.4 References 17
CHAPTER 2 LAYER-SCALE UNCERTAINTY CHARACTERIZATION OF WATER RETENTION PARAMETERS AND PREDICTIVE UNCERTAINTY ASSESSMENT OF FLOW AND CONTAMINANT TRANSPORT IN UNSATURATED ZONE 27
2.1 Introduction 28 2.2 ML Method of Estimating the PDFs 33 2.3 Uncertainty Assessments of Water Retention Parameters, Unsaturated Flow and Contaminant Transport 36
2.3.1 Uncertainty in Matrix van Genuchten a and m 36 2.3.2 Predictive Uncertainty in Unsaturated Flow 37 2.3.3 Predictive Uncertainty in Unsaturated Tracer Transport 42
2.4 Conclusions 45 2.5 References 48
CHAPTER 3 INCORPORATING LAYER- AND LOCAL-SCALE HETEROGENEITIES IN NUMERICAL SIMULATION OF UNSATRUATED FLOW AND CONTAMINANT TRANSPORT 55
3.1 Introduction 55 3.2 Characterization of Parameter Heterogeneity 58 3.3 Uncertainty Assessment 62
3.3.1 Uncertainty Assessment of Unsaturated Flow 64
vn

3.3.1.1 Comparison of Simulated and Measured Saturation and Water Potential 64 3.3.1.2Flow Pattern and Uncertainty Assessment 65 3.3.1.3 Comparison of Flow Uncertainty Assessment 66
3.3.2 Uncertainty Assessment of Tracer Transport 68 3.3.2.1 Uncertainty Assessment of Spatial Distribution in Tracer Plumes 69 3.3.2.2Uncertainty Assessment of Cumulative Mass Travel Time 69 3.3.2.3 Comparison of Transport Uncertainty Assessment 71
3.4 Discussions 72 3.5 Conclusions 75 3.6 References 75
CHAPTER 4 SENSITIVITY OF UNSATURATED FLOW AND CONTAMINANT TRANSPORT AND EFFECTS OF INPUT PARAMETER CORRELATIONS 82
4.1 Introduction 82 4.2 Sampling-based Sensitivity Analysis 86
4.2.1 Regression Analysis 87 4.2.2 Regression-based Method with Correlated Parameters 89
4.3 Sensitivity Analysis of Flow and Contaminant Transport 91 4.3.1 Sensitivity of Unsaturated Flow 92
4.3.1.1 Sensitivity of Unsaturated Flow with Independent Parameters .... 92 4.3.1.2 Sensitivity of Unsaturated Flow with Correlated Parameters 96 4.3.1.3 Effect of Parameter Correlation on Sensitivity of Unsaturated Flow
100 4.3.2 Sensitivity of Contaminant Transport 101
4.3.2.1 Sensitivity of Contaminant Transport with Independent Parameters 101
4.3.2.2 Sensitivity of Contaminant Transport with Correlated Parameters 106
4.3.2.3 Effect of Parameter Correlation on Sensitivity of Contaminant Transport 107
4.4 Conclusions I l l 4.5 References 113
CHAPTER 5 AN ESTIMATION OF SPATIAL CORRELATION STRUCTURES OF HYDRAULIC PARAMETERS IN HETEROGENEOUS POROUS MEDIA 117
5.1 Introduction 117 5.2 Study Site 122 5.3 Bayesian Updating and ASMLCV Approach 126
5.3.1 Identification of Parameter Distribution 126 5.3.2 Prior Probability of Spatial Correlation Scale 127 5.3.3 ML Function of Spatial Correlation Scale 128 5.3.4 Posterior Probability of Spatial Correlation Scale 129 5.3.5 Heterogeneous Parameter Field Generation via Kriging 130
5.4 Estimation of Spatial Correlation Structure 131 5.4.1 Distribution Identification of Soil Hydraulic Data 131
vin

5.4.2 Prior Probability Determination for Spatial Correlation Scale 133 5.4.3 Spatial Correlation Scale Updating 134 5.4.4 Heterogeneous Field Generation of Soil Hydraulic Parameters 139
5.5 Conclusions 140 5.6 References 143
CHAPTER 6 CONCLUSIONS 148
APPENDIX A MATHEMATIC MODEL OF UZ FLOW AND TRACER TRANSPORT 153
VITA 158
IX
LIST OF TABLES
Table 2.1 The estimation of mean and standard deviation of van Genuchten a and m parameters 38
Table 2.2 Comparison of mean, 5th, and 95th percentiles of simulated travel time of the conservative (99Tc) and reactive (23 Np) tracers arriving at water table at 10%, 25%, 50%, 75% and 90% mass fraction breakthrough with (this study) and without (Ye et al., 2007b) considering the water retention parameter uncertainty 48
Table 5.1 Descriptive statistics for soil hydraulic parameters 125 Table 5.2 Statistical parameters of soil hydraulic properties for distribution
approximation 132 Table 5.3 The means of posterior probability distribuitons for horiozntal and vertical
correlation scales of soil hydraulic parameters 138
x

LIST OF FIGURES
Figure 1.1 Schematic illustration of the conceptualized flow processes and effects of capillary barriers, major faults, and perched-water zones within a typical east-west cross section of the UZ flow model domain (modified from BSC, 2004a).
11 Figure 1.2 Plan view of the 3-D UZ numerical model grid showing the model domain,
faults, proposed repository layout, and locations of several boreholes (Modified from BSC, 2004a) 12
Figure 1.3 Plan view of present-day net infiltration distributed over the 3-D unsaturated zone flow model grid 15
Figure 2.1 The van Genuchten model fitted to the water retention data of three samples for the hydrogeologic layer TMN of the UZ model of YM. Symbols denote the water retention data of three samples, and the solid and dashed lines are the fitted van Genuchten model and their 95% confidence intervals. The water retention data are adopted from BSC (2003b) 32
Figure 2.2 CDFs of the matrix van Genuchten a and m in the layer of TLL. Fitted parameter values of five core samples in the layer are also plotted as solid triangles on the x-axis 39
Figure 2.3 Comparison of the observed and simulated matrix liquid saturation with (solid line) and without (dash line) considering the water retention parameter uncertianty for borehole SD-12 41
Figure 2.4 Mean and variance of the simulated percolation fluxes at water table with (a and b) and without (c and d) considering the water retention parameter uncertianty 42
Figure 2.5 Mean and variance of the normalized cumulative mass arrival contours of the reactive tracer (237Np) at the water table after 1,000,000 years with (a and b) and without (c and d) considering the water retention parameter uncertainty. 44
Figure 2.6 Simulated breakthrough curves of the cumulative mass arriving at water table QQ 9 ^ i
for (a) the conservative tracer ( Tc) and (b) reactive tracer ( Np) with (this study) and without (Ye et al, 2007b) considering the water retention parameter uncertainty 47
Figure 3.1 The locations of measurements in matrix hydraulic conductivity (blue circle) and porosity (green square) in the UZ of YM 60
Figure 3.2 Mean of generated random log permeability at east-west (a) and north-south (b) cross section through borehole UZ-14 (TCw, PTn, TSw, and CHn are four major units in the UZ of YM; TLL is the proposed repository layer in TSw unit) 63
Figure 3.3 Comparison of observed and 3-D model simulated matrix liquid saturation for borehole SD-12 65
XI

Figure 3.4 (a) Mean, (b) variance, (c) 5th percentile, and (d) 95th percentile of simulated percolation fluxes at the proposed repository horizon 67
Figure 3.5 Mean and variance of simulated percolation fluxes at the water table for the heterogeneous case (a,b) and homogeneous case (c,d) 68
Figure 3.6 Contours of mean and variance in normalized cumulative mass arrival (%) for the reactive tracer (237Np) at the water table after 1,000,000 years for the heterogeneous case (a,b) and homogeneous case (c,d) 70
Figure 3.7 Simulated breakthrough curves of cumulative mass arriving at the water table for (a) conservative tracer (99Tc) and (b) reactive tracer (23 Np) (Hete represents the heterogeneous case and Homo represents the homogeneous case) 74
Figure 4.1 The mean and standard deviation of SRRC values of permeability, van Genuchten a, and n parameters on percolation flux uncertainty for each layer
94 Figure 4.2 The SRRC values of permeability (a), van Genuchten a (b) and n (c)
parameters on percolation flux uncertainty and R2 values of regression analysis (d) at repository horizon 95
Figure 4.3 The SRRC2 values of permeability (a), van Genuchten a (b) and n (c) parameters on percolation flux uncertainty and R2 values of regression analysis (d) at the water table 96
Figure 4.4 The S of permeability, van Genuchten a, and n parameters for each layer 98 Figure 4.5 The total S of permeability (a), van Genuchten a (b), and n (c) parameters on
percolation flux uncertainty at the water table 100 Figure 4.6 The mean and standard deviation of SRRC2 values of permeability, porosity,
van Genuchten a, and n, and sorption coefficient (Kd) on normalized cumulative mass arrival uncertainty of 237Np after 1,000,000 years in the layers below the repository 102
Figure 4.7 The SRRC2 values of permeability (a), porosity (b), van Genuchten a (c) and n (d), and Kd (e) on normalized cumulative mass arrival uncertainty of 237Np at each block of the water table after 1,000,000 years 104
Figure 4.8 The SRRC2 values of permeability, porosity, van Genuchten a and n, and Kd on travel time uncertainty of 237Np 105
Figure 4.9 The S values of permeability, porosity, van Genuchten a, and n, and Kd in the layers below the repository horizon 109
Figure 4.10 The S of permeability (a), porosity (b), van Genuchten a (c) and n (d), and Kd (e) on normalized cumulative mass arrival uncertainty of 237Np at each block of water table after 1,000,000 years 110
Figure 4.11 The total (solid line), uncorrelated (dash line), and correlated (dashdot line) S of permeability, porosity, van Genuchten a and n, and Kd on travel time uncertainty of 23 Np I l l
Figure 5.1 Plan view of the Sisson and Lu (1984) injection site and well numbering scheme (modified from Ye et al., 2005b) 123
Figure 5.2 Lithostratigraphic corss section (B-B' shown in Figure 5.1) through the southeastern portion of the injection site (modified from Ye et al., 2005b). 124
Figure 5.3 Locations of field measurements at boreholes S-l, S-2, S-3, A-7, E-l, and E-7 in the S&L injection site 125
xn

Figure 5.4 Empirical (dashed) and theoretical (solid) cumulative distribution functions (CDFs) for transformed soil hydraulic parameters in the S&L site. The selected best transformations are listed in the figures 132
Figure 5.5 Prior probability distribution (solid), posterior probability distribution (dashed), and negative natural log likelihood (NLL, dashdotted) values for the soil hydraulic parameters 137
Figure 5.6 Comparison of kriged and measured soil hydraulic data at borehole S-1 shown in Figure 5.1 141
Figure 5.7 Generated heterogeneous fields of soil hydraulic parameters using kriging. 142
xin

ABBREVIATIONS
1-D one-dimensional
3-D three-dimensional
ANOVA Analysis of variance
ASMLCV Adjoint state maximum likelihood cross validation
CDF Cumulative distribution function
CFu Crater Flat undifferentiated unit
CHn Calico Hills nonwelded unit
FEP Feature, event and process
GSLIB Geostatistical software library
K-S Kolmogorov-Smirnov
LHS Latin Hypercube Sampling
LS Least square
LSE Least square estimate
ML Maximum likelihood
MLE Maximum likelihood estimate
NLL Negative log likelihood
RML Restricted maximum likelihood
PDF Probability density function
PTn Paintbrush nonwelded unit
R2 Coefficient of determination
xiv

RETC Retention curve
RDD Random domain decomposition
S Sensitivity index
S&L Sisson and Lu
SGSIM Sequential Gaussian Simulation
SRC Standardized regression coefficient
SRRC Standardized rank regression coefficient
TCw Tiva Canyon welded unit
TSw Topopah Spring welded unit
USDOE U.S. Department of Engery
UZ Unsaturated zone
YM Yucca Mountain
xv

ACKNOWLEDGEMENTS
I sincerely thank my advisor, Dr. Julian Zhu from the Desert Research Institute
(DRI), for his support, encouragement and valuable guidance in the past three years. He
always points out the key of problems to bring me out of the difficult situations. I benefit
a lot from his guidance on improving the ability of problem solving and journal paper
writing. Grateful acknowledgement is made to my advisor, Dr. Ming Ye from the Florida
State University (FSU), for his directing and generous help on my research in the past
five years, who gives me numerous suggestions and guidance. I benefit from his inspired
ideas, hard working, responsibility, and earnest attitude on research. I greatly appreciate
the support, guidance and academic help from my advisor, Dr. Zhongbo Yu from the
University of Nevada Las Vegas (UNLV). He introduced me to the field of hydrologic
modeling six years ago. I benefit from his broad knowledge and guidance to be a
collaborative and independent scientist.
I would like to thank my committee member, Dr. Michael Nicholl from UNLV,
for his instructions in the classes of field hydrogeology and geological engineering as
well as suggestions on my dissertation. I would also like to thank my committee member,
Dr. Ganqing Jiang from UNLV, for his suggestions and help on my comprehensive exam
and research. Many thanks go to my committee member, Dr. Sandra Catlin from UNLV,
as the graduate college representative. I also thank Dr. Terry Spell to take the role of my
comprehensive exam in geochemistry.
To my co-authors of published journal papers, Drs. Julian Zhu, Ming Ye,
xvi
Zhongbo Yu, Yu-Shu Wu and Bill Hu, I'd like to express my gratitude for their
willingness to pursue the significant project to the end, and to make great efforts. I am
grateful that DRI provides me a wonderful research environment in the past five years. I
would also like to extend special thanks to the faculty and staff in Division of Hydrologic
Sciences, DRI Las Vegas Campus, as well as colleagues and officemates in the
department of Geoscience, UNLV, who helped and supported me in many ways in the
past six years. Funding support from U.S. Department of Energy under Grant No.
DOE/UNLV-YM GEOSTAT& STOCHASTIC 6450-644-4450 and the Aileen and Sulo
Maki Ph. D Fellowship from DRI is greatly appreciated.
I would like to thank my wonderful family, especially my parents, Jiayou Pan and
Yujun Fang, and my wife, Yuyu Lin, who occupy a warm place in my heart, and give me
love, support and encouragement throughout.
xvn

CHAPTER 1
INTRODUCTION
1.1 Introduction
Understanding flow and contaminant transport in unsaturated zone (UZ) is
important to evaluate and monitor possible effects of the remediation sites on the
groundwater water and environmental systems, since UZ acts as a critical natural barrier
to delay the arrival of the contaminants to groundwater table (BSC, 2004a; Haukwa et al.,
2003; Illman and Hughson, 2005; Lu and Zhang, 2004; Nichols and Freshley, 1993; Pan,
2005; Ye et al., 2007b; Zhang et al., 2006; Zhou et al., 2003). Many three-dimensional
(3-D) site-scale numerical models have been developed to incorporate various physical
processes in UZ for specific sites (Ahlers et al., 1999; Viswanathan et al., 1998; Wu et
al., 1999). The flow and contaminant predictions simulated by these site-scale models are
acceptable based on the model calibrations in UZ (Bardurraga and Bardvarsson, 1999;
BSC, 2004a, b; Ji et al., 2008; Vrugt et al., 2004; Wu et al., 1999). Because most UZ
consists of complex hydrogeologic units with systematic and spatial variability of
hydraulic properties at multiple scales, it is difficult to predict the flow and contaminant
transport under such uncertain conditions (Flint, 2003; Nichols and Freshley, 1993; Pan,
2005; Ye et al., 2007b). The uncertainties in the model predicted unsaturated flow and
contaminant transport can be quantified using stochastic methods (Dagan, 1989; Dagan
and Neuman, 1997; Gelhar, 1989; Rubin, 2003; Ye et al., 2004a; Zhang, 2002).
1

Generally, uncertainties in flow and contaminant transport at UZ could come from
various types of uncertainties such as parameter uncertainty, measurement uncertainty,
scenario uncertainty in climate, conceptual model uncertainty in hydrogeological models
etc. (BSC, 2004a; Flint, 1998, 2003; Flint et al., 2006; Holt et al., 2002, 2003; Wu et al.,
2002, 2004). The measurement errors could lead to biased predictions of flow and
contaminant transport (Holt et al., 2002, 2003). The conceptual model uncertainty in
hydrogeologic models such as steady-state flow approximation, geological layering,
lateral flow, and fast-flow pathways could cause significant uncertainties in flow and
contaminant transport in UZ (BSC, 2004a; Flint et al., 2001). The scenario uncertainty in
surface infiltration such as due to climate change is another important source of
uncertainty in UZ modeling (BSC, 2004a; Wu et al., 2002). The flow and contaminant
transport uncertainties due to measurement uncertainty, conceptual model uncertainty and
scenario uncertainty are beyond the scope of this study, although these uncertainties can
be evaluated by the numerical simulations and the Maximum Likelihood Bayesian Model
Averaging method (Neuman, 2003; Ye et al., 2004b). This study is focused on the
uncertainty assessments of flow and contaminant transport due to parameter uncertainties
in heterogeneous UZ. The parameter uncertainties due to the spatial variability of
hydraulic parameters can be quantified using the measurements from core samples
according to the ergodicity assumption, which assumes that any realization of a stochastic
process in space has the same probability distributions as the ensemble of possible
realizations (Li and Yeh, 1999; Ye et al., 2007b).
The hydraulic properties controlling water movement in UZ mainly include
parameters such as hydraulic conductivity, porosity, water content, and water retention
2
parameters (Hillel, 1998). The van Genuchten a and n parameters from van Genuchten
equation (van Genuchten, 1980) are widely used as water retention parameters to
describe the water retention characteristics. The contaminant transport in UZ is largely
controlled by three important processes such as advection, diffusion, and dispersion for
conservative contaminants. Additional processes such as adsorption and radionuclide
decay should also be considered for reactive contaminants (Domenico and Schwartz,
1990; Fetter, 1994). The transport parameters controlling the transport processes mainly
include molecular diffusion, hydrodynamic dispersion, grain density, tortuosity,
adsorption, and radionuclide half-time. The parameter uncertainties in the hydraulic and
transport parameters due to the multi-scale spatial variability from core samples to layer
structures and lithofacies would cause uncertain model predictions of flow and
contaminant transport in UZ (Nichols and Freshley, 1993; Pan, 2005; Pan et al., 2009a, b;
Ye et al., 2007b). Quantification of parameter uncertainty and its propagation in
hydrogeological models has been studied for decades using stochastic methods, as
reviewed in several books (e.g., Dagan, 1989; Dagan and Neuman, 1997; Gelhar, 1989;
Rubin, 2003; Zhang, 2002). Quantifying uncertainty at the field scale is of particular
importance because decisions are often based on the field-scale predictions. However,
field-scale models for representing complex hydrogeologic environments are
complicated, making it difficult to evaluate the propagation of parameter uncertainty
through the complicated models.
In field-scale modeling, it is common practice to separate a large field domain
into hydrogeologic layers (or lithofacies and hydrofacies) based on available data such as
site geology, hydrogeology, and geophysics (Flint, 1998, 2003; Flint et al., 2006).
3

Hydraulic and transport parameters of each layer often are treated as homogeneous
variables and are calibrated to match the field observations of state variables (BSC,
2003b, 2004a; Wu et al., 2004; Zhang et al, 2006). The layer scale refers to the
hydrogeologic layers with layerwise average properties, while the local scale refers to the
spatial variation in hydraulic properties within a layer. Layer-scale heterogeneity,
especially after layerwise parameters are calibrated, is important in simulating the overall
flow and transport trend and pattern. The local-scale heterogeneity within the layers is
important in predicting flow path, velocity, and travel time of contaminants (Bodvarsson
et al., 2001; Haukwa et al., 2003; Illman and Hughson, 2005; Nichols and Freshley, 1993;
Viswanathan et al., 2003; Zhou et al., 2003). Therefore, this dissertation is focused on the
characterizations of both layer- and local-scale heterogeneities in the hydraulic and
transport parameters and the assessments of associated predictive uncertainties in flow
and contaminant transport in heterogeneous UZ.
For layer-scale uncertainty characterizations, the hydraulic and transport
parameters are often treated as homogeneous random variables (Nichols and Freshley,
1993; Pan, 2005; Pan et al., 2009b; Ye et al., 2007b). Probability density functions
(PDFs) of the parameters are required for evaluating the parameter uncertainty and its
propagation through unsaturated flow and contaminant transport models (Avanidou and
Paleologos, 2002; Boateng, 2007; Chen et al., 2005; Christiaens and Feyen, 2001; Lu and
Zhang, 2004; Zhou et al., 2003). The PDFs of hydraulic and transport parameters can be
rigorously identified based on a large data set of core samples (e.g., Pan, 2005; Ye et al.,
2007b). However, it is difficult to estimate the PDFs of hydraulic parameters with sparse
measurements and unknown prior PDFs, especially for water retention parameters (i.e.,
4
van Genuchten a and n in this study). Although many methods (e.g., Least-Square (LS),
Maximum Likelihood (ML), pedotransfer method with bootstrap) have been used to
estimate the water retention parameters and the associated estimation uncertainties
(Hollenbeck and Jensen, 1998; Schaap and Leij, 1998; van Genuchten et al., 1991), these
methods do not explicitly yield the parameter PDFs. The Bayesian methods can give the
parameter PDFs but it requires the prior PDFs from subjective estimation (Meyer et al.,
1997). To resolve this problem, this study presents a direct method of estimating the
PDFs for measuring uncertainties in the water retention parameters with unknown prior
PDFs and sparse measurements. The PDFs of the water retention parameters are
estimated using a Bayesian framework based on a non-conventional ML method
introduced by Berger (1985) in statistical literature. The associated predictive
uncertainties in unsaturated flow and contaminant transport due to hydraulic parameter
uncertainties are then examined by Monte Carlo simulations using a 3-D flow and
transport model.
For local-scale heterogeneity characterizations, the hydraulic parameters are
treated as heterogeneous random variables (Pan et al., 2009a; Zhou et al., 2003).
Parameter uncertainty and sensitivity analysis for contaminant transport in UZ has been
conducted mainly at the layer scale (Illman and Hughson, 2005; Nichols and Freshley,
1993; Pan et al., 2009b; Ye et al., 2007b; Zhang et al., 2006). Local-scale heterogeneity
in the model parameters within a layer is also important since it affects the flow path,
velocity, and travel time of contaminants (Bodvarsson et al., 2001; Haukwa et al., 2003;
Illman and Hughson, 2005; Viswanathan et al , 2003; Zhou et al, 2003). This study
incorporates the layer- and local-scale heterogeneities in hydraulic parameters into the
5
uncertainty assessments of flow and transport to investigate relative effects of layer- and
local-scale heterogeneities on the uncertainties in flow and contaminant transport in
heterogeneous UZ.
The parameter uncertainties due to layer- and local-scale heterogeneities in
hydraulic parameters could cause significant predictive uncertainties in flow and
contaminant transport in UZ (Bodvarsson et al., 2001; Haukwa et al., 2003; Illman and
Hughson, 2005; Nichols and Freshley, 1993; Viswanathan et al., 2003; Pan, 2005; Pan et
al., 2009a, b; Ye et al., 2007b; Zhou et al., 2003). The sensitivity analysis is an important
tool to help design future data collection to reduce the parameter uncertainties, which also
reduce the associated predictive uncertainties in flow and contaminant transport in UZ.
The local sensitivity analysis with only one varied parameter within one standard
deviation at a time was conducted by Zhang et al. (2006). Parameter correlations have not
been considered in previous sensitivity analysis (Arnold et al., 2008; Boateng and
Cawlfield, 1999; Mertens, et al, 2005; Sallaberry et al., 2008). Therefore, this study seeks
to conduct global sensitivity analysis of hydraulic and transport parameters on flow and
contaminant transport uncertainties using the sampling-based method and to investigate
the effects of parameter correlations on sensitivity of flow and transport in UZ.
Improving the heterogeneity characterizations of hydraulic parameters is also
critical to reduce the predictive uncertainties in flow and transport in UZ (Kitanidis and
Lane, 1985), due to that the accuracy of flow and contaminant transport predictions
largely depends on the heterogeneity characterizations of hydraulic parameter fields,
especially spatial variability of the parameters. Because of the paucity of hydraulic
parameter field measurements, it is difficult to accurately estimate their spatial
6

variability, which is typically estimated by the traditional geostatistical approach such as
sample variogram. The variogram models are often used in the heterogeneity
characterizations to measure the extent of spatial variability for the hydraulic parameters.
However, it is difficult, if not impossible, to estimate the spatial correlation structures of
hydraulic parameters from the empirical and fitted variograms because of sparse data in
most cases, especially for saturated hydraulic conductivity, and water retention
parameters. Therefore, there are needs for methods to improve the estimation of spatial
correlation structures of hydraulic parameters when the field measurements are sparse.
Many parameter estimation approaches have been proposed to estimate the spatial
correlation structures of hydraulic parameters such as LS, ML estimation, restricted
maximum likelihood (RML) estimation, and adjoint state maximum likelihood cross
validation (ASMLCV) (Dietrich and Osborne, 1991; Kitanidis an Lane, 1985; Samper
and Neuman, 1989a, b, c; Pardo-Iguzquiz, 1998). However, the prior information is not
included in the ML approaches and it may produce unreliable results with only several
measurements available (Pardo-Iguzquiz, 1999). Although the Bayesian updating method
can update the moments of prior PDFs to yield the posterior PDFs with sparse field data
(Meyer et al., 1997), it cannot change the type of prior PDF and its accuracy largely
depends on the accuracy of prior PDF assumption. In order to incorporate the prior
information and available site measurements for improving the heterogeneity
characterizations of hydraulic parameters, this study tries to couple the ASMLCV with
Bayesian updating to estimate the spatial correlation structures of hydraulic parameters
and to improve the local-scale heterogeneity characterizations of hydraulic parameters.
7

The UZ of Yucca Mountain (YM) in Nevada, U.S., is selected as a case study to
illustrate the applications of layer- and local-scale heterogeneity characterizations,
predictive uncertainty and sensitivity analysis of flow and contaminant transport. The UZ
of YM is proposed by the U.S. Department of Energy (USDOE) as the nation's first
permanent geologic repository for spent nuclear fuel and high-level radioactive waste
(BSC, 2003a). The UZ of YM is a complex system in geology and hydrogeology with
significant parameter uncertainty and associated contaminant transport uncertainty. The
UZ consists of various complex hydrogeologic units, and spatial variability of hydraulic
properties in each unit can be viewed as deterministic and/or random processes of
multiple scales. Yet, only limited data are available to characterize multi-scale
heterogeneities, which results in uncertainties in model parameters and, subsequently,
model predictions. The site also provides a good setting for illustrating and testing the
non-conventional ML approach to estimate the PDFs of water retention parameters with
only several samples available for each layer. A conservative tracer, technetium (99Tc),
and a reactive tracer, neptunium (237Np) are selected as synthetic tracers for the
contaminant transport simulations in the UZ of YM. The hydraulic and transport
parameters (e.g., permeability, porosity, van Genuchten a and n, and sorption coefficient
of the reactive tracer) are treated as the random variables. Other parameters (e.g., residual
saturation, molecular distribution, and hydrodynamic dispersion) are treated as the
deterministic variables because the parameters are less variable based on the sensitivity
analysis of Zhang et al. (2006). The uncertainties in fracture properties are also assumed
to be deterministic due to their limited significance to the flow and transport simulations
(BSC, 2004a; Zhang et al., 2006).
8
The Sisson and Lu (S&L) injection site, designed for infiltration experiments
within the Hanford Site, Washington State (Sisson and Lu, 1984), is selected as a case
study to estimate the spatial correlation structures of hydraulic parameters. The site
provides a good setting for illustrating and testing the coupling of Bayesian updating and
ASMLCV approach to estimate the spatial correlation structures of hydraulic parameters.
70 data sets of soil hydraulic parameters are available from six boreholes with 53 of these
data from three close boreholes in the study site (Ye et al., 2007a). It is very difficult to
determine the spatial correlation structures based on the traditional geostatistical
approach (i.e., sample variogram), especially for the horizontal correlation scale.
1.2 Objectives
In summary, the objectives of this dissertation are as follows:
(1) Develop a methodology of estimating PDFs of the unsaturated
hydraulic parameters when field samples are sparse;
(2) Characterize the layer- and local-scale heterogeneities of hydraulic
parameters and evaluate the associated predictive uncertainties in flow
and contaminant transport in UZ;
(3) Investigate the contributions of individual parameter uncertainties to
predictive uncertainties in flow and contaminant transport in UZ by the
global sensitivity analysis;
(4) Estimate the spatial correlation structures of hydraulic parameters to
improve the heterogeneity characterizations by a coupled method of
Bayesian updating and ASMLCV.
9
Thus, this dissertation is comprised of four individual but related parts. The first
part (Chapter 2) is to present a direct method to estimate the PDFs of the water retention
parameters using a Bayesian framework based on a non-conventional ML method when
the core samples are sparse and prior PDFs of the parameters are unknown. The layer-
scale uncertainties in hydraulic parameters can be characterized and the associated
uncertainties in flow and contaminant transport in UZ are also evaluated. The second part
(Chapter 3) is to incorporate the layer- and local-scale heterogeneities in hydraulic
parameters (only permeability and porosity in this part) to investigate relative importance
to the propagation of parameter uncertainty to flow and contaminant transport. The third
part (Chapter 4) is to evaluate the relative importance of individual hydraulic parameters
on flow and transport uncertainties using the sampling-based sensitivity analysis method.
In addition, the effects of parameter correlations on the sensitivity analysis results are
also investigated by comparing the sensitivity results with and without considering
parameter correlations. The fourth part (Chapter 5) is to present a coupled method of
Bayesian updating and ASMLCV to estimate the spatial correlation structures of
hydraulic parameters and to improve the heterogeneity characterizations of the hydraulic
parameters.
1.3 Study Site, Conceptual Model and Numerical Model
1.3.1 Study Site
The study site, UZ of YM, is applied in first three parts of this dissertation and is
briefly described here. The study site, S&L injection site, is only employed in the study
of spatial correlation structure estimation and is introduced in Chapter 5.
10
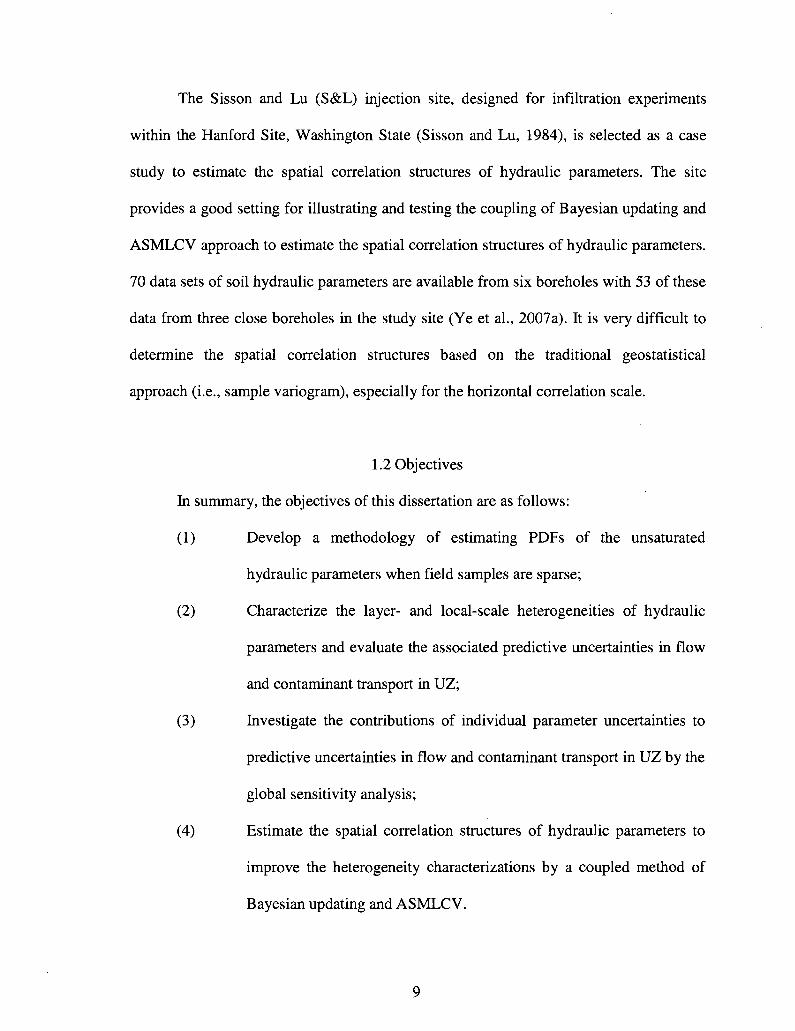
The UZ of YM is between 500 and 700 meters thick and is a complex geologic
formation with heterogeneous layered and anisotropic fractured tuffs (BSC, 2003a). The
UZ consists of five major geologic units: Tiva Canyon welded unit (TCw), Paintbrush
nonwelded unit (PTn), Topopah Spring welded unit (TSw), Calico Hills nonwelded unit
(CHn), and Crater Flat undifferentiated unit (CFu) (Figure 1.1). Each unit is further
divided into multiple hydrogeologic layers, which results in a total of 30 layers. A 3-D
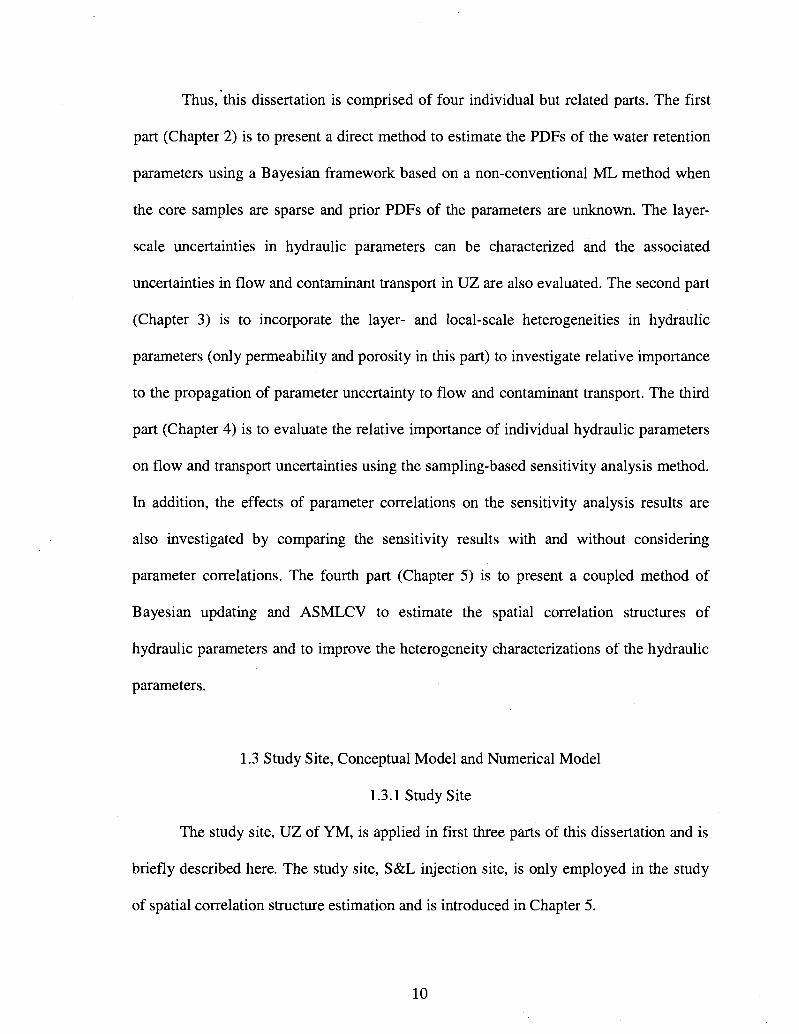
numerical grid of the UZ encompassing approximately 40 km was developed, which
consisted of 980 mesh columns and 45 numerical layers (BSC, 2004a). Figure 1.2 shows
the plane-view of the numerical grid with the model domain, with proposed repository
layout being highlighted in blue dots, borehole locations and faults.
1500"
I 9 IS 0) E 0>
s to
-=- 1000 c o CO
> in
IV
1 f i 1 UZ-'
Capillary Barrier
1 ] j r i y Topopah Soring welded unit (TSw)
Potential Repository Horizon
i » / ' i < i l 1
—*•
^ ^ ^ T -/ProwPass(zeolitic).. Sely\veld '*'l ', ~"~~l S ' i. \ •
170000 171000 Easting (meters)
Tiva Canyon Welded Unit (TCw)
Paintbrush Nonwelded Unit (PTn)
Perched Water
Tptpv3 (basal vitophyre)
Calico Hills (zcolitic)
172000 Water Table
Figure 1.1 Schematic illustration of the conceptualized flow processes and effects of capillary barriers, major faults, and perched-water zones within a typical east-west cross section of the UZ flow model domain (modified from BSC, 2004a).
11
237000
236000
^ 235000 i
M 234000 a 1 © 233000 U eg
J 232000
231000h
230000
- Cross-section « Repository Block • Borehole
_L J I L
170000 172000 17401
Nevada Coordinate E-W (m)
Figure 1.2 Plan view of the 3-D UZ numerical model grid showing the model domain, faults, proposed repository layout, and locations of several boreholes (modified from BSC, 2004a).
A total of 5,320 rock core samples from 33 boreholes were collected to analyze
the spatial variability of hydrologic properties in the UZ of YM (BSC, 2003b; Flint,
1998, 2003). There are 546 matrix saturated hydraulic conductivity samples (converted
into permeability in this study) and 5,257 porosity samples measured from the cores at
several clusters of shallow boreholes and 7 deep boreholes (BSC, 2003b; Flint, 1998).
Matrix porosity was calculated based on the saturated weight, volume, and dry weight of
the sample, which was obtained from the dried sample in 105°C for at least 48 hours
12

(Flint, 1998). The matrix saturated hydraulic conductivity was calculated by Darcy's law
after measuring the outflow over time using the permeameter (Flint, 1998). The water
retention curves (water potential vs. saturation) of samples were obtained using the
laboratory equipment of chilled-mirror psychrometer (Flint, 1998). The van Genuchten a
and n parameters used in this study are derived by fitting the measured water retention
curves (BSC, 2003b; Flint, 1998). Over 700 sample data of sorption coefficient (Kd) of
the reactive tracer (237Np) was experimented for three types of rocks (devitrified, vitric,
and zeolite tuffs) (BSC, 2004b).
1.3.2 Conceptual Model
Since 1980s, conceptual models have been developed by many researchers to
simulate the physical processes in the UZ of YM (Flint et al., 2001). The recently
developed conceptual model is consistent with the measured data and observations
reflecting the hydrologic processes in the UZ of YM (BSC, 2004a; Flint et al, 2001).
The infiltration pulses with spatial and temporal variability from precipitation are
major sources of percolation fluxes through the highly fractured TCw unit on the top. The
PTn unit with high porosity and low fracture intensity has a large capacity to store the
groundwater penetrated through TCw as rapid fracture flow and to form more uniform
flux at the base of PTn. The capillary barriers exists within the PTn unit at the upper and
lower interfaces with TCw and TSw units due to large contrasts in rock properties across
the interfaces (Montazer and Wilson, 1984). The perched water affecting flow paths in
the UZ can be found on the top of low-permeability zeolites in CHn unit or the densely
welded basal vitrophyre of the TSw unit in several boreholes (e.g., UZ-14, SD-7, SD-9,
and SD-12 shown in Figure 1.2). In addition, faults with high permeability can play an
13

important role in percolation flux of UZ. More descriptions of flow conceptual model are
referred to BSC (2004a) and Wu et al. (2007).
The contaminants can transport through the UZ as dissolved molecular species or
in colloidal form, involving the physical processes of advection, molecular diffusion,
sorption for reactive tracers, and radioactive decay. The mechanical dispersion through
the fracture-matrix system is ignored, since sensitivity studies indicated that the
mechanical dispersion has insignificant effect on the cumulative breakthrough curves of
tracers at the water table (BSC, 2004a). The sorption processes involve three basic rock
types (devitrified tuffs, vitric tuffs, and zeolitic tuffs). The contaminant transport in the
TSw unit mostly occurs in the fractures. The transport occurs in both matrix and fractures
with longer contact times between the tracers and the media leading to the increase of
sorption and retardation when tracers travel to the vitric layers in CHn unit. However, for
those zeolitic layers in CHn unit, fast transport dominated by fractures occurs due to the
high disparity in permeability between matrix and fractures in those layers. When tracers
move through the devitrified layers in CHn unit, the transport has similar behaviors to the
vitric layers. More descriptions of the conceptual model of tracer transport are referred to
BSC (2004b).
For the steady-state flow model, the ground surface and the water table are treated
as the top and bottom model boundaries, where the pressure and saturation are specified
as boundary conditions. The no-flux boundary condition is specified for the lateral
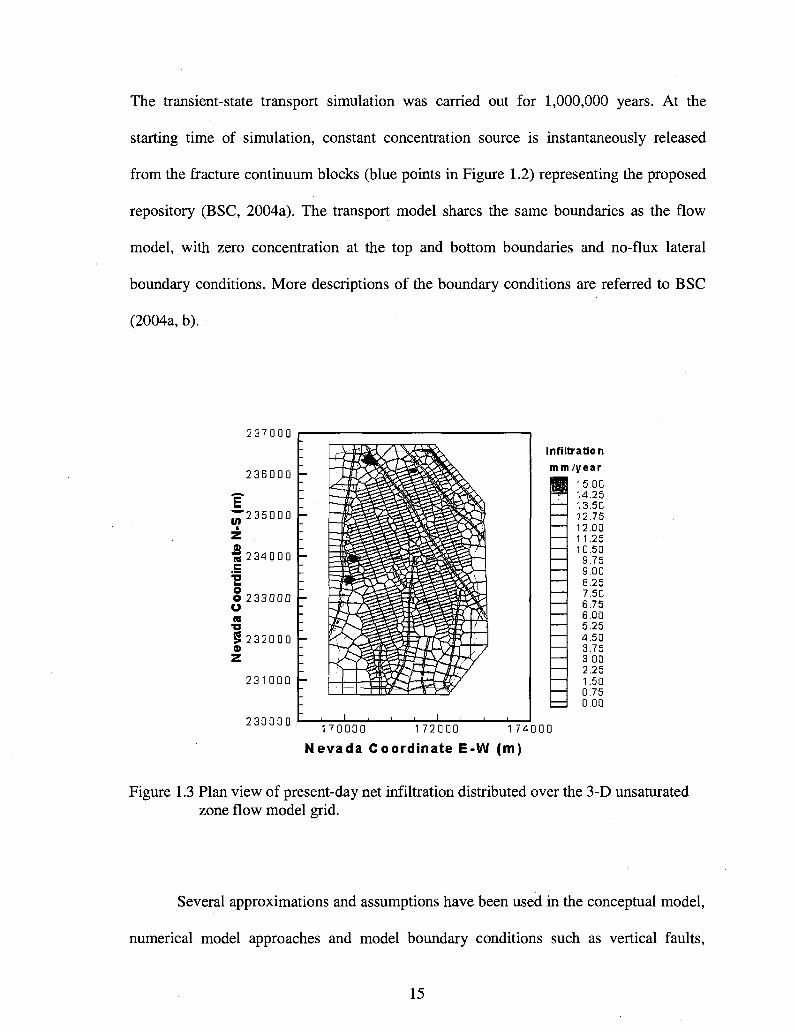
boundaries. A present-day net infiltration estimate (Figure 1.3) is applied to the fracture
blocks within the second grid layer from the top of the domain, as the first layer is treated
as a Dirichlet boundary to represent average atmospheric conditions on the land surface.
14
The transient-state transport simulation was carried out for 1,000,000 years. At the
starting time of simulation, constant concentration source is instantaneously released
from the fracture continuum blocks (blue points in Figure 1.2) representing the proposed
repository (BSC, 2004a). The transport model shares the same boundaries as the flow
model, with zero concentration at the top and bottom boundaries and no-flux lateral
boundary conditions. More descriptions of the boundary conditions are referred to BSC
(2004a, b).
2 3 7 0 0 0
2 3 6 0 0 0 -
Hi
& c 1 o o o «
g 0
2 3 5 0 0 0 -
234000 -
2 3 3 0 0 0 -
232000 -
2 3 1 0 0 0 -
230000
Inf i l t rat ion
mm /year
15.00 14.25 13.50 12.75 12.00 11.25 10.50 9.75 9.00 8.25 7.50 6.75 6.00 5.25 4.50 3.75 3.00 2.25 1.50 0.75 0.00
170000 1 7 2 0 0 0 1 7 4 0 0 0
Nevada Coordinate E-W (m)
Figure 1.3 Plan view of present-day net infiltration distributed over the 3-D unsaturated zone flow model grid.
Several approximations and assumptions have been used in the conceptual model,
numerical model approaches and model boundary conditions such as vertical faults,
15
quasi-steady-state flow approximations, and no flow at lateral boundaries (BSC, 2004a).
Although these assumptions may limit the applications in estimating the gradients of
pressures, and concentrations, the present conceptual and numerical models can better
understand the flow and contaminant transport processes in the UZ of YM than previous
models (BSC, 2004a; Flint et al., 2001). The details of assumptions for conceptual and
numerical models are referred to BSC (2004a) and Flint et al. (2001).
1.3.3 Numerical Model
A 3-D site-scale numerical model (TOUGH2 code) has been developed to
simulate the flow and transport of three mass components (air, water, and tracer) in the
UZ of YM (BSC, 2004a; Pruess et al., 1999; Wu et al., 1996). The site-scale numerical
model can integrate the hydrologic processes in multiple temporal and spatial scales and
provide consistent simulations with the available measurements and observations in the
UZ of YM (BSC, 2004a; Flint et al., 2001). Since the dual-continuum approach,
primarily the dual-permeability concept, is used, a doublet of governing equations of flow
and transport are used to simulate fluid flow, chemical transport, and heat transfer
processes in the two-phase (air and water) system of fractured rock for fracture and
matrix, respectively. The governing equations for either continuum are in the same form
as those for a single porous medium. The details of the governing equations of the
unsaturated flow and tracer transport are described in Appendix A. The integral finite-
difference method is used to solve the governing equations numerically. The 3-D
numerical model grid representing the UZ system consists of 980 mesh columns of both
fracture and matrix continua along a horizon grid layer, and each column includes an
average of 45 model layers representing the hydrogeologic layers. Refined mesh is used
16
near the proposed repository and natural faults. More details of the numerical model can
be found at Wu et al. (1999, 2002, 2004, 2007) and BSC (2004 a, b).
Because of the dual-continuum approach, two sets of hydraulic and transport
properties and other intrinsic properties are needed for the fractured and matrix continua.
The basic parameters used for each model layer include (a) fracture properties
(frequency, spacing, porosity, permeability, van Genuchten a and n parameters, residual
saturation, and fracture-matrix interface area); (b) matrix properties (porosity,
permeability, van Genuchten a and n parameters, and residual saturation); (c) transport
properties (grain density, diffusion, adsorption, and tortuosity coefficients); and (d) fault
properties (porosity, matrix and fracture permeability, and active fracture-matrix interface
area).
1.4 References
Ahlers, C.F., S. Finsterle, and G.S. Bodvarsson. 1999. Characterization and prediction of
subsurface pneumatic response at Yucca Mountain, Nevada. J. Contam. Hydrol.
38(l-3):47-68.
Arnold, B.W., T. Hadgu, and C.J. Sallaberry. 2008. Sensitivity analyses of radionuclide
transport in the saturated zone at Yucca Mountain, Nevada. Proceedings of 2008
International High-Level Radioactive Waste Management Conference
(IHLRWM), September 7 - 11, Las Vegas, Nevada, 64 - 72.
Avanidou, T., and E.K. Paleologos. 2002. Infiltration in stratified, heterogeneous soils:
relative importance of parameters and model variations. Water Resour. Res.
38(11): 1232, doi: 10.1029/2001WR000725.
17

Bardurraga, T.M., and G.S. Bardvarsson. 1999. Calibrating hydrogeologic properties for
the 3-D site-scale unsaturated zone model at Yucca Mountain, Nevada. J.
Contam. Hydrol. 38(l-3):5-46.
Berger, J.O. 1985. Statistical decision theory and Bayesian analysis (2nd edition).
Springer-Verlag, New York, USA.
Boateng, S., and J.D. Cawlfield. 1999. Two-dimensional sensitivity analysis of
contaminant transport in the unsaturated zone. Ground Water. 37(2): 185-193.
Boateng, D. 2007. Probabilistic unsaturated flow along the textural interface in three
capillary barrier models. J. Environ. Eng. DOI: 10.1061/(ASCE)0733-9372(2007)
133:11(1024).
Bodvarsson, G.S., H.H. Liu, R. Ahlers et al. 2001. Parameterization and upscaling in
modeling flow and transport at Yucca Mountain. Conceptual models of flow and
transport in the fractured vadose zone. National Research Council, National
Academy Press, Washington, DC, USA.
BSC (Bechtel SAIC Company). 2003a. Total system performance assessment—License
application methods and approach. TDR-WIS-PA-000006 REV 00 ICN 01.
Bechtel SAIC Company, Las Vegas, Nevada, USA.
BSC (Bechtel SAIC Company). 2003b. Analysis of hydrologic properties data. Report
MDL-NBS-HS-000014 REV00. Lawrence Berkeley National Laboratory,
Berkeley, California and CRWMS M&O, Las Vegas, Nevada, USA.
BSC (Bechtel SAIC Company). 2004a. UZ flow models and submodels. Report MDL-
NBS-HS-000006 REV02. Lawrence Berkeley National Laboratory, Berkeley,
California and CRWMS M&O, Las Vegas, Nevada, USA.
18

BSC (Bechtel SAIC Company). 2004b. Radionuclide transport models under ambient
conditions. Report MDL-NBS-HS-000008 REV02. Lawrence Berkeley National
Laboratory, Berkeley, California and CRWMS M&O, Las Vegas, Nevada, USA.
Chen, M., D. Zhang, A.A. Keller, and Z. Lu. 2005. A stochastic analysis of steady state
two-phase flow in heterogeneous media. Water Resour. Res. 41:W01006,
doi: 10.1029/2004WR003412.
Christiaens, K., and J. Feyen. 2001. Analysis of uncertainties associated with different
methods to determine soil hydraulic properties and their propagation in the
distributed hydrological MIKE SHE model. J. Hydrol. 246:63-81.
Dagan, G. 1989. Flow and transport in porous formations. Springer-Verlag, Berlin,
Germany.
Dagan, G., and S.P. Neuman. 1997. Subsurface flow and transport: A stochastic
approach. Cambridge University Press, International Hydrology Series Cup,
Cambridge, UK.
Dietrich, C.R., and M.R. Osborne. 1991. Estimation of the covariance parameters in
kriging via the restricted maximum likelihood. Math. Geol. 23(1):119-135.
Domenico, P.A., and F.W. Schwartz. 1990. Physical and chemical hydrogeology. John
Wiley & Sons, New York, USA.
Fetter, C.W. 1994. Applied hydrogeology (2nd edition). Macmillan Publishing Company,
New York, USA.
Flint, L.E. 1998. Characterization of hydrogeologic units using matrix properties, Yucca
Mountain, Nevada. Water Resour. Invest. Rep. 97-4243. US Geological Survey,
Denver, Colorado, USA.
19
Flint, A.L., L.E. Flint, G.S. Bodvarsson, E.M. Kwicklis, and J. Fabryka-Martin. 2001
Evolution of the conceptual model of unsaturated zone hydrology at Yucca
Mountain, Nevada. J. Hydrol. 247:1-30.
Flint, L.E. 2003. Physical and hydraulic properties of volcanic rocks from Yucca
Mountain, Nevada. Water Resour. Res. 39(5): 1-13.
Flint, L.E., D.C. Buesch, and A.L. Flint. 2006. Characterization of unsaturated zone
hydrogeologic units using matrix properties and depositional history in a complex
volcanic environment. Vadose Zone J. 5:480-492.
Gelhar, L.W. 1989. Stochastic subsurface hydrology. Prentice Hall, Englewood Cliffs,
New Jersey, USA.
Haukwa, C.B., Y.W. Tsang, Y.S. Wu, and G.S. Bodvarsson. 2003. Effect of
heterogeneity in fracture permeability on the potential for liquid seepage into a
heated emplacement drift of the potential repository. J. Contam. Hydrol. 62-
63:509-527.
Hillel, .D. 1998. Environmental soil physics. Academic Press, San Diego, California,
USA.
Hollenbeck, K.J., and K.H. Jensen. 1998. Maximum-likelihood estimation of unsaturated
hydraulic parameters. J. Hydrol. 210:192-205.
Holt, R.M., J.L. Wilson, and R.J. Glass. 2002. Spatial bias in field-estimated unsaturated
hydraulic properties. Water Resour. Res. 38(12):1311, doi: 10.1029/2002WR0013
36.
20

Holt, R.M., J.L. Wilson, and R.J. Glass. 2003. Error in unsaturated stochastic models
parameterized with field data. Water Resour. Res. 39(2): 1028, doi: 10.1029/2001
WR00544.
Illman, W.A., and D.L. Hughson. 2005. Stochastic simulations of steady state unsaturated
flow in a three-layer, heterogeneous, dual continuum model of fractured rock. J.
Hydrol. 307:17-37.
Kitanidis, P.K., and R.W. Lane. 1985. Maximum likelihood parameter estimation of
hydrologic spatial processes by the Gauss-Newton method. J. Hydrol. 79:53-71.
Li, B., and T.-C.J. Yeh. 1999. Cokriging estimation of the conductivity field under
variably saturated flow conditions.Water Resour. Res. 35(12):3663-3674.
Lu, Z., and D. Zhang. 2004. Analytical solutions to steady state unsaturated flow in
layered, randomly heterogeneous soild via Kirchhoff transformation. Adv. Water
Resour. 27:775-784.
Ji, S.H., Y.J. Park, E.A. Sudicky, and J.F. Sykes. 2008. A generalized transformation
approach for simulating steady-state variably-saturated subsurface flow. Adv.
Water Resour. 31(2):313-323.
Mertens, J., H. Madsen, M. Kristensen, D. Jacques, and J. Feyen. 2005. Sensitivity of soil
parameters in unsaturated zone modeling and the relation between effective,
laboratory and in situ estimates. Hydrol. Process. 19:1611-1633.
Meyer, P.D., M.L. Rockhold, and G.W. Gee. 1997. Uncertainty analysis of infiltration
and subsurface flow and transport for SDMP sites. NUREG/CR-6565, PNNL-
11705. U.S. Nuclear Regulatory Commission, Office of Nuclear Regulatory
Research, Washington, DC, USA.
21
Montazer, P., and W.E. Wilson. 1984. Conceptual hydrologic model of flow in the
unsaturated zone, Yucca Mountain, Nevada. Water Resour. Invest. Rep. 84-4345.
US Geological Survey, Lakewood, Colorado, USA.
Neuman, S.P. 2003. Maximum likelihood Bayesian averaging of alternative conceptual-
mathematical models. Stoch. Environ. Res. Risk Assess. 17(5):291-305.
Nichols, W.E., and M.D. Freshley. 1993. Uncertainty analyses of unsaturated zone travel
time at Yucca Mountain. Ground Water. 31(2):293-301.
Pan, F. 2005. Uncertainty analysis of radionuclide transport in the unsaturated zone at
Yucca Mountain. Master thesis. University of Nevada Las Vegas, Nevada, USA.
Pan, F., M. Ye, J. Zhu, Y.S. Wu, B.X. Hu, and Z. Yu. 2009a. Incorporating layer-and
local-scale heterogeneities in numerical simulation of unsaturated flow and tracer
transport. J. Contam. Hydrol. 103:194-205, doi:10.1016/j.jconhyd.2008.10.012.
Pan, F., M. Ye, J. Zhu, Y.S. Wu, B.X. Hu, and Z.Yu. 2009b. Numerical evaluation of
uncertainty in water retention parameters and effect on predictive uncertainty.
Vadose Zone J. in press.
Pardo-Iguzquiza, E. 1998. Maximum likelihood estimation of spatial co variance
parameters. Math. Geol. 30(1):95-108.
Pardo-Iguzquiza, E. 1999. Bayesian inference of spatial covariance parameters. Math.
Geol. 31(l):47-65.
Pruess, K., C. Oldenburg, and G. Moridis. 1999. TOUGH2 user's guide, version 2.0.
LBL-43134. Lawrence Berkeley Laboratory, Berkeley, California, USA.
Rubin, Y. 2003. Applied stochastic hydrogeology. Oxford University Press, New York,
USA.
22
Sallaberry, C.J., A. Aragon, A. Bier, Y. Chen, J.W. Groves, C.W. Hansen, J.C. Helton, S.
Mehta, S.P. Miller, J. Min, and P. Vo. 2008. Yucca Mountain 2008 Performance
Assessment: uncertainty and sensitivity analysis for physical processes.
Proceedings of 2008 International High-Level Radioactive Waste Management
Conference (IHLRWM), September 7 - 11, Las Vegas, Nevada, 559-566.
Samper, S.J., and S.P. Neuman. 1989a. Estimation of spatial covariance structures by
adjoint state maximum likelihood cross validation 1. Theory. Water Resour. Res.
25(3):351-362.
Samper, S.J., and S.P. Neuman. 1989b. Estimation of spatial covariance structures by
adjoint state maximum likelihood cross validation 2. Synthetic experiments.
Water Resour. Res. 25(3):363-371.
Samper, S.J., and S.P. Neuman. 1989c. Estimation of spatial covariance structures by
adjoint state maximum likelihood cross validation 3. Application to
hydrochemical and isotopic data. Water Resour. Res. 25(3):373-384.
Schaap, M.G., and F.J. Leij. 1998. Using neural networks to predict soil water retention
and soil hydraulic conductivity. Soil Tillage Res. 47:37-42.
Sisson, J.B., and A.H. Lu. 1984. Field calibration of computer models for application to
buried liquid discharges: A status report. RHO-ST-46P. Rockwell Hanford
Operations, Richland, Washington, USA.
van Genuchten, M.Th. 1980. A closed-form equation for predicting the hydraulic
conductivity of unsaturated soils. Soil Sci. Soc. Am. J. 44 (5):892-898.
23

van Genuchten, M.Th., F.J. Leij, and S.R. Yates. 1991. The RETC code for quantifying
the hydraulic functions of unsaturated soils. EPA/600/2-91-065. EPA, Office of
Research and Development. Washington, DC, USA
Viswanathan, H.S., B.A. Robinson, A.J. Valocchi, and I.R. Triay. 1998. A reactive
transport model of neptunium migration from the potential repository at Yucca
Mountain. J. Hydrol. 209:251-280.
Viswanathan, H.S., B.A. Robinson, C.W. Gable, and W.C. Carey. 2003. A geostatistical
modeling study of the effect of heterogeneity on radionuclide transport in the
unsaturated zone, Yucca Mountain. J. Contam. Hydrol. 62-63:319-336.
Vrugt, J.A., G. Schoups, J.W. Hopmans, C. Young, W.W. Wallender, T. Harter, and W.
Bouten. 2004. Inverse modeling of large-scale spatially distributed vadose zone
properties using global optimization. Water Resour. Res. 40:W06503.
doi: 10.1029/2003WR002706.
Wu, Y.S., C.F. Ahlers, P. Fraser, A. Simmons, and K. Pruess. 1996. Software
qualification of selected TOUGH2 modules. LBNL-39490. Lawrence Berkeley
Laboratory, Berkeley, California, USA.
Wu, Y.S., C. Haukwa, and G.S. Bodvarsson. 1999. A site-scale model for fluid and heat
flow in the unsaturated zone of Yucca Mountain, Nevada. J. Contam. Hydrol.
38:185-215.
Wu, Y.S., L. Pan, W. Zhang, and G.S. Bodvarsson. 2002. Characterization of flow and
transport processes within the unsaturated zone of Yucca Mountain, Nevada,
under current and future climates. J. Contam. Hydrol. 54:215-247.
24

Wu, Y.S., G. Lu, K. Zhang, and G.S. Bodvarsson. 2004. A mountain-scale model for
characterizing unsaturated flow and transport in fractured tuffs of Yucca
Mountain. Vadose Zone J. 3:796-805.
Wu, Y.S., G. Lu, K. Zhang, L. Pan, and G.S. Bodvarsson. 2007. Analyzing unsaturated
flow patterns in fractured rock using an integrated modeling approach. Hydrogeol.
J. 15:553-572.
Ye, M., S.P. Neuman, A. Guadagnini, and D.M. Tartakovsky. 2004a. Nonlocal and
localized analyses of conditional mean transient flow in bounded, randomly
heterogeneous porous media. Water Resour. Res. 40:W05104, doi: 10.1029/2003
WR002099.
Ye, M., S.P. Neuman, and P.D. Meyer. 2004b. Maximum Likelihood Bayesian averaging
of spatial variability models in unsaturated fractured tuff. Water Resour. Res.
40:W05113,doi:10.1029/2003WR002557.
Ye, M., R. Khaleel, M.G. Schaap, and J. Zhu. 2007a. Simulation of field injection
experiments in heterogeneous unsaturated media using cokriging and artificial
neural network. Water Resour. Res. 43:W07413, doi:10.1029/2006WR005030.
Ye, M., F. Pan, Y.S. Wu, B.X. Hu, C. Shirley, and Z. Yu. 2007b. Assessment of
radionuclide transport uncertainty in the unsaturated zone of Yucca Mountain.
Adv. Water Resour. 30:118-134.
Zhang, D. 2002. Stochastic methods for flow in porous media: coping with uncertainties.
Academic Press, San Diego, California, USA.
25

Zhang, K., Y.S. Wu, and J.E. Houseworth. 2006. Sensitivity analysis of hydrological
parameters in modeling flow and transport in the unsaturated zone of Yucca
Mountain. Hydrogeol. J. 14:1599-1619.
Zhou, Q., H.H. Liu, G.S. Bodvarsson, and CM. Oldenburg. 2003. Flow and transport in
unsaturated fractured rock: effects of multiscale heterogeneity of hydrogeologic
properties. J. Contam. Hydrol. 60:1-30.
26

CHAPTER 2
LAYER-SCALE UNCERTAINTY CHARACTERIZATION OF WATER RETENTION
PARAMETERS AND PREDICTIVE UNCERTAINTY ASSESSMENT OF FLOW
AND CONTAMINANT TRANSPORT IN UNSATURATED ZONE
This chapter characterizes the layer-scale uncertainties in the hydraulic
parameters and evaluates the predictive uncertainties in flow and contaminant transport in
UZ. The hydraulic and transport parameters (i.e., permeability, porosity, water retention
parameters, and sorption coefficient of the reactive tracer in this study) are treated as
homogeneous random variables to evaluate the parameter uncertainties in the layer-scale
uncertainties. The PDFs of the parameters are required for the layer-scale uncertainty
characterizations and associated predictive uncertainty assessment in unsaturated flow
and contaminant transport. The PDFs of permeability, porosity, and sorption coefficient
of the reactive have been rigorously identified based on a large data set of core samples in
Pan (2005) and Ye et al. (2007b). This study aims to estimate the PDFs of water retention
parameters (i.e., van Genuchten a and n in this study) with only sparse measurements and
unknown prior PDFs based on a non-conventional ML method and evaluate the
predictive uncertainties in flow and contaminant transport in UZ due to uncertainties in
the water retention parameters.
27
2.1 Introduction
Numerical simulations of flow and contaminant transport in UZ require
relationships describing water retention characteristics. The van Genuchten (1980)
equation is one of the most widely used relationships,
SAh)=^^^ = (l + \ah\"r (2.1) ds Or
where Se is effective saturation, h is pressure head, 6 is volumetric water content, 8S and
6r are saturated and residual volumetric water contents, respectively, a and m (n=l-l/m)
are water retention parameters related to water entry pressure and soil pore size
distribution, respectively. The water retention parameters are usually estimated from
water retention data obtained from core samples, and how to more accurately estimate
these parameter values has been an active research field for many years (Chirico et al.,
2007; Christiaens and Feyen, 2001; Yates et al., 1992). Due to their spatial variability, the
water retention parameters are treated as random variables in stochastic subsurface
hydrology. PDFs of the parameters are required for evaluating uncertainty of the
parameters and its propagation through unsaturated flow and contaminant transport
models (Avanidou and Paleologos, 2002; Boateng, 2007; Chen et al., 2005; Christiaens
and Feyen, 2001; Lu and Zhang, 2004; Ye et al., 2008b; Zhou et al., 2003). The
parameter estimates and the PDFs can be obtained in two ways: direct methods of fitting
water retention data (e.g., B0rgesen and Schaap, 2005; Chirico et al., 2007; Christiaens
and Feyen, 2000, 2001; Hollenbeck and Jensen, 1998; Meyer et al., 1997; Schaap and
Leij, 1998; Vrugt and Bouten, 2002; Ye et al., 2007a) and indirect methods of calibrating
the Richards' equation (Abbaspour et al., 2004; Hughson and Yeh, 2000; Minasny and
Field, 2005; Wang et al., 2003; Yeh and Zhang, 1996). This study presents a direct
28
method of estimating the PDFs for measuring uncertainties in the water retention
parameters and for evaluating effects of the uncertain parameters on predictive
uncertainties in unsaturated flow and contaminant transport.
Many methods have been developed for estimating the water retention parameters
and the associated estimation uncertainties. Among them, LS method is the most widely
used due to its simplicity and flexibility. The LS method has been implemented in the
RETC (Retention Curve) software (van Genuchten et al., 1991; Yates et al., 1992), and
accuracy of the LS estimates is measured by a covariance matrix. The ML method
incorporates measurement errors in a rigorous manner and can evaluate adequacy of
model fit (Hollenbeck and Jensen, 1998). In addition, the ML method gives the Cramer-
Rao lower bound for describing the parameter estimation uncertainty. The pedotransfer
method (B0rgesen and Schaap, 2005; Chirico et al., 2007; Christiaens and Feyen, 2000,
2001; Schaap and Leij, 1998; Ye et al., 2007a) is another type of parameter estimation
method, and it uses the bootstrap method (Efron and Tibshirani, 1993) to measure
accuracy of the estimates (B0rgesen and Schaap, 2005; Schaap and Leij, 1998). These
methods do not explicitly yield the parameter PDFs and this renders these methods
insufficient for uncertainty assessments of unsaturated flow and contaminant transport.
While the Bayesian methods (e.g., Meyer et al., 1997; Minasny and Field, 2005; Vrugt
and Bouten, 2002) give the parameter PDFs, they require estimating the prior PDFs from
published datasets of the soil hydraulic parameters. Although estimating the prior PDFs
of hydraulic parameters is not difficult for soils, it may be difficult, if not impossible, for
other types of unsaturated media such as fractured rock in this study.
29
This study estimates the PDFs of the water retention parameters in a Bayesian
framework based on a non-conventional ML method introduced by Berger (1985, p223)
in statistical literature. In particular, the PDFs are estimated for a situation common in
field-scale modeling where core samples are sparse and prior PDFs of the parameters are
unknown. When core samples are sparse, conventional statistical methods (e.g., Carsel
and Parrish, 1988; Mallants et al., 1996; Russo and Bouton, 1992; Russo et al., 2008) of
estimating the PDFs based on a large database become inappropriate. When prior PDFs
are unknown, regular Bayesian methods cannot be applied. The non-conventional ML
approach used in this study resolves the problems of sparse core sample measurements
and unknown prior PDFs, since it shows in a Bayesian framework that the PDFs can be
approximated as multivariate Gaussian for unknown prior PDF regardless of the number
of measurements (Berger, 1985, p223). This is the major advantage of this approach over
conventional ML methods, which give only ML parameter estimates and estimation
uncertainty bounds, not the PDFs. Another feature of this approach is that it explicitly
considers correlation between the water retention parameters through the multivariate
Gaussian PDF, instead of ignoring the correlation (e.g., Zhou et al., 2003) or assuming a
perfect correlation (e.g., Avanidou and Paleologos, 2002). The ML approach gives only
mathematical expression of the multivariate Gaussian PDF, but not the way of estimating
its mean and covariance. This study shows that the mean of the multivariate normal
distribution is the same as the LS parameter estimates and that the covariance can be
estimated using the sensitivity matrix. This provides a practical way of using the non-
conventional ML approach, since the LS parameter estimates and the sensitivity matrix
can be easily obtained.
30

Although the non-conventional ML approach was introduced decades ago, it has
not received attention from vadose zone hydrologists for estimating the PDFs of the
water retention parameters. The UZ of YM, the proposed geologic repository for spent
nuclear fuel or high-level radioactive waste (BSC, 2003a), is selected as a cause study.
The site provides a good setting for illustrating and testing the ML approach. In each
hydrogeologic layer of the UZ, there are only several available measurements of the
water retention parameters, insufficient for estimating the PDFs using conventional
statistical methods. On the other hand, regular Bayesian methods cannot be applied
because the prior parameter PDFs are unknown for the fractured porous medium. Due to
these obstacles, uncertainties in the water retention parameters has not been fully
assessed, despite its importance to the unsaturated flow and tracer transport uncertainties
as shown in previous studies (e.g., Paleologos et al., 2006; Zhang et al., 2006).
Necessity of assessing uncertainties in the water retention parameters at the site is
illustrated in Figure 2.1. The solid line represents the van Genuchten model fitted using
the LS method from water retention data (symbols) of three core samples in the
hydrogeologic layer TMN (details of the parameter fitting are referred to BSC, 2003b).
Uncertainties in the parameter estimates are quantified by the 95% confidence intervals
of the parameters, and the corresponding van Genuchten models are plotted in the dashed
lines of Figure 2.1. However, when the PDFs of the parameters are unknown, using the
95% confidence intervals for quantifying the uncertainties is empirical. Knowing the
parameter PDFs would better quantify the parameter uncertainties. It is also expected that
incorporating the parameter uncertainties into numerical modeling will better simulate the
variability of the simulated state variables (e.g., saturation and concentration). However,
31
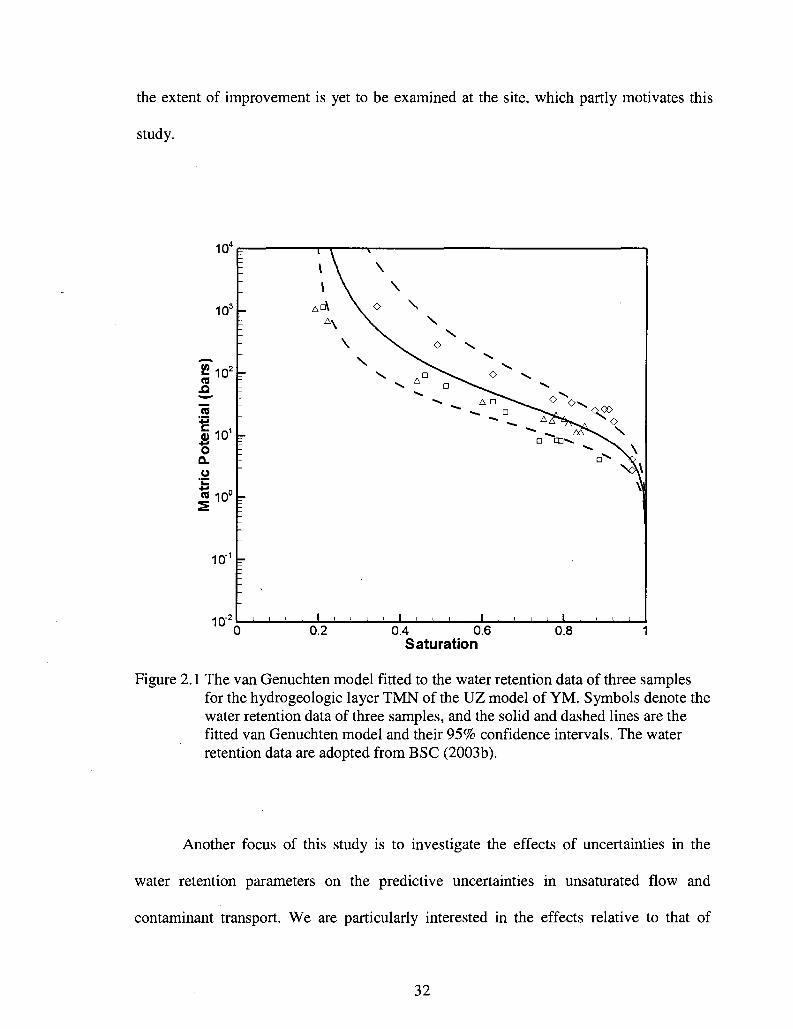
the extent of improvement is yet to be examined at the site, which partly motivates this
study.
10"
10'
£1°2
CO
n !s l i o 1
•5 Q. O
« 10°
10"1
10"' _L _L 0.2 0.4 0.6
Saturation 0.8
Figure 2.1 The van Genuchten model fitted to the water retention data of three samples for the hydrogeologic layer TMN of the UZ model of YM. Symbols denote the water retention data of three samples, and the solid and dashed lines are the fitted van Genuchten model and their 95% confidence intervals. The water retention data are adopted from BSC (2003b).
Another focus of this study is to investigate the effects of uncertainties in the
water retention parameters on the predictive uncertainties in unsaturated flow and
contaminant transport. We are particularly interested in the effects relative to that of
32

permeability and porosity, since understanding the relative effects is important for
directing future efforts of data collection for uncertainty reduction. The relative effects
have not been examined in previous uncertainty analyses (e.g., Avanidou and Paleologos,
2002; Haukwa et al., 2003; Illman and Hughson, 2005; Nichols and Freshley, 1993;
Oliveira et al., 2006; Paleologos et al., 2006; Ye et al., 2007b; Zhou et al., 2003). This
study investigates the relative effects by incorporating the uncertainties in the water
retention parameters into the numerical modeling of Ye et al. (2007b). Since Ye et al.
(2007b) already assessed the predictive uncertainties due to the uncertainties in the
permeability and porosity, the relative effects will be revealed by comparing the
predictive uncertainties of this study with that of Ye et al. (2007b).
2.2 ML Method of Estimating the PDFs
This study determines the PDFs of the water retention parameters based on the
ML theory of Berger (1985, p224): "Suppose that X\, Xi, ...,XN are i.i.d. from the density
/o(*;|P)> P = (/?i> @2, • • -, PP)T being an unknown vector of parameters. (We will write x =
(x\,xi, ..., xN)Tand /(x | p) = J J f0(x( |P), as usual.) Suppose 7r(P) is a prior density, and
that 7r(P) and /(JC,|P) are positive and twice differential near p , the (assumed to exist)
maximum likelihood estimate (MLE) of p. Based on the Bayes' theorem, the posterior
density of p
p(P|x) = /(x|P)^r(P)/m(x) (2.2)
(m(x) being a normalizing factor), can be approximated by a multivariate normal
distribution, Np(p,[I(x)]_1), where I is the observed (or conditional) Fisher information
matrix, having (i, j) element
33
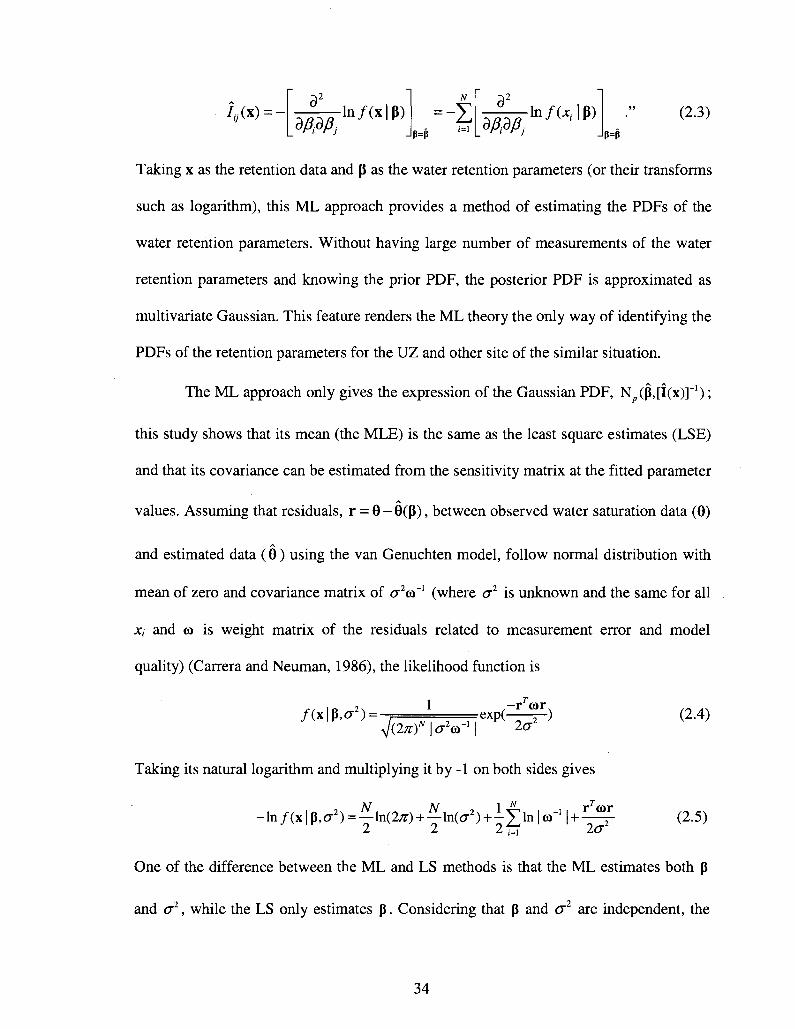
' , , ( * ) = -y
WPj ln/(x|P) - Z
;=i
32 m/(x,|p) d/Sfifij
(2.3)
Taking x as the retention data and p as the water retention parameters (or their transforms
such as logarithm), this ML approach provides a method of estimating the PDFs of the
water retention parameters. Without having large number of measurements of the water
retention parameters and knowing the prior PDF, the posterior PDF is approximated as
multivariate Gaussian. This feature renders the ML theory the only way of identifying the
PDFs of the retention parameters for the UZ and other site of the similar situation.
The ML approach only gives the expression of the Gaussian PDF, Np(p,[i(x)]"1);
this study shows that its mean (the MLE) is the same as the least square estimates (LSE)
and that its covariance can be estimated from the sensitivity matrix at the fitted parameter
values. Assuming that residuals, r = 6 - 0(P), between observed water saturation data (8)
and estimated data (0) using the van Genuchten model, follow normal distribution with
mean of zero and covariance matrix of <72<o~' (where a1 is unknown and the same for all
xt and eo is weight matrix of the residuals related to measurement error and model
quality) (Carrera and Neuman, 1986), the likelihood function is
/(xlp,g2)= , 1 e x p ( ^ ^ ) (2.4) V W l ^ o T ' l 2<72
Taking its natural logarithm and multiplying it by -1 on both sides gives
-ln/(x|p,cr2) = ̂ ln(2^) + ̂ ln(c72) + iX l n l 0 >" , l + - ^ (2-5)
One of the difference between the ML and LS methods is that the ML estimates both p
and a2, while the LS only estimates p. Considering that p and <y2 are independent, the
34
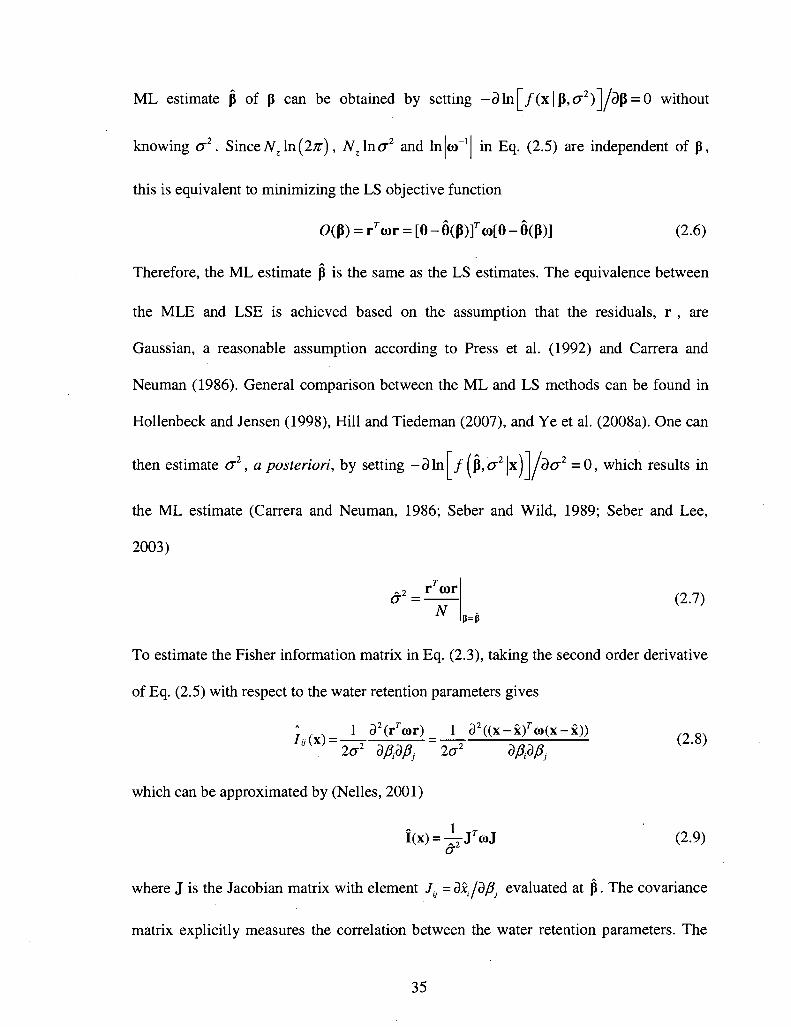
ML estimate P of p can be obtained by setting -3 ln[ / (x |p ,c r 2 ) ] /dp = 0 without
knowing <72. Since 7VZ In (2;r), iVzln<72 and In co"1 in Eq. (2.5) are independent of p,
this is equivalent to minimizing the LS objective function
0(p) = rrcor = [G - 8(p)f<o[6 - 8(p)] (2.6)
Therefore, the ML estimate p is the same as the LS estimates. The equivalence between
the MLE and LSE is achieved based on the assumption that the residuals, r , are
Gaussian, a reasonable assumption according to Press et al. (1992) and Carrera and
Neuman (1986). General comparison between the ML and LS methods can be found in
Hollenbeck and Jensen (1998), Hill and Tiedeman (2007), and Ye et al. (2008a). One can
then estimate a2, a posteriori, by setting -3In /(p,<72|x) /d<72 = 0 , which results in
the ML estimate (Carrera and Neuman, 1986; Seber and Wild, 1989; Seber and Lee,
2003)
.2 rTtor a =
TV
(2.7)
To estimate the Fisher information matrix in Eq. (2.3), taking the second order derivative
of Eq. (2.5) with respect to the water retention parameters gives
; 1 32(rrcor)_ 1 32((x-x) ro(x-x))
which can be approximated by (Nelles, 2001)
i(x) = ̂ -J ra>J (2.9) a
where J is the Jacobian matrix with element J~ = dx^dPj evaluated at p. The covariance
matrix explicitly measures the correlation between the water retention parameters. The
35
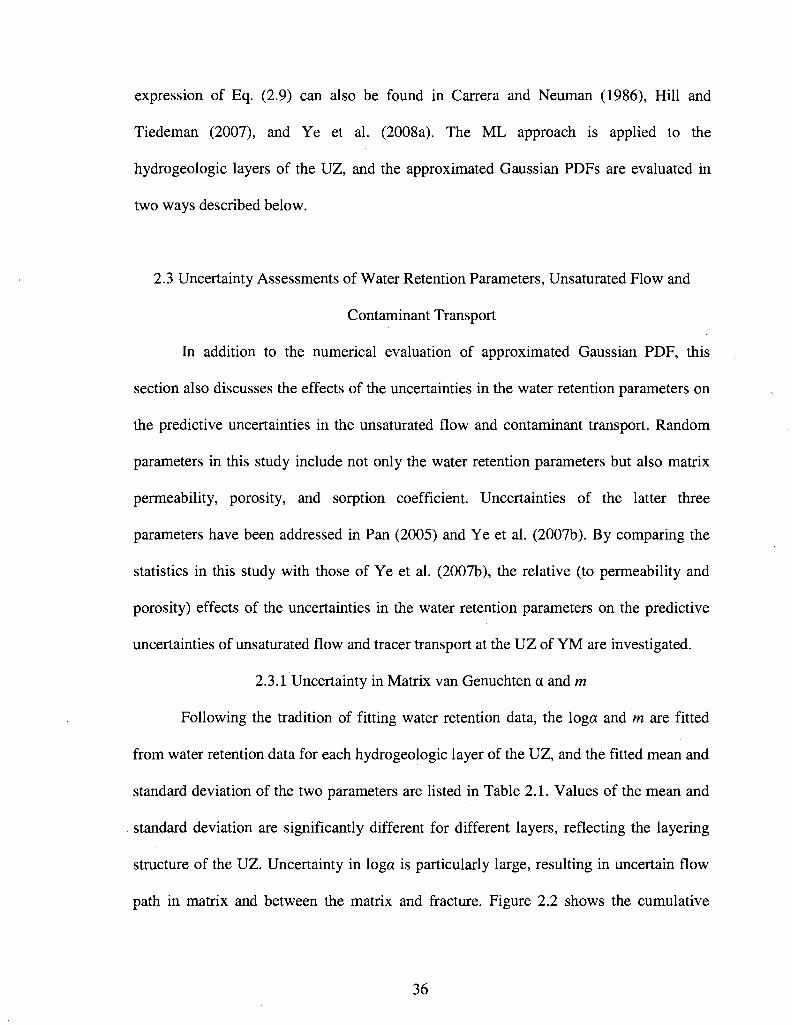
expression of Eq. (2.9) can also be found in Carrera and Neuman (1986), Hill and
Tiedeman (2007), and Ye et al. (2008a). The ML approach is applied to the
hydrogeologic layers of the UZ, and the approximated Gaussian PDFs are evaluated in
two ways described below.
2.3 Uncertainty Assessments of Water Retention Parameters, Unsaturated Flow and
Contaminant Transport
In addition to the numerical evaluation of approximated Gaussian PDF, this
section also discusses the effects of the uncertainties in the water retention parameters on
the predictive uncertainties in the unsaturated flow and contaminant transport. Random
parameters in this study include not only the water retention parameters but also matrix
permeability, porosity, and sorption coefficient. Uncertainties of the latter three
parameters have been addressed in Pan (2005) and Ye et al. (2007b). By comparing the
statistics in this study with those of Ye et al. (2007b), the relative (to permeability and
porosity) effects of the uncertainties in the water retention parameters on the predictive
uncertainties of unsaturated flow and tracer transport at the UZ of YM are investigated.
2.3.1 Uncertainty in Matrix van Genuchten a and m
Following the tradition of fitting water retention data, the loga and m are fitted
from water retention data for each hydrogeologic layer of the UZ, and the fitted mean and
standard deviation of the two parameters are listed in Table 2.1. Values of the mean and
standard deviation are significantly different for different layers, reflecting the layering
structure of the UZ. Uncertainty in loga is particularly large, resulting in uncertain flow
path in matrix and between the matrix and fracture. Figure 2.2 shows the cumulative
36

distribution functions (CDFs) of the two parameters together with the five parameters
fitted from core samples using the RETC software for the TLL layer. The CDF is
estimated based on 200 random numbers of the retention parameters generated using the
Latin Hypercube Sampling (LHS) method (McKay et al., 1979). It is well known that the
LHS is more efficient for sampling the parameter space than random sampling methods.
The parameter correlation is measured using the Spearman rank correlation coefficient,
which can measure nonlinear correlation and is thus superior to the commonly used
Pearson correlation coefficient (Helton and Davis, 2003; Iman and Conover, 1982). In
order to obtain the rank correlation from the covariance matrix, the statistic software
MINITAB (http://www.minitab.com/) is used to generate 2,000 realizations based on the
multivariate Gaussian PDF, and the Spearman rank correlation is estimated based on the
2,000 realizations. Figure 2.2 shows that the fitted parameter values are within the range
of their respective CDFs, indicating that the approximated Gaussian distribution is able to
describe the uncertainties in the water retention parameters.
2.3.2 Predictive Uncertainty in Unsaturated Flow
Figure 2.3 shows the mean and uncertainty bounds of the simulated matrix
saturation and corresponding observations at borehole SD-12 (its location is shown in
Figure 1.2). The uncertainty bounds are the 5th and 95th percentiles of the simulated state
variables (e.g., saturation and percolation fluxes) based on 200 Monte Carlo realizations.
Both the variance and uncertainty bounds are used to measure the predictive uncertainty.
Since the uncertainty bounds correspond to the 5th and 95th percentiles and directly
reveal variability of the simulated variables, they are considered more informative than
the variance. The mean predictions capture the observed variation trend reasonably well,
37

and the uncertainty bounds bracket a large portion of the observations. It suggests that the
approximated Gaussian PDFs of the water retention parameters result in reasonable
simulations of the observed state variables.
Table 2.1 The estimation of mean and standard deviation of van Genuchten a and m parameters.
Layer Name
CCR&CUC CUL&CW
CMW CNW BT4 TPY BT3 TPP BT2 TC TR
TUL TMN TLL
TM2&TM1 PV3 PV2a PV2v BTla BTlv CHV CHZ BTa BTv PP4 PP3 PP2 PP1 BF3 BF2
Core sample number
3 10 6 8 8 2 3 3 11 4 5 4 3 5 3 5 1 1 3 3 5 4 1 1 3 5 3 3 2 1
/Aog(«)
0.004 -0.509 -0.488 1.207 1.164 0.391 1.897 1.015 1.992 0.939 0.055 -0.210 -0.074 0.032 -0.081 -0.206 -0.337 0.686 -1.678 0.940 1.413
-0.648 -1.807 0.196 -1.349 -0.055 -0.622 -1.036 0.098 -1.921
°iog(a)
0.244 0.199 0.192 0.269 0.169 0.728 0.375 0.189 0.335 0.544 0.118 0.114 0.776 0.447 0.934 0.446 0.156 0.043 0.183 0.050 0.092 0.094 0.043 0.253 0.513 0.094 0.168 0.442 0.940 0.032
Mm 0.388 0.280 0.259 0.245 0.219 0.247 0.182 0.300 0.126 0.218 0.290 0.283 0.317 0.216 0.442 0.286 0.059 0.293 0.349 0.240 0.158 0.257 0.499 0.147 0.474 0.407 0.309 0.272 0.193 0.617
°m 0.081 0.046 0.044 0.038 0.019 0.104 0.028 0.039 0.017 0.068 0.025 0.025 0.122 0.058 0.173 0.092 0.007 0.011 0.073 0.008 0.008 0.022 0.036 0.025 0.200 0.033 0.044 0.116 0.077 0.070
38

o o
10"1 10° 101
van Genuchten a (1/bar)
Q O
0.05 0.10 0.15 0.20 0.25 0.30 0.35 0.40 van Genuchten m
Figure 2.2 CDFs of the matrix van Genuchten a and m in the layer of TLL. Fitted parameter values of five core samples in the layer are also plotted as solid triangles on the x-axis.
39

Figure 2.3 also includes the same statistics obtained in Ye et al. (2007b), in which
the uncertainties in the water retention parameters were not considered. The mean
predictions of the both cases (with and without considering uncertainties in the water
retention parameters) capture the observed variation trend reasonably well. In unit TSw
where the potential repository will be located,.75% of observations are covered by the
uncertainty bounds (solid lines) of this study, while the uncertainty bounds (dashed lines)
of Ye et al. (2007b) cover only 65% of observations. The reason is that the uncertainties
in the water retention parameters were not incorporated in Ye et al. (2007b).
The percolation flux through the UZ is a key variable in evaluating the potential
repository site because percolation flux and its spatial variations could affect the amount
of water flowing into the waste emplacement drifts, potential tracer release and migration
from the UZ to the groundwater table. Percolation flux is defined as the total vertical
liquid mass flux through both fractures and matrices (BSC, 2004a; Wu et al. 2004). For
better presentation, it is converted to millimeters per year using a constant water density.
Figures 2.4a and b show the mean and variance of the simulated percolation
fluxes at the water table, and Figures 2.4c and d are those of Ye et al. (2007b) in which
the water retention parameters were treated as deterministic. Comparison of the mean
values (Figures 2.4a and 2.4c) shows that the magnitude and spatial pattern are similar
over the entire domain, suggesting limited effects of the uncertainties in the water
retention parameters on the mean predictions. However, comparing Figures 2.4b and 2.4d
reveals that variance of the percolation flux increases significantly after the uncertainties
in water retention parameters is incorporated. On average over the simulation domain, the
40

variance increases by about 38%; the number of blocks at the water table with variance
. 2 / 2 -larger than 10 (mm /yr ) is almost doubled.
1300
1200
J . 1100 c ,o '"§ 1000 >
LU
900
800
700,
F SD-12
TCw i iEioz: :
• Field data • ., Mean ofYeetal. (2007b) * 5th percentile ofYeetal. (2007b)
-_ 95th percentile ofYeetal. (2007b) — — — Mean of this study
5th Percentile of this study 95th percentile of this study
— Hydro. Unit
- TSw
Vfc5; ;*^e*fi2e
0.4 0.5 0.6 Saturation
Figure 2.3 Comparison of the observed and simulated matrix liquid saturation with (solid line) and without (dash line) considering the water retention parameter uncertainty for borehole SD-12.
41
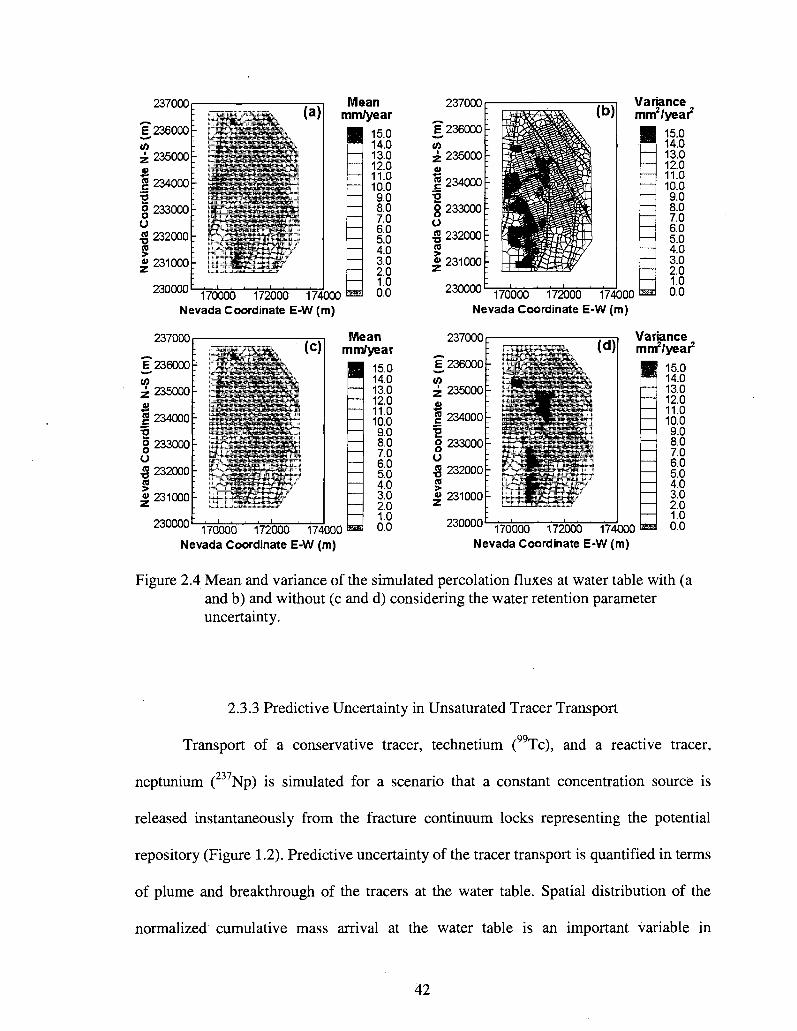
237000r
236000 \
235000;
234000;
233000 :
232000
231000 \
230000
. ' '•
1 1
; • r
(a) Mean
mm/year
170000 172000 174000 ™
15.0 14.0 13.0 12.0 11.0 10.0 9.0 8.0 7.0 6.0 5.0 4.0 3.0 2.0 1.0 0.0
t <n z •ffi c V o o 13 (0 > 4>
z
Nevada Coordinate E-W (m)
237000r
236000
235000
234000
233000
232000
231000
230000
. '' ••
;
WSBsSM
(c)
170000 172000 174000
Mean mm/year
15.0 14.0 13.0 12.0 11.0 10.0 9.0 8.0 7.0 6.0 5.0 4.0 3.0 2.0 1.0 0.0
Nevada Coordinate E-W (m)
237000
236000
235000
234000
233000
232000
231000
230000 170000 172000 174000
Variance mm2 /year2
15.0 14.0 13.0 12.0 11.0 10.0 9.0 8.0 7.0 6.0 5.0 4.0 3.0 2.0 1.0 0.0
Nevada Coordinate E-W (m)
237000 Variance mrrrVyeai2
170000 172000 174000 Nevada Coordinate E-W (m)
15.0 14.0 13.0 12.0 11.0 10.0 9.0 8.0 7.0 6.0 5.0 4.0 3.0 2.0 1.0 0.0
Figure 2.4 Mean and variance of the simulated percolation fluxes at water table with (a and b) and without (c and d) considering the water retention parameter uncertainty.
2.3.3 Predictive Uncertainty in Unsaturated Tracer Transport
Transport of a conservative tracer, technetium (99Tc), and a reactive tracer,
neptunium (237Np) is simulated for a scenario that a constant concentration source is
released instantaneously from the fracture continuum locks representing the potential
repository (Figure 1.2). Predictive uncertainty of the tracer transport is quantified in terms
of plume and breakthrough of the tracers at the water table. Spatial distribution of the
normalized cumulative mass arrival at the water table is an important variable in
42

investigating transport patterns and in estimating the potential locations of high tracer
concentrations. The normalized cumulative mass arrival, as defined in BSC (2004b), is
the cumulative mass arriving at each cell of the water table over time, normalized by the
total mass of the initially released tracer from the potential repository horizon. Figures
2.5a and b show the mean and variance of the normalized cumulative mass arrival
contours of 237Np at the water table after 1,000,000 years. The mean and variance are
large in the area directly below the footprint of the proposed repository. Spatial pattern of
the variance (Figure 2.5b) is similar to that of the flow variance contour shown in Figure
2.4b, indicative of correlation between the uncertainties in flow and tracer transport.
Figures 2.5c and d depict the same mean and variance of normalized cumulative mass
without considering the uncertainties in the water retention parameters (Pan, 2005; Ye et
al., 2007b). Comparing contours of the mean predictions in Figures 2.5a and 2.5c
suggests limited effects of the uncertainties in the water retention parameters on the mean
predictions of the tracer transport. However, the variance shown in Figure 2.5b is
significantly larger than that of Figure 2.5d, almost doubled on average over the whole
domain. In addition, the area with variance lager than 0.01 in Figure 2.5b also increases
by about 3% relative to that shown in Figure 2.5d.
43
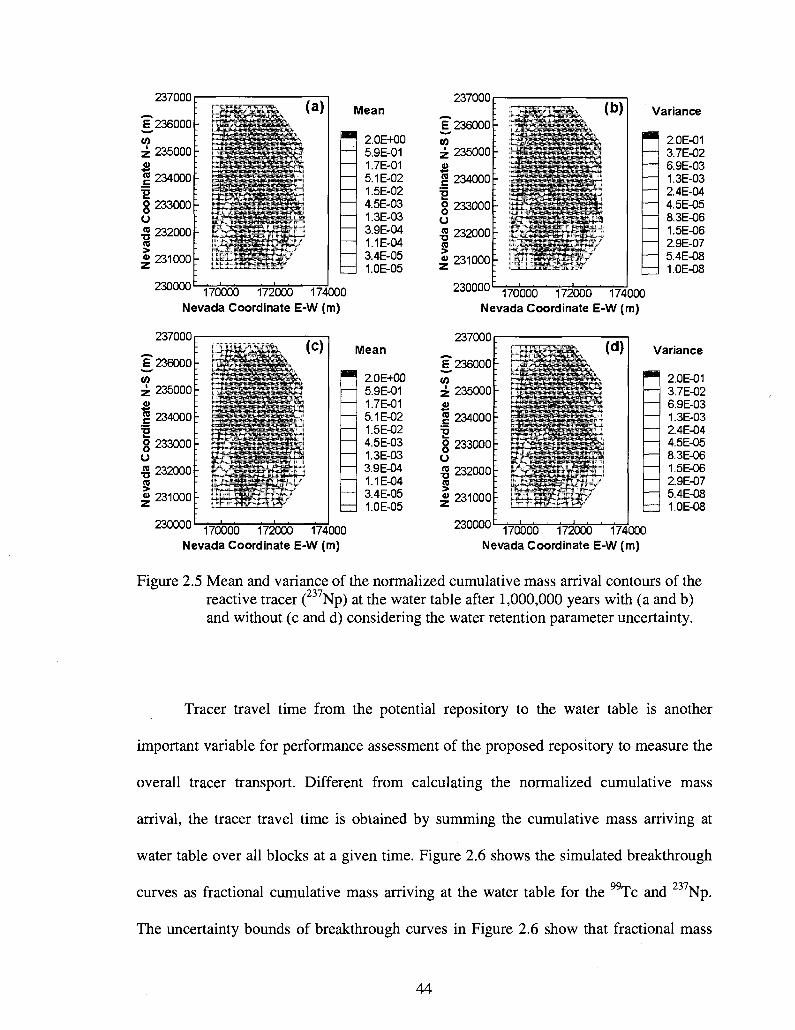
237000
£ 236000 tn z 235000 o | 234000
g 233000 O « 232000
| 231000
230000
Mean
2.0E+00 5.9E-01 1.7E-01 5.1E-02 1.5E-02 4.5E-03 1.3E-03 3.9E-04 1.1E-04 3.4E-05 1.0E-05
170000 172000 174000 Nevada Coordinate E-W (m)
237000
E 236000 Mean
2.0E+00 5.9E-01 1.7E-01 5.1E-02 1.5E-02 4.5E-03 1.3E-03 3.9E-04 1.1E-04 3.4E-05 1.0E-05
230000 170000 172000 174000 Nevada Coordinate E-W (m)
^O1UUU
£236000
z 235000 at
g 234000
g 233000 O « 232000 CO
| 231000
Tsnnnn
i ,
, i ,
. .
-•iopTfcasisl^F^awT'/
(b)
i i
Variance
2.0E-01 3.7E-02 6.9E-03 1.3E-03 2.4E-04 4.5E-05 8.3E-06 1.5E-06 2.9E-07 5.4E-08 1.0E-08
'"" 170000 172000 174000 Nevada Coordinate E-W (m)
237000
£236000
z 235000 o g 234000
g 233000
% 232000 ce | 231000
230000
Variance
2.0E-01 3.7E-02 6.9E-03 1.3E-03 2.4E-04 4.5E-05 8.3E-06 1.5E-06 2.9E-07 5.4E-08 1.0E-08
170000 172000 174000 Nevada Coordinate E-W (m)
Figure 2.5 Mean and variance of the normalized cumulative mass arrival contours of the reactive tracer ( Np) at the water table after 1,000,000 years with (a and b) and without (c and d) considering the water retention parameter uncertainty.
Tracer travel time from the potential repository to the water table is another
important variable for performance assessment of the proposed repository to measure the
overall tracer transport. Different from calculating the normalized cumulative mass
arrival, the tracer travel time is obtained by summing the cumulative mass arriving at
water table over all blocks at a given time. Figure 2.6 shows the simulated breakthrough
GO 9^7
curves as fractional cumulative mass arriving at the water table for the Tc and Np.
The uncertainty bounds of breakthrough curves in Figure 2.6 show that fractional mass
44
arrival is significantly uncertain. Figure 2.6 also includes the same statistics without
considering the uncertainties in the water retention parameters (Ye et al., 2007b). Due to
the large time scale used in Figure 2.6, Table 2.2 lists the 5th and 95th percentiles at the
10%, 25%, 50%, 75%, and 90% mass fractional breakthrough for both cases for better
evaluation of the travel time uncertainty. Similar to what has been observed from the
contours, the mean breakthrough is affected only slightly by considering the uncertain
water retention parameters, while the uncertainty bounds increases more significantly.
For example, with the random water retention parameters, the 5th and 95th percentiles of
simulated travel time of 9Tc are 8.05xl03 and 9.43xl02 years when 50% of the tracer
arrives at the water table. With the deterministic water retention parameters, the
corresponding travel times are 7.17xl03 and 8.22xl02 years. The uncertainty range
increases from 6,348 to 7,107 years if the uncertainties in water retention parameters are
considered. Similarly, for 50% of the reactive tracer ( Np) arriving at the water table,
the uncertainty range increases from 255,000 to 278,100 years.
2.4 Conclusions
This study addressed two problems in numerical simulations of unsaturated flow
and contaminant transport. The first is how to estimate the PDFs of the water retention
parameters when measurements of the parameters are sparse and the prior PDFs are
unknown; the other is whether the uncertainties in the water retention parameters is
important in the predictive uncertainties of unsaturated flow and contaminant transport.
The first problem was resolved using the non-conventional ML approach (Berger, 1985),
which approximates the PDFs as multivariate Gaussian without requiring the prior PDFs
45

and large number of parameter measurements. This study provided the method of
estimating the mean and covariance of PDFs based on the least-square fitting results,
which can be easily estimated from existing software such as RETC. For the case study
of YM UZ, water retention parameter ranges obtained from the Gaussian distributions
encompass the parameter values of individual samples, and are significantly larger than
the ranges of the measured parameter values. This indicates that uncertainties in the water
retention parameters should not be ignored.
The relative effects of the uncertainties in the water retention parameters on the
predictive uncertainties in flow and transport were evaluated using the Monte Carlo
method. After the random water retention parameters are considered, variability of the
observed matrix saturations is better represented in that 10% more observations are
bracketed by the uncertainty bounds. Predictive variance of the percolation flux increases
if the random water retention parameters are taken into account, while the uncertain water
retention parameters have limited effects on the mean prediction of percolation fluxes.
The similar conclusion is also true for the magnitude and spatial pattern of the simulated
plume of both conservative and reactive tracers. The travel time of the two types of
tracers also becomes more uncertain after incorporating the uncertain water retention
parameters, signified by the result that uncertainty bounds of the tracer travel time
increase by tens of thousands of years.
46
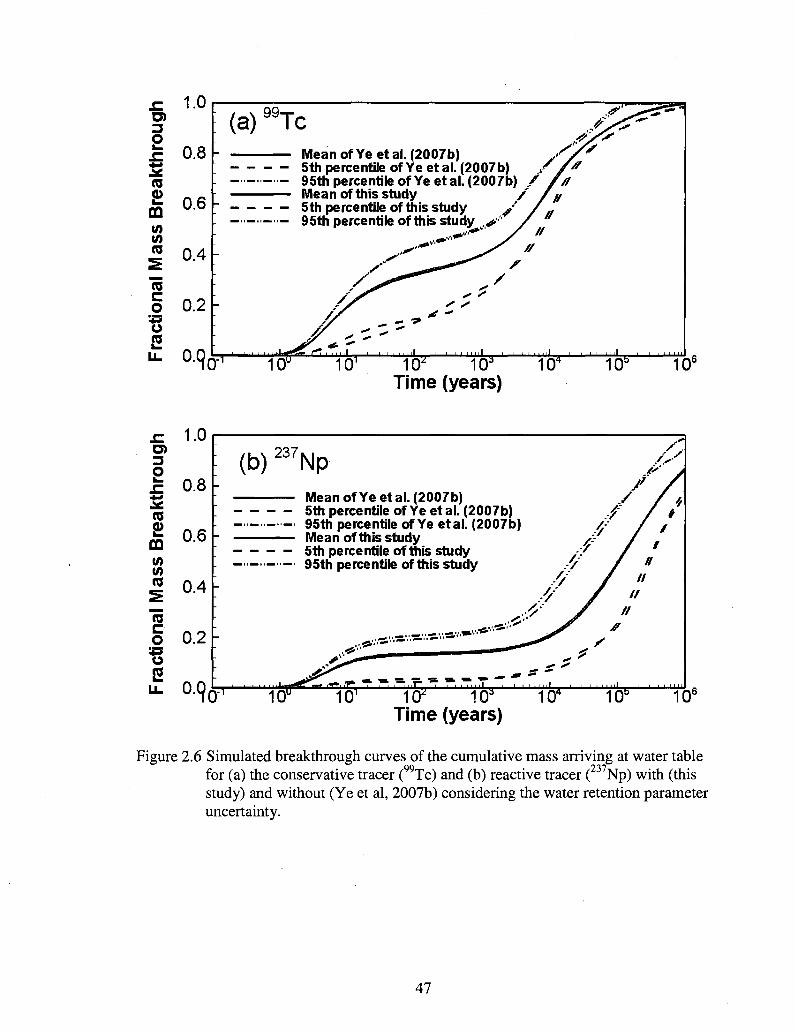
1.0
0.8
0.6
0.4 -
0.2 -
°4
(a) "Tc Mean of Ye et al. (2007b) -5th percentile of Ye et al. (2007b) / 95th percentile of Ye et al. (2007b) / Mean of this study / ' 5th percentile of this study / 95th percentile of this study .,«*'•" u
/ *f
/
// -* z. '
* -
10* j £ L
W i o 2 I F Time (years)
m i l •
I F 10s 10
1.0
0.8
0.6
0.4
0.2
(b) 237Np
Mean ofYeetal . (2007b) 5th percentile ofYeetal. (2007b) 95th percentile of Ye etal. (2007b) Mean of this study 5th percentile of this study 95th percentile of this study
°-9oL io2
I F Time (years)
104 10s 10
2.6 Simulated breakthrough curves of the cumulative mass arriving at water table for (a) the conservative tracer (99Tc) and (b) reactive tracer (237Np) with (this study) and without (Ye et al, 2007b) considering the water retention parameter uncertainty.
47
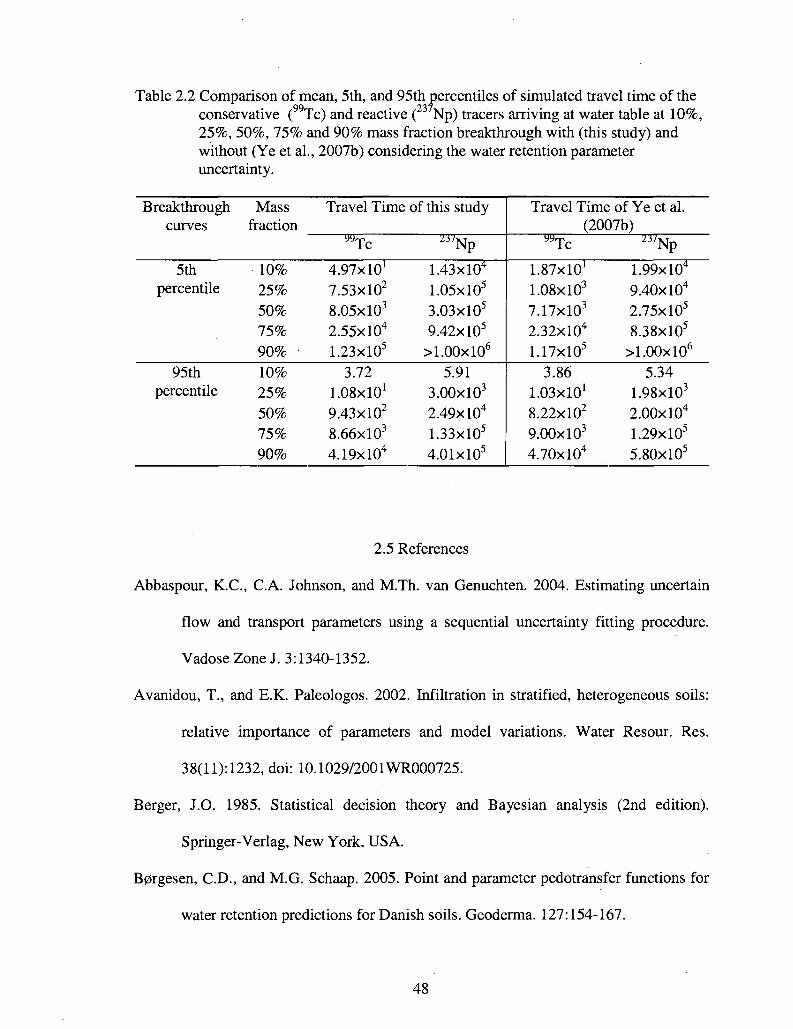
Table 2.2 Comparison of mean, 5th, and 95th percentiles of simulated travel time of the conservative (99Tc) and reactive (23 Np) tracers arriving at water table at 10%, 25%, 50%, 75% and 90% mass fraction breakthrough with (this study) and without (Ye et al., 2007b) considering the water retention parameter uncertainty.
Breakthrough Mass Travel Time of this study curves fraction
yyTc 2ilNp
5th 10% 4.97x10' 1.43xl04
percentile 25% 7.53xl02 1.05xl05
50% 8.05xl03 3.03xl05
75% 2.55X10⁴ 9.42xl05
90% 1.23x10s >1.00xl06
95th 10% 3.72 5.91 percentile 25% 1.08X101 3.00xl03
50% 9.43X10² 2.49xl04
75% 8.66xl03 1.33x10s
90% 4.19xl04 4.01x10s
Travel Time of Ye et al. (2007b)
yyTc *"Np
1.87x10' 1.99xl04
1.08xl03 9.40xl04
7.17xl03 2.75x10s
2.32xl04 8.38x10s
1.17x10s >1.00xl06
3.86 5.34 1.03X101 1.98xl03
8.22xl02 2.00xl04
9.00xl03 1.29x10s
4.70xl04 5.80x10s
2.5 References
Abbaspour, K.C., C.A. Johnson, and M.Th. van Genuchten. 2004. Estimating uncertain
flow and transport parameters using a sequential uncertainty fitting procedure.
Vadose Zone J. 3:1340-1352.
Avanidou, T., and E.K. Paleologos. 2002. Infiltration in stratified, heterogeneous soils:
relative importance of parameters and model variations. Water Resour. Res.
38(11): 1232, doi: 10.1029/2001WR000725.
Berger, J.O. 1985. Statistical decision theory and Bayesian analysis (2nd edition).
Springer-Verlag, New York, USA.
B0rgesen, CD., and M.G. Schaap. 2005. Point and parameter pedotransfer functions for
water retention predictions for Danish soils. Geoderma. 127:154-167.
48
Boateng, D. 2007. Probabilistic unsaturated flow along the textural interface in three
capillary barrier models. J. Environ. Eng. DOI: 10.1061/(ASCE)0733-9372(2007)
133:11(1024).
BSC (Bechtel SAIC Company). 2003a. Total system performance assessment—License
application methods and approach. TDR-WIS-PA-000006 REV 00 ICN 01.
Bechtel SAIC Company, Las Vegas, Nevada, USA.
BSC (Bechtel SAIC Company). 2003b. Analysis of hydrologic properties data. Report
MDL-NBS-HS-000014 REV00. Lawrence Berkeley National Laboratory,
Berkeley, CA and CRWMS M&O, Las Vegas, Nevada, USA.
BSC (Bechtel SAIC Company). 2004a. UZ flow models and submodels. Report MDL-
NBS-HS-000006 REV02. Lawrence Berkeley National Laboratory, Berkeley, CA
and CRWMS M&O, Las Vegas, Nevada, USA.
BSC (Bechtel SAIC Company). 2004b. Radionuclide transport models under ambient
conditions. Report MDL-NBS-HS-000008 REV02. Lawrence Berkeley National
Laboratory, Berkeley, California and CRWMS M&O, Las Vegas, Nevada, USA.
Carrera, J., and S.P. Neuman. 1986. Estimation of aquifer parameters under transient and
steady-state conditions 1. Maximum-likelihood method incorporating prior
information. Water Resour. Res. 22(2): 199-210.
Carsel, R.F., and R.S. Parrish. 1988. Developing joint probability distributions of soil
water retention characteristics. Water Resour. Res. 24(5):755-769.
Chen, M., D. Zhang, A.A. Keller, and Z. Lu. 2005. A stochastic analysis of steady state
two-phase flow in heterogeneous media. Water Resour. Res. 41:W01006,
doi: 10.1029/2004WR003412.
49

Chirico, G.B., H. Medina, and N. Romano. 2007. Uncertainty in predicting soil hydraulic
properties at the hillslope scale with indirect methods. J. Hydrol. 344:405-422.
Christiaens, K., and J. Feyen. 2000. The influence of different methods to derive soil
hydraulic properties on the uncertainty of various model outputs of a distributed
hydrological model. Phys. Chem. Earth (B). 25(7-8):679-683.
Christiaens, K., and J. Feyen. 2001. Analysis of uncertainties associated with different
methods to determine soil hydraulic properties and their propagation in the
distributed hydrological MIKE SHE model. J. Hydrol. 246:63-81.
Efron, B., and R. J. Tibshirani. 1993. An introduction to the bootstrap, Monographs on
statistics and applied probability 57. Chapman & Hall, New York, USA.
Haukwa, C.B., Y.W. Tsang, Y.S. Wu, and G.S. Bodvarsson. 2003. Effect of
heterogeneity in fracture permeability on the potential for liquid seepage into a
heated emplacement drift of the potential repository. J. Contam. Hydrol. 62-
63:509-527.
Helton, J.C, and F.J. Davis. 2003. Latin hypercube sampling and the propagation of
uncertainty in analyses of complex systems. Relia. Eng. Syst. Safety. 81:23-69.
Hill, M.C., and C.R. Tiedeman. 2007. Effective methods and guidelines for groundwater
model calibration, including analysis of data, sensitivities, predictions, and
uncertainty. John Wiley and Sons, New York, USA.
Hollenbeck, K.J., and K.H. Jensen. 1998. Maximum-likelihood estimation of unsaturated
hydraulic parameters. J. Hydrol. 210:192-205.
Hughson, D.L., and T.-C.J. Yeh. 2000. An inverse model for three-dimensional flow in
variably saturated porous media. Water Resour. Res. 36(4):829-840.
50

Illman, W.A., and D.L. Hughson. 2005. Stochastic simulations of steady state unsaturated
flow in a three-layer, heterogeneous, dual continuum model of fractured rock. J.
Hydrol. 307:17-37.
Iman, R.L., and W.J. Conover. 1982. A distribution-free approach to inducing rank
correlation among input variables. Commu. Statist. Simula. Computa. 11(3):311-
334.
Lu, Z., and D. Zhang. 2004. Analytical solutions to steady state unsaturated flow in
layered, randomly heterogeneous soild via Kirchhoff transformation. Adv. Water
Resour. 27:775-784.
Mallants, D., D. Jacques, M. Vanclooster, J. Diels, and J. Feyen. 1996. A stochastic
approach to simulate water flow in a macroporous soil. Geoderma 10:299-324.
Mckay, M.D., R.J. Beckman, and W.J. Conover. 1979. A comparison of three methods
for selecting values of input variables in the analysis of output from a computer
code. Technometrics. 21(2):239-245.
Meyer, P.D., M.L. Rockhold, and G.W. Gee. 1997. Uncertainty analysis of infiltration
and subsurface flow and transport for SDMP sites. NUREG/CR-6565, PNNL-
11705. U.S. Nuclear Regulatory Commission, Office of Nuclear Regulatory
Research, Washington, DC, USA.
Minasny, B., and D.J. Field. 2005. Estimating soil hydraulic properties and their
uncertainty: the use of stochastic simulation in the inverse modeling of the
evaporation method. Geoderma. 126:277-290.
Nelles, O. 2001. Nonlinear System Identification: from classical approaches to neural
networks and fuzzy models. Springer, Berlin, Germany.
51

Nichols, W.E., and M.D. Freshley. 1993. Uncertainty analyses of unsaturated zone travel
time at Yucca Mountain. Ground Water. 31(2):293-301.
Oliveira, L.I., A.H. Demond, L.M. Abriola, and P. Goovaerts. 2006. Simulation of solute
transport in a heterogeneous vadose zone describing the hydraulic properties
using a multistep stochastic approach. Water Resour. Res. 42:W05420, doi:
10.1029/2005WR004580.
Paleologos, E.K., T. Avanidou, and N. Mylopoulos. 2006. Stochastic analysis and
prioritization of the influence of parameter uncertainty on the predicted pressure
profile in heterogeneous, unsaturated soils. J. Hazard. Mater. 136:137-143.
Pan, F. 2005. Uncertainty analysis of radionuclide transport in the unsaturated zone at
Yucca Mountain. Master thesis. University of Nevada Las Vegas, Nevada, USA.
Press, W.H., S.A. Teukolsky, W.T. Vetterling, and B.P. Flannery. 1992. Numerical
recipe in Fortran 77 (2nd edition). Cambridge University Press, New York, USA.
Russo, D., and M. Bouto. 1992. Statistical analysis of spatial variability in unsaturated
flow parameters. Water Resour. Res. 28(7):1911-1925.
Russo, D., J. Zaidel, and A. Laufer. 2008. Numerical analysis of solute transport from
trickle sources in a combined desert soil - imported soil flow system. Vadose
Zone J. 7:53-66, doi:10.2136/vzj2007.0050.
Schaap, M.G., and F.J. Leij. 1998. Using neural networks to predict soil water retention
and soil hydraulic conductivity. Soil Tillage Res. 47:37-42.
Seber, G.A.F., and C.J. Wild. 1989. Nonlinear regression. Jonh Wiley & Sons, New
York, USA.
52
Seber, G.A.F., and A.J. Lee. 2003. Linear regression analysis (2nd edition). John Wiley
& Sons, New York, USA.
van Genuchten, M.Th. 1980. A closed-form equation for predicting the hydraulic
conductivity of unsaturated soils. Soil Sci. Soc. Am. J. 44 (5):892-898.
van Genuchten, M.Th., F.J. Leij, and S.R. Yates. 1991. The RETC code for quantifying
the hydraulic functions of unsaturated soils. EPA/600/2-91-065. EPA, Office of
Research and Development. Washington, DC, USA.
Vrugt, J.A., and W. Bouten. 2002. Validity of first-order approximations to describe
parameter uncertainty in soil hydrologic models. Soil Sci. Am. J. 66:1740-1751.
Wang, W., S.P. Neuman, T. Yao, and P.J. Wierenga. 2003. Simulation of large-scale
field infiltration experiments using a hierarchy of models based on public,
general, and site data. Vadose Zone J. 2:297-312.
Wu, Y.S., G. Lu, K. Zhang, and G.S. Bodvarsson. 2004. A mountain-scale model for
characterizing unsaturated flow and transport in fractured tuffs of Yucca
Mountain. Vadose Zone J. 3:796-805.
Yates, S.R., M.Th. van Genuchten, A.W. Warwick, and F.J. Leij. 1992. Analysis of
measured, predicted, and estimated hydraulic conductivity using the RETC
computer program. Soil Sci. Soc. Am. J. 56:347-354.
Ye, M., R. Khaleel, M.G. Schaap, and J. Zhu. 2007a. Simulation of field injection
experiments in heterogeneous unsaturated media using cokriging and artificial
neural network. Water Resour. Res. 43:W07413, doi:10.1029/2006WR005030.
53
Ye, M., F. Pan, Y.S. Wu, B.X. Hu, C. Shirley, and Z. Yu. 2007b. Assessment of
radionuclide transport uncertainty in the unsaturated zone of Yucca Mountain.
Adv. Water Resour. 30:118-134.
Ye, M., P.D. Meyer, and S.P. Neuman. 2008a. On model selection criteria in multimodel
analysis. Water Resour. Res. 44:W03428, doi:10.1029/2008WR006803.
Ye, M., K.F. Pohlmann, and J.B. Chapman. 2008b. Expert elicitation of recharge model
probabilities for the Death Valley regional flow system. J. Hydrol. 354:102-115,
doi:10.1016/j.jhydrol.2008.03.001.
Yeh, T.-C.J., and J. Zhang. 1996. A geostatistical inverse method for variably saturated
flow in the vadose zone. Water Resour. Res. 32(9):2757-2766.
Zhang, K., Y.S. Wu, and J.E. Houseworth. 2006. Sensitivity analysis of hydrological
parameters in modeling flow and transport in the unsaturated zone of Yucca
Mountain. Hydrogeol. J. 14:1599-1619.
Zhou, Q., H.H. Liu, G.S. Bodvarsson, and CM. Oldenburg. 2003. Flow and transport in
unsaturated fractured rock: effects of multiscale heterogeneity of hydrogeologic
properties. J. Contam. Hydrol. 60:1-30.
54

CHAPTER 3
INCORPORATING LAYER- AND LOCAL-SCALE HETEROGENEITIES IN
NUMERICAL SIMULATION OF UNSATURATED FLOW AND CONTAMINANT
TRANSPORT
This chapter incorporates the layer- and local-scale heterogeneities in hydraulic
parameters into the uncertainty assessments of flow and transport and investigates the
relative effects of layer- and local-scale heterogeneities on the uncertainties in flow and
contaminant transport in heterogeneous UZ. The hydraulic parameters (i.e. permeability
and porosity in this chapter) are treated as heterogeneous random variables to
characterize the local-scale heterogeneities of the parameters. Due to only several
available measurements for van Genuchten a and n parameters for each hydrogeologic
layer and no spatial experiment data for sorption coefficient of the reactive tracer, the
local-scale heterogeneities in these parameters cannot be characterized and they are
treated as deterministic variables.
3.1 Introduction
Hydrogeologic environments consist of natural soils and rocks that exhibit multi-
scale spatial variability, or heterogeneity, in hydraulic and transport parameters from core
samples to layer structures and lithofacies. Although the parameters are intrinsically
55

deterministic (i.e., they exist and are potentially measurable at all scales), knowledge of
these parameters usually is limited, especially at field scales. Parameter uncertainty thus
arises and renders the predictions of contaminant transport uncertain. Quantifying
uncertainty at the field scale is of particular importance because decisions are often based
on the field-scale predictions. It is common in field-scale modeling to separate a large
field domain into hydrogeologic layers (layer-scale). Layer-scale uncertainty is important
in simulating the overall flow and transport trend and pattern. While local-scale
heterogeneity within the layers is critical in predicting flow path, velocity, and travel time
of contaminants, it is often neglected in modeling practices. This study aims to
characterize both layer- and local-scale heterogeneities and evaluate their relative effects
on the predictive uncertainties in unsaturated flow and contaminant transport.
The study site is the UZ of YM, which consists of various complex hydrogeologic
units, and spatial variability of hydraulic properties in each unit can be viewed as
deterministic and/or random processes of multiple scales. Heterogeneities in the
hydraulic properties in the UZ have been investigated by many researchers. Based on the
degree of welding, rock properties, and hydraulic properties, the UZ is separated into 5
major geologic units and 30 hydrogeologic layers (BSC, 2003b; Flint, 1998, 2003; Flint
et al, 2006). Zhou et al. (2003) categorized the heterogeneity for site, layer, and local
scales. Typically, in studies of YM, site scale refers to the UZ model domain of
numerical modeling studies; layer scale refers to the hydrogeologic layers with layerwise
average properties; and local scale refers to the spatial variation in hydraulic properties
within a layer. In the last decade, layer-scale uncertainty has been characterized and
incorporated into the 3-D site-scale numerical model (e.g., BSC, 2004a; Wu et al., 1999,
56

2004, 2007). Parameter uncertainty and sensitivity analysis for tracer transport in the YM
UZ has been conducted mainly at the layer scale (Illman and Hughson, 2005; Nichols and
Freshley, 1993; Pan, 2005; Ye et al., 2007b; Zhang et al., 2006). Local-scale
heterogeneity in the model parameters within a layer is also important since it affects the
flow path, velocity, and travel time of tracers (Bodvarsson et al., 2001; Haukwa et al.,
2003; Illman and Hughson, 2005; Viswanathan et al., 2003; Zhang et al., 2006; Zhou et
al., 2003). This study incorporates the layer- and local-scale heterogeneities and conducts
a Monte Carlo simulation to investigate their relative importance to the propagation of
parameter uncertainty. Based on a-priori knowledge of the UZ described in Chapter 1, the
model parameters of particular importance in our local-scale heterogeneity
characterizations include matrix permeability and porosity. Since the uncertainties of
these two parameters have been characterized at the layer scale in Pan (2005) and Ye et
al. (2007b), selecting them for the uncertainty analysis enables us to distinguish between
the effects of local-scale and layer-scale heterogeneities on uncertainties in unsaturated
flow and tracer transport.
This study is focused on investigating the relative effects of layer- and local-scale
heterogeneities on predictive uncertainty, but not on jointly assessing the predictive
uncertainties due to heterogeneities of the two scales. However, this study can be
extended for a joint assessment of multi-scale heterogeneity using, for example, the
Random Domain Decomposition (RDD) approach (Guadagnini et al., 2004; Winter and
Tartakovsky, 2000, 2002; Winter et al., 2002, 2003, 2006; Xiu and Tartakovsky, 2004).
The RDD also separates a field-scale geologic system into a number of geologic units
(e.g., hydrogeologic layers and lithofacies), but treats boundaries of the geologic units as
57

uncertain (the units being random composites). The key input of the RDD is the
probability of boundary locations, used for averaging local-scale uncertainty to
incorporate uncertainties in the unit boundaries. While estimating the probability is still
in its development stage (Winter et al., 2006), the problem may be resolved using
geostatistical methods (e.g., Guadagnini et al., 2004). When the boundary locations are
fixed (e.g., Winter et al., 2006), some results of the RDD can also be obtained by
conventional stochastic methods as observed in this study. In terms of separating a highly
heterogeneous domain into less heterogeneous hydrogeological layers, this study is
conceptually analogous to the RDD. If uncertainty in the layer boundary locations can be
statistically quantified for the UZ, which will be very difficult for the complicated
geological system with the limited characterization data, this study can be extended to
incorporate this uncertainty using the RDD.
3.2 Characterization of Parameter Heterogeneity
There are two types of available data for matrix permeability and porosity: core
measurements at the local scale and calibrated values at the layer scale. From 33
boreholes, 5,320 rock core samples were collected (Flint, 1998, 2003; BSC, 2003b)
yielding 546 measurements of saturated hydraulic conductivity (which can be converted
to permeability in our simulations) and 5,257 measurements of porosity. Figure 3.1
shows the locations of the measurements. Particularly, more porosity measurements are
available in shallow boreholes than permeability measurements (Figure 3.1) and the
borehole locations are also shown in Figure 1.2. The other type of parameter data is the
layer-scale values of permeability obtained from calibrating the 3-D model (BSC, 2004a;
58
Wu et al., 2004, 2007). Calibration of the 3-D model is based on calibration of the earlier
one-dimensional (1-D) model (BSC, 2004c), which resulted in adjustment of the matrix
permeability values for the layers BT3, BT2, CHV, and PP3. Since the calibrated
permeability values in these layers represent the optimum estimate of layer-scale UZ
heterogeneity, the calibrated permeability values for these layers need to be retained in
the generated heterogeneous field.
For each hydrogeologic layer, sequential Gaussian simulation (SGSIM) of GSLIB
(Geostatistical Software Library) (Deutsch and Journel, 1998) is used to generate the
conditional heterogeneous parameter realizations to characterize local-scale heterogeneity
and associated uncertainties. Since the SGSIM does not consider correlations between
random variables, the random fields of the matrix permeability and porosity are generated
separately. To satisfy the SGSIM requirement for conditional data to be Gaussian (many
studies simply assume that the conditioning data are Gaussian), the transform method of
Ye et al. (2007b) is adopted in this study. At each layer, measurements are transformed to
be Gaussian by one of the three Johnson transformations (Carsel and Parrish, 1988;
Johnson and Kotz, 1970) and four classical re-expressions (Mallants et al., 1996). The
random fields incorporating local-scale heterogeneity are first generated with the
transformed data and then back-transformed to their real values.
59

Figure 3.1 The locations of measurements in matrix hydraulic conductivity (blue circle) and porosity (green square) in the UZ of YM.
The correlation lengths of the parameters are determined based on variogram
analysis (e.g., Ye et al., 2005b, 2007a). Since the porosity measurements are abundant
and widely spread in shallow boreholes, horizontal and vertical correlation lengths of
porosity in each hydrogeologic layer of the TCw, PTn, and TSw units are estimated by
calculating and fitting the sample variograms. While the vertical variogram of porosity in
each hydrogeologic layer of the two deep units of CHn and CFu can be calculated, it is
not possible to calculate the horizontal variogram in each layer due to the lack of
measurements in the two units. However, we note that, for three shallow units of TCw,
PTn, and TSw, the horizontal correlation length in each layer is similar to that of the unit
where the layer belongs. Consequently, horizontal correlation lengths for the layers
within the CHn unit are assumed constant and assigned the value of the CHn unit, given
that the horizontal variogram of the CHn unit can be calculated from measurements.
Since only one borehole was drilled in the CFu unit (below the CHn unit), the horizontal
60
correlation lengths for the two layers in this unit are assumed to be the same as those for
the CHn unit. Permeability measurements are sufficient only for estimating the vertical
correlation lengths for 14 layers, where there appears to be a tendency for permeability
and porosity to have similar vertical correlation lengths. The similarity may be attributed
to the strong correlation between permeability and porosity shown in Flint (2003) and to
the fact that the permeability and porosity measurements were taken from the same
boreholes. It is thus assumed that, for layers where plotting variograms is impossible due
to lack of data, the permeability and porosity have the same correlation lengths.
To honor the layer-scale permeability values obtained from the 3-D model
calibrations, we first calculate for each numerical block the sample mean (over the
realizations) of permeability and then average them over each layer. The resulting layer-
averaged values are close to the calibrated values for most model layers, except for layers
BT3, BT2, CHV, and PP3, where layer-scale permeability is increased during the model
calibration (BSC, 2004a). To ensure that the mean permeability of each realization equals
the calibrated value, the layer-averaged permeability is adjusted for the four layers, after
which, the generated permeability values are no longer conditioned on the local-scale
core measurements. As a result, the generated values of permeability and porosity in each
layer randomly fluctuate around a mean value that is the same as calibrated layer-scale
values or close to them. This procedure omits uncertainties in the calibrated layer-scale
parameter values. The ideal way is to compare the PDFs of the layer- and local-scale
parameter values. However, estimating the PDFs of the layer-scale variables will require
additional field investigation and recalibrating the UZ models, which is beyond the scope
of this study.
61

Figure 3.2 shows the sample mean of the 200-realization log-permeability at the
east-west and north-south cross-sections through borehole UZ-14 located in the proposed
repository area (the two cross-sections are marked in Figure 1.2). Layer-scale uncertainty
is apparent, since the mean log-permeability is significantly different in the various
layers. At the bottom layers, Figure 3.2b shows that the mean log-permeability in the
northern part of the domain is significantly smaller than that in the south, reflecting the
fact that the CHn-unit zeolitic tuffs (with low permeability) are located in the north, while
the vitric tuffs (with high permeability) are located in the south. Figure 3.2 also illustrates
the local-scale heterogeneity within each layer. Sample variance (figures not shown) of
the log-permeability over the 200 realizations varies significantly, from 0.5 to 8.0 in
different layers, depending on the density of measurements in each layer. In general, the
variance is smaller for thinner layers with more measurements. The spatial variability of
porosity is similar to that of log permeability but with a smaller magnitude of variation.
3.3 Uncertainty Assessment
Monte Carlo simulations are conducted to investigate the propagation of
uncertainties in matrix permeability and porosity into the uncertainties in flow and tracer
transport at UZ. The mean, variance, and 5th, 50th, and 95th percentiles of the simulated
state variables (e.g., saturation, percolation fluxes, and concentration) are evaluated from
200 realizations. In addition to the variance, the 5th and 95th percentiles (also known as
uncertainty bounds) are used to quantify predictive uncertainty. The deterministic
simulation results of BSC (2004a) are treated in this study as a baseline case for the
stochastic simulations. Note that only layer-scale uncertainty was considered in the
62
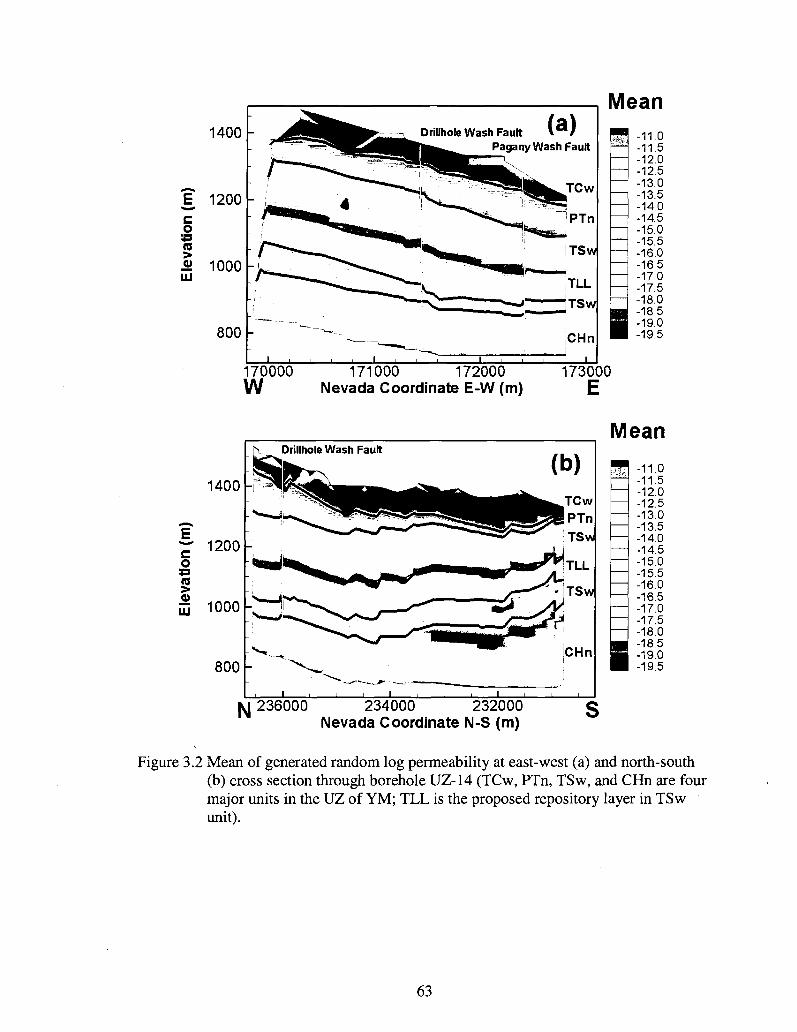
1400
E, 1200 c o ••o
I 1000
800
Drillhole Wash Fault Pagany Wash Fault
CHn
Mean
70000 171000 172000 173000 1N Nevada Coordinate E-W (m) E
-11.0 -11.5 -12.0 -12.5 -13.0 -13.5 -14.0 -14.5 -15.0 -15.5 -16.0 -16.5 -17.0 -17.5 -18.0 -18.5 -19.0 -19.5
Mean -11.0 -11.5 -12.0 -12.5 -13.0 -13.5 -14.0 -14.5 -15.0 -15.5 -16.0 -16.5 -17.0 -17.5 -18.0 -18.5 -19.0 -19.5
|SJ 236000 234000 232000 Nevada Coordinate N-S (m)
Figure 3.2 Mean of generated random log permeability at east-west (a) and north-south (b) cross section through borehole UZ-14 (TCw, PTn, TSw, and CHn are four major units in the UZ of YM; TLL is the proposed repository layer in TSw unit).
63

deterministic simulation. Convergence of the Monte Carlo simulations is investigated in a
similar manner to Ballio and Guadagnini (2004) and Ye et al. (2004a). Results indicate
that the statistics reach stabilization after 150 realizations, and therefore, 200 realizations
are regarded sufficient for meaningful statistics for the uncertainty assessments.
3.3.1 Uncertainty Assessment of Unsaturated Flow
3.3.1.1 Comparison of Simulated and Measured Saturation and Water Potential
Simulated matrix liquid saturation and water potential are verified by comparing
their statistics with field observations. Figure 3.3 compares the observed and simulated
matrix water saturation along borehole SD-12. The simulated mean saturation (as well as
the 50th percentile) is close to the corresponding result for the deterministic case (Wu et
al., 2004; BSC, 2004a), indicating that layer-scale uncertainty in model parameters
dominates local-scale heterogeneity in simulating the mean behavior of the unsaturated
flow. The mean matrix liquid saturation is in reasonable agreement with the observed
profiles, especially the matched variation patterns. The 5th and 95th percentiles of
simulated results bracket a large portion of the observations, indicating that observed
state variability could be explained partially by parameter uncertainties in the matrix
permeability and porosity. Unbracketed measurements may be attributed to uncertainty
not considered in this study, such as uncertainties in other model parameters,
measurement error, conceptual model incompleteness, and different scales between the
model inputs and the field and laboratory parameter measurements. The simulated and
observed matrix liquid saturation along other boreholes is also compared, and the
comparison results are similar to those shown in Figure 3.3. The comparison of simulated
64

and observed water potential along borehole shows similar features as the liquid
saturation (figure not shown).
'% 0 0.1 0.2 0.3 0.4 0.5 0.6 0.7 0.8 0.9 1.0
Saturation
Figure 3.3 Comparison of observed and 3-D model simulated matrix liquid saturation for borehole SD-12.
3.3.1.2 Flow Pattern and Uncertainty Assessment
Figure 3.4 depicts the mean, variance, and 5th and 95th percentiles of simulated
percolation fluxes at the proposed repository horizon, while Figure 3.5a and 3.5b show
the mean and variance at the water table. The pattern of mean percolation fluxes at the
proposed repository layer (Figure 3.4a) is similar to the surface infiltration pattern
65

(Figure 1.3), indicating dominant vertical flow and negligible lateral movement from the
land surface to the proposed repository level. At the water table (Figure 3.5a), the high
percolation flux zone moves eastward, indicating significant lateral flow from the
proposed repository level to the water table. This is mainly attributed to the dipping slope
(around 5 to 10 degrees) and the presence of the CHn unit between the proposed
repository and the water table (Figure 3.2). Variance in percolation fluxes at the proposed
repository level (Figure 3.4b) is larger in the western part of the model domain associated
with the high infiltration rate. In comparison to Figure 3.4b, Figure 3.5b shows that a
large variance at the water table also occurs at the western side of the domain but covers
a wider area that extends southward. This may be due to the larger spatial variation of
matrix permeability at the bottom than at the top of the simulation domain (Figure 3.2)
and the accumulated effects of parameter uncertainty propagation downward to the water
table. In Figures 3.4c and 3.4d, the 5th and 95th percentiles of percolation fluxes are
significantly different, indicating large uncertainty in the percolation fluxes caused by the
uncertainty in matrix permeability.
3.3.1.3 Comparison of Flow Uncertainty Assessment
In Pan (2005) and Ye et al. (2007b), the uncertainty in unsaturated flow caused by
parameter uncertainty was assessed only at the layer scale. Multiple correlated
realizations of matrix permeability and porosity were generated using the LHS method
for each layer where the parameters were treated as homogeneous. This is referred to as
the homogeneous case, as opposed to the heterogeneous case in this study, where
randomly heterogeneous parameter fields are generated for each layer based on the
procedure described in Section 3.2. Figure 3.5 shows the mean and variance of the
66
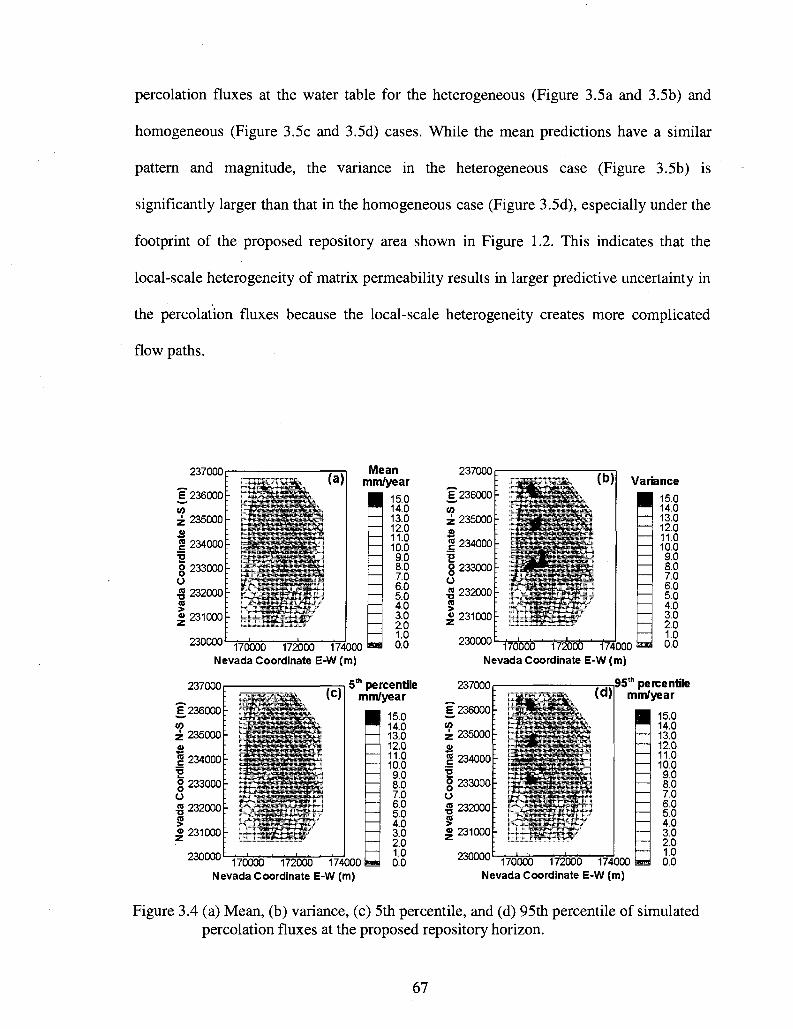
percolation fluxes at the water table for the heterogeneous (Figure 3.5a and 3.5b) and
homogeneous (Figure 3.5c and 3.5d) cases. While the mean predictions have a similar
pattern and magnitude, the variance in the heterogeneous case (Figure 3.5b) is
significantly larger than that in the homogeneous case (Figure 3.5d), especially under the
footprint of the proposed repository area shown in Figure 1.2. This indicates that the
local-scale heterogeneity of matrix permeability results in larger predictive uncertainty in
the percolation fluxes because the local-scale heterogeneity creates more complicated
flow paths.
237000 £-\j t \J\J\y
£ 236000
in z 235000 <u 1 234000
•2 g 233000 O £ 232000 <s
> « 231000
,-v",nnfin
" ~
-'. -: '. ! -•
m_ .
hffi&dSgk (a)
' - -)|tf*3ZAqJlp
i i
Mean mm/year
• 15.0 ff 14.0
zouuuu 1 7 0 0 0 0 1 7 2 0 0 0 174000
13.0 12.0 11.0 10.0 9.0 8.0 7.0 6.0 5.0 4.0 30 2.0 1.0 0.0
Nevada Coordinate E-W (m)
2370001 • 5 th percentile
£236000
in z 235000
•8 1234000
TJ §233000 o « 232000
S * 231000
230000
n n ^ (c)
L\ J^92dKSy
, • . . . • . . .
17 0000 172000 174
mm/year
• 15.0 ~ 14.0
000
13.0 12.0 11.0 10.0 9.0 8.0 7.0 6.0 5.0 4.0 3.0 2.0 1.0 0.0
237000
£236000
CO z 235000 4)
2 234000
•2 g 233000 o o " 2 3 2 0 0 0 re > ° 231000
^ _ ^ w 1 w w w
nonnnn
; "
---: i
; ': : i
•
SUSHk (b) ~^^3|^^^^^^^.
i i
Variance
• 15.0 F l 14.0
^ u u u u 1 7 0 0 0 0 1 7 2 0 0 0 1 7 4 0 0 0 Bag
13.0 12.0 11.0 10.0 9.0 8.0 7.0 6.0 5.0 4.0 3.0 2.0 1.0 0.0
Nevada Coordinate E-W (m)
237000, ^^ ,95 t h percentile
£236000
CO z 235000 jB g 234000
•2 g 233000 U 5 232000
§ » 231000
230000
'-
^ ^ w , (d)
J^^^^^l^w^i
L l~l ?Tffi~?-JTVy i i
17 0000 172000 174
mm/year
• 15.0 ~ 14.0
000
—
13.0 12.0 11.0 10.0 9.0 8.0 7.0 6.0 5.0 4.0 3.0 2.0 1.0 0.0
Nevada Coordinate E-W (m) Nevada Coordinate E-W (m)
Figure 3.4 (a) Mean, (b) variance, (c) 5th percentile, and (d) 95th percentile of simulated percolation fluxes at the proposed repository horizon.
67

170000 172000 174000 Nevada Coordinate E-W (m)
Mean mm/year
15.0 14.0 13.0 12.0 11.0 10.0 9.0 8.0 7.0 6.0 5.0 4.0 3.0 2.0 1.0 0.0
237000r
236000;
235000;
234000;
233000;
232000;
231000;
230000t
.
•.
1
;
lilllllllili
1
(c)
170000 172000 174000
Mean mm/year
15.0 14.0 13.0 12.0 11.0 10.0 9.0 8.0 7.0 6.0 5.0 4.0 3.0 2.0 1.0 0.0
Nevada Coordinate E-W (m)
237000
E 236000
230000 170000 172000 174000 Nevada Coordinate E-W (m
Vara nee
£8 13.0 12.0
tt8 9.0
*8 6.0 5.0
18 2.0
i8 237000
E 236000 (d) Variance
230000 170000 172000 174000 Nevada Coordinate E-W (m)
15.0 14.0 13.0 12.0 11.0 10.0 9.0 8.0 7.0 6.0 5.0 4.0 3.0 2.0 1.0 0.0
Figure 3.5 Mean and variance of simulated percolation fluxes at the water table for the heterogeneous case (a,b) and homogeneous case (c,d).
3.3.2 Uncertainty Assessment of Tracer Transport
The uncertainty in tracer transport is evaluated for two representative tracers:
conservative (99Tc) and reactive (237Np) tracers. Sorption coefficient of 237Np is treated as
a random variable, and multiple realizations are generated in the same manner of Ye et al.
(2007b). Although other transport and geochemical parameters may be also important for
the uncertainty assessment, this study treats them deterministically and uses the
parameter values of BSC (2004a, b).
68

3.3.2.1 Uncertainty Assessment of Spatial Distribution in Tracer Plumes
Figure 3.6a and 3.6b depict the mean and variance of the normalized cumulative
mass-arrival contours of the reactive tracer (237Np) at 1,000,000 years (extended standard
of the U.S. Environmental Protection Agency). The mean of mass arrival covers virtually
the entire area with higher values directly below the footprint of the proposed repository
shown in Figure 1.2. While the contour spreads widely to the east of the model domain,
high values appear restricted to the west of Ghost Dance Fault (Figure 1.2, eastern
boundary of the repository footprint), indicative of the dominant vertical movement for
tracers. The variance contour (Figure 3.6b) has a similar pattern to the mean contour
(Figure 3.6a) with higher values of variance below the repository footprint. In addition,
the area of higher variance corresponds to the area of high mean, except at the northern
end of the Drillhole Wash Fault (Figure 1.2). The spatial pattern of variance (Figure 3.6b)
is correlated with the spatial pattern of percolation flux variance (Figure 3.5b), indicating
that the larger uncertainty in the percolation flux results in the significant uncertainty in
the cumulative mass arrival.
3.3.2.2 Uncertainty Assessment of Cumulative Mass Travel Time
Figure 3.7 shows the mean and the 5th and 95th percentiles of the simulated
fractional breakthrough curves of cumulative mass arriving at the water table for the two
tracers in both heterogeneous and homogeneous cases. For the heterogeneous case, the
5th and 95th percentiles indicate significant uncertainty in travel time. For example, 50%
of the total mass of 237Np may take from 31,600 to 295,000 years to arrive at the water
table. Owing to the sorption effects of the reactive tracer, the reactive tracer (237Np)
travels about two orders of magnitude slower than the conservative tracer (99Tc). For
69
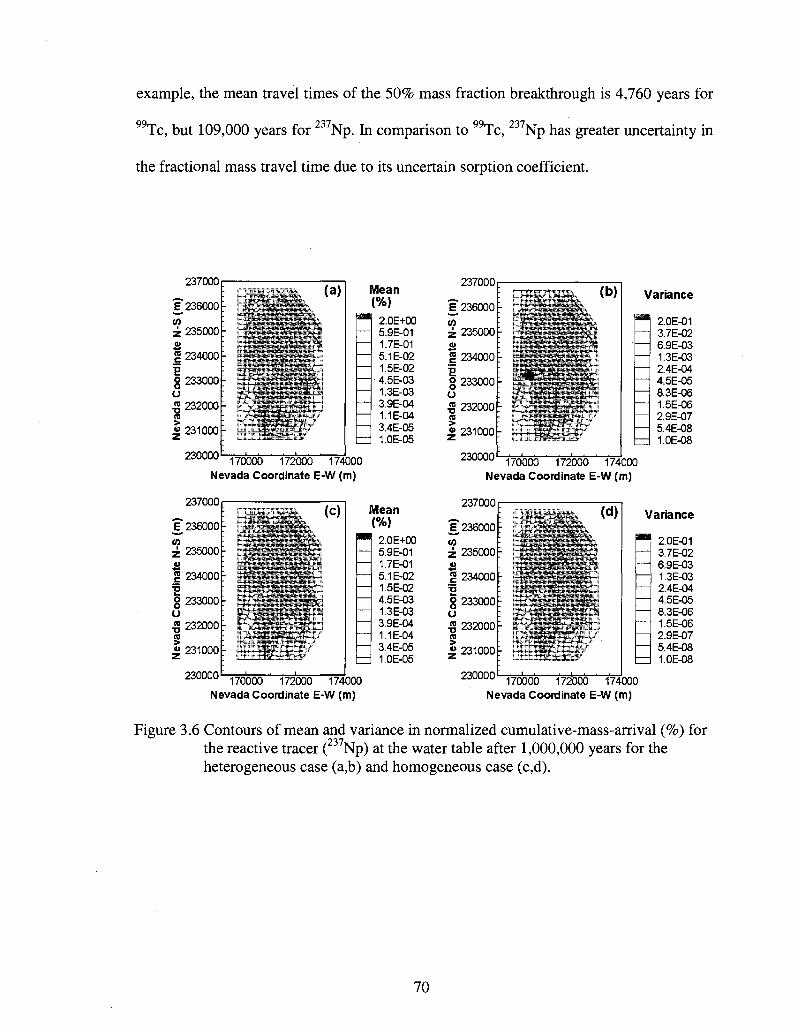
example, the mean travel times of the 50% mass fraction breakthrough is 4,760 years for
99Tc, but 109,000 years for 237Np. In comparison to 99Tc, 237Np has greater uncertainty in
the fractional mass travel time due to its uncertain sorption coefficient.
237000
£.236000
z 235000 -
| 234000
g 233000 o « 232000
I 231000
230000
237000 (a) Mean
(%) 2.0E+00 5.9E-01 1.7E-01 5.1E-02 1.5E-02 4.5E-03 1.3E-03 3.9E-04 1.1E-04 3.4E-05 1.0E-05
1" 236000
CO z 235000 V
g 234000
g 233000 o 5 232000
«j 231000
170000 172000 174000 Nevada Coordinate E-W (m)
230000
Variance
2.0E-01 3.7E-02 6.9E-03 1.3E-03 2.4E-04 4.5E-05 8.3E-06 1.5E-06 2.9E-07 5.4E-08 1.0E-08
170000 172000 174000 Nevada Coordinate E-W (m)
237000
E 236000
Mean (%)
2.0E+00 5.9E-01 1.7E-01 5.1E-02 1.5E-02 4.5E-03 1.3E-03 3.9E-04 1.1E-04 3.4E-05 1.0E-05
230000 170000 172000 174000 Nevada Coordinate E-W (m)
237000
E 236000 :
^ 232000
«> 231000
Variance
2.0E-01 3.7E-02 6.9E-03 1.3E-03 2.4E-04 4.5E-05 8.3E-06 1.5E-06 2.9E-07 5.4E-08 1.0E-08
230000 170000 172000 174000 Nevada Coordinate E-W (m)
Figure 3.6 Contours of mean and variance in normalized cumulative-mass-arrival (%) for the reactive tracer (237Np) at the water table after 1,000,000 years for the heterogeneous case (a,b) and homogeneous case (c,d).
70

3.3.2.3 Comparison of Transport Uncertainty Assessment
Figure 3.6 shows the mean and variance of normalized cumulative mass arrival of
237Np at 1,000,000 years for the heterogeneous (Figures 3.6a and 3.6b) and homogeneous
(Figures 3.6c and 3.6d) cases. While spatial patterns and magnitudes of the mean
predictions are similar for the two cases, the variance in the heterogeneous case is much
greater than that in the homogeneous case. This comparison suggests that incorporating
local-scale heterogeneity of permeability and porosity results in higher uncertainty for
tracer transport. In other words, it becomes more difficult to estimate potential locations
of high-tracer concentration after the local-scale heterogeneity is considered.
Figure 3.7 shows the simulated fractional breakthrough curves of cumulative
mass arriving at the water table in both heterogeneous and homogeneous cases. The mean
travel time for the heterogeneous case increases relative to the homogeneous case for
both tracers at the early stage. This observation implies that the simulated flow path
becomes more tortuous, and simulated tracer transport between matrix and fracture
becomes more complicated after the local-scale heterogeneity is considered. With the
downward movement of the tracers, since flow paths may develop along the fractures
with high permeability, the effect of local-scale heterogeneity in the matrix properties on
tracer transport gradually decreases with time. As a result, the travel time in the two cases
becomes similar after approximately 20,000 years, with 78% fractional mass
breakthrough for 99Tc, and 100,000 years, with 48% fractional mass breakthrough for
237Np. Similar breakthrough behavior was observed in Zhou et al. (2003). Figure 3.7 also
shows that, for both tracers, the 5th and 95th percentile bound for the travel time
prediction is much smaller in the heterogeneous case than in the homogeneous case,
71

indicating the reduced uncertainty in travel time. For example, when 75% of the Tc
mass flows out of the UZ, the variation in travel time is between 9,000 and 23,400 years
in the homogeneous case, whereas the variation is between 14,200 and 18,900 years in
the heterogeneous case. This difference suggests the importance of layer-scale
uncertainty on controlling the overall pattern of tracer transport measured by travel time
of cumulative mass. In the homogeneous case, the layer-scale parameter values vary
randomly, rendering significant change in the overall pattern of tracer transport over
different realizations. In the heterogeneous case, the layer-scale parameter values are the
same or close to the calibrated values over different realizations, despite that the local-
scale parameter values vary randomly. Therefore, the overall pattern of tracer transport
varies less significantly than in the homogeneous case. This indicates that, if one wants to
reduce overall predictive uncertainty in tracer travel time, an effort should be dedicated to
reducing uncertainty in layer-scale values by improving the 3-D model calibration of
BSC (2004a), recalling that layer-scale values are obtained from inverse modeling.
3.4 Discussions
At a complicated field site such as the proposed YM geological repository, there
are two other major sources of uncertainties: uncertainty in conceptual models of the
tracer transport and uncertainty in model scenarios capturing all applicable features,
events, and processes (FEPs) at the geological repository (BSC, 2003a). Recently, a
multi-model averaging method has been advocated to assess the conceptual model
uncertainty (Beven and Binley, 1992; Neuman 2003; Ye et al., 2004b, 2005a, 2008a, b;
Poeter and Anderson, 2005; Beven, 2006; Refsgaard et al., 2006; Meyer et al., 2007). The
72
study of model scenarios mainly is focused on infiltration (Wu et al., 2002, 2004;
Faybishenko, 2007), the major driving force of tracer transport to the groundwater. If the
conceptual model uncertainty and model scenario uncertainty are considered, the
predictive uncertainty will be significantly larger than that caused only by the parameter
uncertainty.
Similarly, if additional random parameters are considered, the predictive
uncertainty also will increase. As described in Chapter 1, the random parameters are
selected mainly based on the sensitivity analysis of Zhang et al. (2006). It would be more
rigorous to conduct a comprehensive sensitivity analysis to determine which parameters
are influential to predictive uncertainty. In addition, given that the modeling domain is
delineated into multiple hydrogeologic layers, and local-scale heterogeneity contributes
more to predictive uncertainty than layer-scale uncertainty, it will be interesting to use
sensitivity analysis in determining the layers where local-scale heterogeneity should be
considered and the layers where layer-scale uncertainty would be sufficient. The
sensitivity analysis will be useful in optimizing limited computing resources and site
characterization to reduce uncertainty.
This research follows the traditional modeling scheme of separating a field-scale
modeling domain into less heterogeneous hydrogeologic layers with fixed layer
boundaries. Uncertainty in the layer boundaries is not considered in this study. If the
uncertainty can be quantified statistically, it can be assessed using the framework of
RDD, whereas it will be difficult to obtain reliable quantification of the uncertainty in
layer boundaries for the complicated geological systems at the UZ of YM. Although this
type of uncertainty is not considered, certain findings of this study (e.g., the relative
73
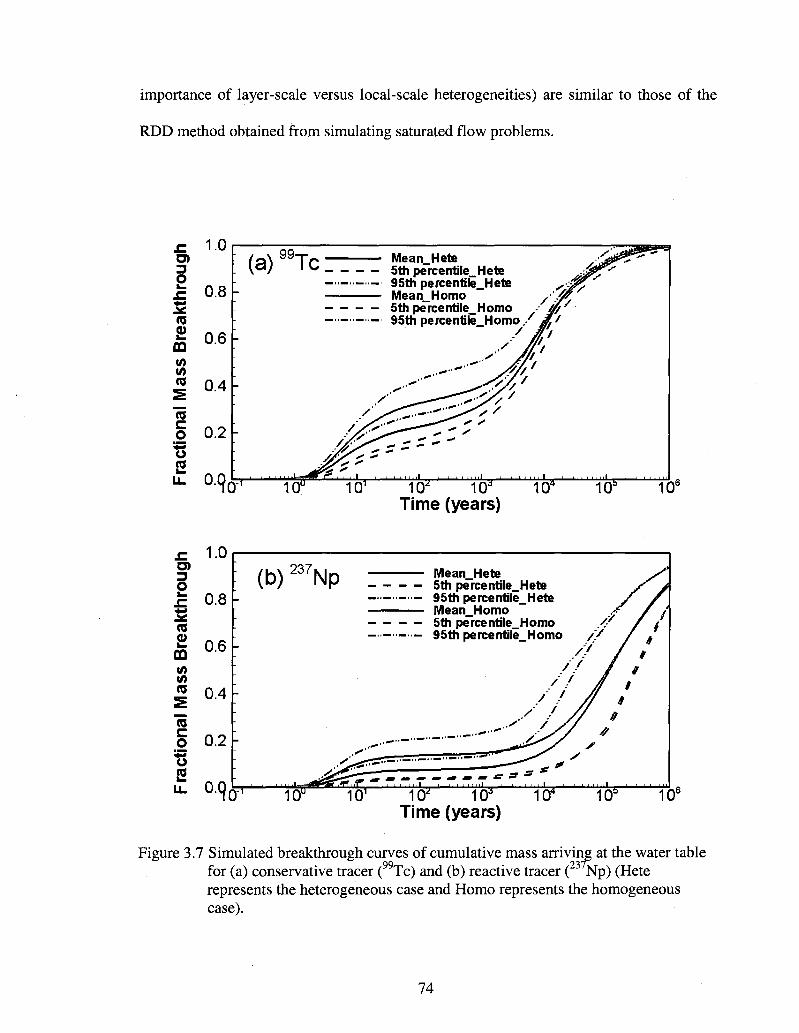
importance of layer-scale versus local-scale heterogeneities) are similar to those of the
RDD method obtained from simulating saturated flow problems.
1.0
0.8
0.6
0.4
0.2
0. 9.
/ Q \ a a T Q Mean_Hete 5th percentile_Hete 95th percentile_Hete Mean_Homo 5th percentile_Homo 95th percentile_Homo / g.f
102 TO3 1CT Time (years)
1.0
0.8
0.6
0.4
0.2
£ 0. 9o^
(b) 2371 Mean Hete
5th percentile_Hete 95th percentile_Hete Mean_Homo 5th percentile_Homo
W To1 To2 To3 W Time (years)
10° 10
Figure 3.7 Simulated breakthrough curves of cumulative mass arriving at the water table for (a) conservative tracer ( Tc) and (b) reactive tracer ( Np) (Hete represents the heterogeneous case and Homo represents the homogeneous case).
74
3.5 Conclusions
This study leads to the following major conclusions:
(1) Layer-scale uncertainty is more important than local-scale heterogeneity in
simulating the trend and pattern of field observations of flow. Therefore, when
simulating the unsaturated flow, layer-scale uncertainty should be honored by
using the calibrated values obtained from the 3-D inverse modeling.
(2) While local-scale heterogeneity slightly affects the mean predictions of
percolation fluxes and tracer plumes, it significantly increases predictive
uncertainty in these quantities, implying that more random and complicated flow
paths are created by the local-scale heterogeneity. This is also true for the spatial
distribution of the normalized cumulative mass arrival.
(3) Local-scale heterogeneity increases mean travel time for the reactive and
conservative tracers in early stage, but the effect gradually decreases over time.
(4) Layer-scale uncertainty is also more important than local-scale heterogeneity in
simulating the travel time of cumulative mass to the water table. If one wants to
reduce overall predictive uncertainty in tracer travel time, an effort should be
made to reduce the uncertainty in layer-scale values by improving the 3-D model
calibration, recalling that layer-scale values are obtained from inverse modeling.
3.6 References
Ballio, F., and A. Guadagnini. 2004. Convergence assessment of numerical Monte Carlo
simulations in groundwater hydrology. Water Resour. Res. 40(5):W04603,
doi: 10.1029/2003 WR002876.
75

Beven, K.J., and A.M. Binley. 1992. The future of distributed models: model calibration
and uncertainty prediction. Hydrol. Process. 6:279-298.
Beven, K. 2006. A manifesto for the equifinality thesis. J. Hydrol. 320:18-36.
BSC (Bechtel SAIC Company). 2003a. Total system performance assessment—License
application methods and approach. TDR-WIS-PA-000006 REV 00 ICN 01.
Bechtel SAIC Company, Las Vegas, Nevada, USA.
BSC (Bechtel SAIC Company). 2003b. Analysis of hydrologic properties data. Report
MDL-NBS-HS-000014 REV00. Lawrence Berkeley National Laboratory,
Berkeley, California and CRWMS M&O, Las Vegas, Nevada, USA.
BSC (Bechtel SAIC Company). 2004a. UZ flow models and submodels. Report MDL-
NBS-HS-000006 REV02. Lawrence Berkeley National Laboratory, Berkeley,
California and CRWMS M&O, Las Vegas, Nevada, USA.
BSC (Bechtel SAIC Company). 2004b. Radionuclide transport models under ambient
conditions. Report MDL-NBS-HS-000008 REV02. Lawrence Berkeley National
Laboratory, Berkeley, California and CRWMS M&O, Las Vegas, Nevada, USA.
BSC (Bechtel SAIC Company). 2004c. Calibrated properties model. MDL-NBS-HS
000003 REV 02. Lawrence Berkeley National Laboratory, Berkeley, California
and Bechtel SAIC Company, Las Vegas, Nevada, USA.
Bodvarsson, G.S., H.H. Liu, R. Ahlers et al. 2001. Parameterization and upscaling in
modeling flow and transport at Yucca Mountain. Conceptual models of flow and
transport in the fractured vadose zone. National Research Council, National
Academy Press, Washington, DC, USA.
76

Carsel, R.F., and R.S. Parrish. 1988. Developing joint probability distributions of soil
water retention characteristics. Water Resour. Res. 24(5):755-769.
Deutsch, C.V., and A.G. Journel. 1998. GSLIB: Geostatistical software library and user's
guide (2nd edition). Oxford University Press, New York, USA.
Faybishenko, B. 2007. Climatic forecasting of net infiltration at Yucca Mountain using
analogue meteorological data. Vadose Zone J. 6(l):77-92.
Flint, L.E. 1998. Characterization of hydrogeologic units using matrix properties, Yucca
Mountain, Nevada. Water Resour. Invest. Rep. 97-4243. US Geological Survey,
Denver, Colorado, USA.
Flint, L.E. 2003. Physical and hydraulic properties of volcanic rocks from Yucca
Mountain, Nevada. Water Resour. Res. 39(5): 1-13.
Flint, L.E., D.C. Buesch, and A.L. Flint. 2006. Characterization of unsaturated zone
hydrogeologic units using matrix properties and depositional history in a complex
volcanic environment. Vadose Zone J. 5:480-492.
Guadagnini, L., A. Guadagnini, and D.M. Tartakovsky. 2004. Probabilistic reconstruction
of geologic facies. J. Hydrol. 294:57-67.
Haukwa, C.B., Y.W. Tsang, Y.S. Wu, and G.S. Bodvarsson. 2003. Effect of
heterogeneity in fracture permeability on the potential for liquid seepage into a
heated emplacement drift of the potential repository. J. Contam. Hydrol. 62-
63:509-527.
Illman, W.A., and D.L. Hughson. 2005. Stochastic simulations of steady state unsaturated
flow in a three-layer, heterogeneous, dual continuum model of fractured rock. J.
Hydrol. 307:17-37.
77

Johnson, N.L., and S. Kotz. 1970. Distributions in statistics: Continuous univariate
distributions, Vol. 1. Houghton Miffin Company, Boston, Massachusetts, USA.
Mallants, D., D. Jacques, M. Vanclooster, J. Diels, and J. Feyen. 1996. A stochastic
approach to simulate water flow in a macroporous soil. Geoderma. 10:299-324.
Meyer, P.D., M. Ye, M.L. Rockhold, S.P. Neuman, and K.J. Cantrell. 2007. Combined
estimation of hydrogeologic conceptual model, parameter, and scenario
uncertainty with application to uranium transport at the Hanford Site 300 Area.
Report NUREG/CR-6940, PNNL-16396, prepared for U.S. Nuclear Regulatory
Commission, Washington, DC, USA.
Montazer, P., and W.E. Wilson. 1984. Conceptual hydrologic model of flow in the
unsaturated zone, Yucca Mountain, Nevada. Water Resour. Invest. Rep. 84-4345.
US Geological Survey, Lakewood, Colorado, USA.
Neuman, S.P. 2003. Maximum likelihood Bayesian averaging of alternative conceptual-
mathematical models. Stoch. Environ. Res. Risk Assess. 17(5):291-305, DOI:
10.1007/s00477-003-0151-7.
Nichols, W.E., and M.D. Freshley. 1993. Uncertainty analyses of unsaturated zone travel
time at Yucca Mountain. Ground Water. 31(2):293-301.
Pan, F. 2005. Uncertainty analysis of radionuclide transport in the unsaturated zone at
Yucca Mountain. Master thesis. University of Nevada Las Vegas, Nevada, USA.
Poeter, E.P., and D.A. Anderson. 2005. Multimodel ranking and inference in ground
water modeling. Ground Water. 43(4):597-605.
78

Refsgaard, J.C., J.P. van der Sluijs, J. Brown, and P. van der Keur. 2006. A framework
for dealing with uncertainty due to model structure error. Adv. Water Resour.
29:1586-1597.
Viswanathan, H.S., B.A. Robinson, C.W. Gable, and W.C. Carey. 2003. A geostatistical
modeling study of the effect of heterogeneity on radionuclide transport in the
unsaturated zone, Yucca Mountain. J. Contam. Hydrol. 62-63:319-336.
Winter, C.L., and D.M. Tartakovsky. 2000. Mean flow in composite porous media.
Geophys. Res. Lett. 27(12): 1759-1762.
Winter, C.L., and D.M. Tartakovsky. 2002. Groundwater flow in heterogeneous
composite aquifers. Water Resour. Res. 38(8): 1148, doi: 10.1029/2001WR0004
50.
Winter, C.L., D.M. Tartakovsky, and A. Guadagnini. 2002. Numerical solutions of
moment equations for flow in heterogeneous composite aquifers. Water Resour.
Res. 38(5):doi: 10.1029/2001WR000222.
Winter, C.L., D.M. Tartakovsky, and A. Guadagnini. 2003. Moment differential
equations for flow in highly heterogeneous porous media. Surv. Geophys. 24:81-
106.
Winter, C.L., A. Guadagnini, D. Nychka, and D.M. Tartakovsky. 2006. Multivariate
sensitivity analysis of saturated flow through simulated highly heterogeneous
groundwater aquifers. J. Comput. Phys. 217:166-175.
Wu, Y.S., C. Haukwa, and G.S. Bodvarsson. 1999. A site-scale model for fluid and heat
flow in the unsaturated zone of Yucca Mountain, Nevada. J. Contam. Hydrol.
38:185-215.
79
Wu, Y.S., L. Pan, W. Zhang, and G.S. Bodvarsson. 2002. Characterization of flow and
transport processes within the unsaturated zone of Yucca Mountain, Nevada,
under current and future climates. J. Contam. Hydrol. 54:215-247.
Wu, Y.S., G. Lu, K. Zhang, and G.S. Bodvarsson. 2004. A mountain-scale model for
characterizing unsaturated flow and transport in fractured tuffs of Yucca
Mountain. Vadose Zone J. 3:796-805.
Wu, Y.S., G. Lu, K. Zhang, L. Pan, and G.S. Bodvarsson. 2007. Analysis unsaturated
flow patterns in fractured rock using an integrated modeling approach. Hydrogeol.
J. 15:553-572.
Xiu, D., and D.M. Tartakovsky. 2004. A two-scale nonperturbative approach to
uncertainty analysis of diffusion in random composition. Multiscale Modeling and
Simulation. 24 (4):662-674, DOI. 10.1137/03060268X.
Ye, M., S.P. Neuman, A. Guadagnini, and D.M. Tartakovsky. 2004a. Nonlocal and
localized analyses of conditional mean transient flow in bounded, randomly
heterogeneous porous media. Water Resour. Res. 40:W05104. doi: 10.1029/2003
WR002099.
Ye, M., S.P. Neuman, and P.D. Meyer. 2004b. Maximum Likelihood Bayesian averaging
of spatial variability models in unsaturated fractured tuff. Water Resour. Res.
40:W05113, doi: 10.1029/2003WR002557.
Ye, M., S.P. Neuman, P.D. Meyer, and K.F. Pohlmann. 2005a. Sensitivity analysis and
assessment of prior model probabilities in MLBMA with application to
unsaturated fractured tuff. Water Resour. Res. 4LW12429, doi: 10.1029/2005WR
004260.
80
Ye, M., R. Khaleel, and T-C.J. Yeh. 2005b. Stochastic analysis of moisture plume
dynamics of a field injection experiment. Water Resour. Res. 41:W03013, doi:
10.1029/2004WR003735.
Ye, M., R. Khaleel, M.G. Schaap, and J. Zhu. 2007a. Simulation of field injection
experiments in heterogeneous unsaturated media using cokriging and artificial
neural network. Water Resour. Res. 43:W07413, doi:10.1029/2006WR005030.
Ye, M , F. Pan, Y.S. Wu, B.X. Hu, C. Shirley, and Z. Yu. 2007b. Assessment of
radionuclide transport uncertainty in the unsaturated zone of Yucca Mountain.
Adv. Water Resour. 30:118-134.
Ye, M., P.D. Meyer, and S.P. Neuman. 2008a. On model selection criteria of multimodel
analysis. Water Resour. Res. 44:W03428, doi:10.1029/2008WR006803.
Ye, M., K.F. Pohlmann, and J.B. Chapman. 2008b. Expert elicitation of recharge model
probabilities for the Death Valley regional flow system. J. Hydrol. 354:102-115,
doi:10.1016/j.jhydrol.2008.03.001.
Zhang, K., Y.S. Wu, and J.E. Houseworth. 2006. Sensitivity analysis of hydrological
parameters in modeling flow and transport in the unsaturated zone of Yucca
Mountain. Hydrogeol. J. 14:1599-1619.
Zhou, Q., H.H. Liu, G.S. Bodvarsson, and CM. Oldenburg. 2003. Flow and transport in
unsaturated fractured rock: effects of multiscale heterogeneity of hydrogeologic
properties. J. Contam. Hydrol. 60:1-30.
81

CHAPTER 4
SENSITIVITY OF UNSATRUATED FLOW AND CONTAMINANT TRANSPORT
AND EFFECTS OF INPUT PARAMETER CORRELATIONS
The predictive uncertainties in flow and contaminant transport due to the
parameter uncertainties in layer- and local-scale heterogeneities of hydraulic and
transport parameters have been assessed in Chapter 2 and Chapter 3. The sensitivity
analysis is an important tool to direct future field characterizations to reduce the
parameter uncertainties, which also reduce the associated predictive uncertainties in flow
and contaminant transport in UZ. This study presents an integrated sensitivity analysis
approach to investigate the contributions of input parameter uncertainties to the flow and
contaminant transport uncertainties with and without the consideration of parameter
correlations in each layer and spatial variability within a layer in UZ. In addition, this
study also examines the effects of parameter correlations on sensitivity of flow and
contaminant transport in UZ by comparing the results with and without considering the
parameter correlations.
4.1 Introduction
Uncertainty and sensitivity analysis of flow and contaminant transport due to
parameter uncertainty in UZ is important for evaluating the possible effects of
contaminant sources on the groundwater and environmental systems. The uncertainty
82
analysis is to determine how uncertainty in flow and contaminant transport is derived
from the independent parameter uncertainty (Pan, 2005; Pan et al., 2009b; Ye et al.,
2007b; Zhou et al., 2003). The sensitivity analysis is to determine the contributions of
individual parameter uncertainties to the flow and contaminant transport uncertainties
(Helton, 1993; Saltelli et al., 1999). The sensitivity analysis is indispensable in (1)
reducing computational burden of 3-D flow and transport modeling by disregarding
insignificant parameters, (2) enabling one to utilize limited resources more efficiently on
characterizing the most influential parameters in order to better understand the predictive
uncertainties in flow and transport, and (3) helping design more effective sampling and
monitoring network by improving the accuracy of flow and transport predictions.
When only limited data are available to characterize the spatial variability of
hydraulic parameters in UZ, it may affect the accuracy of parameter uncertainty
characterization and cause the incorrect estimation of predictive uncertainties in flow and
contaminant transport (Ye et al, 2007a). Due to the limited resources, it becomes critical
to obtain the information about the relative importance of hydraulic parameters in
particular layers and the specific locations within the layer in a complex hydrogeologic
system. In this study, layer-scale sensitivity analysis refers to the assessment of relative
importance of hydraulic parameters for each hydrogeologic layer; local-scale sensitivity
analysis refers to the assessment in spatial variability within a layer. This study aims to
obtain the relative importance of hydraulic parameters at both layer- and local- scales. In
addition, the hydraulic parameters often exhibit correlations for typical field conditions,
however, the assumption of parameter independence was adopted in most existing
sensitivity analysis methods (Arnold et al., 2008; Fang et al., 2004; Sallaberry et al.,
83

2008). Therefore, another purpose of this study is to incorporate the parameter
correlations into the sensitivity analysis and investigate their effects on sensitivity results.
Many methods of sensitivity analysis have been developed such as sampling-
based method, variance-based method, differential analysis, fast probability integration,
response surface methodology, analysis of variance (ANOVA) (Helton, 1993; Helton, et
al., 2005, 2006; Saltelli et al., 1999, 2000; Winter et al., 2006). Among them, the
sampling-based (i.e., Monte Carlo) method has been widely applied due to its conceptual
simplicity, full range coverage of parameter measurements, direct uncertainty results
without using surrogate models, easy mapping between uncertainty inputs and analysis
results (Helton, 1993). The sampling-based sensitivity analysis can be implemented using
scatterplots, regression analysis, correlation and partial correlation between inputs and
results, and stepwise regression analysis (Helton et al., 2005, 2006; Saltelli et al., 2000).
Because the sampling-based method employs linear regression techniques, the rank
transformation is a preferred way when the relationship between the parameter inputs and
analysis results is nonlinear (Saltelli and Sobol, 1995). Comparison of those sampling-
based methods in a design of disposal facility example indicated that the standardized
rank regression coefficient (SRRC) is the most robust and reliable estimator (Helton and
Davis, 2002; Saltelli and Marivoet, 1990). The SRRC from regression analysis provides a
measure of parameter importance on output uncertainty. When the input parameters are
correlated, however, SRRC may give unreliable results on parameter importance (Helton
et al, 2006). Given the fact that hydraulic parameters often exhibit correlations for typical
field conditions, it is desirable to incorporate the parameter correlations into the
sensitivity analysis and investigate the effects of parameter correlations on the results of
84

sensitivity analysis. Several studies have been conducted for sensitivity analysis with
correlated input parameters (Fang et al., 2004; Helton et al., 1995, Jacques et al., 2006).
Recently, Xu and Gertner (2008) proposed a regression-based method to divide the
contributions of individual parameter uncertainties into the correlated and uncorrelated
parts to the output uncertainties. The contributions of input parameter uncertainties to
flow and transport uncertainties can be estimated by the total partial variances of the
output results.
The study site is the UZ of YM, which has been proposed as the high-level
radioactive waste repository (BSC, 2004a). The UZ of YM is a complex system in
geology and hydrogeology subject to significant parameter uncertainty and other
uncertainties (Pan et al., 2009a, b; Ye et al., 2007b; Zhang et al., 2006; Zhou et al., 2003).
The available measurements of hydraulic parameters are limited in each hydrogeologic
layer of the UZ, especially for permeability and water retention parameters.
The sensitivity of the flow and tracer transport at YM has been investigated by
several studies. Zhang et al. (2006) examined the sensitivity of unsaturated flow and
tracer transport with only one varied input parameter within one standard deviation at a
time in the UZ of YM. The sensitivity analysis has been conducted using the sampling-
based method in saturated zone processes with the assumption of parameter
independence (Sallaberry et al., 2008; Arnold et al., 2008). This study is focused on the
global sensitivity analysis of individual parameter uncertainties on the predictive
uncertainties of flow and tracer transport in the UZ of YM. Although the parameter
correlations exist in a real field, capturing the correlations is difficult when the site
measurements are sparse. This study employs an integrated approach to evaluate the
85

contributions of individual parameters to flow and transport uncertainties with and
without parameter correlations at layer- and local- scales. The results can provide useful
information in these two scales in directing future data sampling for uncertainty
reductions. The sensitivity analysis in this study is evaluated based on the results of
uncertainty assessment due to the uncertainties of hydraulic and transport parameters
(i.e., permeability, porosity, van Genuchten a and n, and sorption coefficient of the
reactive tracer) in the UZ of YM in Pan et al. (2009b) (i.e., Chapter 2).
Another objective of this study is to evaluate the relative importance of hydraulic
parameters on predictive uncertainty with correlated input parameters using regression-
based method proposed by Xu and Gertner (2008) and to investigate the effects of
parameter correlations on the sensitivity analysis results. Understanding the effects of
parameter correlations is also important for directing further data collection and
predictive uncertainty reductions. The parameter correlation effects have not been
examined in previous sensitivity analysis of flow and transport (e.g., Arnold et al., 2008;
Boateng and Cawlfield, 1999; Mertens, et al., 2005; Sallaberry et al., 2008). The effects
of parameter correlations on sensitivity of flow and transport in the UZ of YM can be
evaluated by comparing sensitivity results with and without consideration of parameter
correlations.
4.2 Sampling-based Sensitivity Analysis
This study presents an integrated approach to conduct the sensitivity of flow and
contaminant transport with and without considering the input parameter correlations. The
approach is based on the sampling-based approach (i.e, regression analysis for
86

independent parameters, and regression-based method proposed by Xu and Gertner
(2008) for correlated parameters). The procedures of sampling-based approach can be
described as follows (Helton, 1993; Helton et al., 2005):
(1) Determine the distributions and ranges of individual parameters based on the site
measurements;
(2) Generate the random field of each parameter based on the specified distributions
and ranges estimated in step (1);
(3) Solve the flow and transport models using Monte Carlo simulations for multiple
realizations;
(4) Evaluate the uncertainties of output parameters (e.g., saturation, water potential,
percolation flux, mass fraction and travel time of tracer transport etc.);
(5) Conduct the sensitivity analysis to rank the relative importance of the individual
parameters to the uncertainties of output variables.
4.2.1 Regression Analysis
The regression analysis is an effective method to measure the contributions of
individual input parameters to the output uncertainties when the input parameters are
independent.
The regression model between the output results (e.g., percolation flux and
cumulative mass arriving at water table; m = 200 , number of realizations) and input
parameters (i.e., permeability, porosity, van Genuchten a and n, and sorption coefficient
of the reactive tracer; k = 5 , number of input parameters) for each block can be
constructed as (Helton, 1993):
9i=bo + yEbjxij+£i' i = U , - / n , 7 = 1 ,2 , -* (4.1)
87
where: yt is the estimation of output yt from regression model; b0,bjare the regression
coefficients of parameter j ; ei is the error term.
The total variance (V) of output results can be calculated as:
1 m
V = var(v) = T ( ^ - y ) 2 (4.2) m-1 i=l
where: y is the mean of output results.
The estimated variance (V) of output results by regression model can be written
as (Helton et al., 2006; Xu and Gertner, 2008):
1 m
V = vai(y) = -Yth-yf (4.3) m - 1 ,=1
If the input parameters are independent, Eq. (4.3) can be formulated by taking the
variance on both sides of Eq. (4.1): k
V = var(j) = ]T b) var(*.) (4.4) 7=1
The coefficient of determination (R2) is usually applied to measure the extent of
regression model successfully accounting for the output uncertainty. It can be expressed
as (Helton, 1993; Helton, et al., 2006; Saltelli et al., 2000):
9 V R2=- (4.5)
V
The regression coefficients (bj) in Eq. (4.1) are unknown and fixed for all
realizations and can be solved using the LS regression method (Helton, 1993; Saltelli et
al., 2000). Due to the different units of input parameters and output results, the regression
coefficient ( bj ) is not suitable to measure the parameter importance in output
88

uncertainties. The standardized regression model can be reformulated as (Helton et al.,
2006; Saltelli et al., 2000):
(y-y)/s = YibjSj /s)(Xj -x})ls} (4.6)
where x., Sj are the mean and standard deviation of the input parameter xf, y, s are the
mean and standard deviation of the output results. The coefficient bjSj/s , called
standardized regression coefficient (SRC), is used as a measure of parameter importance.
The parameter with largest SRC contributes the most to the output uncertainties. By
combining Eqs. (4.4), (4.5), and (4.6), the R2 can be expressed as:
R2 =^SRC2 • (4.7)
The SRC2 represents the fractional contributions of parameter j to the output variances.
If the relationships between the input parameters and output results are nonlinear,
the regression analysis discussed above may not provide accurate estimations because it
is based on the linear relationships between the input parameters and the output variables.
The problem can be solved using the rank regression, which is a method similar to the
regression analysis. The only difference is that the data used in the usual regression are
transformed to their corresponding ranks. Correspondingly, the resulting regression
coefficients are called the standardized rank regression coefficients (SRRC).
4.2.2 Regression-based Method with Correlated Parameters
As pointed out by Saltelli et al. (2000) and Helton et al. (2006), the SRC and
SRRC may be misleading in measuring the parameter importance if the input parameters
are correlated. A regression-based approach was proposed by Xu and Gertner (2008) to
89

decompose the output variances into the partial variances contributed by the correlated
and uncorrelated portions when the input parameters are correlated. Because the
regression-based method proposed by Xu and Gartner (2008) is also based on the linear
relationships between the input parameters and the output variables, the original values
are also transformed to their corresponding ranks in this study.
The partial variance (V ;) contributed by parameter x. is divided into partial
variance contributed by uncorrelated and correlated variances of parameter x. ,
respectively. The partial variance by parameter x. can be written as (Xu and Gertner,
2008):
Vj =V</+VJC (4.8)
where: Vf is partial variance contributed by uncorrelated variance of parameter JC. ; Vf is
partial variance contributed by correlated variance of parameter x..
The partial variance of y contributed by *. can be estimated by the regression
analysis (Xu and Gertner, 2008):
1 m
y = 0o+ajXj+£ and V,= -^Z(yt-y)2 (4-9)
The partial variance contributed by the uncorrelated variance of x. can be derived
from the following regression models (Xu and Gertner, 2008):
1 m
f=r0 + rjz+£ a n d V / = -%<$?-y)2 (4.10)
k
where: £. = Xj —Xj and Xj =cQ+ ^cpxp . P=\
90
The partial variance contributed by the variation of Xj correlated with other
parameters can be calculated using Eq. (4.8):
V}c =Vj -Vf (4.11)
The sensitivity indices (ratios of partial variance and total variance, V) of each
parameter can be described as:
V Vu Vc
Sj=^; S1; = - 4 - ; S,c = -4 - (4.12) J V V V
where: Sj, S^, and 5yc are total, uncorrected, and correlated partial sensitivity indices
of parameter JC ..
If the relationship between the input parameters and output results is linear,
Vj7 can be represented as the conditional variance of one parameter given another
parameter:
V" = (1 - r2)b] var(xy) (4.13)
where: r is the parameter correlation between two the input parameters.
Combine Eq. (4.7) with Eq. (4.12), the relationship between the SRRC and
uncorrected S of parameter Xj can be described as:
Su. =(l-r2)SRRCj2 (4.14)
4.3 Sensitivity Analysis of Flow and Contaminant Transport
The permeability and water retention parameters (van Genuchten a and n) are
treated as homogenous random parameters in flow simulation and two other uncertain
parameters (porosity and Kd of Np) are incorporated into transport simulation. The
91
regression models are constructed to estimate the sensitivity coefficients (i.e., SRRC2 for
independent parameters, and S for correlated parameters) for each block. Then, the mean
of SRRC or S over all blocks within a layer is calculated as the measure of parameter
importance to the flow and transport uncertainties for the layer. The standard deviation of
SRRC or S is used to measure the spatial variation of sensitivity coefficients within a
layer.
4.3.1 S ensitivity of Uns aturated Flow
4.3.1.1 Sensitivity of Unsaturated Flow with Independent Parameters
The R is firstly used to examine the reliability of the regression analysis. The R
has the values larger than 0.8 in more than 80% blocks of the domain (Figures 4.1a and
4.2d), indicating that the regression analysis is generally reliable.
Figure 4.1 shows the mean and standard deviation of SRRC2 for the permeability,
van Genuchten a, and n parameters to the percolation flux uncertainty for each
hydrogeologic layer. Note that SRRC value for a parameter represents the relative
fractional contribution to the output variance from this parameter's uncertainty. The R2
value for each layer is equal to the summation of SRRC2 values for the three hydraulic
parameters, validating Eq. (4.7). From the comparison of mean SRRC2 values for the
three parameters at each layer, the mean SRRC2 values for the permeability are the
largest for most layers, indicating the parameter uncertainty in permeability has the
largest contribution to the percolation flux uncertainty for those layers. The contributions
of parameter uncertainty in permeability to the flux uncertainty vary with the layers from
20% to 80%. The mean SRRC2 values of van Genuchten a are the second largest in most
layers in the range of 0 - 40% contributions to the flux uncertainty for different layers.
92
The mean of SRRCZ for van Genuchten n parameter is close to zero for all layers,
indicating the limited contributions of its uncertainty to the flux uncertainty. The order of
parameter importance to flux uncertainty is generally permeability, van Genchten a and n
from the most to least important parameters for most layers. This is partly caused by the
values of parameter uncertainties in these parameters (Figure 5 in Ye et al. (2007b) for
permeability and Table 2.1 for water retention parameters). The standard deviation of
9 9
SRRC values for each layer (Figure 4.1b) shows the large standard deviation of SRRC
values for permeability and van Genuchten a, indicating the high variability of SRRC2
values within the layers. This is partly due to the percolation flux uncertainty is related to
not only the input parameter uncertainty at its location but also the parameters at other
locations, especially those above it. Therefore, it is also necessary to investigate the
spatial distribution of the sensitivity coefficients on unsaturated flow uncertainty within
each layer.
Figure 4.2 describes the spatial distribution of SRRC values for the permeability,
van Genuchten a, and n parameters on the percolation flux uncertainty and R of
regression analysis at the proposed repository horizon. Figure 4.3 does the same at the
water table. The large R values (Figure 4.2d) indicate reliable regression analysis in
general. The SRRC values for the permeability are largest in the east and west parts of
model domain and are approximately equal or smaller than the ones for van Genuchten a
in the repository area (blue dots in Figure 1.2). The SRRC2 values of van Genuchten n are
close to zero in the entire domain. It indicates the flux uncertainty at the repository
horizon is largely contributed by the parameter uncertainties in permeability and van
Genuchten a which is consistent with the results of layer-scale results (Figure 4.1a). The
93
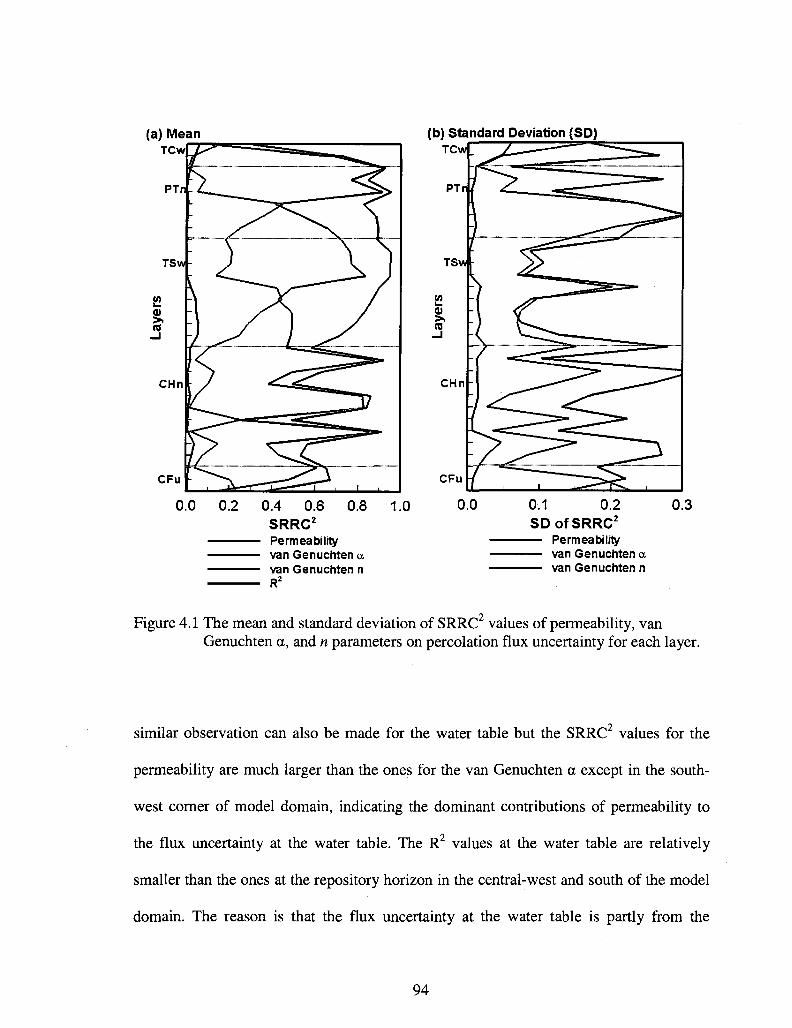
(a) Mean TCw
PTr
TSw
(0 L. 0) > C0
_l
CHn
u .
/
CFuf^*^\ <^13
0.0 0.2 0.4 0.6 SRRC2
- Permeability - van Genuchten a • van Genuchten n
0.8 1.0
(b) Standard Deviation (SD)
TCw
PT
TSw •
I CHn -
CFu
0.1 0.2 SD of SRRC2
— Permeability — van Genuchten a — van Genuchten n
0.3
Figure 4.1 The mean and standard deviation of SRRC values of permeability, van Genuchten a, and n parameters on percolation flux uncertainty for each layer.
similar observation can also be made for the water table but the SRRC values for the
permeability are much larger than the ones for the van Genuchten a except in the south
west corner of model domain, indicating the dominant contributions of permeability to
the flux uncertainty at the water table. The R2 values at the water table are relatively
smaller than the ones at the repository horizon in the central-west and south of the model
domain. The reason is that the flux uncertainty at the water table is partly from the
94
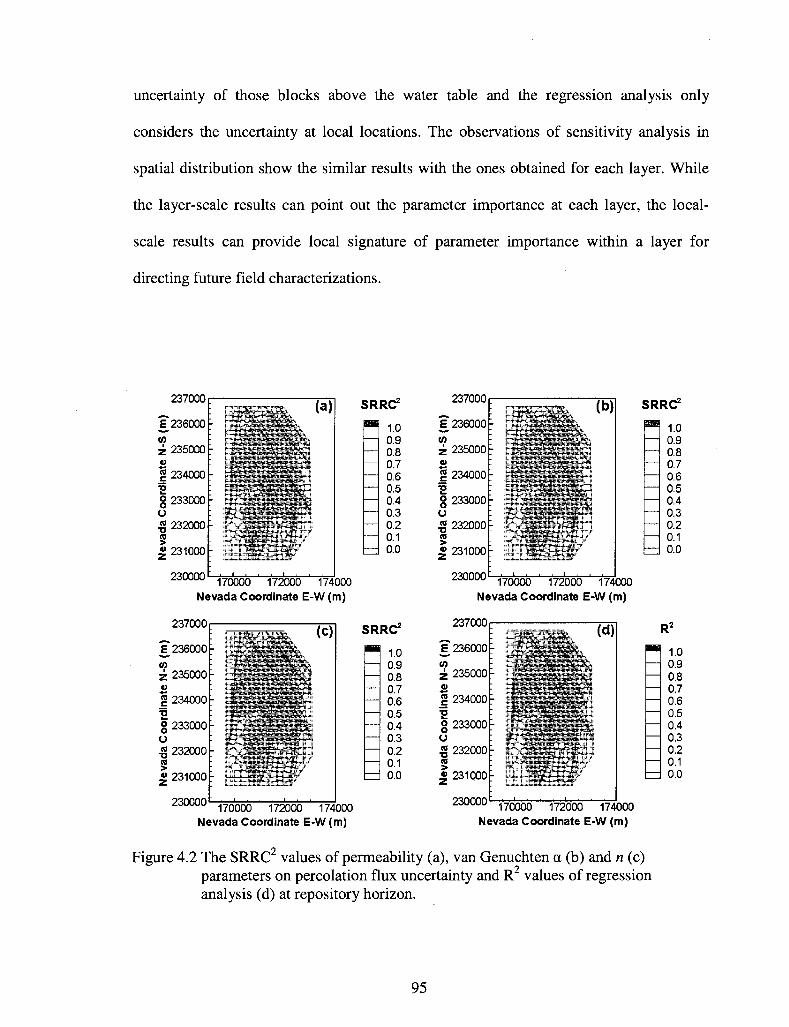
uncertainty of those blocks above the water table and the regression analysis only
considers the uncertainty at local locations. The observations of sensitivity analysis in
spatial distribution show the similar results with the ones obtained for each layer. While
the layer-scale results can point out the parameter importance at each layer, the local-
scale results can provide local signature of parameter importance within a layer for
directing future field characterizations.
237000
: 235000
I 234000 •2 g 233000 (J « 232000 5 "J 231000
SRRC2
1.0 0.9 0.8 0.7 0.6 0.5 0.4 0.3 0.2 0.1 0.0
230000 170000 172000 174000 Nevada Coordinate E-W (m)
237000 SRRC2
1.0 0.9 0.8 0.7 0.6 0.5 0.4 0.3 0.2 0.1 0.0
230000
ZOIUUU
£236000 if)
2 235000 4>
| 234000 •2 g 233000
™ 232000 (0
| 231000
•yjnnnn
, , i ,
\»i
• . i , , , i , . ,
SRRC2
1.0 0.9 0.8 0.7 0.6 0.5 0.4 0.3 0.2 0.1 0.0
170000 172000 174000 Nevada Coordinate E-W (m)
237000
E 236000 r eo
235000-z 4)
1 234000
g 233000t (J ™ 232000 |j
| 231000
170000 172000 174000 Nevada Coordinate E-W (m)
230000
.
11
1 I
I 1
11
I 1
11
1 I
I 1
11
11
1 ]
11
1 1
11
11
;
(d) 1.0 0.9 0.8 0.7 0.6 0.5 0.4 0.3 0.2 0.1 0.0
170000 172000 174000 Nevada Coordinate E-W (m)
Figure 4.2 The SRRC values of permeability (a), van Genuchten a (b) and n (c) parameters on percolation flux uncertainty and R2 values of regression analysis (d) at repository horizon.
95
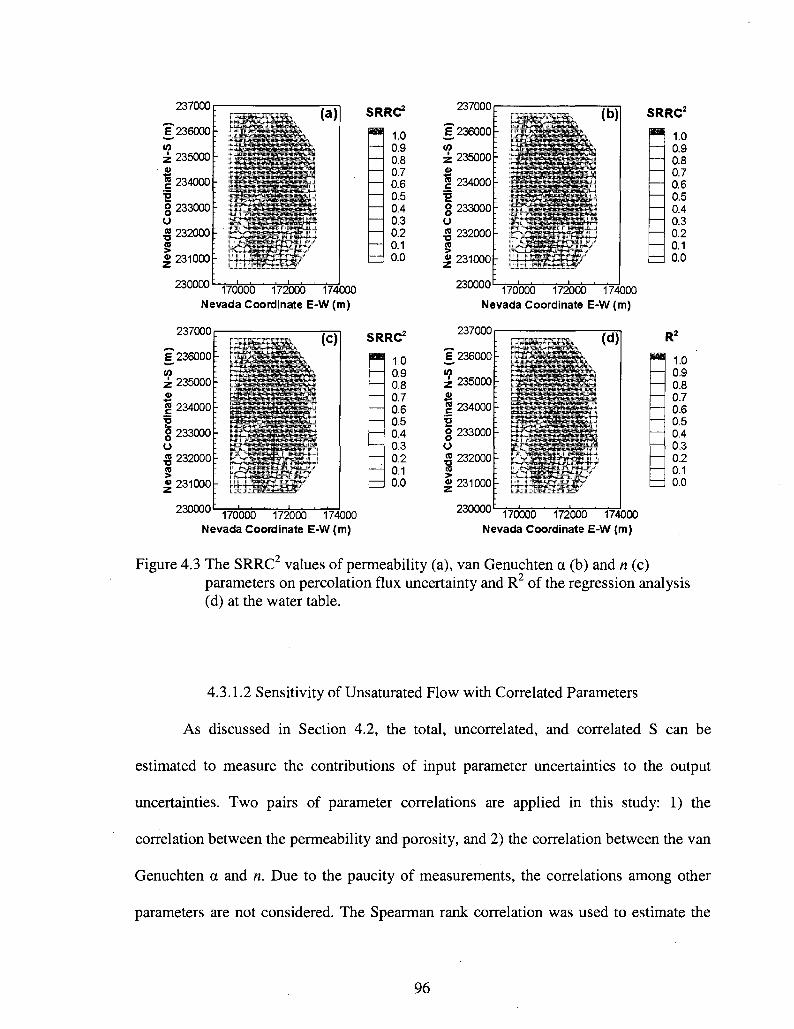
237000 SRRC2 237000
—
—
1.0 0.9 0.8 0.7 0.6 0.5 0.4 0.3 0.2 0.1 0.0
E 236000
Z 235000
1 234000
id
§ 233000 O « 232000
I 231000
230000 170000 172000 174000 Nevada Coordinate E-W (m)
237000
E 236000;
w • 235000 r
<S 234000 E
g 233000 O « 232000f
« 231000
230000
. ' '
' I I
•
(c) SRRC 2
1.0 0.9 0.8 0.7 0.6 0.5 0.4 0.3 0.2 0.1 0.0
170000 172000 174000 Nevada Coordinate E-W (m)
230000
SRRC 2
170000 172000 174000 Nevada Coordinate E-W (m)
237000
230000 170000 172000 174000 Nevada Coordinate E-W (m)
mm 1.0 0.9 0.8 0.7 0.6 0.5 0.4 0.3 0.2 0.1 0.0
1.0 0.9 0.8 0.7 0.6 0.5 0.4 0.3 0.2 0.1 0.0
Figure 4.3 The SRRC values of permeability (a), van Genuchten a (b) and n (c) parameters on percolation flux uncertainty and R2 of the regression analysis (d) at the water table.
4.3.1.2 Sensitivity of Unsaturated Flow with Correlated Parameters
As discussed in Section 4.2, the total, uncorrelated, and correlated S can be
estimated to measure the contributions of input parameter uncertainties to the output
uncertainties. Two pairs of parameter correlations are applied in this study: 1) the
correlation between the permeability and porosity, and 2) the correlation between the van
Genuchten a and n. Due to the paucity of measurements, the correlations among other
parameters are not considered. The Spearman rank correlation was used to estimate the
96
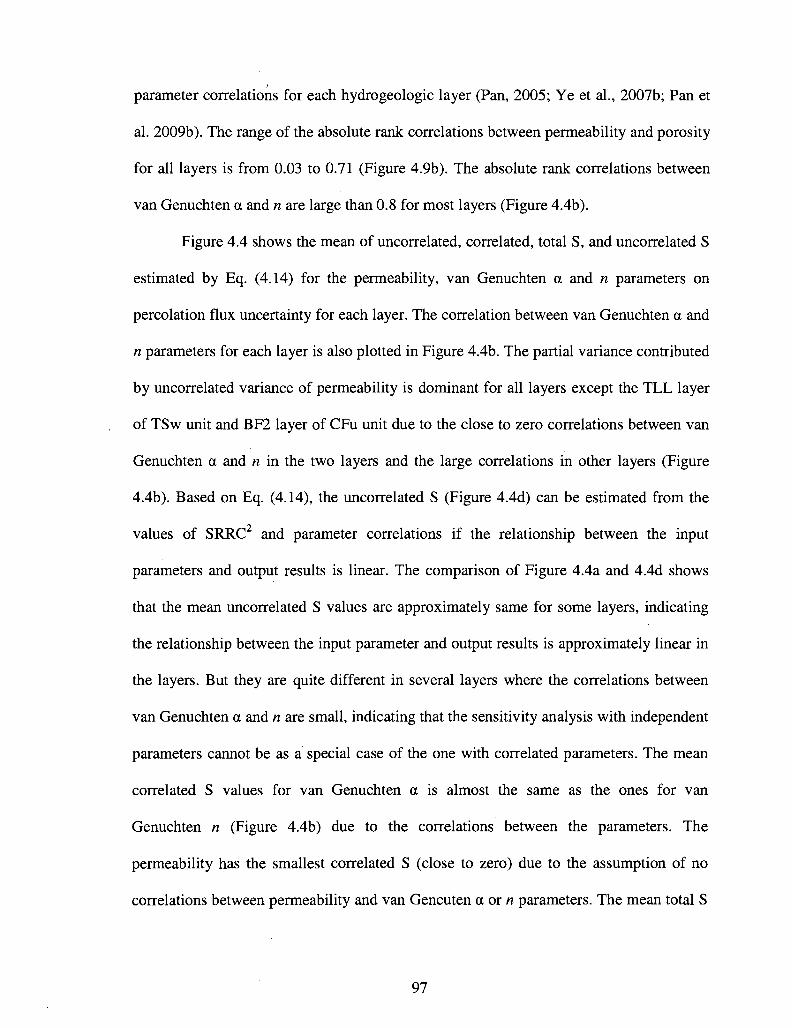
parameter correlations for each hydrogeologic layer (Pan, 2005; Ye et al., 2007b; Pan et
al. 2009b). The range of the absolute rank correlations between permeability and porosity
for all layers is from 0.03 to 0.71 (Figure 4.9b). The absolute rank correlations between
van Genuchten a and n are large than 0.8 for most layers (Figure 4.4b).
Figure 4.4 shows the mean of uncorrelated, correlated, total S, and uncorrelated S
estimated by Eq. (4.14) for the permeability, van Genuchten a and n parameters on
percolation flux uncertainty for each layer. The correlation between van Genuchten a and
n parameters for each layer is also plotted in Figure 4.4b. The partial variance contributed
by uncorrelated variance of permeability is dominant for all layers except the TLL layer
of TSw unit and BF2 layer of CFu unit due to the close to zero correlations between van
Genuchten a and n in the two layers and the large correlations in other layers (Figure
4.4b). Based on Eq. (4.14), the uncorrelated S (Figure 4.4d) can be estimated from the
values of SRRC and parameter correlations if the relationship between the input
parameters and output results is linear. The comparison of Figure 4.4a and 4.4d shows
that the mean uncorrelated S values are approximately same for some layers, indicating
the relationship between the input parameter and output results is approximately linear in
the layers. But they are quite different in several layers where the correlations between
van Genuchten a and n are small, indicating that the sensitivity analysis with independent
parameters cannot be as a special case of the one with correlated parameters. The mean
correlated S values for van Genuchten a is almost the same as the ones for van
Genuchten n (Figure 4.4b) due to the correlations between the parameters. The
permeability has the smallest correlated S (close to zero) due to the assumption of no
correlations between permeability and van Gencuten a or n parameters. The mean total S
97
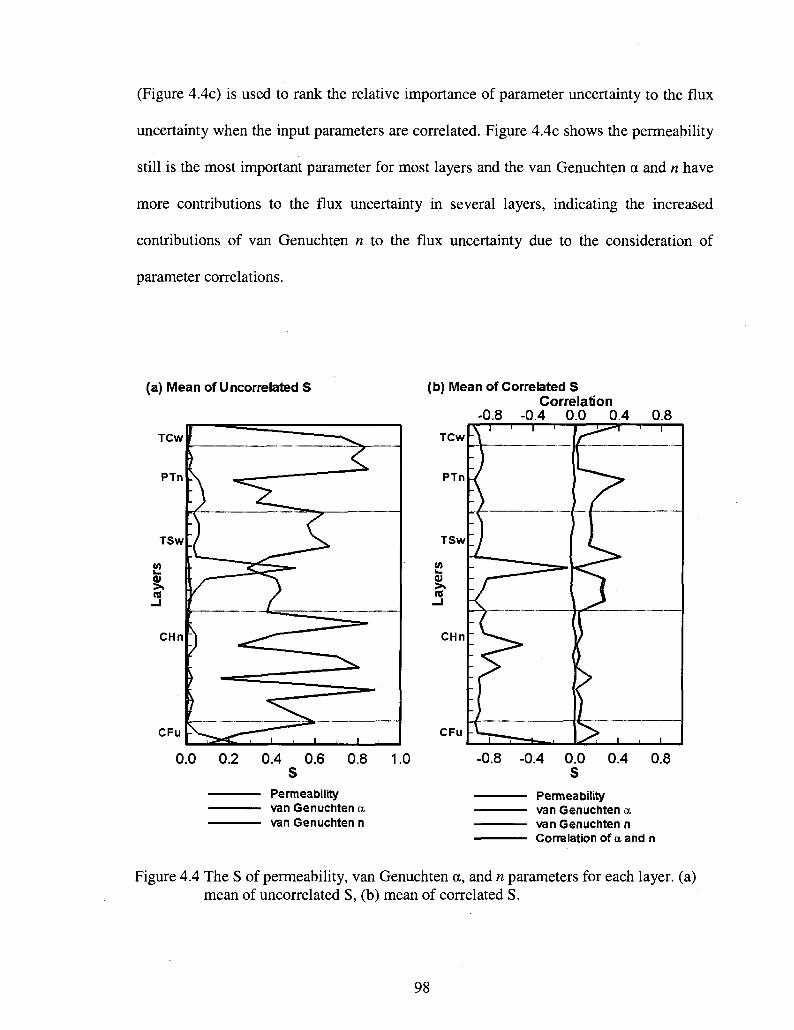
(Figure 4.4c) is used to rank the relative importance of parameter uncertainty to the flux
uncertainty when the input parameters are correlated. Figure 4.4c shows the permeability
still is the most important parameter for most layers and the van Genuchten a and n have
more contributions to the flux uncertainty in several layers, indicating the increased
contributions of van Genuchten n to the flux uncertainty due to the consideration of
parameter correlations.
(a) Mean of Uncorrelated S
TCW
PTn
TSw
!
CHn
CFu -
Permeability van Genuchten a van Genuchten n
(b) Mean of Correlated S Correlation
-0.8 -0.4 0.0 0.4 0.8 T r
TCwh
PTn
TSw
I CHn
CFu
Permeability van Genuchten a van Genuchten n Correlation of a and n
Figure 4.4 The S of permeability, van Genuchten a, and n parameters for each layer, (a) mean of uncorrelated S, (b) mean of correlated S.
98

(c) Mean of Total S TCw
(d) Mean of Calcuated Uncorrelated S
0.0 0.2 0.4 0.6 0.8
Permeability van Genuchten a van Genuchten n
TCw "
0.0 0.2 0.4 0.6 0.8 1.0
Permeability van Genuchten a van Genuchten n
Figure 4.4 (Cont.) The S of permeability, van Genuchten a, and n parameters for each layer, (c) mean of total S, and (d) mean of uncorrelated S estimated by Eq. (4.14).
Figure 4.5 depicts the spatial distribution of total S for the permeability, van
Genucten a and n on percolation flux uncertainty at the water table. The total partial
variance of permeability is the largest for almost the entire domain but the west portion,
where the van Genuchten a has more contribution to the flux uncertainty. The van
Genuchten n has relatively large contributions in the south part of Solitario Canyon Fault
(Figure 1.2) with large total S for van Genuchten a in the area, due to the correlations
between the two parameters.
99

237000
£236000
w z 235000 4>
§234000
rd
g 233000 O ^ 232000 § «• 231000
230000
gigggEk (a)
i ^ ^ ^ ^ ^ ^ ^ ^
M~T~HrTP*+-4rVV
S
1.0 09 0.8 0./ U.b 0.5 0.4 0.3 0.2 0.1 nn
170000 172000 174000 Nevada Coordinate E-W (m)
237000 • — .
E 236000 in z 235000
£ 234000
rd
§ 233000 O « 232000 re > « 231000
230000
Nc
;
'-•
7
. 7
Milk (C)
t^CESeSl-tffieSpiswM/
s C Q ^ ^ ^ ^ & ^ f l ^ K /
M—r Hnl^+^tv^v' '
170000 172000 174 sva da Coordinate E -W(
S
— — —
—
1.0 0 9 0.8 0.7 0.6 0.5 0.4 0.3 0.2 0.1 n n
'••'"'
000 Tl)
237000
? 2360001:
z 235000
£ 234000
I g 233000 <J « 232000 a I 231000
230000
.
11
I I
I 1
1 I
I 1
11
I I
I 1
1 1
1 I
11
1 1
I 1
I 1
1
; ' •
(b)
170000 172000 174000
Nevada Coordinate E-W (m)
1.0 0.9 0.8 0.7 0.6 0.5 0.4 0.3 0.2 0.1 0.0
Figure 4.5 The total S of permeability (a), van Genuchten a (b), and n (c) parameters on percolation flux uncertainty at the water table.
4.3.1.3 Effect of Parameter Correlation on Sensitivity of Unsaturated Flow
The effects of parameter correlations on sensitivity analysis are examined by
comparing the sensitivity results with and without the consideration of parameter
correlations at both layer and local scales discussed above.
The mean values of correlated S for van Genuchten a and n have the same trend
as the absolute values of the correlations between van Genuchten a and n for all layers
(Figure 4.4b), indicating that the partial variances contributed by the correlated input
parameters largely depend the parameter correlations. The comparison of the mean
100

SRRC2 (Figure 4.1a) and mean total S (Figure 4.4c) shows the SRRC2 values are less
than the total S for the permeability in most layers but reverse is true for the van
Genuchten n parameter, indicating that the importance of permeability decreases and the
van Genuchten n becomes more important when the parameter correlations are
considered.
4.3.2 Sensitivity of Contaminant Transport
Two variables are the focus of contaminant transport sensitivity analysis in this
study: normalized cumulative mass arrival at each block and cumulative mass travel time.
The normalized cumulative mass arrival at each block is an important variable in
evaluating the potential locations of high-radionuclide concentration and migration. The
cumulative mass travel time is the radionuclide travel time from the proposed repository
horizon to the water table, which represents a measure of the overall tracer transport. The
five random parameters (permeability, porosity, van Genuchten a and n, and Kd of 237Np)
are used in investigating their contributions to the contaminant transport uncertainty.
4.3.2.1 Sensitivity of Contaminant Transport with Independent Parameters
Figure 4.6 depicts the mean and standard deviation of SRRC values for the five
random parameters on the normalized cumulative mass arrival uncertainty of Np after
1,000,000 years in the layers below the repository horizon. The mean SRRC2 values for
the permeability are larger than the ones for other parameters in most layers. As noted
earlier that the permeability also contributes the most to flow uncertainty, the results
illustrate that the flow uncertainty also translates to uncertainty in tracer transport. The
Kd of Np has the second largest contributions to the tracer transport uncertainties in the
layers with zeolitic and devitrified tuffs but is the smallest in the layers with vitric tuff,
101
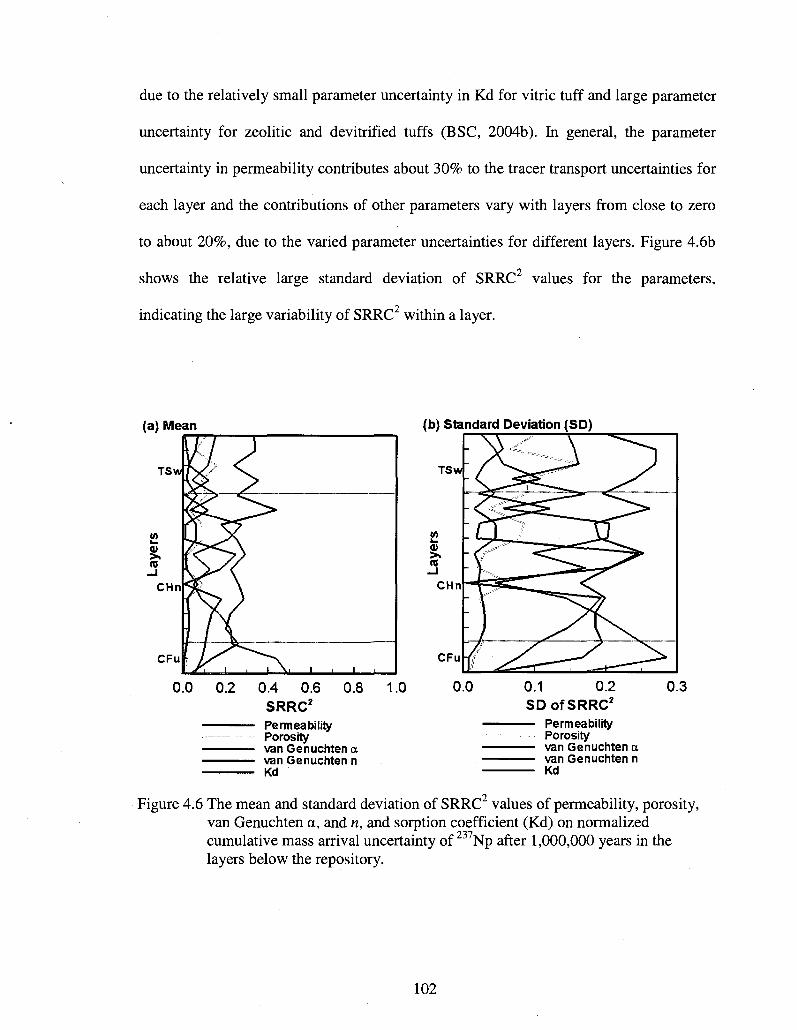
due to the relatively small parameter uncertainty in Kd for vitric tuff and large parameter
uncertainty for zeolitic and devitrified tuffs (BSC, 2004b). In general, the parameter
uncertainty in permeability contributes about 30% to the tracer transport uncertainties for
each layer and the contributions of other parameters vary with layers from close to zero
to about 20%, due to the varied parameter uncertainties for different layers. Figure 4.6b
shows the relative large standard deviation of SRRC values for the parameters,
indicating the large variability of SRRC2 within a layer.
(a) Mean (b) Standard Deviation (SD)
TSw
I CHn
CFu :
0.4 0.6 SRRC2
' Permeability Porosity
' van Genuchten a • van Genuchten n
Kd
TSw
<U
>> (0
CHn
CFu
0.1 0.2 SD of SRRC2
Permeability Porosity van Genuchten a van Genuchten n Kd
0.3
Figure 4.6 The mean and standard deviation of SRRC values of permeability, porosity, van Genuchten a, and n, and sorption coefficient (Kd) on normalized cumulative mass arrival uncertainty of 237Np after 1,000,000 years in the layers below the repository.
102

Figure 4.7 shows the spatial distribution of SRRC2 values for the five random
parameters on the normalized cumulative mass arrival uncertainty of 237Np at all blocks
of the water table after 1,000,000 years. The SRRC2 values for the permeability is the
largest in the footprint of the potential repository and east of model domain and the van
Genuchten a has more contributions than others in the south of model domain. This is
consistent with the sensitivity results of flow, indicating the tracer transport uncertainty
largely comes from the flow uncertainty. The SRRC values for the Kd parameter are the
largest only in the corner and the contributions of the van Genuchten n and porosity to the
transport uncertainty are small in the entire model domain. The results can clearly give
the spatial distribution of parameter importance to provide the detail information for the
future data sampling within a layer. For example, the data collection for permeability
should be taken in the footprint of potential repository and east of model domain to
reduce its parameter uncertainty and associated predictive uncertainty in tracer transport
inUZ.
Figure 4.8 shows the SRRC2 values of the five uncertain parameters for travel
time uncertainty of Np. At early stage, the permeability and van Genuchten a have
more contributions to the uncertainty in overall tracer transport, similar to the flow
scenario. This observation may be explained in part by the fact that for tracer's early
arrival at the water table is mainly along the flow paths with large permeability. As time
evolves, the porosity starts to make impact on the uncertainty in the overall tracer
transport. After 10,000 years, the SRRC values for the sorption coefficient are larger
than other parameters. This is because 80% of mass has arrived at the water table if the
tracer is conservative without sorption at 10,000 years (Pan et al., 2009b) and the sorption
103
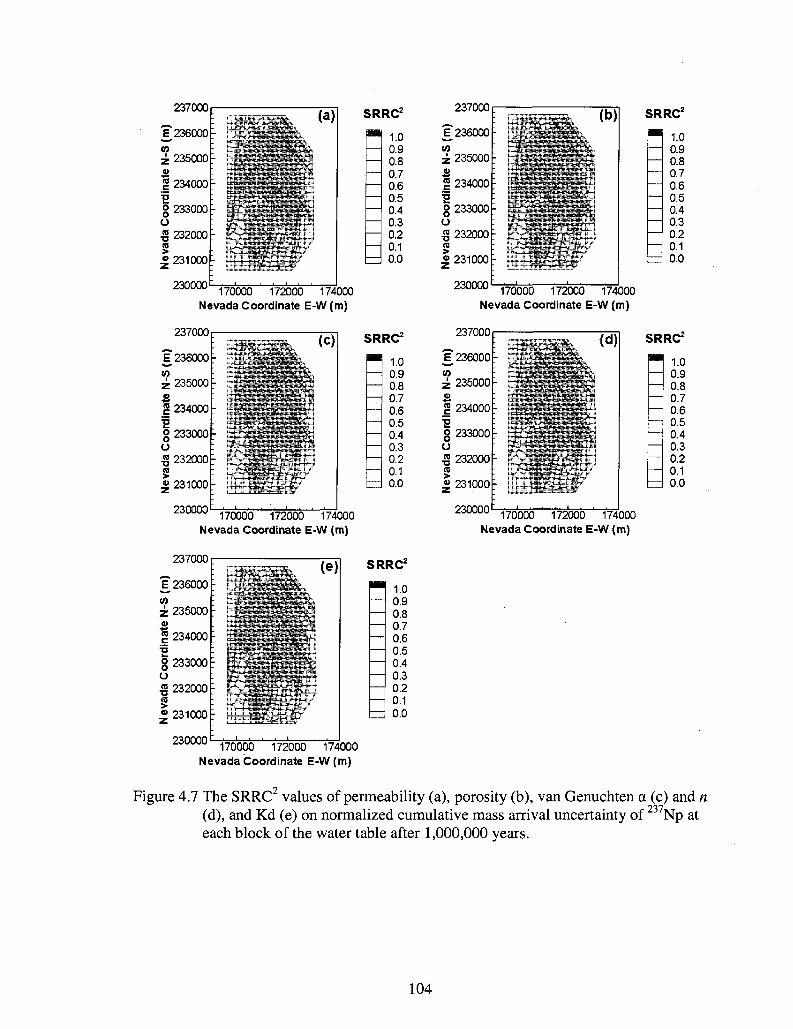
4.0IUVU
£236000 « 2 235000
2 234000
g 233000
.§232000 > » 231000
•yznnrm
. -_
i 1
1 i
i
(a) SRRC2
1.0 0.9 0.8 0.7 0.6 0.5 0.4 0.3 0.2 0.1 0.0
"~ 170000 172000 174000 Nevada Coordinate E-W (m)
237000
£ 236000 -
§ 232000 CO
| 231000
SRRC2
1.0 0.9 0.8 0.7 0.6 0.5 0.4 0.3 0.2 0.1 0.0
230000 170000 172000 174000 Nevada Coordinate E-W (m)
237000
£ 236000E
z 2350001 -̂H £ 234000E S g 233000 O £ 232000E
5 « 231000
230000
.
:
T^wawiErivv
1 . . . 1 .
(c) SRRC2
1.0 0.9 0.8 0.7 0.6 0.5 0.4 0.3 0.2 0.1 0.0
zo/uuu
£ 236000
2 235000 0)
1 234000 •s g 233000 o £ 232000
| 231000
iirinnri
. -
i 1
1 i
(d)
. i . , . i .
SRRC2
1.0 0.9 0.8 0.7 0.6 0.5 0.4 0.3 0.2 0.1 0.0
170000 172000 174000 Nevada Coordinate E-W (m)
170000 172000 174000 Nevada Coordinate E-W (m)
ZOIVUU
£236000
(0 z 235000 o | 234000 •g g 233000 O « 232000 m
£ 231000
o-jnnnn
~^^^^^^t\
(e)
*
SRRC2
1.0 0.9 0.8 0.7 0.6 0.5 0.4 0.3 0.2 0.1 0.0
~" 170000 172000 174000 Nevada Coordinate E-W (m)
ure 4.7 The SRRC values of permeability (a), porosity (b), van Genuchten a (c) and n (d), and Kd (e) on normalized cumulative mass arrival uncertainty of each block of the water table after 1,000,000 years.
237 Npat
104
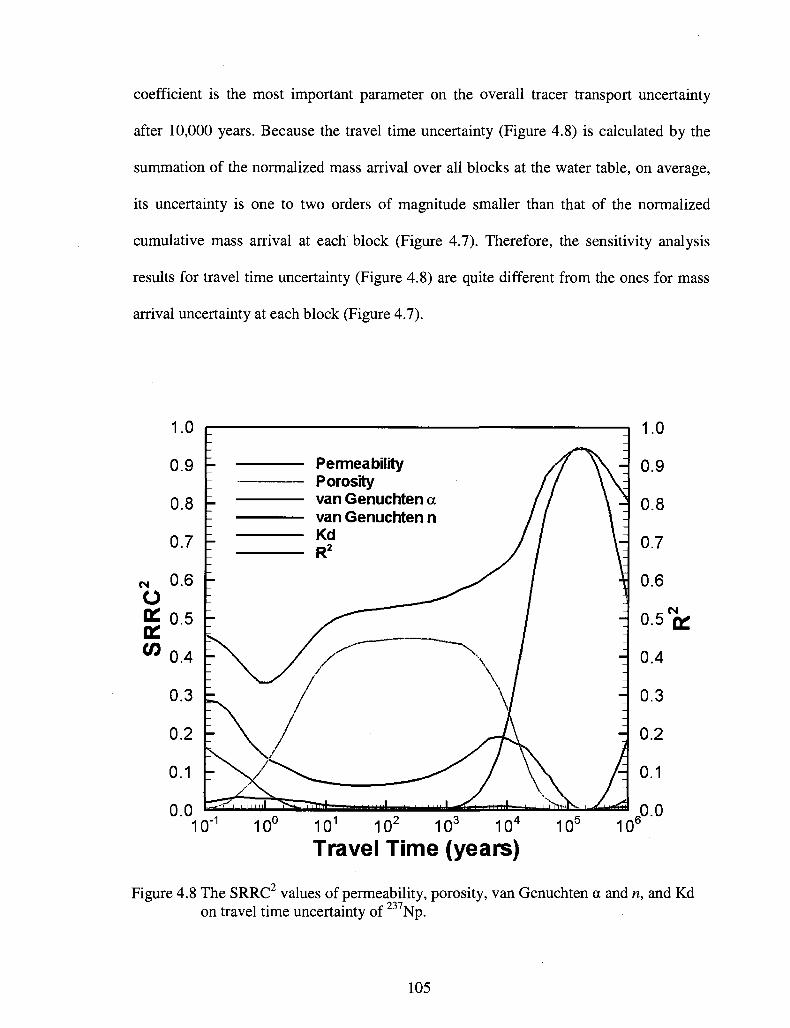
coefficient is the most important parameter on the overall tracer transport uncertainty
after 10,000 years. Because the travel time uncertainty (Figure 4.8) is calculated by the
summation of the normalized mass arrival over all blocks at the water table, on average,
its uncertainty is one to two orders of magnitude smaller than that of the normalized
cumulative mass arrival at each block (Figure 4.7). Therefore, the sensitivity analysis
results for travel time uncertainty (Figure 4.8) are quite different from the ones for mass
arrival uncertainty at each block (Figure 4.7).
1.0
0.9
0.8
0.7
CN 0.6 o * 0.5
<"o.4
0.3
0.2
0.1
0.0 10"1 10° 101 102 103 104 105 106
Travel Time (years) Figure 4.8 The SRRC2 values of permeability, porosity, van Genuchten a and n, and Kd
on travel time uncertainty of 237Np.
105
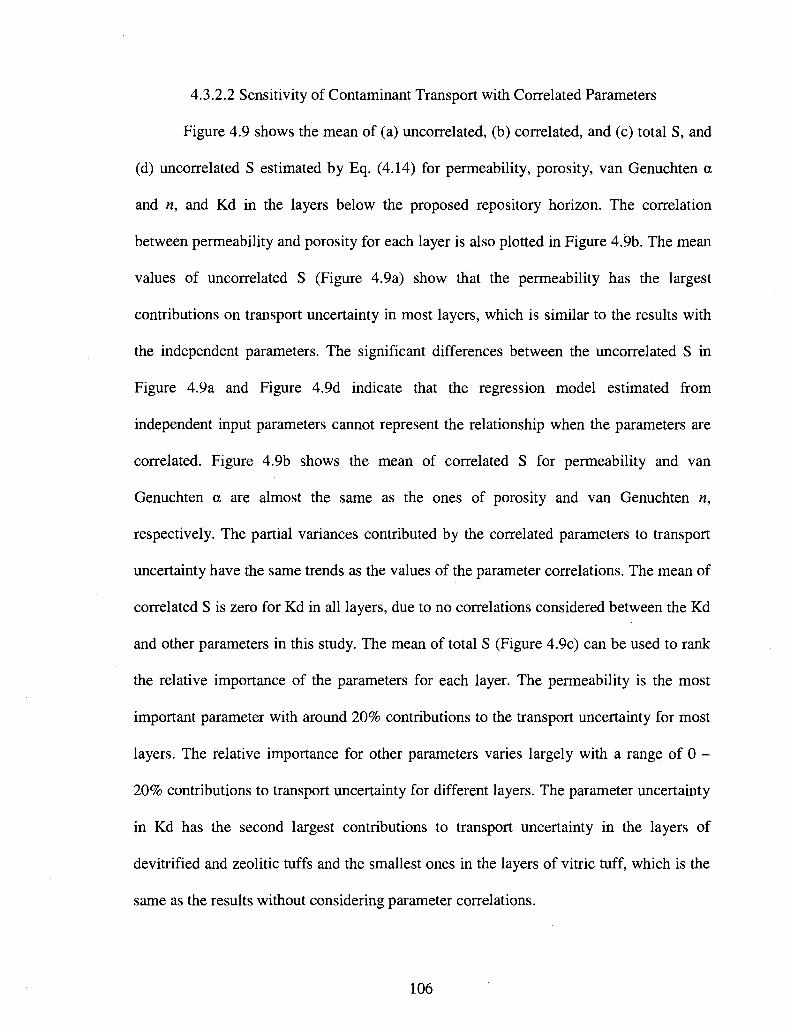
4.3.2.2 Sensitivity of Contaminant Transport with Correlated Parameters
Figure 4.9 shows the mean of (a) uncorrected, (b) correlated, and (c) total S, and
(d) uncorrected S estimated by Eq. (4.14) for permeability, porosity, van Genuchten a
and n, and Kd in the layers below the proposed repository horizon. The correlation
between permeability and porosity for each layer is also plotted in Figure 4.9b. The mean
values of uncorrelated S (Figure 4.9a) show that the permeability has the largest
contributions on transport uncertainty in most layers, which is similar to the results with
the independent parameters. The significant differences between the uncorrelated S in
Figure 4.9a and Figure 4.9d indicate that the regression model estimated from
independent input parameters cannot represent the relationship when the parameters are
correlated. Figure 4.9b shows the mean of correlated S for permeability and van
Genuchten a are almost the same as the ones of porosity and van Genuchten n,
respectively. The partial variances contributed by the correlated parameters to transport
uncertainty have the same trends as the values of the parameter correlations. The mean of
correlated S is zero for Kd in all layers, due to no correlations considered between the Kd
and other parameters in this study. The mean of total S (Figure 4.9c) can be used to rank
the relative importance of the parameters for each layer. The permeability is the most
important parameter with around 20% contributions to the transport uncertainty for most
layers. The relative importance for other parameters varies largely with a range of 0 -
20% contributions to transport uncertainty for different layers. The parameter uncertainty
in Kd has the second largest contributions to transport uncertainty in the layers of
devitrified and zeolitic tuffs and the smallest ones in the layers of vitric tuff, which is the
same as the results without considering parameter correlations.
106

Figure 4.10 describes the spatial distribution of total S of the five uncertain
parameters for the normalized cumulative mass arrival uncertainty of 237Np at all blocks
of the water table after 1,000,000 years. The parameter uncertainties in permeability, van
Genuchten a, and Kd parameters show the similar contributions to the transport
uncertainty with the independent parameters. The van Genuchten a and n parameters are
the most importance parameters in the southern portion. The porosity has relatively large
contributions to transport uncertainty in the north part of Ghost Dance Fault (Figure 1.2).
Figure 4.11 shows the total (solid line), uncorrected (dash line), and correlated
(dashdot line) S for the five uncertain parameters on the travel time uncertainty of 237Np.
At the early stage, the van Genuchten a and n parameters have the largest total S on
overall tracer uncertainty due to their large contributions from the correlated partial
variances of the parameters. As time evolves, the porosity and permeability become the
most important parameters and the van Genuchten a and n parameters become
insignificant. The sorption coefficient becomes the dominant parameter on the
uncertainty of overall tracer transport at the water table after 10,000 years.
4.3.2.3 Effect of Parameter Correlation on Sensitivity of Contaminant Transport
Figure 4.9b shows the relatively large mean values of correlated S for the
parameters in several layers, due to the high parameter correlations in these layers (Figure
4.4b and 4.9b). It indicates the partial variances contributed by the correlated parameters
largely depend on the values of their correlations. The comparison of parameter
contributions to the transport uncertainties with (Figure 4.9c) and without (Figure 4.6a)
parameter correlations shows the parameter Kd has the same contributions for both case
because the Kd is not correlated with other parameters in this study. The contributions of
107

van Genuchten n significantly increase with the decreased importance of van Genuchten
a after the parameter correlation are taken into account, while the importance of porosity
slightly increases with the slightly decreased contributions of permeability to the
transport uncertainty. This is due to the large correlations between van Genuchten a and n
(Figure 4.4b) and relatively small ones between permeability and porosity (Figure 4.9b)
in most layers. The parameter correlations could have significant effects on the sensitivity
results and extent of the effects largely depends on the values of the parameter
correlations. Comparison of the spatial distribution of total S with (Figure 4.10) and
without (Figure 4.8) parameter correlations shows that the van Genuchten n parameter
has significant contributions in the south part and the porosity becomes more important in
the north part of the fault after incorporating the parameter correlations, which is
consistent with conclusions for the layer-scale results.
The permeability and van Genuchten a are the two most important parameters on
the travel time uncertainty at the water table at early stage when the parameter
correlations are not considered. However, the van Genuchten n parameter becomes more
important than the other parameters when the parameter correlations are considered due
to large contributions from the correlated partial variances (Figure 4.10). The parameter
importance on the overall tracer transport uncertainty has the same rankings at the early
stage. However, the correlated contributions for permeability and porosity account for
large portions of their total partial variances when the parameter correlations are
considered, indicating the effect of parameter correlations is an important factor on
sensitivity results and should be considered.
108
(a) Mean of Uncorrelated S
TSW
I CHnt
C F u _l_ _L
0.0 0.2 0.4 0.6 0.8 S
— Permeability — Porosity — van Genuchten a — van Genuchten n — Kd
1.0
(c) Mean of Total S
TSW
0) > CO
C H n
CFu -
0.4 0.6 S
— Permeability Porosity
— van Genuchten a — van Genuchten n — Kd
1.0
(b) Mean of Correlated S Correlation
-0.8 -0.4 0.0 0.4
T S w
I
0.8
C H n
CFu -
-0.8 -0.4 0.0 S
Permeability (K) Porosity (<t>) van Genuchten a van Genuchten n Kd Correlation of K and $
(d) Mean of Calculated Uncorrelated S
T S w
I C H n
C F u -
Permeability Porosity van Genuchten a van Genuchten n Kd
Figure 4.9 The S values of permeability, porosity, van Genuchten a, and n, and Kd in the layers below the repository horizon.
109

237000
•g 232000
| 231000
230000 170000 172000 174000
Nevada Coordinate E-W (m)
1.0 0.9 0.8 0.7 0.6 0.5 0.4 0.3 0.2 0.1 0.0
4.C1IJUU
£236000 CO
2 235000 4>
| 234000 S g 233000 u ^ 232000 (0
| 231000
(b)
S^^^^^^SS/TTC /
: L... I . . . 1 , __..
— —
1.0 0.9 0.8 0.7 0.6 O.b 0.4 0.3 0.2 0.1 0.0
170000 172000 174000 Nevada Coordinate E-W (m)
237000
£ 236000E W , z 235000: a>
| 2340001"
s , g 233000t o •g 232000
| 231000t
230000
_
i |
i i
ii | iiii
|
i i
i I
|i i
i iH
i
i i
| i
i
; '
(c)
170000 172000 174000 Nevada Coordinate E-W (m)
1.0 0.9 0.8 0.7 0.6 0.5 0.4 0.3 0.2 0.1 0.0
237000
E 236000
^ 232000 TO
| 231000
— —
— —
—
1.0 0.9 0.8 0.7 0.6 O.b 0.4 0.3 0.2 0.1 0.0
230000 170000 172000 174000
Nevada Coordinate E-W (m)
237000
£ 236000E
z 235000F
g 234000 •a
g 233000 (J « 232000
« 231000
230000
.
- 1 . . . 1
la\ (C)
1.0 0.9 0.8 0.7 0.6 0.5 0.4 0.3 0.2 0.1 0.0
170000 172000 174000 Nevada Coordinate E-W (m)
ure 4.10 The S of permeability (a), porosity (b), van Genuchten a (c) and n (d), and Kd (e) on normalized cumulative mass arrival uncertainty of block of water table after 1,000,000 years.
237-Np at each
110

CO
10' icr io° 10 Travel Time (years)
Figure 4.11 The total (solid line), uncorrected (dash line), and correlated (dashdot line) S of permeability, porosity, van Genuchten a and n, and Kd on travel time uncertainty of 23 Np.
4.4 Conclusions
This study presented an integrated approach to evaluate the sensitivity of the
unsaturated flow and contaminant transport uncertainties with and without considering
parameter correlations. The contributions of input parameter uncertainties to the flow and
transport uncertainties were investigated at both layer and local scales. The obtained
insights can provide meaningful information on the sampling and monitoring network to
111
reduce the parameter uncertainties and associated predictive uncertainties in flow and
contaminant transport in UZ.
With the independent input parameters, the uncertainty in the permeability has the
largest contributions to the percolation flux uncertainty. The van Genuchten a is the
second important parameter with the limited contributions from the van Genuchten n to
the flux uncertainty. The permeability is also the most important parameter to the
uncertainty in the normalized cumulative mass arrival at each block of the water table.
The sorption coefficient of the reactive tracer is the second important parameter in the
layers of devitrified and zeolitic tuffs and has the smallest contributions in the layers of
vitric tuff. For the overall tracer transport uncertainty, the uncertainties in permeability
and van Genuchten a have the most contributions to the uncertainty in total cumulative
mass arrival at the water table at the early stage. As time evolves, the uncertainty in
porosity becomes more important. As the transport progresses further, the sorption
coefficient of the reactive tracer becomes the dominant parameter in contributing to the
uncertainty in overall tracer transport.
When the input parameters are correlated, the uncertainty in van Genuchten n has
more contributions to the percolation flux uncertainty, mainly due to its high correlation
with the van Genuchten a. The van Genuchten n and porosity also become more
important on the transport uncertainty when the parameter correlations are considered
due to their correlations with the van Genuchten a and permeability, respectively. The
importance of sorption coefficient to the tracer transport uncertainty has not changed
when the parameter correlations are considered, due to the assumption of zero
correlations between the sorption coefficient and other hydraulic parameters. The results
112
illustrate that parameter correlations may have significant effects on the sensitivity of
unsaturated flow and contaminant transport, which should be included in the uncertainty
and sensitivity analysis of flow and transport in the UZ.
4.5 References
Arnold, B.W., T. Hadgu, and C.J. Sallaberry. 2008. Sensitivity analyses of radionuclide
transport in the saturated zone at Yucca Mountain, Nevada. Proceedings of 2008
International High-Level Radioactive Waste Management Conference
(IHLRWM), September 7 - 11, Las Vegas, NV, 64 - 72.
Boateng, S., and J.D. Cawlfield. 1999. Two-dimensional sensitivity analysis of
contaminant transport in the unsaturated zone. Ground Water. 37(2): 185-193.
BSC (Bechtel SAIC Company). 2004a. UZ flow models and submodels. Report MDL-
NBS-HS-000006 REV02. Lawrence Berkeley National Laboratory, Berkeley,
California and CRWMS M&O, Las Vegas, Nevada, USA.
BSC (Bechtel SAIC Company). 2004b. Radionuclide transport models under ambient
conditions. Report MDL-NBS-HS-000008 REV02. Lawrence Berkeley National
Laboratory, Berkeley, California and CRWMS M&O, Las Vegas, Nevada, USA.
Fang, S., G.Z. Gertner, and A.A. Anderson. 2004. Estimation of sensitivity coefficients of
nonlinear model input parameters which have a multinomial distribution.
Comput. Phys. Commun. 157:9-16.
Helton, J.C. 1993. Uncertainty and sensitivity analysis techniques for use in performance
assessment for radioactive waste disposal. Reliab. Eng. Syst. Saf. 42:327-367.
113
Helton, J.C, J.D. Johnson, J.A. Rollstin, A.W. Shiver, and J.L. Sprung. 1995.
Uncertainty and sensitivity analysis of chronic exposure results with the MACCS
reactor accident consequence model. Reliab. Eng. Syst. Saf. 50(2): 137-177.
Helton, J.C, and F.J. Davis. 2002. Illustration of sampling-based methods for uncertainty
and sensitivity analysis. Risk Analy. 22(3):591-622.
Helton, J.C, F.J. Davis, and J.D. Johnson. 2005. A comparison of uncertainty and
sensitivity analysis results obtained with random and Latin hypercube sampling.
Reliab. Eng. Syst. Saf. 89:305-330.
Helton, J.C, J.D. Johnson, C.J. Sallaberry, and CB. Storlie. 2006. Survey of sampling-
based analysis. Reliab. Eng. Syst. Saf. 91:1175-1209.
Jacques, J., C. Lavergne, and N. Devictor. 2006. Sensitivity analysis in presence of model
uncertainty and correlated inputs. Reliab. Eng. Syst. Saf. 91:1126-1134.
Mertens, J., H. Madsen, M. Kristensen, D. Jacques, and J. Feyen. 2005. Sensitivity of soil
parameters in unsaturated zone modeling and the relation between effective,
laboratory and in situ estimates. Hydrol. Process. 19:1611-1633.
Pan, F. 2005. Uncertainty analysis of radionuclide transport in the unsaturated zone at
Yucca Mountain. Master thesis. University of Nevada Las Vegas, Nevada, USA.
Pan, F., M. Ye, J. Zhu, Y.S. Wu, B.X. Hu, and Z. Yu. 2009a. Incorporating layer- and
local-scale heterogeneities in numerical simulation of unsaturated flow and tracer
transport. J. Contam. Hydrol. 103:194-205, doi: 10.1016/j.jconhyd.2008.10.012.
Pan, F., M. Ye, J. Zhu, Y.S. Wu, B.X. Hu, and Z. Yu. 2009b. Numerical evaluation of
uncertainty in water retention parameters and effect on predictive uncertainty.
Vadose Zone J. in press.
114

Sallaberry, C.J., A. Aragon, A. Bier, Y. Chen, J.W. Groves, C.W. Hansen, J.C. Helton, S.
Mehta, S.P. Miller, J. Min, and P. Vo. 2008. Yucca Mountain 2008 Performance
Assessment: uncertainty and sensitivity analysis for physical processes.
Proceedings of 2008 International High-Level Radioactive Waste Management
Conference (IHLRWM), September 7 - 11, Las Vegas, NV, 559-566.
Saltelli, A., and J. Marivoet. 1990. Non-parametric statistics in sensitivity analysis for
model output: a comparison of selected techniques. Reliab. Eng. Syst. Saf. 28:22-
253.
Saltelli, A., and I.M. Sobol. 1995. About the use of rank transformation in sensitivity
analysis of model output. Reliab. Eng. Syst. Saf. 50:225-239.
Saltelli, A., S. Tarantola, and K. Chan. 1999. A quantitative model-independent method
for global sensitivity analysis of model output. Technometrics. 41(l):39-56.
Saltelli, A., K. Chan, and E.M. Scott. 2000. Sensitivity Analysis. John Wiley & Sons,
Chichester, UK.
Winter, C.L., A. Guadagnini, D. Nychka, and D.M. Tartakovsky. 2006. Multivariate
sensitivity analysis of saturated flow through simulated highly heterogeneous
groundwater aquifers. J. Comput. Phys. 217:166-175.
Xu, C , and G.Z. Gertner. 2008. Uncertainty and sensitivity analysis for models with
correlated parameters. Reliab. Eng. Syst. Saf. 93:1562-1573.
Ye, M., R. Khaleel, M.G. Schaap, and J. Zhu. 2007a. Simulation of field injection
experiments in heterogeneous unsaturated media using cokriging and artificial
neural network. Water Resour. Res. 43:W07413, doi:10.1029/2006WR005030.
115

Ye, M., F. Pan, Y.S. Wu, B.X. Hu, C. Shirley, and Z. Yu. 2007b. Assessment of
radionuclide transport uncertainty in the unsaturated zone of Yucca Mountain.
Adv. Water Resour. 30:118-134.
Zhang, K., Y.S. Wu, and J.E. Houseworth. 2006. Sensitivity analysis of hydrological
parameters in modeling flow and transport in the unsaturated zone of Yucca
Mountain. Hydrogeol. J. 14:1599-1619.
Zhou, Q., H.H. Liu, G.S. Bodvarsson, and CM. Oldenburg. 2003. Flow and transport in
unsaturated fractured rock: effects of multiscale heterogeneity of hydrogeologic
properties. J. Contam. Hydrol. 60:1-30.
116

CHAPTER 5
AN ESTIMATION OF SPATIAL CORRELATION STRUCTURES OF HYDRAULIC
PARAMETERS IN HETEROGENEOUS POROUS MEDIA
Improving the heterogeneity characterizations is critical to reduce the predictive
uncertainties in flow and transport in heterogeneous UZ (Kitanidis and Lane, 1985).
Because of the paucity of hydraulic parameter field measurements, it is difficult to
accurately estimate their spatial variability, which is typically estimated by a traditional
geostatistical approach such as a sample variogram. Therefore, there exist needs for
methods to improve the estimation of spatial correlation structures of hydraulic
parameters when the field measurements are sparse. This study tries to couple the
ASMLCV with a Bayesian updating method to estimate the spatial correlation structures
of hydraulic parameters to improve the local-scale heterogeneity characterizations of
hydraulic parameters.
5.1 Introduction
Accuracy of flow and transport predictions depends, in part, on the closeness
between the generated hydraulic parameter fields and the real fields. The heterogeneity
and spatial variability of the hydraulic parameters in heterogeneous media
117
play an important role in generating the heterogeneous fields representing the variability
of real parameter fields (Pan et al., 2009a, b; Zhou et al., 2003). The spatial correlation
structures of variogram models characterize the extent of spatial variability and
heterogeneities of hydraulic parameters. However, it is difficult, if not impossible, to
estimate the spatial correlation structures of hydraulic parameters from the empirical and
fitted variograms because of sparse data in most cases, especially for saturated hydraulic
conductivity and water retention parameters. Therefore, it is often desirable to estimate
spatial correlation structures of hydraulic parameters based on sparse field measurements.
The study of spatial correlation structure estimation for hydraulic parameters can improve
the accuracy of heterogeneous parameter fields, facilitate the design of data sampling and
monitoring networks, and better understand the effects of spatial correlation structures on
the flow and contaminant transport predictions in heterogeneous media (Kitanidis and
Lane, 1985).
The traditional geostatistical approach (i.e., sample variogram) is widely used to
estimate the spatial correlation structures of hydraulic parameters (Bardossy and
Lehmann, 1998; Kennedy and Woodbury, 2002; Pan et al., 2009a; Ritzi et al., 1994;
Sminchak et al., 1996; Viswanathan et al., 2003; Yates and Warrick, 1987; Ye et al.,
2005b, 2007a; Zhou et al., 2003). Fitting a sample variogram using variogram models is a
powerful tool for spatial correlation structure estimation with a large set of field
measurements. However, it is difficult to obtain the correlation structure using a sample
variogram, especially for horizontal correlation scale, when the field data are sparse.
Many previous studies assumed that the horizontal correlation scales of hydraulic
parameters were the same as those of other parameters (e.g., soil texture parameters,
118
initial moisture content, and porosity) with enough field measurements, whose horizontal
correlation structures can be directly obtained from sample variogram based on the field
data (Viswanathan et al., 2003; Ye et al., 2005b, 2007a; Zhou et al., 2003). Pan et al.
(2009a) assumed that the horizontal correlation scales in one layer were the same as those
of other layers in the same geologic unit. Other studies did not consider the anisotropy of
spatial data and only the correlation scales in omni direction were determined from
sample variogram (Kennedy and Woodbury, 2002; Yates and Warrick, 1987).
Many approaches have been proposed to estimate the spatial correlation structures
of hydraulic parameters such as LS, ML estimation, RML estimation, ASMLCV, and a
Bayesian inference approach (Dietrich and Osborne, 1991; Kitanidis an Lane, 1985;
Kitanidis, 1986; Pardo-Igiizquiz, 1998; 1999; Samper and Neuman, 1989a, b, c). Among
them, the ML method is widely applied in the parameter estimation. The ML parameter
estimates are unbiased and minimum-variance with the assumption of data following
multivariate Gaussian distribution (Kitanidis and Lane, 1985). The computational cost of
ML estimation can be reduced via RML method (Dietrich and Osborne, 1991). Samper
and Neuman (1989a) proposed the ASMLCV method to estimate the spatial covariance
structure based on a ML approach with the cross-validation errors following Gaussian
distribution. The ASMLCV approach can not only provide the quality information of the
parameter estimation but also select the best covariance function by model structure
identification criteria (Samper and Neuman, 1989a). However, the prior information is
not included in the ML approaches and it may produce unreliable results with only few
data available (Pardo-Igiizquiz, 1999). The Bayesian inference approach was proposed to
119

infer the posterior probability of spatial correlation structure from its prior probability
through the likelihood function estimated by the ML approach (Pardo-Iguzquiz, 1999).
This study proposes a method to couple the ASMLCV with the Bayesian updating
method to estimate the spatial correlation structures of hydraulic parameters when the
field measurements are sparse. The Bayesian updating methods were introduced to
update the statistics of the prior PDFs of hydraulic parameters based on the Bayes'
theorem (Meyer et al., 1997; Vrugt and Bouthen, 2002; Ye et al., 2005a). The Bayesian
updating method cannot change the types of prior PDFs and can only update the moments
of prior PDF to yield the posterior PDF with the same type of distribution as the prior
PDF. The ASMLCV approach was based on the ML estimation with the assumption of
cross-validation errors following a Gaussian distribution without the requirement of prior
information (Samper and Neuman, 1989a, b). The ASMLCV approach not only measures
the quality of parameter estimation but also can easily deal with noisy data (Samper and
Neuman, 1989a). However, the prior information is not included in the ASMLCV
approach. It may produce better results to incorporate all available prior information. This
study seeks to couple the Bayesian updating method with ASMLCV to incorporate the
available prior information and the site measurements of hydraulic parameters. The
ASMLCV approach is used to estimate the likelihood function based on site
measurements, while ML estimation is applied in the Bayesian inference approach
(Pardo-Iguzquiz, 1999). The advantages of ASMLCV approach over ML estimation are
highly efficient optimization, reduced computational cost, easily dealing with noisy data,
and easy implementation via kriging.
120

Although the Bayesian updating method and ASMLCV approach were introduced
decades ago, this study presents the first application of the coupled method of Bayesian
updating and ASMLCV in vadose zone hydrology to estimate the spatial correlation
structures of hydraulic parameters in heterogeneous media. The Sisson and Lu (S&L)
injection site at Hanford Site in Washington State is selected as a case study to illustrate
the approach. The site provides a good setting for illustrating and testing the coupling of
Bayesian updating and ASMLCV. 70 data sets of soil hydraulic parameters are available
from six boreholes with 53 of these data sets from three close boreholes in the study site.
It is difficult to determine the spatial correlation structures of soil hydraulic parameters,
especially in horizontal direction.
This study is focused on the estimation of horizontal and vertical correlation
scales because the correlation scale is the most important quantity in characterizing the
spatial variability of hydraulic parameters (Bardossy and Lehmann, 1998). The field data
of the soil hydraulic parameters (saturated hydraulic conductivity, van Genuchten a and
n, saturated and residual water content) are firstly transformed and standardized to follow
a standard normal distribution based on the results of normality test so that the sill of
variogram model is 1.0. The prior probability of horizontal and vertical correlation scales
are assumed to follow a triangular distribution and the minimum, most likely, and
maximum values are inferred from literature, expert judgment, and previous studies in the
study site or similar sites. Based on the transformed field data, the likelihood functions of
horizontal and vertical correlation scales for each hydraulic parameter can be obtained
using the ASMLCV approach. The prior probability is updated to yield posterior
probability of the correlation scales through the likelihood functions. The means of the
121
posterior probability for horizontal and vertical correlation scales can be obtained and
used as the inputs of subsequent heterogeneous parameter field generation via kriging.
5.2 Study Site
The S&L injection site originally designed by Sisson and Lu (1984) is within the
200 east area of the USDOE Hanford Site in southeastern Washington State (Ward et al.,
2000). The plan view of the S&L injection site with well numbering scheme is plotted in
Figure 5.1. The upper portion of the study site was formed during catastrophic glacial
flooding and a thick sequence of flood sediments known as the Hanford formation were
deposited during Pleistocene flooding (Ye et al., 2005b). The sediments are about 60 m
deep in S&L injection site and mainly consist of sand with interstitial silt and silt beds
(Ye et al., 2005b, 2007a). The lithostratigraphic cross section (B-B' in Figure 5.1)
through the southeastern portion of the injection site is plotted in Figure 5.2. The study
site mainly consists of sandy deposits with the stratified slightly silty in the middle of
sand beds (Ye et al., 2005b) based on the cross section in Figure 5.2.
Two field infiltration injection experiments were conducted in 1980 and 2000 to
measure the moisture content distribution and about 1,376 measurements of initial
moisture content were collect to surrogate the site heterogeneity (Ye et al., 2007a). In
addition, there are 70 data sets of measurements for the soil hydraulic properties
(saturated hydraulic conductivity, saturated and residual water content, van Genuchten a
and n) from core samples in six boreholes (S-l, S-2, S-3, E-7, E-l, and A-7 in Figure
5.1). The locations of 70 measurements plotted in Figure 5.3 show that 53 data are from 3
close boreholes S-l, S-2, and S-3 with vertical distances less than 1 m. The descriptive
122

statistics of the data are tabulated in Table 5.1. The saturated hydraulic conductivities for
four samples of silt are larger than 70 m/d and the van Genuchten n is 11.95 for one
sample of silt, which are unrealistically high for silt. Therefore, the five values are
identified as outliers and removed from the data sets. The sample sizes for saturated
hydraulic conductivity and van Genuchten n parameter are 66, and 69 shown in Table
5.1. The large standard deviations of the hydraulic data indicate the significant spatial
variability of soil hydraulic parameters at the study site.
Figure 5.1 Plan view of the Sisson and Lu (1984) injection site and well numbering scheme (modified from Ye et al., 2005b).
123
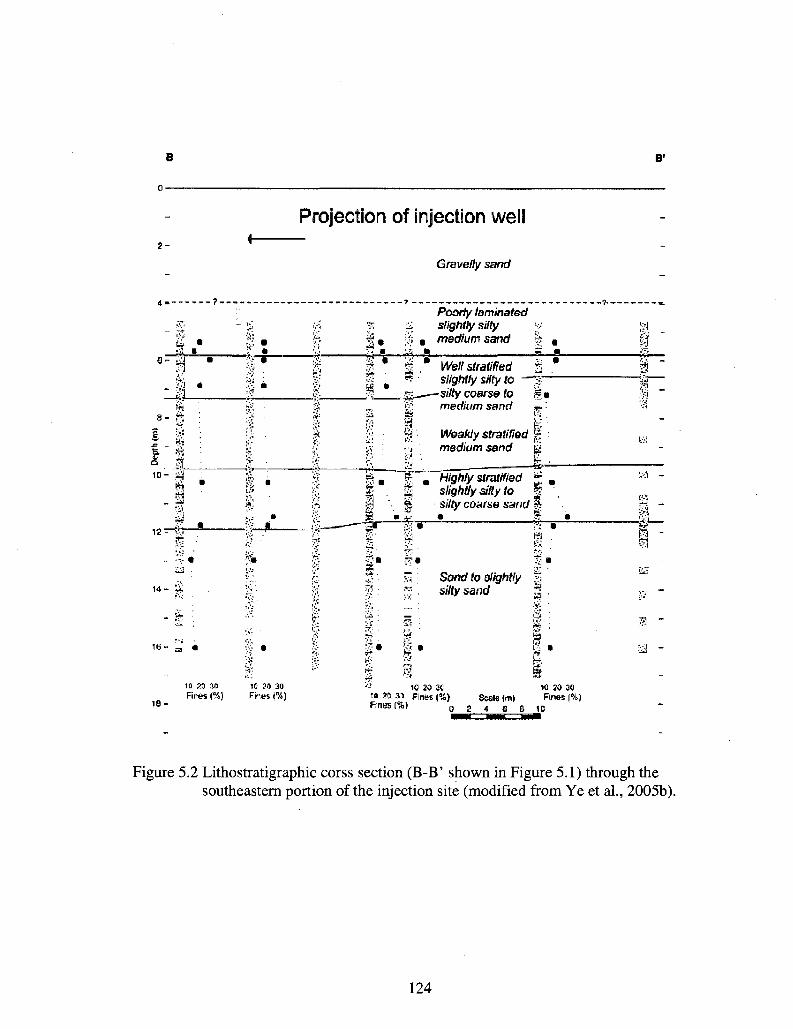
Projection of injection well
Gravelly sand
B-
1 . •%
1 0 -
12
-1' JU
14- £
i s -
~£j~
Poorly laminated slightly silty
3» S
£3
Well stratified slightly silty to
-silty coarse to medium sand
Weakly stratified f, medium send &*
I ft ft iff
Highly stratified g . slightly silty to g s//fy coarse sand $
re
Sand to s//gWy s % sa/id
?? fr
-frw Si
fa •'
E3
I.
a
a
to 20 io 10 20 ae Fines (%) Finos i%)
'- 10 29 30 10 2D 39 tn X M FintE (%) Sjjie ( r n | Fines (%) Fines (%) o 2 4 G B ID
Figure 5.2 Lithostratigraphic corss section (B-B' shown in Figure 5.1) through the southeastern portion of the injection site (modified from Ye et al., 2005b).
124
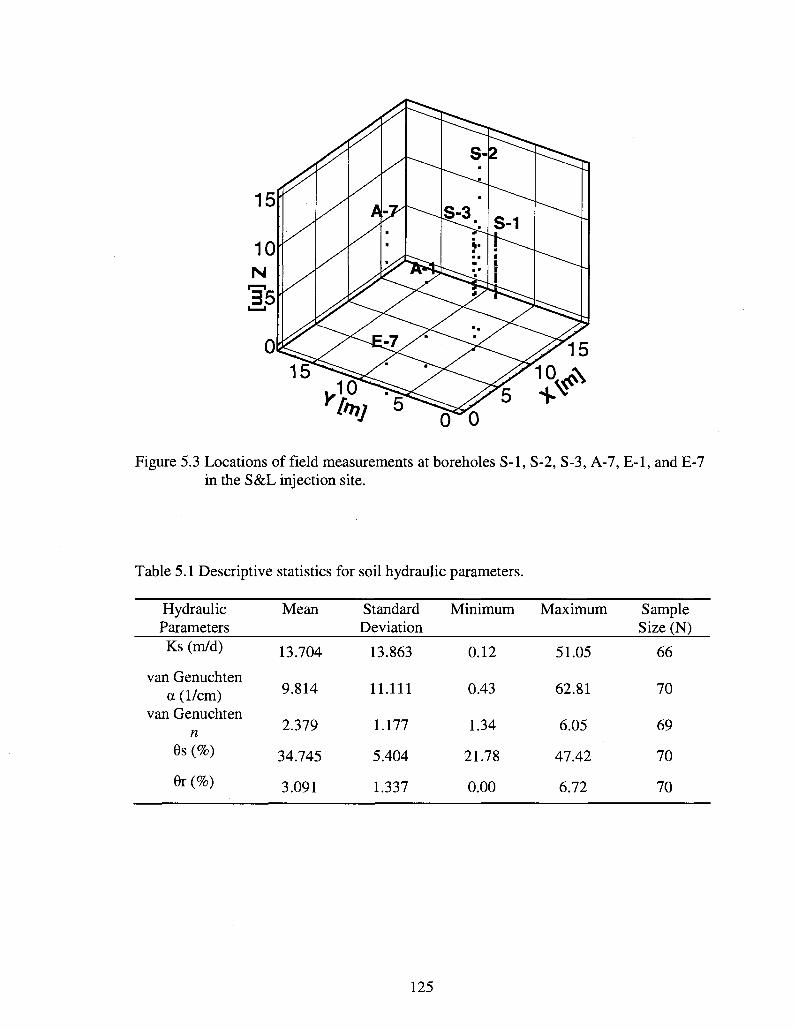
<T"0
Figure 5.3 Locations of field measurements at boreholes S-1, S-2, S-3, A-7, E-1, and E-7 in the S&L injection site.
Table 5.1 Descriptive statistics for soil hydraulic parameters.
Hydraulic Parameters Ks (m/d)
van Genuchten a (1/cm)
van Genuchten n
0s (%)
0r (%)
Mean
13.704
9.814
2.379
34.745
3.091
Standard Deviation
13.863
11.111
1.177
5.404
1.337
Minimum
0.12
0.43
1.34
21.78
0.00
Maximum
51.05
62.81
6.05
47.42
6.72
Sample Size (N)
66
70
69
70
70
125
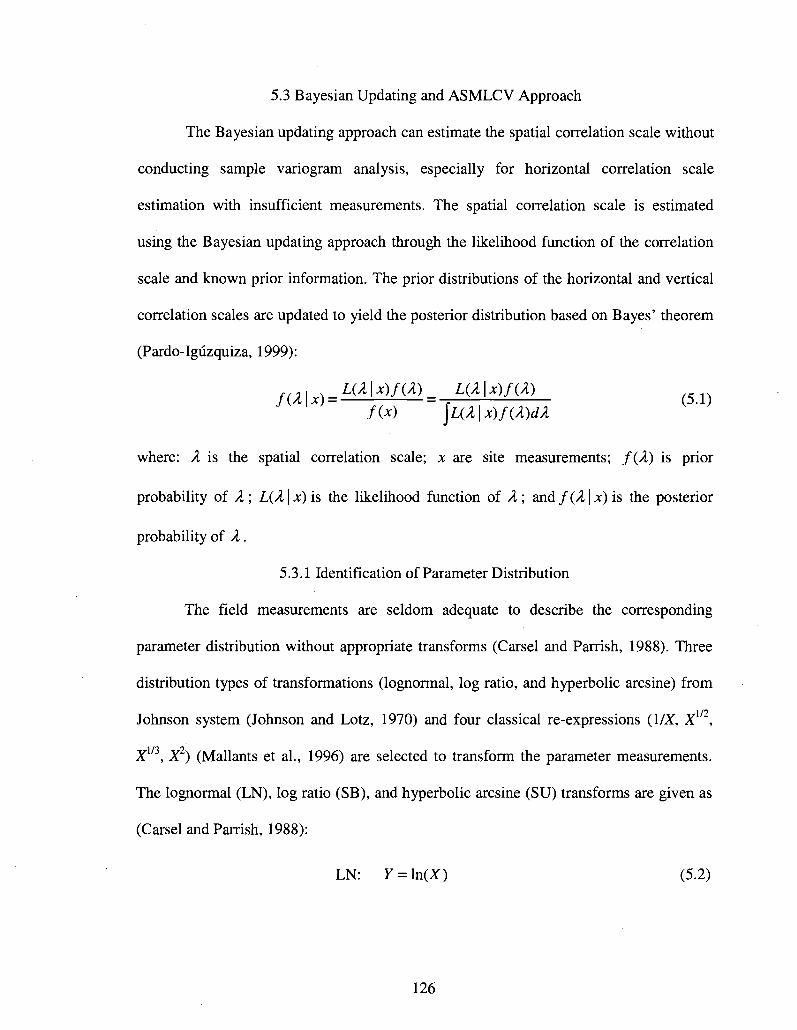
5.3 Bayesian Updating and ASMLCV Approach
The Bayesian updating approach can estimate the spatial correlation scale without
conducting sample variogram analysis, especially for horizontal correlation scale
estimation with insufficient measurements. The spatial correlation scale is estimated
using the Bayesian updating approach through the likelihood function of the correlation
scale and known prior information. The prior distributions of the horizontal and vertical
correlation scales are updated to yield the posterior distribution based on Bayes' theorem
(Pardo-Iguzquiza, 1999):
f(Mx)=Lq\X)fU) L(MX)fU) 5 fix) \L(X\x)f(X)dX
where: X is the spatial correlation scale; x are site measurements; f(X) is prior
probability of X; L(X\x)is the likelihood function of X; andf(X\x) is the posterior
probability of X.
5.3.1 Identification of Parameter Distribution
The field measurements are seldom adequate to describe the corresponding
parameter distribution without appropriate transforms (Carsel and Parrish, 1988). Three
distribution types of transformations (lognormal, log ratio, and hyperbolic arcsine) from
Johnson system (Johnson and Lotz, 1970) and four classical re-expressions (l/X, Xm,
X , X) (Mallants et al., 1996) are selected to transform the parameter measurements.
The lognormal (LN), log ratio (SB), and hyperbolic arcsine (SU) transforms are given as
(Carsel and Parrish, 1988):
LN: y = ln(Z) (5.2)
126
SB: y = l n £ - £ ) (5.3) D — X
SU: Y = sinlT1 (U) = ln(U + Jl + U2) (5.4)
where X are untransformed field measurements with limits of variation from A to B (A <
X <B) and (/ = (X-A)/(Z?-A). Another distribution is Gaussian distribution denoted by NO,
meaning no transform. The best among the eight transformations (NO, LN, SB, SU, 1/X,
1/7 11"\ 7
X , X , and X ) is selected using the Lilliefors goodness-of-fit test for normality, which
is a variant of the Kolmogorov-Smirnov (K-S) test. Different from the K-S test, the
Lilliefors test does not require a hypothesized distribution with mean and variance (or,
more rigorously, cumulative distribution function) to be specified a priori. Instead, mean
and variance can be estimated from measurements and the required minimum number of
data points is only 4 for Lilliefors Test. (Bowen and Bennett, 1988). Once the normality
test is accepted, the transformed field measurements using the selected transformations
are considered to follow a normal distribution.
5.3.2 Prior Probability of Spatial Correlation Scale
Due to insufficient field measurements to estimate the spatial correlation scale,
especially the horizontal correlation scale, the prior probability of spatial correlation scale
is estimated subjectively based on literature, expert judgment, and study of similar
conditions, etc. The prior probability distribution of spatial correlation scale could have
significant effect on the posterior distribution and subsequent heterogeneous parameter
field generation. The prior distribution could be proper priors, truncation of the parameter
space, vague proper priors, transformation of the correlation scale, the Jeffereys prior,
and the inference prior (Berger et al., 2001). The uniform, trapezoidal, triangular, left
rectangular triangular, and right rectangular triangular distributions were proposed as
127

prior probability distributions to update the posterior probability through the likelihood
function (Pardo-Igiizquiza, 1999). The results from Pardo-Iguzquiza (1999) indicated the
triangular and trapezoidal distributions as priors could better estimate the posterior
distributions. This study adopts the triangular distribution as the prior probability
distribution of spatial correlation scale due to its easy implementation, which is defined
as:
/U) =
2^~a) a±X<b (c-a)(b-a) .._.
2 < ^ > b ^ c ( }
(c-a)(c-b)
where a<b<c, a, b, and c are the minimum, most likely, and maximum values of the
spatial correlation scale. The subjective estimation from literature, expert judgments, and
study of similar conditions are used to determine the values of a, b , and c. After
determining the prior probability, multiple realizations of the correlation scale can be
generated to update the posterior probability through the likelihood function.
5.3.3 ML Function of Spatial Correlation Scale
The ASMLCV approach was proposed to estimate the likelihood function
(Samper and Neuman, 1989a). In geostatistical study, the cross-validation approach is a
traditional method to validate variogram models via kriging estimation. In this study, the
errors estimated using cross-validation method are assumed to follow a Gaussian
distribution with a mean of zero and a covariance matrix of C(A). The likelihood
function can be written as (Carrera and Neuman, 1986):
1 -e'C~le L(A | x) = . -^= exp( ) (5.6)
J{2x)NCa) 2
128

where TV is the number of field measurements; e are the estimation errors; C(X) is the
covariance function.
The negative natural log likelihood (NLL) function can be obtained by taking the
natural logarithm and multiplying it by -1 on both sides of Eq. (5.6):
NLL = -\nL(A | x) = — In2^ + - I n | C{X) | +-eC'le (5.7)
The covariance function C(A) could be one type of exponential model, spherical
model, Gaussian model, power model, or hole effect model (Deutsch and Journal, 1998).
The exponential model is adopted in this study due to its simple form and wide
applications:
C a ) = o-2exp(--j4 (5.8)
where <J2 is variance of hydraulic parameters; htj is the distance between two field
measurements i, and j .
If the covariance function is validated using the cross-validation method via
kriging, the NLL can be approximated to a simpler form (Samper and Neuman, 1989a):
N „ 2
NLL =-In LU\x) = —ln2n + -y£\n(T?+-Yd\ (5.9) 2 2 i=1 2 !=1 (7i
where ai is the estimation variance of measurement i; ei is the estimation error of
measurement i.
5.3.4 Posterior Probability of Spatial Correlation Scale
The multiple-realization values of the correlation scales are generated based on
the prior probability distribution discussed in Section 5.3.2. The likelihood function of
the correlation scale for each realization can be estimated by performing cross validation
129
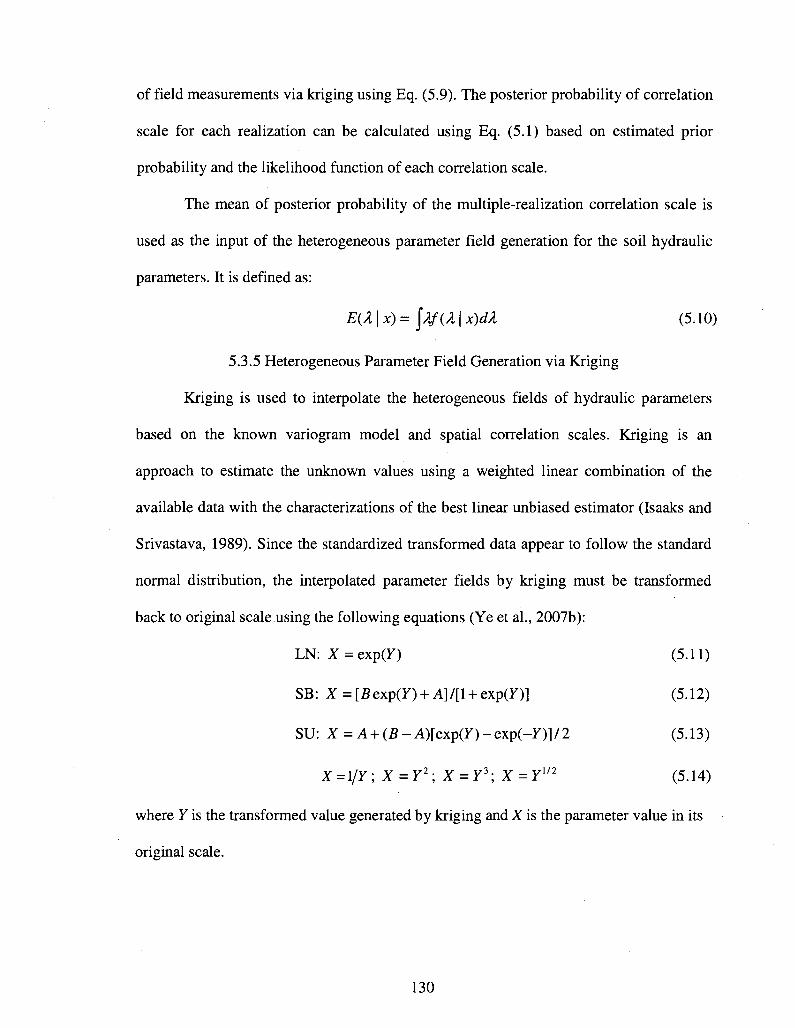
of field measurements via kriging using Eq. (5.9). The posterior probability of correlation
scale for each realization can be calculated using Eq. (5.1) based on estimated prior
probability and the likelihood function of each correlation scale.
The mean of posterior probability of the multiple-realization correlation scale is
used as the input of the heterogeneous parameter field generation for the soil hydraulic
parameters. It is defined as:
E(A | x) = \Af(A | x)dl (5.10)
5.3.5 Heterogeneous Parameter Field Generation via Kriging
Kriging is used to interpolate the heterogeneous fields of hydraulic parameters
based on the known variogram model and spatial correlation scales. Kriging is an
approach to estimate the unknown values using a weighted linear combination of the
available data with the characterizations of the best linear unbiased estimator (Isaaks and
Srivastava, 1989). Since the standardized transformed data appear to follow the standard
normal distribution, the interpolated parameter fields by kriging must be transformed
back to original scale using the following equations (Ye et al., 2007b):
LN: X=exp(F) (5.11)
SB: X=[5exp(F) + A]/[l + exp(F)] (5.12)
SU: X = A + (£-A)[exp(F)-exp(-F)]/2 (5.13)
X=l/Y; X=Y2; X = F 3 ; X = YU2 (5.14)
where F is the transformed value generated by kriging and X is the parameter value in its
original scale.
130
5.4 Estimation of Spatial Correlation Structure
This section discusses the results of spatial correlation structure estimation by the
coupled method of Bayesian updating and ASMLCV.
5.4.1 Distribution Identification of Soil Hydraulic Data
For the soil hydraulic parameters, Table 5.2 lists the values of A and B needed for
the SB and SU transforms, the selected best transformations based on Lilliefors Test,
mean and variance of the transformed data, maximum absolute distribution difference
(7), and Lilliefors criteria (T ) for significance levels of 0.01, 0.05, and 0.1. The selected
best distributions are determined at the significance level of 0.1 in Lilliefors normality
test for the saturated hydraulic conductivity, van Genuchten a, saturated and residual
water content, indicating the transformed data of the parameters follow a normal
distribution. Only the normality assumption for the van Genuchten n is rejected at all
significant levels but its T value is close to the critical value at the significant level of
0.01.
Figure 5.4 shows the empirical and theoretical CDFs for transformed soil
hydraulic parameters and the selected best transformations. The empirical CDFs of the
parameters agree well with the theoretical CDFs shown in Figure 5.4, indicating the
selected transformations are appropriate. The selected best transformations are SB, LN,
1/X, and SU for the saturated hydraulic conductivity, van Genuchten a, saturated and
residual water content. Although the normality test for van Gneuchten n is rejected, its
best transformation (1/X) is still selected to transform the field data used in the future
simulations.
131
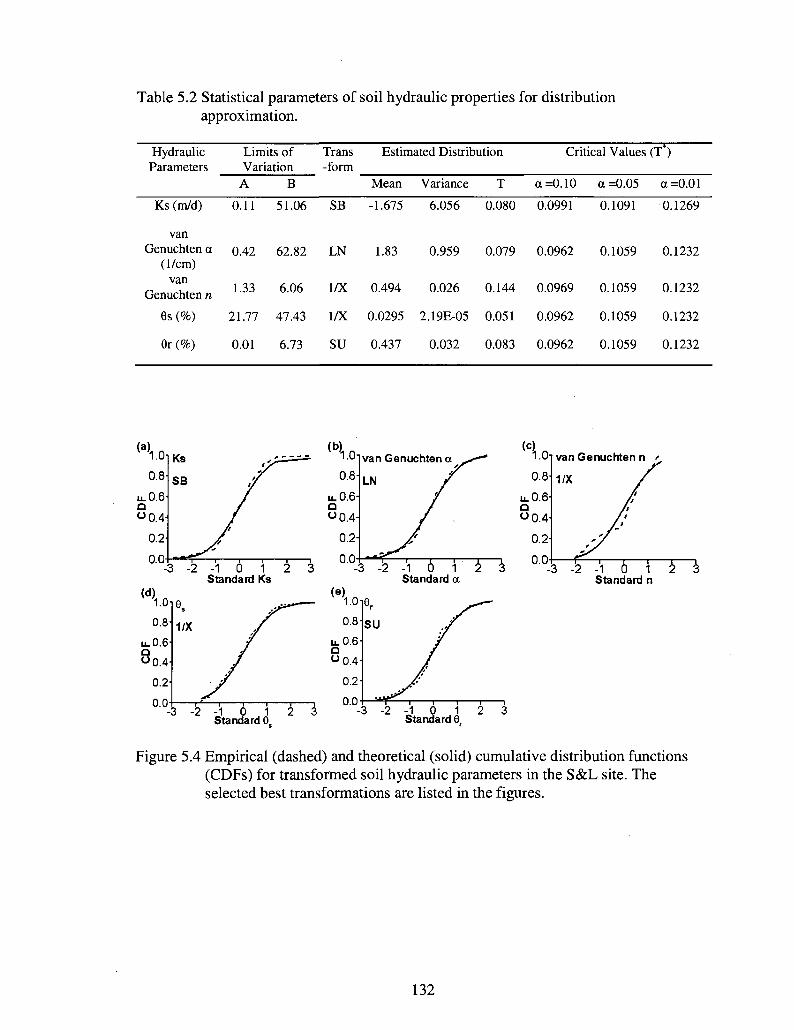
Table 5.2 Statistical parameters of soil hydraulic properties for distribution approximation.
Hydraulic Parameters
Ks (m/d)
van Genuchten a
(1/cm)
van Genuchten n
9s (%)
6r (%)
Limits of Variation
A B
0.11
0.42
1.33
21.77
0.01
51.06
62.82
6.06
47.43
6.73
Trans -form
SB
LN
1/X
1/X
SU
Estimated Distribution
Mean
-1.675
1.83
0.494
0.0295
0.437
Variance
6.056
0.959
0.026
2.19E-05
0.032
T
0.080
0.079
0.144
0.051
0.083
Critical Values (T*)
a =0.10
0.0991
0.0962
0.0969
0.0962
0.0962
a =0.05
0.1091
0.1059
0.1059
0.1059
0.1059
a =0.01
0.1269
0.1232
0.1232
0.1232
0.1232
- 3 - 2 - 1 0 1 2 Standard Ks
3 -2 -1 (5 1 2 3 Standard a
Standard 6. -3 -2 -J 5" J 1
Standard 6
1.0
0.8
u.0.6 Q
Ofj.4
0.2
0.0
van Genuchten n
1/X
3 -2 -'1 b \ 2 3 Standard n
Figure 5.4 Empirical (dashed) and theoretical (solid) cumulative distribution functions (CDFs) for transformed soil hydraulic parameters in the S&L site. The selected best transformations are listed in the figures.
132

5.4.2 Prior Probability Determination for Spatial Correlation Scale
The triangular distribution is adopted as prior probability distribution of the
spatial correlation scale in this study due to its wide applications (Pardo-Igiizquiza,
1999). The a, b, c values of the triangular distribution could be estimated subjectively
from literature, expert judgments, and studies under similar conditions.
For the vertical correlation scale, the sample variograms of soil texture parameters
(bulk density, gravel, coarse sand, fine sand, silt, and clay percentages) are fitted to an
exponential model with a vertical range of around 1.5 m at the study site in Ye et al.
(2007a). The vertical correlation scale of 1.72 m was estimated from the sample
variogram fitting of initial moisture content at the S&L injection site (Ye et al., 2005b).
Therefore, the value of 1.5 m is selected as the most likely vertical correlation scale of the
triangular distribution. The vertical correlation scale could be as small as the sampling
interval (0.305 m) of initial moisture content (Ye et al., 2005b) and the minimum value
(a) is assumed to be a very small value, 0.05 m. The study site is classified into five
sediment layers with the depths of 2~3 m, and the conclusions that the vertical correlation
scales of initial moisture content are smaller than the average layer thickness were drawn
in Ye et al. (2005b). 50-realization correlation scales are generated with an interval of
0.05m with the minimum value of 0.05m in this study. Thus, the maximum vertical
correlation scale (c value) is set to 2.55 m in this study. The prior probability distribution
of vertical correlation scale is determined as a triangular distribution with a = 0.05 m, b =
1.50 m, and c = 2.55 m.
The horizontal correlation scale of the initial moisture content is greater than the
domain's horizontal dimension since the horizontal variogram cannot reach a sill within
133
the maximum lag distance of sampling domain (Ye et al., 2005b). However, the
likelihood function is based on the field measurements, and extreme large horizontal
correlation scales may lead to unreliable updated results. Thus, the mostly like horizontal
correlation scale (b value) is set to 7.0 m at half of largest distance among the six
boreholes. The maximum horizontal scale (c value) is assumed to be 25.5 m because the
simulation domain has a size of 18m xl8mxl5m. The smallest distance between the
boreholes shown in Figure 5.3 is 0.85 m. Therefore, it is reasonable to set a small value
of 0.5 m as the minimum horizontal correlation scale. The prior probability distribution
of the horizontal correlation scale is then described as a triangular distribution with a =
0.5 m, b = 7.0 m, and c = 25.5 m.
The prior probability distributions of horizontal and vertical correlation scales are
assumed to be the same for all soil hydraulic parameters in this study. The 50 realizations
of horizontal and vertical correlation scales are generated for all parameters with a
50
limitation of ^df(Ai) = 1.0. The PDFs of prior triangular distributions are plotted in
;=i
Figure 5.5 in solid line. Figure 5.5 shows the maximum probability of 0.04 for the most
likely values of correlation scales and zero probability for the minimum and maximum
correlation scales.
5.4.3 Spatial Correlation Scale Updating
The procedures of spatial correlation scale updating for each parameter could be
described as follows:
(1) Generate 50 realizations of horizontal correlation scales in Section 5.4.2 and a
fixed vertical correlation scale at most likely value 1.5 m as the inputs of the
exponential model in cross validation;
134

(2) Estimate the likelihood functions using Eq. (5.9) based on 50-realization cross-
validation results;
(3) Obtain the posterior probability for 50-realizaiotn horizontal correlation scales;
(4) Estimate the mean of the posterior probability of multiple-realization horizontal
correlation scales as the updated horizontal correlation scale for subsequent
heterogeneous field generation;
(5) Generate 50-realization vertical correlation scales in Section 5.4.2 and a fixed
horizontal correlation scale estimated in Step 4;
(6) Repeat steps 2, 3, and 4 to obtain the updated vertical correlation scale.
Figure 5.5 shows the prior probability, posterior probability, and NLL values of
horizontal and vertical correlation scales for the soil hydraulic parameters. The posterior
probability distributions for the correlation scales have inversely proportional
relationships with the NLL values shown in Figure 5.5. One can also see from Figure 5.5
that the shapes of posterior probability distributions for the correlation scales look
normally distributed and are significantly different from the prior triangular distributions,
indicating that the updated posterior probability depends largely on the likelihood
function estimation based on field measurements. The vertical correlation scales for the
soil hydraulic parameters have their maximum posterior probability around 1.0 m or
smaller than 1.0 m. Table 5.3 lists the means of updated posterior probability
distributions for the vertical and horizontal correlations scales. The mean updated vertical
correlation scales for the saturated hydraulic conductivity, van Genuchten a and n,
saturated and residual water content are 1.1m, 0.6m, 0.5m, 1.0m, and 0.4m, respectively.
They are smaller than the vertical correlation scales of soil texture parameters of around
135
1.5 m and the initial moisture content of 1.72 m using sample variogram fitting in Ye et
al. (2007a). The updated vertical correlation scales in this study are reasonable because
the layer thickness of this study site is around 2-3 m and the sampling interval in
boreholes S-l, S-2, and S-3 is very small (0.305 m).
The updated posterior horizontal correlation scales at maximum posterior
probability are around 5.0 m for van Genuchten n, and residual water content; 3-4 m for
saturated hydraulic conductivity and saturated water content; 12.8 m for van Genuchten
a, indicating the significant different horizontal correlation scales among the soil
hydraulic parameters. Figure 5.5 shows that the sharp posterior probability distributions
have the smaller horizontal scales at maximum posterior probability. The shapes of
posterior probability distributions are largely related to the ones of likelihood functions.
If the NLL values decrease or increase dramatically, the posterior probability
distributions are much narrower. On the other hand, the wide posterior probability
distribution is a result of slow change in the NLL values. This illustrates that the
contributions to the posterior probability distributions are largely from the likelihood
functions. The means of posterior probability for the horizontal correlation scales listed in
Table 5.3 are 4.3, 12.8, 4.9, 3.0, and 5.0 for the five soil hydraulic parameters. The small
horizontal correlation scales may be caused by the close boreholes (S-l, S-2, and S-3)
shown in Figure 5.3. The updated horizontal and vertical correlation scales can then be
investigated by the comparing the field measurements with the estimated data using
kriging based on the results of spatial correlation scale updating.
136

"0.0 0.5 1.0 1.5 2.0 2.5 Vertical Correlation Scale (m)
3.0 0 5 10 15 20 25 Horizontal Correlation Scale (m)
170
(f)
0 5 10 15 20 25 Horizontal Correlation Scale (m)
van Genuchten n
30
0.0 0.5 1.0 1.5 2.0 2.5 Vertical Correlation Scale (m)
0 5 10 15 20 25 Horizontal Correlation Scale (m)
30
Figure 5.5 Prior probability distribution (solid), posterior probability distribution (dashed), and negative natural log likelihood (NLL, dashdotted) values for the soil hydraulic parameters.
137

0.20
0.16
0.12
0.08
0.04
0.5 1.0 1.5 2.0 2.5 Vertical Correlation Scale (m)
5 10 15 20 25 Horizontal Correlation Scale (m)
0 0 t 0
er(%) / /
« ' # •
«» • • #-: '.
- . * • • #-; . • * / • « /
« / • * / _• V • /•' ^ - " ^ v ^
• * - . . . ' ' ^ - " — ^ s >
' *̂*"** •*-r i 1 . . L . 1 . J . . U . L. J>5
~
_ _ _ _ _
J,
250
240
230
220 - i 00.06 Z Q.
210
200
0.5 1.0 1.5 2.0 2.5 Vertical Correlation Scale (m)
3.0 190
5 10 15 20 25 Horizontal Correlation Scale (m)
Figure 5.5 (Cont.) Prior probability distribution (solid), posterior probability (dashed), and negative natural log likelihood (NLL, values for the soil hydraulic parameters.
distribution dashdotted)
Table 5.3 The means of posterior probability distributions for horizontal and vertical correlation scales of soil hydraulic parameters.
Hydraulic Mean of posterior Parameters probability for horizontal
correlation scale
Mean of posterior probability for vertical
correlation scale Ks (m/d)
van Genuchten a (1/cm)
van Genuchten n
0s (%)
0r (%)
4.3
12.8
4.9
3.0
5.0
1.1
0.6
0.5
1.0
0.4
138
5.4.4 Heterogeneous Field Generation of Soil Hydraulic Parameters
The simulation domain of the S&L injection site is 18m xl8mxl5m with a grid
size of 0.25 m x 0.25 m x 0.3048 m. The 3-D heterogeneous parameter fields are
generated by kriging based on the estimated horizontal and vertical correlation scales and
the site measurements.
Figure 5.6 shows the spatial variability of the hydraulic parameters and the kriged
estimation at borehole S-1. The comparison of field measurements and kriged results in
Figure 5.6 shows that kriged estimation data of the hydraulic parameters agree well with
the field measurements, indicating the kriging results are reliable to represent the S&L
site heterogeneity. Therefore, the updated spatial correlation scales by the coupled
method may improve the estimation of spatial correlation scales and the simulations of
heterogeneous fields for the soil hydraulic parameters via kriging.
Figure 5.7 shows the 3-D heterogeneous fields of the five soil hydraulic
parameters via kriging. The S&L site heterogeneity is apparent due to the significant
differences of hydraulic parameters in the different locations and layers. The imperfectly
stratified layering structure can be found for the soil hydraulic parameters in Figure 5.7,
especially for saturated hydraulic conductivity. The simulated saturated hydraulic
conductivity is less than 10 m/d in most area of the model domain and is around 25 m/d
in the area with depth between 5 m and 10 m and width between 0 m and 10 m. The
layering structure is not apparent in the heterogeneous fields of the soil hydraulic
parameters, especially saturated hydraulic conductivity, indicating that the interpolated
parameter fields do not represent well the real parameter fields. The interpolated
heterogeneous field of saturated water content also has the imperfectly stratified layering
139

structure similar to the saturated hydraulic conductivity. The reasons could be that the
most site measurements are clustered in three close boreholes, and small horizontal
correlation scales are used in kriging. The generated fields of van Genuchten a and n, and
residual water content have better results than the saturated hydraulic conductivity and
saturated water content and the layering structure can be found due to the relatively large
horizontal correlation scales. However, the results still could be improved due to the
sparse clustered sampling data for the soil hydraulic parameters in the study site. This
could be achieved by incorporating the secondary information (e.g., initial moisture
content) with a large set of samples into the heterogeneous field interpolation by
cokriging approaches.
5.5 Conclusions
This study presented a method to couple the Bayesian updating with ASMLCV to
estimate the spatial correlation structures of the soil hydraulic parameters. The prior
probability of the correlation scales for the hydraulic parameters was updated to yield the
corresponding posterior probability distributions through the likelihood function
estimated by ASMLCV approach based on site measurements. The heterogeneous fields
of the soil hydraulic parameters can then be interpolated by kriging based on the
estimated mean values of the horizontal and vertical correlation scales from the updated
posterior probability.
The posterior probability distributions for the correlation scales have inversely
proportional relationships with the NLL values and are significant different from the prior
triangular distributions, indicating the updated posterior probability depends largely on
140

(a) van Genuchten a (b) van Genuchten n
y25
(e)Ks
30 35 ,„,,40 M%)
10 2°Ks(m3/3) 4 ° 5 °
Figure 5.6 Comparison of kriged and measured soil hydraulic data at borehole S-1 shown in Figure 5.1.
141

a(1/cm)
16.0 15.0 14.0 13.0 12.0 11.0 10.0
9.0 8.0 7.0 6.0 5.0 4.0 3.0 2.0 1.0
M%» 38.5 37.9 37.2 36.6 36.0 35.3 34.7 34.1 33.4 32.8 32.2 31.5 30.9 30.3 29.6 29.0
Ks (m/d)
50.0 47.0 44 S> 41 S> 38.0 35.0 32.0 29.0 26.0 23.0 20.0 17.0 14.0 11.0 8.0 5.0
n 3.5 3.4 32 3.1 3.0 23 2.7 2.6 25 2.4 22 2.1
—I 2.0 — 13 — 1.7 ZM 1.6
&,{%)
5.0 4.7 4.3 4.0 3.7 3.3 3.0 2.7 2.3 2.0 1.7 1.3 1.0 0.7 0.3 0.0
Figure 5.7 Generated heterogeneous fields of soil hydraulic parameters using kriging.
142
the likelihood function estimated based on field measurements. The means of posterior
probability distributions for vertical correlations scales of the parameters are around or
smaller than 1.0 m. The estimates are reasonable because the layer thickness of this study
site is around 2-3 m and the sampling interval in boreholes S-l, S-2, and S-3 is very
small (0.305 m). The means of posterior probability distributions for horizontal
correlation scales of the parameters vary from 3 m ~ 12.5 m, indicating the significant
different horizontal correlation scales among the soil hydraulic parameters.
The good agreement of field measurements and kriged parameter fields at
borehole S-l indicate that the kriging results are reliable to represent the S&L site
heterogeneity. Therefore, the updated spatial correlation scales may improve the
estimation of spatial correlation scales and the simulations of heterogeneous fields for the
soil hydraulic parameters. The imperfectly stratified layering structure is apparent in the
interpolated 3-D heterogeneous fields of the soil hydraulic parameters. The results could
be further improved by incorporating the secondary information (e.g., initial moisture
content) with a large set of samples into the heterogeneous field generation using
cokriging approaches.
5.6 References
Bardossy, A., and W. Lehmann. 1998. Spatial distribution of soil moisture in a small
catchment. Part 1: geostatistical analysis. J. Hydrol. 205:1-15.
Berger, J.O., V.D. Oliveira, and B. Sanso. 2001. Objective Bayesian analysis of spatially
correlated data. J. Am. Stat. Assoc. 96(456): 1361-1374.
143
Bowen, W.M., and C.A. Bennett. 1988. Statistical methods for nuclear material
management. Report NUREG/CR-4604. Pacific Northwest National Laboratory,
Richland, Washington, USA.
Carrera, J., and S.P. Neuman. 1986. Estimation of aquifer parameters under transient and
steady-state conditions 1. Maximum-likelihood method incorporating prior
information. Water Resour. Res. 22(2): 199-210.
Carsel, R.F., and R.S. Parrish. 1988. Developing joint probability distributions of soil
water retention characteristics. Water Resour. Res. 24(5):755-769.
Deutsch, C.V., and A.G. Journel. 1998. GSLIB: Geostatistical software library and user's
guide (2nd edition). Oxford University Press, New York, USA.
Dietrich, C.R., and M.R. Osborne. 1991. Estimation of the covariance parameters in
kriging via the restricted maximum likelihood. Math. Geol. 23(1): 119-135.
Isaaks, E.H., and R.M. Srivastava. 1989. Applied Geostatistics. Oxford University Press,
New York, USA.
Johnson, N.L., and S. Kotz. 1970. Distributions in statistics: Continuous univariate
distributions, Vol. 1. Houghton Miffin Company, Boston, Massachusetts, USA.
Kennedy, P.L., and A.D. Woodbury. 2002. Geostatistics and Bayesian updating for
transmissivity estimation in a multiaquifer system in Manitoba, Canada. Ground
Water. 40(3):273-283.
Kitanidis, P.K., and R.W. Lane. 1985. Maximum likelihood parameter estimation of
hydrologic spatial processes by the Gauss-Newton method. J. Hydrol. 79:53-71.
Kitanidis, P.K. 1986. Parameter uncertainty in estimation of spatial functions: Bayesian
analysis. Water Resour. Res. 22(4):499-507.
144

Mallants, D., D. Jacques, M. Vanclooster, J. Diels, and J. Feyen. 1996. A stochastic
approach to simulate water flow in a macroporous soil. Geoderma. 10:299-324.
Meyer, P.D., M.L. Rockhold, and G.W. Gee. 1997. Uncertainty analysis of infiltration
and subsurface flow and transport for SDMP sites. NUREG/CR-6565, PNNL-
11705. U.S. Nuclear Regulatory Commission, Office of Nuclear Regulatory
Research, Washington, DC, USA.
Pan, F., M. Ye, J. Zhu, Y.S. Wu, B.X. Hu, and Z. Yu. 2009a. Incorporating layer-and
local-scale heterogeneities in numerical simulation of unsaturated flow and tracer
transport. J. Contam. Hydrol. 103:194-205, doi: 10.1016/j.jconhyd.2008.10.012.
Pan, F., M. Ye, J. Zhu, Y.S. Wu, B.X. Hu, and Z. Yu. 2009b. Numerical evaluation of
uncertainty in water retention parameters and effect on predictive uncertainty.
Vadose Zone J. in press.
Pardo-Iguzquiza, E. 1998. Maximum likelihood estimation of spatial covariance
parameters. Math. Geol. 30(1):95-108.
Pardo-Iguzquiza, E. 1999. Bayesian inference of spatial covariance parameters. Math.
Geol. 31(l):47-65.
Ritzi, R.W., D.F. Jayne, A.J. Zahradnik, A.A. Field, and G.E. Fogg. 1994. Geostatistical
modeling of heterogeneity in glaciofluvial, buried-valley aquifers. Ground Water.
32(4):666-674.
Samper, S.J., and S.P. Neuman. 1989a. Estimation of spatial covariance structures by
adjoint state maximum likelihood cross validation 1. Theory. Water Resour. Res.
25(3):351-362.
145

Samper, S.J., and S.P. Neuman. 1989b. Estimation of spatial covariance structures by
adjoint state maximum likelihood cross validation 2. Synthetic experiments.
Water Resour. Res. 25(3):363-371.
Samper, S.J., and S.P. Neuman. 1989c. Estimation of spatial covariance structures by
adjoint state maximum likelihood cross validation 3. Application to
hydrochemical and isotopic data. Water Resour. Res. 25(3):373-384.
Sminchak, J.R., D.F. Dominic, and R.W. Ritzi. 1996. Indicator geostatistical analysis of
sand interconnections within a till. Ground Water. 34(6): 1125-1131.
Viswanathan, H.S., B.A. Robinson, C.W. Gable, and W.C. Carey. 2003. A geostatistical
modeling study of the effect of heterogeneity on radionuclide transport in the
unsaturated zone, Yucca Mountain. J. Contam. Hydrol. 62-63:319-336.
Vrugt, J.A., and W. Bouten. 2002. Validity of first-order approximations to describe
parameter uncertainty in soil hydrologic models. Soil Sci. Am. J. 66:1740-1751.
Ward, A.L., T.G. Galdwell, and G.W. Gee. 2000. Vadose zone transport field study: soil
water content distributions by neutron moderation. PNNL-13795. Pacific
Northwest National Laboratory, Richland, Washington, USA.
Yates, S.R., and A.W. Warrick. 1987. Estimating soil water content using cokriging. Soil
Sci. Soc. Am. J. 51:23-30.
Ye, M., S.P. Neuman, P.D. Meyer, and K.F. Pohlmann. 2005a. Sensitivity analysis and
assessment of prior model probabilities in MLBMA with application to unsaturated
fractured tuff. Water Resour. Res. 41:W12429, doi: 10.1029/2005WR004260.
146
Ye, M., R. Khaleel, and T-C.J. Yeh. 2005b. Stochastic analysis of moisture plume
dynamics of a field injection experiment. Water Resour. Res, 41:W03013, doi:
10.1029/2004WR003735.
Ye, M., R. Khaleel, M.G. Schaap, and J. Zhu. 2007a. Simulation of field injection
experiments in heterogeneous unsaturated media using cokriging and artificial
neural network. Water Resour. Res. 43:W07413, doi:10.1029/2006WR005030.
Ye, M., F. Pan, Y.S. Wu, B.X. Hu, C. Shirley, and Z. Yu. 2007b. Assessment of
radionuclide transport uncertainty in the unsaturated zone of Yucca Mountain.
Adv. Water Resour. 30:118-134.
Zhou, Q., H.H. Liu, G.S. Bodvarsson, and CM. Oldenburg. 2003. Flow and transport in
unsaturated fractured rock: effects of multiscale heterogeneity of hydrogeologic
properties. J. Contam. Hydrol. 60:1-30.
147
CHAPTER 6
CONCLUSIONS
Four research topics were presented in this dissertation related to
characterizations of heterogeneous hydraulic properties, predictive uncertainty and
sensitivity analysis of flow and contaminant transport in the unsaturated zone. In general,
this study addressed the problems of characterizing the layer- and local-scale
heterogeneities in hydraulic parameters using geostatistical methods when the core
samples are sparse, evaluating the predictive uncertainties in flow and tracer transport
due to layer- and local-scale heterogeneities in hydraulic parameters in the UZ,
investigating the contributions of individual parameter uncertainties to the flow and
transport uncertainties, and estimating the spatial correlation structures of hydraulic
parameters using a coupled method of Bayesian updating and ASMLCV in
heterogeneous media.
More specifically, the first study (Chapter 2) addressed two problems in
numerical simulations of unsaturated flow and contaminant transport. The first is how to
estimate the PDFs of the water retention parameters when measurements of the
parameters are sparse and the prior PDFs are unknown; the other is how to evaluate the
effects of the uncertainties in water retention parameters on the predictive uncertainties in
unsaturated flow and contaminant transport. The first problem was resolved using the
non-conventional ML approach, which approximates the PDFs as multivariate Gaussian
148

without requiring the prior PDFs and large number of parameter measurements. This
study provided a method of estimating the mean and covariance of PDFs based on the
least-square fitting results, which can be easily estimated from existing software such as
RETC. This study also evaluated the relative effects of the uncertainties in the water
retention parameters (to those in permeability and porosity) on the predictive
uncertainties of flow and transport using the Monte Carlo method. Predictive variance of
the percolation flux increases if the random water retention parameters are taken into
account, while the uncertain water retention parameters have limited effects on the mean
predictions of percolation fluxes. The similar conclusion is also true for the magnitude
and spatial pattern of the simulated plume of both conservative and reactive tracers. The
travel time of the two types of tracers also becomes more uncertain after incorporating
the uncertain water retention parameters.
The second study (Chapter 3) incorporated the layer- and local-scale
heterogeneities of hydraulic parameters and investigated the relative effects of the two
types of heterogeneities on predictive uncertainties of flow and tracer transport in the UZ.
The layer-scale uncertainty is more important than local-scale heterogeneity in simulating
the field observed flow patterns and trends. While the local-scale heterogeneity only
slightly affects the mean predictions of percolation fluxes and tracer plumes, it
significantly increases predictive uncertainties in these quantities, implying that more
random and complicated flow paths are created by the local-scale heterogeneity. This is
also true for the spatial distribution of the normalized cumulative mass arrival. The local-
scale heterogeneity increases the mean travel time of the reactive and conservative tracers
at early stage, but the effects gradually decrease over time. The layer-scale uncertainty is
149

also more important than local-scale heterogeneity in simulating the travel time of
cumulative mass to the water table. If one wants to reduce overall predictive uncertainty
in tracer travel time, an effort should be made to reduce the uncertainty in layer-scale
values by improving the 3-D model calibration, recalling that layer-scale values were
obtained from inverse modeling.
The third study (Chapter 4) was the global sensitivity analysis to investigate the
contributions of individual parameter uncertainties to the flow and transport uncertainties
in the UZ. The relative effects of parameter correlations on the sensitivity analysis were
also investigated by comparing the sensitivity results with and without considering the
parameter correlations. The obtained insights provided meaningful information on how to
reduce the uncertainties in unsaturated flow and contaminant transport predictions
through targeted layer- and local-scale characterizations. When the input parameters are
independent, the uncertainty in permeability has the largest contributions to the
uncertainties in percolation flux and the normalized cumulative mass arrival at each block
of the water table. The sorption coefficient of the reactive tracer is the second important
parameter in the layers of devitrified and zeolitic tuffs and has the smallest contributions
in the layers of vitric tuff. For the overall tracer transport uncertainty, the uncertainties in
the permeability and van Genuchten a have more contributions to the uncertainties in
total cumulative mass arrival at the water table at the early stage. As time evolves, the
uncertainty in porosity becomes more important. As the transport progresses further, the
sorption coefficient of the reactive tracer becomes the dominant parameter in contributing
to the uncertainties in overall tracer transport. When the input parameters are correlated,
the uncertainty in van Genuchten n becomes important to the percolation flux
150

uncertainty, mainly due to its high correlation with the van Genuchten a. The importance
of sorption coefficient to the tracer transport uncertainty has not changed when the
parameter correlations are considered, due to the assumption of zero correlations between
the sorption coefficient and other hydraulic parameters. The rankings of parameter
importance also change if the parameter correlations are taken into account, indicating
that the significant effects of parameter correlations on the sensitivity of unsaturated flow
and contaminant transport.
The fourth study (Chapter 5) addressed the problem of how to improve the
heterogeneity characterizations of hydraulic parameters through incorporation of prior
information and available sparse field data using geostatistical approaches. This study
presented a method to couple the Bayesian updating with ASMLCV approach to estimate
the spatial correlation structures of the soil hydraulic parameters. The posterior
probability distributions for the correlation scales have the inverse proportional
relationships with the NLL values and are significantly different from the prior triangular
distributions, indicating the updated posterior probability depends largely on the
likelihood function estimated based on the available field measurements. The good
agreement of field measurements and kriged parameter fields at borehole S-l indicate
that the kriging results are reliable to represent the S&L site heterogeneity. Therefore, the
updated spatial correlation scales may improve the heterogeneity characterizations of
hydraulic parameters representing the spatial variability of the parameters in the study
site. The results could be improved by incorporating secondary information (e.g., initial
moisture content) with a large data set of samples into the heterogeneous parameter field
generation using cokriging approaches.
151

In summary, the four research topics presented in this dissertation incorporated
the geostatistical methods and numerical simulations to characterize the heterogeneities
of hydraulic parameters and evaluate the uncertainty and sensitivity of flow and
contaminant transport in heterogeneous UZ. The non-conventional ML approach
provided an effective way of estimating the parameter PDFs of the hydraulic parameters
when the site measurements are sparse and the prior parameter PDFs are unknown. The
findings of relative importance of layer- and local-scale heterogeneities and individual
hydraulic parameters to flow and tracer transport uncertainties can point to the most
influential locations and parameters in directing possible future field characterizations in
order to reduce the overall and/or spatial predictive uncertainties of flow and contaminant
transport modeling. The coupled method of Bayesian updating and ASMLCV can
improve the spatial correlation structure estimation with the incorporation of available
site measurements and prior information.
Based on the results of this dissertation work, future efforts can focus on the
improvement of heterogeneity characterizations in hydraulic parameters by incorporating
the available information related to the parameters such as soil texture properties,
lithologic and topographical data etc. The future work can also be extended to
uncertainty assessments in flow and contaminant transport due to conceptual model
uncertainty in order to better understand the physical processes of unsaturated flow and
contaminant transport.
152
APPENDIX A
MATHEMATICAL MODEL OF THE UZ FLOW AND TRACER TRANSPORT
A.l Flow Governing Equations
The dual-continuum approach is applied to separate the physical processes of
flow and transport into fracture and matrix systems and to handle the fracture-matrix
interaction in a fractured porous media (Wu et al., 1999; Wu and Pruess, 2000). The
physical processes of unsaturated flow in fracture and matrix are governed by Richard's
equation, conservation of mass, and Darcy's law (BSC, 2004a, Wu and Pruess, 2000).
The basic mass and energy equations for fracture or matrix in the dual-continuum system
are (BSC, 2004a):
j - \MkdVn = \FkndTn+\qkdVn (A.l) ill y Y y
where: Mk is mass or energy per volume; F* is mass or heat flux; qK is sinks and
sources; K"is the mass components (air, water, and tracer etc.); Tnis the closed surface;
and Vn is an arbitrary subdomain.
The mass accumulation of water and air components {Mk in Eq. (A.l)) for matrix
or fracture can be written as (BSC, 2004a; Wu and Pruess, 2000):
Af*=X(#vVrJ) (A.2)
153
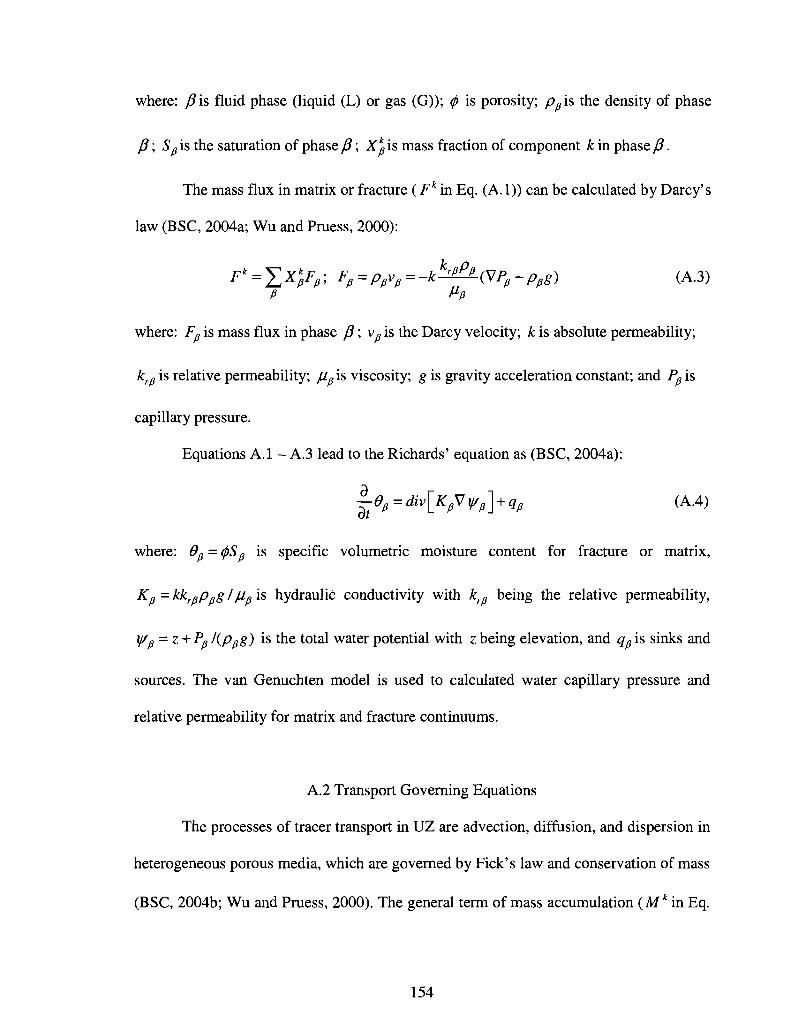
where: /?is fluid phase (liquid (L) or gas (G)); (/> is porosity; p^is the density of phase
P; Sp is the saturation of phase J3; Xkp is mass fraction of component k in phase /?.
The mass flux in matrix or fracture (Fk in Eq. (A.l)) can be calculated by Darcy's
law (BSC, 2004a; Wu and Pruess, 2000):
P Vp
where: Fp is mass flux in phase fi; vp is the Darcy velocity; & is absolute permeability;
krp is relative permeability; / ^ is viscosity; g is gravity acceleration constant; and Pp is
capillary pressure.
Equations A.l - A.3 lead to the Richards' equation as (BSC, 2004a):
— 0p= div [KpV \l/p\ + qp (A.4)
where: dp = 0Sp is specific volumetric moisture content for fracture or matrix,
Kp=kkrpPpgljUpis hydraulic conductivity with krp being the relative permeability,
y/p-z + Pp l{Ppg) is the total water potential with z being elevation, and qp is sinks and
sources. The van Genuchten model is used to calculated water capillary pressure and
relative permeability for matrix and fracture continuums.
A.2 Transport Governing Equations
The processes of tracer transport in UZ are advection, diffusion, and dispersion in
heterogeneous porous media, which are governed by Fick's law and conservation of mass
(BSC, 2004b; Wu and Pruess, 2000). The general term of mass accumulation (Mk in Eq.
154
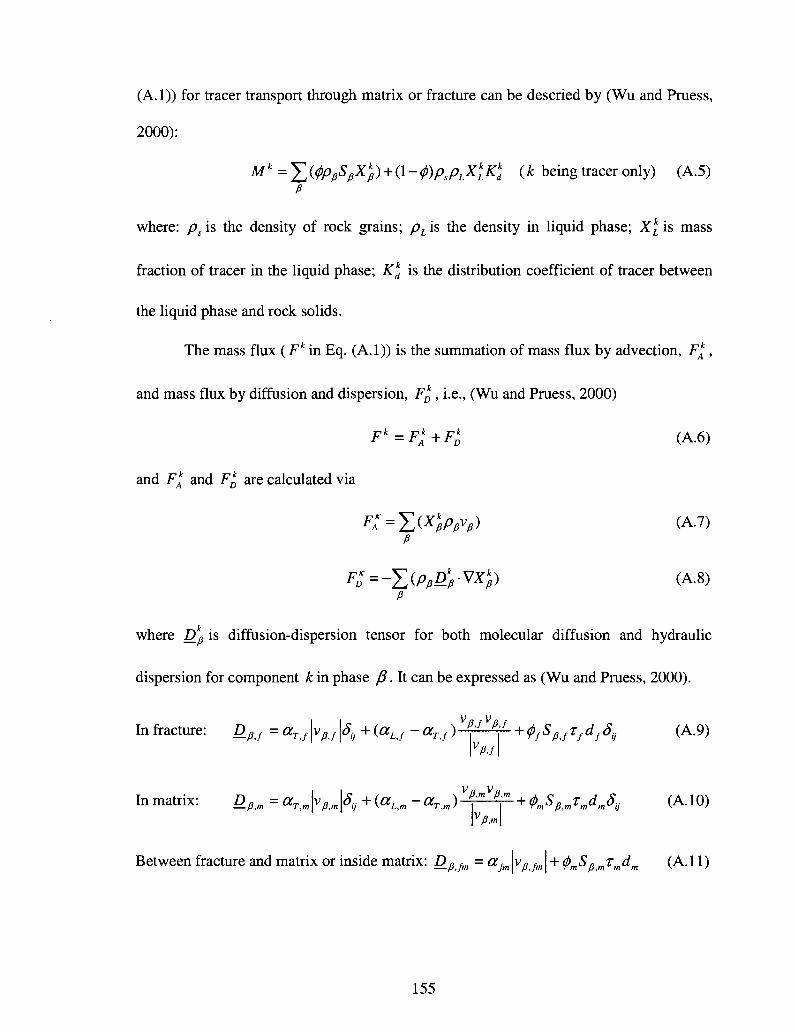
(A.l)) for tracer transport through matrix or fracture can be descried by (Wu and Pruess,
2000):
Mk =^(^pfiSfiXkfi) + (}-p)P,PLXk
LKkd (k being tracer only) (A.5)
P
where: ps is the density of rock grains; pL is the density in liquid phase; XkL is mass
fraction of tracer in the liquid phase; Kkd is the distribution coefficient of tracer between
the liquid phase and rock solids.
The mass flux (Fk in Eq. (A.l)) is the summation of mass flux by advection, Fk,
and mass flux by diffusion and dispersion, Fk, i.e., (Wu and Pruess, 2000)
Fk=Fk+Fk (A.6)
and Fk and Fk are calculated via
p
F^-YiPp&p-VXl) (A.8) P
where D_p is diffusion-dispersion tensor for both molecular diffusion and hydraulic
dispersion for component k in phase /?. It can be expressed as (Wu and Pruess, 2000).
I I VB fV0 f
In fracture: Dfif = aT f \vp f \Sy + (aL f - aT f) . ' +<pfSfif tf df 8tj (A.9) \VPJ\
Inmatrix: D^m= a ^ v ^ +(aL,m - a ^ ^ ^ + ̂ S^rJJ, (A.10) \VPA
Between fracture and matrix or inside matrix: D_pifm = u^p A + (f)mSpmTmdm (A.ll)
155

where D_p p is diffusion-dispersion tensors for transport through fractures (/? = / ) ,
matrix (p = m), and between fractures and matrix or inside matrix (p = fin); aT ,aL
are transverse and longitudinal dispersivities of fractures and matrix respectively; a^ is
longitudinal dispersivity along fracture-matrix or inner matrix-matrix connections; 2^ is
the tortuosity of fracture or matrix continuum; dp is the molecular diffusion coefficient in
phase fi; and dtj is Kroneker delta function.
When tracer k undergoes radioactive decay, the rate of mass change can be
described by the first-order decay law:
dM k =-\Mk (A. 12) dt
where Xk is radioactive decay constant of radionuclide tracer A: defined as
\=^~ (A.13) 01,2)*
(Ty2)k being the half life of tracer k. Therefore, the transport equation of each component
k within the fracture or matrix continuum can be obtained by substituting Eqs. A.5, A.7,
A.8, and A. 12 into A.l (Wu and Pruess, 2000):
^{^pfiS/}X^ + a-^pspLXkLKk
d} + Ak{^pfiS^Xkfi) + a-^pspLXk
LKkd} =
-Yy-(Ppxkpvp)+Yy-(ppDkp-vxkp)+qk (A.i4)
156

A. 3 References
BSC (Bechtel SAIC Company). 2004a. UZ flow models and submodels. Report MDL-
NBS-HS-000006 REV02. Lawrence Berkeley National Laboratory, Berkeley,
California and CRWMS M&O, Las Vegas, Nevada, USA.
BSC (Bechtel SAIC Company). 2004b. Radionuclide transport models under ambient
conditions. Report MDL-NBS-HS-000008 REV02. Lawrence Berkeley National
Laboratory, Berkeley, California and CRWMS M&O, Las Vegas, Nevada, USA.
Wu, Y.S., C. Haukwa, and G.S. Bodvarsson. 1999. A site-scale model for fluid and heat
flow in the unsaturated zone of Yucca Mountain, Nevada. J. Contam. Hydrol.
38:185-215.
Wu, Y.S., and K. Pruess. 2000. Numerical simulation of non-isothermal multiphase tracer
transport in heterogeneous fractured porous media. Adv. Water Resour. 23:699-
723.
157

VITA
Graduate College University of Nevada, Las Vegas
Feng Pan
Home address: 4566 Maxwell Peak Ct. Las Vegas, NV 89139
Degrees: Bachelor of Engineering, Hydrology and Water Resources, 2000 Sichuan University, China
Master of Science, Water Resources Management, 2005 University of Nevada, Las Vegas
Special Honors and Awards: • Colin Warden Memorial Endowment Award, DRI, Dec. 2008 • Bernada E. French Scholarship in Geology, UNLV, Jul. 2008 • Bernada E. French Scholarship in Geology, UNLV, Jul. 2007 • George Burke Maxey Award in Water Resources Research, DRI, Apr. 2007 • The Aileen and Sulo Maki Hydrogeology/Hydrology Fellowship, DRI, Sep. 2005 • NSF EPSCoR Advanced Computing in Environmental Sciences (ACES)
Scholarship, May 2005
Publications: • Pan, F., M. Ye, J. Zhu, Y.S. Wu, B.X. Hu, and Z. Yu. 2009. Numerical evaluation of
uncertainty in water retention parameters and effect on predictive uncertainty. Vadose Zone J. in press.
• Pan, F., M. Ye, J. Zhu, Y.S. Wu, B.X. Hu, and Z. Yu. 2009. Incorporating layer- and local-scale heterogeneities in numerical simulation of unsaturated flow and tracer transport. J. Contam. Hydrol. 103:194-205, doi:10.1016/j.jconhyd.2008.10.012.
• Ye, M., F. Pan, Y.S. Wu, B.X. Hu, C. Shirley, and Z. Yu. 2007. Assessment of radionuclide transport uncertainty in the unsaturated zone of Yucca Mountain. Adv. Water Resour. 30:118-134.
158
• Yu, Z., F. Pan, C. Liang, Z. Liang, Z. Lin, and L. Ren. 2006. Application of hydrologic model system to the flood simulation in the Emei stream watershed. Advances in Water Science, 17(5):645-652 (in Chinese).
Dissertation Title: Uncertainty, Sensitivity and Geostatistical Studies of Flow and Contaminant Transport in Heterogeneous Unsaturated Zone
Dissertation Examination Committee: Chairperson, Dr. Zhongbo Yu, Ph. D. Committee Co-Chair, Dr. Jianting Zhu, Ph. D. Committee Member, Dr. Michael Nicholle , Ph. D. Committee Member, Dr. Ganqing Jiang, Ph.D. Graduate Faculty Representative, Dr. Sandra Catlin, Ph. D.
159
Recommended