UNCLASSI FlED
AD 4 23 99 8
DEFENSE DOCUMENTATION CENTERFOR
SCIENTIFIC AND TECHNICAL INFORMATION
CAMERON STATION. ALEXANDRIA. VIRGINIA
UNCLASSIFIED

A DIGITAL COMPUTER PROGRAM
FOR A
BRUCETON ANALYSIS
FORREST L. MCMAINS
AMCMS 5023.11.18400
COPY NO. 1 OF -AUGUST 1963
OEt; 4
PICATINNY ARSENALDOVER, NEW JERSEY

The findings in this Report are not to be construed as
an official Department of the Army position.
DISPOSITION
Destroy this report when it is no longer needed.Do not return.
DDC AVAILABILITY NOTICE
Qualified requesters may obtain copies of this report
from DDC.

TECHNICAL MEMORANDUM 1254
ADIGITAL COMPUTER PROGRAM
FOR ABRUCETON ANALYSIS
BY
FORREST L. MC MAINS
AMCMS 5023.11. 18400 AUGUST 196.
SUBMITTED BY REVIEWED BY:S. KRAVITZ . A. BERMAN
Chief, Evaluation Unit Chief, SpecialAmmunition & AnalysisSection
APPROVED BY: -/YA. I-.C'-E. H. BUCHANANChief, ArtilleryAmmunition Laboratory
AMMUNITION ENGINEERING DIRECTORATEPICATINNY ARSENALDOVER, NEW 3ERSEY

TABLE OF CONTENTS
Section Page
ABSTRACT 1
INTRODUCTION I
DISCUSSION
PART I -- Input and Output Format 2
A. Input Format 2B. Output Format 2
PART II -- Numerical Calculations 4
A. Primary Statistics 4B. Secondary Statistics 5C. Confidence Interval 6D. Final Calculations 6
REFERENCES 7
APPENDIX
A. Fortran Program for a Bruceton Analysis 8-10
ABSTRACT DATA 11
TABLE OF DISTRIBUTION 12
(i)

ACKNOW LEDGEMENT
The author, is grateful to Richard Aaron and Frederick Correll-df
the Artillery Ammunition Laboratory for suggesting that such a programwas necessary and their invaluable aid in performing the calculations.Also appreciated is the assistance of Disan Georgevich of the ArtilleryAmmunition Laboratory, who supplied the data to test the program.

ABSTRACT
A digital computer program was developed for performing the Brucetonstatistical analysis on an IBM 709 or IBM 7090. A brief description of theBruceton test is given -. followed by an outline of the method of analysiswhich this program uses. Input and output formats are discussed.
INTRODUCTION
The purpose of this report is to describe a digital computer programwhich was developed for performing a statistical analysis of sensitivitydata obtained from the Bruceton Test.
Part I discusses the input and output formats. Part II discusses thenumerical calculations used. The appendix lists the program as writtenin Fortran.
The Bruceton Test -- developed by the Explosives Research Laboratoryat Bruceton, Pennsylvania -- measures electrical sensitivity of anelectro-explosive devir, at a specific level of frequency. The lowestpower level should fall above the "no-fire" level for the device being eval-uated and the highest power level should fall below the "tall-fire" powerlevel. This test is preferable to other similar tests in that it concentratesthe testing near the mean. Therefore. in most situations, a desireddegree of reliability can be obtained with a smaller sample.
With the data from a Bruceton Test the mean (m) or the 50% firinglevel and the standard deviation'(if) can be calculated. Further computa-tion yields the extreme probabilities such as the 99.90 and the 0. 1%1 levels.These are expressed with the confidence intervals included.
This statistical analysis is based on the Bruceton Report (Reference 1).It is assumed that the calculations found in Part II will be used in conjunc-tion with the Bruceton Report and the Franklin Institute Memorandum(Reference Z).
-1

DISCUSSION
Part I - Input and Output Formats
A, Input Format
The first ten data cards will be the same for any group of runs.These are constant values (G, H and S) obtained from the graphs foun
in the Bruceton Report.
Following this set of cards, any number of runs may be includedprovided each run is in correct sequence.
The format for the first data card is:
Spaces I through 20 (inclusive) are reserved for an identification.Spaces 21-25 are reserved for the number of levels used.Spaces 26-35 are reserved for the common logarithm of the lowest
level.Spaces 36-45 are reserved for the constant interval between the
logarithms of the levels.Spaces 46-50 are reserved for the probability level (in percent).Spaces 51-55 are reserved for the confidence level (in percent).Spaces 56-60 are reserved for the value of the first (lowest)
level (in milliwatts).Spaces 61-65 are reserved for the number of "fires" at that level.Spaces 66-70 are reserved for the number of "no-fires" at that
level.Spaces 71-80 are blank.
Each successive level, followed by the "fires" and "no-fires" at thatlevel (in that order). are placed on the second card with five spaces re-served for each value. If more data remains after the second card is used;a third, fourth, etc., may be used with the same format.
As a convenience those numbers above, which are whole numbers, neednot be written with a decimal.
B. Output Format
The output will list all the input data as well as every intermediaryvalue used in the analysis. The values used in the primary statistics and
in the secondary statistics are so labeled.
-2-

If P and E equal the input probability and confidence levels respec.tively. then in the final calculations the values (both in logarithmic unitsand milliwatts)consist. of
P% probability with E% confidence and(lO-P)% probability with E% confidence.
" 3-

Part II - Numerical Calculati6ns
A* Primary Statistics
Let N equal the number of levels used.Let X(i), where i=O, 1s 2, . .N, equal the value of each level.Let n (i) equal the number of "fires" at each level.Let no(X), equal the number of "no-fires"' at each level.Let c equal the logarithm of the lowest level.Let d equal the constant.logarithmic interval between levels.Let P% equal the probability level.Let E% equal the confidence level.
DI n (i) No= n
Bx I x o1 0 1i)i
Mx = NBin-A 2= N .0'A
NX2 No 2
= c + d(±A! - 1/2) m o = c + d(±.- 1/2)BX B O
If My< 0.3, the smallest absolute value R mX - log X(i)
is evaluated and Graph I in the Bruceton Report is used to find s x O Incorpo-rated in the program (data cards 3. 10) are 268 points taken from this graphwithM x = .05# .06p ... , .30 and R = O, .5, ,1, .15, ... , .5
-4-

Similarly s o if Mo < 0.3.
the computation is Crx = sxd
do = sad
However, if M x > 0.3 then
x . 6Zd (M + 0.029) N-
*00 1.62d(ML + 0.029) N0
B. Secondary Statistics
m = Nomo + Nxmx = Noo +IN +NV o+
NO x 10+ x0o X0 Ixx
= Antilog m; m equals the mean or 50% firing leveland O" equals the standard deviation.
S=
d
N=No +N x
N 7- when N in an even integer
= I when N is an odd integer2
-5-

C. Confidence Interval (Y)
1/2
Y = k ( .)(G ~p
E n n
where kE, kp, G and H are obtained from the Bruceton Report.
kE and k- are found in the table on Page 19 and G and H from Graphs
III, IV and V. The table, in its entirety, is incorporated in the program#and 17 points are taken from each of the graphs and placed on data cardsI and2.(S= 02, 03, *.0, 1.0,1.5, 2.0*0., 5.0). Straight line inter-polations are made for values between these points.
D. Final Calculations
P% (E% confidence) = m + kp .+ Y
(100-P)% (Efe confidence) = m-- kp + Y
-6-

REFERENCES
1. AMP Report No. 101.R, Statistical Analysis for A New Procedure inSonsitivity Experiments (!'Bruceton Report"), July 1944.
Z. Paul R. Mohrbach and Robert F. Wood. The Franklin Institute Labora-tory Memorandum Report LM-A--Z369-Zg Methods and Equipment for RFSensitivity Evaluation of Electro-explosive Devices, October 1961.
-7-

APPENDIX

APPENDIX A
FORTRAN PROGRAM FOR A BRUCETON ANALYSIS

BRUCETON STATISTICAL ANALYSIS
LCGF(W) a *&4343.LOGF(W)ANT'F(W) - EXPF(W/094343)DIME:NSION Gt!50 ),H(50) ,K(50), IDENT(20) ,FIX(50) ,FAX(50) ,Y(-50),AB(30,115)
I READ INPUT TAPE 2929(G(1),I=2910)tG(15),G(20)tG(25),G(3o,,G(35)tG(140) ,G(45)tG(5O)
2 FORMAT(l7F4.3)3 READ INPUT TAPE 2,4,IH(I),1u2,l0),H(15),H(20)tH(25),H(30),H13r5),M(140)vH(45)i.1H(5O)
4 FORMATII7F3.2)READ INPUT TAPE 297,((AB(JI),J=5,30),!-19i1)
7 FIRMAT(36F2.;0/ 36F2.0/36F2.0/36F2.0/36F2.0/36F2.0/36F2.O/34F2.'O)5 READ INPUT TAPE 2969 (IDENTMJ ,J=1,20) tNtCDtPEg (XI I),@FIX(I )*FAX( IU1) 19N)
6 FORMAT(20Al,15,2FI0.OSF5.0,2X/(14F5.Ot2X))P1 - 100.-PAIXI -0.0AFAX- 0.0BFIX= 0.0SFAX- 0.0SFIX= 0.0SFAX- 0.0I SO0
10 W-1 PAGE 1AFIX mAFIX + W.FIX(14l)AfAX mAFAX + W.FAX(I+1)BFIX xBFIX .(W*.2)*FIX(I.1)BFAX =BFAX e(W..2)*FAX(I,1)SfIX -SFIX -F I X( 1 1)SFAX =SFAX +FAXIIGI)Iz=1.1IF(I-N.1) 10.10,11
It RuDTFIX -I (SFIX*BFIX)-AF[Xee2)/(SFIX..2)TFAX=( (SFAX.BFAX)-AFAX.*2)/(SFAX..2)
13 UFIXw C4R*(AFIX/SFIX-0.5)UFAX- C4R*(AFAX/SFAX.0.5)IF(TFIX-0.3) 118,23923
118 CIXmTFIX*IOO.LIX-CIX
III WEEIX=500.1=0
112 WEEIXMINF(WEEIXABSF(UFIX-LCGF(X(+1))))1-1+lIF(I-N41) 112t1129113
1130 RIXSABSFIWEFIX/R)KIX-X I NTF (RI X*22. ) +1VFIX=(AB(LIXPKIX)/100. )'R
24 IF(TFAX-0.3) 117,25,25117 CAX-TFAX.100.
LAX-AX114 WEEAX500.
ISOL15 WEEAXuMINIF(WEEAXABSF(UFAX-LCGF(X(I41))))

BRUCETON STATISTICAL ANALYSIS
IFII-N.1) 115,115,116116 RAX-ABSF(W:EE'AX/R)
KAX=XINTF(RAX*2o.)*1VFAXz(AB(LAXtKAX)/10.)*'fGO TO 26
23 VFIX= 1.62.R.(TFJX.0.029).SQRTF(SFIX/(SFIX-1.))GO TO 24
25 VFAX= 1.62*R*(TFAX+0.02'9)*SQRTF(SFAX/(SFAX-1.))26 U -((SFAX*UFAX)4(SFIX*UFIX))/(SFAX4SFIX)
V x SQRTF(4SFAX.(VFAX.*2)4SFIX.(VFIXO*2))/(SFAX4SFIX))ZE TA-.ANTF (U)IF(99.-P) 51,00
50 KP=99.9-PGO TO 60
51 KlP=(100.-P)*IOO.'60 IF(99.-E) 53t52,5252 KX-9'9.9-E
GO TO 6153 KX- (100. -E) *1000161 Y(49)=0.0
Y24)=0. 675Y(9)=1.282Y4) =1. 645Y(0)=2. 326Y( 10)-3.090Y( 1['3.719 PAGE 2S= V/RZ = S.10.SX- SFIX+SF&XSX2 z(SX+1.)12.KS2 =SX2SX3 a KS2
14 IF(Z-504)15*15tl00
L6 IF(Z-10.)40,17,1817 K-Z
A=GW(K)B-H(K)GO TO 19
40 KzZS2=KA-(G(K,1)-G(K))4(Z-SZ) + G(K)B=(H(K41)-H(KJ)e*(l-S2) + H(K)GO TO 19
18 SIz Z/5.K['= SiKu 5*KS2=KA -C (G(K+5)--G( K)) /5. )e(Z-S2)4 G(K)B =((H(K.5)-H(K))/5*)*(l-S2)4 H(K)
19 T =Y(KX)e( (SX3+1.2)/SX3)*SQRTF( (A..24(B..2)*(Y(KP)*))/SX3)'VCFL1 =U.Y(KP)*V4TCFL2 =U-Y(KP).V-TCFN1 ANTF(CFLI)CFN2 *ANTF(CFL2)

BRUCETON STATISTICAL ANALYSIS
WRITE OUTPUT TAPE 3,20,(IDENT(J)tJ=1,20),PtEIK(I ),FIX(IhtFAX(I),I1=19N)
20 FORMAT(1IX,20A2,5XI3HP'ROB. LEV. aFT.395X913HCONF. LEVI - F7.1'3//IOX,11HTEST LEVELSt5X,12HIN0.BF FIRES,5XtIIHNB.BF FAILS//( 1OX,-FT2.3, 10XF7.3qIOXF7.3))WRITE OUTPUT TAPE 3,2ISFAXtSFIXCtRtAFAX,AFIXBFAXBFIX.TFAXTFIXl.UFAXUFIXVFAXVFIXUVZETAPPlESSX,5X3,Y(KP),Y(KX),AtBT,P,2EtCFL19CFNIPIt ECFL29CFN,2
21 FORMAT(IHOIOX,9H N0,NX a 2Fl1.5//26,H SPECIAL PARAMETERS CpD a 2F111.5/66H PRIMARY STATISTICS A,AXBOBXtMBtMXMBIMXItSIGMA0,SI2GMAX - ///5('13XtFll 595XPFI1.5/),IOX///45I SECONDARY STATISTICS ME3AN*STAND.DEV.,ZETA :3Fllo5//16H PROB. LEVELS a 2FI1.5vl4HCONFe LE4VEL - FIj.5/5X,19HStN19KPtKXtGH =/I0Xt6(F11.5t3X)/l0X9F1l.5q3X5/25H CONFIDENCE INTERVAL Y - F1Lo5//(IXF7.395H WITHF7o3,8H CINF6- F11.5,9HLOG UNITS94H =Fll.5/))
GB TO 102100 WRITE OUTPUT TAPE 3,90,WIDENT(J)tJ=1920),PE, (XII ),FIX(I3,FAX(I),I
1=19N)90 FOBRMAT(1OX,20A2,5XI3HPRIBo LEV. z F7.395X913HCINf. LEV4 a F7.
13//IOX,1I.HTEST LEVELS,5X912HNB.Bf FIRES95X91IHNI.BF FAILS//t IOXt.F72.3, 10X,F7.31,LOXF7.3))WRITE OUTPUT TAPE 3,9lS
91 FORMAT(IH0O,0X,44HTHIS ANALYSIS WAS NBT COMPLETED BECAUSE S F P1115,1fl3H IT IS OUT BF THE RANGE FROM .2 TO 5 AND HENCE G AND H CANNI2T BE tDETERMINED~w CHECK LEVEL DISTRIBUTIIN.)
102 SB TI 5END~l, i,0,0g0,0,1,1,0,0,0,000,)
PAGE 3
-10-

ABSTRACT DATA

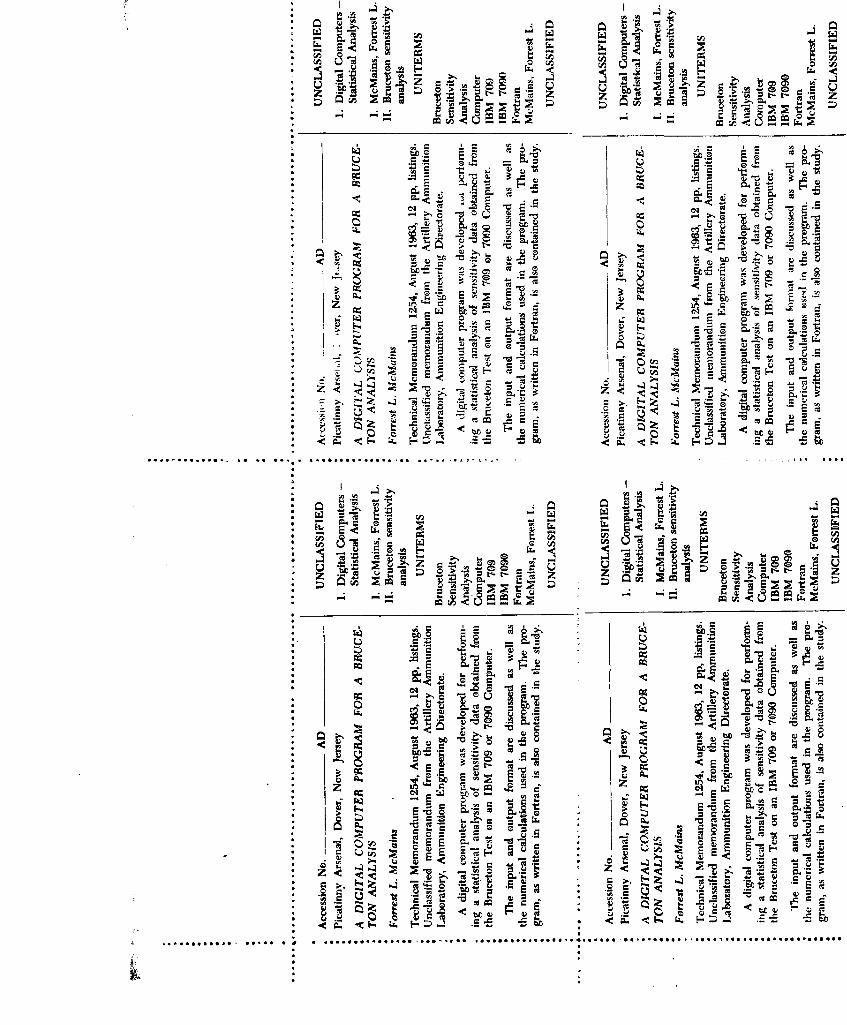
Accession No. AD_ _ UNCLASSIFIED
Picatinny Arsenal, Dover, New Jersey 1. Digital Computers -Statistical Analysis
A DIGITAL COMPUTER PROGRAM FOR A'BRUCETON ANALYSIS I. McMains. Forrest L.
H. Bruceton sensitivityForrest L. McMains analysis
Technical Memorandum 1254, August 19,63, I2pp, UNITERMSlistings. Unclassified memorandum from theArtillery Ammunition Laboratory, Ammunition BrucetonEngineering Director ate. Sensitivity
AnalysisA digital computer program was developed for Computerperforming a statistical analysis of sensitivity IBM 709data obtained from the Bruceton Test on an IBM IBM 7090709 or 7090 Computer. Fortran
McMains, Forrest L.The input and output format are discussed aswell as the numerical calculations used in theprogram. The program, as written In Fortran,is also contMnqd in the study.
/
I J
SDt
:9 j
4. C6. ~
j. - =
Q cd~
as Cc ftU
t.) zz l0* *
*4 ;Q. r .. 2
E A
*l N .4 M.E
Z o a~
5 0 -E E L
.. . . . . . .. . . . . . . . ... . . . . . . . . . . . . .. .. .. .. . . . ... ..

* I A
4o
* LLS j~ - - -*.
* u~Q..
bt -U-
0uc 0 )
.2- a t4 LT.
3 Et .).2 vc r. 4
.. . .. . . . . . . . . .. . . . . . . . . . . . .. ..
CA t:O~ ~ .)
* ~ . 0.
.. QE 0
ha~~ 0cc, ~
0 ha0 -0.0~
> 00>,
5 bEE-
c0 Q. -2
* .0
0 0* -.1 i) W-
Z C - 2 2 o
a: - . =
.... ... ... ... . .. . . . . . . .. . . . . . . .. . . . . . . . .. . . . . . . . . . . . . . . . . .

TABLE OF DISTRIBUTION

TABLE OF DISTRIBUTION
Copy Number
1, Commanding OfficerPicatinny ArsenalDover, New JerseyATTN: SMUPA-DR3 1.10
SMUPA- DR4 11-25SMUPA-VC4 26-28SMUPA-VA6 29-33SMUPA-DX I 34-35
2. Defense Documentation CenterCameron StationAlexandria, Virginia 36-55
3. Department of MathematicsUniversity of ArizonaTucson, ArizonaATTN: Dr. Louise C. Lim 56
4, Harry Diamond LaboratoriesConnecticut & Van Ness AvenueWashington 25, D. C. 57-58
-12-
Recommended


![WELCOME [s3.amazonaws.com]s3.amazonaws.com/AMCMS/wocc-family-retreat-brochure.pdfIs it a weekend of catching up on sleep, housework, and errands, all mixed in with birthday parties](https://img.pdfslide.net/doc/110x75/5ac68a2d7f8b9ae06c8e67cf/welcome-s3-s3-it-a-weekend-of-catching-up-on-sleep-housework-and-errands.jpg)