Understanding the Bond Market
Determining Market
Interest Rates
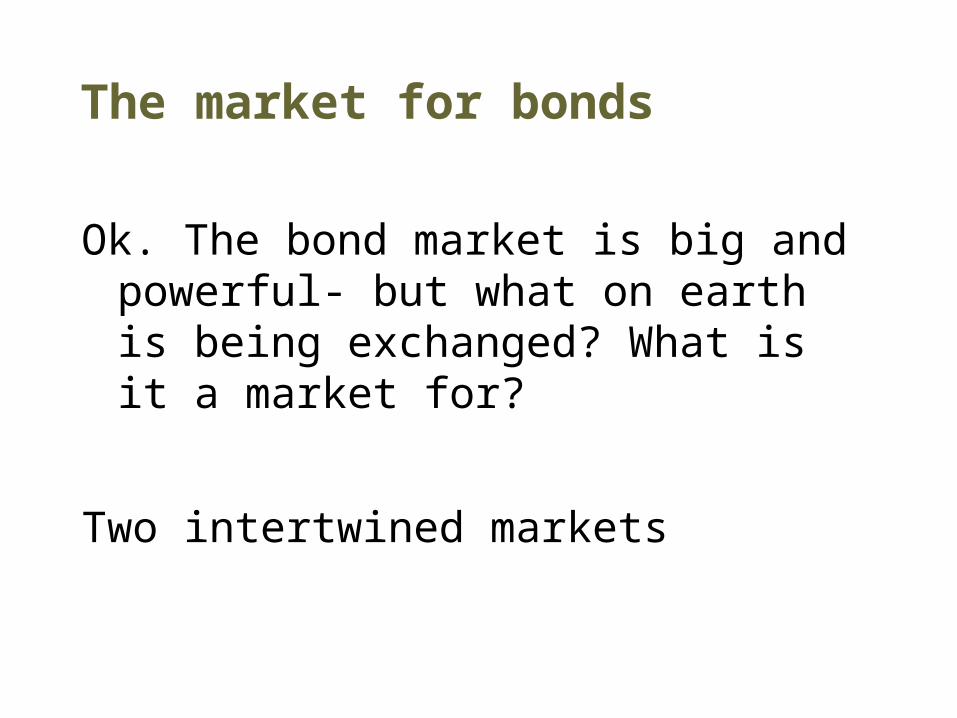
The market for bonds
Ok. The bond market is big and powerful- but what on earth is being exchanged? What is it a market for?
Two intertwined markets

Two Views of Bond Market
• Bond is the good.
• Use of funds is the good.

Bond Is the Good
• Buyer: Lender who buys bond (say, the public)
• Seller: Borrower issuing bond (say, a corporation or the state)
• Price: Bond price

Use of Funds Is the Good
• Buyer: Borrower raising funds (a corporation or a state)
• Seller: Lender supplying funds (the public)
• Price: Interest rate

Example
• 1 year bond with par value of $10,000
• If you sell it at $8000, the interest rate earned is ($10,000-$ 8,000)/$8000= $2000/$8,000= 25%
• If you sell it at $9500, the interest rate earned is ($10,000-$9,500)/$9500= $500/$9,500= 5.2%

Demand for Bonds.Those who demand the bonds are the ones supplying the funds…

Figure 6.2 Supply of Bonds: Those who supply the bonds are the ones who demand loanable funds

Figure 6.3 Market Equilibrium

Explaining Changes in Equilibrium Interest Rates
• Changes in bond demand or supply will change the bond price and interest rate.
• Theory of portfolio allocation can explain bond demand curve shifts.
• Changes in willingness and ability to borrow shifts the supply curve.

Shifts in Bond Demand

Determinants of Asset Allocation

Factors Shifting Increasing Bond Demand
• Higher wealth
• Higher expected returns on bonds
• Lower expected inflation
• Lower expected return on other assets
• Lower relative riskiness of bonds
• Higher relative liquidity of bonds
• Lower relative information costs of bonds

Real and Nominal Interest Rates
• Expected real interest rate = nominal interest rate - the expected rate of inflation.
• Fisher hypothesis: change in expected inflation = change in nominal interest rate.
• The real rate of return equals the nominal rate of return adjusted for expected inflation.

Real and Nominal Interest Rates, 1960-2002

Factors Increasing Bond Supply
• Higher expected profitability of capital
• Lower business taxes
• Higher expected inflation
• Higher government borrowing

Shifts in the Supply of Bonds
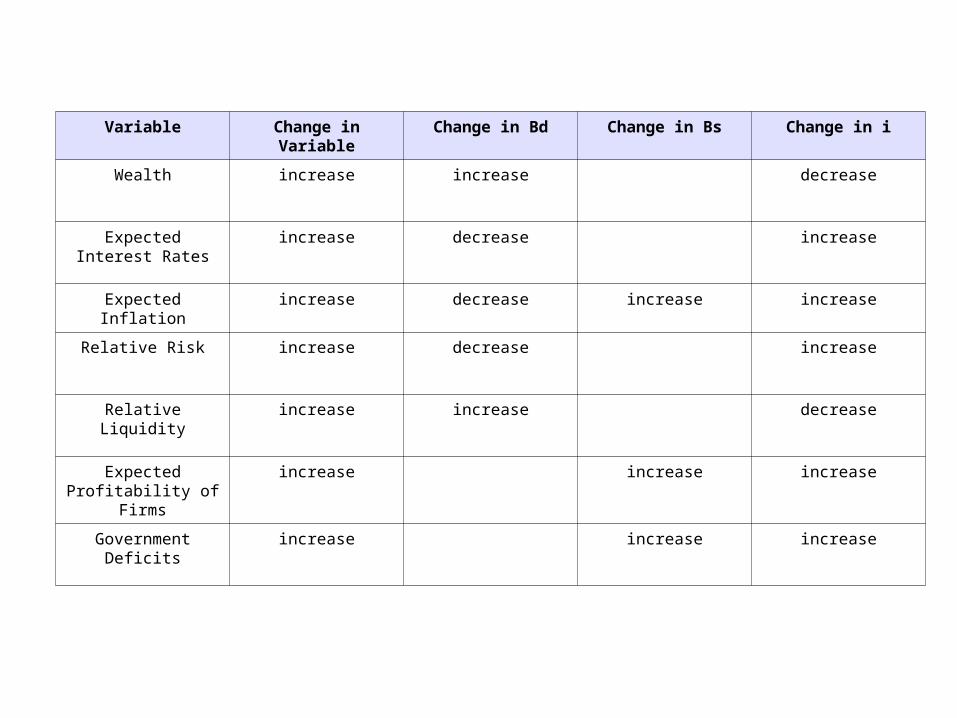
Variable Change in Variable Change in Bd Change in Bs Change in i
Wealth increase increase decrease
Expected Interest Rates increase decrease increase
Expected Inflation increase decrease increase increase
Relative Risk increase decrease increase
Relative Liquidity increase increase decrease
Expected Profitability of Firms
increase increase increase
Government Deficits increase increase increase
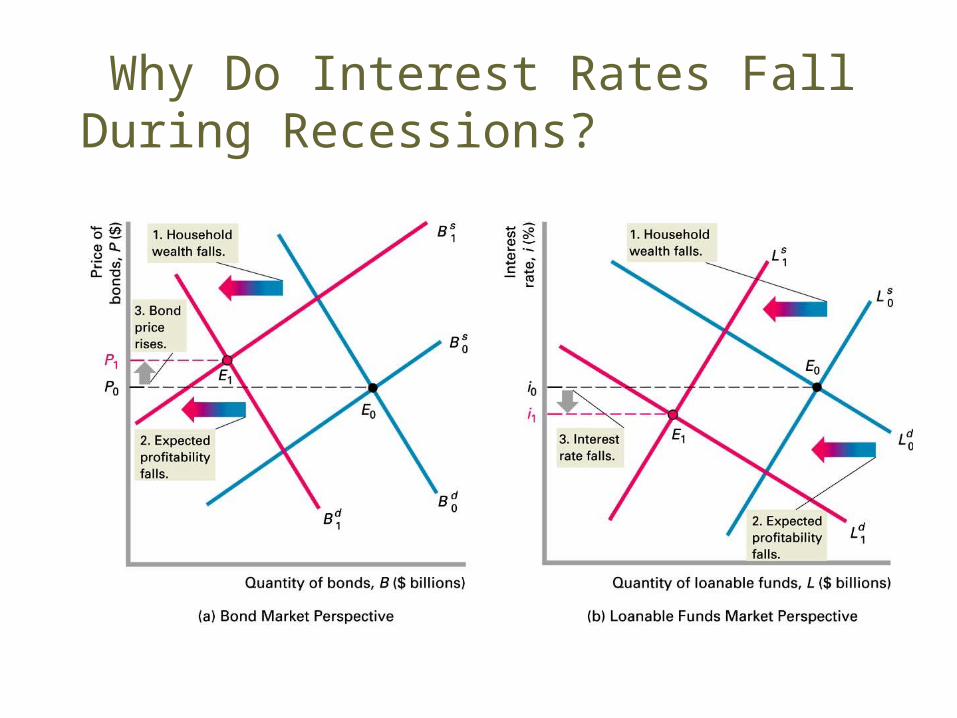
Why Do Interest Rates Fall During Recessions?

Expected Inflation and Interest Rates

The Yield Curve
• Yield Curve (Term Structure of Interest Rates): A plot of the interest rates of Treasury Bills and Treasury Bonds versus their maturities at a point in time.

Yield Curve: An Example
Term (years) Interest Rate (%)
0.25 3.62
2.00 4.34
5.00 5.07
10.00 5.54
30.00 5.86

The Slope of the Yield Curve
• Upward Sloping (Term i) -- usual case.
• Downward Sloping (or Inverted) Yield Curve (Term i) -- occurs periodically
• What information can we get from the yield curve?

Observed Phenomena -- Yield Curve
• The downward sloping (inverted) yield curve is unusual but not rare.
• Interest rates of bonds of all maturities move together (are positively correlated)
• The downward sloping (inverted) yield curve tends to occur when interest rates in general are high.

The Preferred Habitat Hypothesis
• The Preferred Habitat Hypothesis The interest rate on a long-term bond equals the average of short-term rates expected to occur over the lifetime of the long-term bond plus a risk premium due to higher market risk in the long-term bond.

Preferred Habitat Hypothesis: Assumption
• Key assumption -- Bonds of different maturities are close substitutes but not perfect substitutes.
• Major non-price difference -- longer term bonds have higher market risk.

Assessment: Preferred Habitat Hypothesis
• The downward sloping (inverted) yield curve is unusual but not rare.
Accurately predicts occurrence.
(Investors must expect interest
rates to decrease a lot in the
future.)

Preferred Habitat Hypothesis
• Interest rates of bonds of all maturities move together (are positively correlated)
Accurately predicts this occurrence.
(Close substitutes)

Preferred Habitat Hypothesis
• The downward sloping (inverted) yield curve tends to occur when interest rates in general are high.
Accurately predicts occurrence
(When are interest rates expected
to decrease a lot?)
Recommended