Name ________________________________ Date ___________________ page 1 of 2
Unit 5: Scatter Plots & Trend Lines – Test Review The table below gives the dates, heights, and number of stories (floors) for ten of the World’s Tallest Buildings for their times. For example, in 1974 the Sears Tower was the World’s Tallest Building.
Read more: Infoplease.com http://www.infoplease.com/spot/tallest-buildings-timeline.html#ixzz1Ib9gnpC3
1. Predict the height of the world’s tallest building in 2020, using the graph to find the equation of the best-fit line.
a. Identify the independent variable and dependent variable.
IV: __________________________________
DV: __________________________________
b. Label the axes.
c. Draw a trend line by hand.
d. Calculate the equation of your trend line. Show all work.
e. Use your equation to predict the height of the world’s tallest building in 2020. Show all
work.
f. Is this an example of interpolation or extrapolation? Why?
Building Year Built
Years since 1890
Height (feet) Stories
New York World Building, New York 1890 0 309 20 Manhattan Life Insurance Building, New York 1894 4 348 18 Woolworth Building, New York 1913 23 792 60 Chrysler Building, New York 1930 40 1046 77 The Empire State Building, New York 1931 41 1250 102 The World Trade Center, New York 1972 82 1368 110 The Sears Tower, Chicago 1974 84 1450 110 The Petronas Towers, Kuala Lumpur, Malaysia 1998 108 1483 88 Taipei 101, Taiwan 2004 114 1670 101 Burj Khalifa, United Arab Emirates 2010 120 2716 160
20 40 60 80 100 120
250
500750
1000
1250
1500
1750
20002250
2500
2750
0
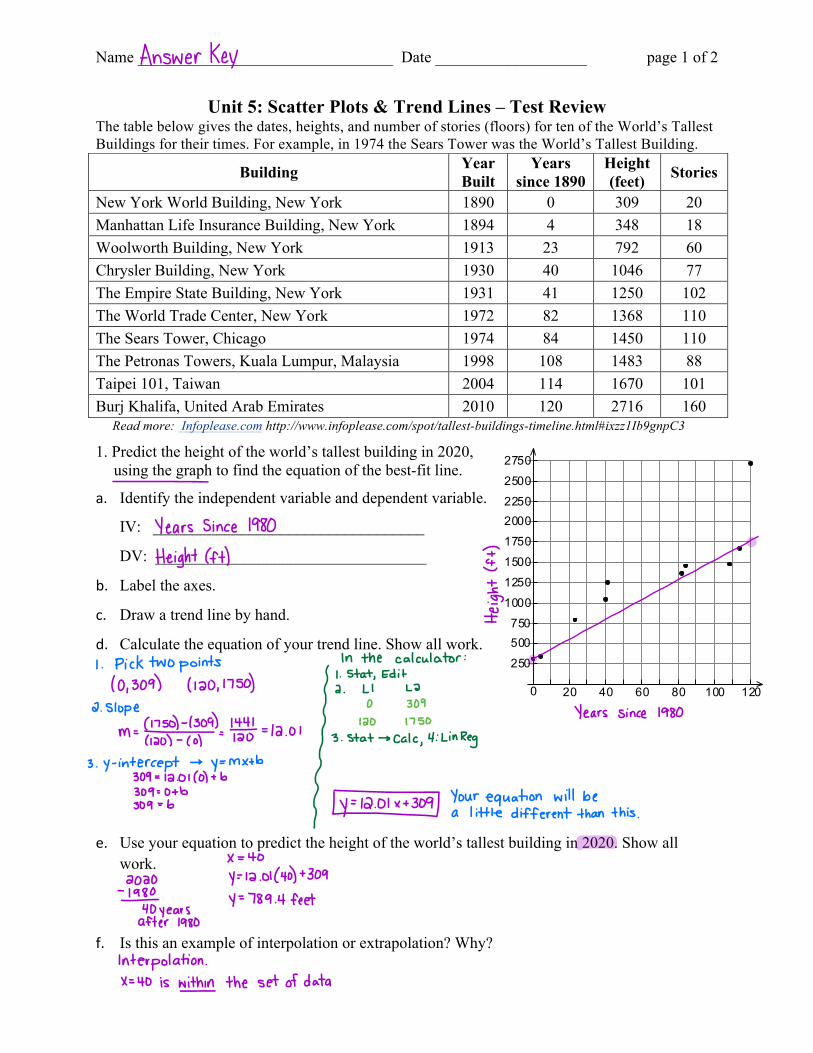
Name ________________________________ Date ___________________ page 2 of 2 g. What does the slope represent in the
context of this situation? (Include units!) h. What does the y-intercept represent in the
context of this situation? (Include units!) i. Is the data positively correlated, negatively, correlated or neither? j. If it is correlated, then is it a strong or weak correlation? Explain how you know.
k. Identify any possible outlier or outliers and explain your choice.
l. Use your equation to predict when the height of the world’s tallest building was 150 feet.
Show all work.
2. Suppose you were able to use your graphing calculator to make a scatter plot of height in feet vs. number of stories.
a. If you press STAT and then click on EDIT. The table appears for you to enter your data.
Which variable would go under L1? ____________________________________
Which variable would go under L2? ____________________________________
b. To find the linear regression equation, you would press STAT again. Then you go right to CALC. Then you click on 4: LINREG (ax+b). The screen comes up to with this information:
a = 0.0593… b = 10.874… r2 = 0.916… r = 0.9570… Write the linear regression equation, rounding to the nearest hundredth. _________________ c. Use your equation to predict the number of stories in a 600 foot high building.
d. What is the slope? ________________ What does it represent in the context of this
situation?
e. What is the y-intercept? ___________ What does it represent in the context of the situation?

Name ________________________________ Date ___________________ page 3 of 2
f. What is the correlation coefficient? _________ What does it tell you about the data?
Recommended