Università degli Studi di Siena
DIPARTIMENTO DI ECONOMIA POLITICA
FEDERICO MARIA PULSELLI FRANCESCA CIAMPALINI ENZO TIEZZI CARLO ZAPPIA
The Index of Sustainable Economic Welfare (ISEW) for a Local Authority: A Case Study in Italy
n. 449 - Maggio 2005
Abstract - The Index of Sustainable Economic Welfare (ISEW) has been calculated for many countries, but rarely at the local level. This paper shows how the index has been calculated for the Province of Siena, Central Italy. The whole procedure is illustrated step by step, including the search for the most suitable and precise methods to obtain reliable values for each item composing the index. Application of ISEW at a very local level was found to be feasible. The most general difficulty encountered was the lack of an adequate institutionalised source of statistical information to support the construction of indicators other than purely economic or demographic ones. The availability of data depends on the interest in implementing projects of sustainable management of natural resources and land on the part of local authorities and their consequent willingness to invest money and human resources on such projects. The ISEW is a good tool for local environmental policy, because it gives a more realistic representation of the well-being of the population than GDP, since it includes environmental and social items not considered in conventional national accounting. Furthermore, in Italy, the principle of administrative decentralization has been implemented in recent years to such an extent that the central government devolved part of its power to Regions, Provinces and Municipalities. Arguably, local authorities should therefore allocate more resources to pursue their policies towards sustainability, an issue which modern electoral campaigns are often based on. The results for the Province of Siena show that there is a large gap between local GDP and ISEW (about 37% of GDP). Keywords: Local level, economic welfare, sustainability, ISEW, economic policy. J.E.L. Classification: Q57, R11, I31 Acknowledgements The authors would like to thank Achille Lemmi and Silvia Tiezzi for insightful suggestions. Federico Maria Pulselli, Francesca Ciampalini, Enzo Tiezzi - Dept. of Chemical and Biosystems Sciences and Technologies - University of Siena, Italy. Carlo Zappia - Dept. of Economics - University of Siena, Italy.
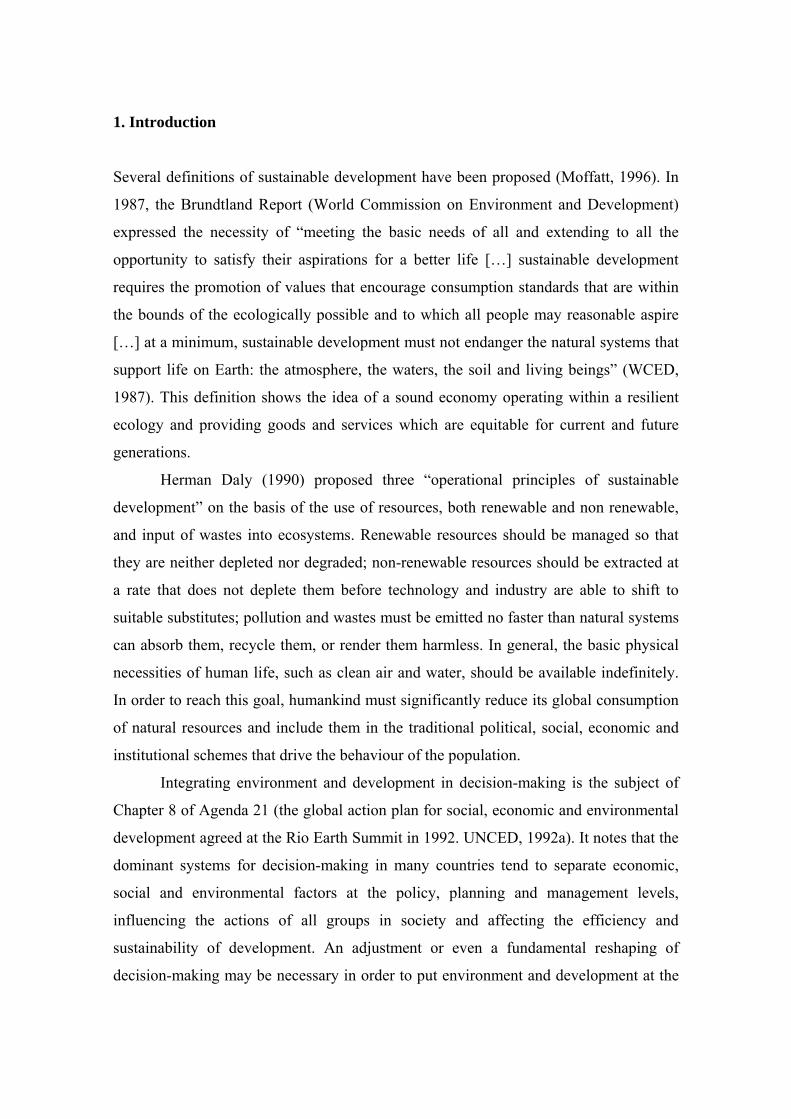
1. Introduction
Several definitions of sustainable development have been proposed (Moffatt, 1996). In
1987, the Brundtland Report (World Commission on Environment and Development)
expressed the necessity of “meeting the basic needs of all and extending to all the
opportunity to satisfy their aspirations for a better life […] sustainable development
requires the promotion of values that encourage consumption standards that are within
the bounds of the ecologically possible and to which all people may reasonable aspire
[…] at a minimum, sustainable development must not endanger the natural systems that
support life on Earth: the atmosphere, the waters, the soil and living beings” (WCED,
1987). This definition shows the idea of a sound economy operating within a resilient
ecology and providing goods and services which are equitable for current and future
generations.
Herman Daly (1990) proposed three “operational principles of sustainable
development” on the basis of the use of resources, both renewable and non renewable,
and input of wastes into ecosystems. Renewable resources should be managed so that
they are neither depleted nor degraded; non-renewable resources should be extracted at
a rate that does not deplete them before technology and industry are able to shift to
suitable substitutes; pollution and wastes must be emitted no faster than natural systems
can absorb them, recycle them, or render them harmless. In general, the basic physical
necessities of human life, such as clean air and water, should be available indefinitely.
In order to reach this goal, humankind must significantly reduce its global consumption
of natural resources and include them in the traditional political, social, economic and
institutional schemes that drive the behaviour of the population.
Integrating environment and development in decision-making is the subject of
Chapter 8 of Agenda 21 (the global action plan for social, economic and environmental
development agreed at the Rio Earth Summit in 1992. UNCED, 1992a). It notes that the
dominant systems for decision-making in many countries tend to separate economic,
social and environmental factors at the policy, planning and management levels,
influencing the actions of all groups in society and affecting the efficiency and
sustainability of development. An adjustment or even a fundamental reshaping of
decision-making may be necessary in order to put environment and development at the
2
centre of economic and political decision-making. This is the goal of the Local Agenda
21 process, according to which each local authority should seek the participation of
citizens, local organizations and private enterprises in order to implement the concept of
the Conference of Rio: “thinking globally, acting locally”.
The main problem delaying the development of local Agenda 21 is the lack of
suitable methods for assessing interactions between various environmental,
demographic, social and sectoral economic parameters. Indicators of sustainable
development are necessary to provide a solid basis for decision-making at all levels and
to contribute to self-regulating sustainability of integrated natural and human systems.
Chapter 40 of Agenda 21 (UNCED, 1992b) recognizes this need, stating that commonly
used indicators such as GDP and measures of resource and pollution flows do not
provide adequate indications of sustainability. This growing need for sustainable
development indicators has been widely expressed by many politicians, decision-
makers, businessmen and industrialists at national and local level.
In Italy, the Constitution and certain laws regulate local government. The most
important recent contribution is Constitutional Law n.3/2001, that disciplines the
administrative decentralization introduced by the so-called Bassanini laws (n.59 and
n.127/1997). These laws actuate the principle of subsidiarity promoted by the
Maastricht Treaty of the European Union.
Italy is divided into 20 Regions; each Region is composed of Provinces, and each
Province contains several Municipalities. Regions have legislative power on certain
issues and they produce their own Statute and laws (see, for example, the Statute of
Tuscany and Tuscan Regional Law n.1/2005 on land management). Provinces and
Municipalities have administrative functions and deal with local questions. The
Province is a body between the town council (Municipality) and the Region; it
represents its community, looks after the interests of the population and fosters local
development. It plays an important rule in environmental questions because it can grant
authorizations and has to monitor and manage the local environment. In order to
perform all these functions, a Provincial government needs direct and continuous
knowledge of environmental status and all other local concerns. It therefore needs
instruments which provide as much information as possible.
3
2. What is ISEW?
One of the most ambitious efforts to reform the calculation of an indicator of
economic welfare sprang from the partnership of an economist, Herman Daly, and a
theologian, John Cobb. Daly and Cobb (1989) named their proposed substitute for the
GDP, the Index of Sustainable Economic Welfare (ISEW). This is not the first index
proposed: others include the Measure of Economic Welfare (MEW) by Nordhaus and
Tobin (1972), the Human Development Index (HDI) by UNDP (1990), the Genuine
Progress Indicator (GPI) by Cobb and Halstead (1994) and the Sustainable Net Benefit
Index (SNBI) (see Lawn and Sanders, 1999 and Lawn, 2003). In recent years ISEW has
been calculated for several countries: for example, Great Britain (Jackson and Marks,
1994), Sweden (Jackson and Stymne, 1996), Austria (Stockhammer et al. 1997), The
Netherlands (Rosenberg and Oegema, 1995), Italy (Guenno and Tiezzi, 1998) and Chile
(Castañeda, 1999).
In proposing the calculation of ISEW for the USA, Daly and Cobb wanted to
adjust the GDP to obtain a more accurate measure of economic welfare. ISEW is an
integrated index of economic development composed of a list of economic values. It
endeavours to integrate the traditional measures of economic performance, that usually
drive local policies, with information on the land management and population behaviour
and their impacts on the environment and their sustainability. Many academics and
economists maintain that the GDP is inadequate for measuring the economic welfare of
an area. Some believe that the ISEW gives a broader and clearer picture of social
welfare since it addresses crucial issues such as income distribution, environmental
damage and loss of environmental quality.
ISEW accounting starts with the value of private consumption which is also the
starting point for GDP calculations. Since an additional income of a thousand dollars is
more beneficial to the welfare of a poor family than a rich one (Daly and Cobb, 1994),
private consumption has to be adjusted according to the Gini index of income
distribution. Stockhammer et al. (1997) consider distribution as an integral part of
welfare itself and social welfare is only possible if society as a whole can take part in
this welfare. Afterwards, the items that increase economic welfare are considered to be
positive values and those which decrease economic welfare are negative ones. For
4
example, some positive benefits are services deriving from domestic labour, durable
goods and the transport network; negative items are health and education costs (because
they are considered defensive expenditures1), the cost of durable goods, commuting and
road accidents. Other costs are related to environmental questions: air, water and noise
pollution, loss of farmland and wetlands, long term environmental damage and the
depletion of non-renewable resources. The latter is a cost which future generations will
have to shoulder and should be subtracted from estimates of the capital of the present
generation.
The ISEW is not a perfect measure of welfare, as pointed out by Eric Neumayer
(1999, 2000). The arbitrary selection of certain variables to be included or excluded
from the index, the method of calculation and the concept that the GDP is not an
indicator of economic welfare but rather an indicator of total economic productive
output have been criticized. Neumayer also draws attention to some contradictions in
the methodology:
1. Contrary to the opinion of Daly and Cobb, ISEW cannot be an indicator of the
real level of economic welfare and at the same time an indicator of “sustainability”
because it is composed of or should only be composed of a list of items which indicate
economic welfare or “sustainability”. Neumayer therefore suggests that two distinct
indices should be calculated and the relationship between them determined.
2. The second issue is that ISEW does not really achieve its aims. It was originally
compiled by “ecological economists” concerned with the concept of strong
sustainability, as distinct from weak sustainability, according to which natural capital
can be substituted by man made capital. What surprised Neumayer was that ISEW does
not make a clear distinction between these two forms of capital (national capital and
natural capital) and it does not make a distinction between the various forms of natural
capital (renewable and non-renewable resources).
Actually, Daly and Cobb admitted that many of their own calculations were
preliminary and based on highly abstract assumptions, but as Daly said, “ISEW is like
putting a filter on a cigarette. It’s better than nothing” (England, 1998).
1 Defensive expenditures are “expenditures that have actually occurred and are classified as not welfare-bearing due to a systematic bias in the economic social system. The typical example of defensive costs are filters, which would not be necessary if production did not cause pollution in the first place. [...]. Defensive costs are merely the monetary equivalent of the reaction to environmental, overpopulation and other kinds of damage” (Stockhammer et al., 1997 p.21).
5
3. The case study: ISEW for the Province of Siena
3.1 The territorial system
The Province of Siena is in central Italy. It is the second largest Province in Tuscany
and is composed of 36 municipalities with a total population of 252,972 (in 1999). The
Province’s main commercial activities are linked to tourism, trade, banking and
agriculture; the level of industrial activity is low, except in the crystal, building
materials and furniture sectors. The principal commercial products are food including
regional specialities such as wine (Brunello di Montalcino, Chianti, Vino Nobile di
Montepulciano and Vernaccia di San Gimignano), cheese (pecorino di Siena) and olive
oil. In 1999, the GDP per capita was € 17,836. In a survey published by the most
authoritative Italian financial and economic newspaper, Il Sole 24 ore (1999), Siena was
ranked 9th among 103 Italian Provinces for quality of life. Four UNESCO World
Heritage sites are in the Province of Siena: San Gimignano, Siena historical centre,
Pienza and, recently, Val d’Orcia. They are much more than tourist attractions because
they call for special policy to preserve and sustain their natural and historical integrity
(OECD, 2002).
3.2 ISEW: materials and results
The ISEW calculation is divided into items. Item A is the reference year; items B and D
are row and adjusted consumption, respectively. The latter is calculated on the basis of
the Gini index of income distribution (item C). Items E, F, G and H are positive values,
corresponding to services that contribute to welfare but are not considered in
conventional national accounting. Items I to Q are negative because they correct the
overestimation of economic welfare with respect to the private level of consumption.
Items R, S, T and U are usually negative since they are estimates of consumption of
structural fractions of Natural Capital without any real counterpart in terms of welfare.
The following sections are devoted to the step-by-step description of the whole
procedure. All monetary values were expressed in Italian Lira in 1999, then converted
into Euro by multiplying by the fixed exchange rate of 1936.27 Lira per Euro.
6
Item A: Year
This ISEW application was based upon figures for 1999.
Item B: Private Consumption
Private Consumption is the basic variable directly affecting economic welfare because
large household expenditures on goods and services are considered to be an indicator of
a healthy economy and a wealthy society. Data for this variable were obtained from the
statistical report for the Province of Siena by Istituto Guglielmo Tagliacarne (1999).
Item C: Index of Income Distribution
In general, private consumption does not really indicate the economic welfare of a
population and must be adjusted to reflect more realistic conditions. Daly and Cobb
(1994) proposed an index of income distribution to adjust the level of private
consumption. In order to estimate the adjusted consumption, an investigation was
conducted. Two alternative methods for assessing income distribution inequality are the
Gini index and the Atkinson index. The former has been used by Daly and Cobb (1994),
Guenno and Tiezzi (1998), Castañeda (1999) and by Costanza et al. (2004) in a recent
study on GPI. The latter was adopted by Jackson et al. (1997), because, according to
many economists, Atkinson’s index is more accurate being based on the utility function.
Gini index was used here since certain statisticians consider it to contain elements of the
utility function and to be more precise and realistic. The range of variation of this index
is between 0 and 1, where 0 means perfect income distribution and 1 means maximum
inequality. The value of Gini index was computed from data in Betti et al. (2003) for
Tuscany.
Item D: Calculation of Adjusted Private Consumption
The Adjusted Private Consumption2 is the basis on which all other positive and negative
modifications are applied. Daly and Cobb (1994) used it to calculate the degree of
economic welfare because they sustain that there is a degree of inequality of income
distribution in all economic models throughout the world.
2 Adjusted Private Consumption = Private Consumption / (1+Gini’s index)
7
Item E: Services - Domestic Labour
Domestic labour for cleaning, cooking and childminding, for example, contributes
directly to economic welfare, even if it does not involve money. The number of
housewives, unemployed persons and students was obtained (data from Provincia di
Siena 2000, 2001). It was assumed that a housewife spends 8 hours/day in housework,
an unemployed person 4 hours/day and a student 2 hours/day. The income per hour
generated by domestic labour (market wages - ISTAT 1999a) was multiplied by the
hours spent at home by people over 14 years of age, as suggested by Guenno and Tiezzi
(1998).
Item F: Services - Consumer Durables
Expenditure on consumer durables such as cars and household appliances does not
reflect the real welfare of consumers related to these goods because it is necessary to
consider the life of these goods. In ISEW calculations, the services connected with these
goods are benefits, while the initial capital (item I) is a cost that is subtracted from
private consumption. Domestic appliances tend to wear out faster than they should and
this causes an increase in private consumption that does not really contribute to
economic welfare. According to the method of Daly and Cobb (1994), services are only
10% of the total stock because they estimate that such goods have a life span of 10
years. The services from a variety of goods (houses, household appliances, personal
computers, mobile phones and cars) were calculated on the basis of data from the Bank
of Italy (D’Alessio and Faiella, 2000 and a personal estimation of their medium prices).
Item G: Services from Public Infrastructure
Daly and Cobb (1994) considered that public costs should not be a component of
economic welfare because they are part of defensive costs, with the exception of
services from public infrastructure (item G) and health and education costs (item H).
Indeed, the growth of administration costs does not contribute to net economic welfare
because it keeps economic welfare from declining, thus guaranteeing security, a healthy
environment and conditions conducive to trade and commerce. In general, people use
infrastructure without paying a direct monetary contribution. This item is the sum of the
value of services of the road system (equal to the cost of their maintenance) and the
8
value of current public expenses in urban development, water distribution, urban health,
without which these services would be unavailable. All data are taken from the
Provincial Office of Roads for 1999 (personal communication, 2003) and Regione
Toscana (1999a).
Item H: Public Health Care and Education Costs
It is generally accepted that public health care and education costs should be included in
the GDP because they are part of public expenses. This issue, however, is much more
complex than it seems. It is not easy to link an increase in public expenditure to an
increase in economic welfare because of the inherent difficulty of measuring the
demand for the types of services offered by the public administration. According to
Daly and Cobb (1994), there is a fraction of health care and education expenditure that
contributes to economic welfare and it should be added to private consumption. While
Daly and Cobb (1994) consider that 50% of this expenditure is a defensive cost and
should not be added to the index calculations, Guenno and Tiezzi (1998) believe that
only 50% of health care costs are defensive. Hence, 100% of the public education costs
and 50% of health care costs are added. Data are collected from Progetto Aspis, 2002
and Provincia di Siena, 2000.
Item I: Costs - Consumer Durables
Expenditure for consumer durables reflects a negative adjustment of private
consumption because this item has already been included in item F on services for
private consumption. All data are taken from Regione Toscana (1999b), Tomat (2002),
ISTAT (1999b) and Provincia di Siena (2001).
Item J: Private Defensive Expenditure for Education and Health Care
A fraction of public health care and education expenditure was considered in item H as
a non defensive cost that increases economic welfare. In order to get a clearer picture of
overall health care and education costs, private defensive costs were subtracted from
total consumption. 50% of private health care costs and 50% of private education costs
were considered as defensive costs and subtracted from private consumption. Data are
from ISTAT (1999c) and Provincia di Siena (2000).
9
Item K: Local Advertising Costs
National advertising costs are mostly aimed at stimulating or maintaining the demand
for a certain product, without a real counterpart in terms of welfare; on the contrary, at
local level, advertising also plays a social rule by broadcasting information, hence a
portion of local advertising costs should be added (Daly and Cobb, 1994). However,
since no data on local advertising costs were available, this item was omitted.
Item L: Costs of Commuting
Like Daly and Cobb (1994) and Guenno and Tiezzi (1998), we consider that 30% of the
costs related to private cars and public means of transport together with 30% of the
costs for public and private vehicle maintenance (the sources for these data are ACI
CENSIS, 2003 and Regione Toscana, 1999b) are directly related to commuting costs,
according to the following formula:
C = 0.3 (A-0.3A)+0.3B+0.3C1 (2)
where:
C = the direct cost of commuting
A = automobile and other private vehicle costs
0.3A = the estimated amortization costs for private cars; in this case, we excluded it
because it was already included in item F
0.3 = the estimated portion of the use of non-commercial vehicle and the estimated
portion of passenger miles on local public transport related to commuting
B = expenditure for tickets on public transport
C1 = costs for public and private vehicle maintenance.
Item M: Urbanisation Costs
In general, growing population density in urban areas implies that land and house prices
rise without a compensating increase in economic welfare. Buying a house provides a
high level of satisfaction and the monetary value of the investment tends to be
maintained with rare contingent exceptions. The convergence of people on urban areas
10
also stimulates an increase in the supply of houses that partially offsets the increase in
prices due to the overcrowding and is regulated by multiyear urban plans approved by
local authorities. Hence this figure has not been subtracted from private consumption.
Item N: Costs of Road Accidents
In the ISEW calculation, unlike GDP, these costs are a negative item because they
decrease economic welfare. The cost of road accidents was calculated from total
payments of insurance premiums as a result of car accidents. We used the same method
as Guenno and Tiezzi (1998) to calculate national figures. Data are taken from ISTAT
(1999d).
Item O: Cost of Water Pollution
As in the case of Italy, we used total costs for water purification. Water quality is
usually determined on the basis of parameters such as BOD (biological oxygen demand)
and COD (chemical oxygen demand) and the cost of pollution is calculated on the
abatement of organic pollution levels. In this paper an estimate of the total amount
necessary to purify the water supply is obtained from data on a standard purification
plant. The cost is 14.56 Euro in 2001 and it is referred to the equivalent inhabitants (e.i.)
of the area (see http://www.wasserfeld.it/Italienisch/depuratore_1.html). The number of
e.i. of the Province of Siena was obtained by summing resident population (252,972),
e.i. of industrial sector (261,000) and e.i. of agricultural and zootechnic sector (772,396)
(Regione Toscana, 2000a).
Item P: Cost of Air Pollution
Daly and Cobb (1994) divided their estimate of this cost into 6 categories: 1) damage to
agricultural production; 2) material damage; 3) cost of cleaning implement; 4) damage
caused by acid rain; 5) urban degradation; 6) damage to buildings and surroundings.
Like Guenno and Tiezzi (1998), we considered types of emissions and their cost per
tonne of emission abatement (data from I.R.S.E, 2000):
SOx = 2,324 Euro/ton
NOx = 904 Euro/ton
11
TSP (total suspended particles) = € 130 Euro/ton
CO2 = 10 Euro/ton
Costs were multiplied by the quantity of emissions (Regione Toscana, 2000a), to obtain
the cost of air pollution for these four pollutants in a year.
Item Q: Costs of Noise Pollution
Noise pollution is not a substantial problem in the Province of Siena. A project for
measuring and reducing noise pollution in urban centres has been undertaken but the
results are negligible.
Item R: Loss of Wetlands
Wetlands host some of the most biologically productive habitats in the world. Their
value has not been included in economic accounting because they are considered part of
natural capital and difficult to monetize. The ISEW addresses this issue by estimating
the value of services lost when wetlands are converted to other uses. In 1999, there was
an increase in wetlands in the Province of Siena because local authorities have
implemented a project to refill part of the Montepulciano Lake basin. It seems
reasonable to assign a positive value to an increase in wetlands because it increases
economic welfare. A value of 1,033 Euro/hectare was used (Guenno and Tiezzi, 1998).
Item S: Loss of Agricultural Land
Agricultural land productivity is fundamental for every society and has been
progressively reducing for a long time due to two destructive processes. Urban
expansion and bad land management (allowing erosion, intensive agricultural practices,
decomposition of organic material) have led to the depletion of agricultural land and a
reduction in yields. Assigning a monetary value to this loss is an arduous and
controversial task. Figures for the area of depleted agricultural land were taken from the
fourth and fifth agricultural censuses of 1990 and 2000, respectively (ISTAT 1990,
2000) and represent definitive loss of available bioproductive land due to the change in
use. The difference between the values of 1990 and 2000 was divided by 10 to give
12
annual depletion. The monetary value of agricultural land was obtained from the
Provincial Office of Agriculture (personal communication).
Item T: Depletion of Non-Renewable Resources
As in Daly and Cobb (1994) and Guenno and Tiezzi (1998), we used Salah El Serafy’s
method (1988) to calculate depletion of non-renewable resources.
According to El Serafy, a portion of the economic profits of resource extraction should
be reinvested to preserve the capacity of the economic system to produce a durable
income for future generation.
El Serafy’s formula as presented by Guenno and Tiezzi (1998) is:
R – X = R [1 / (1+ r)n+1] (5)
where:
X = annual income;
R = revenue from extraction net of extraction costs;
r = discount rate;
n = residual life-time of the stock of resources.
Dealing with the concept of sustainable income, Santos and Zaratan (1997) describe an
income component (X ≤ R) that can be consumed, and a capital component (R – X) that
must be invested to ensure a future flow of income. Since discounting the utility of
future generations is morally unacceptable, Daly and Cobb (1994) assumed a discount
of 0, that implies X = 0. Therefore, the value of total net returns from the sale of non
renewable resources is counted as depreciation.
Depletion of non-renewable resources was calculated by considering resources
extracted in the Province of Siena: sand, clay, gravel, limestone, marble and travertine
(Regione Toscana, 2000b). Unit prices of each product extraction costs were obtained
by interviewing local quarry owners.
13
Item U: Long-term Environmental Damage
A major factor contributing to economic welfare in the long run is the conservation and
protection of natural ecosystems which represent a source of biological production.
Modern society and the economic system engage in myopic commercial practices and
produce technological devices which ignore the physical rules and the inability of
ecosystems to cope. The production of toxic wastes, carbon-dioxide, nuclear wastes and
chlorofluorocarbons, with their long-term deleterious effects, is a real cost to be
recognised which will fall on future generations.
In order to calculate long-term environmental damage we used the method of
Daly and Cobb (1994) and considered four main pollutants - CO2, NOx, CH4, and CFC.
Long-term environmental damage is directly proportional to consumption of fossil fuels
and energy. Hence, petrol, diesel fuel, fuel oil, methane and electricity consumption
time series were considered.3 As proposed by Guenno and Tiezzi (1998) we used a tax
of € 1.276 per equivalent barrel of oil (Anielski and Rowe, 1999). It was multiplied by
the time series (1979-1999) of non-renewable energy consumption (data sources:
DGERM, 1999; GRTN, 1999; personal communications by local methane providers,
2003) to represent the persistence of environmental damage in the medium-long term
due to emission of combustion gases.
Item V: Net Capital Growth
In order to sustain long-term economic welfare, there should be an increasing or
constant supply of capital per worker. ISEW calculates net capital growth (NCG) by
adding the stock of new capital (∆K) and subtracting the capital requirement (CR:
amount needed to sustain the stock of capital and thus, the amount needed to sustain the
same level of capital per worker). The CR is obtained multiplying the percentage
variation in labour force (∆L/L) by the stock of capital of the preceding year (K–1)
(Guenno and Tiezzi, 1998).
NCG = ∆K - CR (6)
where ∆K = K – K–1 and CR = (∆L/L) K–1
3 This procedure leads to an overestimate of long-term environmental damage because in the Province of Siena, local geothermal electricity production meets the 90% of provincial demand, implying a change in the emission inventory, but no estimation was possible for the period 1979-1999 due to lack of data.
14
Data are taken from IRPET (2001) and Provincia di Siena (2000, 2001).
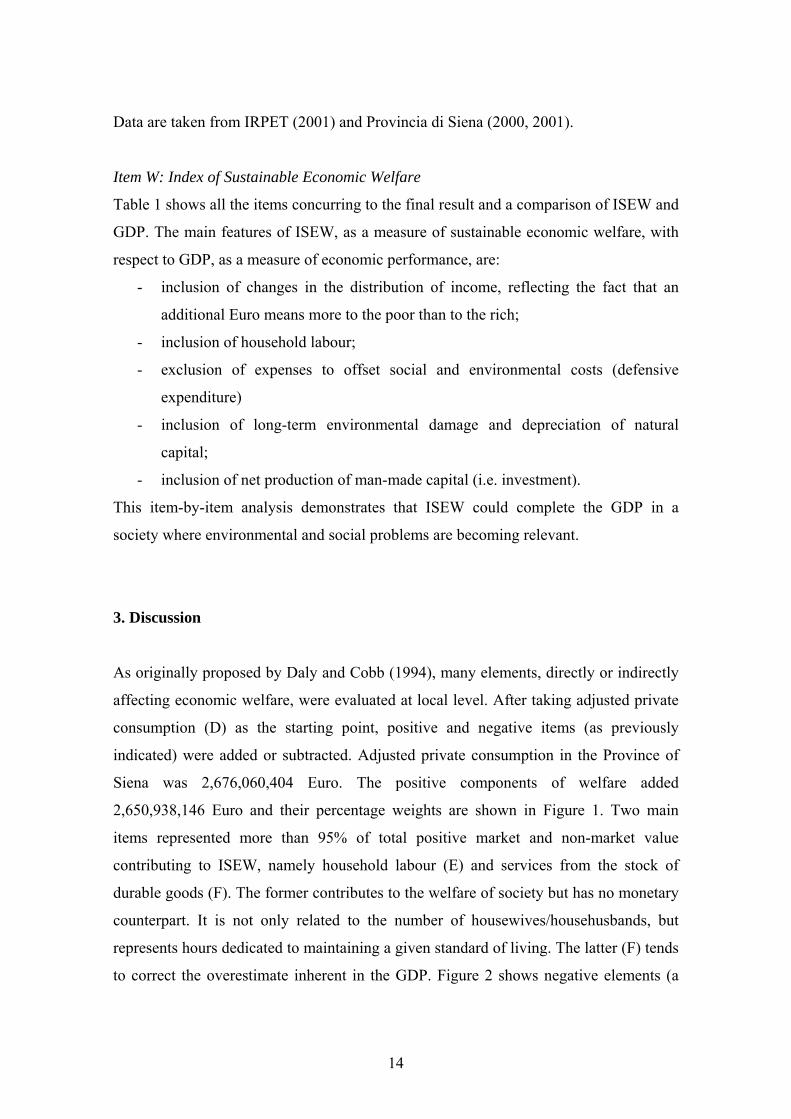
Item W: Index of Sustainable Economic Welfare
Table 1 shows all the items concurring to the final result and a comparison of ISEW and
GDP. The main features of ISEW, as a measure of sustainable economic welfare, with
respect to GDP, as a measure of economic performance, are:
- inclusion of changes in the distribution of income, reflecting the fact that an
additional Euro means more to the poor than to the rich;
- inclusion of household labour;
- exclusion of expenses to offset social and environmental costs (defensive
expenditure)
- inclusion of long-term environmental damage and depreciation of natural
capital;
- inclusion of net production of man-made capital (i.e. investment).
This item-by-item analysis demonstrates that ISEW could complete the GDP in a
society where environmental and social problems are becoming relevant.
3. Discussion
As originally proposed by Daly and Cobb (1994), many elements, directly or indirectly
affecting economic welfare, were evaluated at local level. After taking adjusted private
consumption (D) as the starting point, positive and negative items (as previously
indicated) were added or subtracted. Adjusted private consumption in the Province of
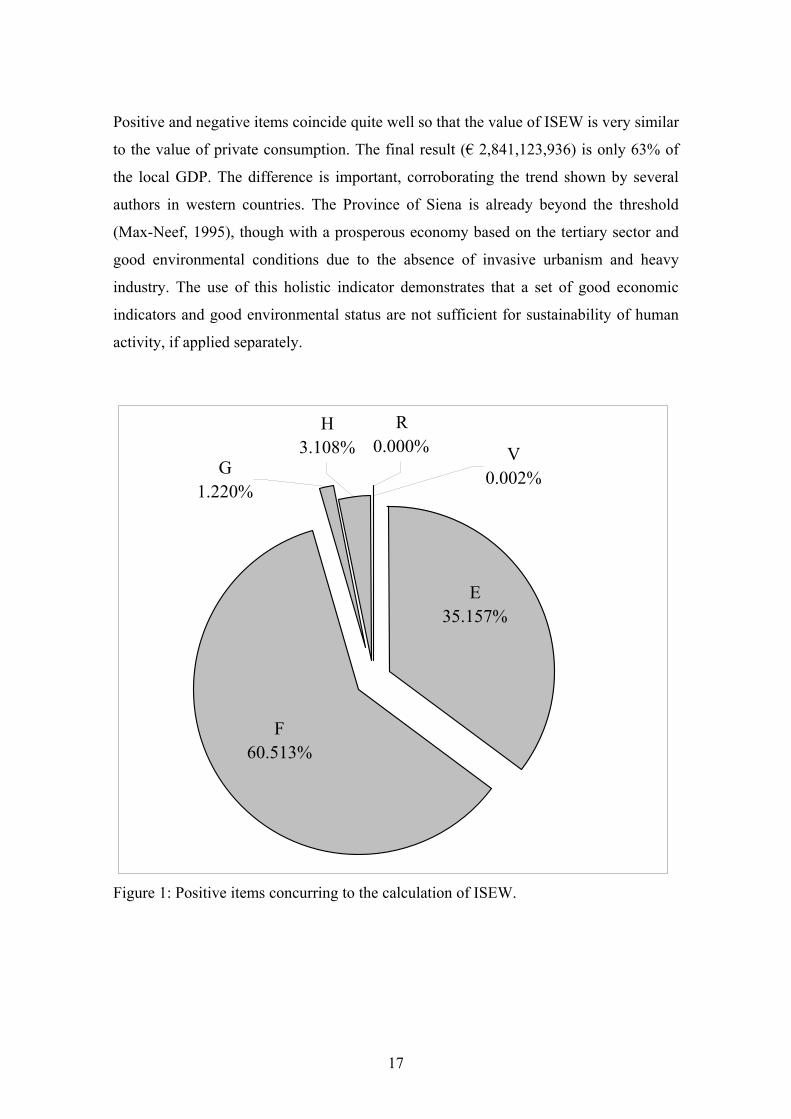
Siena was 2,676,060,404 Euro. The positive components of welfare added
2,650,938,146 Euro and their percentage weights are shown in Figure 1. Two main
items represented more than 95% of total positive market and non-market value
contributing to ISEW, namely household labour (E) and services from the stock of
durable goods (F). The former contributes to the welfare of society but has no monetary
counterpart. It is not only related to the number of housewives/househusbands, but
represents hours dedicated to maintaining a given standard of living. The latter (F) tends
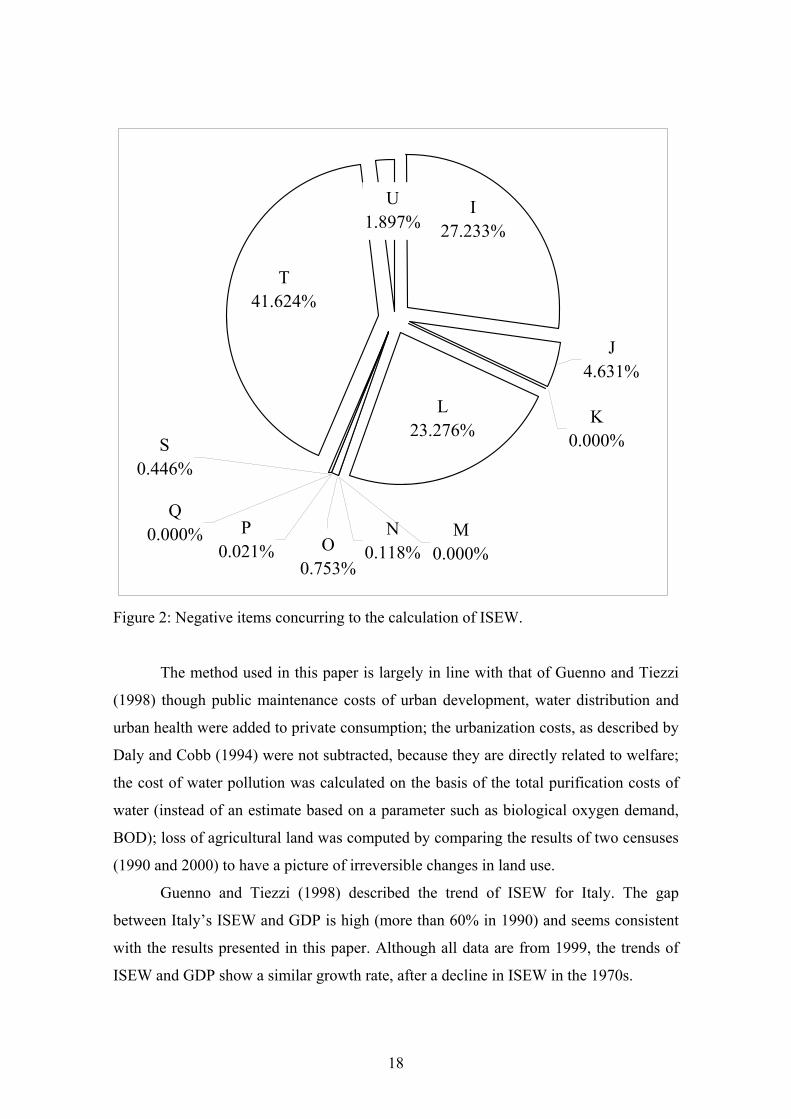
to correct the overestimate inherent in the GDP. Figure 2 shows negative elements (a
15
value of € 2,485,876,614) to be subtracted from consumption. The principal elements
are non-renewable resource depreciation (T), expenditure on consumer durables (I) and
commuting costs (L). They represent 92.1% of the total negative elements.
The problem of the exploitation of local non renewable resources is fundamental
from the point of view of sustainability. Normally no intrinsic value is attributed to
extracted materials: only the costs of extraction (goods, services, energy, labour, etc.)
are accounted for. The proposal of Daly and Cobb (1994) introduces El Serafy’s
method, that tries to represent the difference between the flow of money derived from
the sale of exhaustible products and the stock of materials derived from geological
processes. In the Province of Siena, many materials are extracted, such as travertine, a
precious yellow marble, gravel and sand. If this difference between a flow and a stock is
not taken into account, extractive activity will never be considered a sustainable
activity.
The cost of commuting depends on two elements: overcrowding of roads and
urban areas and the need to own one or more private cars in a consumer society. Among
negative items, there is non negligible defensive expenditure (J) and environmental
damage (U - related to combustion of fossil fuels).
16
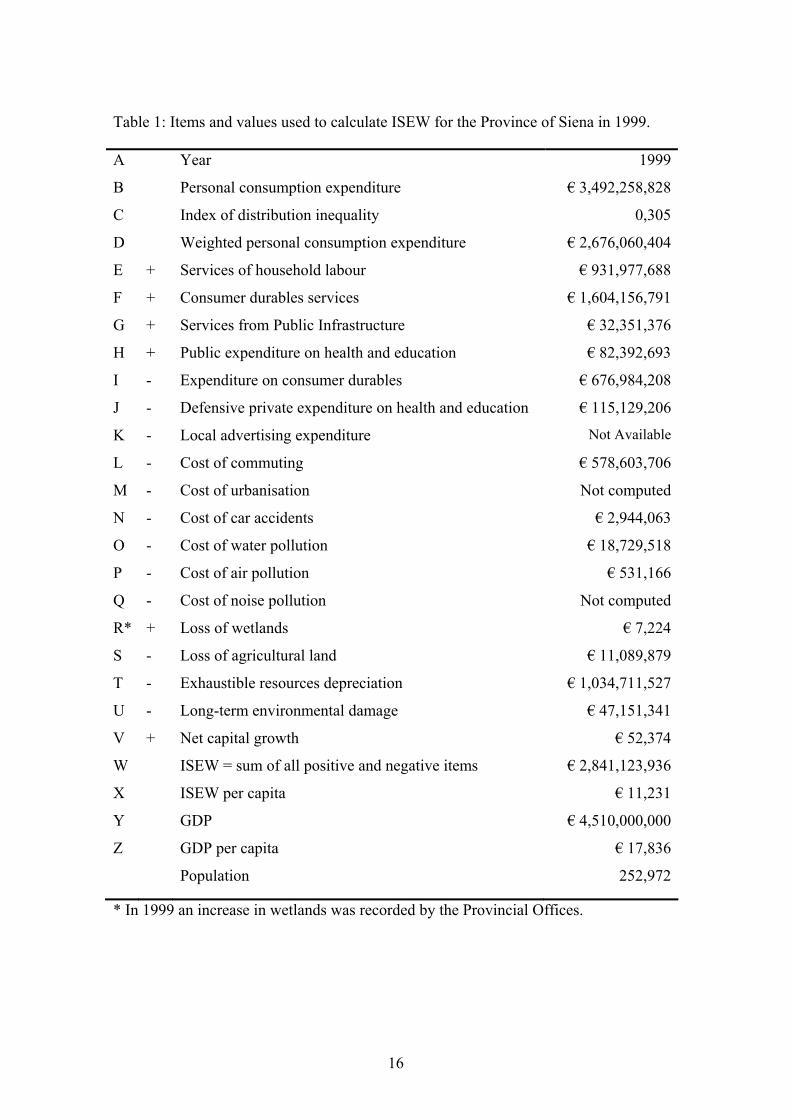
Table 1: Items and values used to calculate ISEW for the Province of Siena in 1999.
* In 1999 an increase in wetlands was recorded by the Provincial Offices.
A Year 1999
B Personal consumption expenditure € 3,492,258,828
C Index of distribution inequality 0,305
D Weighted personal consumption expenditure € 2,676,060,404
E + Services of household labour € 931,977,688
F + Consumer durables services € 1,604,156,791
G + Services from Public Infrastructure € 32,351,376
H + Public expenditure on health and education € 82,392,693
I - Expenditure on consumer durables € 676,984,208
J - Defensive private expenditure on health and education € 115,129,206
K - Local advertising expenditure Not Available
L - Cost of commuting € 578,603,706
M - Cost of urbanisation Not computed
N - Cost of car accidents € 2,944,063
O - Cost of water pollution € 18,729,518
P - Cost of air pollution € 531,166
Q - Cost of noise pollution Not computed
R* + Loss of wetlands € 7,224
S - Loss of agricultural land € 11,089,879
T - Exhaustible resources depreciation € 1,034,711,527
U - Long-term environmental damage € 47,151,341
V + Net capital growth € 52,374
W ISEW = sum of all positive and negative items € 2,841,123,936
X ISEW per capita € 11,231
Y GDP € 4,510,000,000
Z GDP per capita € 17,836
Population 252,972
17
Positive and negative items coincide quite well so that the value of ISEW is very similar
to the value of private consumption. The final result (€ 2,841,123,936) is only 63% of
the local GDP. The difference is important, corroborating the trend shown by several
authors in western countries. The Province of Siena is already beyond the threshold
(Max-Neef, 1995), though with a prosperous economy based on the tertiary sector and
good environmental conditions due to the absence of invasive urbanism and heavy
industry. The use of this holistic indicator demonstrates that a set of good economic
indicators and good environmental status are not sufficient for sustainability of human
activity, if applied separately.
Figure 1: Positive items concurring to the calculation of ISEW.
E35.157%
F60.513%
H3.108%
R0.000% V
0.002%G1.220%
18
Figure 2: Negative items concurring to the calculation of ISEW.
The method used in this paper is largely in line with that of Guenno and Tiezzi
(1998) though public maintenance costs of urban development, water distribution and
urban health were added to private consumption; the urbanization costs, as described by
Daly and Cobb (1994) were not subtracted, because they are directly related to welfare;
the cost of water pollution was calculated on the basis of the total purification costs of
water (instead of an estimate based on a parameter such as biological oxygen demand,
BOD); loss of agricultural land was computed by comparing the results of two censuses
(1990 and 2000) to have a picture of irreversible changes in land use.
Guenno and Tiezzi (1998) described the trend of ISEW for Italy. The gap
between Italy’s ISEW and GDP is high (more than 60% in 1990) and seems consistent
with the results presented in this paper. Although all data are from 1999, the trends of
ISEW and GDP show a similar growth rate, after a decline in ISEW in the 1970s.
L23.276%
I27.233%
U1.897%
T41.624%
M0.000%
N0.118%O
0.753%
P0.021%
Q0.000%
S0.446%
K0.000%
J4.631%
19
The main differences with respect to the conclusions by Guenno and Tiezzi
(1998) concern pollution and exhaustible resources. The low impact of air, water and
noise pollution in the Province of Siena reflects the characteristics of the area, where
production is in the sectors of agriculture, tourism, tertiary, etc. rather than industrial,
towns are small and the population density is only 66 persons per km2. On the other
hand, exploitation of non renewable resources is also a typical activity of the area due to
quarrying of ornamental stone, gravel and sand for construction.
Sustainability calls for an overall view of the world with multidimensional
indicators that reflect the links between the economy, environment and society. The
much abused GDP only measures the amount of money being spent in a country. It is
generally reported as a measure of a country’s economic welfare: the more money
spent, the higher the GDP and the better overall economic welfare is supposed to be.
The ISEW provides a more complete view.
The difficulties in implementing an adequate time series analysis at local level
together with the need to make estimates and assumptions due to the lack of data
revealed the inadequacy of the available statistical platform for the construction of
indicators other than purely economic or demographic ones. The main information gap
regards environmental components (pollution levels, water and air quality), the energy
sector (local energy producers are unwilling to provide data on their production and
local public authorities lack basic information about energy sources, consumption and
distribution) and land and resources use (for example, evolution of towns and suburbs in
terms of land consumption and the dynamics of the quarry sector in terms of extracted
materials).
4. A tool for a local environmental policy
The concept of a sustainable system is different from that of an environmentally clean
one. Local variables of sustainability must take more than just traditional environmental
issues into account. Sustainability indicators should go beyond the reductionist
approach with its separate compartments of environment, economy and society and
reflect the interactions between them. In order to make progress and offer better
20
practical methods of monitoring, an index of local sustainability, an approach which
reflects the synergy between environmental, social and economic variables, is needed.
ISEW methodology seems suitable for studying the real welfare of a population in a
region. It seems consistent with main aims and precepts of modern strategic planning
models that local authorities are implementing in Italy. These programs are
characterized by some of the following elements, taken from a local agenda experience
in Italy (Bollini, 2000):
• equal opportunity in society and social integration - equal access to all fundamental
services like education, employment, energy, health care, housing, job training and
transport;
• local government/decentralization/democratic practises - common access and
participation in local planning and decision-making;
• relationships between local and global issues - satisfy local needs, from production
to consumption and waste management, and make them more sustainable;
• local economy - combine objectives and local needs with available jobs and other
services in order to minimise damage to natural resources and the environment;
• environmental protection - decrease depletion of land and natural resources, control
waste accumulation and toxic emissions and increase biodiversity;
• cultural heritage environmental quality in towns - protect, conserve and restore
works of historical, cultural, architectural importance including buildings,
monuments and local cultural events; protect the aesthetic and functional qualities of
urban space and buildings.
The exploitation of the environment damages the quality of life, especially in
relation to health, services and the ecosystem. These aspects of life are fundamental for
economic activity. The complex dynamic processes which link the natural world and the
economy to the quality of life are the central focus of sustainability studies. Since
environmental issues and economic and sector-specific policy overlap, decision-makers
and public opinion need to be informed about the different variables to consider and
how they influence these sectors. Exhaustive regional studies, that shed light on
environmental, socio-demographic and economic conditions, can be carried out using
these new methods. ISEW assigns a monetary value to certain regional characteristics
and to “nature” used for productive, tourist or residential purposes, the location of
21
businesses and public services and the extent of industries and trades and their types, the
road network and the flux of transportation vehicles, allowing decision/policy – makers
to have a wide set of information to drive the improvement of local welfare.
5. Conclusions
The calculation of ISEW we have presented in this paper shows the monetary relevance
of items like depletion of resources, production of air, noise and water pollution, long-
term environmental damage in the economic welfare of the Province of Siena. The
results of the analysis are consistent with the results for Italy. The gap between ISEW
and GDP was confirmed, though the main items influencing the final result at local
level play a different role relative to the national level. For example, the scattered
presence of industrial activities and the low population density in the Province of Siena
make the effect of pollution lighter than in Italy and in western countries, in general. At
the same time, both energy and resources consumption and the exploitation of local
stocks of non renewable resources are substantial inputs and greatly affect the results.
The assessment of the sustainability of economic and social activities at the local
level is certainly a great challenge for local authorities. Their power to take decisions,
though regulated by laws, should be put into action on the basis of accurate and
comprehensive information. Any decision, plan or project to be implemented should be
evaluated both in economic terms and considering social and environmental aspects.
22
References
ACI-CENSIS, 2003. XIII Rapporto Automobili. Available at
http://www.tmcrew.org/eco/bike/xiii_rapporto_auto.htm.
Anielski, M., Rowe, J. 1999. The Genuine Progress Indicator - 1998 update. Redefining
Progress. San Francisco, CA.
Betti, G., Cheli, B., Lemmi, A., Scivolone, N., 2003. Misure convenzionali e non
convenzionali della poverta’. Il caso della Toscana. Società’ italiana di economia
pubblica. Dipartimento di economia pubblica e territoriale – Universita’ di
Pavia, Italy.
Bollini, G., 2000. Gli indicatori ambientali e di sostenibilità. Comune di Alghero.
http://www.comune.alghero.ss.it/agenda_locale/documenti/indicatori.pdf.
Castañeda, B., E., 1999. An index of sustainable economic welfare (ISEW) for Chile.
Ecological Economics, 28: 231-244.
Cobb, C., Halstead, T., Rowe J., 1995. The Genuine Progress Indicator. Summary of
data and methodology. Redefining Progress, San Francisco, CA.
Costanza, R., Erickson, J., Fligger, K., Adams, A., Adams, C., Altschuler, B., Balter, S.,
Fisher, B., Hike, J., Kelly, J., Kerr, T., McCauley, M., Montone, K., Rauch, M.,
Schmiedeskamp, K., Saxton, D., Sparacino, L., Tusinski, W., Williams, L.,
2004. Estimates of the Genuine Progress Indicator (GPI) for Vermont,
Chittenden County and Burlington, from 1950 to 2000. Ecological Economics,
51: 139-155.
D’Alessio, G., Faiella, I., 2000. I bilanci delle famiglie italiane nell’anno 1998.
Supplemento al bollettino statistico, nuova serie, X, Banca d’Italia, Roma, Italy.
Daly, H. E., 1990. Toward some operational principles of sustainable development.
Ecological Economics, 2: 1-6.
Daly, H. E., Cobb, J.B. 1989. For the common good: redirecting the economy towards
community, the environment, and a sustainable future. Beacon Press, Boston.
482 pp.
Daly, H. E., Cobb, J.B., 1994. Un’economia per il bene comune. Il nuovo paradigma
economico orientato verso la comunità, l’ambiente e un futuro particolarmente
sostenibile. RED edizioni, Como, Italy.
23
DGERM, 1999 - Direzione Generale dell’Energia e delle Risorse Minerarie.
Combustibles consumption: time series. Available at
https://dgerm.attivitaproduttive.gov.it/dgerm/venditeprovinciali.asp.
El Serafy, S., 1988. The proper calculation of income from depletable natural resources.
In: Ahmad, Y.J., Serafy, S.E., Lutz, E., (Eds) Environmental Accounting for
Sustainable Development. An UNDP-World Bank Symposium, World Bank,
Washington, DC.: 10-18.
England, R.W., 1998. Measurement of social well-being: alternatives to gross domestic
product. Ecological Economics, 25: 89-103.
GRTN, 1999 - Gestore della Rete di Trasmissione Nazionale. Available at
http://www.grtn.it/ita/statistiche/regioni.asp?ANNO=1999&AREA=SI.
Guenno, G., Tiezzi, S., 1998. The Index of Sustainable Economic Welfare (ISEW) for
Italy. Worknote 5.98. Fondazione Enrico Mattei, Milano, Italy.
Il Sole 24 ore, 1999. Dossier - La qualità della vita. December 27th, p. 25.
IRPET, 2001 - Istituto Regionale Programmazione Economica Toscana. La situazione
economica della Toscana. Consuntivo anno 2000. Previsioni 2001-2002. Italy.
IRSE, 2000 - Inventario Regionale delle Emissioni. Rapporto: Qualità dell’aria,
inquinamento acustico, industrie a rischio, inquinamento elettromagnetico. Italy.
ISTAT, 1990 - Istituto Nazionale di Statistica. 4° Censimento dell’Agricoltura. Roma,
Italy. http://www.regione.toscana.it/cif/pubblica/cen90407/indic407.htm
ISTAT, 1999a - Istituto Nazionale di Statistica. Lavoro e Retribuzioni. Roma, Italy.
ISTAT, 1999b - Istituto Nazionale di Statistica. Consumi delle famiglie 1997-1999.
Roma, Italy.
ISTAT, 1999c - Istituto Nazionale di Statistica. I consumi delle famiglie italiane 2000.
Roma, Italy.
ISTAT, 1999d - Istituto Nazionale di Statistica. Statistica degli incidenti stradali. Roma,
Italy.
ISTAT, 2000 - Istituto Nazionale di Statistica. 5° Censimento dell’Agricoltura. Roma,
Italy. http://censagr.istat.it/toscana.pdf.
Istituto Guglielmo Tagliacarte, 1999. Sistema Starter, data base, Roma, Italy.
Jackson, T., Laing, F., MacGillivary, A., Marks, N., Ralls, J. and Stymne, S., 1997. An
Index of Sustainable Economic Welfare for the UK 1950-1996. University of
24
Surrey Centre for Environmental Strategy, Guildford, UK.
Jackson, T., Marks, N., 1994. Measuring sustainable economic welfare. A pilot index:
1950-1990. Stockholm Environment Institute, The New Economics Foundation,
46 pp.
Jackson, T., Stymne, S., 1996. Sustainable Economic Welfare in Sweden: A Pilot Index
1950-1992. Stockholm Environment Institute, The New Economics Foundation,
46 pp.
Lawn, P., 2003. A theoretical foundation to support the Index of Sustainable Economic
Welfare (ISEW), Genuine Progress Indicator (GPI), and other related indexes.
Ecological Economics, 44: 105-118.
Lawn, P., Sanders, R., 1999. Has Australia surpassed its optimal macroeconomic scale:
finding out with the aid of benefit and cost accounts and a sustainable net benefit
index. Ecological Economics, 28: 213-229.
Max-Neef, M., 1995. Economic growth and quality of life: a threshold hypothesis.
Ecological Economics, 15: 115-118.
Moffatt, I., 1996. Sustainable Development: Principles, Analysis and Policies. Carnforth
Lanes: Parthenon Publishing.
Neumayer, E., 1999. The ISEW - not an index of sustainable economic welfare. Social
Indicators Research, 48, 77-101.
Neumayer, E., 2000. On the methodology of ISEW, GPI and related measures: some
constructive suggestions and some doubt on the “threshold” hypothesis.
Ecological Economics, 34: 347-361.
Nordhaus, W., Tobin, J., 1972. Is growth obsolete? In: Economic Growth. National
Bureau of Economic Research, General Series No. 96, New York.
OECD 2002. Territorial Reviews. Siena Italy. OECD, Paris.
Politecnico di Milano, 2000. Indice tariffario - Analisi di acqua, liquami civili ed
industriali, fanghi e gas biologico. Milan, Italy.
http://www.amb.polimi.it/tariffario.htm.
Progetto Aspis, 2002. Analisi delle spese per l'istruzione pubblica.
http://www.cede.it/web-est/aspis/cede.pdf.
Provincia di Siena, 2000. Rapporto Statistico 2000.
http://osservatorioeconomico.provincia.siena.it/resources/rapp_stat/rapp_stat200
25
0.htm.
Provincia di Siena, 2001. Rapporto Statistico 2001.
http://osservatorioeconomico.provincia.siena.it/resources/rapp_stat/rapp_stat200
1.htm.
Regione Toscana 1999a. Spesa dei Comuni per il territorio e l’ambiente nel 1999.
http://www.rete.toscana.it/sett/pta/stato_ambiente/indicatori_ambientali/finanza_
verde_ch5.htm.
Regione Toscana 1999b. Indicatori ambientali. Trasporti e mobilità: autovetture per
anno di immatricolazione.
Regione Toscana 2000a. Rapporto sullo stato dell’ambiente in Toscana.
http://www.rete.toscana.it/sett/pta/stato_ambiente/rapporti/2000/frameset.htm.
Regione Toscana 2000b. PRAE - Piano Regionale per le Attività Estrattive.
Rosenberg, D., Oegema T. 1995. A Pilot ISEW for the Netherlands 1950-1992. Instituut
vor Milieu-En systeemanalyse, Amsterdam.
Santos, T.M., Zaratan, M.L. 1997. Mineral resources accounting: a technique for
monitoring the Philippine mining industry for sustainable development. Journal
of Asian Earth Sciences, 15, 2-3, 155-160.
Stockhammer, E., Hochreiter, H., Hobermayr, B., Steiner, K., 1997. The index of
sustainable economic welfare (ISEW) as an alternative to GDP in measuring
economic welfare. The result of the Austrian (revised) ISEW calculation, 1955 -
1992. Ecological Economics, 21: 19-34.
Tomat, G.M., 2002. Beni durevoli, indici di prezzo e cambiamenti di qualità:
un’applicazione ai prezzi delle automobili in Italia, 1988-1998. Tema di
discussione n. 439, Banca d’Italia, Roma, Italy.
UNCED, 1992a. United Nations Conference on Environment and Development.
Agenda 21, Chapter 8, Integrating environment and development in decision-
making. Rio de Janeiro 3rd-14th June, 1992.
UNCED, 1992b. United Nations Conference on Environment and Development.
Agenda 21, Chapter 40, Information for decision making. Rio de Janeiro 3rd-
14th June, 1992.
UNDP, 1990-2004. Human Development Report. New York: Oxford University Press.
WCED, World Commission on Environment and Development, 1987. Our common
26
future (The Brundtland Report). Oxford University Press, Oxford.
Recommended